Larsen Bay, AK Map & Demographics
Larsen Bay Map
Larsen Bay Overview
$37,222
PER CAPITA INCOME
$96,250
AVG FAMILY INCOME
$77,500
AVG HOUSEHOLD INCOME
0.27
INEQUALITY / GINI INDEX
46
TOTAL POPULATION
27
MALE POPULATION
19
FEMALE POPULATION
142.11
MALES / 100 FEMALES
70.37
FEMALES / 100 MALES
55.3
MEDIAN AGE
2.3
AVG FAMILY SIZE
1.5
AVG HOUSEHOLD SIZE
33
LABOR FORCE [ PEOPLE ]
82.5%
PERCENT IN LABOR FORCE
6.1%
UNEMPLOYMENT RATE
Larsen Bay Zip Codes
Larsen Bay Area Codes
Income in Larsen Bay
Income Overview in Larsen Bay
Per Capita Income in Larsen Bay is $37,222, while median incomes of families and households are $96,250 and $77,500 respectively.
| Characteristic | Number | Measure |
| Per Capita Income | 46 | $37,222 |
| Median Family Income | 7 | $96,250 |
| Mean Family Income | 7 | $78,400 |
| Median Household Income | 18 | $77,500 |
| Mean Household Income | 18 | $69,850 |
| Income Deficit | 7 | $0 |
| Wage / Income Gap (%) | 46 | 0.00% |
| Wage / Income Gap ($) | 46 | 100.00¢ per $1 |
| Gini / Inequality Index | 46 | 0.27 |
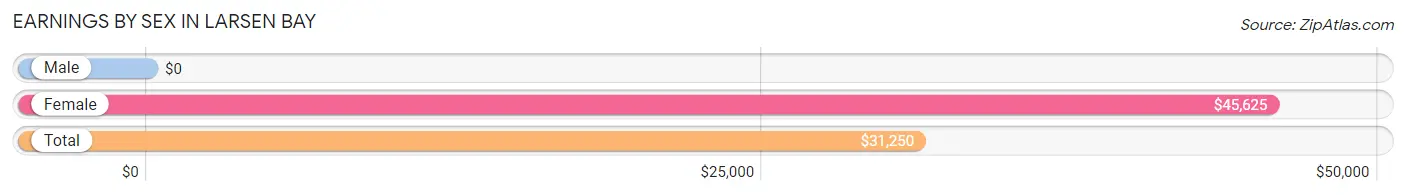
Earnings by Sex in Larsen Bay
| Sex | Number | Average Earnings |
| Male | 23 (67.6%) | $0 |
| Female | 11 (32.4%) | $45,625 |
| Total | 34 (100.0%) | $31,250 |
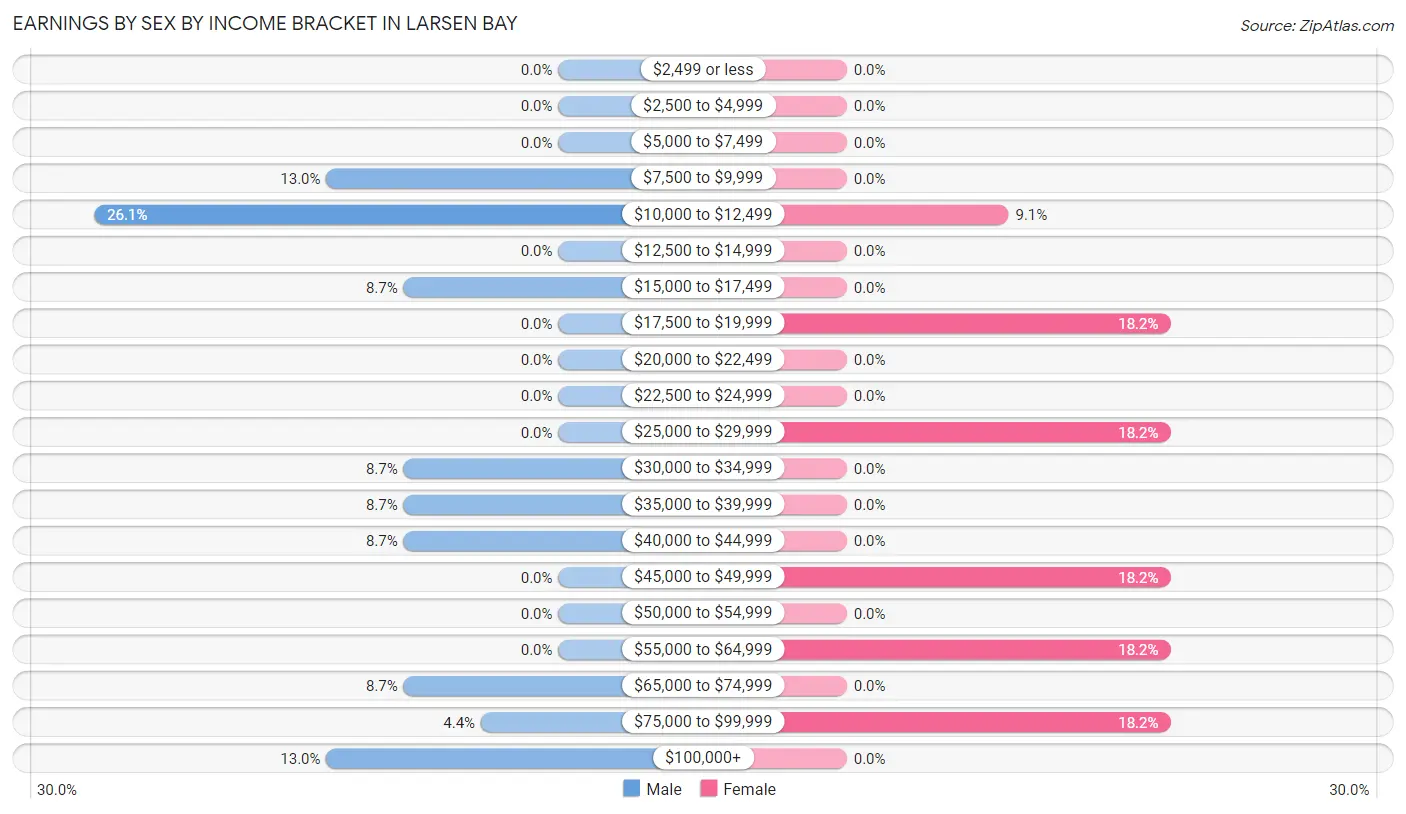
Earnings by Sex by Income Bracket in Larsen Bay
The most common earnings brackets in Larsen Bay are $10,000 to $12,499 for men (6 | 26.1%) and $17,500 to $19,999 for women (2 | 18.2%).
| Income | Male | Female |
| $2,499 or less | 0 (0.0%) | 0 (0.0%) |
| $2,500 to $4,999 | 0 (0.0%) | 0 (0.0%) |
| $5,000 to $7,499 | 0 (0.0%) | 0 (0.0%) |
| $7,500 to $9,999 | 3 (13.0%) | 0 (0.0%) |
| $10,000 to $12,499 | 6 (26.1%) | 1 (9.1%) |
| $12,500 to $14,999 | 0 (0.0%) | 0 (0.0%) |
| $15,000 to $17,499 | 2 (8.7%) | 0 (0.0%) |
| $17,500 to $19,999 | 0 (0.0%) | 2 (18.2%) |
| $20,000 to $22,499 | 0 (0.0%) | 0 (0.0%) |
| $22,500 to $24,999 | 0 (0.0%) | 0 (0.0%) |
| $25,000 to $29,999 | 0 (0.0%) | 2 (18.2%) |
| $30,000 to $34,999 | 2 (8.7%) | 0 (0.0%) |
| $35,000 to $39,999 | 2 (8.7%) | 0 (0.0%) |
| $40,000 to $44,999 | 2 (8.7%) | 0 (0.0%) |
| $45,000 to $49,999 | 0 (0.0%) | 2 (18.2%) |
| $50,000 to $54,999 | 0 (0.0%) | 0 (0.0%) |
| $55,000 to $64,999 | 0 (0.0%) | 2 (18.2%) |
| $65,000 to $74,999 | 2 (8.7%) | 0 (0.0%) |
| $75,000 to $99,999 | 1 (4.3%) | 2 (18.2%) |
| $100,000+ | 3 (13.0%) | 0 (0.0%) |
| Total | 23 (100.0%) | 11 (100.0%) |
Earnings by Sex by Educational Attainment in Larsen Bay
| Educational Attainment | Male Income | Female Income |
| Less than High School | - | - |
| High School Diploma | - | - |
| College or Associate's Degree | - | - |
| Bachelor's Degree | - | - |
| Graduate Degree | - | - |
| Total | - | - |
Family Income in Larsen Bay
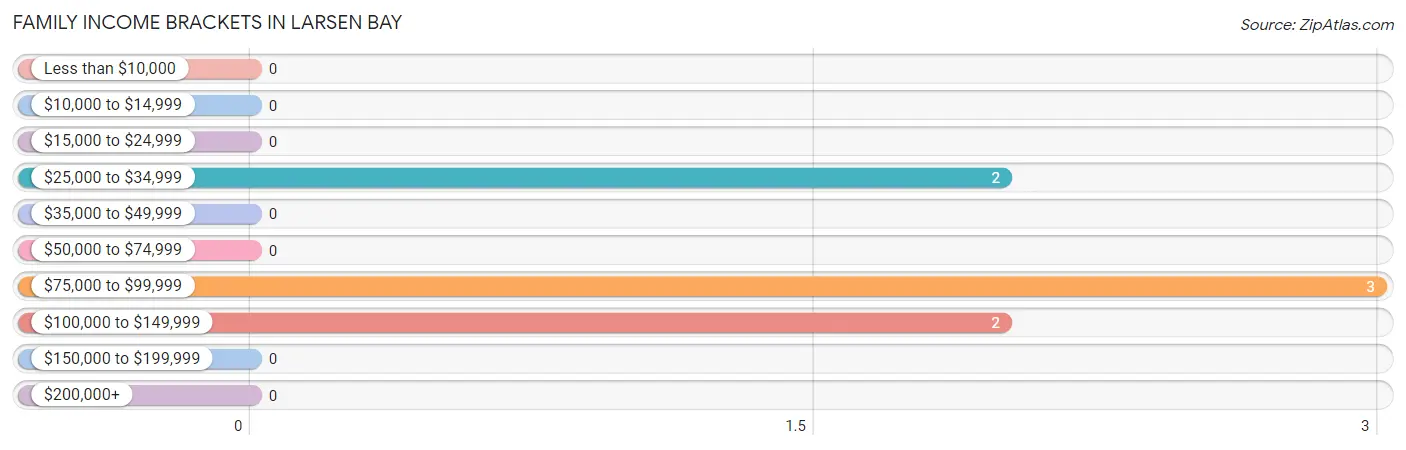
Family Income Brackets in Larsen Bay
According to the Larsen Bay family income data, there are 3 families falling into the $75,000 to $99,999 income range, which is the most common income bracket and makes up 42.9% of all families.
| Income Bracket | # Families | % Families |
| Less than $10,000 | 0 | 0.0% |
| $10,000 to $14,999 | 0 | 0.0% |
| $15,000 to $24,999 | 0 | 0.0% |
| $25,000 to $34,999 | 2 | 28.6% |
| $35,000 to $49,999 | 0 | 0.0% |
| $50,000 to $74,999 | 0 | 0.0% |
| $75,000 to $99,999 | 3 | 42.9% |
| $100,000 to $149,999 | 2 | 28.6% |
| $150,000 to $199,999 | 0 | 0.0% |
| $200,000+ | 0 | 0.0% |
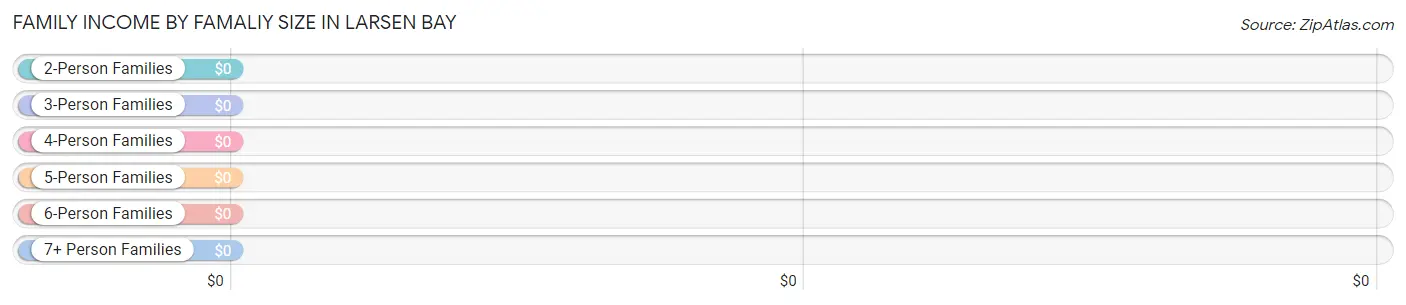
Family Income by Famaliy Size in Larsen Bay
| Income Bracket | # Families | Median Income |
| 2-Person Families | 5 (71.4%) | $0 |
| 3-Person Families | 0 (0.0%) | $0 |
| 4-Person Families | 2 (28.6%) | $0 |
| 5-Person Families | 0 (0.0%) | $0 |
| 6-Person Families | 0 (0.0%) | $0 |
| 7+ Person Families | 0 (0.0%) | $0 |
| Total | 7 (100.0%) | $96,250 |
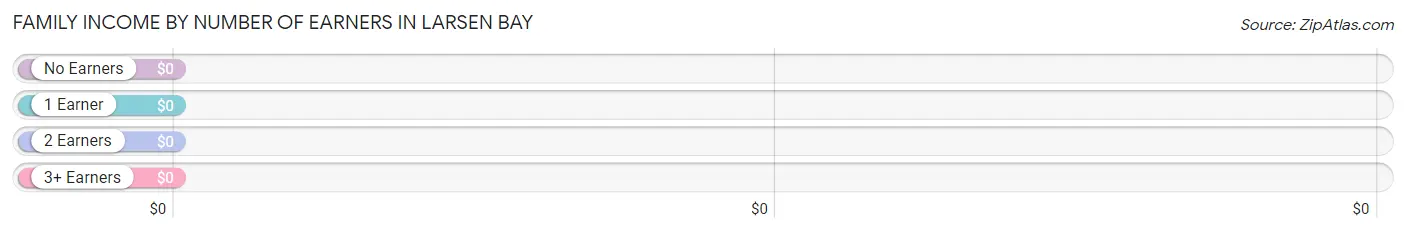
Family Income by Number of Earners in Larsen Bay
| Number of Earners | # Families | Median Income |
| No Earners | 2 (28.6%) | $0 |
| 1 Earner | 5 (71.4%) | $0 |
| 2 Earners | 0 (0.0%) | $0 |
| 3+ Earners | 0 (0.0%) | $0 |
| Total | 7 (100.0%) | $96,250 |
Household Income in Larsen Bay
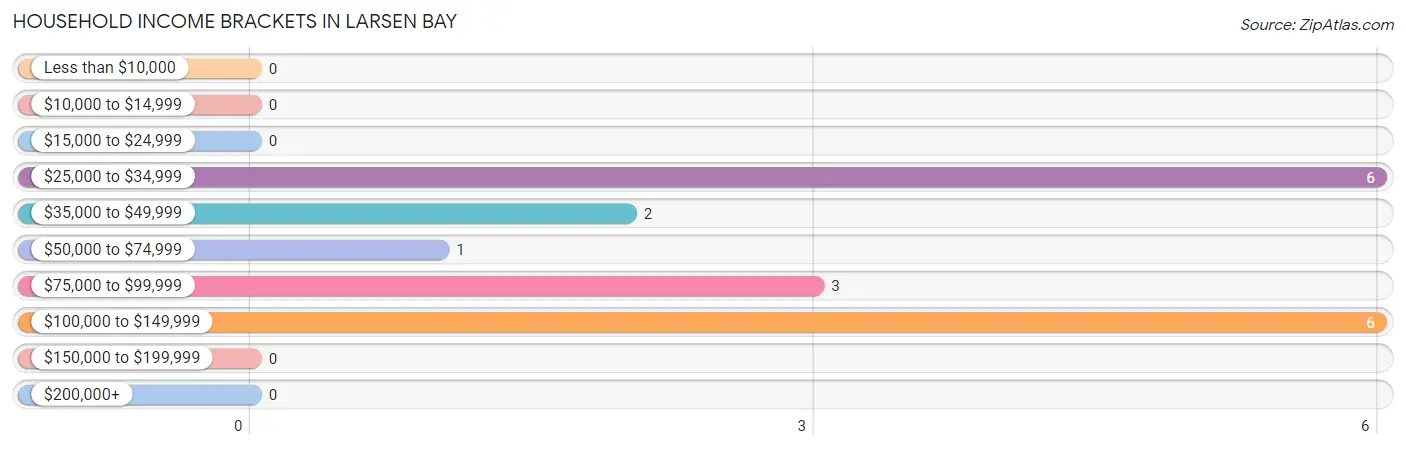
Household Income Brackets in Larsen Bay
With 6 households falling in the category, the $25,000 to $34,999 income range is the most frequent in Larsen Bay, accounting for 33.3% of all households.
| Income Bracket | # Households | % Households |
| Less than $10,000 | 0 | 0.0% |
| $10,000 to $14,999 | 0 | 0.0% |
| $15,000 to $24,999 | 0 | 0.0% |
| $25,000 to $34,999 | 6 | 33.3% |
| $35,000 to $49,999 | 2 | 11.1% |
| $50,000 to $74,999 | 1 | 5.6% |
| $75,000 to $99,999 | 3 | 16.7% |
| $100,000 to $149,999 | 6 | 33.3% |
| $150,000 to $199,999 | 0 | 0.0% |
| $200,000+ | 0 | 0.0% |
Household Income by Householder Age in Larsen Bay
The median household income in Larsen Bay is $77,500, with the highest median household income of $96,667 found in the 45 to 64 years age bracket for the primary householder. A total of 8 households (44.4%) fall into this category. Meanwhile, the 15 to 24 years age bracket for the primary householder has the lowest median household income of $0, with 2 households (11.1%) in this group.
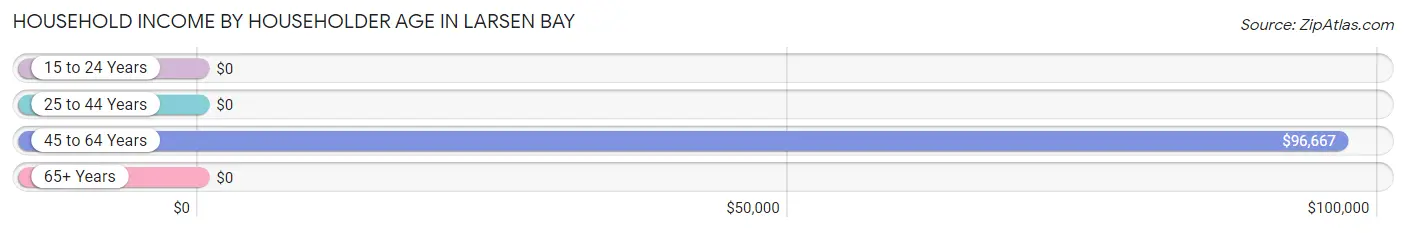
| Income Bracket | # Households | Median Income |
| 15 to 24 Years | 2 (11.1%) | $0 |
| 25 to 44 Years | 0 (0.0%) | $0 |
| 45 to 64 Years | 8 (44.4%) | $96,667 |
| 65+ Years | 8 (44.4%) | $0 |
| Total | 18 (100.0%) | $77,500 |
Poverty in Larsen Bay
Income Below Poverty by Sex and Age in Larsen Bay
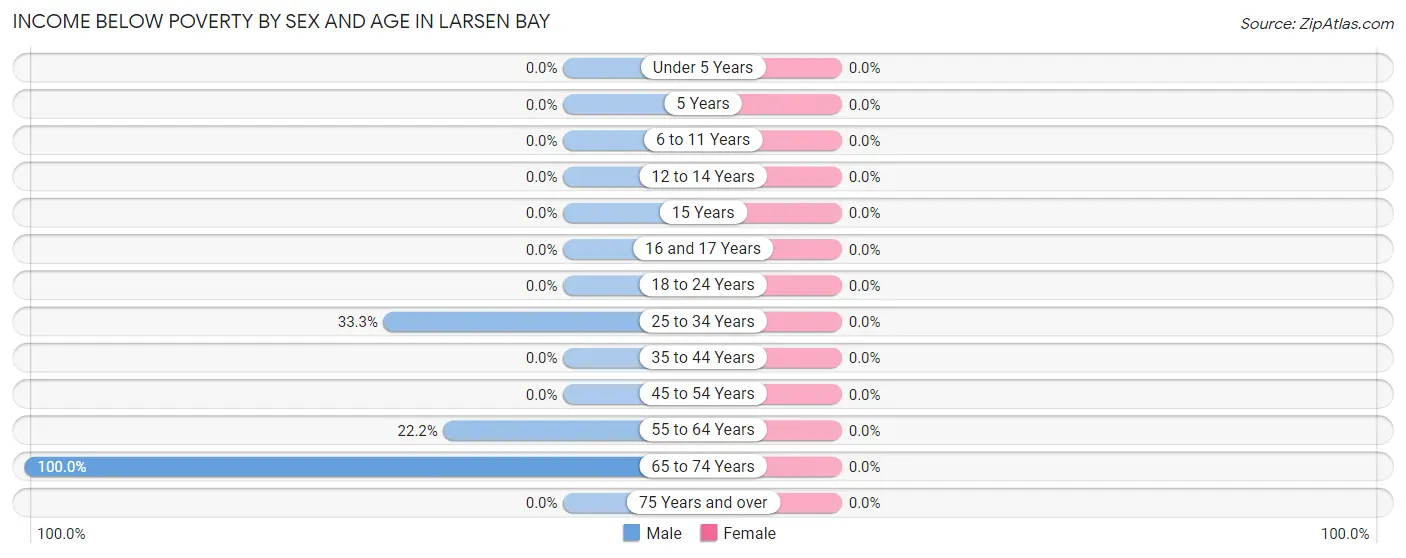
| Age Bracket | Male | Female |
| Under 5 Years | 0 (0.0%) | 0 (0.0%) |
| 5 Years | 0 (0.0%) | 0 (0.0%) |
| 6 to 11 Years | 0 (0.0%) | 0 (0.0%) |
| 12 to 14 Years | 0 (0.0%) | 0 (0.0%) |
| 15 Years | 0 (0.0%) | 0 (0.0%) |
| 16 and 17 Years | 0 (0.0%) | 0 (0.0%) |
| 18 to 24 Years | 0 (0.0%) | 0 (0.0%) |
| 25 to 34 Years | 2 (33.3%) | 0 (0.0%) |
| 35 to 44 Years | 0 (0.0%) | 0 (0.0%) |
| 45 to 54 Years | 0 (0.0%) | 0 (0.0%) |
| 55 to 64 Years | 2 (22.2%) | 0 (0.0%) |
| 65 to 74 Years | 3 (100.0%) | 0 (0.0%) |
| 75 Years and over | 0 (0.0%) | 0 (0.0%) |
| Total | 7 (25.9%) | 0 (0.0%) |
Income Above Poverty by Sex and Age in Larsen Bay
According to the poverty statistics in Larsen Bay, males aged under 5 years and females aged 6 to 11 years are the age groups that are most secure financially, with 100.0% of males and 100.0% of females in these age groups living above the poverty line.
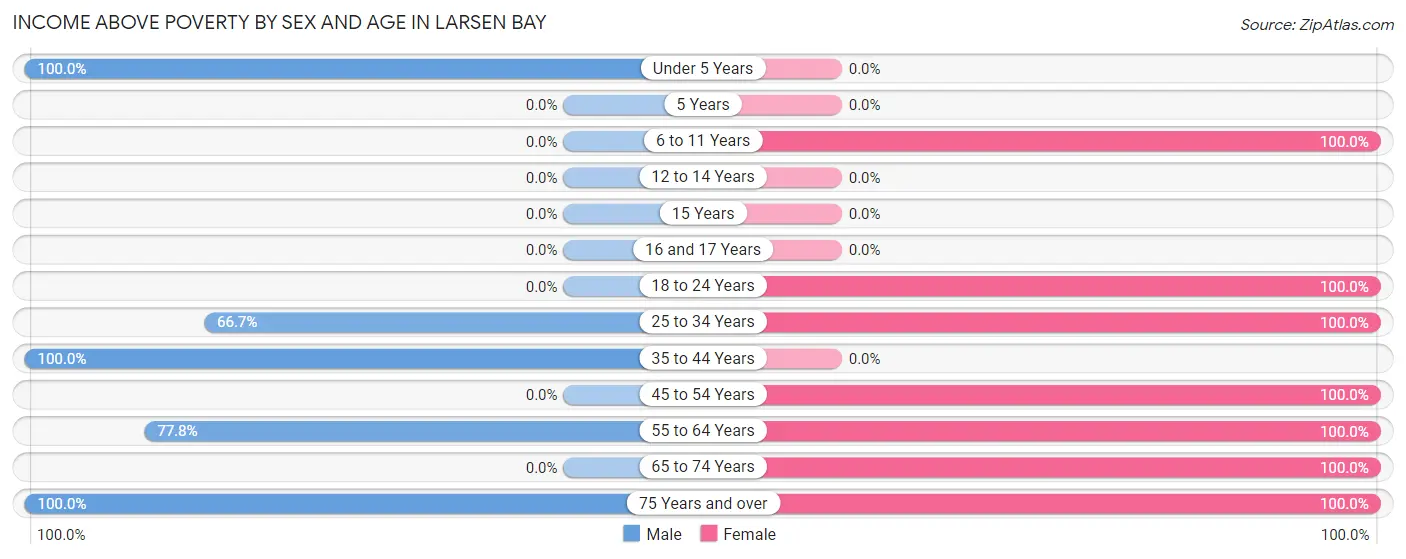
| Age Bracket | Male | Female |
| Under 5 Years | 2 (100.0%) | 0 (0.0%) |
| 5 Years | 0 (0.0%) | 0 (0.0%) |
| 6 to 11 Years | 0 (0.0%) | 4 (100.0%) |
| 12 to 14 Years | 0 (0.0%) | 0 (0.0%) |
| 15 Years | 0 (0.0%) | 0 (0.0%) |
| 16 and 17 Years | 0 (0.0%) | 0 (0.0%) |
| 18 to 24 Years | 0 (0.0%) | 2 (100.0%) |
| 25 to 34 Years | 4 (66.7%) | 4 (100.0%) |
| 35 to 44 Years | 2 (100.0%) | 0 (0.0%) |
| 45 to 54 Years | 0 (0.0%) | 2 (100.0%) |
| 55 to 64 Years | 7 (77.8%) | 3 (100.0%) |
| 65 to 74 Years | 0 (0.0%) | 3 (100.0%) |
| 75 Years and over | 5 (100.0%) | 1 (100.0%) |
| Total | 20 (74.1%) | 19 (100.0%) |
Income Below Poverty Among Married-Couple Families in Larsen Bay
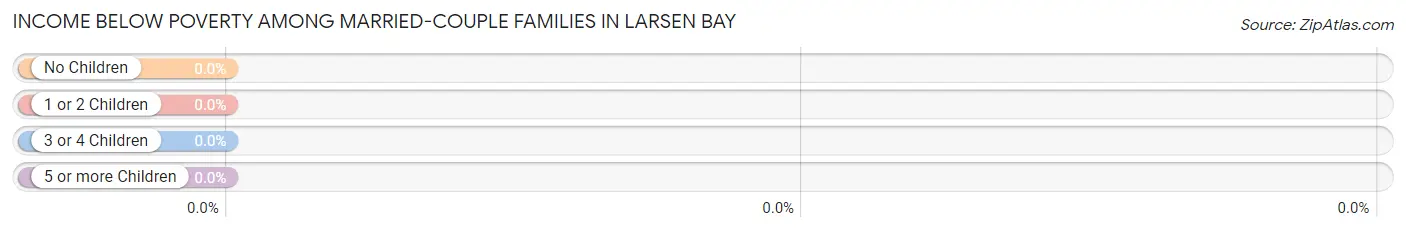
| Children | Above Poverty | Below Poverty |
| No Children | 2 (100.0%) | 0 (0.0%) |
| 1 or 2 Children | 0 (0.0%) | 0 (0.0%) |
| 3 or 4 Children | 0 (0.0%) | 0 (0.0%) |
| 5 or more Children | 0 (0.0%) | 0 (0.0%) |
| Total | 2 (100.0%) | 0 (0.0%) |
Income Below Poverty Among Single-Parent Households in Larsen Bay
| Children | Single Father | Single Mother |
| No Children | 0 (0.0%) | 0 (0.0%) |
| 1 or 2 Children | 0 (0.0%) | 0 (0.0%) |
| 3 or 4 Children | 0 (0.0%) | 0 (0.0%) |
| 5 or more Children | 0 (0.0%) | 0 (0.0%) |
| Total | 0 (0.0%) | 0 (0.0%) |
Income Below Poverty Among Married-Couple vs Single-Parent Households in Larsen Bay
| Children | Married-Couple Families | Single-Parent Households |
| No Children | 0 (0.0%) | 0 (0.0%) |
| 1 or 2 Children | 0 (0.0%) | 0 (0.0%) |
| 3 or 4 Children | 0 (0.0%) | 0 (0.0%) |
| 5 or more Children | 0 (0.0%) | 0 (0.0%) |
| Total | 0 (0.0%) | 0 (0.0%) |
Race in Larsen Bay
The most populous races in Larsen Bay are White / Caucasian (20 | 43.5%), Native / Alaskan (11 | 23.9%), and Asian (7 | 15.2%).
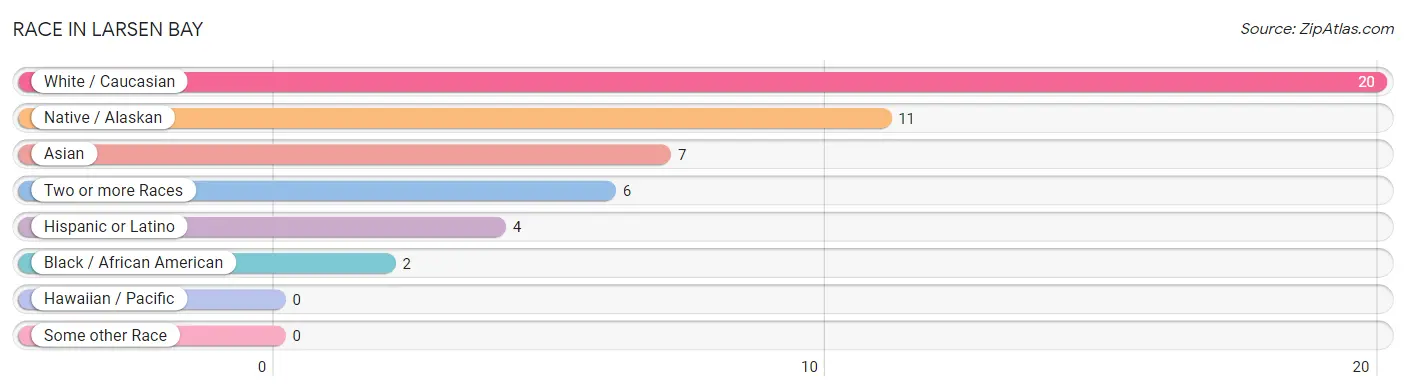
| Race | # Population | % Population |
| Asian | 7 | 15.2% |
| Black / African American | 2 | 4.3% |
| Hawaiian / Pacific | 0 | 0.0% |
| Hispanic or Latino | 4 | 8.7% |
| Native / Alaskan | 11 | 23.9% |
| White / Caucasian | 20 | 43.5% |
| Two or more Races | 6 | 13.0% |
| Some other Race | 0 | 0.0% |
| Total | 46 | 100.0% |
Ancestry in Larsen Bay
The most populous ancestries reported in Larsen Bay are Aleut (11 | 23.9%), Korean (7 | 15.2%), German (5 | 10.9%), Finnish (3 | 6.5%), and Irish (3 | 6.5%), together accounting for 63.0% of all Larsen Bay residents.
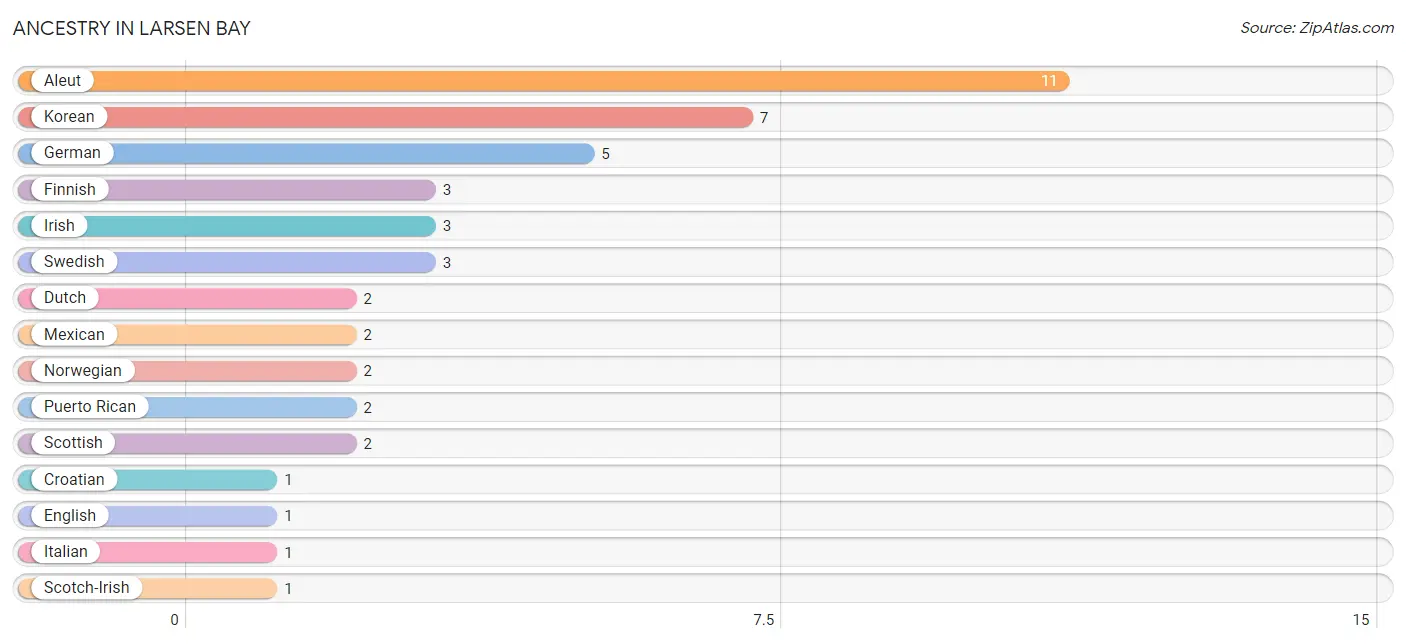
| Ancestry | # Population | % Population |
| Aleut | 11 | 23.9% |
| Croatian | 1 | 2.2% |
| Dutch | 2 | 4.3% |
| English | 1 | 2.2% |
| Finnish | 3 | 6.5% |
| German | 5 | 10.9% |
| Irish | 3 | 6.5% |
| Italian | 1 | 2.2% |
| Korean | 7 | 15.2% |
| Mexican | 2 | 4.3% |
| Norwegian | 2 | 4.3% |
| Puerto Rican | 2 | 4.3% |
| Scotch-Irish | 1 | 2.2% |
| Scottish | 2 | 4.3% |
| Swedish | 3 | 6.5% | View All 15 Rows |
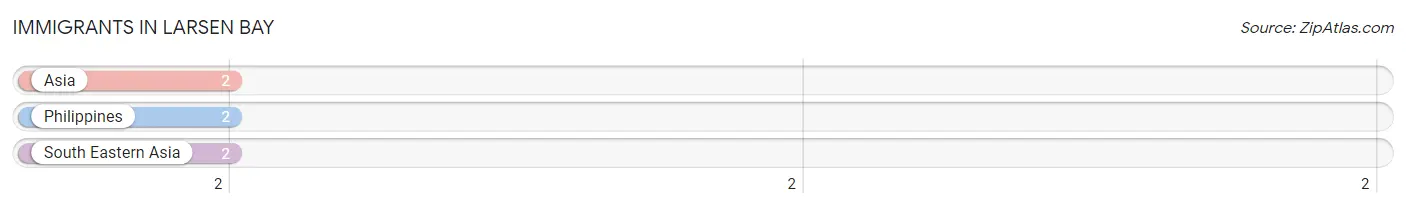
Immigrants in Larsen Bay
The most numerous immigrant groups reported in Larsen Bay came from Asia (2 | 4.3%), Philippines (2 | 4.3%), and South Eastern Asia (2 | 4.3%), together accounting for 13.1% of all Larsen Bay residents.
| Immigration Origin | # Population | % Population |
| Asia | 2 | 4.3% |
| Philippines | 2 | 4.3% |
| South Eastern Asia | 2 | 4.3% | View All 3 Rows |
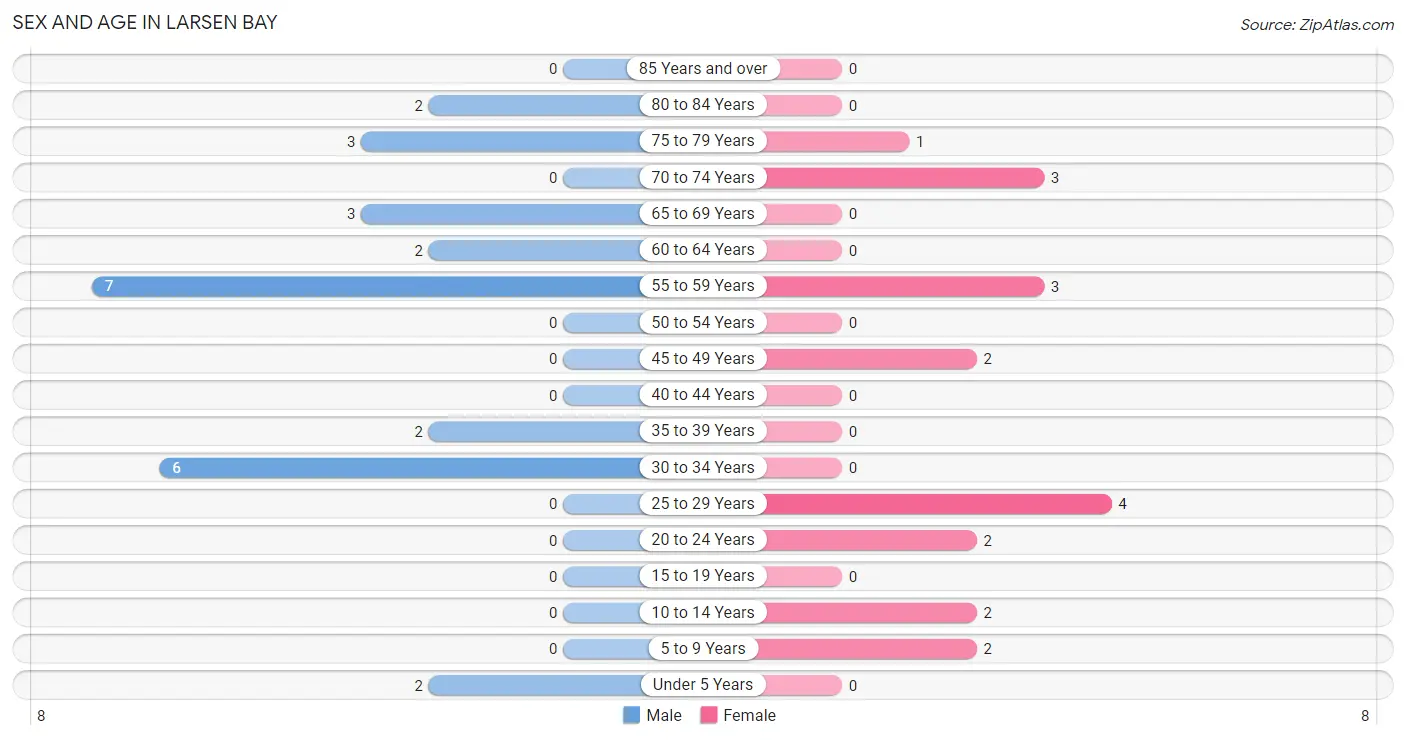
Sex and Age in Larsen Bay
Sex and Age in Larsen Bay
The most populous age groups in Larsen Bay are 55 to 59 Years (7 | 25.9%) for men and 25 to 29 Years (4 | 21.0%) for women.
| Age Bracket | Male | Female |
| Under 5 Years | 2 (7.4%) | 0 (0.0%) |
| 5 to 9 Years | 0 (0.0%) | 2 (10.5%) |
| 10 to 14 Years | 0 (0.0%) | 2 (10.5%) |
| 15 to 19 Years | 0 (0.0%) | 0 (0.0%) |
| 20 to 24 Years | 0 (0.0%) | 2 (10.5%) |
| 25 to 29 Years | 0 (0.0%) | 4 (21.0%) |
| 30 to 34 Years | 6 (22.2%) | 0 (0.0%) |
| 35 to 39 Years | 2 (7.4%) | 0 (0.0%) |
| 40 to 44 Years | 0 (0.0%) | 0 (0.0%) |
| 45 to 49 Years | 0 (0.0%) | 2 (10.5%) |
| 50 to 54 Years | 0 (0.0%) | 0 (0.0%) |
| 55 to 59 Years | 7 (25.9%) | 3 (15.8%) |
| 60 to 64 Years | 2 (7.4%) | 0 (0.0%) |
| 65 to 69 Years | 3 (11.1%) | 0 (0.0%) |
| 70 to 74 Years | 0 (0.0%) | 3 (15.8%) |
| 75 to 79 Years | 3 (11.1%) | 1 (5.3%) |
| 80 to 84 Years | 2 (7.4%) | 0 (0.0%) |
| 85 Years and over | 0 (0.0%) | 0 (0.0%) |
| Total | 27 (100.0%) | 19 (100.0%) |
Families and Households in Larsen Bay
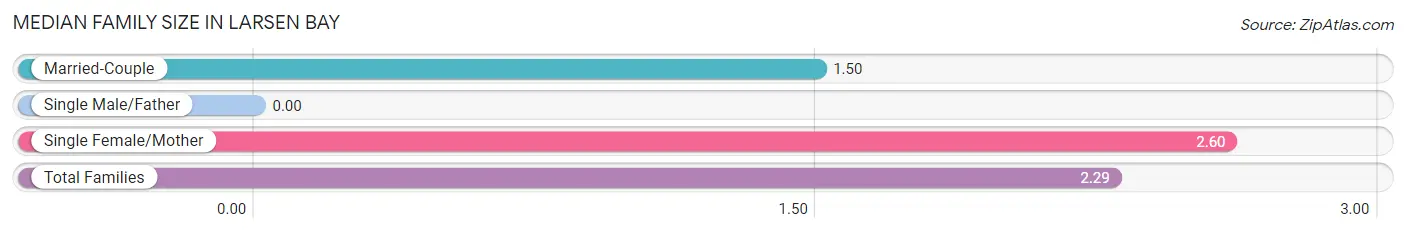
Median Family Size in Larsen Bay
| Family Type | # Families | Family Size |
| Married-Couple | 2 (28.6%) | 1.50 |
| Single Male/Father | 0 (0.0%) | - |
| Single Female/Mother | 5 (71.4%) | 2.60 |
| Total Families | 7 (100.0%) | 2.29 |
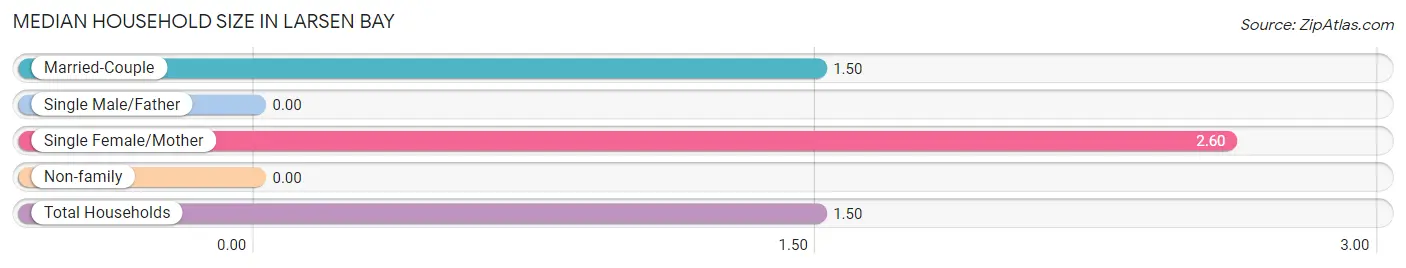
Median Household Size in Larsen Bay
| Household Type | # Households | Household Size |
| Married-Couple | 2 (11.1%) | 1.50 |
| Single Male/Father | 0 (0.0%) | - |
| Single Female/Mother | 5 (27.8%) | 2.60 |
| Non-family | 11 (61.1%) | - |
| Total Households | 18 (100.0%) | 1.50 |
Household Size by Marriage Status in Larsen Bay
Out of a total of 18 households in Larsen Bay, 7 (38.9%) are family households, while 11 (61.1%) are nonfamily households. The most numerous type of family households are 2-person households, comprising 5, and the most common type of nonfamily households are 1-person households, comprising 11.
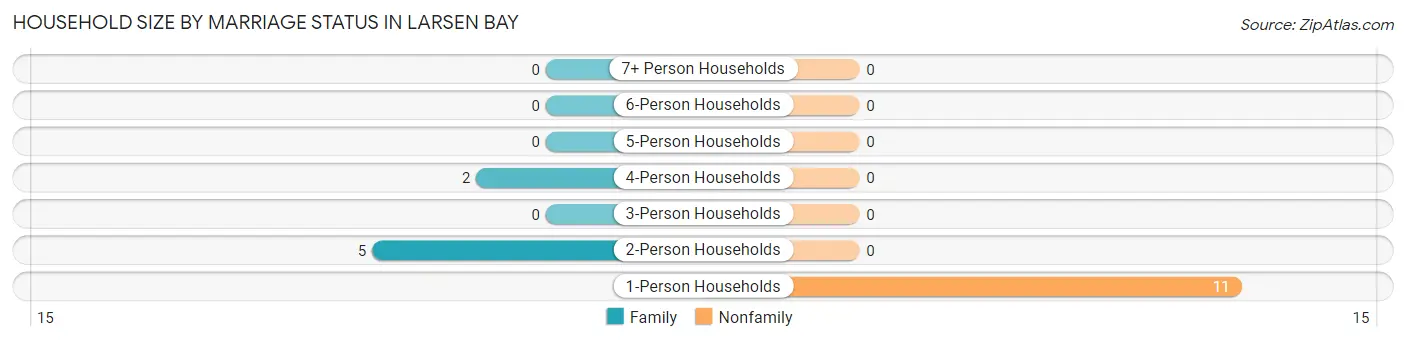
| Household Size | Family Households | Nonfamily Households |
| 1-Person Households | - | 11 (61.1%) |
| 2-Person Households | 5 (27.8%) | 0 (0.0%) |
| 3-Person Households | 0 (0.0%) | 0 (0.0%) |
| 4-Person Households | 2 (11.1%) | 0 (0.0%) |
| 5-Person Households | 0 (0.0%) | 0 (0.0%) |
| 6-Person Households | 0 (0.0%) | 0 (0.0%) |
| 7+ Person Households | 0 (0.0%) | 0 (0.0%) |
| Total | 7 (38.9%) | 11 (61.1%) |
Female Fertility in Larsen Bay
Fertility by Age in Larsen Bay
| Age Bracket | Women with Births | Births / 1,000 Women |
| 15 to 19 years | 0 (0.0%) | 0.0 |
| 20 to 34 years | 0 (0.0%) | 0.0 |
| 35 to 50 years | 0 (0.0%) | 0.0 |
| Total | 0 (0.0%) | 0.0 |
Fertility by Age by Marriage Status in Larsen Bay
| Age Bracket | Married | Unmarried |
| 15 to 19 years | 0 (0.0%) | 0 (0.0%) |
| 20 to 34 years | 0 (0.0%) | 0 (0.0%) |
| 35 to 50 years | 0 (0.0%) | 0 (0.0%) |
| Total | 0 (0.0%) | 0 (0.0%) |
Fertility by Education in Larsen Bay
| Educational Attainment | Women with Births | Births / 1,000 Women |
| Less than High School | 0 (0.0%) | 0.0 |
| High School Diploma | 0 (0.0%) | 0.0 |
| College or Associate's Degree | 0 (0.0%) | 0.0 |
| Bachelor's Degree | 0 (0.0%) | 0.0 |
| Graduate Degree | 0 (0.0%) | 0.0 |
| Total | 0 (0.0%) | 0.0 |
Fertility by Education by Marriage Status in Larsen Bay
| Educational Attainment | Married | Unmarried |
| Less than High School | 0 (0.0%) | 0 (0.0%) |
| High School Diploma | 0 (0.0%) | 0 (0.0%) |
| College or Associate's Degree | 0 (0.0%) | 0 (0.0%) |
| Bachelor's Degree | 0 (0.0%) | 0 (0.0%) |
| Graduate Degree | 0 (0.0%) | 0 (0.0%) |
| Total | 0 (0.0%) | 0 (0.0%) |
Employment Characteristics in Larsen Bay
Employment by Class of Employer in Larsen Bay
Among the 31 employed individuals in Larsen Bay, private company employees (19 | 61.3%), local government employees (8 | 25.8%), and self-employed (not incorporated) (2 | 6.5%) make up the most common classes of employment.
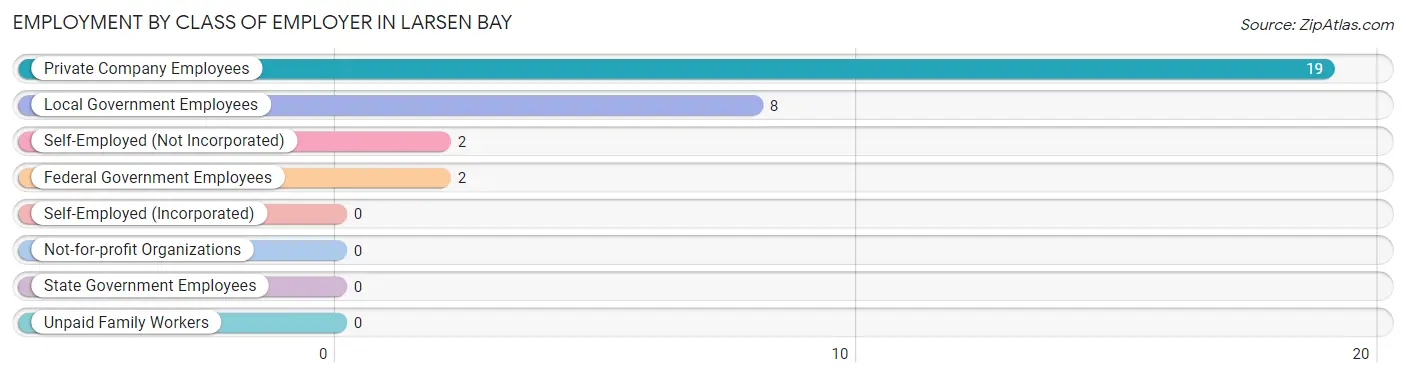
| Employer Class | # Employees | % Employees |
| Private Company Employees | 19 | 61.3% |
| Self-Employed (Incorporated) | 0 | 0.0% |
| Self-Employed (Not Incorporated) | 2 | 6.5% |
| Not-for-profit Organizations | 0 | 0.0% |
| Local Government Employees | 8 | 25.8% |
| State Government Employees | 0 | 0.0% |
| Federal Government Employees | 2 | 6.5% |
| Unpaid Family Workers | 0 | 0.0% |
| Total | 31 | 100.0% |
Employment Status by Age in Larsen Bay
According to the labor force statistics for Larsen Bay, out of the total population over 16 years of age (40), 82.5% or 33 individuals are in the labor force, with 6.1% or 2 of them unemployed. The age group with the highest labor force participation rate is 20 to 24 years, with 100.0% or 2 individuals in the labor force. Within the labor force, the 35 to 44 years age range has the highest percentage of unemployed individuals, with 100.0% or 2 of them being unemployed.
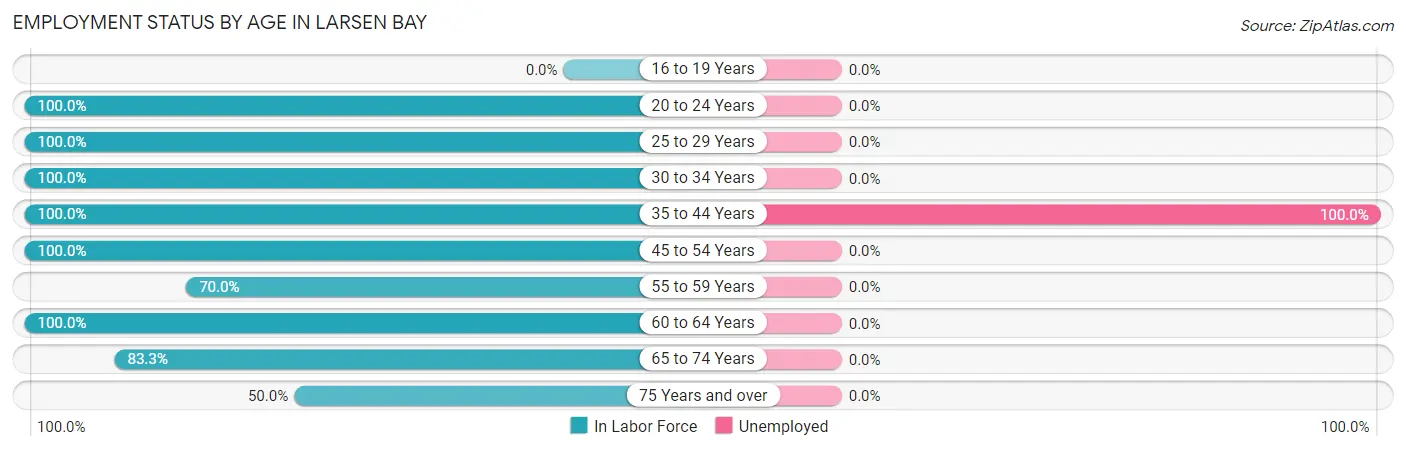
| Age Bracket | In Labor Force | Unemployed |
| 16 to 19 Years | 0 (0.0%) | 0 (0.0%) |
| 20 to 24 Years | 2 (100.0%) | 0 (0.0%) |
| 25 to 29 Years | 4 (100.0%) | 0 (0.0%) |
| 30 to 34 Years | 6 (100.0%) | 0 (0.0%) |
| 35 to 44 Years | 2 (100.0%) | 2 (100.0%) |
| 45 to 54 Years | 2 (100.0%) | 0 (0.0%) |
| 55 to 59 Years | 7 (70.0%) | 0 (0.0%) |
| 60 to 64 Years | 2 (100.0%) | 0 (0.0%) |
| 65 to 74 Years | 5 (83.3%) | 0 (0.0%) |
| 75 Years and over | 3 (50.0%) | 0 (0.0%) |
| Total | 33 (82.5%) | 2 (6.1%) |
Employment Status by Educational Attainment in Larsen Bay
According to labor force statistics for Larsen Bay, 88.5% of individuals (23) out of the total population between 25 and 64 years of age (26) are in the labor force, with 8.7% or 2 of them being unemployed. The group with the highest labor force participation rate are those with the educational attainment of high school diploma, with 100.0% or 17 individuals in the labor force. Within the labor force, individuals with high school diploma education have the highest percentage of unemployment, with 11.8% or 2 of them being unemployed.
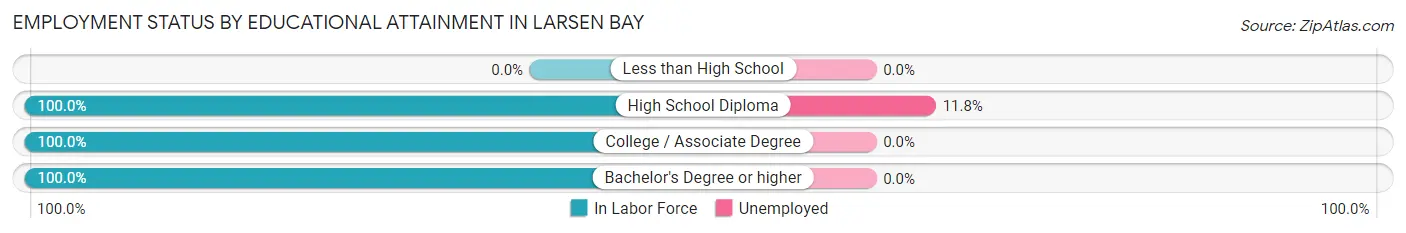
| Educational Attainment | In Labor Force | Unemployed |
| Less than High School | 0 (0.0%) | 0 (0.0%) |
| High School Diploma | 17 (100.0%) | 2 (11.8%) |
| College / Associate Degree | 4 (100.0%) | 0 (0.0%) |
| Bachelor's Degree or higher | 2 (100.0%) | 0 (0.0%) |
| Total | 23 (88.5%) | 2 (8.7%) |
Employment Occupations by Sex in Larsen Bay
Management, Business, Science and Arts Occupations
The most common Management, Business, Science and Arts occupations in Larsen Bay are Management (4 | 12.9%), and Business & Financial (2 | 6.5%).
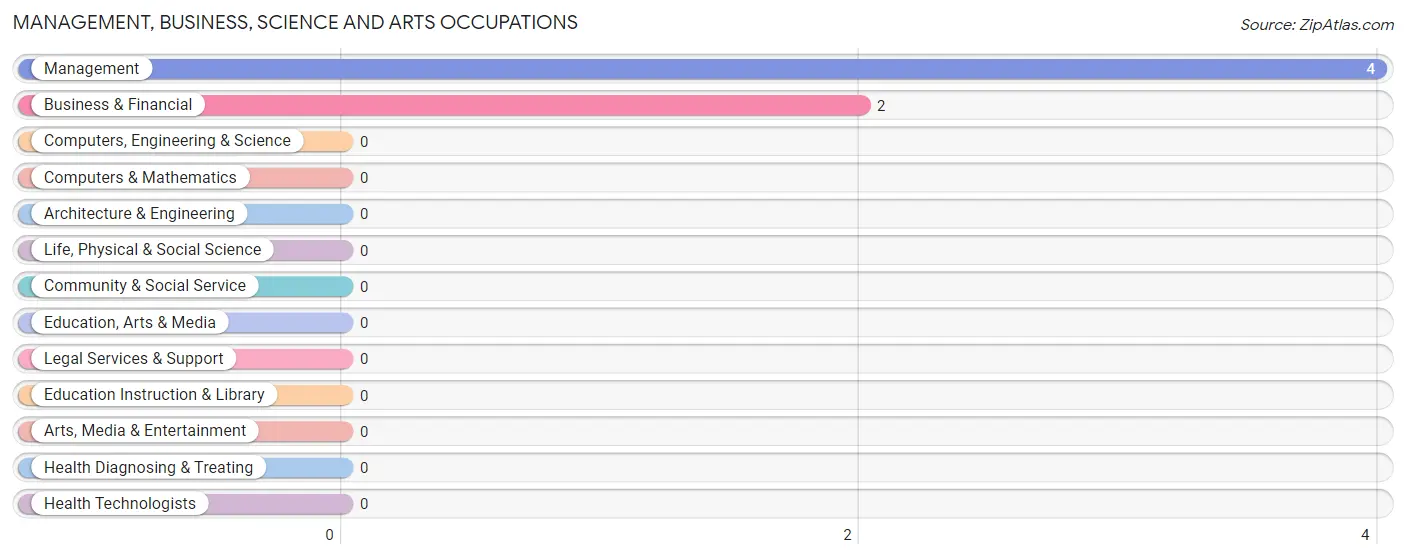
Management, Business, Science and Arts Occupations by Sex
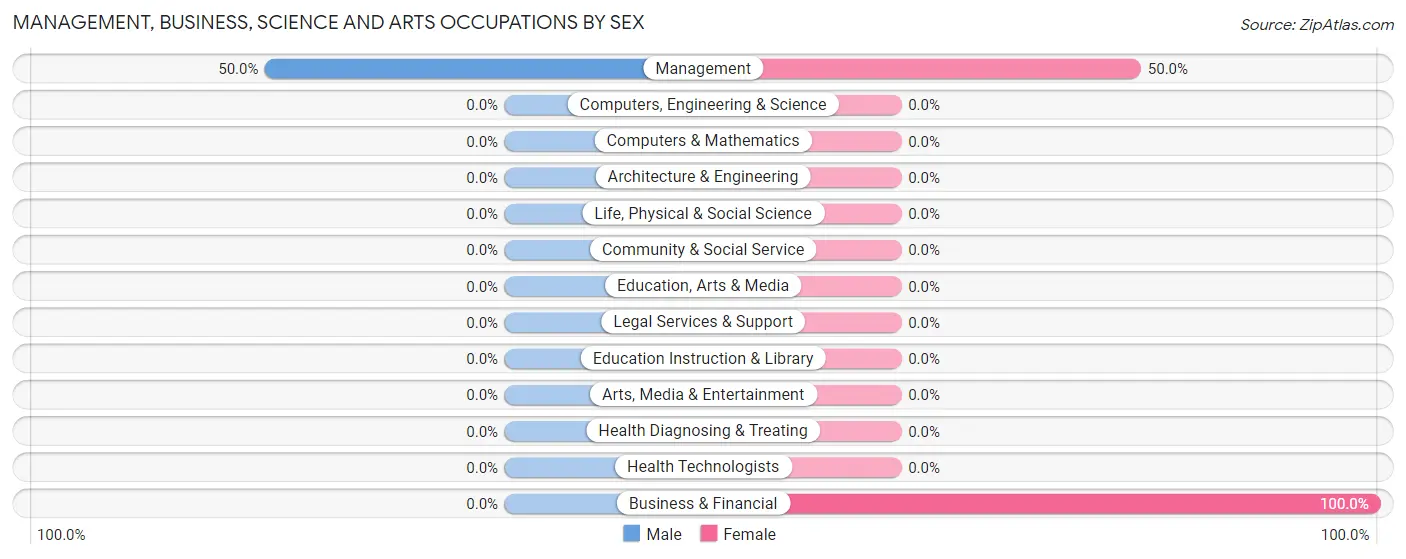
| Occupation | Male | Female |
| Management | 2 (50.0%) | 2 (50.0%) |
| Business & Financial | 0 (0.0%) | 2 (100.0%) |
| Computers, Engineering & Science | 0 (0.0%) | 0 (0.0%) |
| Computers & Mathematics | 0 (0.0%) | 0 (0.0%) |
| Architecture & Engineering | 0 (0.0%) | 0 (0.0%) |
| Life, Physical & Social Science | 0 (0.0%) | 0 (0.0%) |
| Community & Social Service | 0 (0.0%) | 0 (0.0%) |
| Education, Arts & Media | 0 (0.0%) | 0 (0.0%) |
| Legal Services & Support | 0 (0.0%) | 0 (0.0%) |
| Education Instruction & Library | 0 (0.0%) | 0 (0.0%) |
| Arts, Media & Entertainment | 0 (0.0%) | 0 (0.0%) |
| Health Diagnosing & Treating | 0 (0.0%) | 0 (0.0%) |
| Health Technologists | 0 (0.0%) | 0 (0.0%) |
| Total (Category) | 2 (33.3%) | 4 (66.7%) |
| Total (Overall) | 21 (67.7%) | 10 (32.3%) |
Services Occupations
The most common Services occupations in Larsen Bay are Cleaning & Maintenance (4 | 12.9%), Security & Protection (3 | 9.7%), and Law Enforcement (3 | 9.7%).
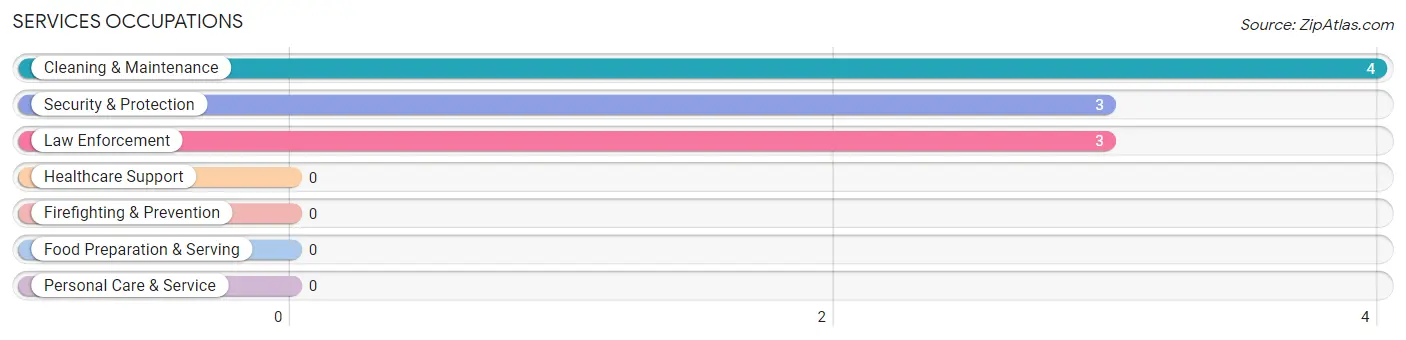
Services Occupations by Sex
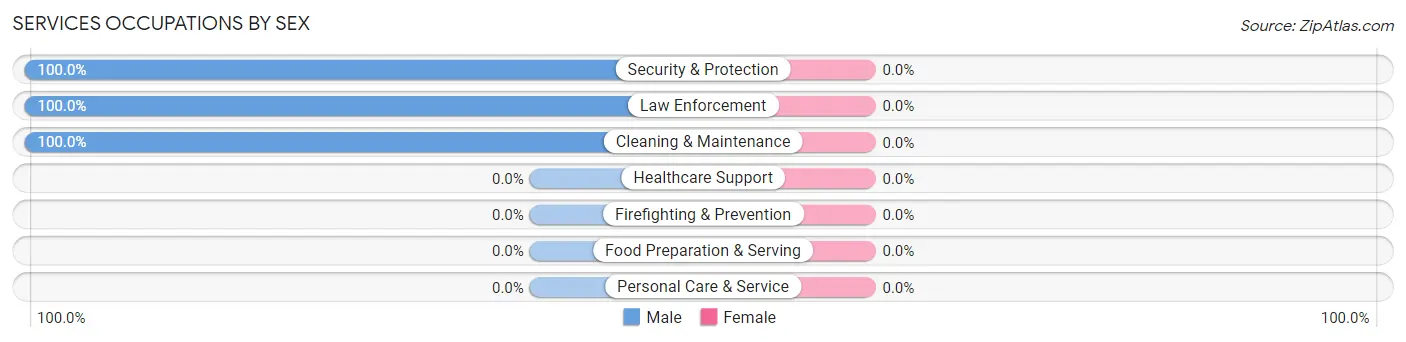
| Occupation | Male | Female |
| Healthcare Support | 0 (0.0%) | 0 (0.0%) |
| Security & Protection | 3 (100.0%) | 0 (0.0%) |
| Firefighting & Prevention | 0 (0.0%) | 0 (0.0%) |
| Law Enforcement | 3 (100.0%) | 0 (0.0%) |
| Food Preparation & Serving | 0 (0.0%) | 0 (0.0%) |
| Cleaning & Maintenance | 4 (100.0%) | 0 (0.0%) |
| Personal Care & Service | 0 (0.0%) | 0 (0.0%) |
| Total (Category) | 7 (100.0%) | 0 (0.0%) |
| Total (Overall) | 21 (67.7%) | 10 (32.3%) |
Sales and Office Occupations
The most common Sales and Office occupations in Larsen Bay are , and Office & Administration (4 | 12.9%).
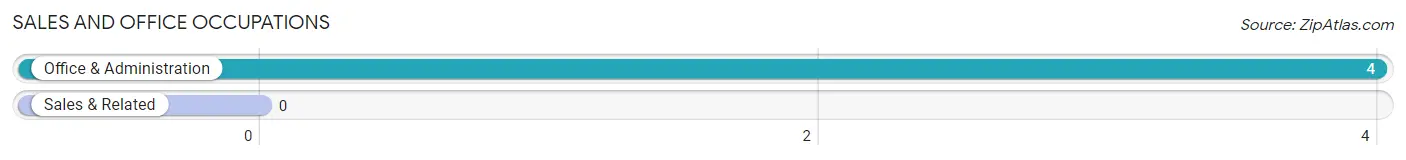
Sales and Office Occupations by Sex
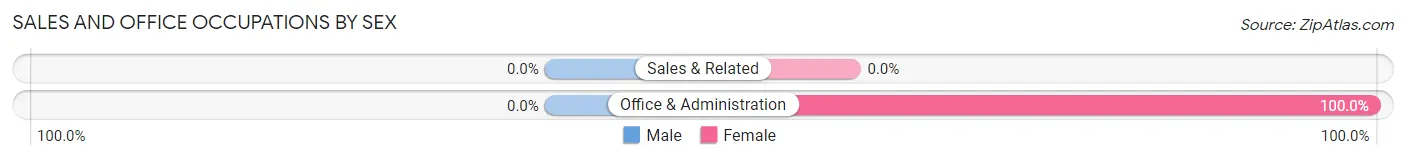
| Occupation | Male | Female |
| Sales & Related | 0 (0.0%) | 0 (0.0%) |
| Office & Administration | 0 (0.0%) | 4 (100.0%) |
| Total (Category) | 0 (0.0%) | 4 (100.0%) |
| Total (Overall) | 21 (67.7%) | 10 (32.3%) |
Natural Resources, Construction and Maintenance Occupations
The most common Natural Resources, Construction and Maintenance occupations in Larsen Bay are Farming, Fishing & Forestry (6 | 19.4%), and Installation, Maintenance & Repair (2 | 6.5%).
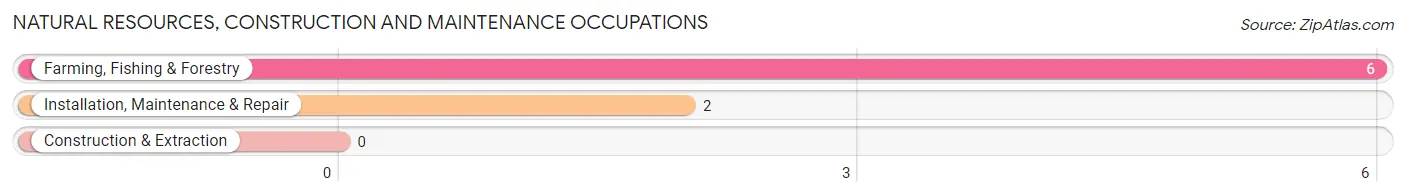
Natural Resources, Construction and Maintenance Occupations by Sex
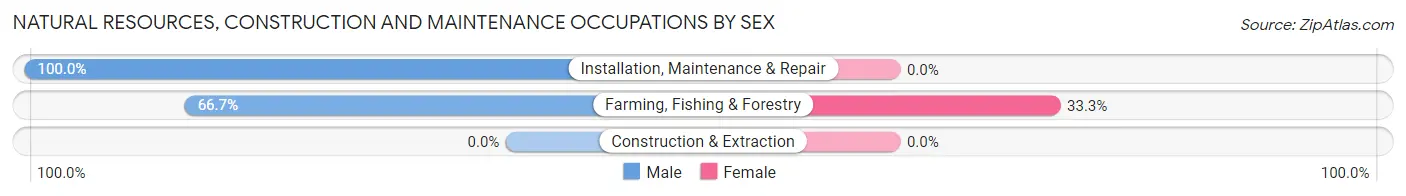
| Occupation | Male | Female |
| Farming, Fishing & Forestry | 4 (66.7%) | 2 (33.3%) |
| Construction & Extraction | 0 (0.0%) | 0 (0.0%) |
| Installation, Maintenance & Repair | 2 (100.0%) | 0 (0.0%) |
| Total (Category) | 6 (75.0%) | 2 (25.0%) |
| Total (Overall) | 21 (67.7%) | 10 (32.3%) |
Production, Transportation and Moving Occupations
The most common Production, Transportation and Moving occupations in Larsen Bay are , and Production (6 | 19.4%).
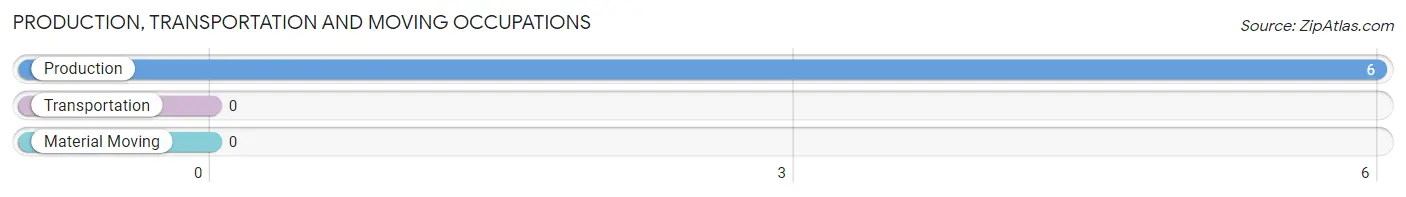
Production, Transportation and Moving Occupations by Sex
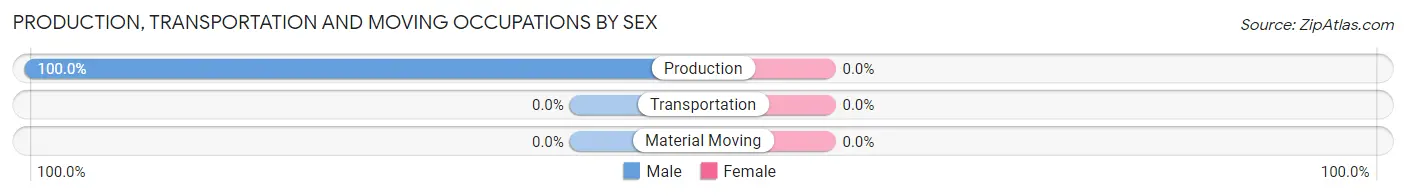
| Occupation | Male | Female |
| Production | 6 (100.0%) | 0 (0.0%) |
| Transportation | 0 (0.0%) | 0 (0.0%) |
| Material Moving | 0 (0.0%) | 0 (0.0%) |
| Total (Category) | 6 (100.0%) | 0 (0.0%) |
| Total (Overall) | 21 (67.7%) | 10 (32.3%) |
Employment Industries by Sex in Larsen Bay
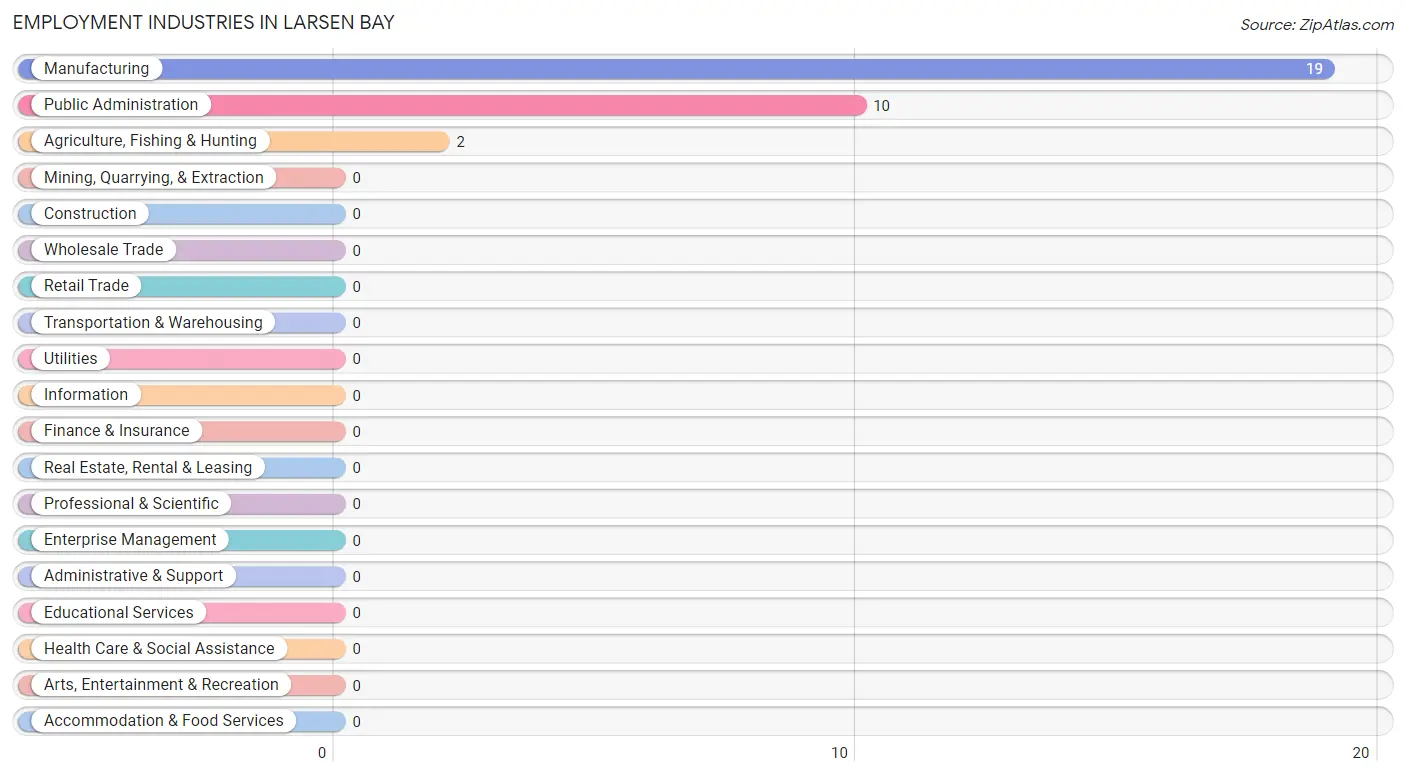
Employment Industries in Larsen Bay
The major employment industries in Larsen Bay include Manufacturing (19 | 61.3%), Public Administration (10 | 32.3%), and Agriculture, Fishing & Hunting (2 | 6.5%).
Employment Industries by Sex in Larsen Bay
The Larsen Bay industries that see more men than women are Public Administration (80.0%), and Manufacturing (68.4%), whereas the industries that tend to have a higher number of women are Agriculture, Fishing & Hunting (100.0%), Manufacturing (31.6%), and Public Administration (20.0%).
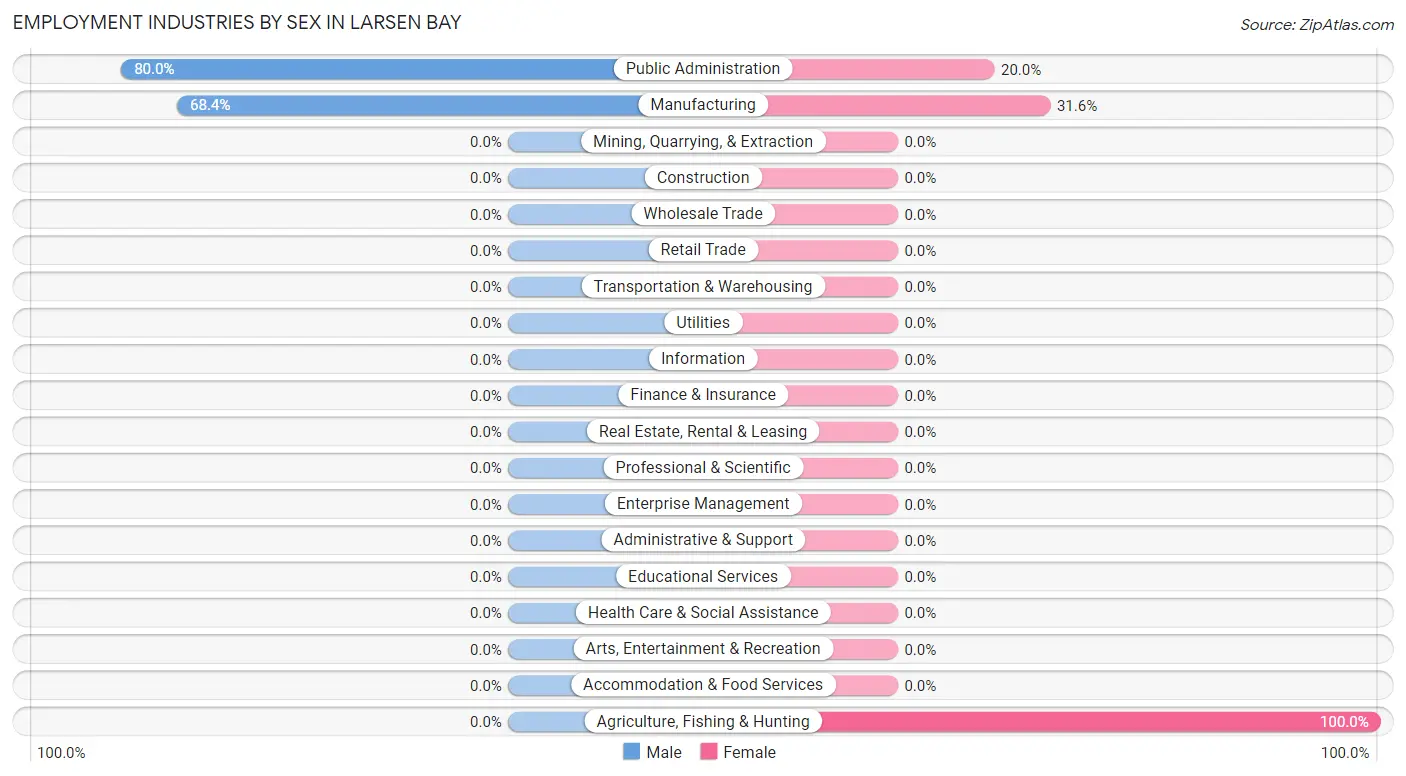
| Industry | Male | Female |
| Agriculture, Fishing & Hunting | 0 (0.0%) | 2 (100.0%) |
| Mining, Quarrying, & Extraction | 0 (0.0%) | 0 (0.0%) |
| Construction | 0 (0.0%) | 0 (0.0%) |
| Manufacturing | 13 (68.4%) | 6 (31.6%) |
| Wholesale Trade | 0 (0.0%) | 0 (0.0%) |
| Retail Trade | 0 (0.0%) | 0 (0.0%) |
| Transportation & Warehousing | 0 (0.0%) | 0 (0.0%) |
| Utilities | 0 (0.0%) | 0 (0.0%) |
| Information | 0 (0.0%) | 0 (0.0%) |
| Finance & Insurance | 0 (0.0%) | 0 (0.0%) |
| Real Estate, Rental & Leasing | 0 (0.0%) | 0 (0.0%) |
| Professional & Scientific | 0 (0.0%) | 0 (0.0%) |
| Enterprise Management | 0 (0.0%) | 0 (0.0%) |
| Administrative & Support | 0 (0.0%) | 0 (0.0%) |
| Educational Services | 0 (0.0%) | 0 (0.0%) |
| Health Care & Social Assistance | 0 (0.0%) | 0 (0.0%) |
| Arts, Entertainment & Recreation | 0 (0.0%) | 0 (0.0%) |
| Accommodation & Food Services | 0 (0.0%) | 0 (0.0%) |
| Public Administration | 8 (80.0%) | 2 (20.0%) |
| Total | 21 (67.7%) | 10 (32.3%) |
Education in Larsen Bay
School Enrollment in Larsen Bay
The most common levels of schooling among the 6 students in Larsen Bay are kindergarten (2 | 33.3%), elementary school (2 | 33.3%), and graduate / professional (2 | 33.3%).
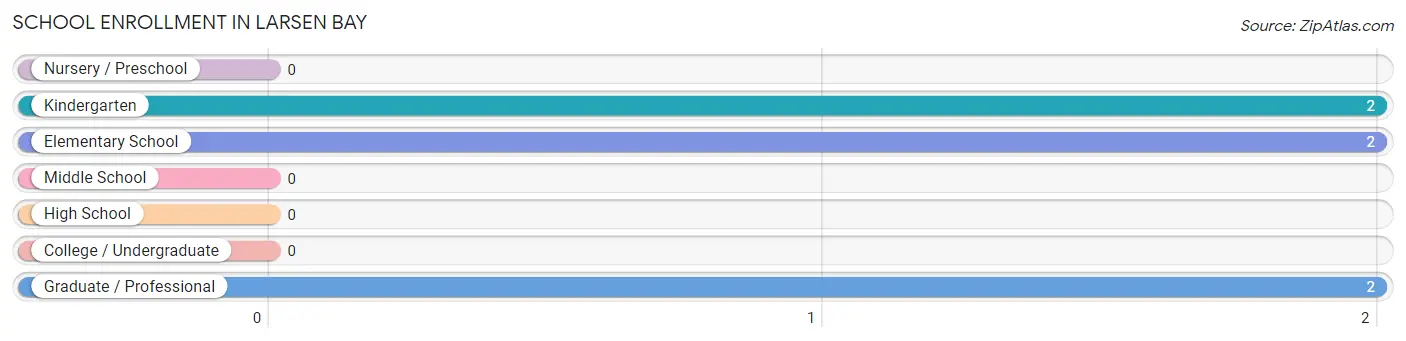
| School Level | # Students | % Students |
| Nursery / Preschool | 0 | 0.0% |
| Kindergarten | 2 | 33.3% |
| Elementary School | 2 | 33.3% |
| Middle School | 0 | 0.0% |
| High School | 0 | 0.0% |
| College / Undergraduate | 0 | 0.0% |
| Graduate / Professional | 2 | 33.3% |
| Total | 6 | 100.0% |
School Enrollment by Age by Funding Source in Larsen Bay
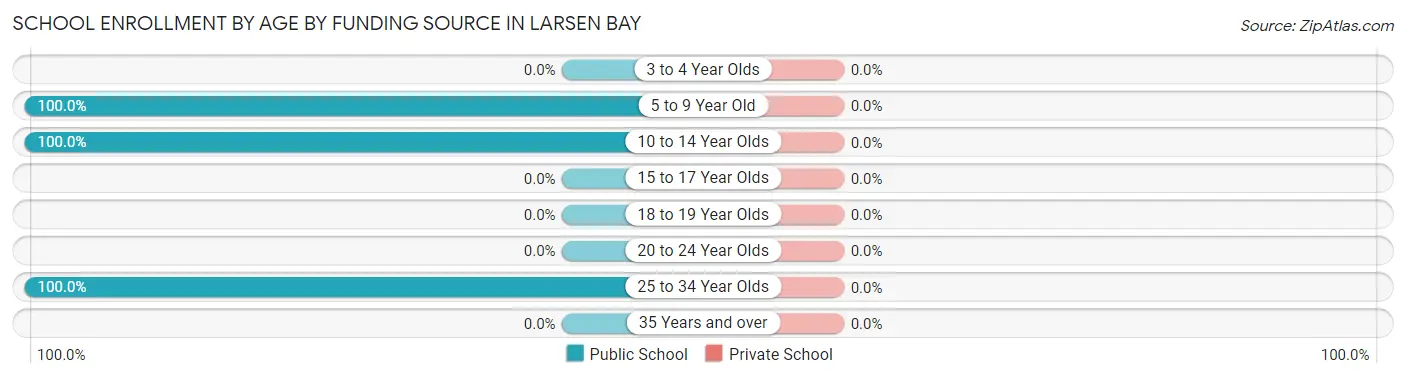
| Age Bracket | Public School | Private School |
| 3 to 4 Year Olds | 0 (0.0%) | 0 (0.0%) |
| 5 to 9 Year Old | 2 (100.0%) | 0 (0.0%) |
| 10 to 14 Year Olds | 2 (100.0%) | 0 (0.0%) |
| 15 to 17 Year Olds | 0 (0.0%) | 0 (0.0%) |
| 18 to 19 Year Olds | 0 (0.0%) | 0 (0.0%) |
| 20 to 24 Year Olds | 0 (0.0%) | 0 (0.0%) |
| 25 to 34 Year Olds | 2 (100.0%) | 0 (0.0%) |
| 35 Years and over | 0 (0.0%) | 0 (0.0%) |
| Total | 6 (100.0%) | 0 (0.0%) |
Educational Attainment by Field of Study in Larsen Bay
Social sciences (3 | 60.0%), and literature & languages (2 | 40.0%) are the most common fields of study among 5 individuals in Larsen Bay who have obtained a bachelor's degree or higher.
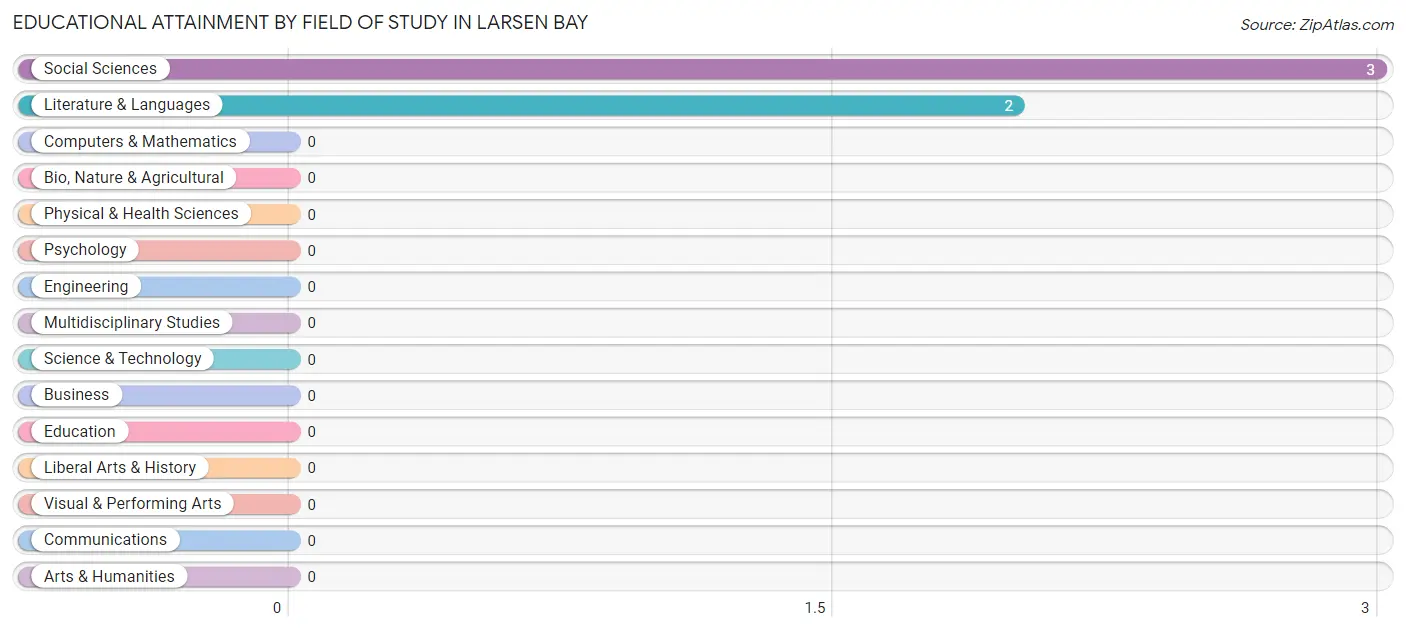
| Field of Study | # Graduates | % Graduates |
| Computers & Mathematics | 0 | 0.0% |
| Bio, Nature & Agricultural | 0 | 0.0% |
| Physical & Health Sciences | 0 | 0.0% |
| Psychology | 0 | 0.0% |
| Social Sciences | 3 | 60.0% |
| Engineering | 0 | 0.0% |
| Multidisciplinary Studies | 0 | 0.0% |
| Science & Technology | 0 | 0.0% |
| Business | 0 | 0.0% |
| Education | 0 | 0.0% |
| Literature & Languages | 2 | 40.0% |
| Liberal Arts & History | 0 | 0.0% |
| Visual & Performing Arts | 0 | 0.0% |
| Communications | 0 | 0.0% |
| Arts & Humanities | 0 | 0.0% |
| Total | 5 | 100.0% |
Transportation & Commute in Larsen Bay
Vehicle Availability by Sex in Larsen Bay
The most prevalent vehicle ownership categories in Larsen Bay are males with 1 vehicle (5, accounting for 62.5%) and females with 1 vehicle (4, making up 125.0%).
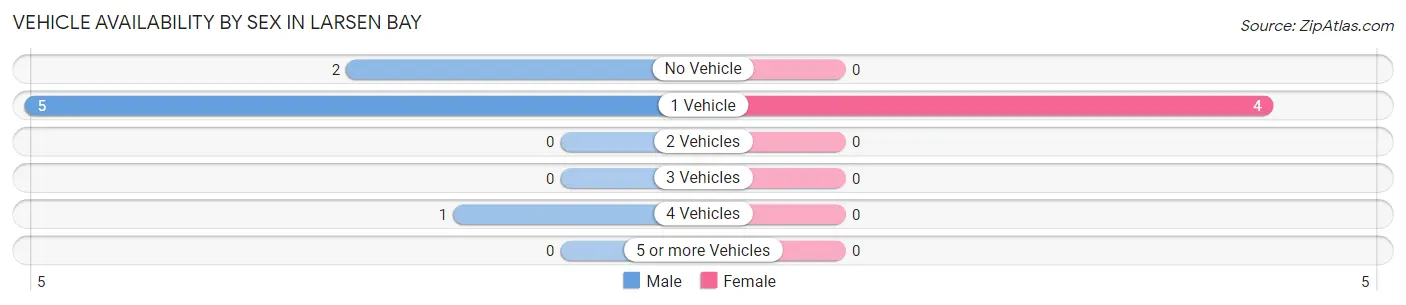
| Vehicles Available | Male | Female |
| No Vehicle | 2 (25.0%) | 0 (0.0%) |
| 1 Vehicle | 5 (62.5%) | 4 (100.0%) |
| 2 Vehicles | 0 (0.0%) | 0 (0.0%) |
| 3 Vehicles | 0 (0.0%) | 0 (0.0%) |
| 4 Vehicles | 1 (12.5%) | 0 (0.0%) |
| 5 or more Vehicles | 0 (0.0%) | 0 (0.0%) |
| Total | 8 (100.0%) | 4 (100.0%) |
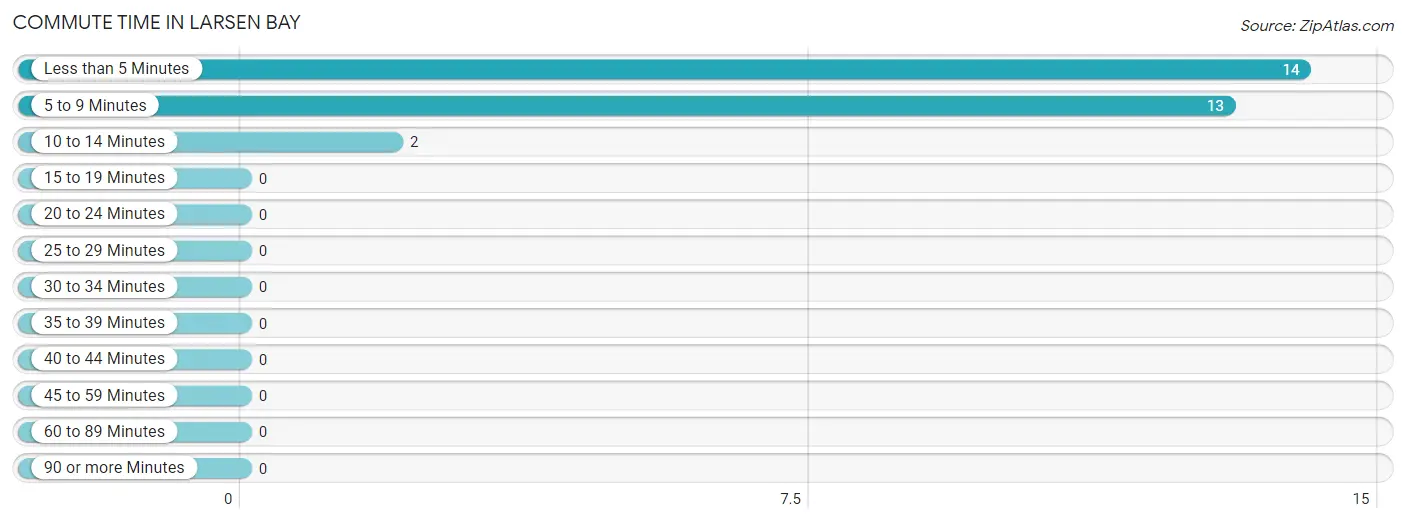
Commute Time in Larsen Bay
The most frequently occuring commute durations in Larsen Bay are less than 5 minutes (14 commuters, 48.3%), 5 to 9 minutes (13 commuters, 44.8%), and 10 to 14 minutes (2 commuters, 6.9%).
| Commute Time | # Commuters | % Commuters |
| Less than 5 Minutes | 14 | 48.3% |
| 5 to 9 Minutes | 13 | 44.8% |
| 10 to 14 Minutes | 2 | 6.9% |
| 15 to 19 Minutes | 0 | 0.0% |
| 20 to 24 Minutes | 0 | 0.0% |
| 25 to 29 Minutes | 0 | 0.0% |
| 30 to 34 Minutes | 0 | 0.0% |
| 35 to 39 Minutes | 0 | 0.0% |
| 40 to 44 Minutes | 0 | 0.0% |
| 45 to 59 Minutes | 0 | 0.0% |
| 60 to 89 Minutes | 0 | 0.0% |
| 90 or more Minutes | 0 | 0.0% |
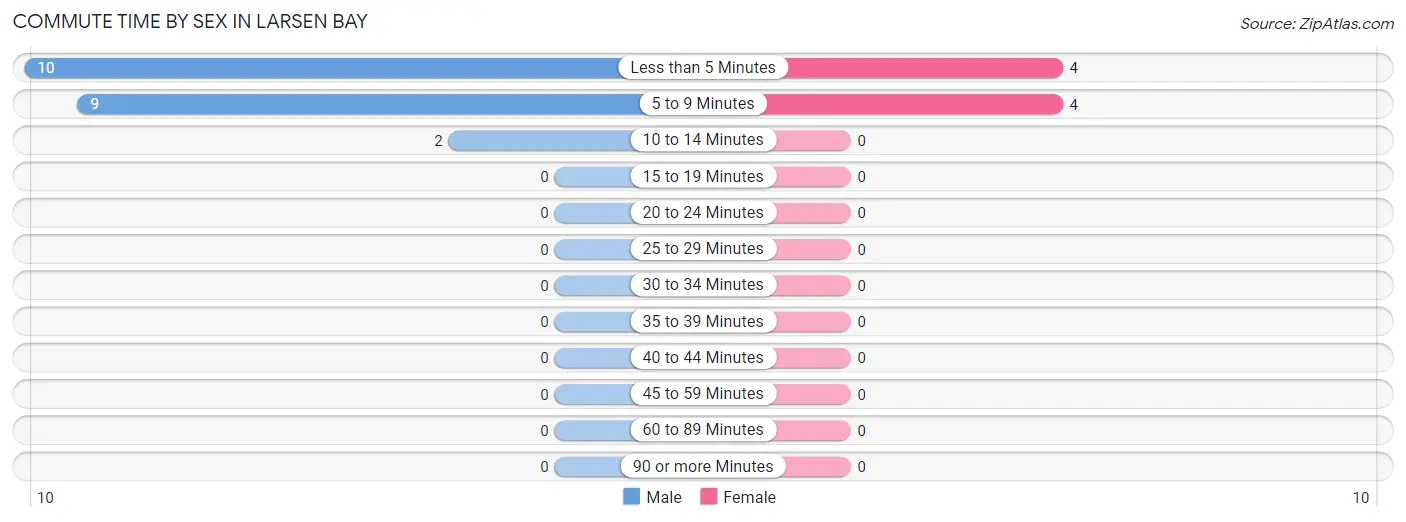
Commute Time by Sex in Larsen Bay
The most common commute times in Larsen Bay are less than 5 minutes (10 commuters, 47.6%) for males and less than 5 minutes (4 commuters, 50.0%) for females.
| Commute Time | Male | Female |
| Less than 5 Minutes | 10 (47.6%) | 4 (50.0%) |
| 5 to 9 Minutes | 9 (42.9%) | 4 (50.0%) |
| 10 to 14 Minutes | 2 (9.5%) | 0 (0.0%) |
| 15 to 19 Minutes | 0 (0.0%) | 0 (0.0%) |
| 20 to 24 Minutes | 0 (0.0%) | 0 (0.0%) |
| 25 to 29 Minutes | 0 (0.0%) | 0 (0.0%) |
| 30 to 34 Minutes | 0 (0.0%) | 0 (0.0%) |
| 35 to 39 Minutes | 0 (0.0%) | 0 (0.0%) |
| 40 to 44 Minutes | 0 (0.0%) | 0 (0.0%) |
| 45 to 59 Minutes | 0 (0.0%) | 0 (0.0%) |
| 60 to 89 Minutes | 0 (0.0%) | 0 (0.0%) |
| 90 or more Minutes | 0 (0.0%) | 0 (0.0%) |
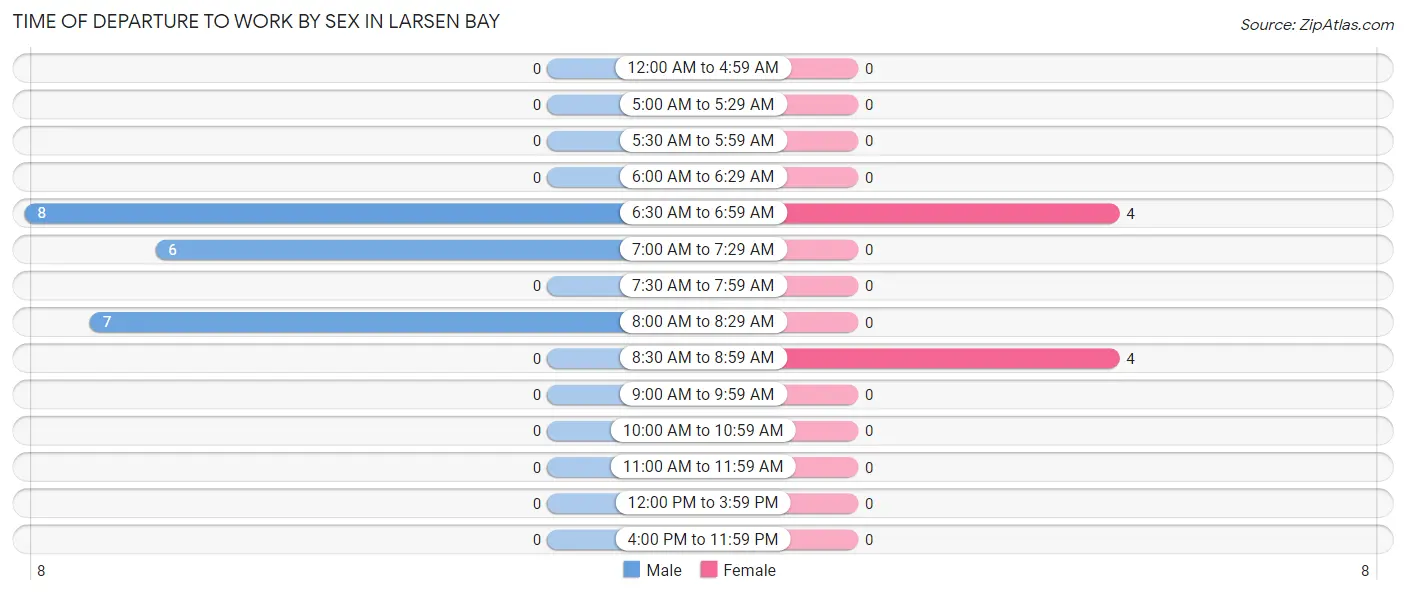
Time of Departure to Work by Sex in Larsen Bay
The most frequent times of departure to work in Larsen Bay are 6:30 AM to 6:59 AM (8, 38.1%) for males and 6:30 AM to 6:59 AM (4, 50.0%) for females.
| Time of Departure | Male | Female |
| 12:00 AM to 4:59 AM | 0 (0.0%) | 0 (0.0%) |
| 5:00 AM to 5:29 AM | 0 (0.0%) | 0 (0.0%) |
| 5:30 AM to 5:59 AM | 0 (0.0%) | 0 (0.0%) |
| 6:00 AM to 6:29 AM | 0 (0.0%) | 0 (0.0%) |
| 6:30 AM to 6:59 AM | 8 (38.1%) | 4 (50.0%) |
| 7:00 AM to 7:29 AM | 6 (28.6%) | 0 (0.0%) |
| 7:30 AM to 7:59 AM | 0 (0.0%) | 0 (0.0%) |
| 8:00 AM to 8:29 AM | 7 (33.3%) | 0 (0.0%) |
| 8:30 AM to 8:59 AM | 0 (0.0%) | 4 (50.0%) |
| 9:00 AM to 9:59 AM | 0 (0.0%) | 0 (0.0%) |
| 10:00 AM to 10:59 AM | 0 (0.0%) | 0 (0.0%) |
| 11:00 AM to 11:59 AM | 0 (0.0%) | 0 (0.0%) |
| 12:00 PM to 3:59 PM | 0 (0.0%) | 0 (0.0%) |
| 4:00 PM to 11:59 PM | 0 (0.0%) | 0 (0.0%) |
| Total | 21 (100.0%) | 8 (100.0%) |
Housing Occupancy in Larsen Bay
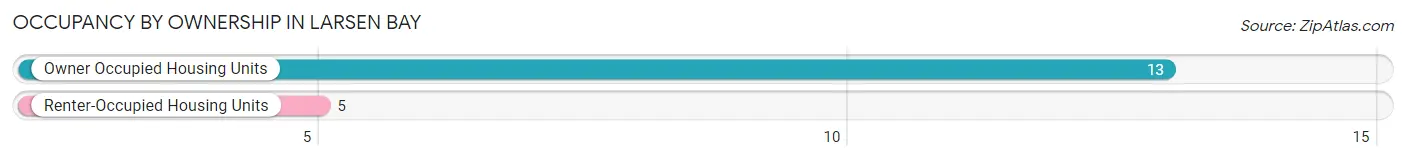
Occupancy by Ownership in Larsen Bay
Of the total 18 dwellings in Larsen Bay, owner-occupied units account for 13 (72.2%), while renter-occupied units make up 5 (27.8%).
| Occupancy | # Housing Units | % Housing Units |
| Owner Occupied Housing Units | 13 | 72.2% |
| Renter-Occupied Housing Units | 5 | 27.8% |
| Total Occupied Housing Units | 18 | 100.0% |
Occupancy by Household Size in Larsen Bay
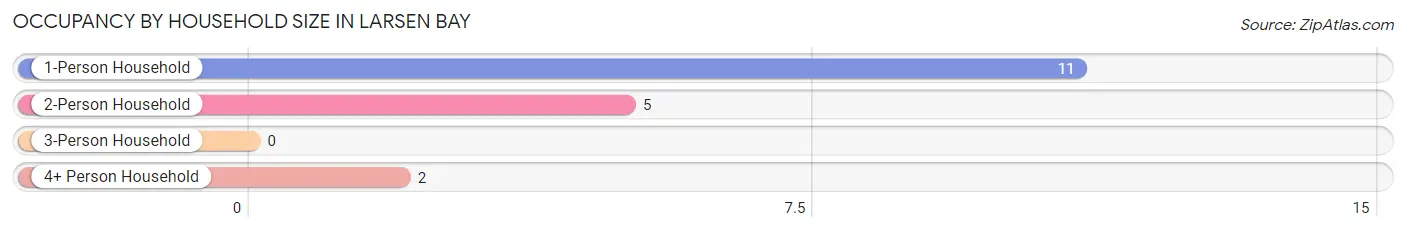
| Household Size | # Housing Units | % Housing Units |
| 1-Person Household | 11 | 61.1% |
| 2-Person Household | 5 | 27.8% |
| 3-Person Household | 0 | 0.0% |
| 4+ Person Household | 2 | 11.1% |
| Total Housing Units | 18 | 100.0% |
Occupancy by Ownership by Household Size in Larsen Bay
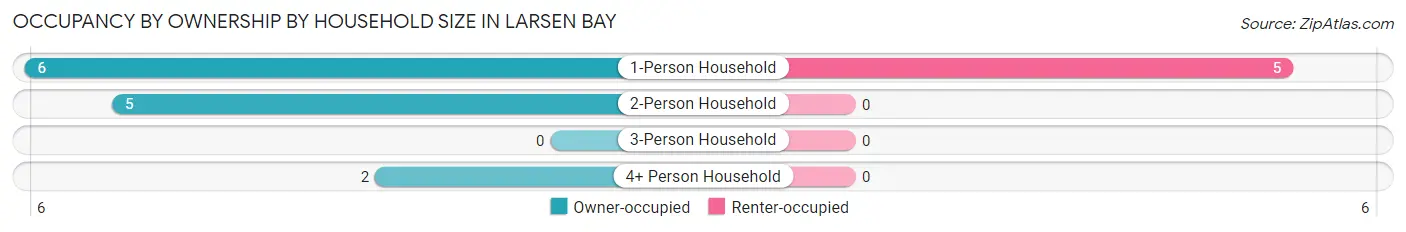
| Household Size | Owner-occupied | Renter-occupied |
| 1-Person Household | 6 (54.5%) | 5 (45.5%) |
| 2-Person Household | 5 (100.0%) | 0 (0.0%) |
| 3-Person Household | 0 (0.0%) | 0 (0.0%) |
| 4+ Person Household | 2 (100.0%) | 0 (0.0%) |
| Total Housing Units | 13 (72.2%) | 5 (27.8%) |
Occupancy by Educational Attainment in Larsen Bay
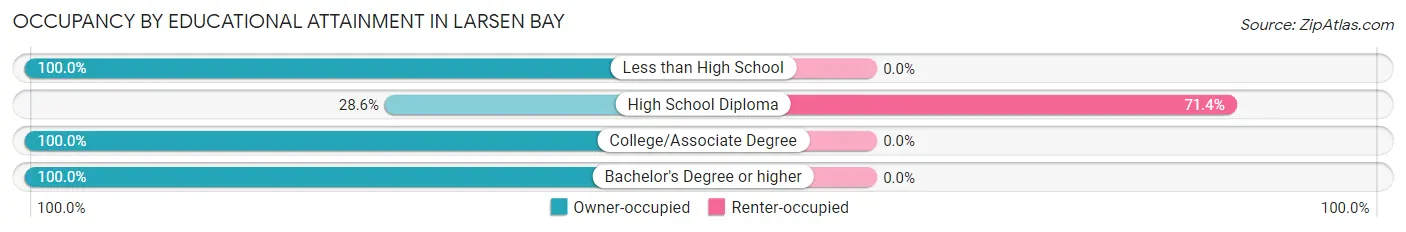
| Household Size | Owner-occupied | Renter-occupied |
| Less than High School | 3 (100.0%) | 0 (0.0%) |
| High School Diploma | 2 (28.6%) | 5 (71.4%) |
| College/Associate Degree | 5 (100.0%) | 0 (0.0%) |
| Bachelor's Degree or higher | 3 (100.0%) | 0 (0.0%) |
Occupancy by Age of Householder in Larsen Bay
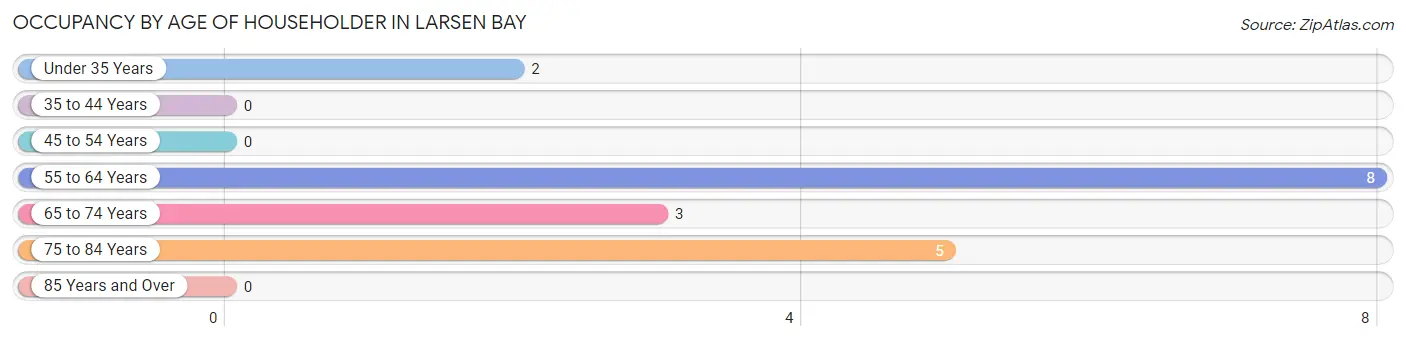
| Age Bracket | # Households | % Households |
| Under 35 Years | 2 | 11.1% |
| 35 to 44 Years | 0 | 0.0% |
| 45 to 54 Years | 0 | 0.0% |
| 55 to 64 Years | 8 | 44.4% |
| 65 to 74 Years | 3 | 16.7% |
| 75 to 84 Years | 5 | 27.8% |
| 85 Years and Over | 0 | 0.0% |
| Total | 18 | 100.0% |
Housing Finances in Larsen Bay
Median Income by Occupancy in Larsen Bay
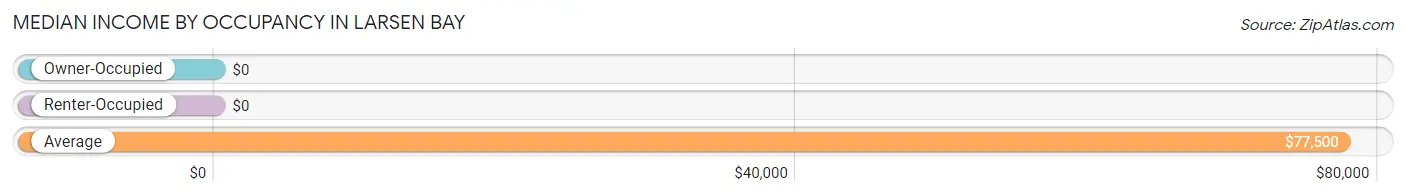
| Occupancy Type | # Households | Median Income |
| Owner-Occupied | 13 (72.2%) | $0 |
| Renter-Occupied | 5 (27.8%) | $0 |
| Average | 18 (100.0%) | $77,500 |
Occupancy by Householder Income Bracket in Larsen Bay
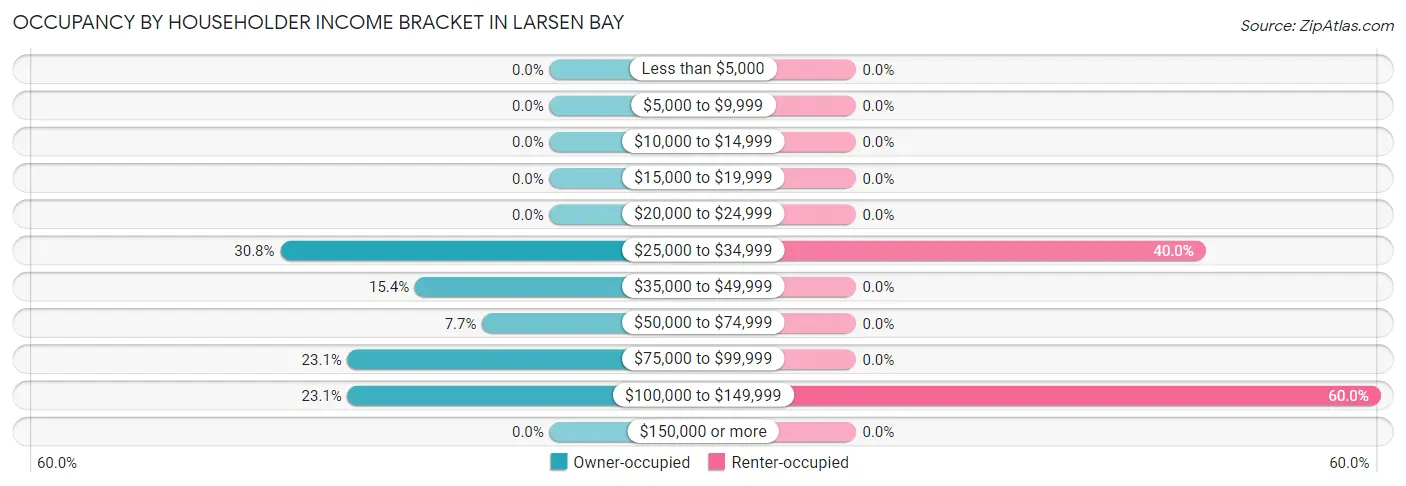
| Income Bracket | Owner-occupied | Renter-occupied |
| Less than $5,000 | 0 (0.0%) | 0 (0.0%) |
| $5,000 to $9,999 | 0 (0.0%) | 0 (0.0%) |
| $10,000 to $14,999 | 0 (0.0%) | 0 (0.0%) |
| $15,000 to $19,999 | 0 (0.0%) | 0 (0.0%) |
| $20,000 to $24,999 | 0 (0.0%) | 0 (0.0%) |
| $25,000 to $34,999 | 4 (30.8%) | 2 (40.0%) |
| $35,000 to $49,999 | 2 (15.4%) | 0 (0.0%) |
| $50,000 to $74,999 | 1 (7.7%) | 0 (0.0%) |
| $75,000 to $99,999 | 3 (23.1%) | 0 (0.0%) |
| $100,000 to $149,999 | 3 (23.1%) | 3 (60.0%) |
| $150,000 or more | 0 (0.0%) | 0 (0.0%) |
| Total | 13 (100.0%) | 5 (100.0%) |
Monthly Housing Cost Tiers in Larsen Bay
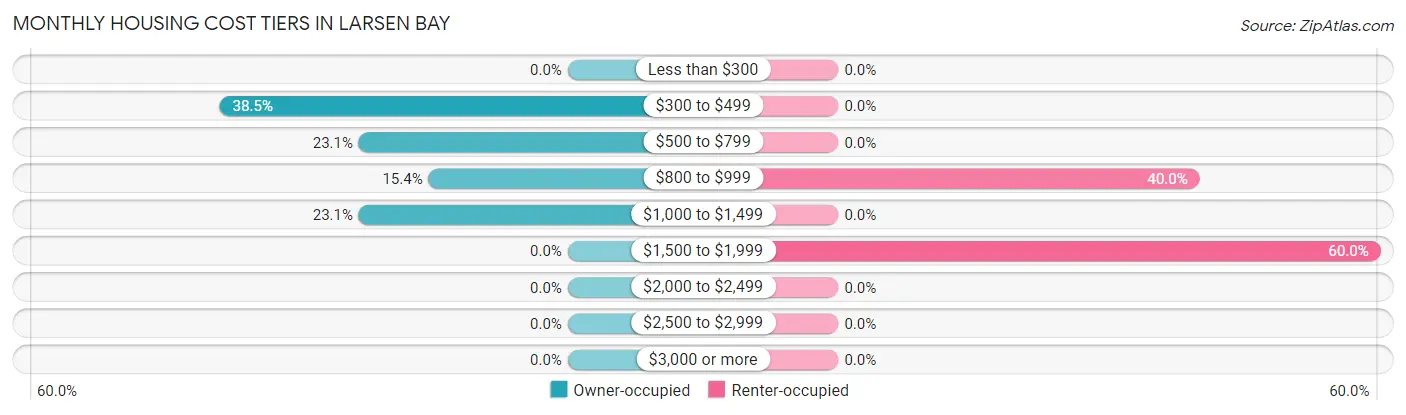
| Monthly Cost | Owner-occupied | Renter-occupied |
| Less than $300 | 0 (0.0%) | 0 (0.0%) |
| $300 to $499 | 5 (38.5%) | 0 (0.0%) |
| $500 to $799 | 3 (23.1%) | 0 (0.0%) |
| $800 to $999 | 2 (15.4%) | 2 (40.0%) |
| $1,000 to $1,499 | 3 (23.1%) | 0 (0.0%) |
| $1,500 to $1,999 | 0 (0.0%) | 3 (60.0%) |
| $2,000 to $2,499 | 0 (0.0%) | 0 (0.0%) |
| $2,500 to $2,999 | 0 (0.0%) | 0 (0.0%) |
| $3,000 or more | 0 (0.0%) | 0 (0.0%) |
| Total | 13 (100.0%) | 5 (100.0%) |
Physical Housing Characteristics in Larsen Bay
Housing Structures in Larsen Bay
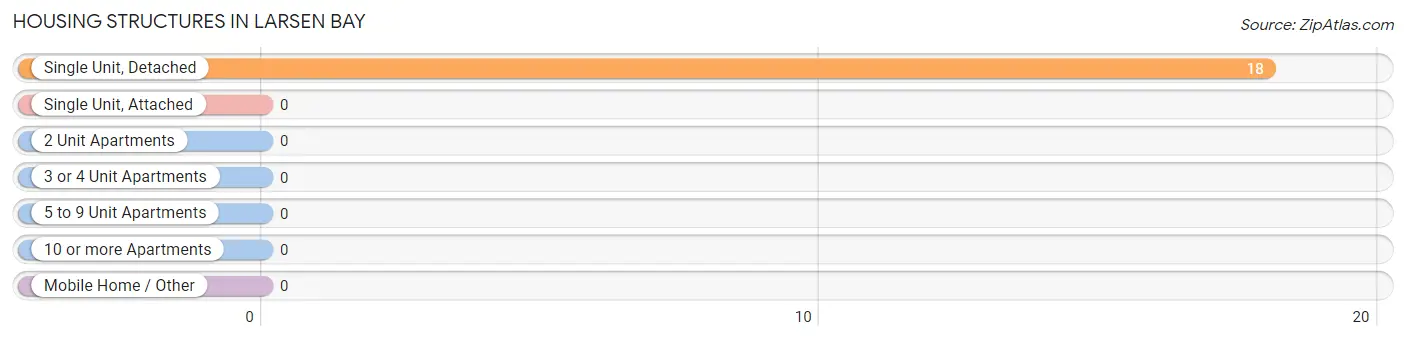
| Structure Type | # Housing Units | % Housing Units |
| Single Unit, Detached | 18 | 100.0% |
| Single Unit, Attached | 0 | 0.0% |
| 2 Unit Apartments | 0 | 0.0% |
| 3 or 4 Unit Apartments | 0 | 0.0% |
| 5 to 9 Unit Apartments | 0 | 0.0% |
| 10 or more Apartments | 0 | 0.0% |
| Mobile Home / Other | 0 | 0.0% |
| Total | 18 | 100.0% |
Housing Structures by Occupancy in Larsen Bay
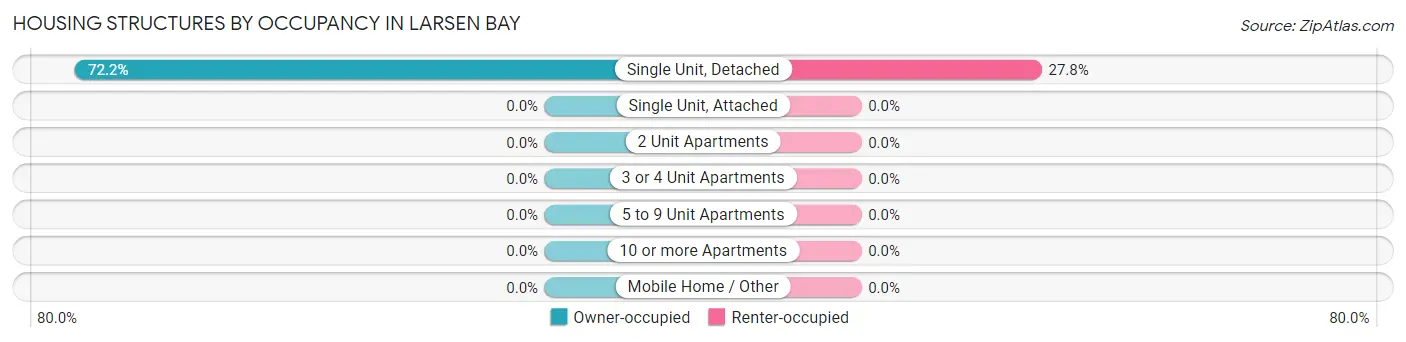
| Structure Type | Owner-occupied | Renter-occupied |
| Single Unit, Detached | 13 (72.2%) | 5 (27.8%) |
| Single Unit, Attached | 0 (0.0%) | 0 (0.0%) |
| 2 Unit Apartments | 0 (0.0%) | 0 (0.0%) |
| 3 or 4 Unit Apartments | 0 (0.0%) | 0 (0.0%) |
| 5 to 9 Unit Apartments | 0 (0.0%) | 0 (0.0%) |
| 10 or more Apartments | 0 (0.0%) | 0 (0.0%) |
| Mobile Home / Other | 0 (0.0%) | 0 (0.0%) |
| Total | 13 (72.2%) | 5 (27.8%) |
Housing Structures by Number of Rooms in Larsen Bay
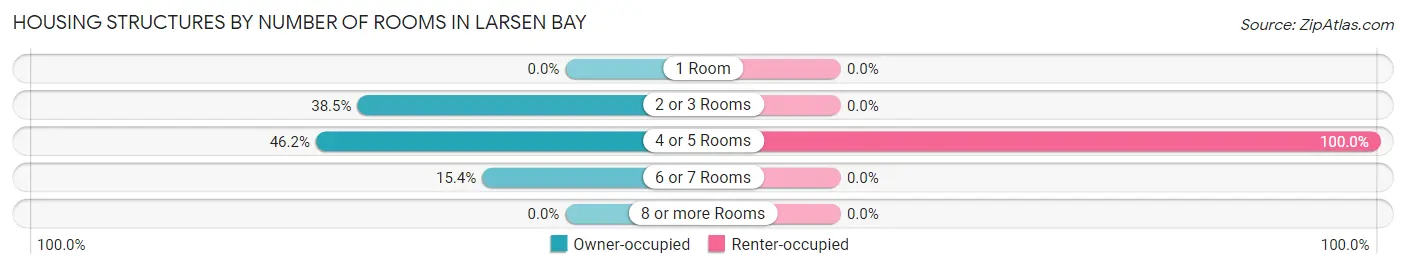
| Number of Rooms | Owner-occupied | Renter-occupied |
| 1 Room | 0 (0.0%) | 0 (0.0%) |
| 2 or 3 Rooms | 5 (38.5%) | 0 (0.0%) |
| 4 or 5 Rooms | 6 (46.2%) | 5 (100.0%) |
| 6 or 7 Rooms | 2 (15.4%) | 0 (0.0%) |
| 8 or more Rooms | 0 (0.0%) | 0 (0.0%) |
| Total | 13 (100.0%) | 5 (100.0%) |
Housing Structure by Heating Type in Larsen Bay
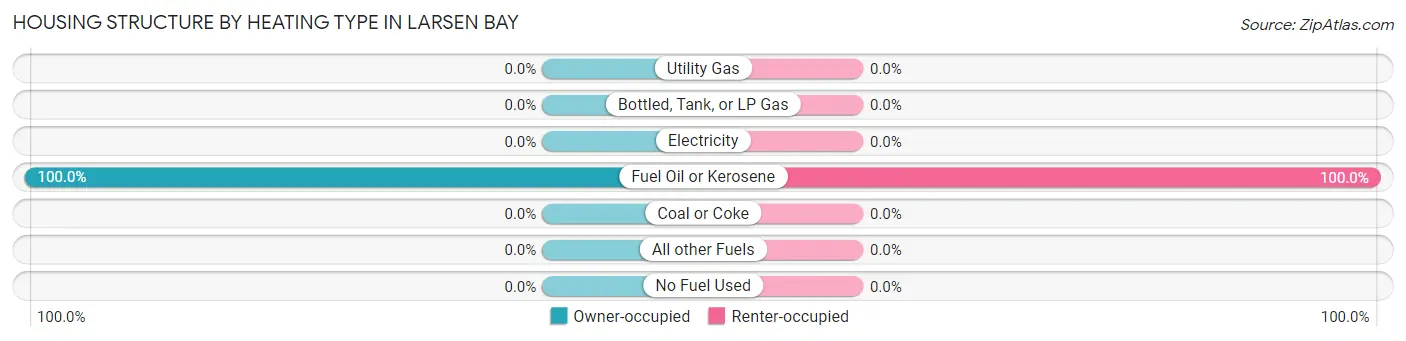
| Heating Type | Owner-occupied | Renter-occupied |
| Utility Gas | 0 (0.0%) | 0 (0.0%) |
| Bottled, Tank, or LP Gas | 0 (0.0%) | 0 (0.0%) |
| Electricity | 0 (0.0%) | 0 (0.0%) |
| Fuel Oil or Kerosene | 13 (100.0%) | 5 (100.0%) |
| Coal or Coke | 0 (0.0%) | 0 (0.0%) |
| All other Fuels | 0 (0.0%) | 0 (0.0%) |
| No Fuel Used | 0 (0.0%) | 0 (0.0%) |
| Total | 13 (100.0%) | 5 (100.0%) |
Household Vehicle Usage in Larsen Bay
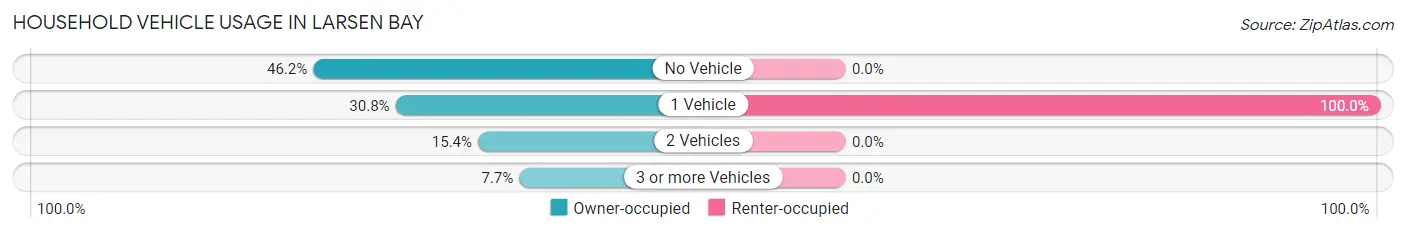
| Vehicles per Household | Owner-occupied | Renter-occupied |
| No Vehicle | 6 (46.2%) | 0 (0.0%) |
| 1 Vehicle | 4 (30.8%) | 5 (100.0%) |
| 2 Vehicles | 2 (15.4%) | 0 (0.0%) |
| 3 or more Vehicles | 1 (7.7%) | 0 (0.0%) |
| Total | 13 (100.0%) | 5 (100.0%) |
Real Estate & Mortgages in Larsen Bay
Real Estate and Mortgage Overview in Larsen Bay
| Characteristic | Without Mortgage | With Mortgage |
| Housing Units | 11 | 2 |
| Median Property Value | $110,400 | $0 |
| Median Household Income | $95,417 | $0 |
| Monthly Housing Costs | $625 | $0 |
| Real Estate Taxes | $1,188 | $2 |
Property Value by Mortgage Status in Larsen Bay
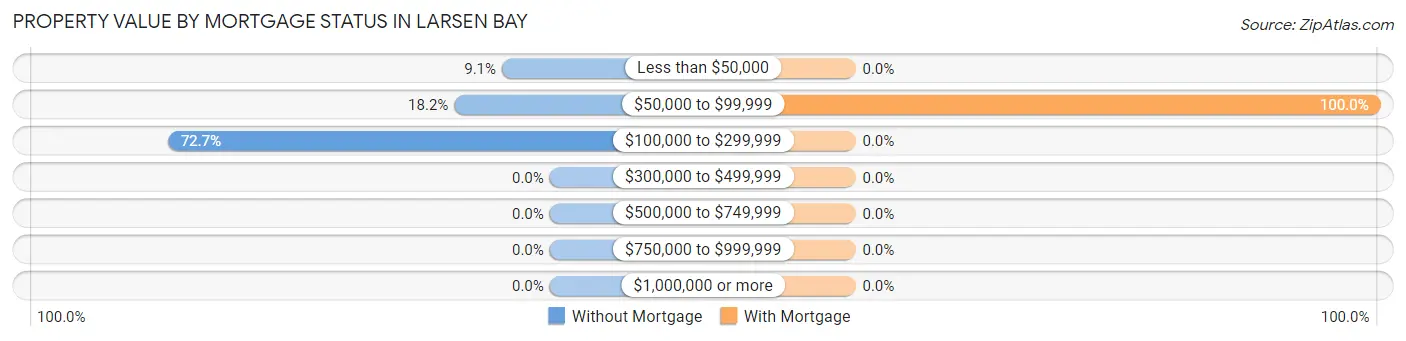
| Property Value | Without Mortgage | With Mortgage |
| Less than $50,000 | 1 (9.1%) | 0 (0.0%) |
| $50,000 to $99,999 | 2 (18.2%) | 2 (100.0%) |
| $100,000 to $299,999 | 8 (72.7%) | 0 (0.0%) |
| $300,000 to $499,999 | 0 (0.0%) | 0 (0.0%) |
| $500,000 to $749,999 | 0 (0.0%) | 0 (0.0%) |
| $750,000 to $999,999 | 0 (0.0%) | 0 (0.0%) |
| $1,000,000 or more | 0 (0.0%) | 0 (0.0%) |
| Total | 11 (100.0%) | 2 (100.0%) |
Household Income by Mortgage Status in Larsen Bay
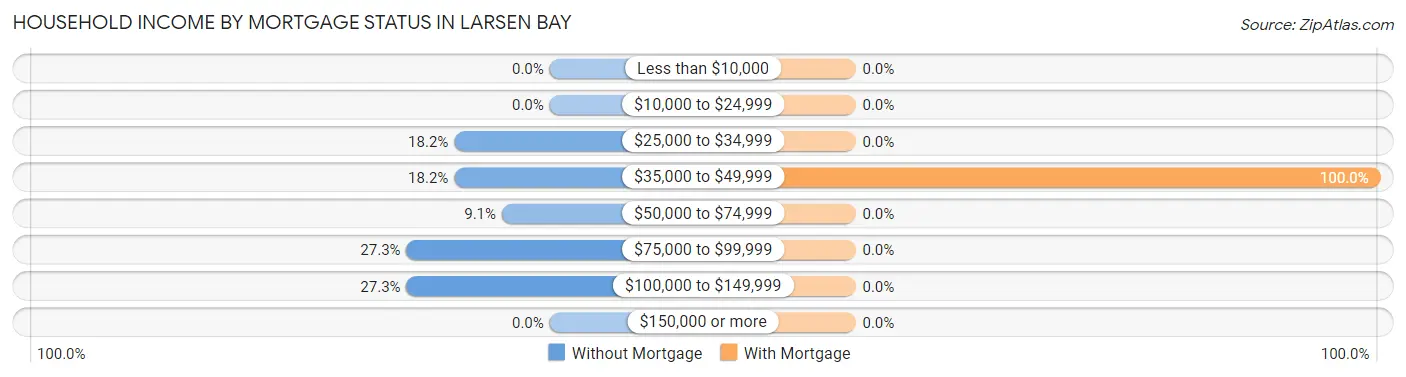
| Household Income | Without Mortgage | With Mortgage |
| Less than $10,000 | 0 (0.0%) | 0 (0.0%) |
| $10,000 to $24,999 | 0 (0.0%) | 0 (0.0%) |
| $25,000 to $34,999 | 2 (18.2%) | 0 (0.0%) |
| $35,000 to $49,999 | 2 (18.2%) | 2 (100.0%) |
| $50,000 to $74,999 | 1 (9.1%) | 0 (0.0%) |
| $75,000 to $99,999 | 3 (27.3%) | 0 (0.0%) |
| $100,000 to $149,999 | 3 (27.3%) | 0 (0.0%) |
| $150,000 or more | 0 (0.0%) | 0 (0.0%) |
| Total | 11 (100.0%) | 2 (100.0%) |
Property Value to Household Income Ratio in Larsen Bay
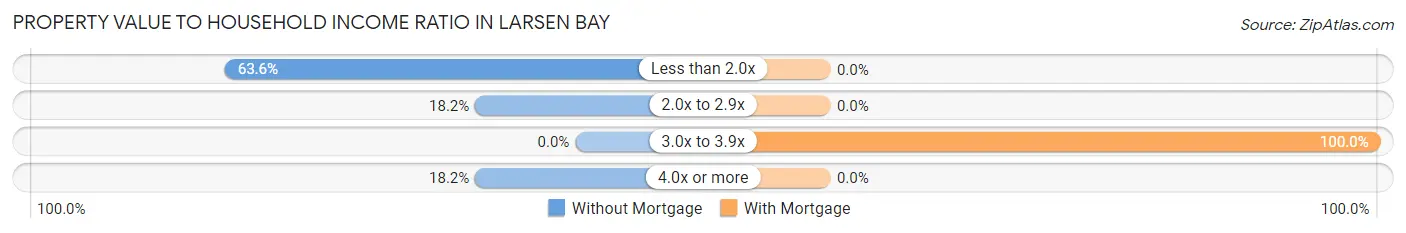
| Value-to-Income Ratio | Without Mortgage | With Mortgage |
| Less than 2.0x | 7 (63.6%) | 0 (0.0%) |
| 2.0x to 2.9x | 2 (18.2%) | 0 (0.0%) |
| 3.0x to 3.9x | 0 (0.0%) | 2 (100.0%) |
| 4.0x or more | 2 (18.2%) | 0 (0.0%) |
| Total | 11 (100.0%) | 2 (100.0%) |
Real Estate Taxes by Mortgage Status in Larsen Bay
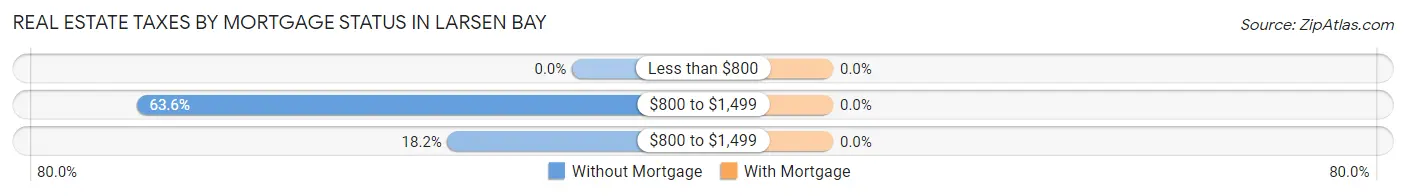
| Property Taxes | Without Mortgage | With Mortgage |
| Less than $800 | 0 (0.0%) | 0 (0.0%) |
| $800 to $1,499 | 7 (63.6%) | 0 (0.0%) |
| $800 to $1,499 | 2 (18.2%) | 0 (0.0%) |
| Total | 11 (100.0%) | 2 (100.0%) |
Health & Disability in Larsen Bay
Health Insurance Coverage by Age in Larsen Bay
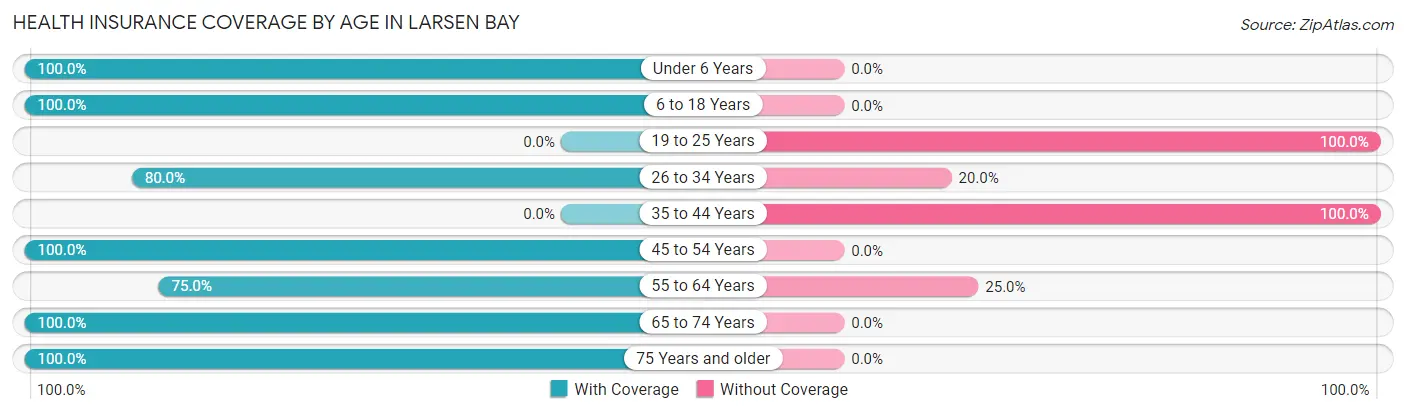
| Age Bracket | With Coverage | Without Coverage |
| Under 6 Years | 2 (100.0%) | 0 (0.0%) |
| 6 to 18 Years | 4 (100.0%) | 0 (0.0%) |
| 19 to 25 Years | 0 (0.0%) | 2 (100.0%) |
| 26 to 34 Years | 8 (80.0%) | 2 (20.0%) |
| 35 to 44 Years | 0 (0.0%) | 2 (100.0%) |
| 45 to 54 Years | 2 (100.0%) | 0 (0.0%) |
| 55 to 64 Years | 9 (75.0%) | 3 (25.0%) |
| 65 to 74 Years | 6 (100.0%) | 0 (0.0%) |
| 75 Years and older | 6 (100.0%) | 0 (0.0%) |
| Total | 37 (80.4%) | 9 (19.6%) |
Health Insurance Coverage by Citizenship Status in Larsen Bay
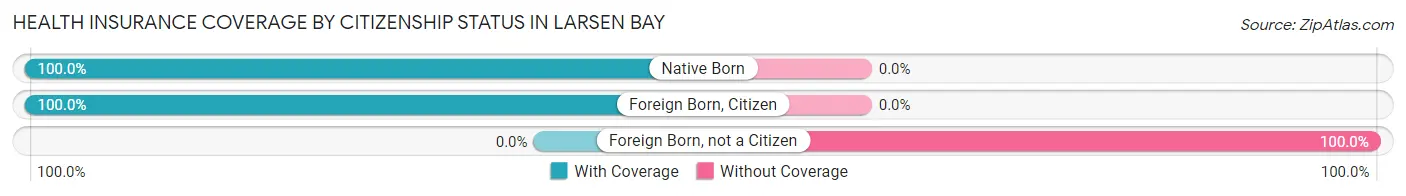
| Citizenship Status | With Coverage | Without Coverage |
| Native Born | 2 (100.0%) | 0 (0.0%) |
| Foreign Born, Citizen | 4 (100.0%) | 0 (0.0%) |
| Foreign Born, not a Citizen | 0 (0.0%) | 2 (100.0%) |
Health Insurance Coverage by Household Income in Larsen Bay
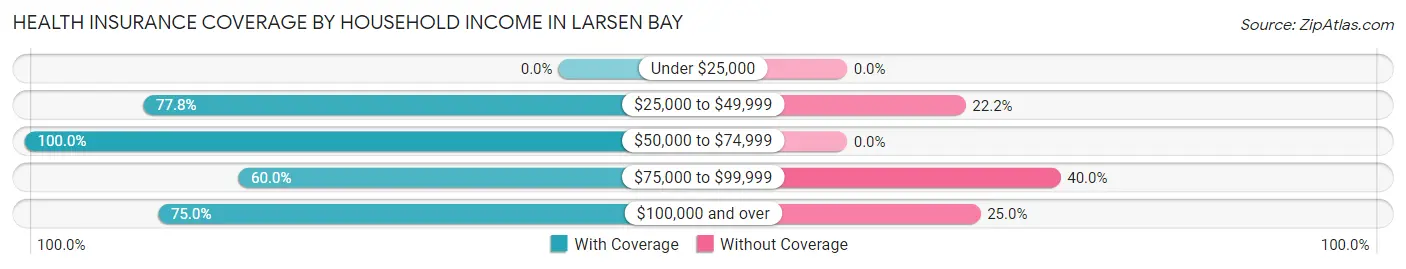
| Household Income | With Coverage | Without Coverage |
| Under $25,000 | 0 (0.0%) | 0 (0.0%) |
| $25,000 to $49,999 | 7 (77.8%) | 2 (22.2%) |
| $50,000 to $74,999 | 1 (100.0%) | 0 (0.0%) |
| $75,000 to $99,999 | 3 (60.0%) | 2 (40.0%) |
| $100,000 and over | 9 (75.0%) | 3 (25.0%) |
Public vs Private Health Insurance Coverage by Age in Larsen Bay
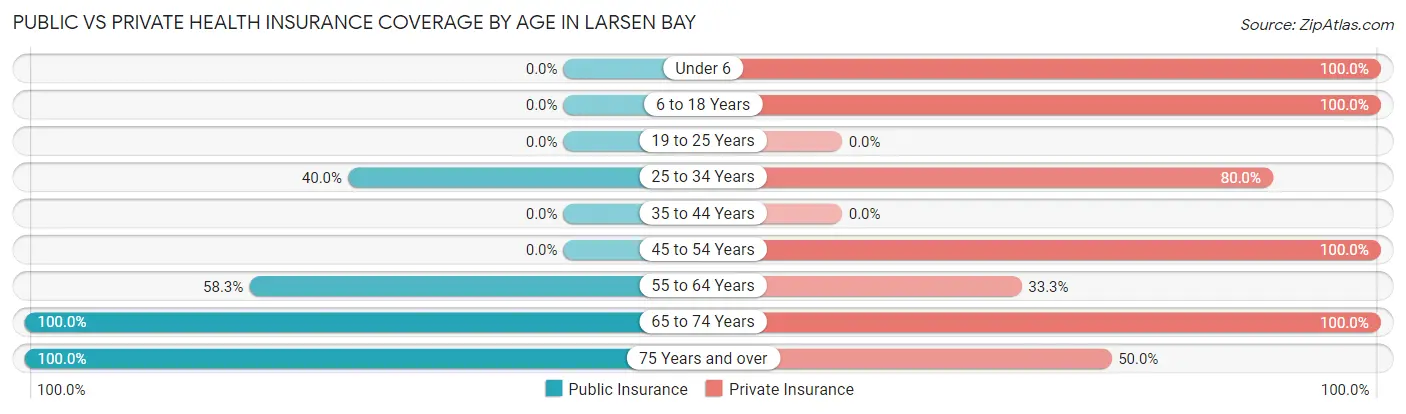
| Age Bracket | Public Insurance | Private Insurance |
| Under 6 | 0 (0.0%) | 2 (100.0%) |
| 6 to 18 Years | 0 (0.0%) | 4 (100.0%) |
| 19 to 25 Years | 0 (0.0%) | 0 (0.0%) |
| 25 to 34 Years | 4 (40.0%) | 8 (80.0%) |
| 35 to 44 Years | 0 (0.0%) | 0 (0.0%) |
| 45 to 54 Years | 0 (0.0%) | 2 (100.0%) |
| 55 to 64 Years | 7 (58.3%) | 4 (33.3%) |
| 65 to 74 Years | 6 (100.0%) | 6 (100.0%) |
| 75 Years and over | 6 (100.0%) | 3 (50.0%) |
| Total | 23 (50.0%) | 29 (63.0%) |
Disability Status by Sex by Age in Larsen Bay
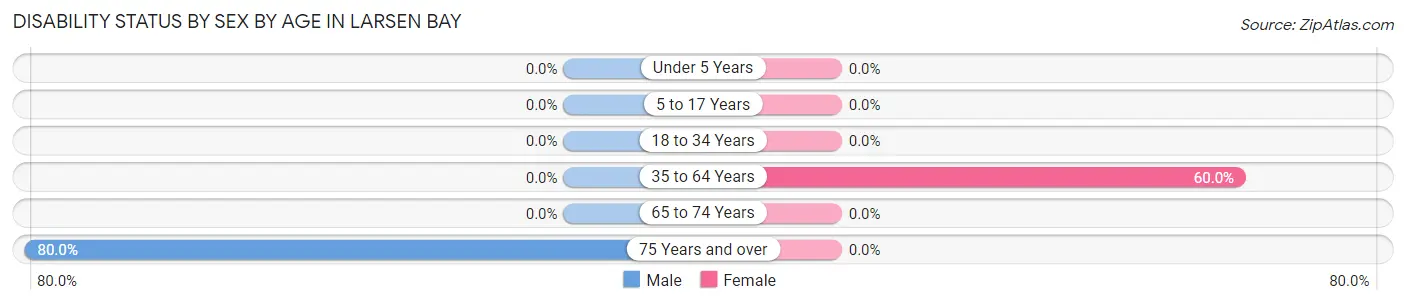
| Age Bracket | Male | Female |
| Under 5 Years | 0 (0.0%) | 0 (0.0%) |
| 5 to 17 Years | 0 (0.0%) | 0 (0.0%) |
| 18 to 34 Years | 0 (0.0%) | 0 (0.0%) |
| 35 to 64 Years | 0 (0.0%) | 3 (60.0%) |
| 65 to 74 Years | 0 (0.0%) | 0 (0.0%) |
| 75 Years and over | 4 (80.0%) | 0 (0.0%) |
Disability Class by Sex by Age in Larsen Bay
Disability Class: Hearing Difficulty
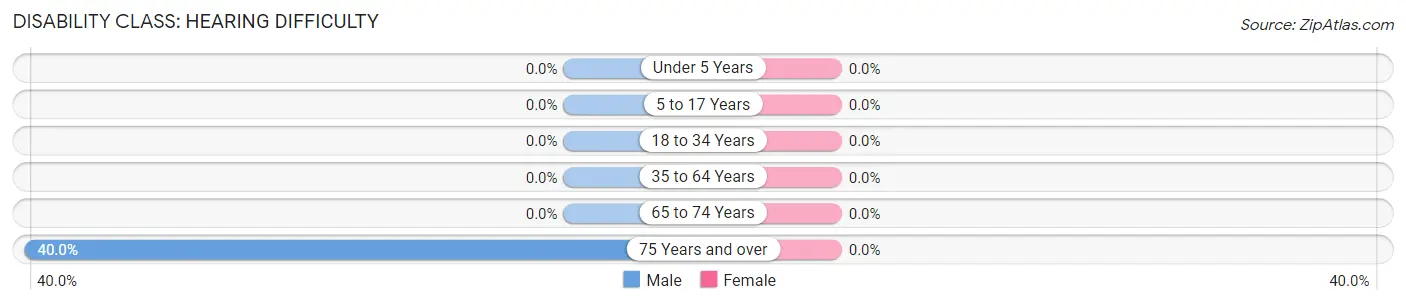
| Age Bracket | Male | Female |
| Under 5 Years | 0 (0.0%) | 0 (0.0%) |
| 5 to 17 Years | 0 (0.0%) | 0 (0.0%) |
| 18 to 34 Years | 0 (0.0%) | 0 (0.0%) |
| 35 to 64 Years | 0 (0.0%) | 0 (0.0%) |
| 65 to 74 Years | 0 (0.0%) | 0 (0.0%) |
| 75 Years and over | 2 (40.0%) | 0 (0.0%) |
Disability Class: Vision Difficulty
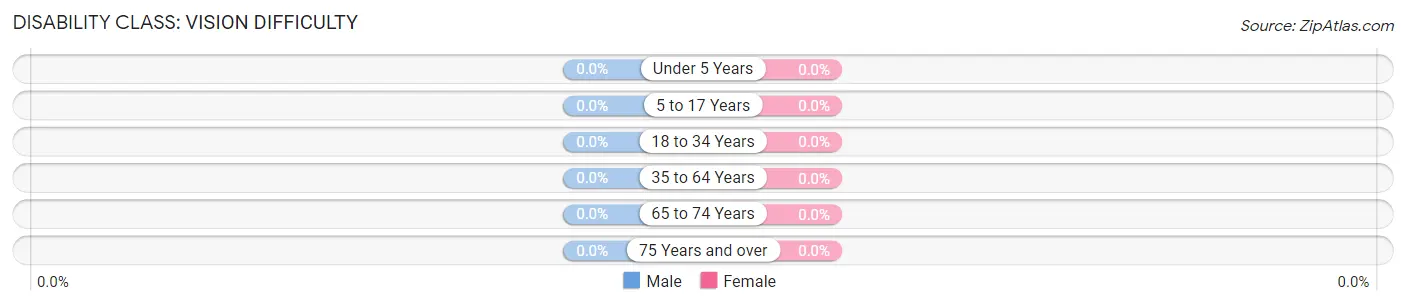
| Age Bracket | Male | Female |
| Under 5 Years | 0 (0.0%) | 0 (0.0%) |
| 5 to 17 Years | 0 (0.0%) | 0 (0.0%) |
| 18 to 34 Years | 0 (0.0%) | 0 (0.0%) |
| 35 to 64 Years | 0 (0.0%) | 0 (0.0%) |
| 65 to 74 Years | 0 (0.0%) | 0 (0.0%) |
| 75 Years and over | 0 (0.0%) | 0 (0.0%) |
Disability Class: Cognitive Difficulty
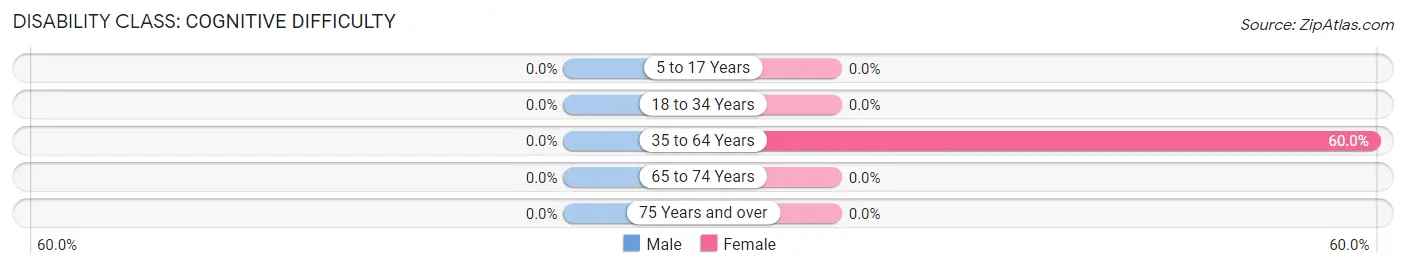
| Age Bracket | Male | Female |
| 5 to 17 Years | 0 (0.0%) | 0 (0.0%) |
| 18 to 34 Years | 0 (0.0%) | 0 (0.0%) |
| 35 to 64 Years | 0 (0.0%) | 3 (60.0%) |
| 65 to 74 Years | 0 (0.0%) | 0 (0.0%) |
| 75 Years and over | 0 (0.0%) | 0 (0.0%) |
Disability Class: Ambulatory Difficulty
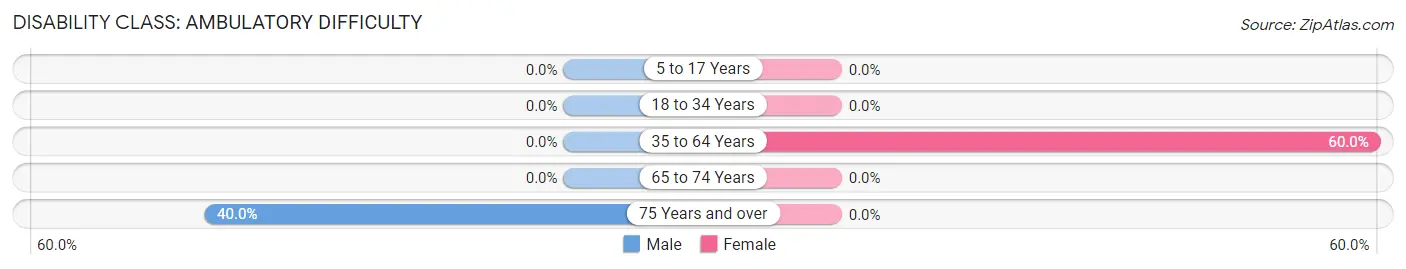
| Age Bracket | Male | Female |
| 5 to 17 Years | 0 (0.0%) | 0 (0.0%) |
| 18 to 34 Years | 0 (0.0%) | 0 (0.0%) |
| 35 to 64 Years | 0 (0.0%) | 3 (60.0%) |
| 65 to 74 Years | 0 (0.0%) | 0 (0.0%) |
| 75 Years and over | 2 (40.0%) | 0 (0.0%) |
Disability Class: Self-Care Difficulty
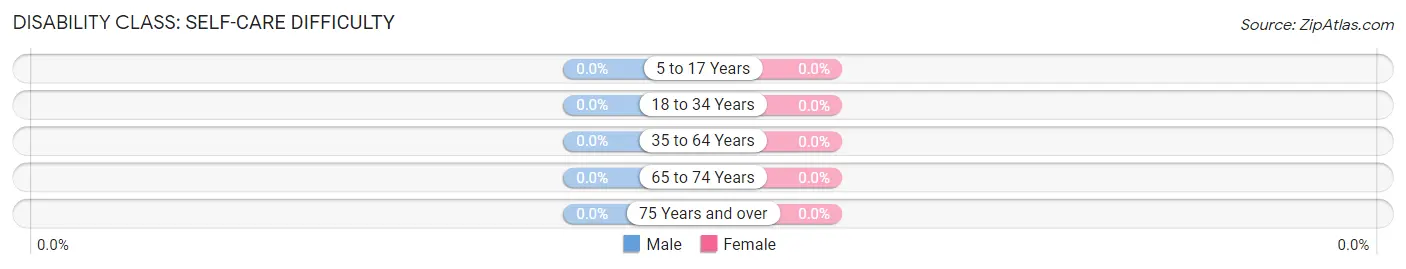
| Age Bracket | Male | Female |
| 5 to 17 Years | 0 (0.0%) | 0 (0.0%) |
| 18 to 34 Years | 0 (0.0%) | 0 (0.0%) |
| 35 to 64 Years | 0 (0.0%) | 0 (0.0%) |
| 65 to 74 Years | 0 (0.0%) | 0 (0.0%) |
| 75 Years and over | 0 (0.0%) | 0 (0.0%) |
Technology Access in Larsen Bay
Computing Device Access in Larsen Bay
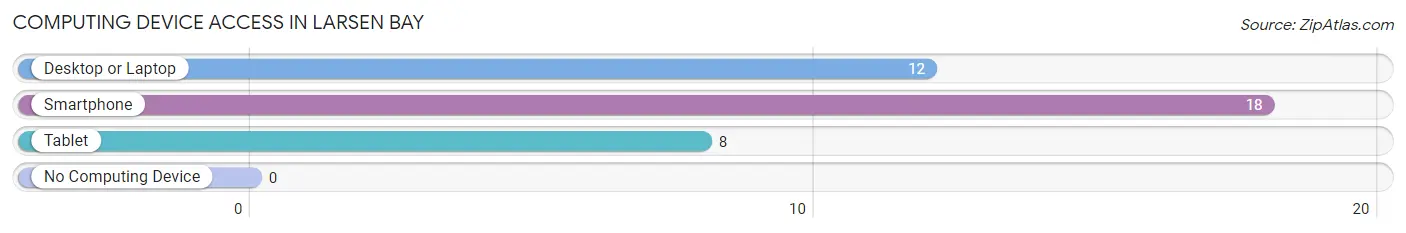
| Device Type | # Households | % Households |
| Desktop or Laptop | 12 | 66.7% |
| Smartphone | 18 | 100.0% |
| Tablet | 8 | 44.4% |
| No Computing Device | 0 | 0.0% |
| Total | 18 | 100.0% |
Internet Access in Larsen Bay
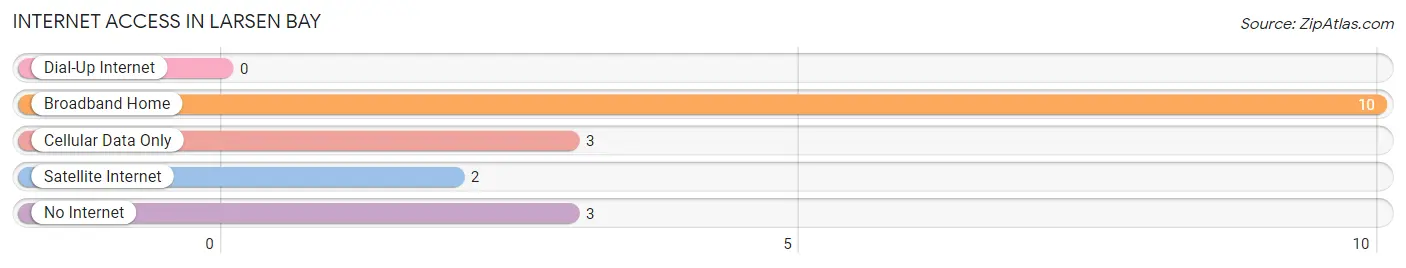
| Internet Type | # Households | % Households |
| Dial-Up Internet | 0 | 0.0% |
| Broadband Home | 10 | 55.6% |
| Cellular Data Only | 3 | 16.7% |
| Satellite Internet | 2 | 11.1% |
| No Internet | 3 | 16.7% |
| Total | 18 | 100.0% |
Larsen Bay Summary
Larsen Bay is a small fishing village located on Kodiak Island in the Gulf of Alaska. It is part of the Kodiak Island Borough and is located about 40 miles southwest of the city of Kodiak. The population of Larsen Bay was estimated to be around 200 people in 2020.
History
Larsen Bay was first settled by the Alutiiq people, who have lived in the area for thousands of years. The Alutiiq people were hunters and gatherers, and relied heavily on the abundant marine life in the area for sustenance. The Alutiiq people were also known for their skill in boat building and fishing.
In the late 1700s, Russian fur traders arrived in the area and established a trading post in Larsen Bay. The trading post was used to trade furs and other goods with the Alutiiq people. The trading post was eventually abandoned in the early 1800s.
In the late 1800s, the first commercial fishing operations began in Larsen Bay. The fishing industry quickly grew, and by the early 1900s, Larsen Bay was a thriving fishing village. The fishing industry continued to grow throughout the 20th century, and today, Larsen Bay is still a major fishing port.
Geography
Larsen Bay is located on the eastern side of Kodiak Island, in the Gulf of Alaska. The village is situated on a small bay, which is surrounded by steep hills and mountains. The bay is protected from the open ocean by a small island, which is home to a large population of sea lions.
The climate in Larsen Bay is mild and temperate, with average temperatures ranging from the mid-30s in the winter to the mid-60s in the summer. The area receives an average of 40 inches of rain per year, and is known for its frequent fog and mist.
Economy
The economy of Larsen Bay is largely based on fishing and seafood processing. The fishing industry is the main source of employment in the village, and many of the residents are employed in the processing plants or on fishing boats.
The seafood processing plants in Larsen Bay process a variety of seafood, including salmon, halibut, cod, and crab. The seafood is then shipped to markets around the world.
In addition to fishing and seafood processing, Larsen Bay also has a small tourism industry. The village is a popular destination for sport fishing, and there are several charter boats that offer guided fishing trips.
Demographics
The population of Larsen Bay was estimated to be around 200 people in 2020. The majority of the population is of Alutiiq descent, and the village is home to a small number of non-native residents.
The village is served by a single school, which serves students from kindergarten through 12th grade. The school is part of the Kodiak Island Borough School District.
Conclusion
Larsen Bay is a small fishing village located on Kodiak Island in the Gulf of Alaska. It has a long history of settlement by the Alutiiq people, and has been a major fishing port since the late 1800s. The economy of Larsen Bay is largely based on fishing and seafood processing, and the village is also a popular destination for sport fishing. The population of Larsen Bay was estimated to be around 200 people in 2020, and the majority of the population is of Alutiiq descent.
Common Questions
What is Per Capita Income in Larsen Bay?
Per Capita income in Larsen Bay is $37,222.
What is the Median Family Income in Larsen Bay?
Median Family Income in Larsen Bay is $96,250.
What is the Median Household income in Larsen Bay?
Median Household Income in Larsen Bay is $77,500.
What is Inequality or Gini Index in Larsen Bay?
Inequality or Gini Index in Larsen Bay is 0.27.
What is the Total Population of Larsen Bay?
Total Population of Larsen Bay is 46.
What is the Total Male Population of Larsen Bay?
Total Male Population of Larsen Bay is 27.
What is the Total Female Population of Larsen Bay?
Total Female Population of Larsen Bay is 19.
What is the Ratio of Males per 100 Females in Larsen Bay?
There are 142.11 Males per 100 Females in Larsen Bay.
What is the Ratio of Females per 100 Males in Larsen Bay?
There are 70.37 Females per 100 Males in Larsen Bay.
What is the Median Population Age in Larsen Bay?
Median Population Age in Larsen Bay is 55.3 Years.
What is the Average Family Size in Larsen Bay
Average Family Size in Larsen Bay is 2.3 People.
What is the Average Household Size in Larsen Bay
Average Household Size in Larsen Bay is 1.5 People.
How Large is the Labor Force in Larsen Bay?
There are 33 People in the Labor Forcein in Larsen Bay.
What is the Percentage of People in the Labor Force in Larsen Bay?
82.5% of People are in the Labor Force in Larsen Bay.
What is the Unemployment Rate in Larsen Bay?
Unemployment Rate in Larsen Bay is 6.1%.