Kwethluk, AK Map & Demographics
Kwethluk Map
Kwethluk Overview
$13,189
PER CAPITA INCOME
$46,667
AVG FAMILY INCOME
$43,750
AVG HOUSEHOLD INCOME
10.9%
WAGE / INCOME GAP [ % ]
89.1¢/ $1
WAGE / INCOME GAP [ $ ]
$13,993
FAMILY INCOME DEFICIT
0.48
INEQUALITY / GINI INDEX
561
TOTAL POPULATION
308
MALE POPULATION
253
FEMALE POPULATION
121.74
MALES / 100 FEMALES
82.14
FEMALES / 100 MALES
24.7
MEDIAN AGE
5.3
AVG FAMILY SIZE
4.8
AVG HOUSEHOLD SIZE
180
LABOR FORCE [ PEOPLE ]
48.1%
PERCENT IN LABOR FORCE
15.6%
UNEMPLOYMENT RATE
Kwethluk Zip Codes
Kwethluk Area Codes
Income in Kwethluk
Income Overview in Kwethluk
Per Capita Income in Kwethluk is $13,189, while median incomes of families and households are $46,667 and $43,750 respectively.
| Characteristic | Number | Measure |
| Per Capita Income | 561 | $13,189 |
| Median Family Income | 96 | $46,667 |
| Mean Family Income | 96 | $62,878 |
| Median Household Income | 116 | $43,750 |
| Mean Household Income | 116 | $58,537 |
| Income Deficit | 96 | $13,993 |
| Wage / Income Gap (%) | 561 | 10.87% |
| Wage / Income Gap ($) | 561 | 89.13¢ per $1 |
| Gini / Inequality Index | 561 | 0.48 |
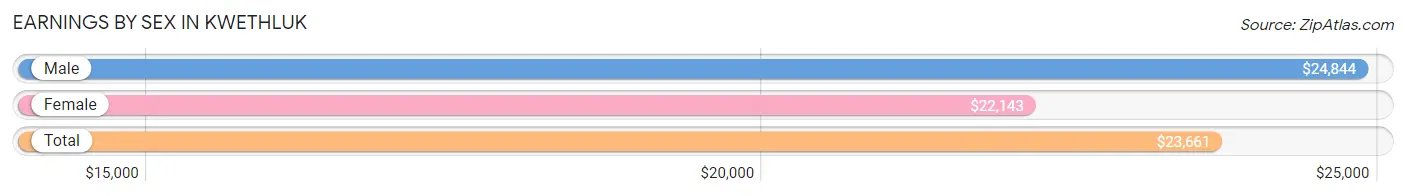
Earnings by Sex in Kwethluk
Average Earnings in Kwethluk are $23,661, $24,844 for men and $22,143 for women, a difference of 10.9%.
| Sex | Number | Average Earnings |
| Male | 97 (49.7%) | $24,844 |
| Female | 98 (50.3%) | $22,143 |
| Total | 195 (100.0%) | $23,661 |
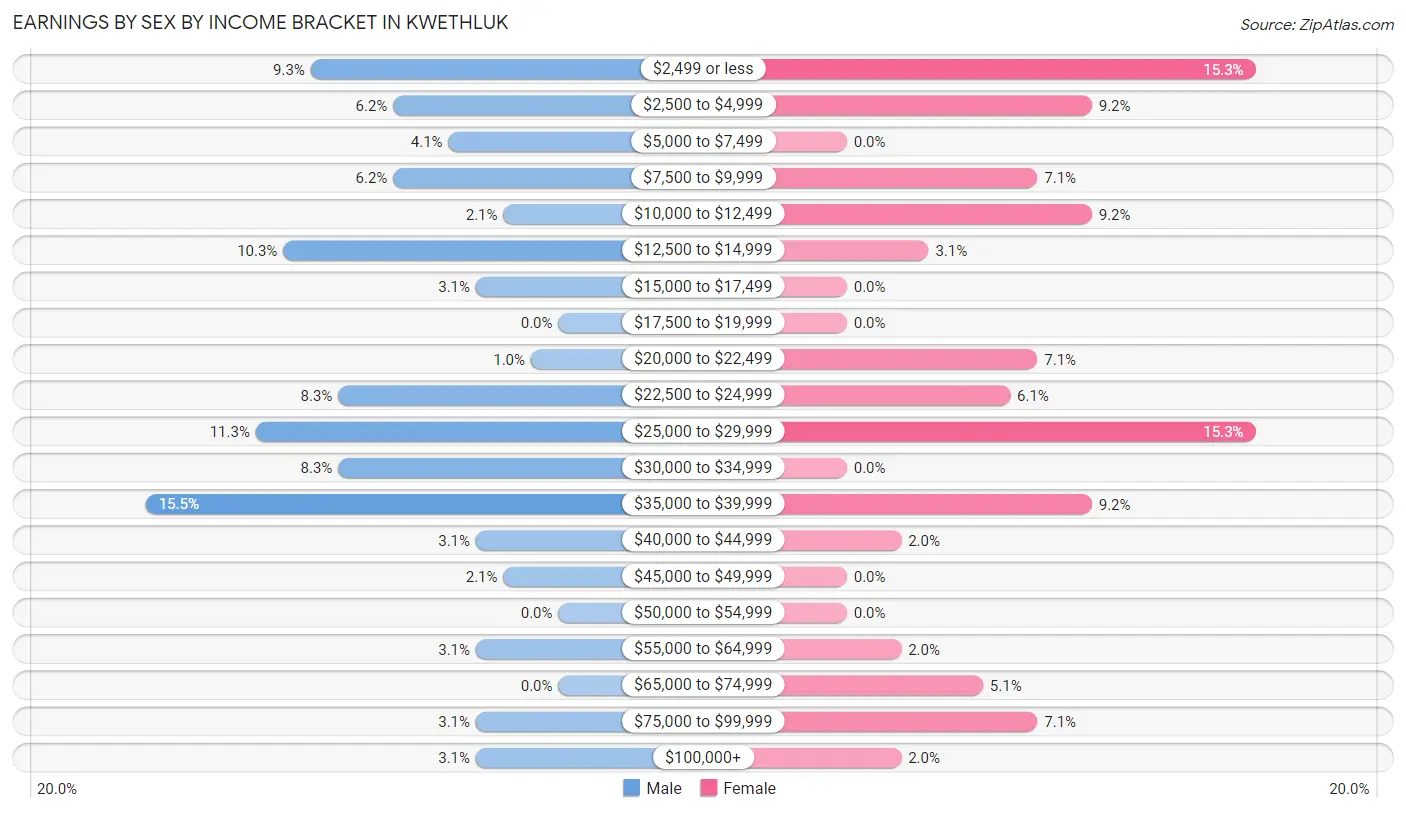
Earnings by Sex by Income Bracket in Kwethluk
The most common earnings brackets in Kwethluk are $35,000 to $39,999 for men (15 | 15.5%) and $2,499 or less for women (15 | 15.3%).
| Income | Male | Female |
| $2,499 or less | 9 (9.3%) | 15 (15.3%) |
| $2,500 to $4,999 | 6 (6.2%) | 9 (9.2%) |
| $5,000 to $7,499 | 4 (4.1%) | 0 (0.0%) |
| $7,500 to $9,999 | 6 (6.2%) | 7 (7.1%) |
| $10,000 to $12,499 | 2 (2.1%) | 9 (9.2%) |
| $12,500 to $14,999 | 10 (10.3%) | 3 (3.1%) |
| $15,000 to $17,499 | 3 (3.1%) | 0 (0.0%) |
| $17,500 to $19,999 | 0 (0.0%) | 0 (0.0%) |
| $20,000 to $22,499 | 1 (1.0%) | 7 (7.1%) |
| $22,500 to $24,999 | 8 (8.3%) | 6 (6.1%) |
| $25,000 to $29,999 | 11 (11.3%) | 15 (15.3%) |
| $30,000 to $34,999 | 8 (8.3%) | 0 (0.0%) |
| $35,000 to $39,999 | 15 (15.5%) | 9 (9.2%) |
| $40,000 to $44,999 | 3 (3.1%) | 2 (2.0%) |
| $45,000 to $49,999 | 2 (2.1%) | 0 (0.0%) |
| $50,000 to $54,999 | 0 (0.0%) | 0 (0.0%) |
| $55,000 to $64,999 | 3 (3.1%) | 2 (2.0%) |
| $65,000 to $74,999 | 0 (0.0%) | 5 (5.1%) |
| $75,000 to $99,999 | 3 (3.1%) | 7 (7.1%) |
| $100,000+ | 3 (3.1%) | 2 (2.0%) |
| Total | 97 (100.0%) | 98 (100.0%) |
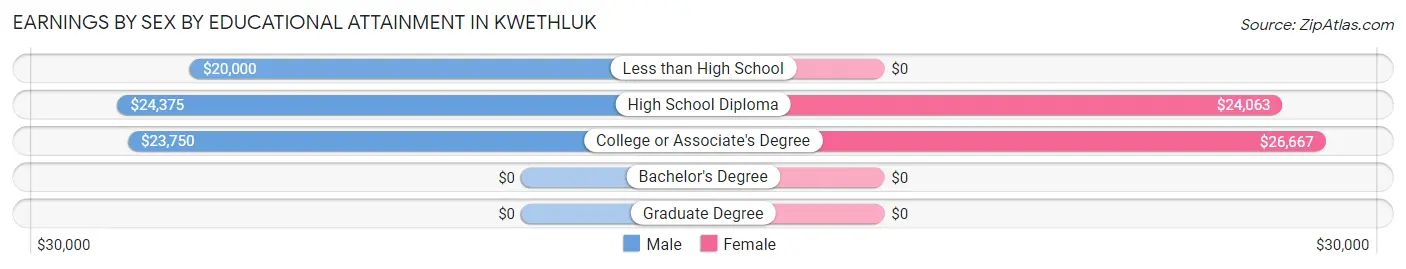
Earnings by Sex by Educational Attainment in Kwethluk
Average earnings in Kwethluk are $25,833 for men and $28,125 for women, a difference of 8.2%. Men with an educational attainment of high school diploma enjoy the highest average annual earnings of $24,375, while those with less than high school education earn the least with $20,000. Women with an educational attainment of college or associate's degree earn the most with the average annual earnings of $26,667, while those with high school diploma education have the smallest earnings of $24,063.
| Educational Attainment | Male Income | Female Income |
| Less than High School | $20,000 | $0 |
| High School Diploma | $24,375 | $24,063 |
| College or Associate's Degree | $23,750 | $26,667 |
| Bachelor's Degree | - | - |
| Graduate Degree | - | - |
| Total | $25,833 | $28,125 |
Family Income in Kwethluk
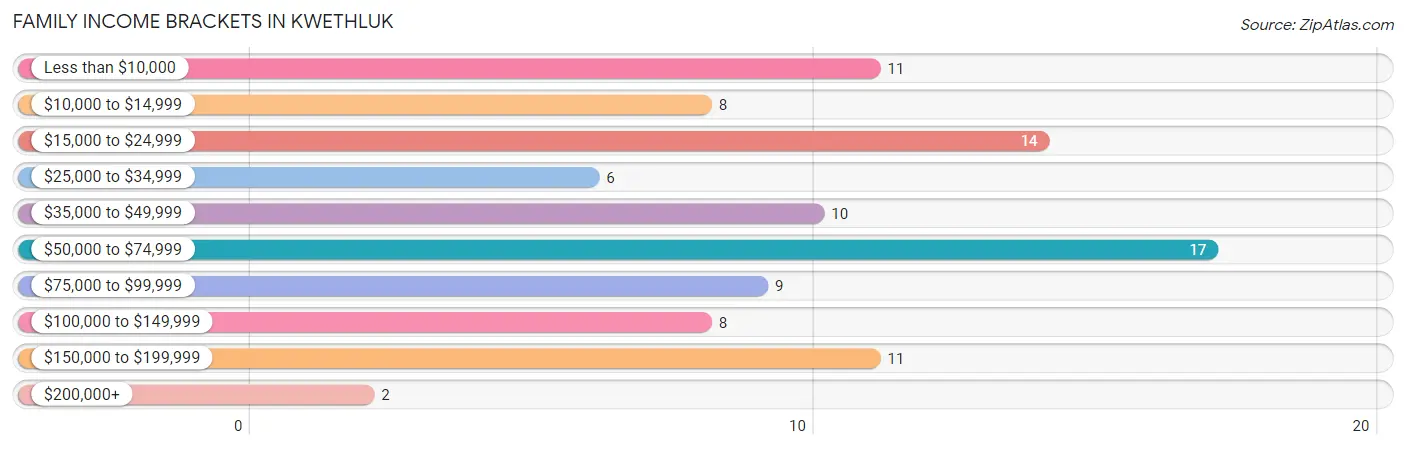
Family Income Brackets in Kwethluk
According to the Kwethluk family income data, there are 17 families falling into the $50,000 to $74,999 income range, which is the most common income bracket and makes up 17.7% of all families. Conversely, the $200,000+ income bracket is the least frequent group with only 2 families (2.1%) belonging to this category.
| Income Bracket | # Families | % Families |
| Less than $10,000 | 11 | 11.5% |
| $10,000 to $14,999 | 8 | 8.3% |
| $15,000 to $24,999 | 14 | 14.6% |
| $25,000 to $34,999 | 6 | 6.3% |
| $35,000 to $49,999 | 10 | 10.4% |
| $50,000 to $74,999 | 17 | 17.7% |
| $75,000 to $99,999 | 9 | 9.4% |
| $100,000 to $149,999 | 8 | 8.3% |
| $150,000 to $199,999 | 11 | 11.5% |
| $200,000+ | 2 | 2.1% |
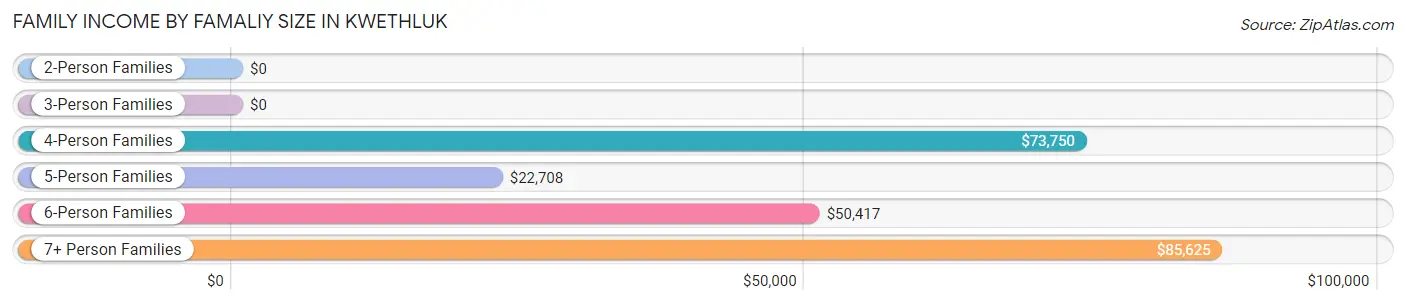
Family Income by Famaliy Size in Kwethluk
7+ person families (15 | 15.6%) account for the highest median family income in Kwethluk with $85,625 per family, while 4-person families (14 | 14.6%) have the highest median income of $18,438 per family member.
| Income Bracket | # Families | Median Income |
| 2-Person Families | 16 (16.7%) | $0 |
| 3-Person Families | 17 (17.7%) | $0 |
| 4-Person Families | 14 (14.6%) | $73,750 |
| 5-Person Families | 17 (17.7%) | $22,708 |
| 6-Person Families | 17 (17.7%) | $50,417 |
| 7+ Person Families | 15 (15.6%) | $85,625 |
| Total | 96 (100.0%) | $46,667 |
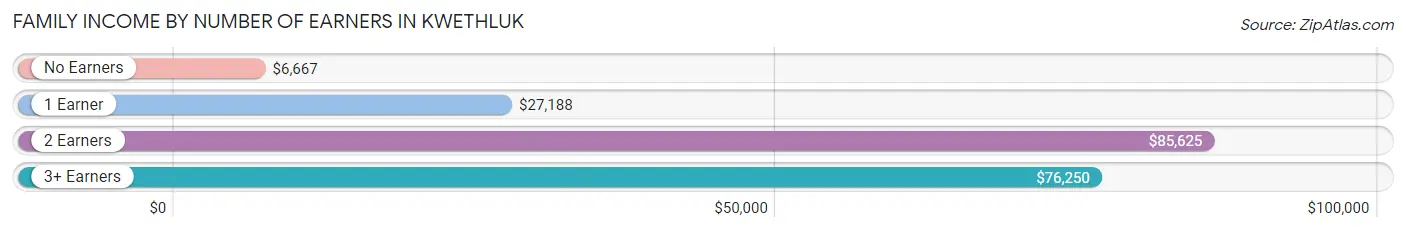
Family Income by Number of Earners in Kwethluk
The median family income in Kwethluk is $46,667, with families comprising 2 earners (27) having the highest median family income of $85,625, while families with no earners (14) have the lowest median family income of $6,667, accounting for 28.1% and 14.6% of families, respectively.
| Number of Earners | # Families | Median Income |
| No Earners | 14 (14.6%) | $6,667 |
| 1 Earner | 39 (40.6%) | $27,188 |
| 2 Earners | 27 (28.1%) | $85,625 |
| 3+ Earners | 16 (16.7%) | $76,250 |
| Total | 96 (100.0%) | $46,667 |
Household Income in Kwethluk
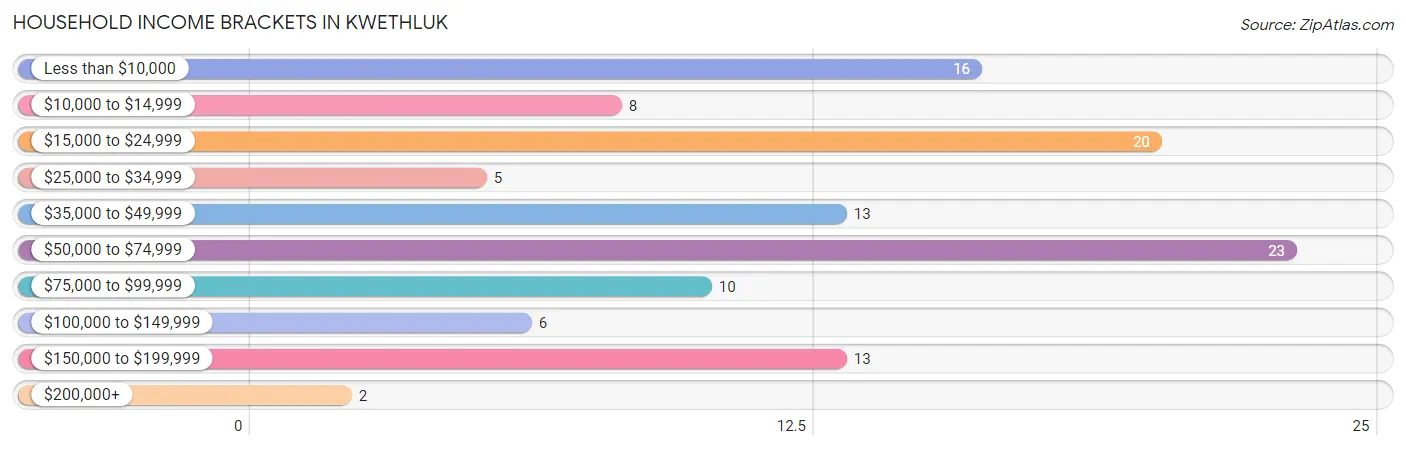
Household Income Brackets in Kwethluk
With 23 households falling in the category, the $50,000 to $74,999 income range is the most frequent in Kwethluk, accounting for 19.8% of all households. In contrast, only 2 households (1.7%) fall into the $200,000+ income bracket, making it the least populous group.
| Income Bracket | # Households | % Households |
| Less than $10,000 | 16 | 13.8% |
| $10,000 to $14,999 | 8 | 6.9% |
| $15,000 to $24,999 | 20 | 17.2% |
| $25,000 to $34,999 | 5 | 4.3% |
| $35,000 to $49,999 | 13 | 11.2% |
| $50,000 to $74,999 | 23 | 19.8% |
| $75,000 to $99,999 | 10 | 8.6% |
| $100,000 to $149,999 | 6 | 5.2% |
| $150,000 to $199,999 | 13 | 11.2% |
| $200,000+ | 2 | 1.7% |
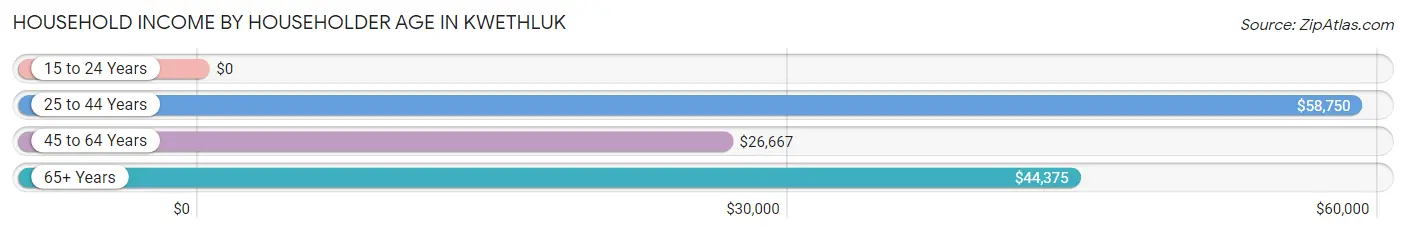
Household Income by Householder Age in Kwethluk
The median household income in Kwethluk is $43,750, with the highest median household income of $58,750 found in the 25 to 44 years age bracket for the primary householder. A total of 31 households (26.7%) fall into this category.
| Income Bracket | # Households | Median Income |
| 15 to 24 Years | 0 (0.0%) | $0 |
| 25 to 44 Years | 31 (26.7%) | $58,750 |
| 45 to 64 Years | 70 (60.3%) | $26,667 |
| 65+ Years | 15 (12.9%) | $44,375 |
| Total | 116 (100.0%) | $43,750 |
Poverty in Kwethluk
Income Below Poverty by Sex and Age in Kwethluk
With 42.4% poverty level for males and 42.3% for females among the residents of Kwethluk, 12 to 14 year old males and 15 year old females are the most vulnerable to poverty, with 8 males (80.0%) and 9 females (75.0%) in their respective age groups living below the poverty level.
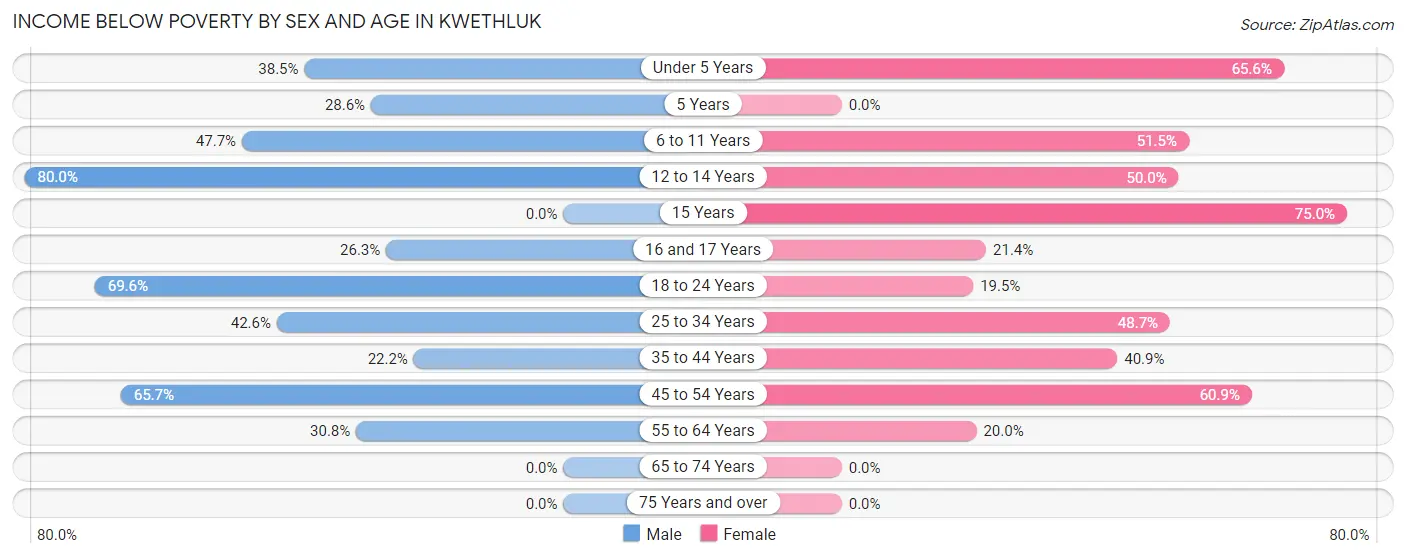
| Age Bracket | Male | Female |
| Under 5 Years | 15 (38.5%) | 21 (65.6%) |
| 5 Years | 2 (28.6%) | 0 (0.0%) |
| 6 to 11 Years | 21 (47.7%) | 17 (51.5%) |
| 12 to 14 Years | 8 (80.0%) | 2 (50.0%) |
| 15 Years | 0 (0.0%) | 9 (75.0%) |
| 16 and 17 Years | 5 (26.3%) | 3 (21.4%) |
| 18 to 24 Years | 16 (69.6%) | 8 (19.5%) |
| 25 to 34 Years | 20 (42.5%) | 19 (48.7%) |
| 35 to 44 Years | 6 (22.2%) | 9 (40.9%) |
| 45 to 54 Years | 23 (65.7%) | 14 (60.9%) |
| 55 to 64 Years | 12 (30.8%) | 5 (20.0%) |
| 65 to 74 Years | 0 (0.0%) | 0 (0.0%) |
| 75 Years and over | 0 (0.0%) | 0 (0.0%) |
| Total | 128 (42.4%) | 107 (42.3%) |
Income Above Poverty by Sex and Age in Kwethluk
According to the poverty statistics in Kwethluk, males aged 65 to 74 years and females aged 65 to 74 years are the age groups that are most secure financially, with 100.0% of males and 100.0% of females in these age groups living above the poverty line.
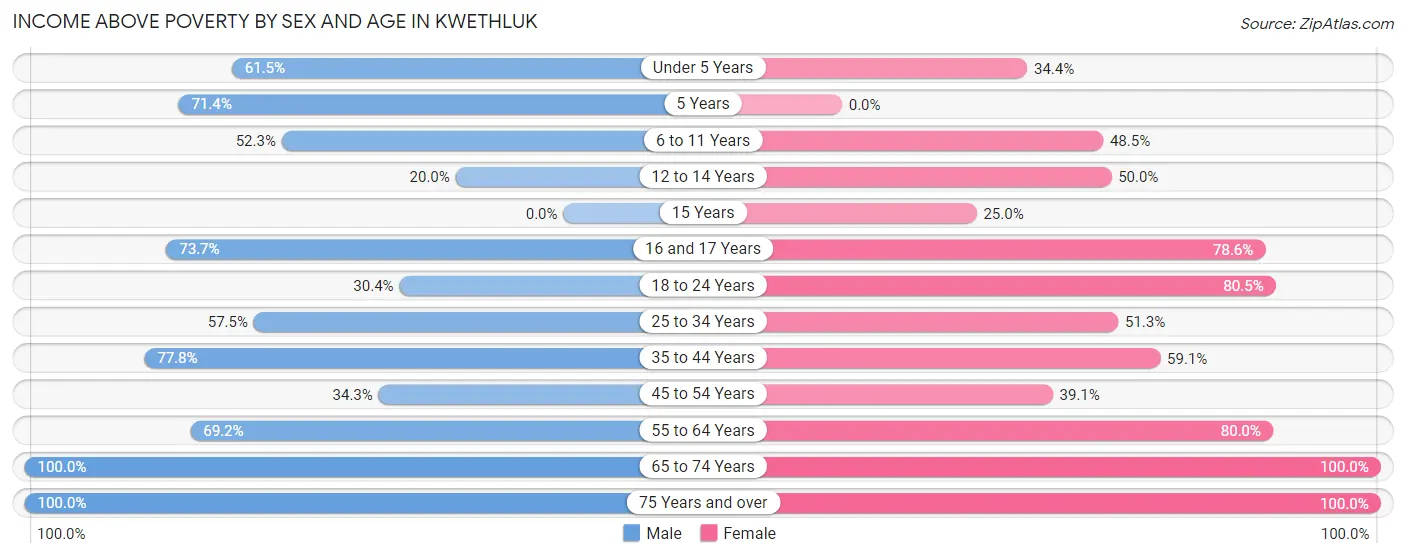
| Age Bracket | Male | Female |
| Under 5 Years | 24 (61.5%) | 11 (34.4%) |
| 5 Years | 5 (71.4%) | 0 (0.0%) |
| 6 to 11 Years | 23 (52.3%) | 16 (48.5%) |
| 12 to 14 Years | 2 (20.0%) | 2 (50.0%) |
| 15 Years | 0 (0.0%) | 3 (25.0%) |
| 16 and 17 Years | 14 (73.7%) | 11 (78.6%) |
| 18 to 24 Years | 7 (30.4%) | 33 (80.5%) |
| 25 to 34 Years | 27 (57.5%) | 20 (51.3%) |
| 35 to 44 Years | 21 (77.8%) | 13 (59.1%) |
| 45 to 54 Years | 12 (34.3%) | 9 (39.1%) |
| 55 to 64 Years | 27 (69.2%) | 20 (80.0%) |
| 65 to 74 Years | 3 (100.0%) | 5 (100.0%) |
| 75 Years and over | 9 (100.0%) | 3 (100.0%) |
| Total | 174 (57.6%) | 146 (57.7%) |
Income Below Poverty Among Married-Couple Families in Kwethluk
The poverty statistics for married-couple families in Kwethluk show that 35.9% or 14 of the total 39 families live below the poverty line. Families with 3 or 4 children have the highest poverty rate of 84.6%, comprising of 11 families. On the other hand, families with no children have the lowest poverty rate of 0.0%, which includes 0 families.
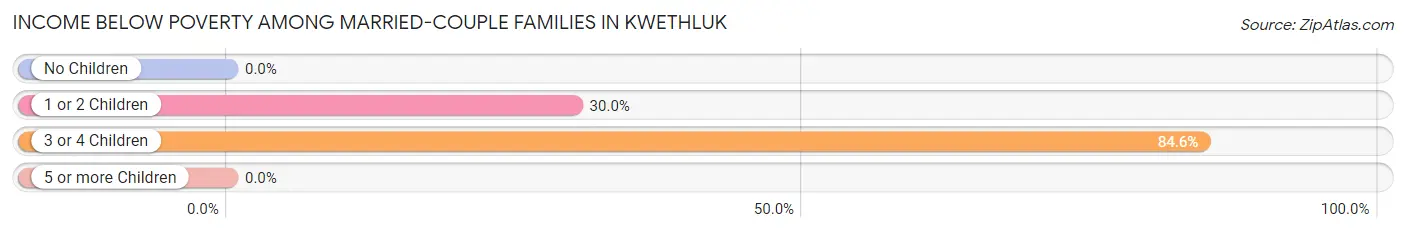
| Children | Above Poverty | Below Poverty |
| No Children | 13 (100.0%) | 0 (0.0%) |
| 1 or 2 Children | 7 (70.0%) | 3 (30.0%) |
| 3 or 4 Children | 2 (15.4%) | 11 (84.6%) |
| 5 or more Children | 3 (100.0%) | 0 (0.0%) |
| Total | 25 (64.1%) | 14 (35.9%) |
Income Below Poverty Among Single-Parent Households in Kwethluk
According to the poverty data in Kwethluk, 60.9% or 14 single-father households and 38.2% or 13 single-mother households are living below the poverty line. Among single-father households, those with 1 or 2 children have the highest poverty rate, with 9 households (81.8%) experiencing poverty. Likewise, among single-mother households, those with 3 or 4 children have the highest poverty rate, with 5 households (62.5%) falling below the poverty line.
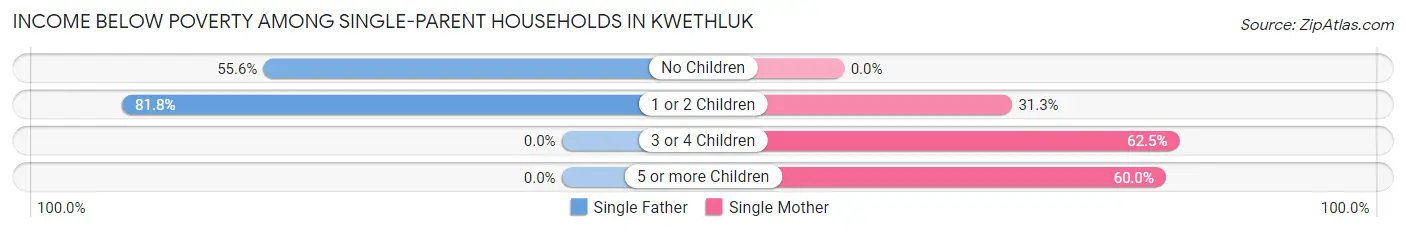
| Children | Single Father | Single Mother |
| No Children | 5 (55.6%) | 0 (0.0%) |
| 1 or 2 Children | 9 (81.8%) | 5 (31.2%) |
| 3 or 4 Children | 0 (0.0%) | 5 (62.5%) |
| 5 or more Children | 0 (0.0%) | 3 (60.0%) |
| Total | 14 (60.9%) | 13 (38.2%) |
Income Below Poverty Among Married-Couple vs Single-Parent Households in Kwethluk
The poverty data for Kwethluk shows that 14 of the married-couple family households (35.9%) and 27 of the single-parent households (47.4%) are living below the poverty level. Within the married-couple family households, those with 3 or 4 children have the highest poverty rate, with 11 households (84.6%) falling below the poverty line. Among the single-parent households, those with 3 or 4 children have the highest poverty rate, with 5 household (62.5%) living below poverty.
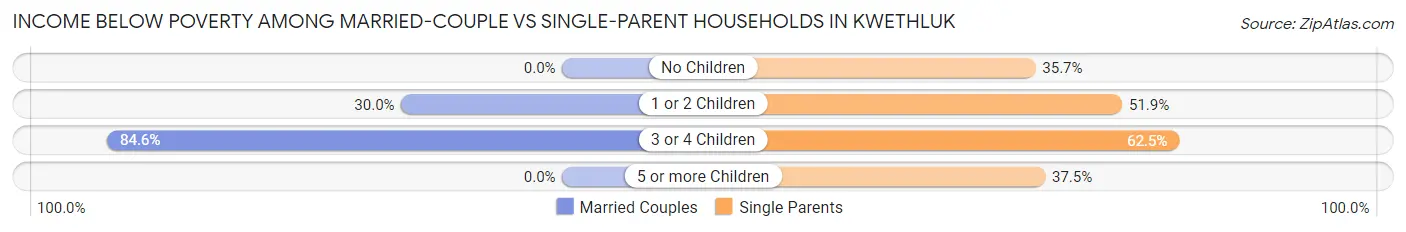
| Children | Married-Couple Families | Single-Parent Households |
| No Children | 0 (0.0%) | 5 (35.7%) |
| 1 or 2 Children | 3 (30.0%) | 14 (51.8%) |
| 3 or 4 Children | 11 (84.6%) | 5 (62.5%) |
| 5 or more Children | 0 (0.0%) | 3 (37.5%) |
| Total | 14 (35.9%) | 27 (47.4%) |
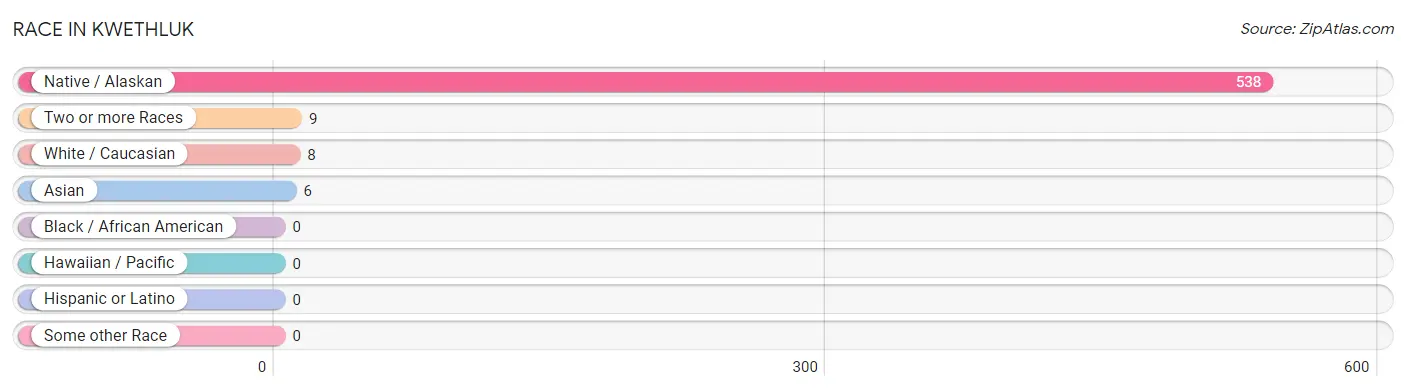
Race in Kwethluk
The most populous races in Kwethluk are Native / Alaskan (538 | 95.9%), Two or more Races (9 | 1.6%), and White / Caucasian (8 | 1.4%).
| Race | # Population | % Population |
| Asian | 6 | 1.1% |
| Black / African American | 0 | 0.0% |
| Hawaiian / Pacific | 0 | 0.0% |
| Hispanic or Latino | 0 | 0.0% |
| Native / Alaskan | 538 | 95.9% |
| White / Caucasian | 8 | 1.4% |
| Two or more Races | 9 | 1.6% |
| Some other Race | 0 | 0.0% |
| Total | 561 | 100.0% |
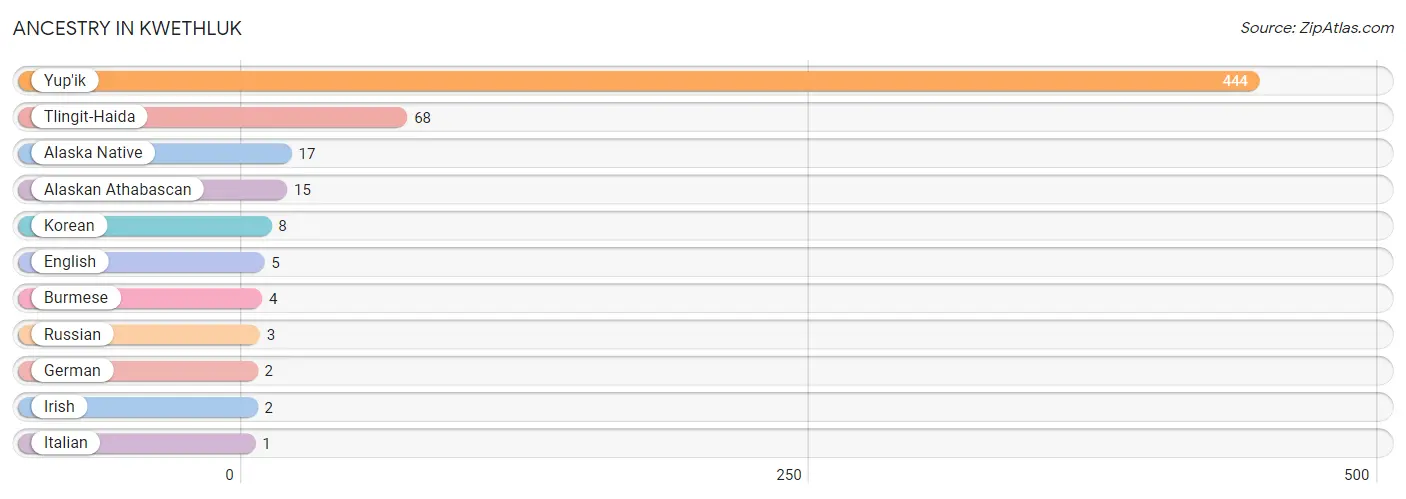
Ancestry in Kwethluk
The most populous ancestries reported in Kwethluk are Yup'ik (444 | 79.1%), Tlingit-Haida (68 | 12.1%), Alaska Native (17 | 3.0%), Alaskan Athabascan (15 | 2.7%), and Korean (8 | 1.4%), together accounting for 98.4% of all Kwethluk residents.
| Ancestry | # Population | % Population |
| Alaska Native | 17 | 3.0% |
| Alaskan Athabascan | 15 | 2.7% |
| Burmese | 4 | 0.7% |
| English | 5 | 0.9% |
| German | 2 | 0.4% |
| Irish | 2 | 0.4% |
| Italian | 1 | 0.2% |
| Korean | 8 | 1.4% |
| Russian | 3 | 0.5% |
| Tlingit-Haida | 68 | 12.1% |
| Yup'ik | 444 | 79.1% | View All 11 Rows |
Immigrants in Kwethluk
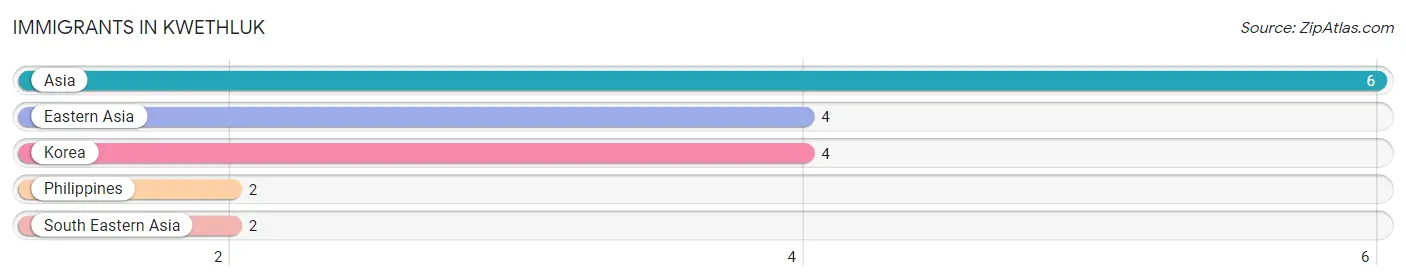
The most numerous immigrant groups reported in Kwethluk came from Asia (6 | 1.1%), Eastern Asia (4 | 0.7%), Korea (4 | 0.7%), Philippines (2 | 0.4%), and South Eastern Asia (2 | 0.4%), together accounting for 3.2% of all Kwethluk residents.
| Immigration Origin | # Population | % Population |
| Asia | 6 | 1.1% |
| Eastern Asia | 4 | 0.7% |
| Korea | 4 | 0.7% |
| Philippines | 2 | 0.4% |
| South Eastern Asia | 2 | 0.4% | View All 5 Rows |
Sex and Age in Kwethluk
Sex and Age in Kwethluk
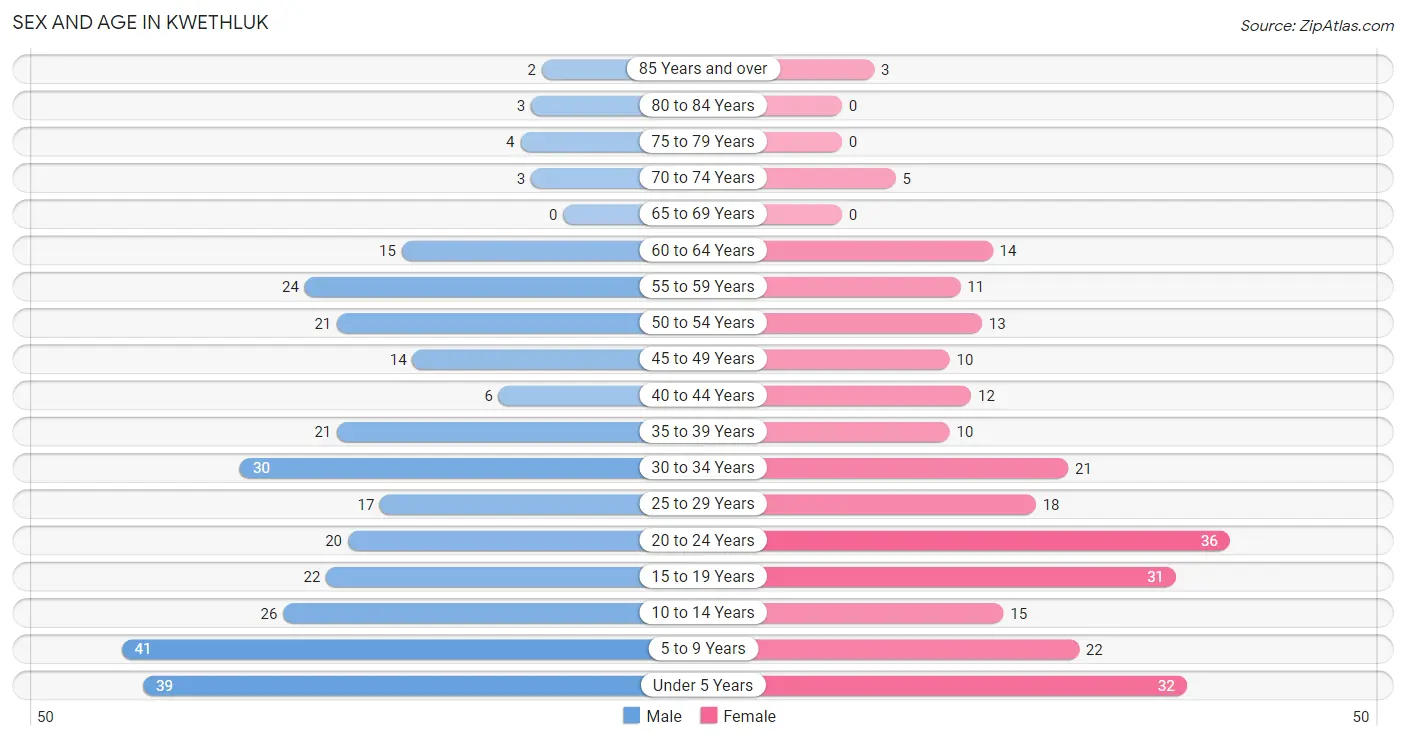
The most populous age groups in Kwethluk are 5 to 9 Years (41 | 13.3%) for men and 20 to 24 Years (36 | 14.2%) for women.
| Age Bracket | Male | Female |
| Under 5 Years | 39 (12.7%) | 32 (12.7%) |
| 5 to 9 Years | 41 (13.3%) | 22 (8.7%) |
| 10 to 14 Years | 26 (8.4%) | 15 (5.9%) |
| 15 to 19 Years | 22 (7.1%) | 31 (12.2%) |
| 20 to 24 Years | 20 (6.5%) | 36 (14.2%) |
| 25 to 29 Years | 17 (5.5%) | 18 (7.1%) |
| 30 to 34 Years | 30 (9.7%) | 21 (8.3%) |
| 35 to 39 Years | 21 (6.8%) | 10 (4.0%) |
| 40 to 44 Years | 6 (1.9%) | 12 (4.7%) |
| 45 to 49 Years | 14 (4.5%) | 10 (4.0%) |
| 50 to 54 Years | 21 (6.8%) | 13 (5.1%) |
| 55 to 59 Years | 24 (7.8%) | 11 (4.3%) |
| 60 to 64 Years | 15 (4.9%) | 14 (5.5%) |
| 65 to 69 Years | 0 (0.0%) | 0 (0.0%) |
| 70 to 74 Years | 3 (1.0%) | 5 (2.0%) |
| 75 to 79 Years | 4 (1.3%) | 0 (0.0%) |
| 80 to 84 Years | 3 (1.0%) | 0 (0.0%) |
| 85 Years and over | 2 (0.6%) | 3 (1.2%) |
| Total | 308 (100.0%) | 253 (100.0%) |
Families and Households in Kwethluk
Median Family Size in Kwethluk
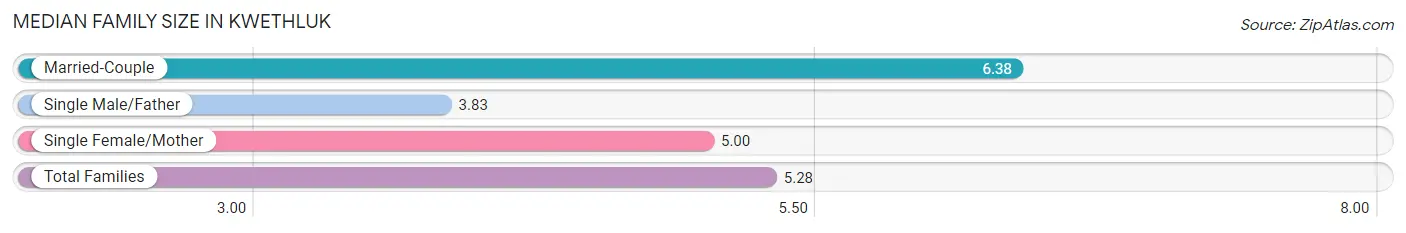
The median family size in Kwethluk is 5.28 persons per family, with married-couple families (39 | 40.6%) accounting for the largest median family size of 6.38 persons per family. On the other hand, single male/father families (23 | 24.0%) represent the smallest median family size with 3.83 persons per family.
| Family Type | # Families | Family Size |
| Married-Couple | 39 (40.6%) | 6.38 |
| Single Male/Father | 23 (24.0%) | 3.83 |
| Single Female/Mother | 34 (35.4%) | 5.00 |
| Total Families | 96 (100.0%) | 5.28 |
Median Household Size in Kwethluk
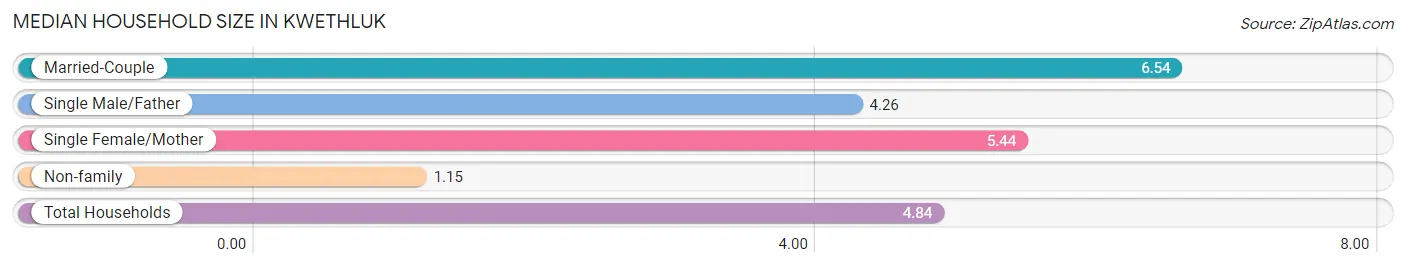
The median household size in Kwethluk is 4.84 persons per household, with married-couple households (39 | 33.6%) accounting for the largest median household size of 6.54 persons per household. non-family households (20 | 17.2%) represent the smallest median household size with 1.15 persons per household.
| Household Type | # Households | Household Size |
| Married-Couple | 39 (33.6%) | 6.54 |
| Single Male/Father | 23 (19.8%) | 4.26 |
| Single Female/Mother | 34 (29.3%) | 5.44 |
| Non-family | 20 (17.2%) | 1.15 |
| Total Households | 116 (100.0%) | 4.84 |
Household Size by Marriage Status in Kwethluk
Out of a total of 116 households in Kwethluk, 96 (82.8%) are family households, while 20 (17.2%) are nonfamily households. The most numerous type of family households are 7+ person households, comprising 24, and the most common type of nonfamily households are 1-person households, comprising 17.
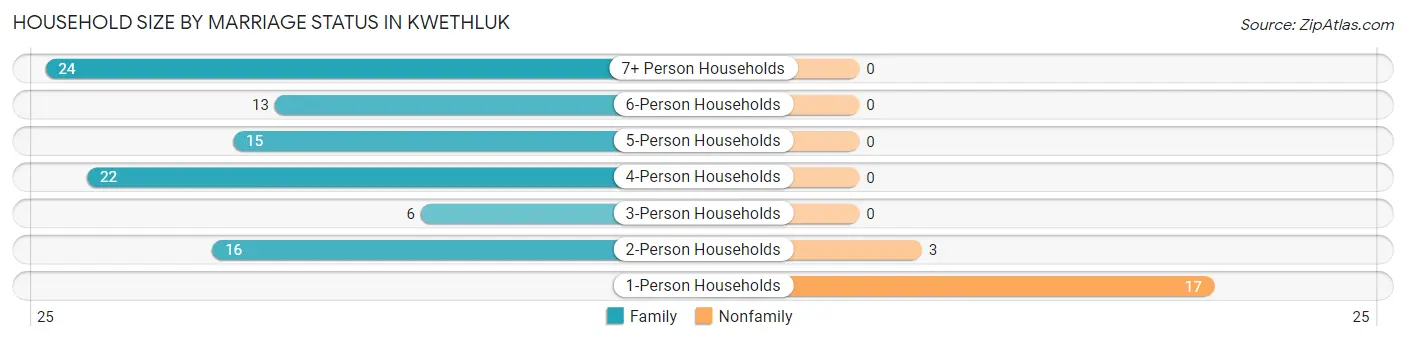
| Household Size | Family Households | Nonfamily Households |
| 1-Person Households | - | 17 (14.7%) |
| 2-Person Households | 16 (13.8%) | 3 (2.6%) |
| 3-Person Households | 6 (5.2%) | 0 (0.0%) |
| 4-Person Households | 22 (19.0%) | 0 (0.0%) |
| 5-Person Households | 15 (12.9%) | 0 (0.0%) |
| 6-Person Households | 13 (11.2%) | 0 (0.0%) |
| 7+ Person Households | 24 (20.7%) | 0 (0.0%) |
| Total | 96 (82.8%) | 20 (17.2%) |
Female Fertility in Kwethluk
Fertility by Age in Kwethluk
Average fertility rate in Kwethluk is 50.0 births per 1,000 women. Women in the age bracket of 35 to 50 years have the highest fertility rate with 114.0 births per 1,000 women. Women in the age bracket of 35 to 50 years acount for 57.1% of all women with births.
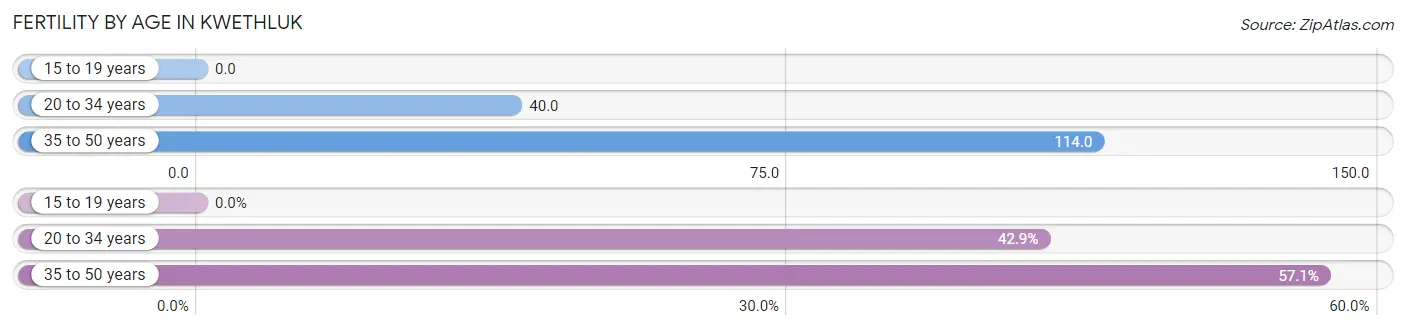
| Age Bracket | Women with Births | Births / 1,000 Women |
| 15 to 19 years | 0 (0.0%) | 0.0 |
| 20 to 34 years | 3 (42.9%) | 40.0 |
| 35 to 50 years | 4 (57.1%) | 114.0 |
| Total | 7 (100.0%) | 50.0 |
Fertility by Age by Marriage Status in Kwethluk
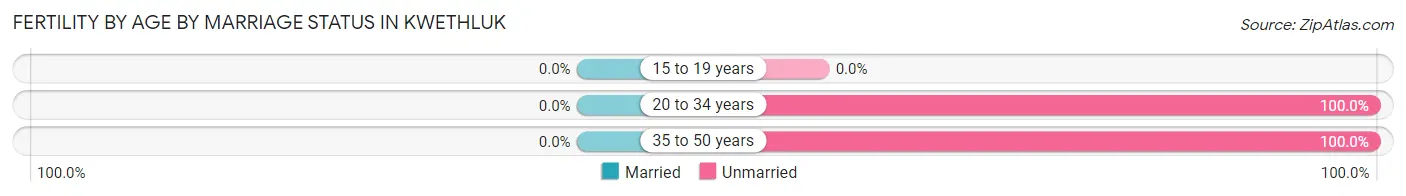
| Age Bracket | Married | Unmarried |
| 15 to 19 years | 0 (0.0%) | 0 (0.0%) |
| 20 to 34 years | 0 (0.0%) | 3 (100.0%) |
| 35 to 50 years | 0 (0.0%) | 4 (100.0%) |
| Total | 0 (0.0%) | 7 (100.0%) |
Fertility by Education in Kwethluk
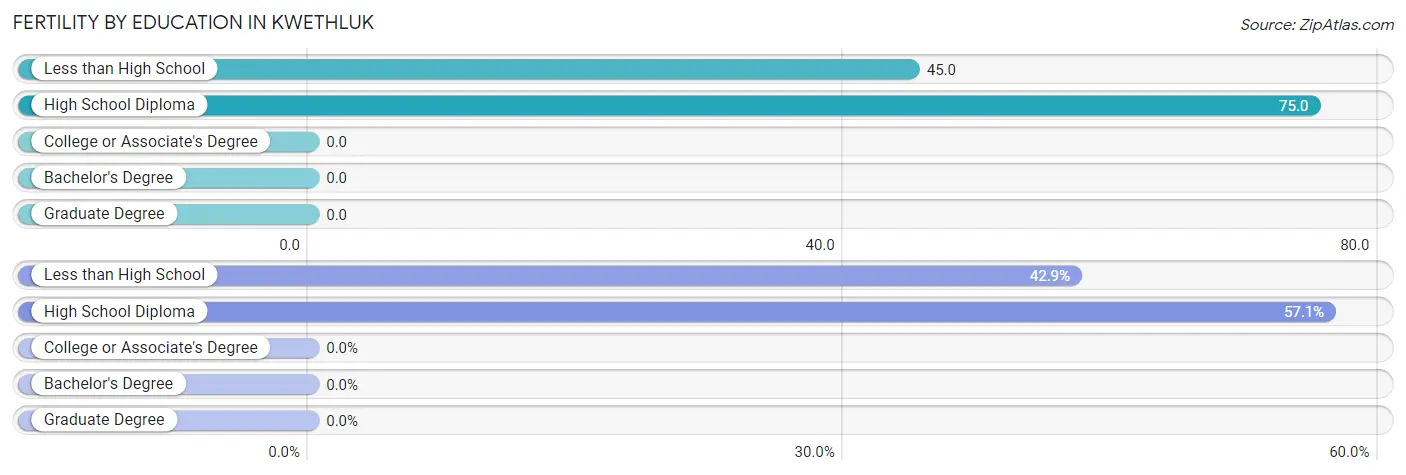
| Educational Attainment | Women with Births | Births / 1,000 Women |
| Less than High School | 3 (42.9%) | 45.0 |
| High School Diploma | 4 (57.1%) | 75.0 |
| College or Associate's Degree | 0 (0.0%) | 0.0 |
| Bachelor's Degree | 0 (0.0%) | 0.0 |
| Graduate Degree | 0 (0.0%) | 0.0 |
| Total | 7 (100.0%) | 50.0 |
Fertility by Education by Marriage Status in Kwethluk
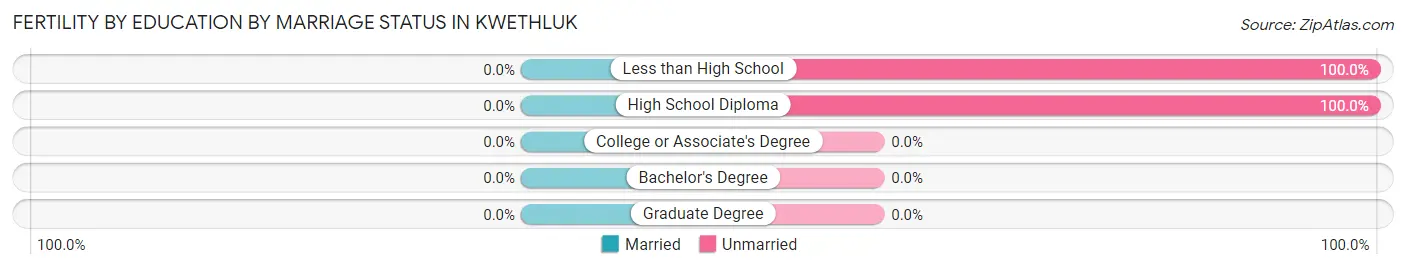
| Educational Attainment | Married | Unmarried |
| Less than High School | 0 (0.0%) | 3 (100.0%) |
| High School Diploma | 0 (0.0%) | 4 (100.0%) |
| College or Associate's Degree | 0 (0.0%) | 0 (0.0%) |
| Bachelor's Degree | 0 (0.0%) | 0 (0.0%) |
| Graduate Degree | 0 (0.0%) | 0 (0.0%) |
| Total | 0 (0.0%) | 7 (100.0%) |
Employment Characteristics in Kwethluk
Employment by Class of Employer in Kwethluk
Among the 152 employed individuals in Kwethluk, local government employees (77 | 50.7%), private company employees (28 | 18.4%), and not-for-profit organizations (24 | 15.8%) make up the most common classes of employment.
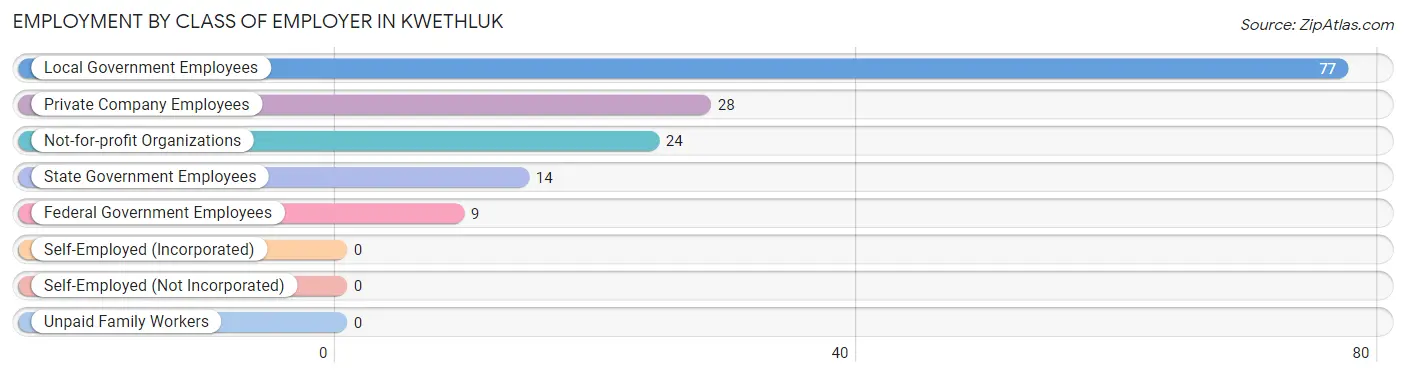
| Employer Class | # Employees | % Employees |
| Private Company Employees | 28 | 18.4% |
| Self-Employed (Incorporated) | 0 | 0.0% |
| Self-Employed (Not Incorporated) | 0 | 0.0% |
| Not-for-profit Organizations | 24 | 15.8% |
| Local Government Employees | 77 | 50.7% |
| State Government Employees | 14 | 9.2% |
| Federal Government Employees | 9 | 5.9% |
| Unpaid Family Workers | 0 | 0.0% |
| Total | 152 | 100.0% |
Employment Status by Age in Kwethluk
According to the labor force statistics for Kwethluk, out of the total population over 16 years of age (374), 48.1% or 180 individuals are in the labor force, with 15.6% or 28 of them unemployed. The age group with the highest labor force participation rate is 55 to 59 years, with 68.6% or 24 individuals in the labor force. Within the labor force, the 16 to 19 years age range has the highest percentage of unemployed individuals, with 50.0% or 3 of them being unemployed.
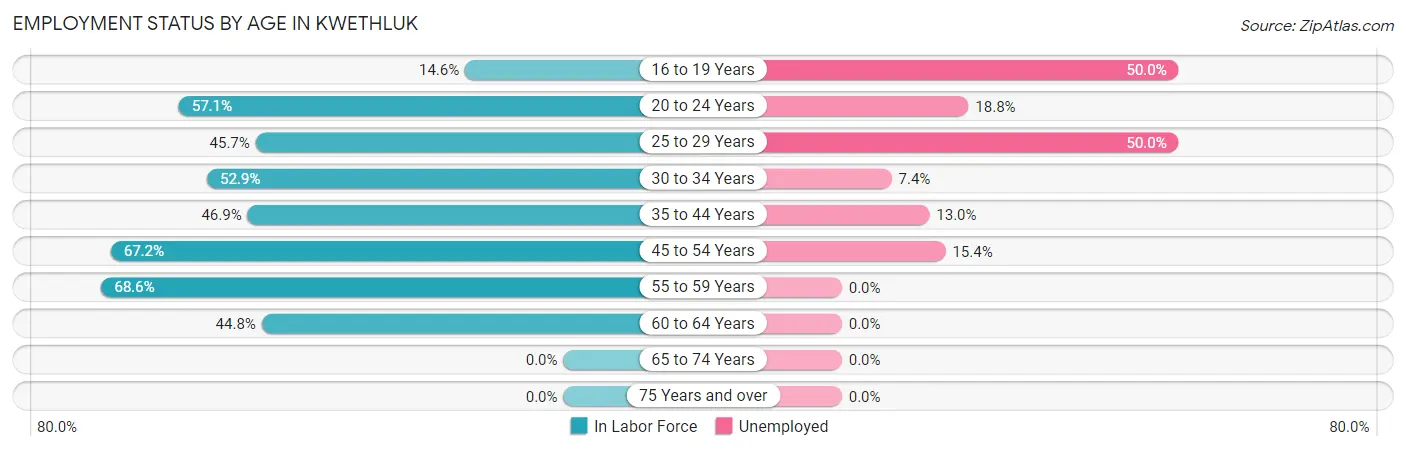
| Age Bracket | In Labor Force | Unemployed |
| 16 to 19 Years | 6 (14.6%) | 3 (50.0%) |
| 20 to 24 Years | 32 (57.1%) | 6 (18.8%) |
| 25 to 29 Years | 16 (45.7%) | 8 (50.0%) |
| 30 to 34 Years | 27 (52.9%) | 2 (7.4%) |
| 35 to 44 Years | 23 (46.9%) | 3 (13.0%) |
| 45 to 54 Years | 39 (67.2%) | 6 (15.4%) |
| 55 to 59 Years | 24 (68.6%) | 0 (0.0%) |
| 60 to 64 Years | 13 (44.8%) | 0 (0.0%) |
| 65 to 74 Years | 0 (0.0%) | 0 (0.0%) |
| 75 Years and over | 0 (0.0%) | 0 (0.0%) |
| Total | 180 (48.1%) | 28 (15.6%) |
Employment Status by Educational Attainment in Kwethluk
According to labor force statistics for Kwethluk, 55.3% of individuals (142) out of the total population between 25 and 64 years of age (257) are in the labor force, with 13.4% or 19 of them being unemployed. The group with the highest labor force participation rate are those with the educational attainment of bachelor's degree or higher, with 100.0% or 15 individuals in the labor force. Within the labor force, individuals with less than high school education have the highest percentage of unemployment, with 21.4% or 3 of them being unemployed.
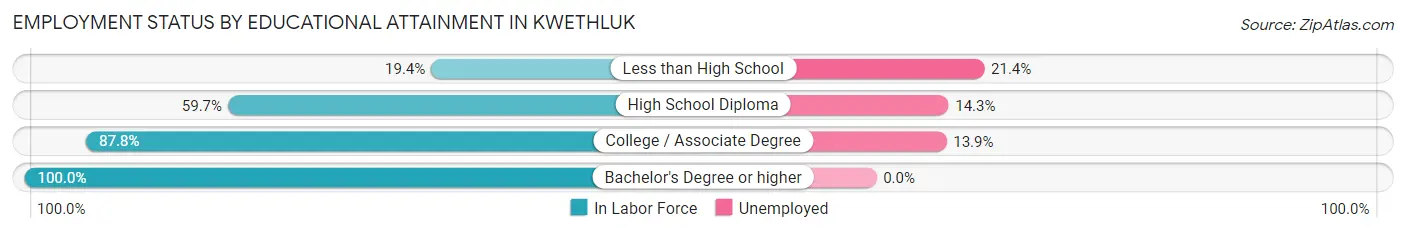
| Educational Attainment | In Labor Force | Unemployed |
| Less than High School | 14 (19.4%) | 15 (21.4%) |
| High School Diploma | 77 (59.7%) | 18 (14.3%) |
| College / Associate Degree | 36 (87.8%) | 6 (13.9%) |
| Bachelor's Degree or higher | 15 (100.0%) | 0 (0.0%) |
| Total | 142 (55.3%) | 34 (13.4%) |
Employment Occupations by Sex in Kwethluk
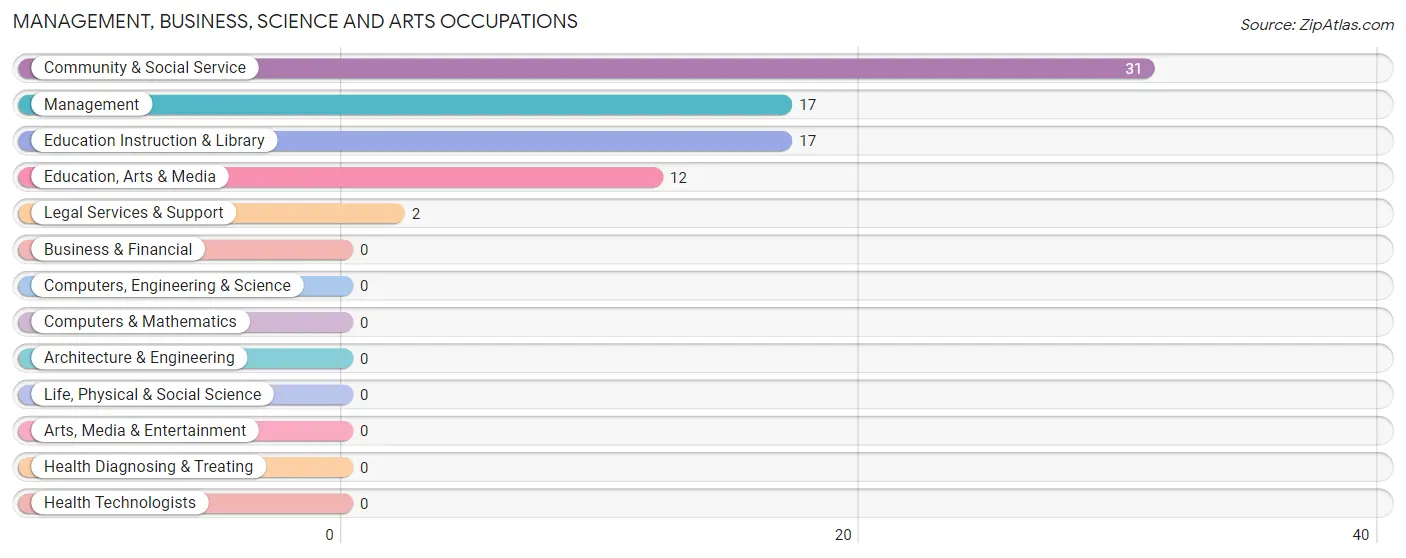
Management, Business, Science and Arts Occupations
The most common Management, Business, Science and Arts occupations in Kwethluk are Community & Social Service (31 | 20.4%), Management (17 | 11.2%), Education Instruction & Library (17 | 11.2%), Education, Arts & Media (12 | 7.9%), and Legal Services & Support (2 | 1.3%).
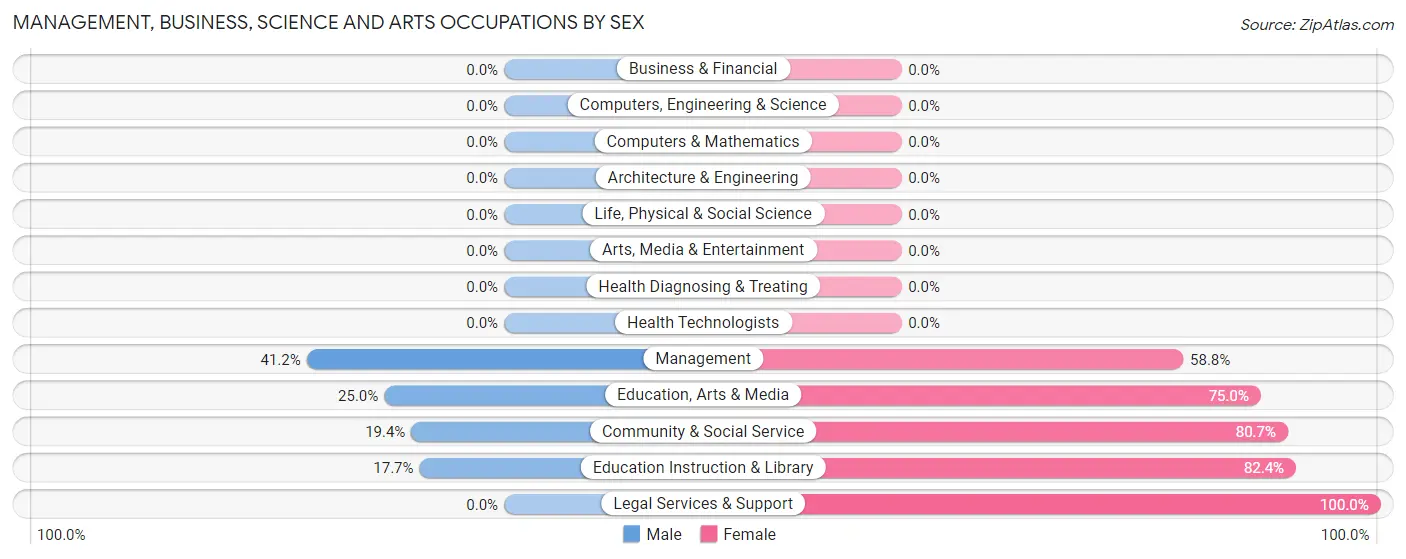
Management, Business, Science and Arts Occupations by Sex
Within the Management, Business, Science and Arts occupations in Kwethluk, the most male-oriented occupations are Management (41.2%), Education, Arts & Media (25.0%), and Community & Social Service (19.4%), while the most female-oriented occupations are Legal Services & Support (100.0%), Education Instruction & Library (82.4%), and Community & Social Service (80.6%).
| Occupation | Male | Female |
| Management | 7 (41.2%) | 10 (58.8%) |
| Business & Financial | 0 (0.0%) | 0 (0.0%) |
| Computers, Engineering & Science | 0 (0.0%) | 0 (0.0%) |
| Computers & Mathematics | 0 (0.0%) | 0 (0.0%) |
| Architecture & Engineering | 0 (0.0%) | 0 (0.0%) |
| Life, Physical & Social Science | 0 (0.0%) | 0 (0.0%) |
| Community & Social Service | 6 (19.4%) | 25 (80.6%) |
| Education, Arts & Media | 3 (25.0%) | 9 (75.0%) |
| Legal Services & Support | 0 (0.0%) | 2 (100.0%) |
| Education Instruction & Library | 3 (17.6%) | 14 (82.4%) |
| Arts, Media & Entertainment | 0 (0.0%) | 0 (0.0%) |
| Health Diagnosing & Treating | 0 (0.0%) | 0 (0.0%) |
| Health Technologists | 0 (0.0%) | 0 (0.0%) |
| Total (Category) | 13 (27.1%) | 35 (72.9%) |
| Total (Overall) | 74 (48.7%) | 78 (51.3%) |
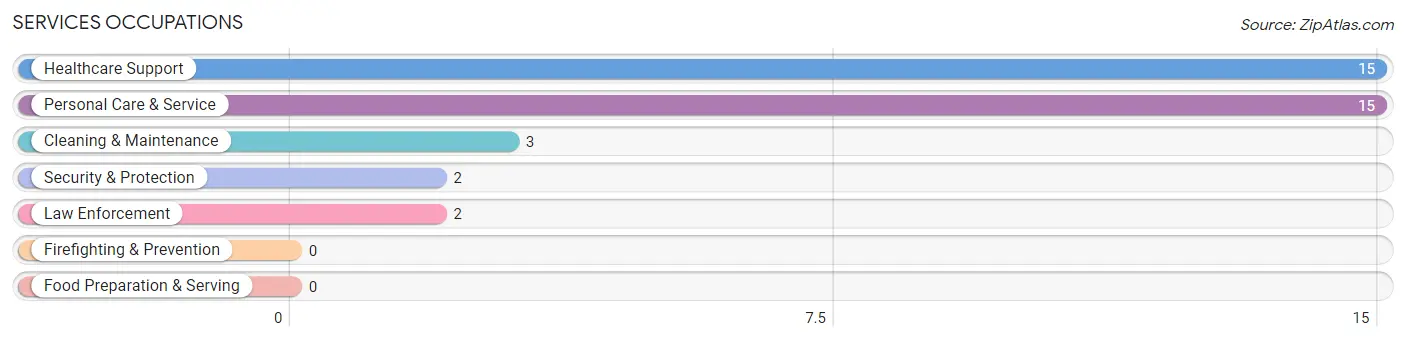
Services Occupations
The most common Services occupations in Kwethluk are Healthcare Support (15 | 9.9%), Personal Care & Service (15 | 9.9%), Cleaning & Maintenance (3 | 2.0%), Security & Protection (2 | 1.3%), and Law Enforcement (2 | 1.3%).
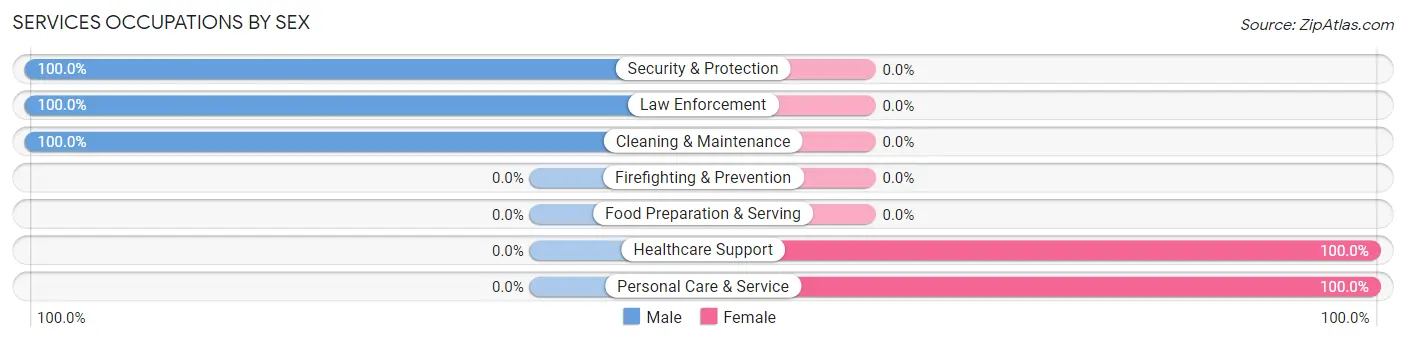
Services Occupations by Sex
Within the Services occupations in Kwethluk, the most male-oriented occupations are Security & Protection (100.0%), Law Enforcement (100.0%), and Cleaning & Maintenance (100.0%), while the most female-oriented occupations are Healthcare Support (100.0%), and Personal Care & Service (100.0%).
| Occupation | Male | Female |
| Healthcare Support | 0 (0.0%) | 15 (100.0%) |
| Security & Protection | 2 (100.0%) | 0 (0.0%) |
| Firefighting & Prevention | 0 (0.0%) | 0 (0.0%) |
| Law Enforcement | 2 (100.0%) | 0 (0.0%) |
| Food Preparation & Serving | 0 (0.0%) | 0 (0.0%) |
| Cleaning & Maintenance | 3 (100.0%) | 0 (0.0%) |
| Personal Care & Service | 0 (0.0%) | 15 (100.0%) |
| Total (Category) | 5 (14.3%) | 30 (85.7%) |
| Total (Overall) | 74 (48.7%) | 78 (51.3%) |
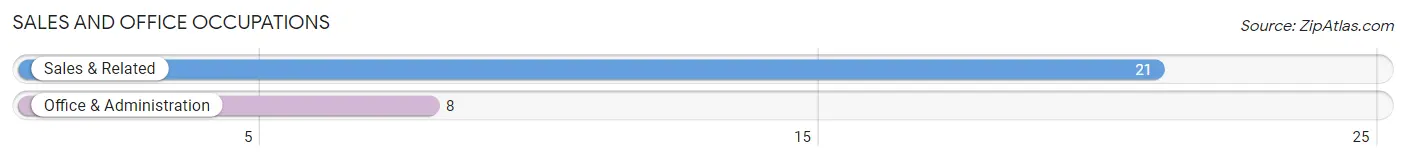
Sales and Office Occupations
The most common Sales and Office occupations in Kwethluk are Sales & Related (21 | 13.8%), and Office & Administration (8 | 5.3%).
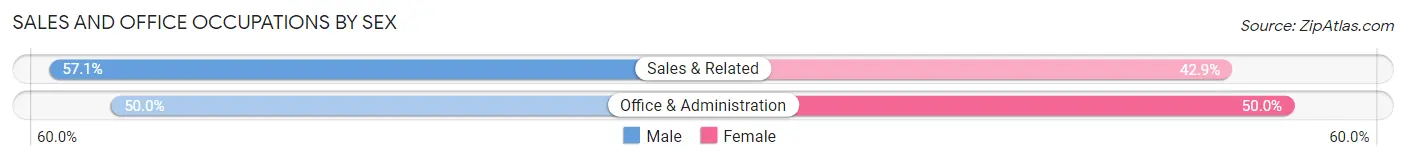
Sales and Office Occupations by Sex
| Occupation | Male | Female |
| Sales & Related | 12 (57.1%) | 9 (42.9%) |
| Office & Administration | 4 (50.0%) | 4 (50.0%) |
| Total (Category) | 16 (55.2%) | 13 (44.8%) |
| Total (Overall) | 74 (48.7%) | 78 (51.3%) |
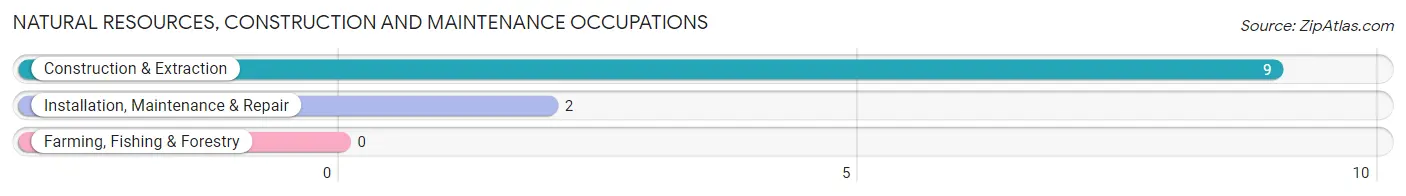
Natural Resources, Construction and Maintenance Occupations
The most common Natural Resources, Construction and Maintenance occupations in Kwethluk are Construction & Extraction (9 | 5.9%), and Installation, Maintenance & Repair (2 | 1.3%).
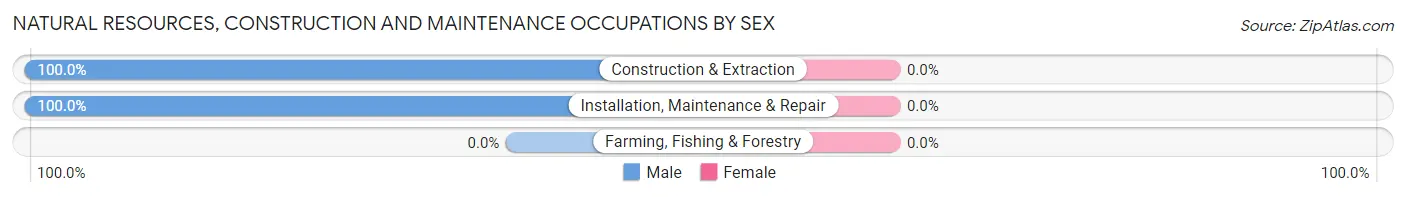
Natural Resources, Construction and Maintenance Occupations by Sex
| Occupation | Male | Female |
| Farming, Fishing & Forestry | 0 (0.0%) | 0 (0.0%) |
| Construction & Extraction | 9 (100.0%) | 0 (0.0%) |
| Installation, Maintenance & Repair | 2 (100.0%) | 0 (0.0%) |
| Total (Category) | 11 (100.0%) | 0 (0.0%) |
| Total (Overall) | 74 (48.7%) | 78 (51.3%) |
Production, Transportation and Moving Occupations
The most common Production, Transportation and Moving occupations in Kwethluk are Material Moving (12 | 7.9%), Production (11 | 7.2%), and Transportation (6 | 4.0%).
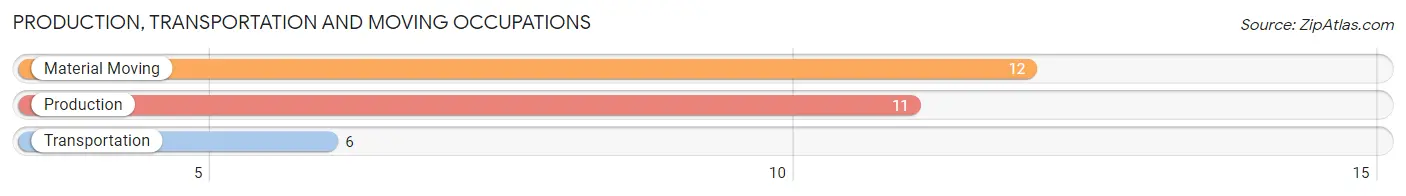
Production, Transportation and Moving Occupations by Sex
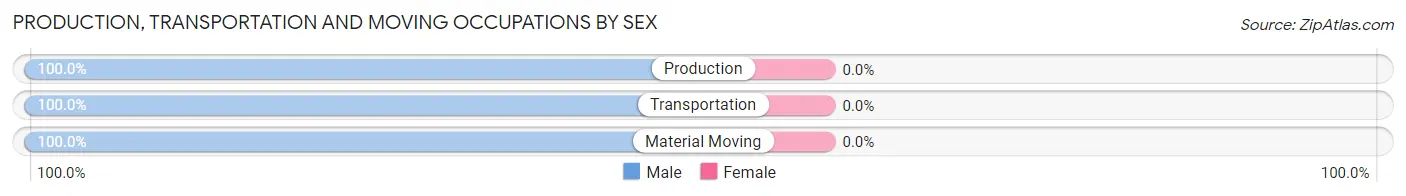
| Occupation | Male | Female |
| Production | 11 (100.0%) | 0 (0.0%) |
| Transportation | 6 (100.0%) | 0 (0.0%) |
| Material Moving | 12 (100.0%) | 0 (0.0%) |
| Total (Category) | 29 (100.0%) | 0 (0.0%) |
| Total (Overall) | 74 (48.7%) | 78 (51.3%) |
Employment Industries by Sex in Kwethluk
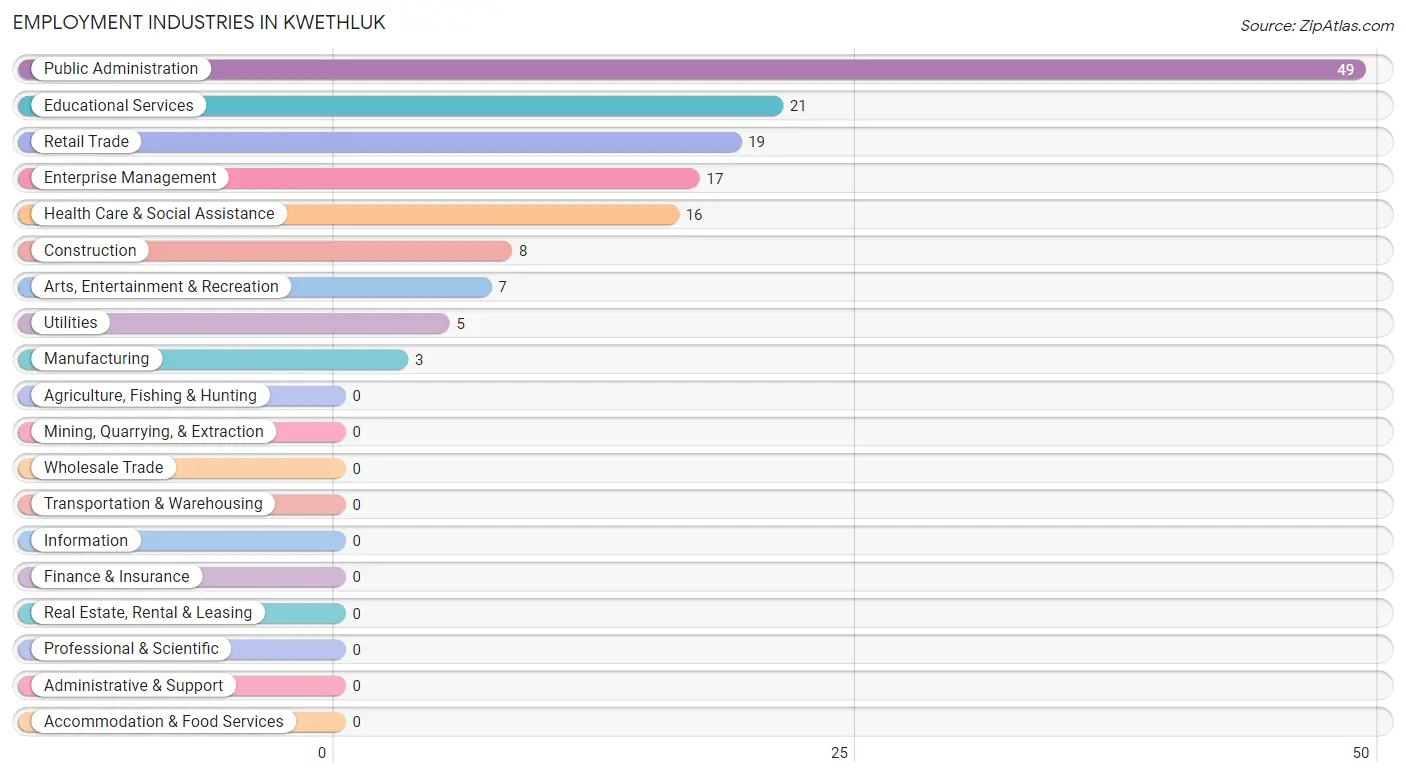
Employment Industries in Kwethluk
The major employment industries in Kwethluk include Public Administration (49 | 32.2%), Educational Services (21 | 13.8%), Retail Trade (19 | 12.5%), Enterprise Management (17 | 11.2%), and Health Care & Social Assistance (16 | 10.5%).
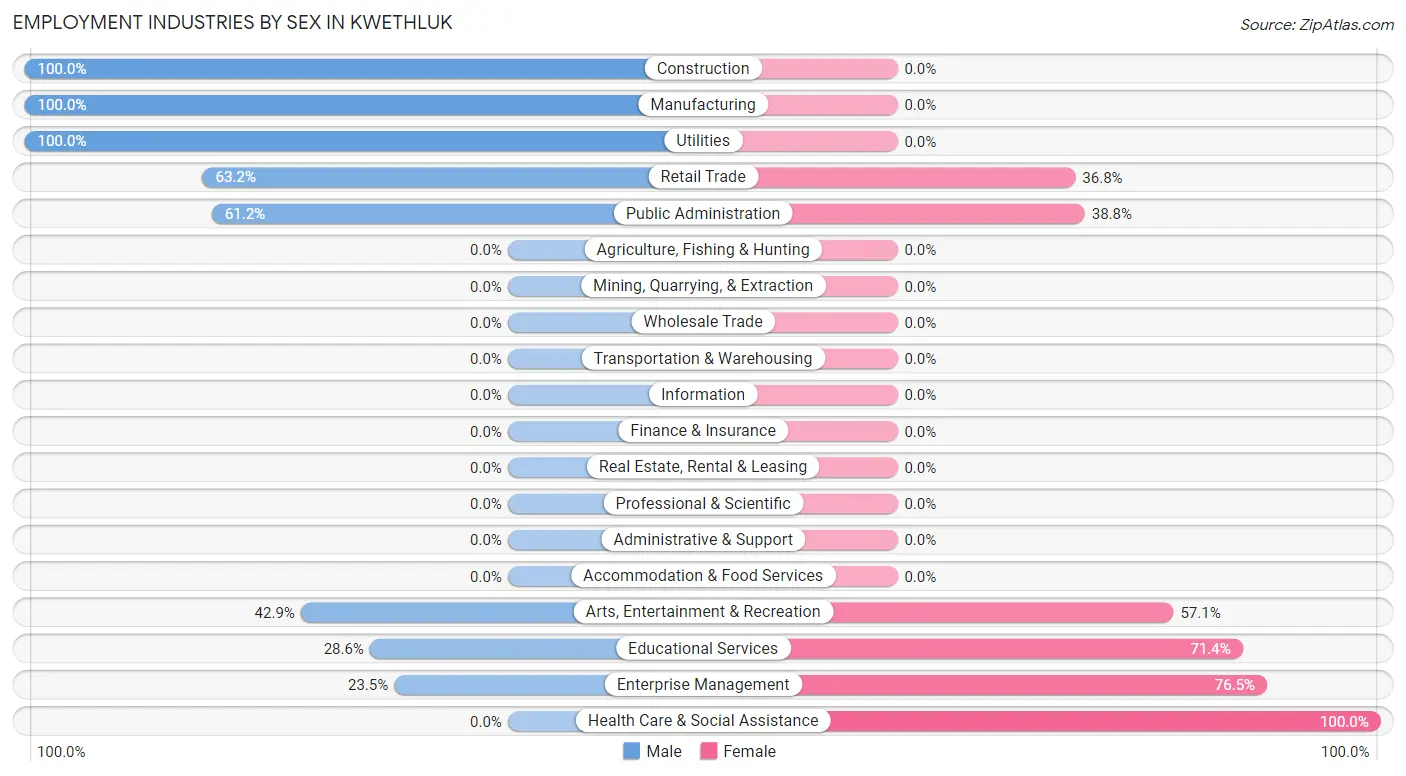
Employment Industries by Sex in Kwethluk
The Kwethluk industries that see more men than women are Construction (100.0%), Manufacturing (100.0%), and Utilities (100.0%), whereas the industries that tend to have a higher number of women are Health Care & Social Assistance (100.0%), Enterprise Management (76.5%), and Educational Services (71.4%).
| Industry | Male | Female |
| Agriculture, Fishing & Hunting | 0 (0.0%) | 0 (0.0%) |
| Mining, Quarrying, & Extraction | 0 (0.0%) | 0 (0.0%) |
| Construction | 8 (100.0%) | 0 (0.0%) |
| Manufacturing | 3 (100.0%) | 0 (0.0%) |
| Wholesale Trade | 0 (0.0%) | 0 (0.0%) |
| Retail Trade | 12 (63.2%) | 7 (36.8%) |
| Transportation & Warehousing | 0 (0.0%) | 0 (0.0%) |
| Utilities | 5 (100.0%) | 0 (0.0%) |
| Information | 0 (0.0%) | 0 (0.0%) |
| Finance & Insurance | 0 (0.0%) | 0 (0.0%) |
| Real Estate, Rental & Leasing | 0 (0.0%) | 0 (0.0%) |
| Professional & Scientific | 0 (0.0%) | 0 (0.0%) |
| Enterprise Management | 4 (23.5%) | 13 (76.5%) |
| Administrative & Support | 0 (0.0%) | 0 (0.0%) |
| Educational Services | 6 (28.6%) | 15 (71.4%) |
| Health Care & Social Assistance | 0 (0.0%) | 16 (100.0%) |
| Arts, Entertainment & Recreation | 3 (42.9%) | 4 (57.1%) |
| Accommodation & Food Services | 0 (0.0%) | 0 (0.0%) |
| Public Administration | 30 (61.2%) | 19 (38.8%) |
| Total | 74 (48.7%) | 78 (51.3%) |
Education in Kwethluk
School Enrollment in Kwethluk
The most common levels of schooling among the 191 students in Kwethluk are elementary school (55 | 28.8%), high school (53 | 27.8%), and middle school (39 | 20.4%).
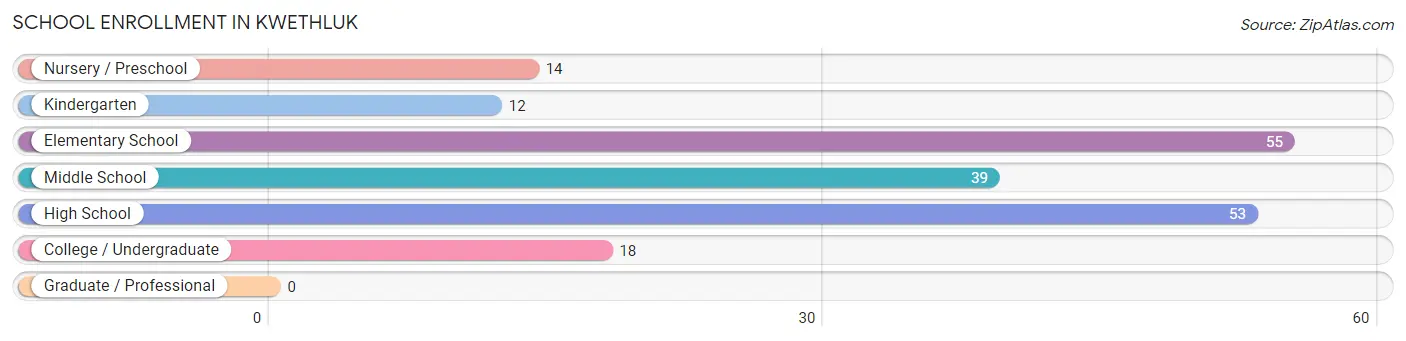
| School Level | # Students | % Students |
| Nursery / Preschool | 14 | 7.3% |
| Kindergarten | 12 | 6.3% |
| Elementary School | 55 | 28.8% |
| Middle School | 39 | 20.4% |
| High School | 53 | 27.8% |
| College / Undergraduate | 18 | 9.4% |
| Graduate / Professional | 0 | 0.0% |
| Total | 191 | 100.0% |
School Enrollment by Age by Funding Source in Kwethluk
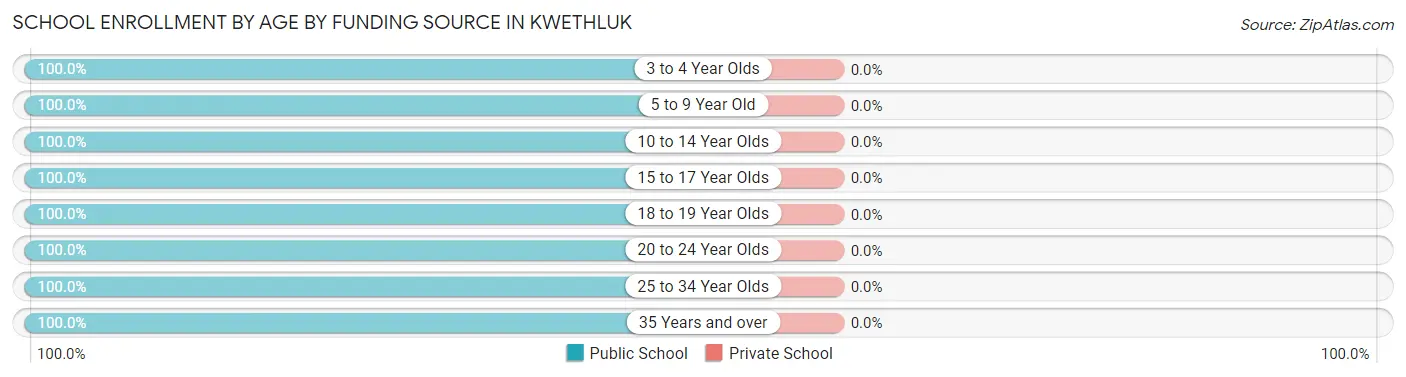
| Age Bracket | Public School | Private School |
| 3 to 4 Year Olds | 14 (100.0%) | 0 (0.0%) |
| 5 to 9 Year Old | 63 (100.0%) | 0 (0.0%) |
| 10 to 14 Year Olds | 41 (100.0%) | 0 (0.0%) |
| 15 to 17 Year Olds | 42 (100.0%) | 0 (0.0%) |
| 18 to 19 Year Olds | 2 (100.0%) | 0 (0.0%) |
| 20 to 24 Year Olds | 13 (100.0%) | 0 (0.0%) |
| 25 to 34 Year Olds | 12 (100.0%) | 0 (0.0%) |
| 35 Years and over | 4 (100.0%) | 0 (0.0%) |
| Total | 191 (100.0%) | 0 (0.0%) |
Educational Attainment by Field of Study in Kwethluk
Education (12 | 57.1%), business (5 | 23.8%), liberal arts & history (3 | 14.3%), and literature & languages (1 | 4.8%) are the most common fields of study among 21 individuals in Kwethluk who have obtained a bachelor's degree or higher.
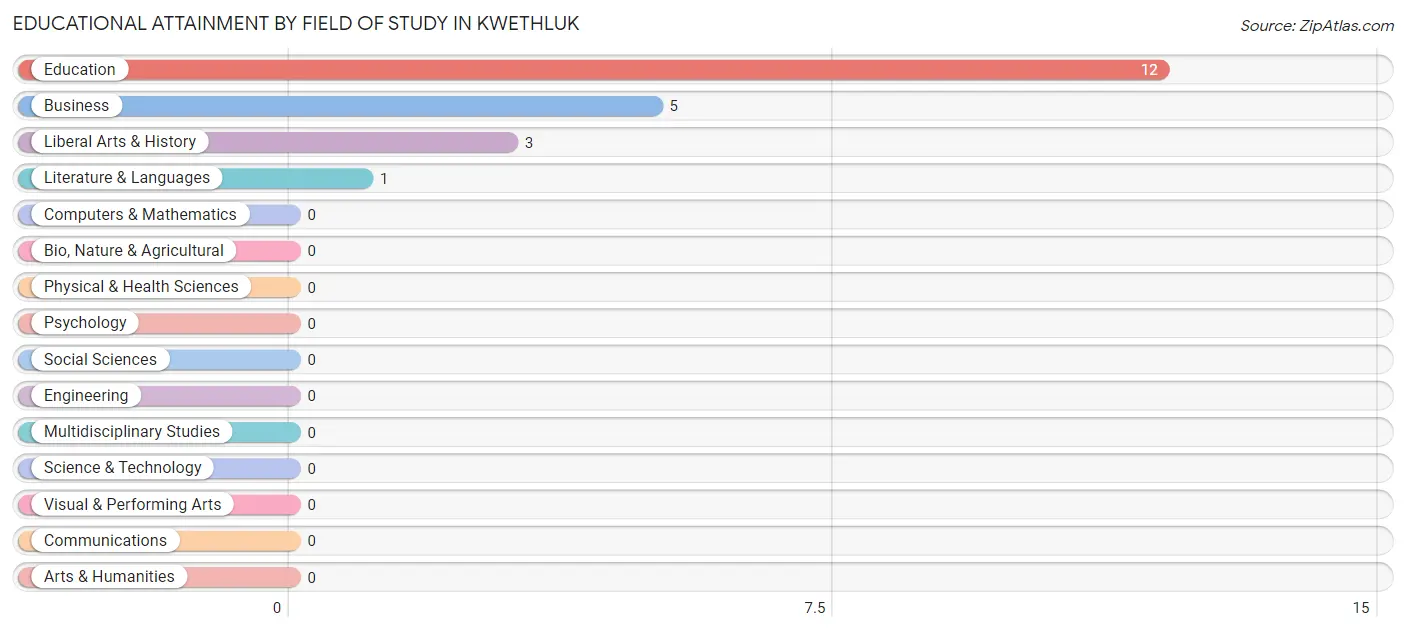
| Field of Study | # Graduates | % Graduates |
| Computers & Mathematics | 0 | 0.0% |
| Bio, Nature & Agricultural | 0 | 0.0% |
| Physical & Health Sciences | 0 | 0.0% |
| Psychology | 0 | 0.0% |
| Social Sciences | 0 | 0.0% |
| Engineering | 0 | 0.0% |
| Multidisciplinary Studies | 0 | 0.0% |
| Science & Technology | 0 | 0.0% |
| Business | 5 | 23.8% |
| Education | 12 | 57.1% |
| Literature & Languages | 1 | 4.8% |
| Liberal Arts & History | 3 | 14.3% |
| Visual & Performing Arts | 0 | 0.0% |
| Communications | 0 | 0.0% |
| Arts & Humanities | 0 | 0.0% |
| Total | 21 | 100.0% |
Transportation & Commute in Kwethluk
Vehicle Availability by Sex in Kwethluk
The most prevalent vehicle ownership categories in Kwethluk are males with no vehicle (53, accounting for 71.6%) and females with no vehicle (51, making up 67.9%).
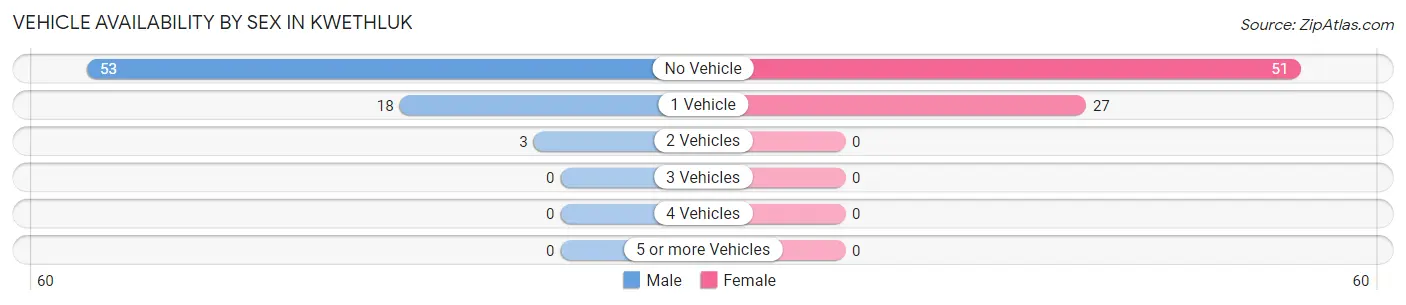
| Vehicles Available | Male | Female |
| No Vehicle | 53 (71.6%) | 51 (65.4%) |
| 1 Vehicle | 18 (24.3%) | 27 (34.6%) |
| 2 Vehicles | 3 (4.1%) | 0 (0.0%) |
| 3 Vehicles | 0 (0.0%) | 0 (0.0%) |
| 4 Vehicles | 0 (0.0%) | 0 (0.0%) |
| 5 or more Vehicles | 0 (0.0%) | 0 (0.0%) |
| Total | 74 (100.0%) | 78 (100.0%) |
Commute Time in Kwethluk
The most frequently occuring commute durations in Kwethluk are 5 to 9 minutes (80 commuters, 53.3%), less than 5 minutes (42 commuters, 28.0%), and 15 to 19 minutes (14 commuters, 9.3%).
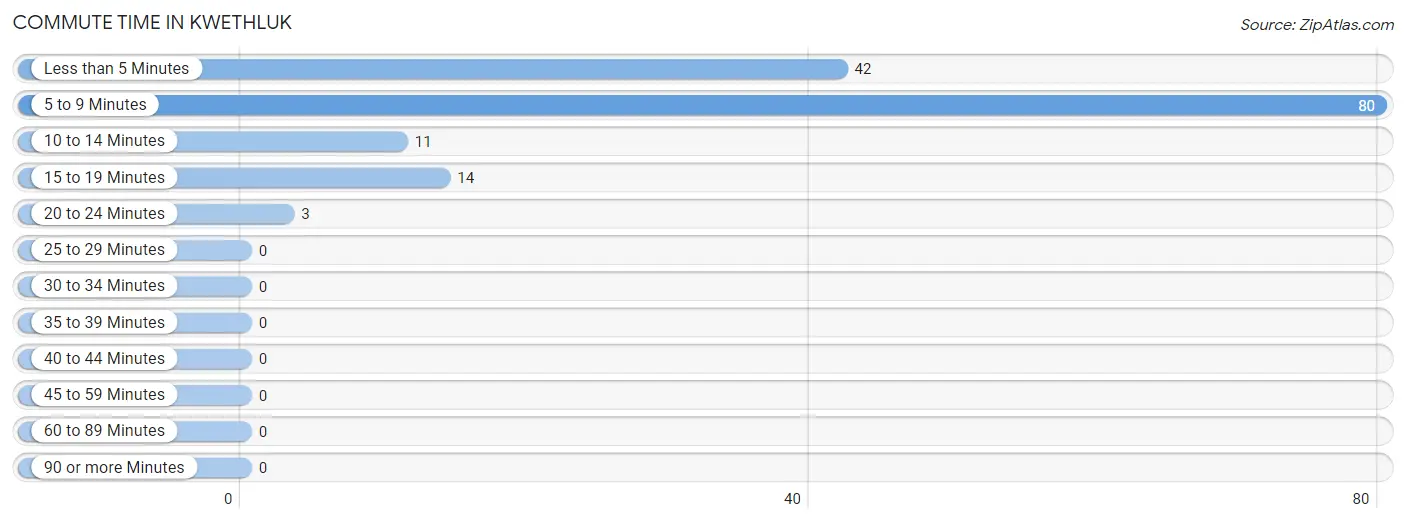
| Commute Time | # Commuters | % Commuters |
| Less than 5 Minutes | 42 | 28.0% |
| 5 to 9 Minutes | 80 | 53.3% |
| 10 to 14 Minutes | 11 | 7.3% |
| 15 to 19 Minutes | 14 | 9.3% |
| 20 to 24 Minutes | 3 | 2.0% |
| 25 to 29 Minutes | 0 | 0.0% |
| 30 to 34 Minutes | 0 | 0.0% |
| 35 to 39 Minutes | 0 | 0.0% |
| 40 to 44 Minutes | 0 | 0.0% |
| 45 to 59 Minutes | 0 | 0.0% |
| 60 to 89 Minutes | 0 | 0.0% |
| 90 or more Minutes | 0 | 0.0% |
Commute Time by Sex in Kwethluk
The most common commute times in Kwethluk are 5 to 9 minutes (44 commuters, 59.5%) for males and 5 to 9 minutes (36 commuters, 47.4%) for females.
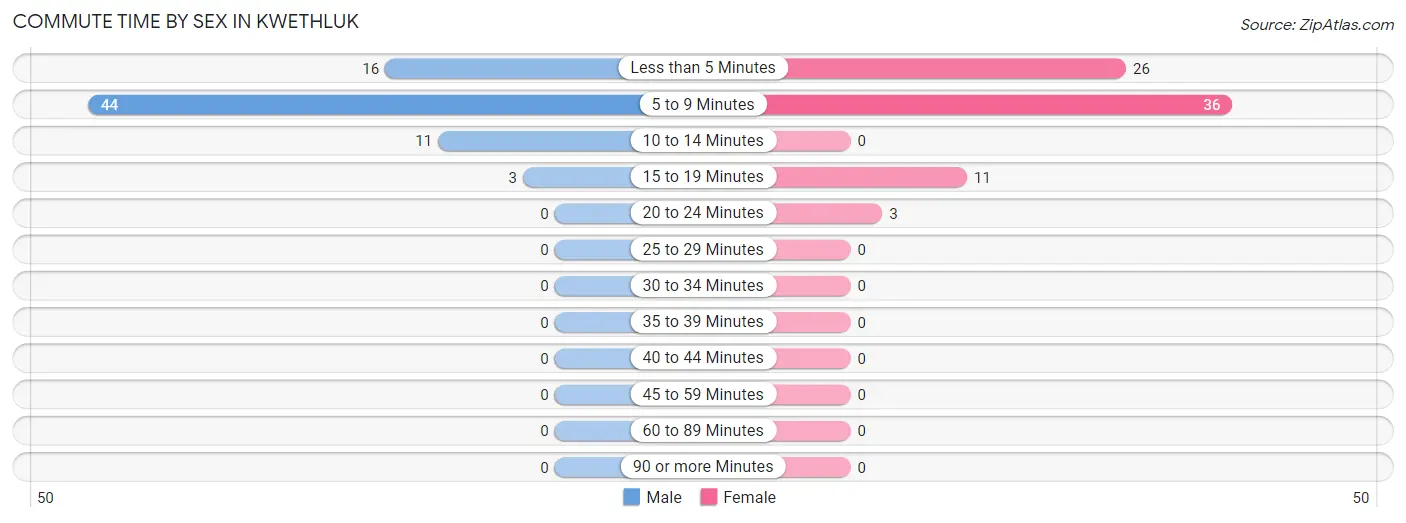
| Commute Time | Male | Female |
| Less than 5 Minutes | 16 (21.6%) | 26 (34.2%) |
| 5 to 9 Minutes | 44 (59.5%) | 36 (47.4%) |
| 10 to 14 Minutes | 11 (14.9%) | 0 (0.0%) |
| 15 to 19 Minutes | 3 (4.1%) | 11 (14.5%) |
| 20 to 24 Minutes | 0 (0.0%) | 3 (4.0%) |
| 25 to 29 Minutes | 0 (0.0%) | 0 (0.0%) |
| 30 to 34 Minutes | 0 (0.0%) | 0 (0.0%) |
| 35 to 39 Minutes | 0 (0.0%) | 0 (0.0%) |
| 40 to 44 Minutes | 0 (0.0%) | 0 (0.0%) |
| 45 to 59 Minutes | 0 (0.0%) | 0 (0.0%) |
| 60 to 89 Minutes | 0 (0.0%) | 0 (0.0%) |
| 90 or more Minutes | 0 (0.0%) | 0 (0.0%) |
Time of Departure to Work by Sex in Kwethluk
The most frequent times of departure to work in Kwethluk are 8:30 AM to 8:59 AM (52, 70.3%) for males and 8:30 AM to 8:59 AM (20, 26.3%) for females.
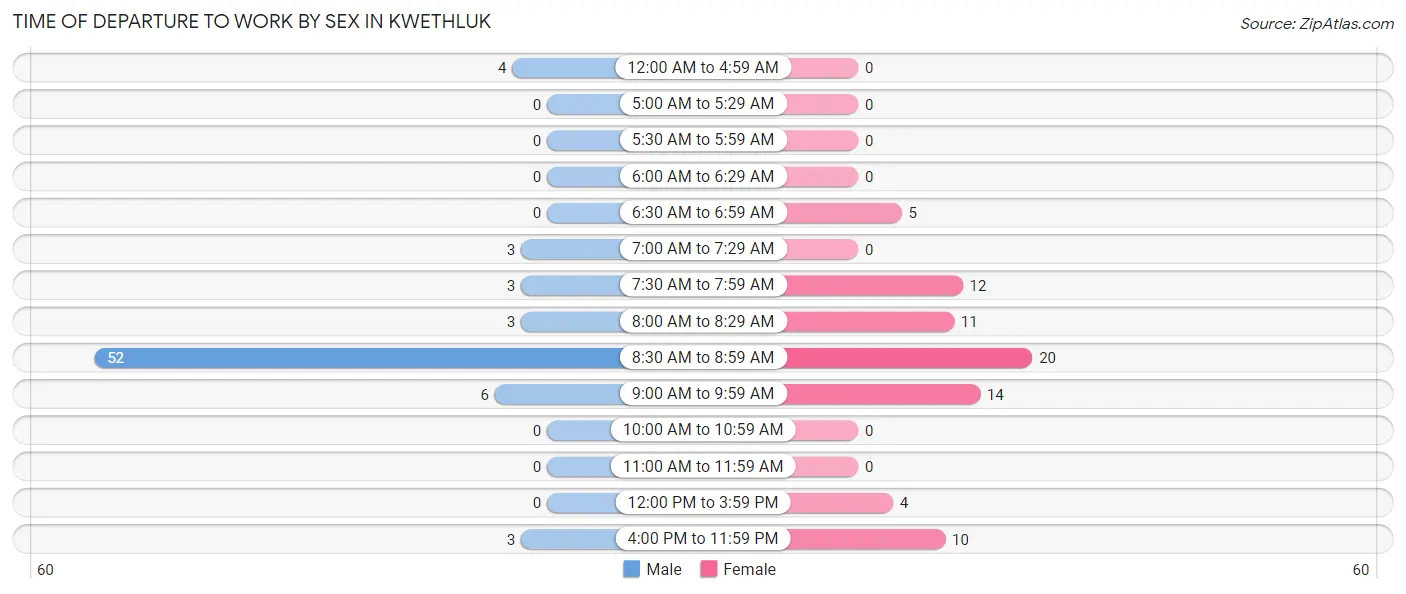
| Time of Departure | Male | Female |
| 12:00 AM to 4:59 AM | 4 (5.4%) | 0 (0.0%) |
| 5:00 AM to 5:29 AM | 0 (0.0%) | 0 (0.0%) |
| 5:30 AM to 5:59 AM | 0 (0.0%) | 0 (0.0%) |
| 6:00 AM to 6:29 AM | 0 (0.0%) | 0 (0.0%) |
| 6:30 AM to 6:59 AM | 0 (0.0%) | 5 (6.6%) |
| 7:00 AM to 7:29 AM | 3 (4.1%) | 0 (0.0%) |
| 7:30 AM to 7:59 AM | 3 (4.1%) | 12 (15.8%) |
| 8:00 AM to 8:29 AM | 3 (4.1%) | 11 (14.5%) |
| 8:30 AM to 8:59 AM | 52 (70.3%) | 20 (26.3%) |
| 9:00 AM to 9:59 AM | 6 (8.1%) | 14 (18.4%) |
| 10:00 AM to 10:59 AM | 0 (0.0%) | 0 (0.0%) |
| 11:00 AM to 11:59 AM | 0 (0.0%) | 0 (0.0%) |
| 12:00 PM to 3:59 PM | 0 (0.0%) | 4 (5.3%) |
| 4:00 PM to 11:59 PM | 3 (4.1%) | 10 (13.2%) |
| Total | 74 (100.0%) | 76 (100.0%) |
Housing Occupancy in Kwethluk
Occupancy by Ownership in Kwethluk
Of the total 116 dwellings in Kwethluk, owner-occupied units account for 81 (69.8%), while renter-occupied units make up 35 (30.2%).
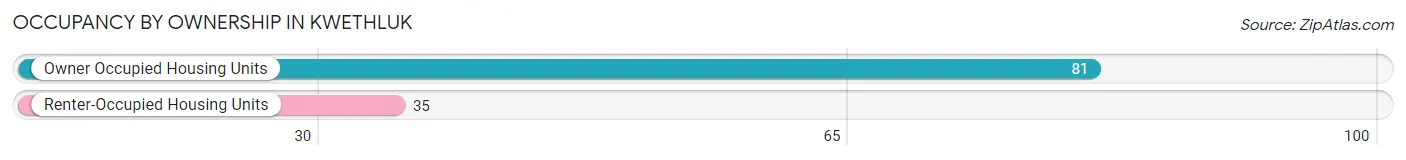
| Occupancy | # Housing Units | % Housing Units |
| Owner Occupied Housing Units | 81 | 69.8% |
| Renter-Occupied Housing Units | 35 | 30.2% |
| Total Occupied Housing Units | 116 | 100.0% |
Occupancy by Household Size in Kwethluk
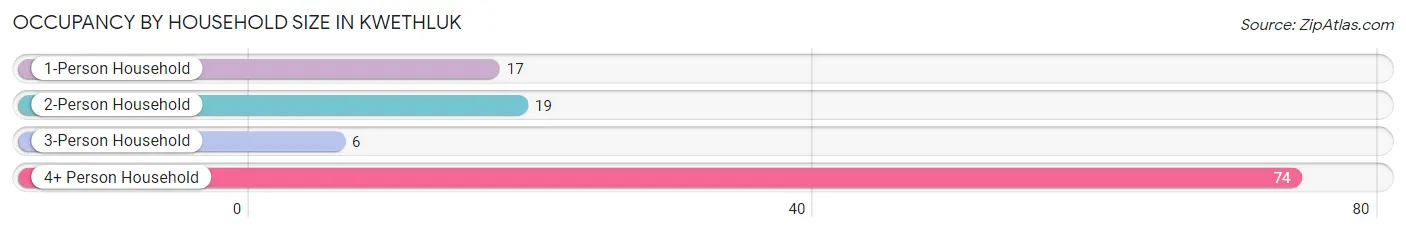
| Household Size | # Housing Units | % Housing Units |
| 1-Person Household | 17 | 14.7% |
| 2-Person Household | 19 | 16.4% |
| 3-Person Household | 6 | 5.2% |
| 4+ Person Household | 74 | 63.8% |
| Total Housing Units | 116 | 100.0% |
Occupancy by Ownership by Household Size in Kwethluk

| Household Size | Owner-occupied | Renter-occupied |
| 1-Person Household | 12 (70.6%) | 5 (29.4%) |
| 2-Person Household | 10 (52.6%) | 9 (47.4%) |
| 3-Person Household | 6 (100.0%) | 0 (0.0%) |
| 4+ Person Household | 53 (71.6%) | 21 (28.4%) |
| Total Housing Units | 81 (69.8%) | 35 (30.2%) |
Occupancy by Educational Attainment in Kwethluk
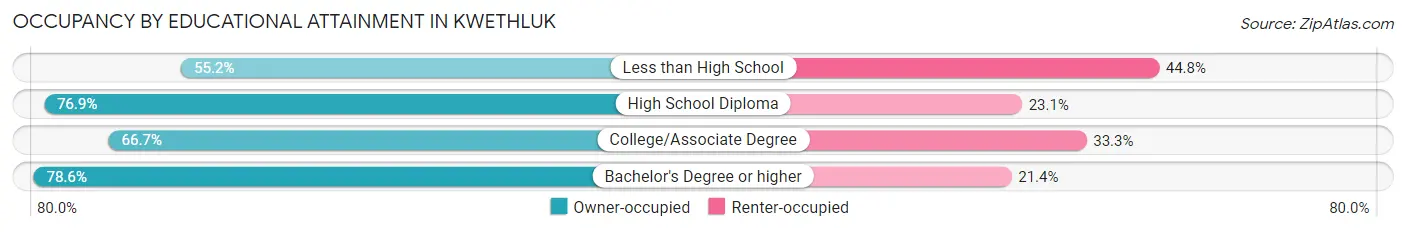
| Household Size | Owner-occupied | Renter-occupied |
| Less than High School | 16 (55.2%) | 13 (44.8%) |
| High School Diploma | 40 (76.9%) | 12 (23.1%) |
| College/Associate Degree | 14 (66.7%) | 7 (33.3%) |
| Bachelor's Degree or higher | 11 (78.6%) | 3 (21.4%) |
Occupancy by Age of Householder in Kwethluk
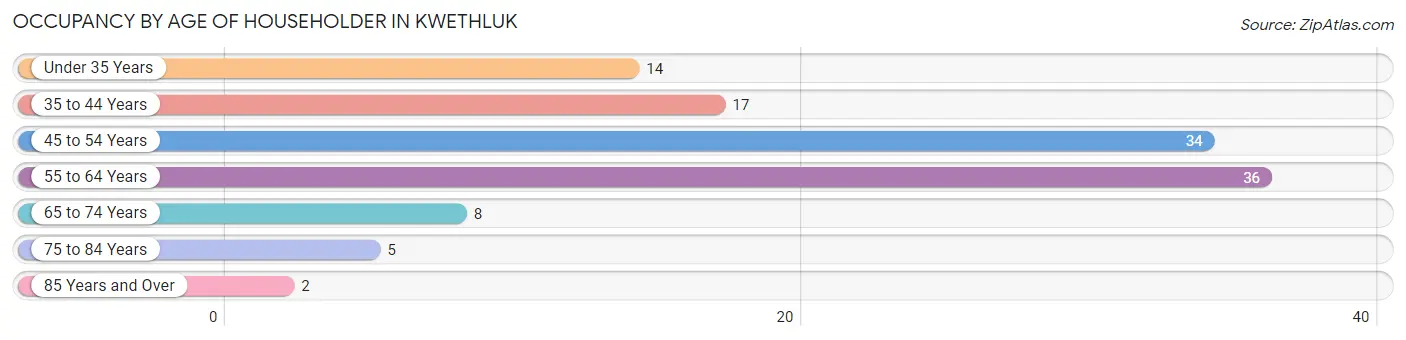
| Age Bracket | # Households | % Households |
| Under 35 Years | 14 | 12.1% |
| 35 to 44 Years | 17 | 14.7% |
| 45 to 54 Years | 34 | 29.3% |
| 55 to 64 Years | 36 | 31.0% |
| 65 to 74 Years | 8 | 6.9% |
| 75 to 84 Years | 5 | 4.3% |
| 85 Years and Over | 2 | 1.7% |
| Total | 116 | 100.0% |
Housing Finances in Kwethluk
Median Income by Occupancy in Kwethluk
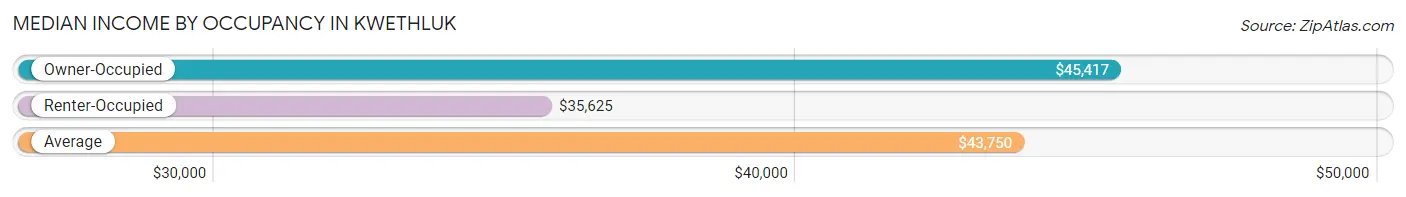
| Occupancy Type | # Households | Median Income |
| Owner-Occupied | 81 (69.8%) | $45,417 |
| Renter-Occupied | 35 (30.2%) | $35,625 |
| Average | 116 (100.0%) | $43,750 |
Occupancy by Householder Income Bracket in Kwethluk
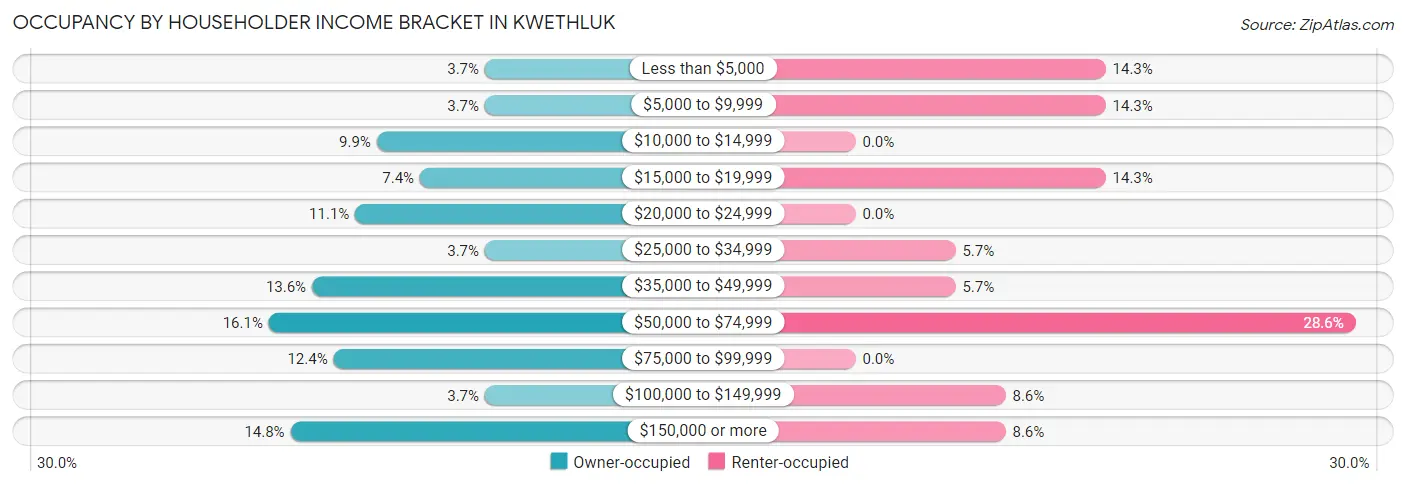
| Income Bracket | Owner-occupied | Renter-occupied |
| Less than $5,000 | 3 (3.7%) | 5 (14.3%) |
| $5,000 to $9,999 | 3 (3.7%) | 5 (14.3%) |
| $10,000 to $14,999 | 8 (9.9%) | 0 (0.0%) |
| $15,000 to $19,999 | 6 (7.4%) | 5 (14.3%) |
| $20,000 to $24,999 | 9 (11.1%) | 0 (0.0%) |
| $25,000 to $34,999 | 3 (3.7%) | 2 (5.7%) |
| $35,000 to $49,999 | 11 (13.6%) | 2 (5.7%) |
| $50,000 to $74,999 | 13 (16.1%) | 10 (28.6%) |
| $75,000 to $99,999 | 10 (12.3%) | 0 (0.0%) |
| $100,000 to $149,999 | 3 (3.7%) | 3 (8.6%) |
| $150,000 or more | 12 (14.8%) | 3 (8.6%) |
| Total | 81 (100.0%) | 35 (100.0%) |
Monthly Housing Cost Tiers in Kwethluk
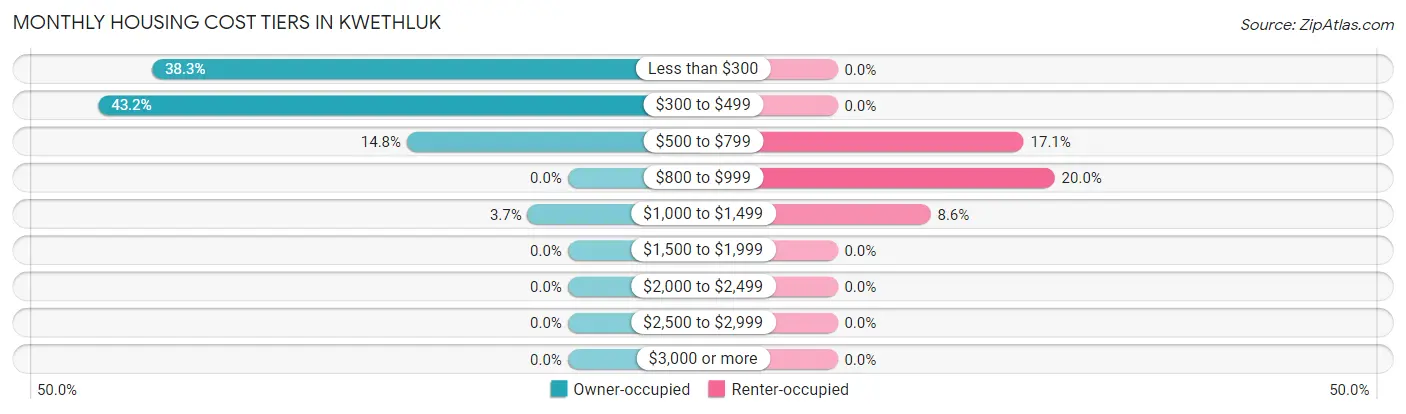
| Monthly Cost | Owner-occupied | Renter-occupied |
| Less than $300 | 31 (38.3%) | 0 (0.0%) |
| $300 to $499 | 35 (43.2%) | 0 (0.0%) |
| $500 to $799 | 12 (14.8%) | 6 (17.1%) |
| $800 to $999 | 0 (0.0%) | 7 (20.0%) |
| $1,000 to $1,499 | 3 (3.7%) | 3 (8.6%) |
| $1,500 to $1,999 | 0 (0.0%) | 0 (0.0%) |
| $2,000 to $2,499 | 0 (0.0%) | 0 (0.0%) |
| $2,500 to $2,999 | 0 (0.0%) | 0 (0.0%) |
| $3,000 or more | 0 (0.0%) | 0 (0.0%) |
| Total | 81 (100.0%) | 35 (100.0%) |
Physical Housing Characteristics in Kwethluk
Housing Structures in Kwethluk
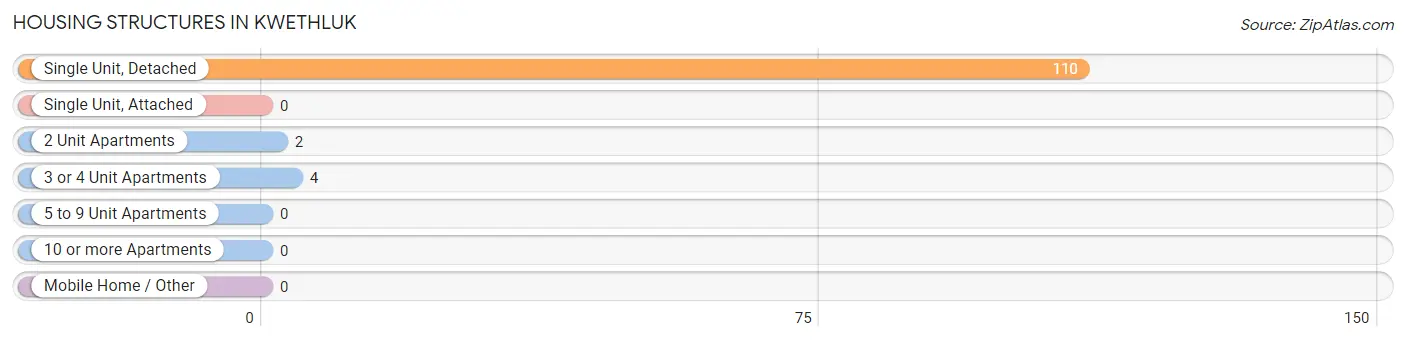
| Structure Type | # Housing Units | % Housing Units |
| Single Unit, Detached | 110 | 94.8% |
| Single Unit, Attached | 0 | 0.0% |
| 2 Unit Apartments | 2 | 1.7% |
| 3 or 4 Unit Apartments | 4 | 3.5% |
| 5 to 9 Unit Apartments | 0 | 0.0% |
| 10 or more Apartments | 0 | 0.0% |
| Mobile Home / Other | 0 | 0.0% |
| Total | 116 | 100.0% |
Housing Structures by Occupancy in Kwethluk
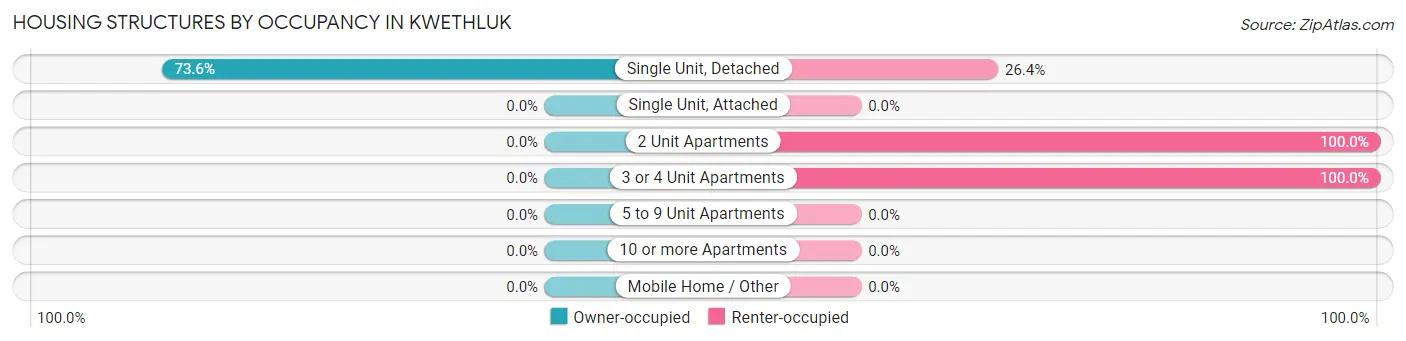
| Structure Type | Owner-occupied | Renter-occupied |
| Single Unit, Detached | 81 (73.6%) | 29 (26.4%) |
| Single Unit, Attached | 0 (0.0%) | 0 (0.0%) |
| 2 Unit Apartments | 0 (0.0%) | 2 (100.0%) |
| 3 or 4 Unit Apartments | 0 (0.0%) | 4 (100.0%) |
| 5 to 9 Unit Apartments | 0 (0.0%) | 0 (0.0%) |
| 10 or more Apartments | 0 (0.0%) | 0 (0.0%) |
| Mobile Home / Other | 0 (0.0%) | 0 (0.0%) |
| Total | 81 (69.8%) | 35 (30.2%) |
Housing Structures by Number of Rooms in Kwethluk
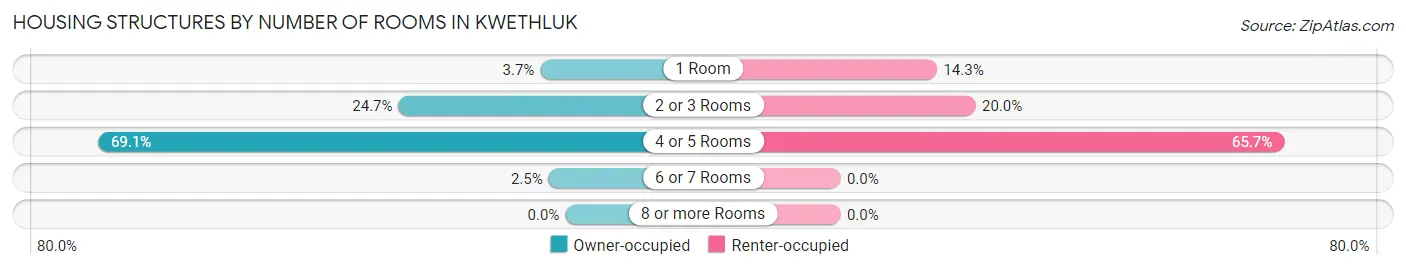
| Number of Rooms | Owner-occupied | Renter-occupied |
| 1 Room | 3 (3.7%) | 5 (14.3%) |
| 2 or 3 Rooms | 20 (24.7%) | 7 (20.0%) |
| 4 or 5 Rooms | 56 (69.1%) | 23 (65.7%) |
| 6 or 7 Rooms | 2 (2.5%) | 0 (0.0%) |
| 8 or more Rooms | 0 (0.0%) | 0 (0.0%) |
| Total | 81 (100.0%) | 35 (100.0%) |
Housing Structure by Heating Type in Kwethluk
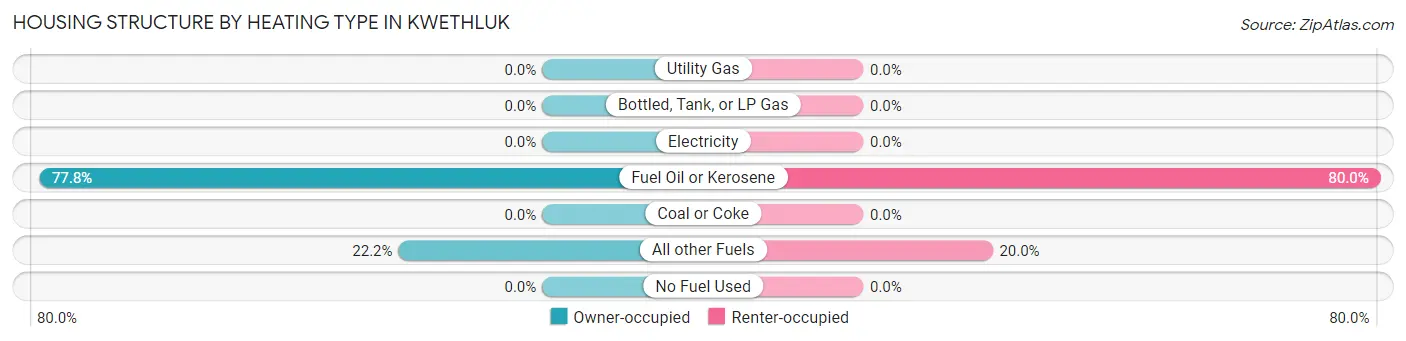
| Heating Type | Owner-occupied | Renter-occupied |
| Utility Gas | 0 (0.0%) | 0 (0.0%) |
| Bottled, Tank, or LP Gas | 0 (0.0%) | 0 (0.0%) |
| Electricity | 0 (0.0%) | 0 (0.0%) |
| Fuel Oil or Kerosene | 63 (77.8%) | 28 (80.0%) |
| Coal or Coke | 0 (0.0%) | 0 (0.0%) |
| All other Fuels | 18 (22.2%) | 7 (20.0%) |
| No Fuel Used | 0 (0.0%) | 0 (0.0%) |
| Total | 81 (100.0%) | 35 (100.0%) |
Household Vehicle Usage in Kwethluk
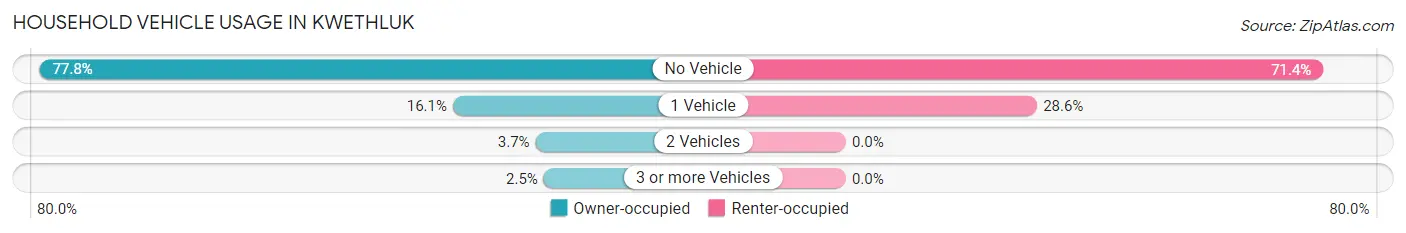
| Vehicles per Household | Owner-occupied | Renter-occupied |
| No Vehicle | 63 (77.8%) | 25 (71.4%) |
| 1 Vehicle | 13 (16.1%) | 10 (28.6%) |
| 2 Vehicles | 3 (3.7%) | 0 (0.0%) |
| 3 or more Vehicles | 2 (2.5%) | 0 (0.0%) |
| Total | 81 (100.0%) | 35 (100.0%) |
Real Estate & Mortgages in Kwethluk
Real Estate and Mortgage Overview in Kwethluk
| Characteristic | Without Mortgage | With Mortgage |
| Housing Units | 70 | 11 |
| Median Property Value | $33,200 | $231,300 |
| Median Household Income | $42,500 | $2 |
| Monthly Housing Costs | $312 | $0 |
| Real Estate Taxes | - | - |
Property Value by Mortgage Status in Kwethluk
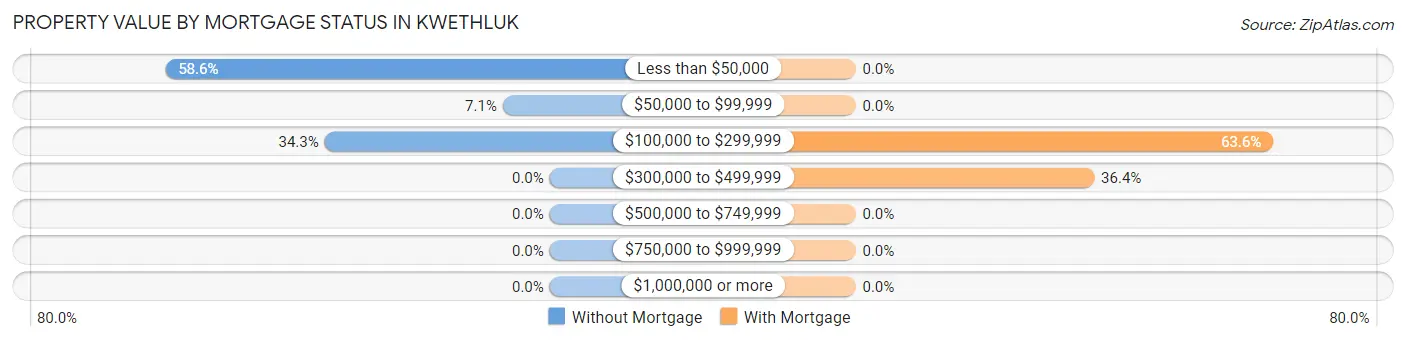
| Property Value | Without Mortgage | With Mortgage |
| Less than $50,000 | 41 (58.6%) | 0 (0.0%) |
| $50,000 to $99,999 | 5 (7.1%) | 0 (0.0%) |
| $100,000 to $299,999 | 24 (34.3%) | 7 (63.6%) |
| $300,000 to $499,999 | 0 (0.0%) | 4 (36.4%) |
| $500,000 to $749,999 | 0 (0.0%) | 0 (0.0%) |
| $750,000 to $999,999 | 0 (0.0%) | 0 (0.0%) |
| $1,000,000 or more | 0 (0.0%) | 0 (0.0%) |
| Total | 70 (100.0%) | 11 (100.0%) |
Household Income by Mortgage Status in Kwethluk
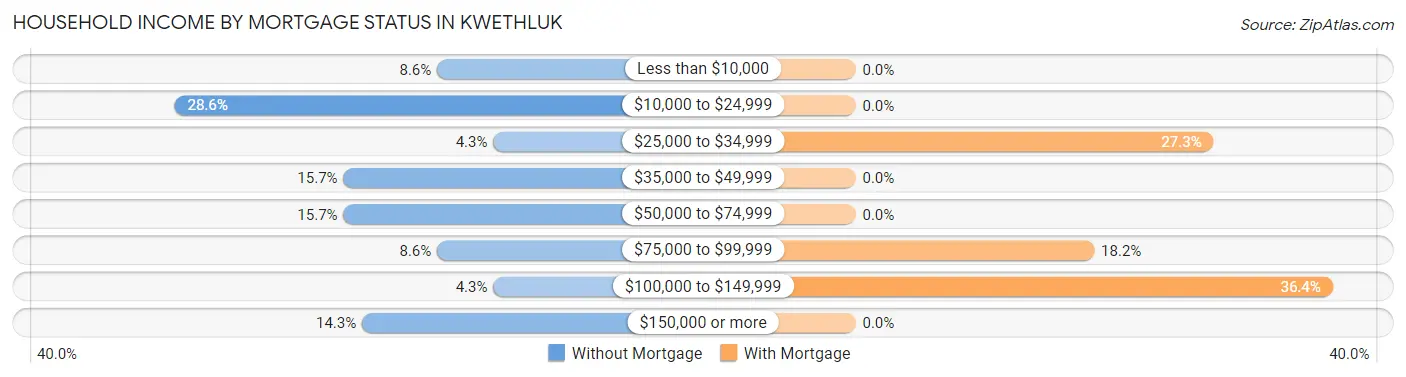
| Household Income | Without Mortgage | With Mortgage |
| Less than $10,000 | 6 (8.6%) | 0 (0.0%) |
| $10,000 to $24,999 | 20 (28.6%) | 0 (0.0%) |
| $25,000 to $34,999 | 3 (4.3%) | 3 (27.3%) |
| $35,000 to $49,999 | 11 (15.7%) | 0 (0.0%) |
| $50,000 to $74,999 | 11 (15.7%) | 0 (0.0%) |
| $75,000 to $99,999 | 6 (8.6%) | 2 (18.2%) |
| $100,000 to $149,999 | 3 (4.3%) | 4 (36.4%) |
| $150,000 or more | 10 (14.3%) | 0 (0.0%) |
| Total | 70 (100.0%) | 11 (100.0%) |
Property Value to Household Income Ratio in Kwethluk
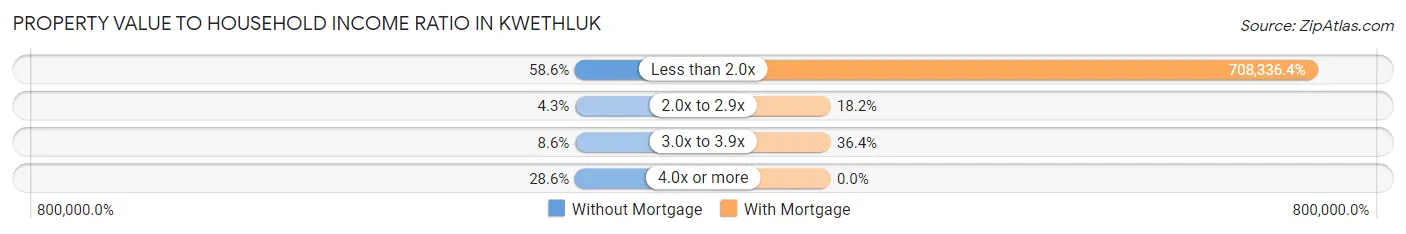
| Value-to-Income Ratio | Without Mortgage | With Mortgage |
| Less than 2.0x | 41 (58.6%) | 77,917 (708,336.4%) |
| 2.0x to 2.9x | 3 (4.3%) | 2 (18.2%) |
| 3.0x to 3.9x | 6 (8.6%) | 4 (36.4%) |
| 4.0x or more | 20 (28.6%) | 0 (0.0%) |
| Total | 70 (100.0%) | 11 (100.0%) |
Real Estate Taxes by Mortgage Status in Kwethluk
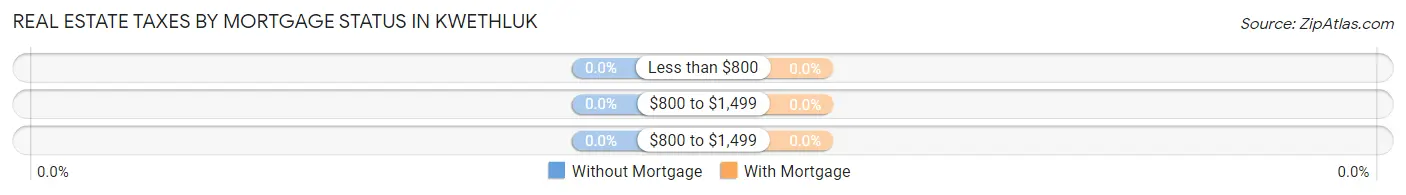
| Property Taxes | Without Mortgage | With Mortgage |
| Less than $800 | 0 (0.0%) | 0 (0.0%) |
| $800 to $1,499 | 0 (0.0%) | 0 (0.0%) |
| $800 to $1,499 | 0 (0.0%) | 0 (0.0%) |
| Total | 70 (100.0%) | 11 (100.0%) |
Health & Disability in Kwethluk
Health Insurance Coverage by Age in Kwethluk
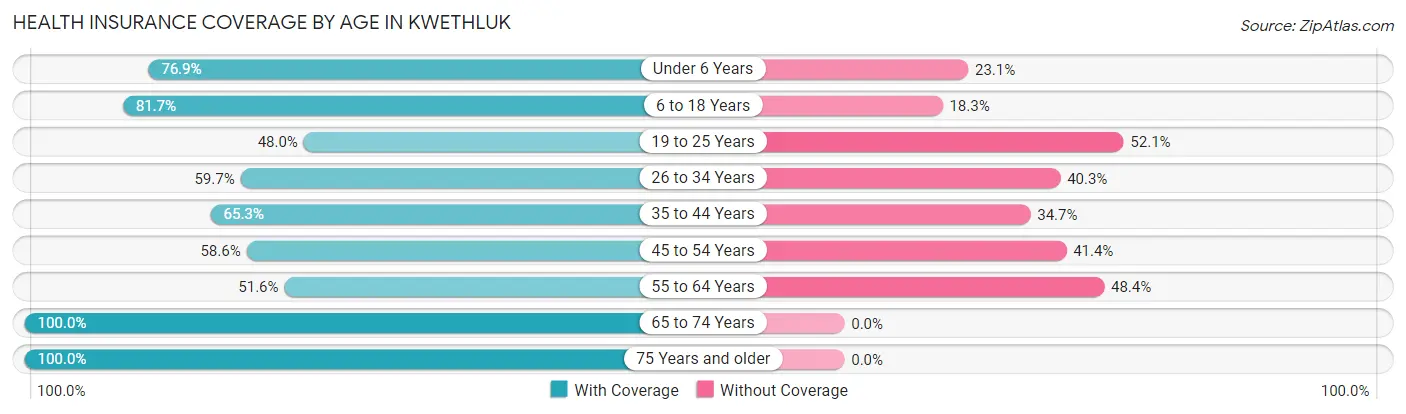
| Age Bracket | With Coverage | Without Coverage |
| Under 6 Years | 60 (76.9%) | 18 (23.1%) |
| 6 to 18 Years | 116 (81.7%) | 26 (18.3%) |
| 19 to 25 Years | 35 (47.9%) | 38 (52.0%) |
| 26 to 34 Years | 46 (59.7%) | 31 (40.3%) |
| 35 to 44 Years | 32 (65.3%) | 17 (34.7%) |
| 45 to 54 Years | 34 (58.6%) | 24 (41.4%) |
| 55 to 64 Years | 33 (51.6%) | 31 (48.4%) |
| 65 to 74 Years | 8 (100.0%) | 0 (0.0%) |
| 75 Years and older | 12 (100.0%) | 0 (0.0%) |
| Total | 376 (67.0%) | 185 (33.0%) |
Health Insurance Coverage by Citizenship Status in Kwethluk
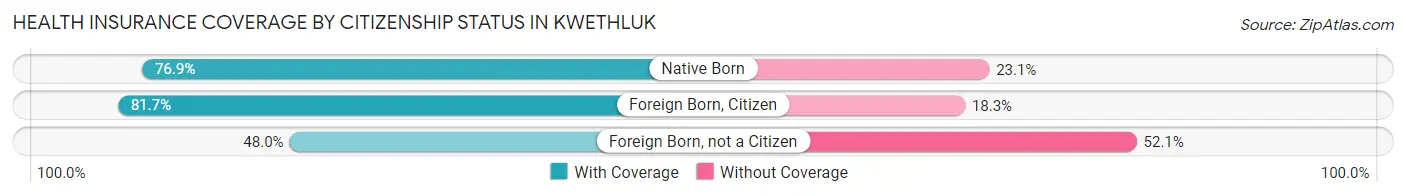
| Citizenship Status | With Coverage | Without Coverage |
| Native Born | 60 (76.9%) | 18 (23.1%) |
| Foreign Born, Citizen | 116 (81.7%) | 26 (18.3%) |
| Foreign Born, not a Citizen | 35 (47.9%) | 38 (52.0%) |
Health Insurance Coverage by Household Income in Kwethluk
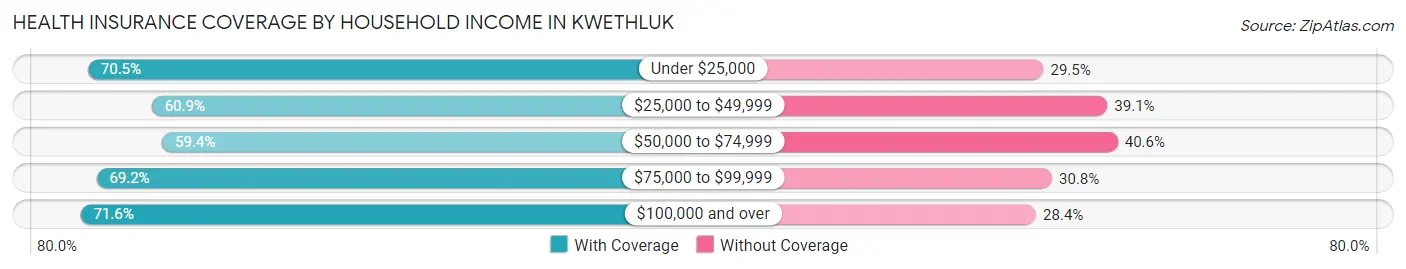
| Household Income | With Coverage | Without Coverage |
| Under $25,000 | 110 (70.5%) | 46 (29.5%) |
| $25,000 to $49,999 | 39 (60.9%) | 25 (39.1%) |
| $50,000 to $74,999 | 76 (59.4%) | 52 (40.6%) |
| $75,000 to $99,999 | 45 (69.2%) | 20 (30.8%) |
| $100,000 and over | 106 (71.6%) | 42 (28.4%) |
Public vs Private Health Insurance Coverage by Age in Kwethluk
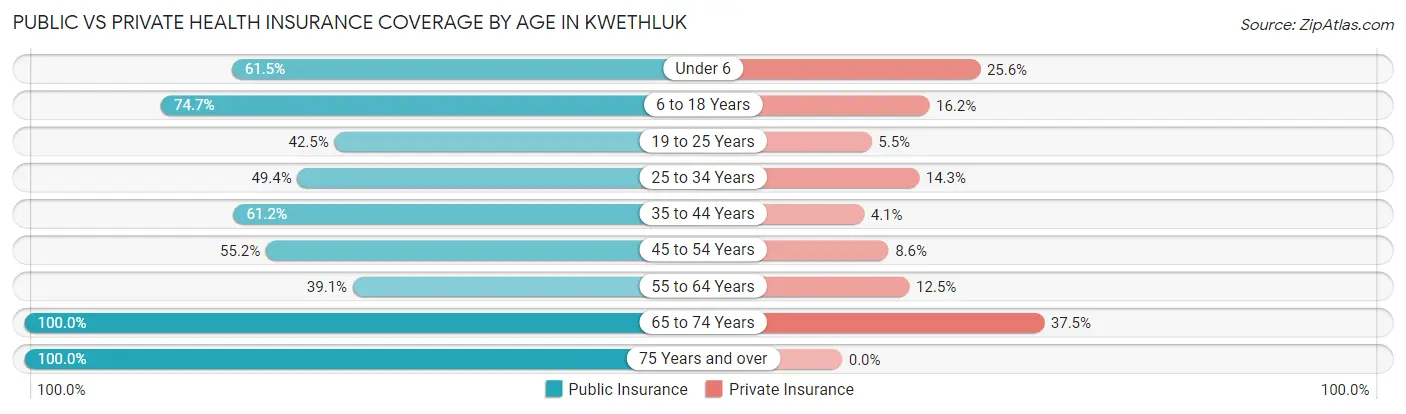
| Age Bracket | Public Insurance | Private Insurance |
| Under 6 | 48 (61.5%) | 20 (25.6%) |
| 6 to 18 Years | 106 (74.7%) | 23 (16.2%) |
| 19 to 25 Years | 31 (42.5%) | 4 (5.5%) |
| 25 to 34 Years | 38 (49.3%) | 11 (14.3%) |
| 35 to 44 Years | 30 (61.2%) | 2 (4.1%) |
| 45 to 54 Years | 32 (55.2%) | 5 (8.6%) |
| 55 to 64 Years | 25 (39.1%) | 8 (12.5%) |
| 65 to 74 Years | 8 (100.0%) | 3 (37.5%) |
| 75 Years and over | 12 (100.0%) | 0 (0.0%) |
| Total | 330 (58.8%) | 76 (13.6%) |
Disability Status by Sex by Age in Kwethluk
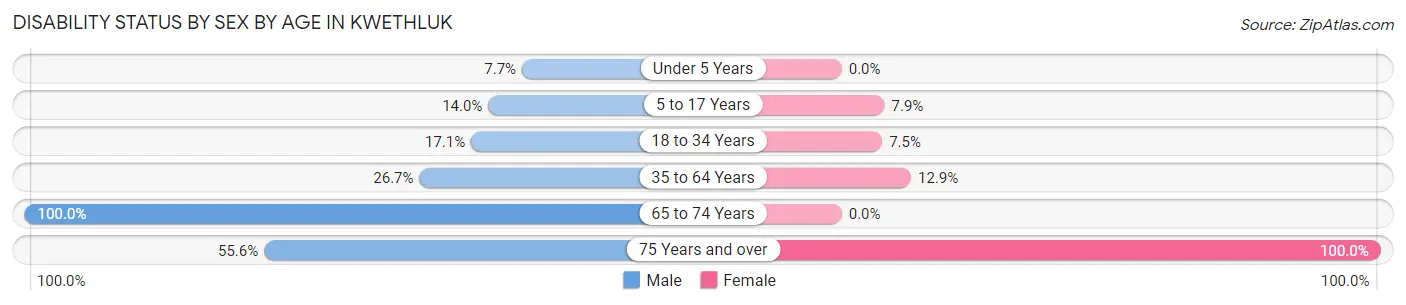
| Age Bracket | Male | Female |
| Under 5 Years | 3 (7.7%) | 0 (0.0%) |
| 5 to 17 Years | 12 (14.0%) | 5 (7.9%) |
| 18 to 34 Years | 12 (17.1%) | 6 (7.5%) |
| 35 to 64 Years | 27 (26.7%) | 9 (12.9%) |
| 65 to 74 Years | 3 (100.0%) | 0 (0.0%) |
| 75 Years and over | 5 (55.6%) | 3 (100.0%) |
Disability Class by Sex by Age in Kwethluk
Disability Class: Hearing Difficulty
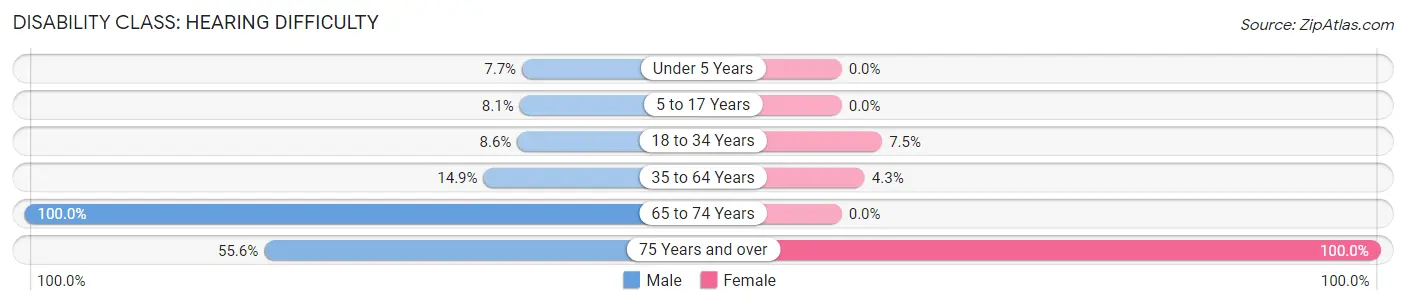
| Age Bracket | Male | Female |
| Under 5 Years | 3 (7.7%) | 0 (0.0%) |
| 5 to 17 Years | 7 (8.1%) | 0 (0.0%) |
| 18 to 34 Years | 6 (8.6%) | 6 (7.5%) |
| 35 to 64 Years | 15 (14.8%) | 3 (4.3%) |
| 65 to 74 Years | 3 (100.0%) | 0 (0.0%) |
| 75 Years and over | 5 (55.6%) | 3 (100.0%) |
Disability Class: Vision Difficulty
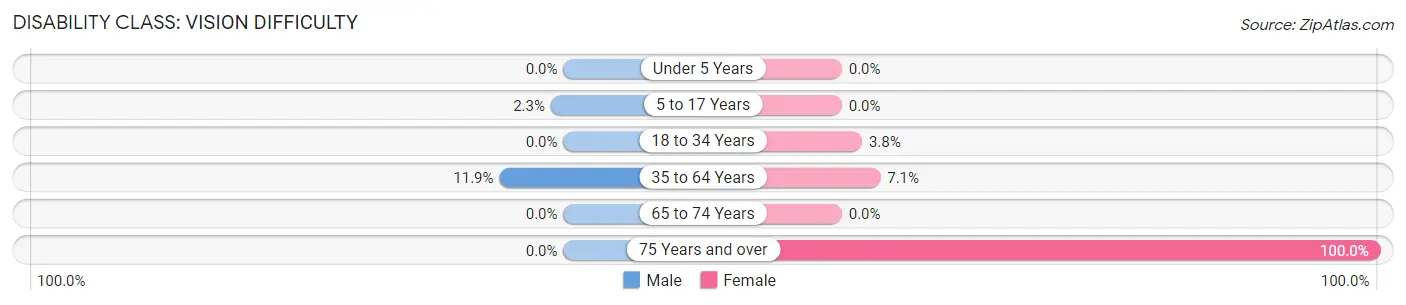
| Age Bracket | Male | Female |
| Under 5 Years | 0 (0.0%) | 0 (0.0%) |
| 5 to 17 Years | 2 (2.3%) | 0 (0.0%) |
| 18 to 34 Years | 0 (0.0%) | 3 (3.7%) |
| 35 to 64 Years | 12 (11.9%) | 5 (7.1%) |
| 65 to 74 Years | 0 (0.0%) | 0 (0.0%) |
| 75 Years and over | 0 (0.0%) | 3 (100.0%) |
Disability Class: Cognitive Difficulty
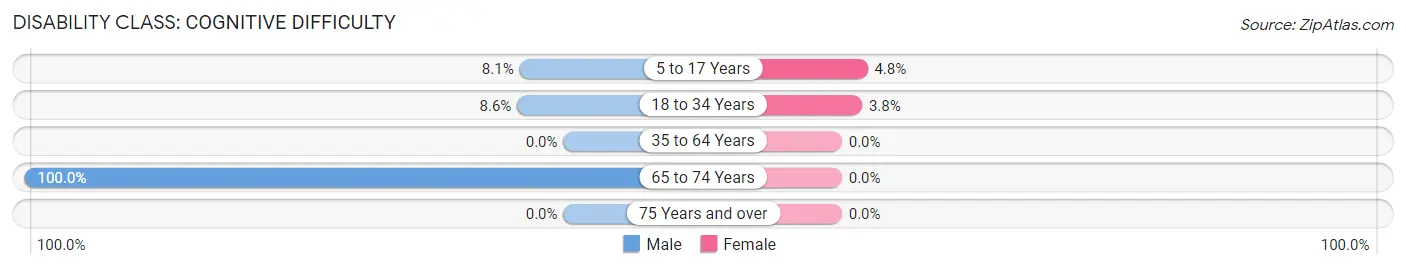
| Age Bracket | Male | Female |
| 5 to 17 Years | 7 (8.1%) | 3 (4.8%) |
| 18 to 34 Years | 6 (8.6%) | 3 (3.7%) |
| 35 to 64 Years | 0 (0.0%) | 0 (0.0%) |
| 65 to 74 Years | 3 (100.0%) | 0 (0.0%) |
| 75 Years and over | 0 (0.0%) | 0 (0.0%) |
Disability Class: Ambulatory Difficulty
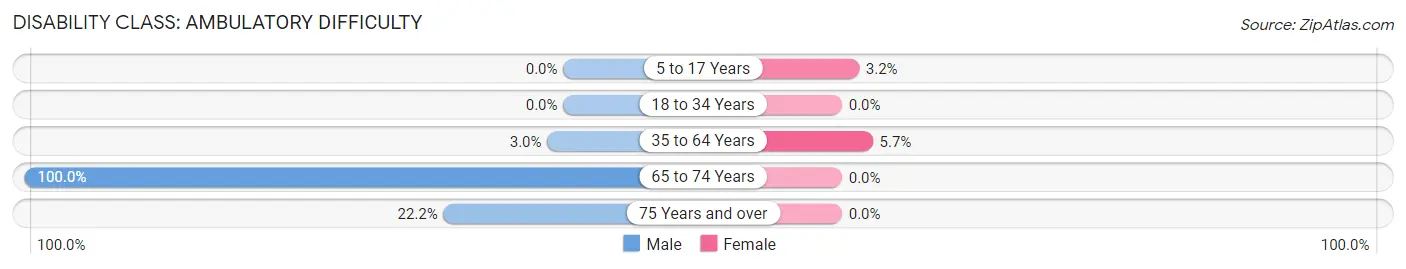
| Age Bracket | Male | Female |
| 5 to 17 Years | 0 (0.0%) | 2 (3.2%) |
| 18 to 34 Years | 0 (0.0%) | 0 (0.0%) |
| 35 to 64 Years | 3 (3.0%) | 4 (5.7%) |
| 65 to 74 Years | 3 (100.0%) | 0 (0.0%) |
| 75 Years and over | 2 (22.2%) | 0 (0.0%) |
Disability Class: Self-Care Difficulty
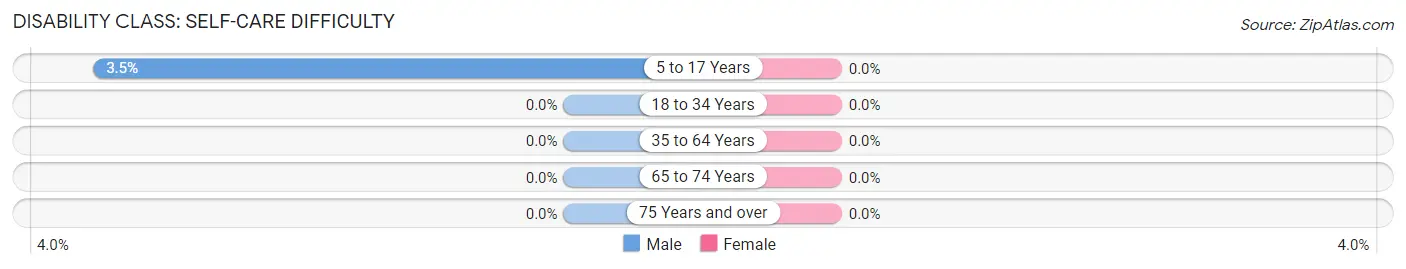
| Age Bracket | Male | Female |
| 5 to 17 Years | 3 (3.5%) | 0 (0.0%) |
| 18 to 34 Years | 0 (0.0%) | 0 (0.0%) |
| 35 to 64 Years | 0 (0.0%) | 0 (0.0%) |
| 65 to 74 Years | 0 (0.0%) | 0 (0.0%) |
| 75 Years and over | 0 (0.0%) | 0 (0.0%) |
Technology Access in Kwethluk
Computing Device Access in Kwethluk
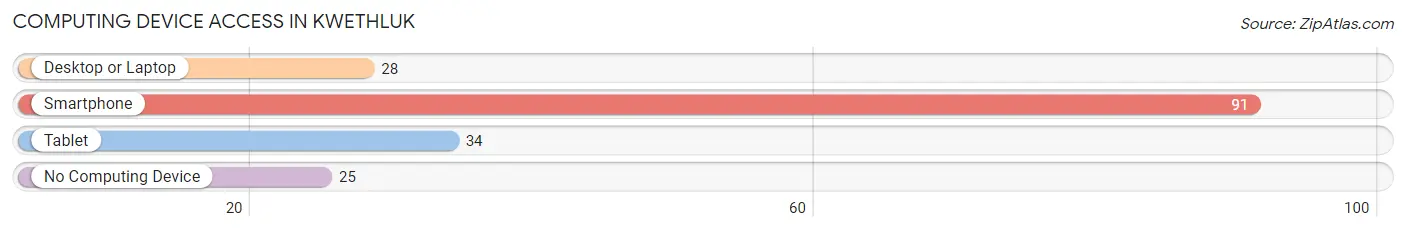
| Device Type | # Households | % Households |
| Desktop or Laptop | 28 | 24.1% |
| Smartphone | 91 | 78.4% |
| Tablet | 34 | 29.3% |
| No Computing Device | 25 | 21.5% |
| Total | 116 | 100.0% |
Internet Access in Kwethluk
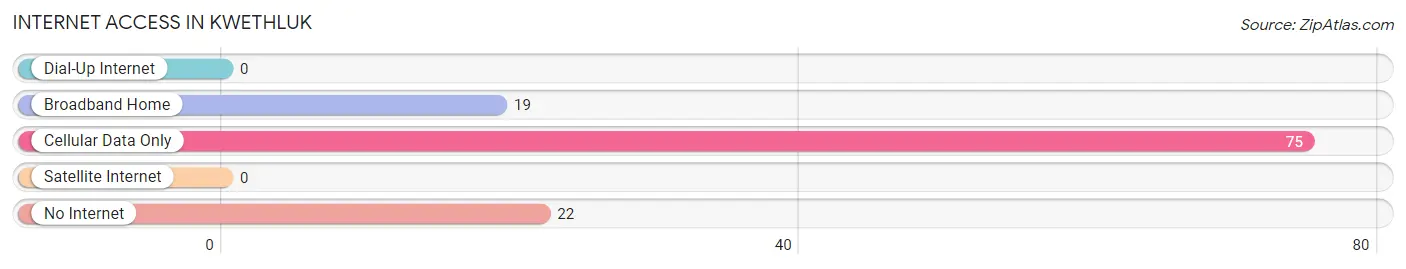
| Internet Type | # Households | % Households |
| Dial-Up Internet | 0 | 0.0% |
| Broadband Home | 19 | 16.4% |
| Cellular Data Only | 75 | 64.7% |
| Satellite Internet | 0 | 0.0% |
| No Internet | 22 | 19.0% |
| Total | 116 | 100.0% |
Kwethluk Summary
Kwethluk is a city located in the Bethel Census Area of Alaska, United States. It is situated on the banks of the Kuskokwim River, about 40 miles (64 km) upstream from Bethel. The population of Kwethluk was 745 at the 2010 census, up from 690 in 2000.
History
Kwethluk was originally inhabited by Yup'ik Eskimos, who called the area “Kwethluk”, meaning “big river”. The first non-native settlers arrived in the area in the late 1800s, and the town was officially established in 1901. The town was named after the nearby Kwethluk River, which was named by the explorer Captain James Cook in 1778.
In the early 1900s, the town was a major trading center for the region, and it was also a hub for riverboat traffic. In the 1920s, the Alaska Railroad was built, connecting the town to the rest of the state.
In the 1950s, the town was connected to the rest of the state by the Alaska Highway. In the 1960s, the town was connected to the rest of the state by the Alaska Marine Highway.
Geography
Kwethluk is located at the mouth of the Kuskokwim River, about 40 miles (64 km) upstream from Bethel. The town is situated on a flat plain, surrounded by hills and mountains. The climate is subarctic, with cold winters and mild summers.
The town is located in the Bethel Census Area of Alaska, and is part of the Yukon-Kuskokwim Delta. The nearest major city is Bethel, located about 40 miles (64 km) to the south.
Economy
Kwethluk’s economy is largely based on subsistence fishing and hunting. The town is also home to a number of small businesses, including a grocery store, a hardware store, and a restaurant.
The town is also home to a number of government offices, including the Kwethluk Tribal Council, the Kwethluk School District, and the Kwethluk Clinic.
Demographics
As of the 2010 census, the population of Kwethluk was 745, up from 690 in 2000. The racial makeup of the town was 95.3% Native American, 2.7% White, 0.3% Asian, and 1.7% from two or more races.
The median household income in Kwethluk was $25,000, and the median family income was $30,000. The per capita income was $13,000. About 24.3% of the population was below the poverty line.
Conclusion
Kwethluk is a small city located in the Bethel Census Area of Alaska. It is situated on the banks of the Kuskokwim River, about 40 miles (64 km) upstream from Bethel. The population of Kwethluk was 745 at the 2010 census, up from 690 in 2000. The town’s economy is largely based on subsistence fishing and hunting, and it is also home to a number of small businesses. The racial makeup of the town was 95.3% Native American, 2.7% White, 0.3% Asian, and 1.7% from two or more races. The median household income in Kwethluk was $25,000, and the median family income was $30,000. The per capita income was $13,000. About 24.3% of the population was below the poverty line.
Common Questions
What is Per Capita Income in Kwethluk?
Per Capita income in Kwethluk is $13,189.
What is the Median Family Income in Kwethluk?
Median Family Income in Kwethluk is $46,667.
What is the Median Household income in Kwethluk?
Median Household Income in Kwethluk is $43,750.
What is Income or Wage Gap in Kwethluk?
Income or Wage Gap in Kwethluk is 10.9%.
Women in Kwethluk earn 89.1 cents for every dollar earned by a man.
What is Family Income Deficit in Kwethluk?
Family Income Deficit in Kwethluk is $13,993.
Families that are below poverty line in Kwethluk earn $13,993 less on average than the poverty threshold level.
What is Inequality or Gini Index in Kwethluk?
Inequality or Gini Index in Kwethluk is 0.48.
What is the Total Population of Kwethluk?
Total Population of Kwethluk is 561.
What is the Total Male Population of Kwethluk?
Total Male Population of Kwethluk is 308.
What is the Total Female Population of Kwethluk?
Total Female Population of Kwethluk is 253.
What is the Ratio of Males per 100 Females in Kwethluk?
There are 121.74 Males per 100 Females in Kwethluk.
What is the Ratio of Females per 100 Males in Kwethluk?
There are 82.14 Females per 100 Males in Kwethluk.
What is the Median Population Age in Kwethluk?
Median Population Age in Kwethluk is 24.7 Years.
What is the Average Family Size in Kwethluk
Average Family Size in Kwethluk is 5.3 People.
What is the Average Household Size in Kwethluk
Average Household Size in Kwethluk is 4.8 People.
How Large is the Labor Force in Kwethluk?
There are 180 People in the Labor Forcein in Kwethluk.
What is the Percentage of People in the Labor Force in Kwethluk?
48.1% of People are in the Labor Force in Kwethluk.
What is the Unemployment Rate in Kwethluk?
Unemployment Rate in Kwethluk is 15.6%.