King Salmon, AK Map & Demographics
King Salmon Map
King Salmon Overview
$49,567
PER CAPITA INCOME
$112,222
AVG FAMILY INCOME
$115,625
AVG HOUSEHOLD INCOME
31.1%
WAGE / INCOME GAP [ % ]
68.9¢/ $1
WAGE / INCOME GAP [ $ ]
0.39
INEQUALITY / GINI INDEX
383
TOTAL POPULATION
202
MALE POPULATION
181
FEMALE POPULATION
111.60
MALES / 100 FEMALES
89.60
FEMALES / 100 MALES
36.1
MEDIAN AGE
3.2
AVG FAMILY SIZE
2.8
AVG HOUSEHOLD SIZE
226
LABOR FORCE [ PEOPLE ]
75.1%
PERCENT IN LABOR FORCE
2.8%
UNEMPLOYMENT RATE
King Salmon Zip Codes
King Salmon Area Codes
Income in King Salmon
Income Overview in King Salmon
Per Capita Income in King Salmon is $49,567, while median incomes of families and households are $112,222 and $115,625 respectively.
| Characteristic | Number | Measure |
| Per Capita Income | 383 | $49,567 |
| Median Family Income | 94 | $112,222 |
| Mean Family Income | 94 | $152,667 |
| Median Household Income | 126 | $115,625 |
| Mean Household Income | 126 | $134,910 |
| Income Deficit | 94 | $0 |
| Wage / Income Gap (%) | 383 | 31.12% |
| Wage / Income Gap ($) | 383 | 68.88¢ per $1 |
| Gini / Inequality Index | 383 | 0.39 |
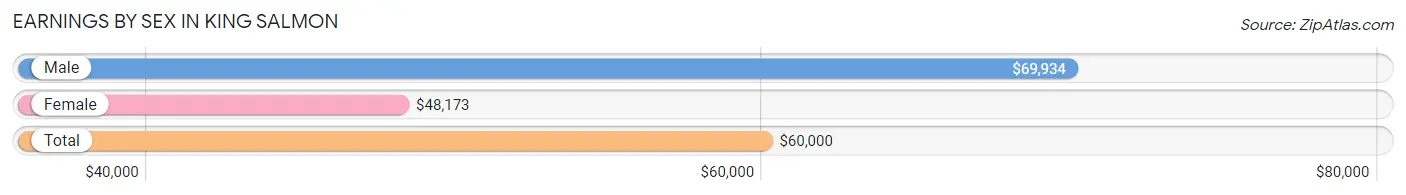
Earnings by Sex in King Salmon
Average Earnings in King Salmon are $60,000, $69,934 for men and $48,173 for women, a difference of 31.1%.
| Sex | Number | Average Earnings |
| Male | 113 (47.9%) | $69,934 |
| Female | 123 (52.1%) | $48,173 |
| Total | 236 (100.0%) | $60,000 |
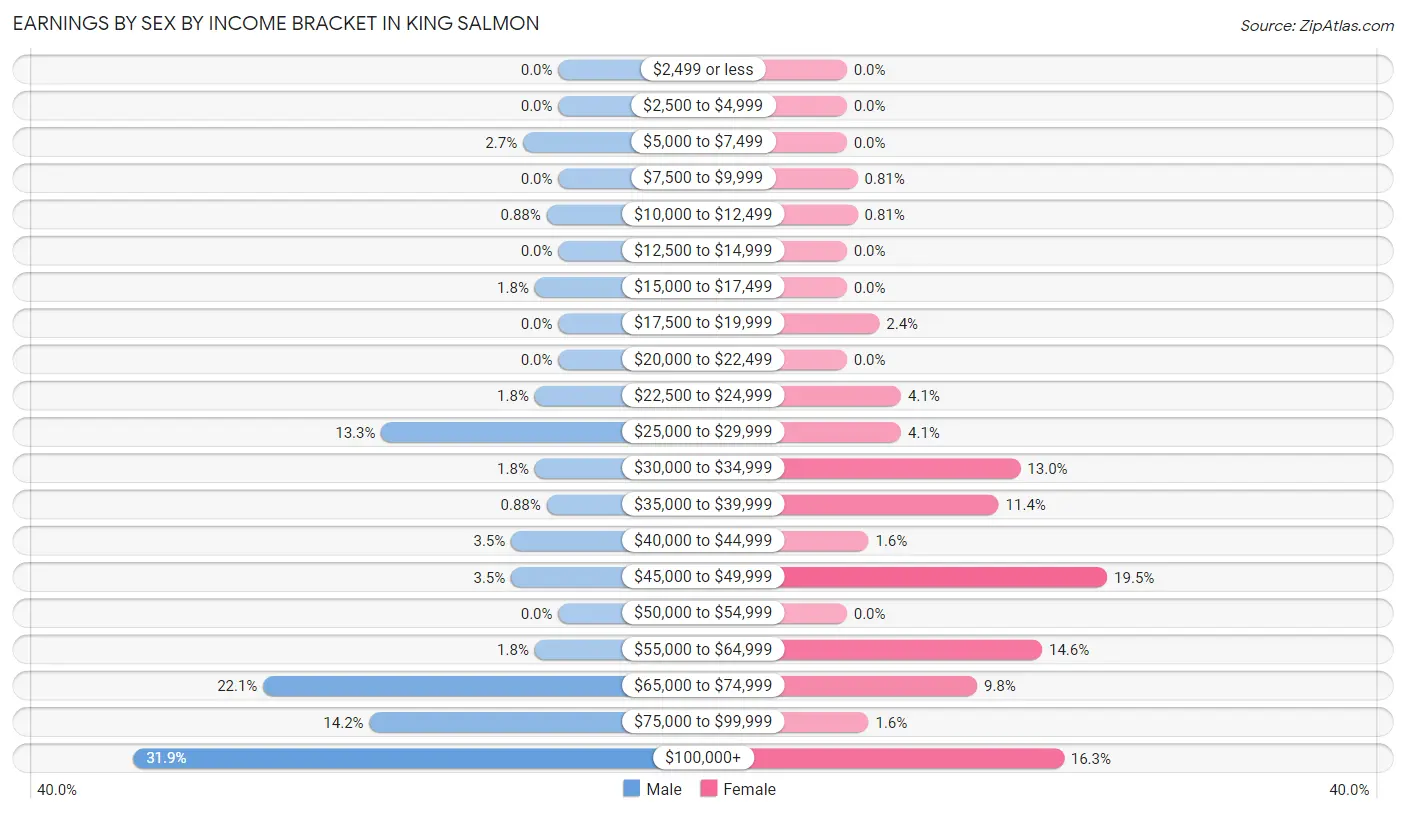
Earnings by Sex by Income Bracket in King Salmon
The most common earnings brackets in King Salmon are $100,000+ for men (36 | 31.9%) and $45,000 to $49,999 for women (24 | 19.5%).
| Income | Male | Female |
| $2,499 or less | 0 (0.0%) | 0 (0.0%) |
| $2,500 to $4,999 | 0 (0.0%) | 0 (0.0%) |
| $5,000 to $7,499 | 3 (2.6%) | 0 (0.0%) |
| $7,500 to $9,999 | 0 (0.0%) | 1 (0.8%) |
| $10,000 to $12,499 | 1 (0.9%) | 1 (0.8%) |
| $12,500 to $14,999 | 0 (0.0%) | 0 (0.0%) |
| $15,000 to $17,499 | 2 (1.8%) | 0 (0.0%) |
| $17,500 to $19,999 | 0 (0.0%) | 3 (2.4%) |
| $20,000 to $22,499 | 0 (0.0%) | 0 (0.0%) |
| $22,500 to $24,999 | 2 (1.8%) | 5 (4.1%) |
| $25,000 to $29,999 | 15 (13.3%) | 5 (4.1%) |
| $30,000 to $34,999 | 2 (1.8%) | 16 (13.0%) |
| $35,000 to $39,999 | 1 (0.9%) | 14 (11.4%) |
| $40,000 to $44,999 | 4 (3.5%) | 2 (1.6%) |
| $45,000 to $49,999 | 4 (3.5%) | 24 (19.5%) |
| $50,000 to $54,999 | 0 (0.0%) | 0 (0.0%) |
| $55,000 to $64,999 | 2 (1.8%) | 18 (14.6%) |
| $65,000 to $74,999 | 25 (22.1%) | 12 (9.8%) |
| $75,000 to $99,999 | 16 (14.2%) | 2 (1.6%) |
| $100,000+ | 36 (31.9%) | 20 (16.3%) |
| Total | 113 (100.0%) | 123 (100.0%) |
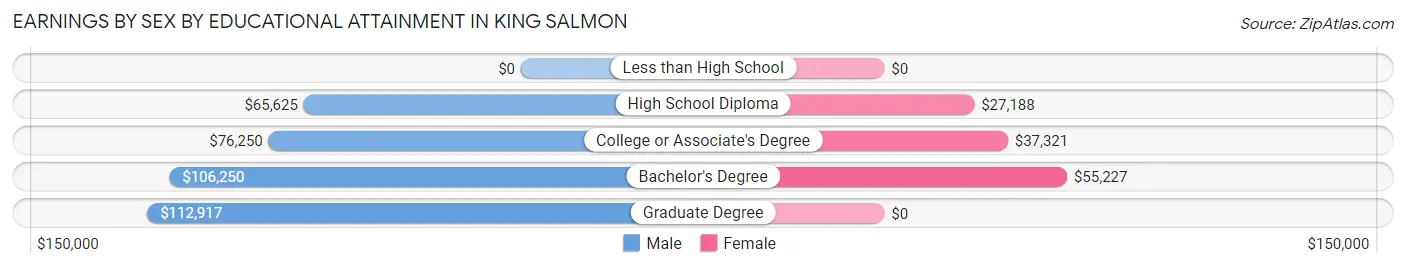
Earnings by Sex by Educational Attainment in King Salmon
Average earnings in King Salmon are $80,750 for men and $48,750 for women, a difference of 39.6%. Men with an educational attainment of graduate degree enjoy the highest average annual earnings of $112,917, while those with high school diploma education earn the least with $65,625. Women with an educational attainment of bachelor's degree earn the most with the average annual earnings of $55,227, while those with high school diploma education have the smallest earnings of $27,188.
| Educational Attainment | Male Income | Female Income |
| Less than High School | - | - |
| High School Diploma | $65,625 | $27,188 |
| College or Associate's Degree | $76,250 | $37,321 |
| Bachelor's Degree | $106,250 | $55,227 |
| Graduate Degree | $112,917 | $0 |
| Total | $80,750 | $48,750 |
Family Income in King Salmon
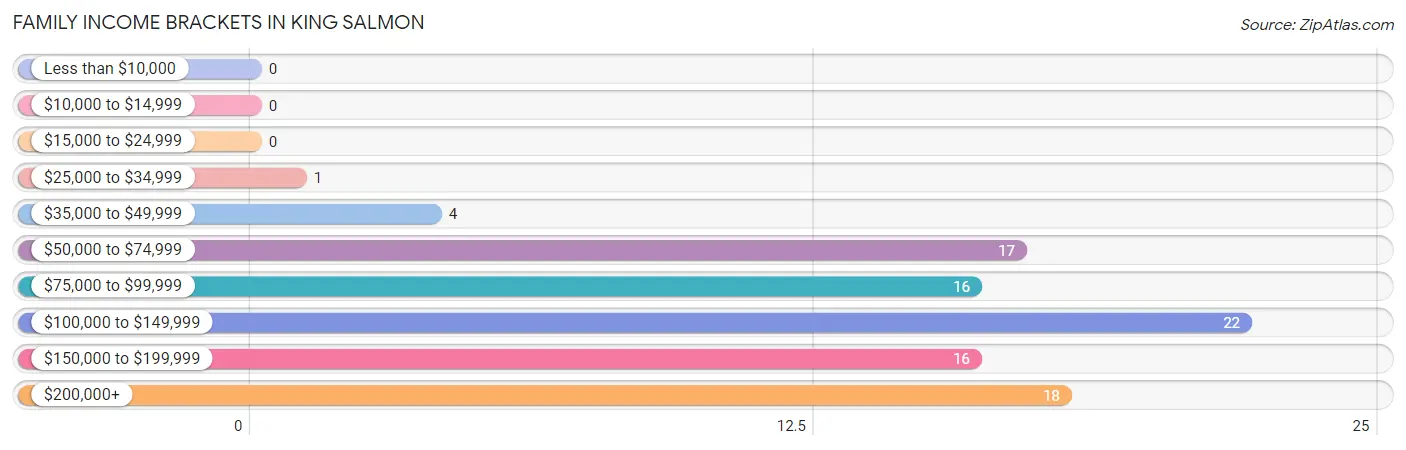
Family Income Brackets in King Salmon
According to the King Salmon family income data, there are 22 families falling into the $100,000 to $149,999 income range, which is the most common income bracket and makes up 23.4% of all families.
| Income Bracket | # Families | % Families |
| Less than $10,000 | 0 | 0.0% |
| $10,000 to $14,999 | 0 | 0.0% |
| $15,000 to $24,999 | 0 | 0.0% |
| $25,000 to $34,999 | 1 | 1.1% |
| $35,000 to $49,999 | 4 | 4.3% |
| $50,000 to $74,999 | 17 | 18.1% |
| $75,000 to $99,999 | 16 | 17.0% |
| $100,000 to $149,999 | 22 | 23.4% |
| $150,000 to $199,999 | 16 | 17.0% |
| $200,000+ | 18 | 19.1% |
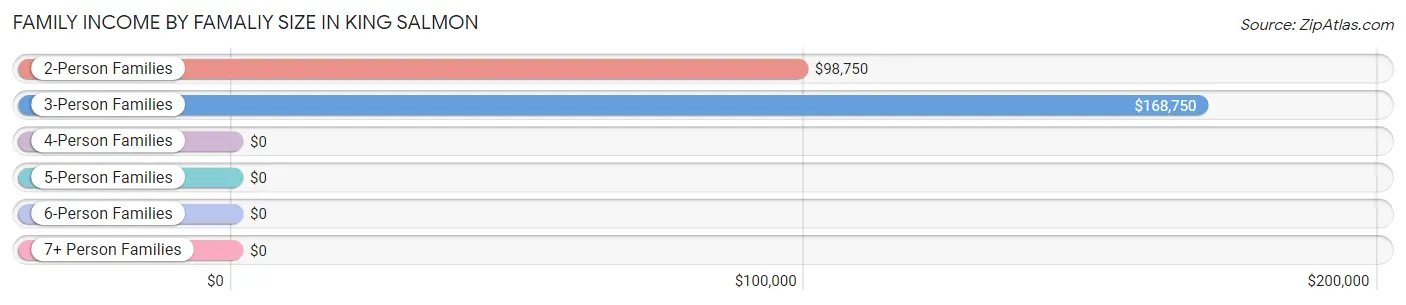
Family Income by Famaliy Size in King Salmon
3-person families (12 | 12.8%) account for the highest median family income in King Salmon with $168,750 per family, while 3-person families (12 | 12.8%) have the highest median income of $56,250 per family member.
| Income Bracket | # Families | Median Income |
| 2-Person Families | 60 (63.8%) | $98,750 |
| 3-Person Families | 12 (12.8%) | $168,750 |
| 4-Person Families | 16 (17.0%) | $0 |
| 5-Person Families | 0 (0.0%) | $0 |
| 6-Person Families | 2 (2.1%) | $0 |
| 7+ Person Families | 4 (4.3%) | $0 |
| Total | 94 (100.0%) | $112,222 |
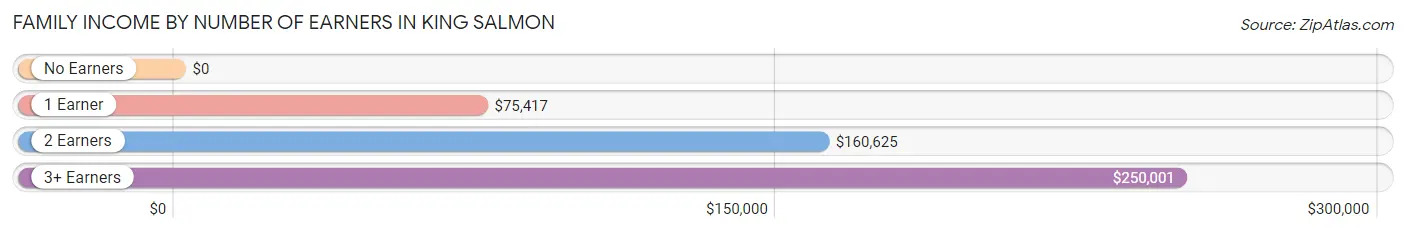
Family Income by Number of Earners in King Salmon
| Number of Earners | # Families | Median Income |
| No Earners | 7 (7.4%) | $0 |
| 1 Earner | 31 (33.0%) | $75,417 |
| 2 Earners | 41 (43.6%) | $160,625 |
| 3+ Earners | 15 (16.0%) | $250,001 |
| Total | 94 (100.0%) | $112,222 |
Household Income in King Salmon
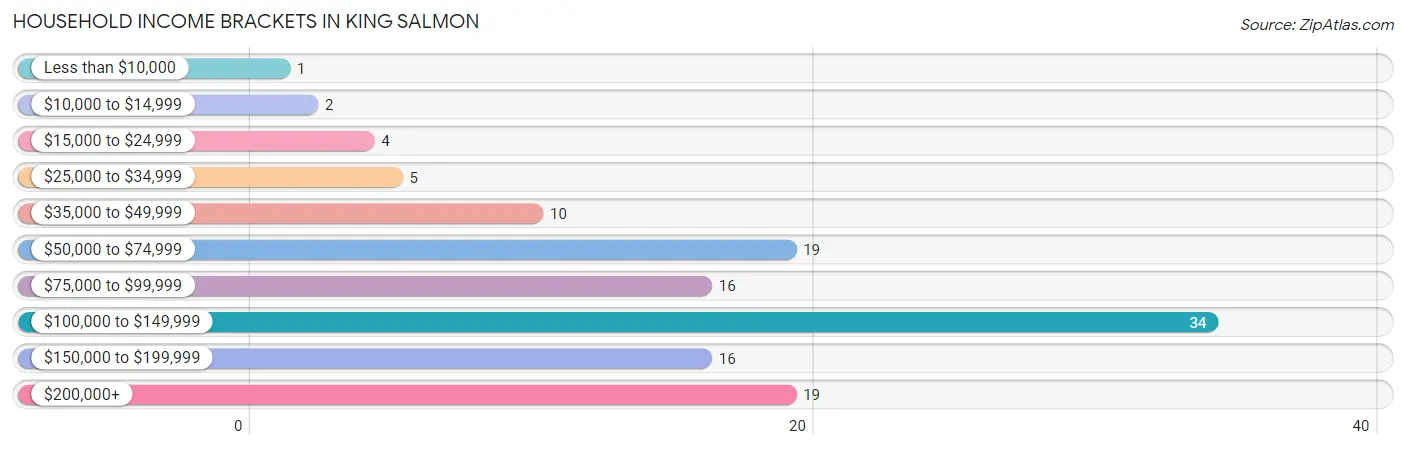
Household Income Brackets in King Salmon
With 34 households falling in the category, the $100,000 to $149,999 income range is the most frequent in King Salmon, accounting for 27.0% of all households. In contrast, only 1 households (0.8%) fall into the less than $10,000 income bracket, making it the least populous group.
| Income Bracket | # Households | % Households |
| Less than $10,000 | 1 | 0.8% |
| $10,000 to $14,999 | 2 | 1.6% |
| $15,000 to $24,999 | 4 | 3.2% |
| $25,000 to $34,999 | 5 | 4.0% |
| $35,000 to $49,999 | 10 | 7.9% |
| $50,000 to $74,999 | 19 | 15.1% |
| $75,000 to $99,999 | 16 | 12.7% |
| $100,000 to $149,999 | 34 | 27.0% |
| $150,000 to $199,999 | 16 | 12.7% |
| $200,000+ | 19 | 15.1% |
Household Income by Householder Age in King Salmon
The median household income in King Salmon is $115,625, with the highest median household income of $131,136 found in the 25 to 44 years age bracket for the primary householder. A total of 46 households (36.5%) fall into this category.
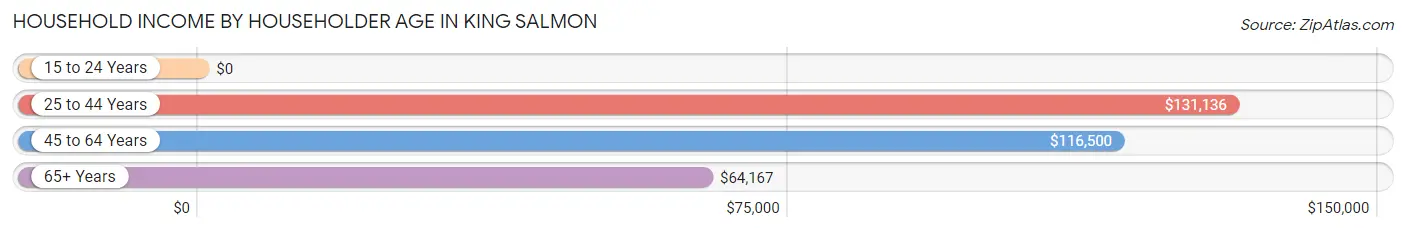
| Income Bracket | # Households | Median Income |
| 15 to 24 Years | 0 (0.0%) | $0 |
| 25 to 44 Years | 46 (36.5%) | $131,136 |
| 45 to 64 Years | 62 (49.2%) | $116,500 |
| 65+ Years | 18 (14.3%) | $64,167 |
| Total | 126 (100.0%) | $115,625 |
Poverty in King Salmon
Income Below Poverty by Sex and Age in King Salmon
With 0.5% poverty level for males and 1.7% for females among the residents of King Salmon, 55 to 64 year old males and 65 to 74 year old females are the most vulnerable to poverty, with 1 males (2.9%) and 2 females (15.4%) in their respective age groups living below the poverty level.
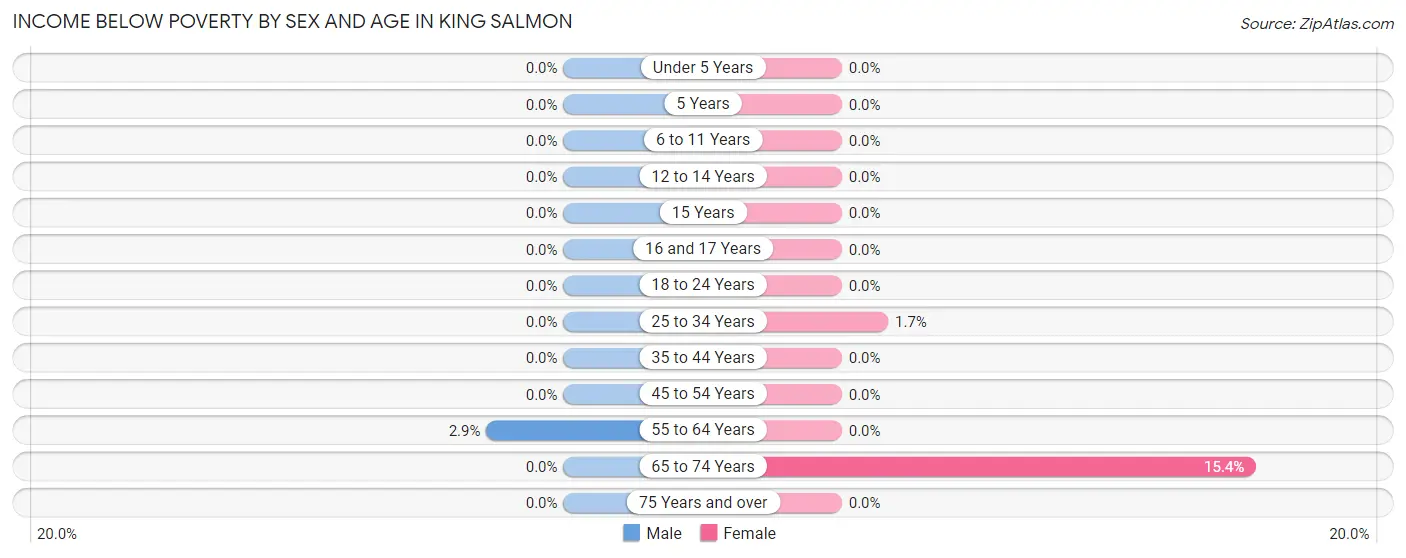
| Age Bracket | Male | Female |
| Under 5 Years | 0 (0.0%) | 0 (0.0%) |
| 5 Years | 0 (0.0%) | 0 (0.0%) |
| 6 to 11 Years | 0 (0.0%) | 0 (0.0%) |
| 12 to 14 Years | 0 (0.0%) | 0 (0.0%) |
| 15 Years | 0 (0.0%) | 0 (0.0%) |
| 16 and 17 Years | 0 (0.0%) | 0 (0.0%) |
| 18 to 24 Years | 0 (0.0%) | 0 (0.0%) |
| 25 to 34 Years | 0 (0.0%) | 1 (1.7%) |
| 35 to 44 Years | 0 (0.0%) | 0 (0.0%) |
| 45 to 54 Years | 0 (0.0%) | 0 (0.0%) |
| 55 to 64 Years | 1 (2.9%) | 0 (0.0%) |
| 65 to 74 Years | 0 (0.0%) | 2 (15.4%) |
| 75 Years and over | 0 (0.0%) | 0 (0.0%) |
| Total | 1 (0.5%) | 3 (1.7%) |
Income Above Poverty by Sex and Age in King Salmon
According to the poverty statistics in King Salmon, males aged under 5 years and females aged under 5 years are the age groups that are most secure financially, with 100.0% of males and 100.0% of females in these age groups living above the poverty line.
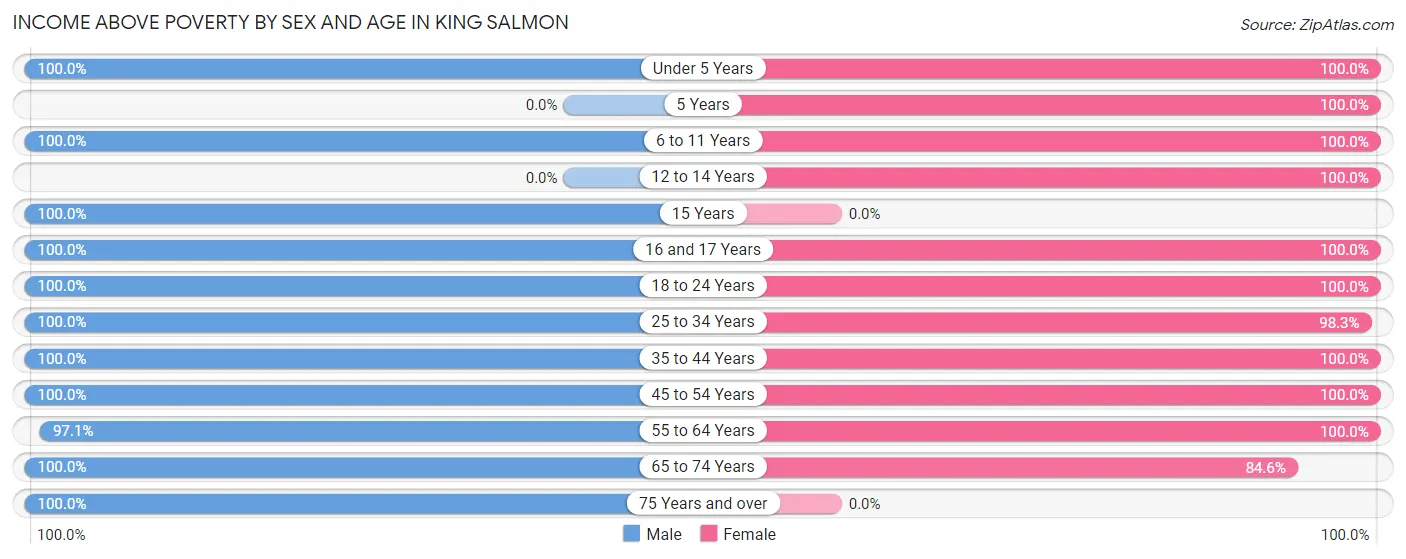
| Age Bracket | Male | Female |
| Under 5 Years | 37 (100.0%) | 8 (100.0%) |
| 5 Years | 0 (0.0%) | 6 (100.0%) |
| 6 to 11 Years | 4 (100.0%) | 13 (100.0%) |
| 12 to 14 Years | 0 (0.0%) | 1 (100.0%) |
| 15 Years | 9 (100.0%) | 0 (0.0%) |
| 16 and 17 Years | 3 (100.0%) | 6 (100.0%) |
| 18 to 24 Years | 16 (100.0%) | 5 (100.0%) |
| 25 to 34 Years | 8 (100.0%) | 57 (98.3%) |
| 35 to 44 Years | 28 (100.0%) | 26 (100.0%) |
| 45 to 54 Years | 16 (100.0%) | 21 (100.0%) |
| 55 to 64 Years | 34 (97.1%) | 23 (100.0%) |
| 65 to 74 Years | 19 (100.0%) | 11 (84.6%) |
| 75 Years and over | 14 (100.0%) | 0 (0.0%) |
| Total | 188 (99.5%) | 177 (98.3%) |
Income Below Poverty Among Married-Couple Families in King Salmon
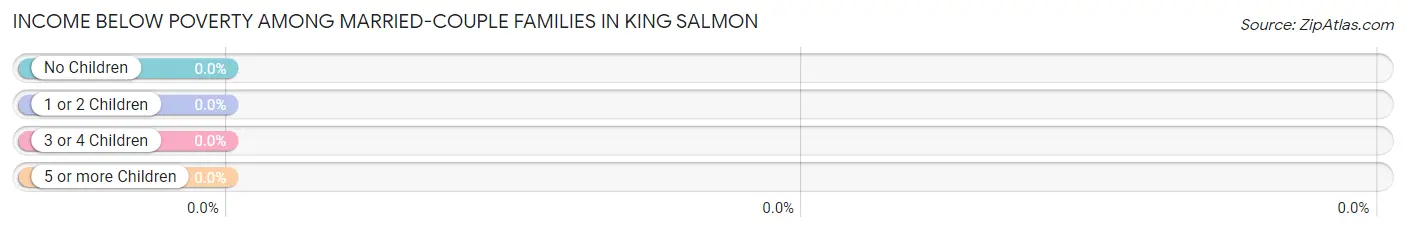
| Children | Above Poverty | Below Poverty |
| No Children | 63 (100.0%) | 0 (0.0%) |
| 1 or 2 Children | 19 (100.0%) | 0 (0.0%) |
| 3 or 4 Children | 2 (100.0%) | 0 (0.0%) |
| 5 or more Children | 4 (100.0%) | 0 (0.0%) |
| Total | 88 (100.0%) | 0 (0.0%) |
Income Below Poverty Among Single-Parent Households in King Salmon
| Children | Single Father | Single Mother |
| No Children | 0 (0.0%) | 0 (0.0%) |
| 1 or 2 Children | 0 (0.0%) | 0 (0.0%) |
| 3 or 4 Children | 0 (0.0%) | 0 (0.0%) |
| 5 or more Children | 0 (0.0%) | 0 (0.0%) |
| Total | 0 (0.0%) | 0 (0.0%) |
Income Below Poverty Among Married-Couple vs Single-Parent Households in King Salmon
| Children | Married-Couple Families | Single-Parent Households |
| No Children | 0 (0.0%) | 0 (0.0%) |
| 1 or 2 Children | 0 (0.0%) | 0 (0.0%) |
| 3 or 4 Children | 0 (0.0%) | 0 (0.0%) |
| 5 or more Children | 0 (0.0%) | 0 (0.0%) |
| Total | 0 (0.0%) | 0 (0.0%) |
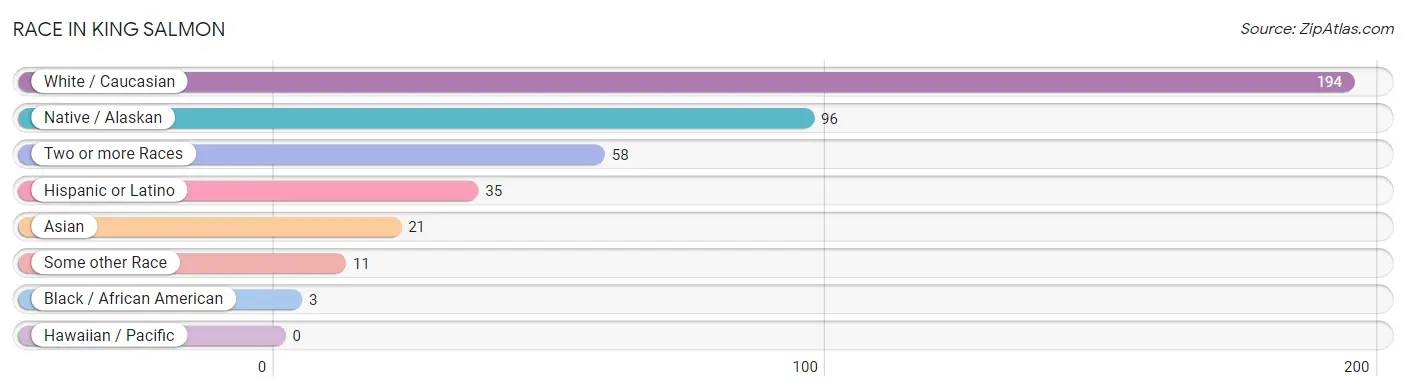
Race in King Salmon
The most populous races in King Salmon are White / Caucasian (194 | 50.6%), Native / Alaskan (96 | 25.1%), and Two or more Races (58 | 15.1%).
| Race | # Population | % Population |
| Asian | 21 | 5.5% |
| Black / African American | 3 | 0.8% |
| Hawaiian / Pacific | 0 | 0.0% |
| Hispanic or Latino | 35 | 9.1% |
| Native / Alaskan | 96 | 25.1% |
| White / Caucasian | 194 | 50.6% |
| Two or more Races | 58 | 15.1% |
| Some other Race | 11 | 2.9% |
| Total | 383 | 100.0% |
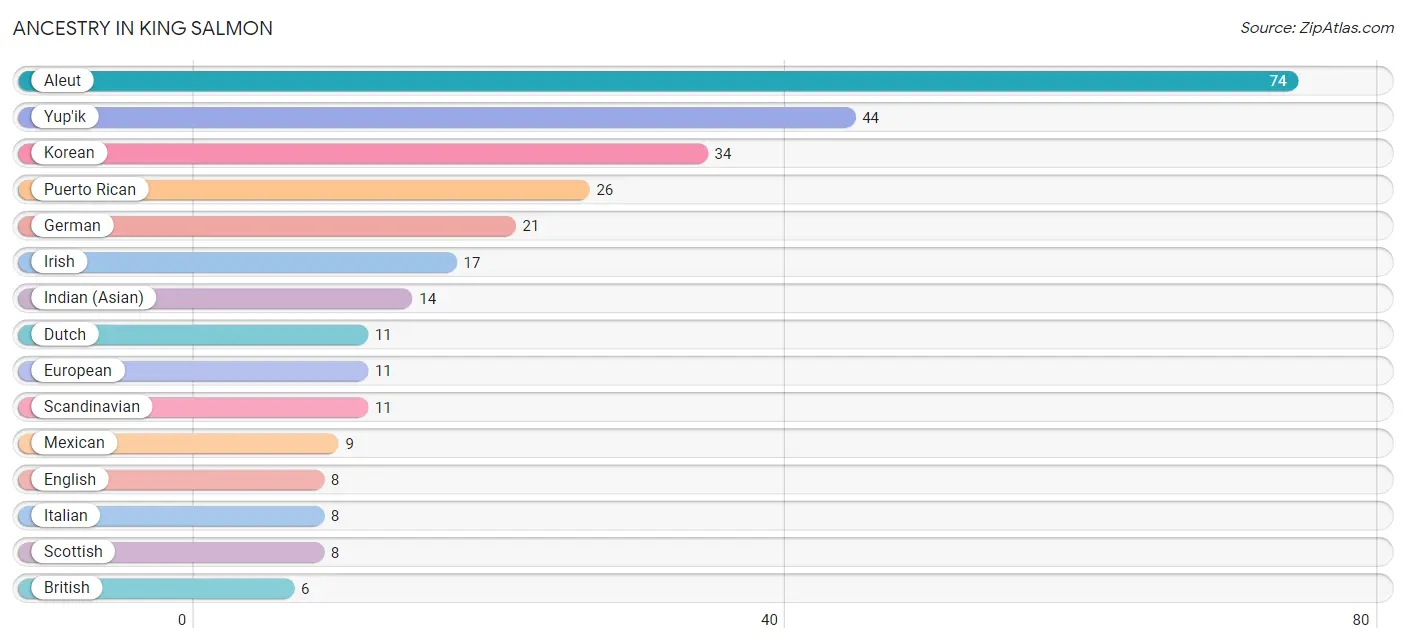
Ancestry in King Salmon
The most populous ancestries reported in King Salmon are Aleut (74 | 19.3%), Yup'ik (44 | 11.5%), Korean (34 | 8.9%), Puerto Rican (26 | 6.8%), and German (21 | 5.5%), together accounting for 52.0% of all King Salmon residents.
| Ancestry | # Population | % Population |
| Alaskan Athabascan | 3 | 0.8% |
| Aleut | 74 | 19.3% |
| American | 3 | 0.8% |
| Bhutanese | 1 | 0.3% |
| British | 6 | 1.6% |
| Cherokee | 1 | 0.3% |
| Czech | 5 | 1.3% |
| Dutch | 11 | 2.9% |
| English | 8 | 2.1% |
| European | 11 | 2.9% |
| French | 2 | 0.5% |
| German | 21 | 5.5% |
| Indian (Asian) | 14 | 3.7% |
| Inupiat | 6 | 1.6% |
| Irish | 17 | 4.4% |
| Italian | 8 | 2.1% |
| Korean | 34 | 8.9% |
| Mexican | 9 | 2.4% |
| Norwegian | 4 | 1.0% |
| Polish | 3 | 0.8% |
| Puerto Rican | 26 | 6.8% |
| Russian | 4 | 1.0% |
| Scandinavian | 11 | 2.9% |
| Scottish | 8 | 2.1% |
| Welsh | 1 | 0.3% |
| Yup'ik | 44 | 11.5% | View All 26 Rows |
Immigrants in King Salmon
The most numerous immigrant groups reported in King Salmon came from Asia (11 | 2.9%), Philippines (11 | 2.9%), and South Eastern Asia (11 | 2.9%), together accounting for 8.6% of all King Salmon residents.
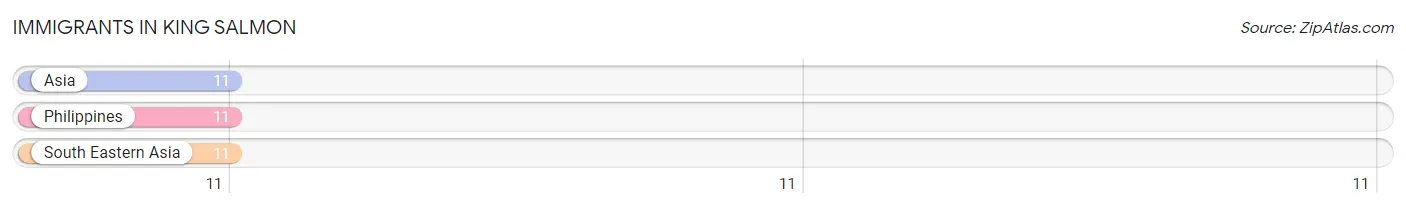
| Immigration Origin | # Population | % Population |
| Asia | 11 | 2.9% |
| Philippines | 11 | 2.9% |
| South Eastern Asia | 11 | 2.9% | View All 3 Rows |
Sex and Age in King Salmon
Sex and Age in King Salmon
The most populous age groups in King Salmon are Under 5 Years (39 | 19.3%) for men and 30 to 34 Years (37 | 20.4%) for women.
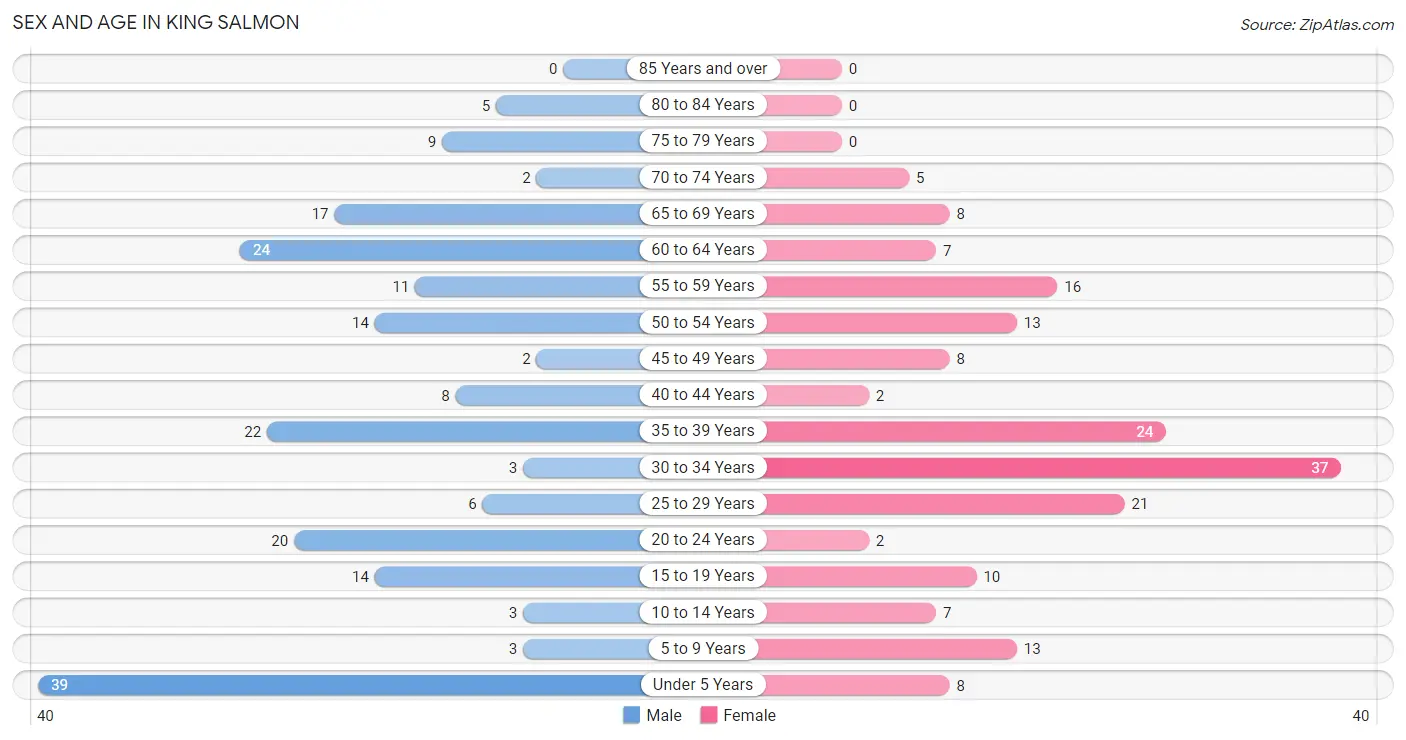
| Age Bracket | Male | Female |
| Under 5 Years | 39 (19.3%) | 8 (4.4%) |
| 5 to 9 Years | 3 (1.5%) | 13 (7.2%) |
| 10 to 14 Years | 3 (1.5%) | 7 (3.9%) |
| 15 to 19 Years | 14 (6.9%) | 10 (5.5%) |
| 20 to 24 Years | 20 (9.9%) | 2 (1.1%) |
| 25 to 29 Years | 6 (3.0%) | 21 (11.6%) |
| 30 to 34 Years | 3 (1.5%) | 37 (20.4%) |
| 35 to 39 Years | 22 (10.9%) | 24 (13.3%) |
| 40 to 44 Years | 8 (4.0%) | 2 (1.1%) |
| 45 to 49 Years | 2 (1.0%) | 8 (4.4%) |
| 50 to 54 Years | 14 (6.9%) | 13 (7.2%) |
| 55 to 59 Years | 11 (5.4%) | 16 (8.8%) |
| 60 to 64 Years | 24 (11.9%) | 7 (3.9%) |
| 65 to 69 Years | 17 (8.4%) | 8 (4.4%) |
| 70 to 74 Years | 2 (1.0%) | 5 (2.8%) |
| 75 to 79 Years | 9 (4.5%) | 0 (0.0%) |
| 80 to 84 Years | 5 (2.5%) | 0 (0.0%) |
| 85 Years and over | 0 (0.0%) | 0 (0.0%) |
| Total | 202 (100.0%) | 181 (100.0%) |
Families and Households in King Salmon
Median Family Size in King Salmon
The median family size in King Salmon is 3.19 persons per family, with single male/father families (3 | 3.2%) accounting for the largest median family size of 4.67 persons per family. On the other hand, single female/mother families (3 | 3.2%) represent the smallest median family size with 2.67 persons per family.
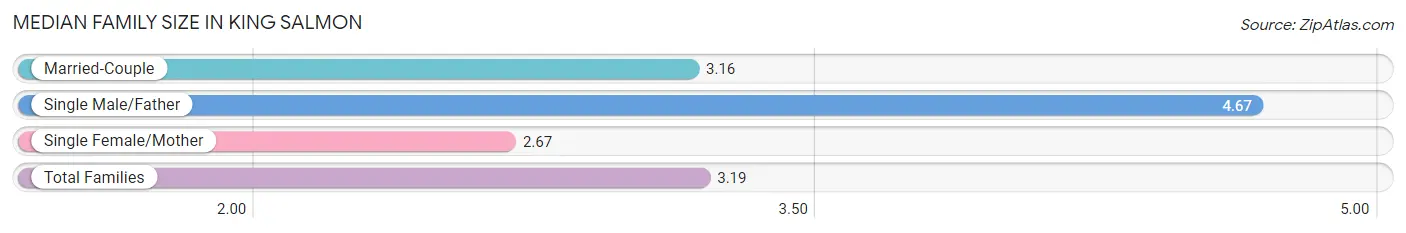
| Family Type | # Families | Family Size |
| Married-Couple | 88 (93.6%) | 3.16 |
| Single Male/Father | 3 (3.2%) | 4.67 |
| Single Female/Mother | 3 (3.2%) | 2.67 |
| Total Families | 94 (100.0%) | 3.19 |
Median Household Size in King Salmon
The median household size in King Salmon is 2.79 persons per household, with single male/father households (3 | 2.4%) accounting for the largest median household size of 7.33 persons per household. non-family households (32 | 25.4%) represent the smallest median household size with 1.22 persons per household.
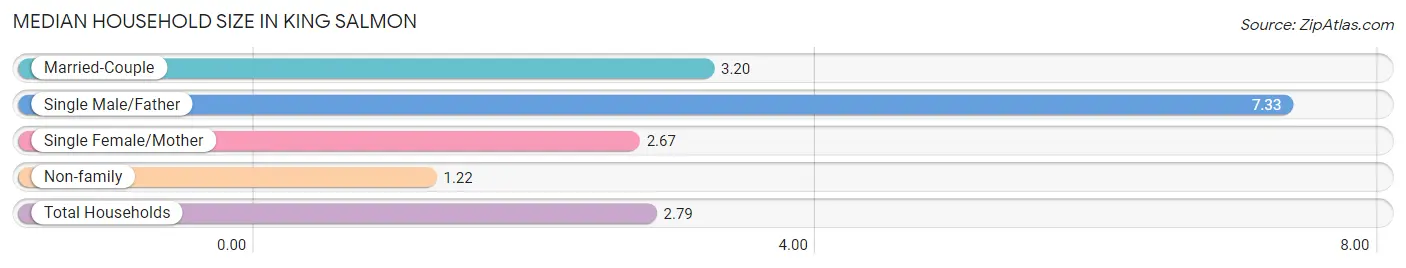
| Household Type | # Households | Household Size |
| Married-Couple | 88 (69.8%) | 3.20 |
| Single Male/Father | 3 (2.4%) | 7.33 |
| Single Female/Mother | 3 (2.4%) | 2.67 |
| Non-family | 32 (25.4%) | 1.22 |
| Total Households | 126 (100.0%) | 2.79 |
Household Size by Marriage Status in King Salmon
Out of a total of 126 households in King Salmon, 94 (74.6%) are family households, while 32 (25.4%) are nonfamily households. The most numerous type of family households are 2-person households, comprising 49, and the most common type of nonfamily households are 1-person households, comprising 26.
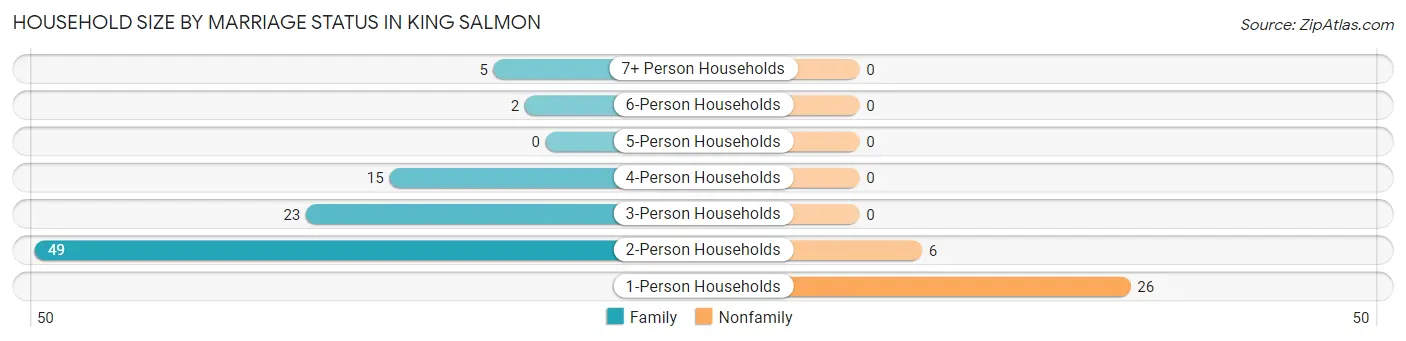
| Household Size | Family Households | Nonfamily Households |
| 1-Person Households | - | 26 (20.6%) |
| 2-Person Households | 49 (38.9%) | 6 (4.8%) |
| 3-Person Households | 23 (18.2%) | 0 (0.0%) |
| 4-Person Households | 15 (11.9%) | 0 (0.0%) |
| 5-Person Households | 0 (0.0%) | 0 (0.0%) |
| 6-Person Households | 2 (1.6%) | 0 (0.0%) |
| 7+ Person Households | 5 (4.0%) | 0 (0.0%) |
| Total | 94 (74.6%) | 32 (25.4%) |
Female Fertility in King Salmon
Fertility by Age in King Salmon
| Age Bracket | Women with Births | Births / 1,000 Women |
| 15 to 19 years | 0 (0.0%) | 0.0 |
| 20 to 34 years | 0 (0.0%) | 0.0 |
| 35 to 50 years | 0 (0.0%) | 0.0 |
| Total | 0 (0.0%) | 0.0 |
Fertility by Age by Marriage Status in King Salmon
| Age Bracket | Married | Unmarried |
| 15 to 19 years | 0 (0.0%) | 0 (0.0%) |
| 20 to 34 years | 0 (0.0%) | 0 (0.0%) |
| 35 to 50 years | 0 (0.0%) | 0 (0.0%) |
| Total | 0 (0.0%) | 0 (0.0%) |
Fertility by Education in King Salmon
| Educational Attainment | Women with Births | Births / 1,000 Women |
| Less than High School | 0 (0.0%) | 0.0 |
| High School Diploma | 0 (0.0%) | 0.0 |
| College or Associate's Degree | 0 (0.0%) | 0.0 |
| Bachelor's Degree | 0 (0.0%) | 0.0 |
| Graduate Degree | 0 (0.0%) | 0.0 |
| Total | 0 (0.0%) | 0.0 |
Fertility by Education by Marriage Status in King Salmon
| Educational Attainment | Married | Unmarried |
| Less than High School | 0 (0.0%) | 0 (0.0%) |
| High School Diploma | 0 (0.0%) | 0 (0.0%) |
| College or Associate's Degree | 0 (0.0%) | 0 (0.0%) |
| Bachelor's Degree | 0 (0.0%) | 0 (0.0%) |
| Graduate Degree | 0 (0.0%) | 0 (0.0%) |
| Total | 0 (0.0%) | 0 (0.0%) |
Employment Characteristics in King Salmon
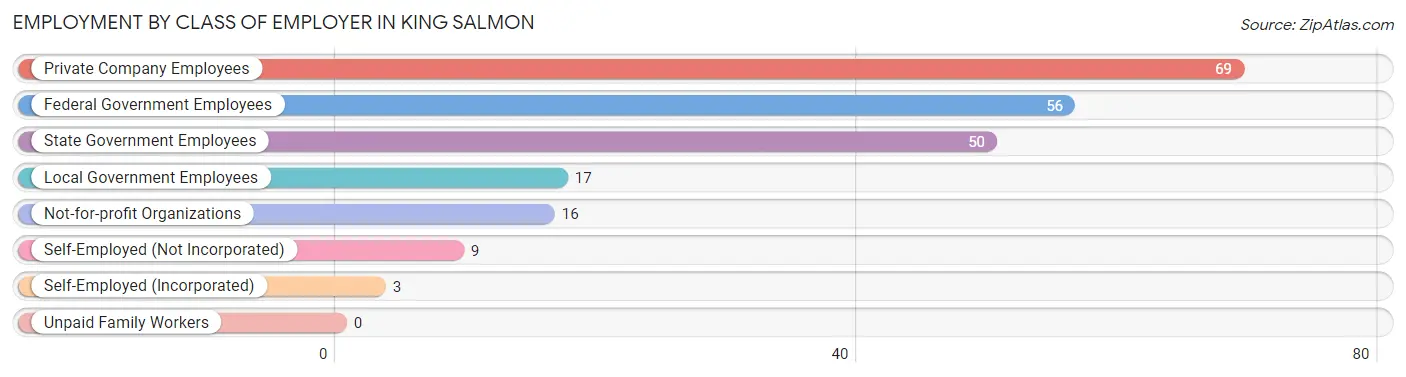
Employment by Class of Employer in King Salmon
Among the 220 employed individuals in King Salmon, private company employees (69 | 31.4%), federal government employees (56 | 25.5%), and state government employees (50 | 22.7%) make up the most common classes of employment.
| Employer Class | # Employees | % Employees |
| Private Company Employees | 69 | 31.4% |
| Self-Employed (Incorporated) | 3 | 1.4% |
| Self-Employed (Not Incorporated) | 9 | 4.1% |
| Not-for-profit Organizations | 16 | 7.3% |
| Local Government Employees | 17 | 7.7% |
| State Government Employees | 50 | 22.7% |
| Federal Government Employees | 56 | 25.5% |
| Unpaid Family Workers | 0 | 0.0% |
| Total | 220 | 100.0% |
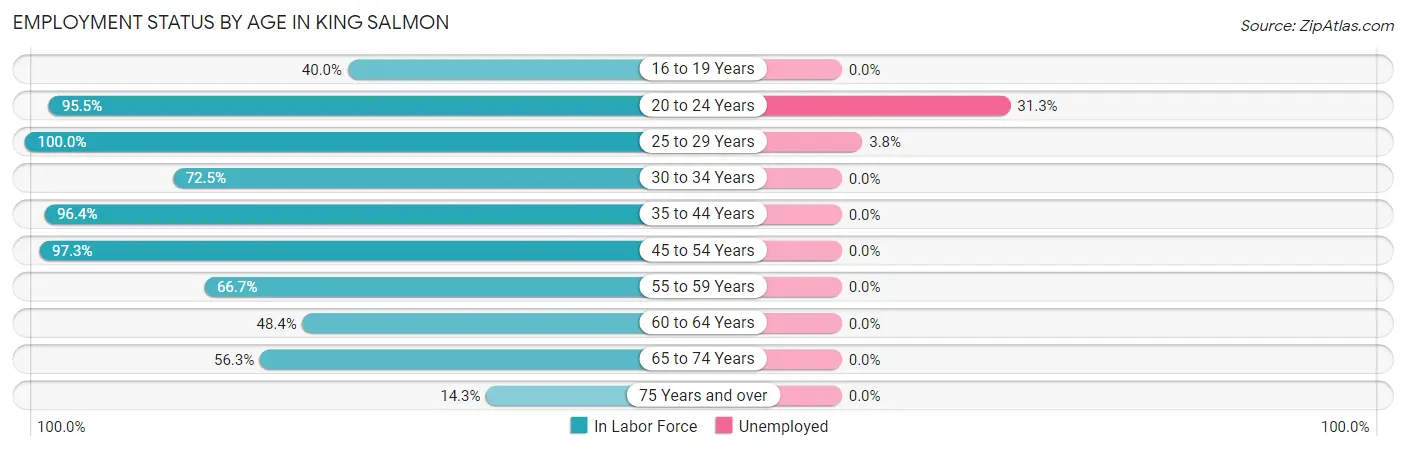
Employment Status by Age in King Salmon
According to the labor force statistics for King Salmon, out of the total population over 16 years of age (301), 75.1% or 226 individuals are in the labor force, with 2.8% or 6 of them unemployed. The age group with the highest labor force participation rate is 25 to 29 years, with 100.0% or 27 individuals in the labor force. Within the labor force, the 20 to 24 years age range has the highest percentage of unemployed individuals, with 31.3% or 7 of them being unemployed.
| Age Bracket | In Labor Force | Unemployed |
| 16 to 19 Years | 6 (40.0%) | 0 (0.0%) |
| 20 to 24 Years | 21 (95.5%) | 7 (31.3%) |
| 25 to 29 Years | 27 (100.0%) | 1 (3.8%) |
| 30 to 34 Years | 29 (72.5%) | 0 (0.0%) |
| 35 to 44 Years | 54 (96.4%) | 0 (0.0%) |
| 45 to 54 Years | 36 (97.3%) | 0 (0.0%) |
| 55 to 59 Years | 18 (66.7%) | 0 (0.0%) |
| 60 to 64 Years | 15 (48.4%) | 0 (0.0%) |
| 65 to 74 Years | 18 (56.3%) | 0 (0.0%) |
| 75 Years and over | 2 (14.3%) | 0 (0.0%) |
| Total | 226 (75.1%) | 6 (2.8%) |
Employment Status by Educational Attainment in King Salmon
According to labor force statistics for King Salmon, 82.1% of individuals (179) out of the total population between 25 and 64 years of age (218) are in the labor force, with 0.6% or 1 of them being unemployed. The group with the highest labor force participation rate are those with the educational attainment of bachelor's degree or higher, with 100.0% or 74 individuals in the labor force. Within the labor force, individuals with college / associate degree education have the highest percentage of unemployment, with 1.3% or 1 of them being unemployed.
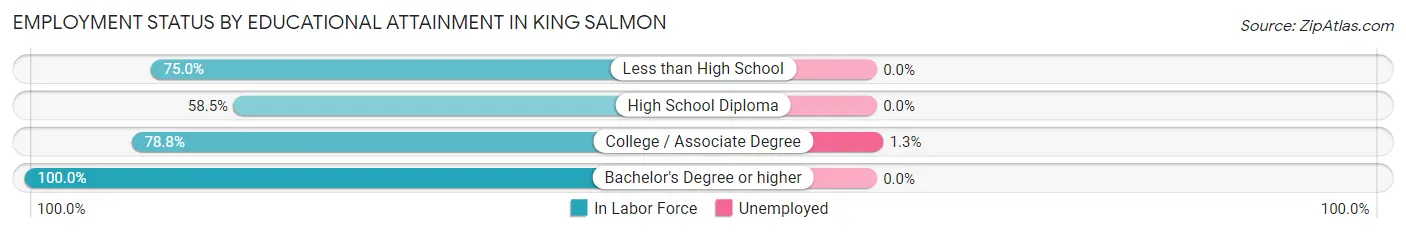
| Educational Attainment | In Labor Force | Unemployed |
| Less than High School | 3 (75.0%) | 0 (0.0%) |
| High School Diploma | 24 (58.5%) | 0 (0.0%) |
| College / Associate Degree | 78 (78.8%) | 1 (1.3%) |
| Bachelor's Degree or higher | 74 (100.0%) | 0 (0.0%) |
| Total | 179 (82.1%) | 1 (0.6%) |
Employment Occupations by Sex in King Salmon
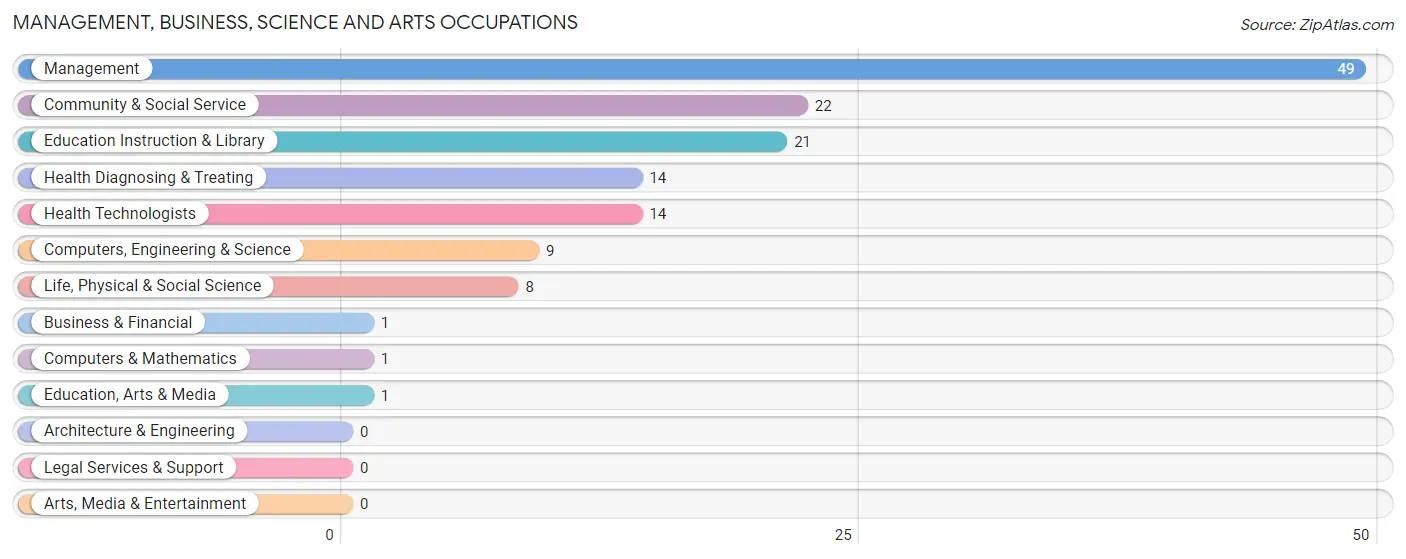
Management, Business, Science and Arts Occupations
The most common Management, Business, Science and Arts occupations in King Salmon are Management (49 | 23.1%), Community & Social Service (22 | 10.4%), Education Instruction & Library (21 | 9.9%), Health Diagnosing & Treating (14 | 6.6%), and Health Technologists (14 | 6.6%).
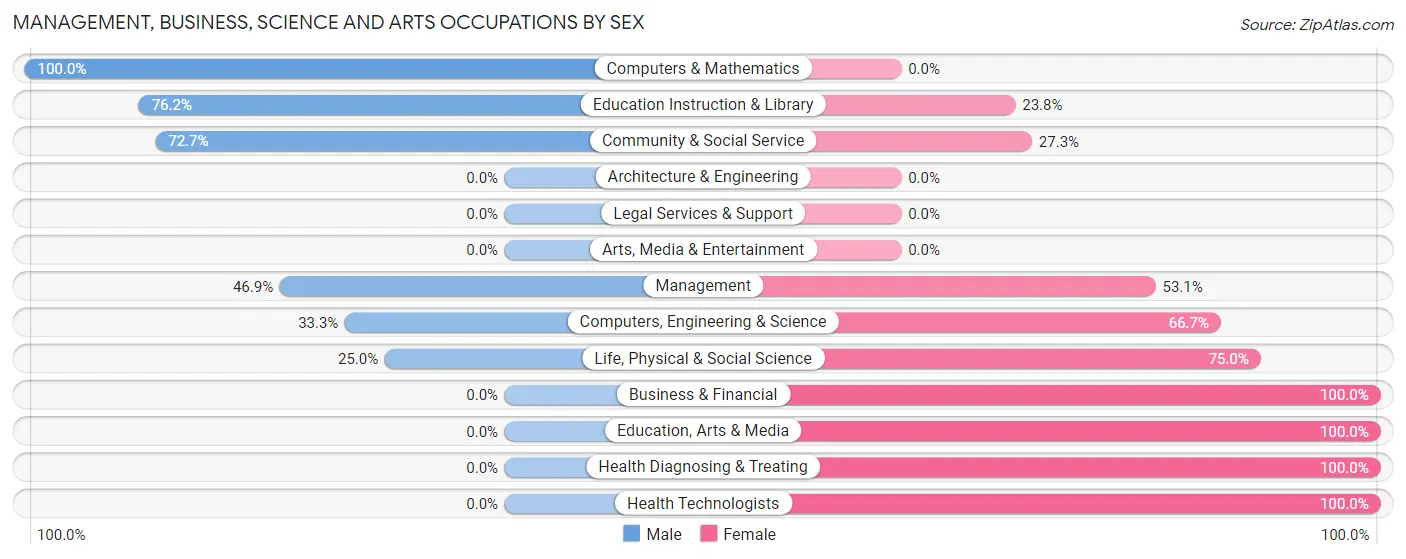
Management, Business, Science and Arts Occupations by Sex
Within the Management, Business, Science and Arts occupations in King Salmon, the most male-oriented occupations are Computers & Mathematics (100.0%), Education Instruction & Library (76.2%), and Community & Social Service (72.7%), while the most female-oriented occupations are Business & Financial (100.0%), Education, Arts & Media (100.0%), and Health Diagnosing & Treating (100.0%).
| Occupation | Male | Female |
| Management | 23 (46.9%) | 26 (53.1%) |
| Business & Financial | 0 (0.0%) | 1 (100.0%) |
| Computers, Engineering & Science | 3 (33.3%) | 6 (66.7%) |
| Computers & Mathematics | 1 (100.0%) | 0 (0.0%) |
| Architecture & Engineering | 0 (0.0%) | 0 (0.0%) |
| Life, Physical & Social Science | 2 (25.0%) | 6 (75.0%) |
| Community & Social Service | 16 (72.7%) | 6 (27.3%) |
| Education, Arts & Media | 0 (0.0%) | 1 (100.0%) |
| Legal Services & Support | 0 (0.0%) | 0 (0.0%) |
| Education Instruction & Library | 16 (76.2%) | 5 (23.8%) |
| Arts, Media & Entertainment | 0 (0.0%) | 0 (0.0%) |
| Health Diagnosing & Treating | 0 (0.0%) | 14 (100.0%) |
| Health Technologists | 0 (0.0%) | 14 (100.0%) |
| Total (Category) | 42 (44.2%) | 53 (55.8%) |
| Total (Overall) | 99 (46.7%) | 113 (53.3%) |
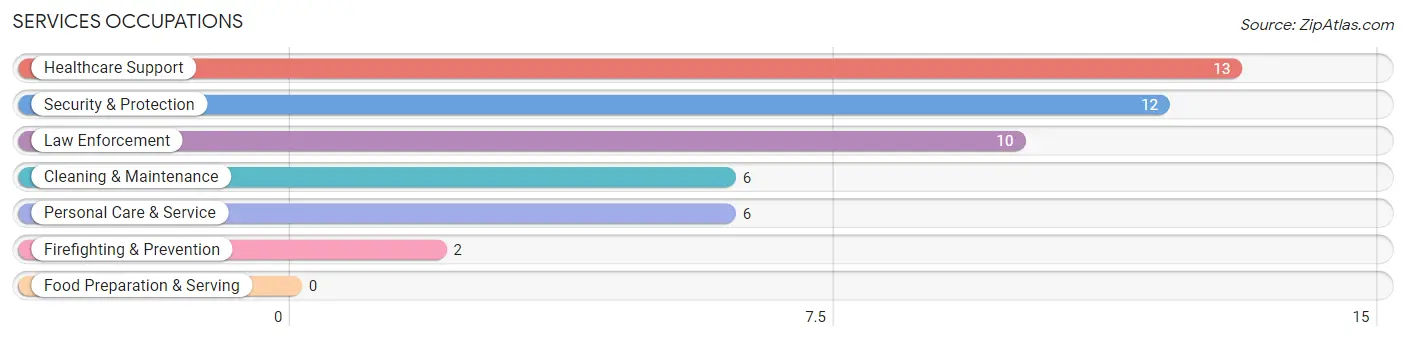
Services Occupations
The most common Services occupations in King Salmon are Healthcare Support (13 | 6.1%), Security & Protection (12 | 5.7%), Law Enforcement (10 | 4.7%), Cleaning & Maintenance (6 | 2.8%), and Personal Care & Service (6 | 2.8%).
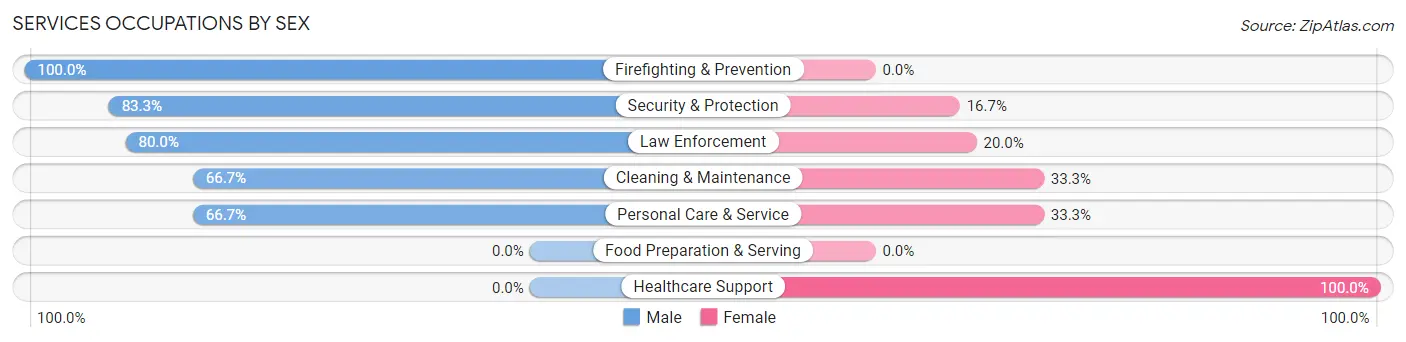
Services Occupations by Sex
Within the Services occupations in King Salmon, the most male-oriented occupations are Firefighting & Prevention (100.0%), Security & Protection (83.3%), and Law Enforcement (80.0%), while the most female-oriented occupations are Healthcare Support (100.0%), Cleaning & Maintenance (33.3%), and Personal Care & Service (33.3%).
| Occupation | Male | Female |
| Healthcare Support | 0 (0.0%) | 13 (100.0%) |
| Security & Protection | 10 (83.3%) | 2 (16.7%) |
| Firefighting & Prevention | 2 (100.0%) | 0 (0.0%) |
| Law Enforcement | 8 (80.0%) | 2 (20.0%) |
| Food Preparation & Serving | 0 (0.0%) | 0 (0.0%) |
| Cleaning & Maintenance | 4 (66.7%) | 2 (33.3%) |
| Personal Care & Service | 4 (66.7%) | 2 (33.3%) |
| Total (Category) | 18 (48.6%) | 19 (51.3%) |
| Total (Overall) | 99 (46.7%) | 113 (53.3%) |
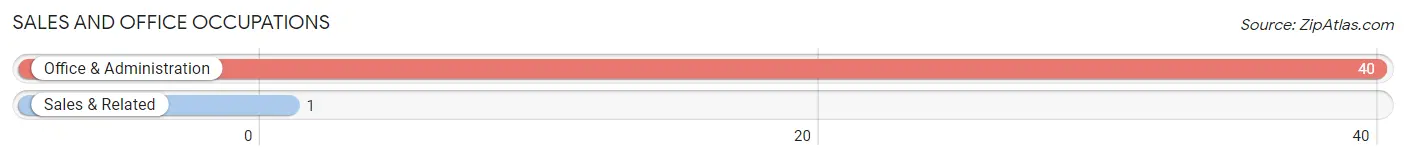
Sales and Office Occupations
The most common Sales and Office occupations in King Salmon are Office & Administration (40 | 18.9%), and Sales & Related (1 | 0.5%).
Sales and Office Occupations by Sex
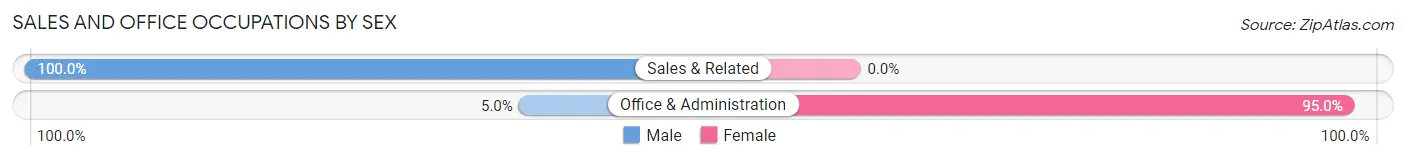
| Occupation | Male | Female |
| Sales & Related | 1 (100.0%) | 0 (0.0%) |
| Office & Administration | 2 (5.0%) | 38 (95.0%) |
| Total (Category) | 3 (7.3%) | 38 (92.7%) |
| Total (Overall) | 99 (46.7%) | 113 (53.3%) |
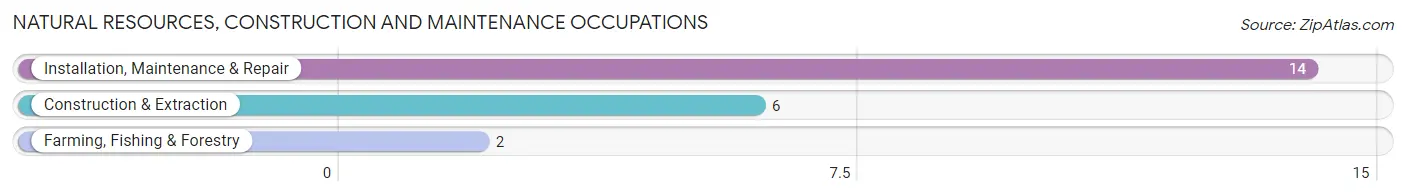
Natural Resources, Construction and Maintenance Occupations
The most common Natural Resources, Construction and Maintenance occupations in King Salmon are Installation, Maintenance & Repair (14 | 6.6%), Construction & Extraction (6 | 2.8%), and Farming, Fishing & Forestry (2 | 0.9%).
Natural Resources, Construction and Maintenance Occupations by Sex
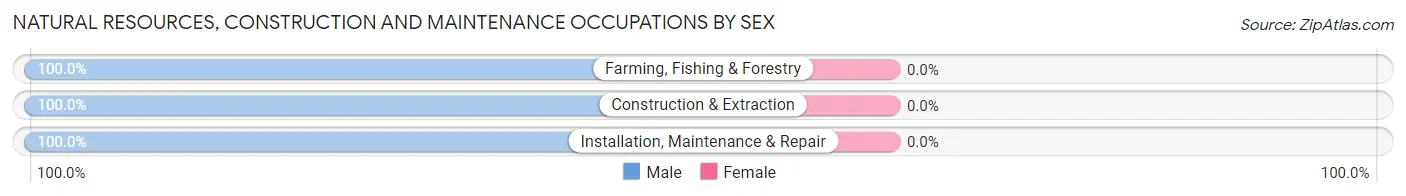
| Occupation | Male | Female |
| Farming, Fishing & Forestry | 2 (100.0%) | 0 (0.0%) |
| Construction & Extraction | 6 (100.0%) | 0 (0.0%) |
| Installation, Maintenance & Repair | 14 (100.0%) | 0 (0.0%) |
| Total (Category) | 22 (100.0%) | 0 (0.0%) |
| Total (Overall) | 99 (46.7%) | 113 (53.3%) |
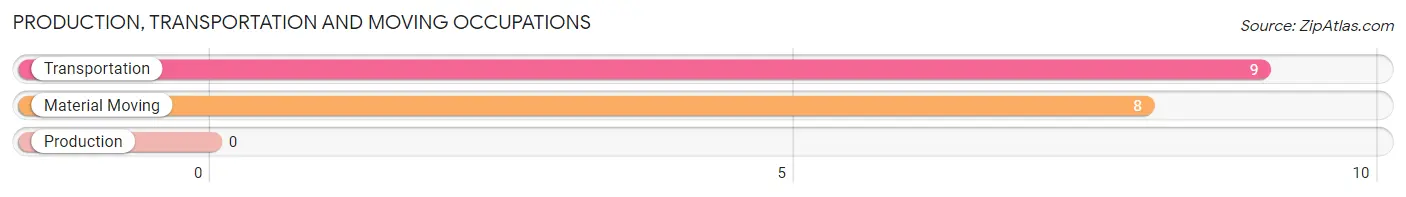
Production, Transportation and Moving Occupations
The most common Production, Transportation and Moving occupations in King Salmon are Transportation (9 | 4.3%), and Material Moving (8 | 3.8%).
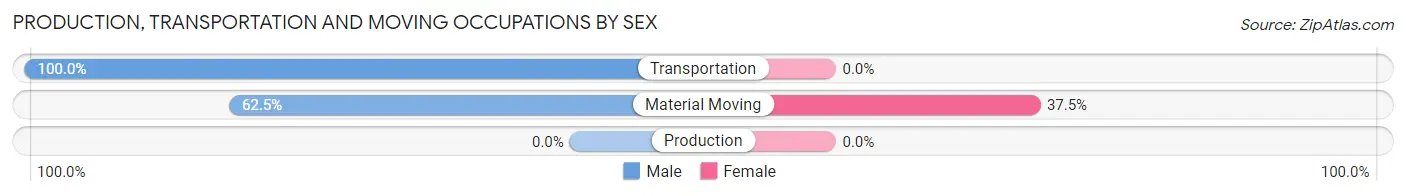
Production, Transportation and Moving Occupations by Sex
| Occupation | Male | Female |
| Production | 0 (0.0%) | 0 (0.0%) |
| Transportation | 9 (100.0%) | 0 (0.0%) |
| Material Moving | 5 (62.5%) | 3 (37.5%) |
| Total (Category) | 14 (82.4%) | 3 (17.6%) |
| Total (Overall) | 99 (46.7%) | 113 (53.3%) |
Employment Industries by Sex in King Salmon
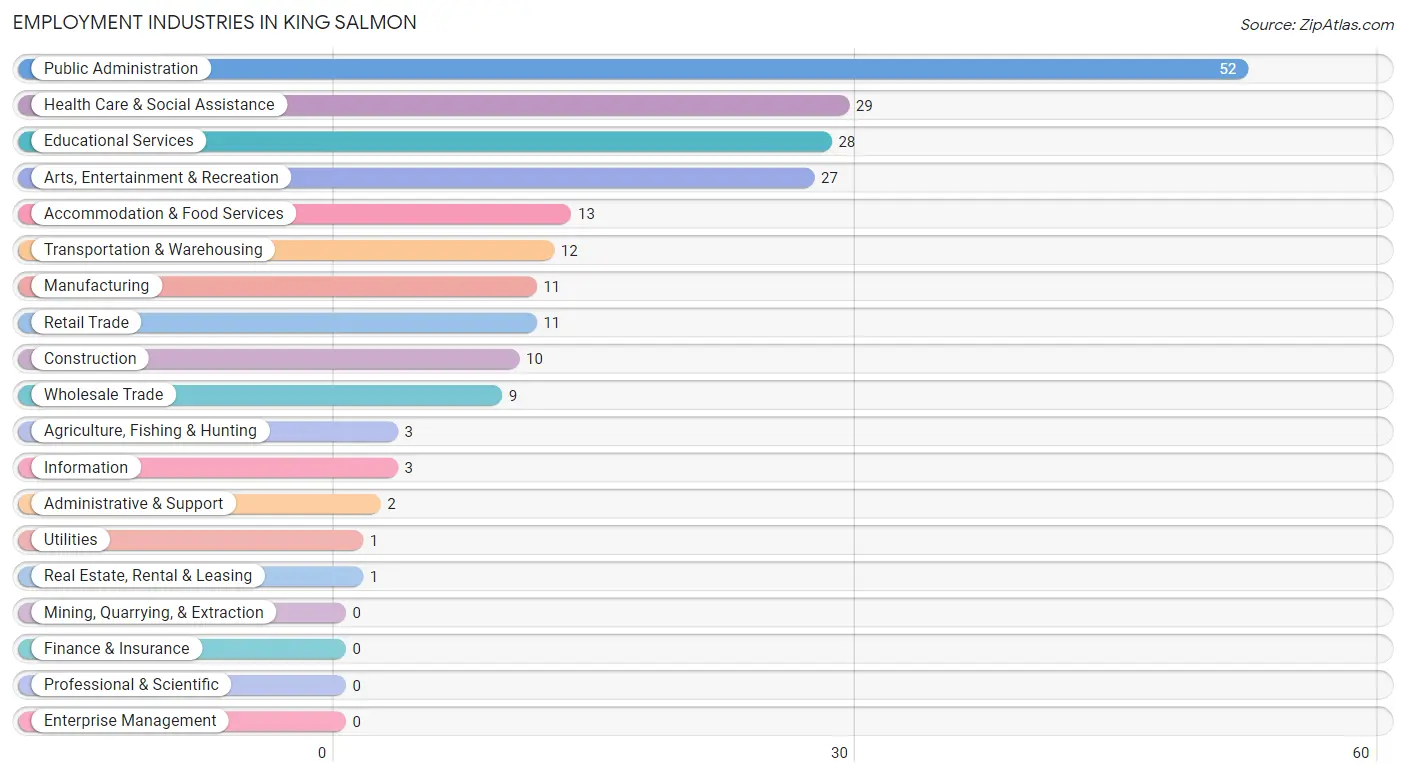
Employment Industries in King Salmon
The major employment industries in King Salmon include Public Administration (52 | 24.5%), Health Care & Social Assistance (29 | 13.7%), Educational Services (28 | 13.2%), Arts, Entertainment & Recreation (27 | 12.7%), and Accommodation & Food Services (13 | 6.1%).
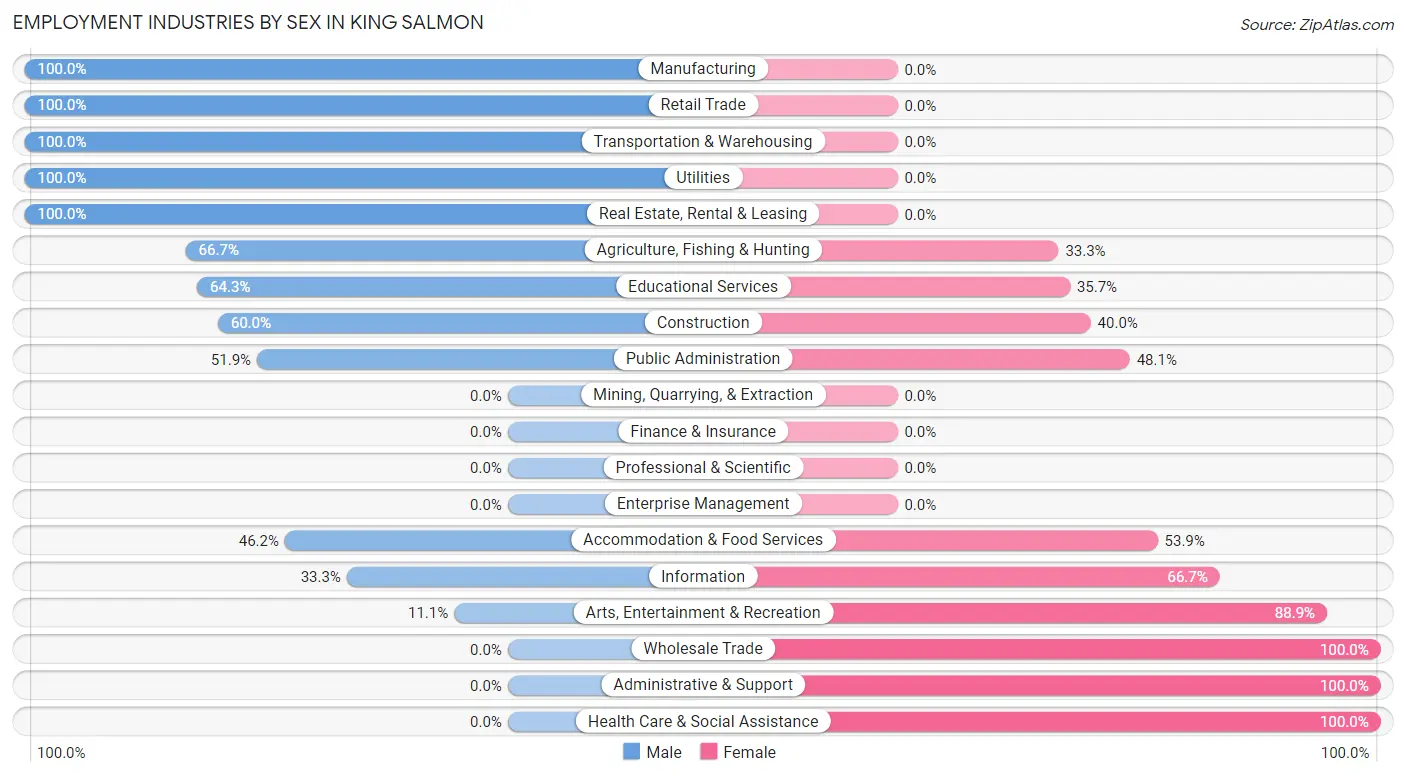
Employment Industries by Sex in King Salmon
The King Salmon industries that see more men than women are Manufacturing (100.0%), Retail Trade (100.0%), and Transportation & Warehousing (100.0%), whereas the industries that tend to have a higher number of women are Wholesale Trade (100.0%), Administrative & Support (100.0%), and Health Care & Social Assistance (100.0%).
| Industry | Male | Female |
| Agriculture, Fishing & Hunting | 2 (66.7%) | 1 (33.3%) |
| Mining, Quarrying, & Extraction | 0 (0.0%) | 0 (0.0%) |
| Construction | 6 (60.0%) | 4 (40.0%) |
| Manufacturing | 11 (100.0%) | 0 (0.0%) |
| Wholesale Trade | 0 (0.0%) | 9 (100.0%) |
| Retail Trade | 11 (100.0%) | 0 (0.0%) |
| Transportation & Warehousing | 12 (100.0%) | 0 (0.0%) |
| Utilities | 1 (100.0%) | 0 (0.0%) |
| Information | 1 (33.3%) | 2 (66.7%) |
| Finance & Insurance | 0 (0.0%) | 0 (0.0%) |
| Real Estate, Rental & Leasing | 1 (100.0%) | 0 (0.0%) |
| Professional & Scientific | 0 (0.0%) | 0 (0.0%) |
| Enterprise Management | 0 (0.0%) | 0 (0.0%) |
| Administrative & Support | 0 (0.0%) | 2 (100.0%) |
| Educational Services | 18 (64.3%) | 10 (35.7%) |
| Health Care & Social Assistance | 0 (0.0%) | 29 (100.0%) |
| Arts, Entertainment & Recreation | 3 (11.1%) | 24 (88.9%) |
| Accommodation & Food Services | 6 (46.2%) | 7 (53.8%) |
| Public Administration | 27 (51.9%) | 25 (48.1%) |
| Total | 99 (46.7%) | 113 (53.3%) |
Education in King Salmon
School Enrollment in King Salmon
The most common levels of schooling among the 66 students in King Salmon are high school (18 | 27.3%), college / undergraduate (16 | 24.2%), and elementary school (11 | 16.7%).
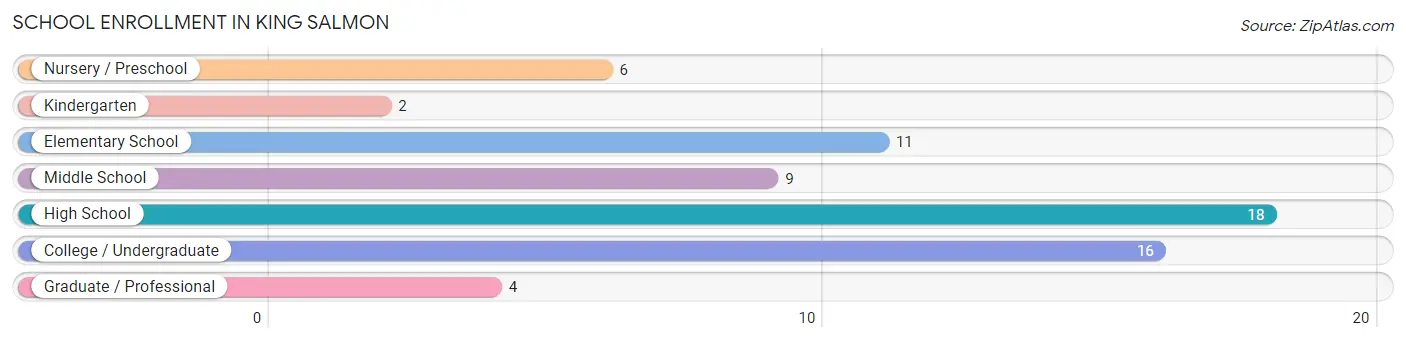
| School Level | # Students | % Students |
| Nursery / Preschool | 6 | 9.1% |
| Kindergarten | 2 | 3.0% |
| Elementary School | 11 | 16.7% |
| Middle School | 9 | 13.6% |
| High School | 18 | 27.3% |
| College / Undergraduate | 16 | 24.2% |
| Graduate / Professional | 4 | 6.1% |
| Total | 66 | 100.0% |
School Enrollment by Age by Funding Source in King Salmon
Out of a total of 66 students who are enrolled in schools in King Salmon, 11 (16.7%) attend a private institution, while the remaining 55 (83.3%) are enrolled in public schools. The age group of 5 to 9 year old has the highest likelihood of being enrolled in private schools, with 7 (58.3% in the age bracket) enrolled. Conversely, the age group of 3 to 4 year olds has the lowest likelihood of being enrolled in a private school, with 6 (100.0% in the age bracket) attending a public institution.
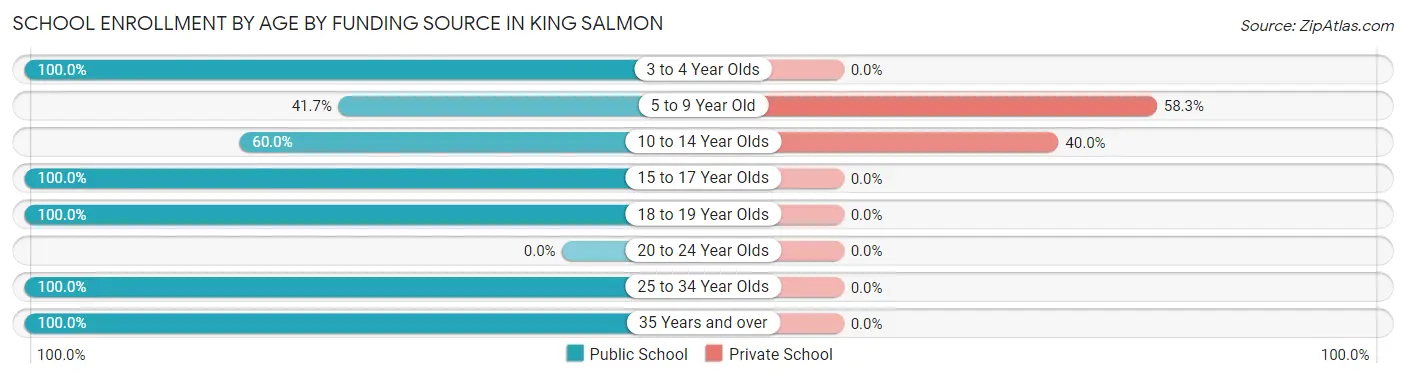
| Age Bracket | Public School | Private School |
| 3 to 4 Year Olds | 6 (100.0%) | 0 (0.0%) |
| 5 to 9 Year Old | 5 (41.7%) | 7 (58.3%) |
| 10 to 14 Year Olds | 6 (60.0%) | 4 (40.0%) |
| 15 to 17 Year Olds | 18 (100.0%) | 0 (0.0%) |
| 18 to 19 Year Olds | 4 (100.0%) | 0 (0.0%) |
| 20 to 24 Year Olds | 0 (0.0%) | 0 (0.0%) |
| 25 to 34 Year Olds | 14 (100.0%) | 0 (0.0%) |
| 35 Years and over | 2 (100.0%) | 0 (0.0%) |
| Total | 55 (83.3%) | 11 (16.7%) |
Educational Attainment by Field of Study in King Salmon
Bio, nature & agricultural (20 | 23.5%), social sciences (15 | 17.6%), science & technology (11 | 12.9%), education (11 | 12.9%), and liberal arts & history (7 | 8.2%) are the most common fields of study among 85 individuals in King Salmon who have obtained a bachelor's degree or higher.
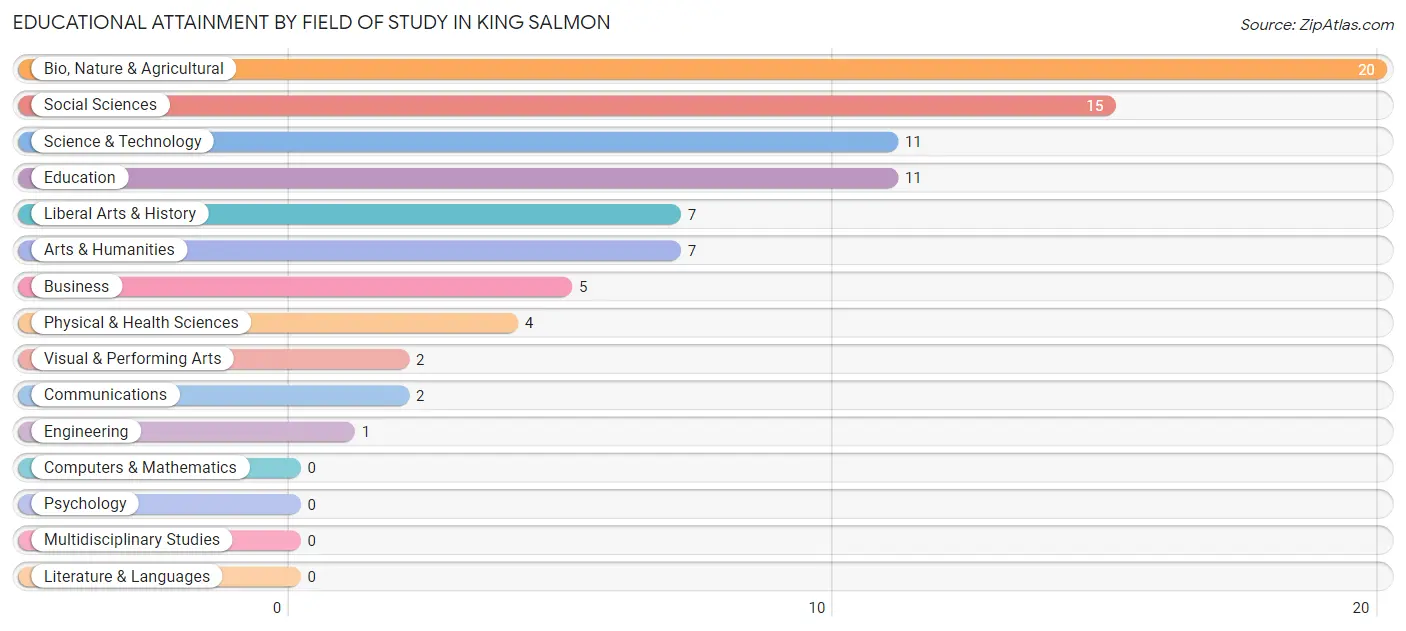
| Field of Study | # Graduates | % Graduates |
| Computers & Mathematics | 0 | 0.0% |
| Bio, Nature & Agricultural | 20 | 23.5% |
| Physical & Health Sciences | 4 | 4.7% |
| Psychology | 0 | 0.0% |
| Social Sciences | 15 | 17.6% |
| Engineering | 1 | 1.2% |
| Multidisciplinary Studies | 0 | 0.0% |
| Science & Technology | 11 | 12.9% |
| Business | 5 | 5.9% |
| Education | 11 | 12.9% |
| Literature & Languages | 0 | 0.0% |
| Liberal Arts & History | 7 | 8.2% |
| Visual & Performing Arts | 2 | 2.4% |
| Communications | 2 | 2.4% |
| Arts & Humanities | 7 | 8.2% |
| Total | 85 | 100.0% |
Transportation & Commute in King Salmon
Vehicle Availability by Sex in King Salmon
The most prevalent vehicle ownership categories in King Salmon are males with 1 vehicle (31, accounting for 40.3%) and females with 1 vehicle (38, making up 27.4%).
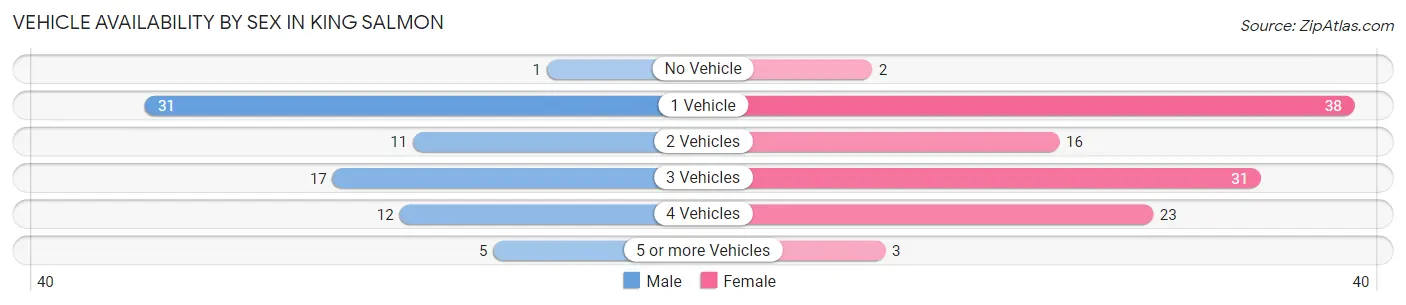
| Vehicles Available | Male | Female |
| No Vehicle | 1 (1.3%) | 2 (1.8%) |
| 1 Vehicle | 31 (40.3%) | 38 (33.6%) |
| 2 Vehicles | 11 (14.3%) | 16 (14.2%) |
| 3 Vehicles | 17 (22.1%) | 31 (27.4%) |
| 4 Vehicles | 12 (15.6%) | 23 (20.3%) |
| 5 or more Vehicles | 5 (6.5%) | 3 (2.6%) |
| Total | 77 (100.0%) | 113 (100.0%) |
Commute Time in King Salmon
The most frequently occuring commute durations in King Salmon are 5 to 9 minutes (71 commuters, 35.0%), 10 to 14 minutes (53 commuters, 26.1%), and 25 to 29 minutes (28 commuters, 13.8%).
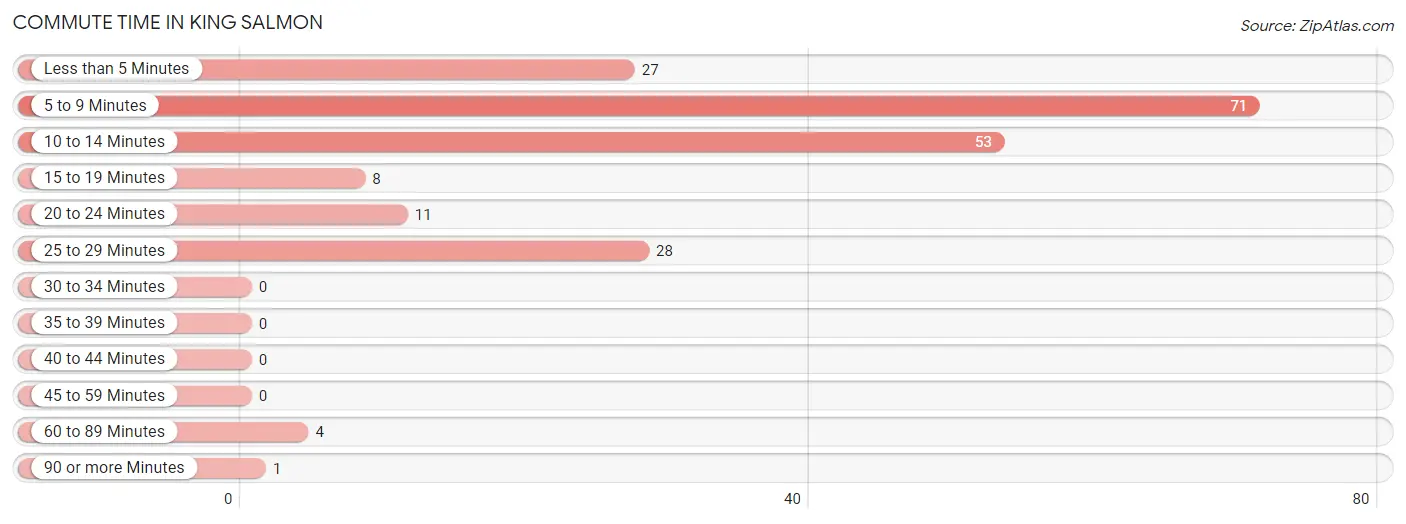
| Commute Time | # Commuters | % Commuters |
| Less than 5 Minutes | 27 | 13.3% |
| 5 to 9 Minutes | 71 | 35.0% |
| 10 to 14 Minutes | 53 | 26.1% |
| 15 to 19 Minutes | 8 | 3.9% |
| 20 to 24 Minutes | 11 | 5.4% |
| 25 to 29 Minutes | 28 | 13.8% |
| 30 to 34 Minutes | 0 | 0.0% |
| 35 to 39 Minutes | 0 | 0.0% |
| 40 to 44 Minutes | 0 | 0.0% |
| 45 to 59 Minutes | 0 | 0.0% |
| 60 to 89 Minutes | 4 | 2.0% |
| 90 or more Minutes | 1 | 0.5% |
Commute Time by Sex in King Salmon
The most common commute times in King Salmon are 5 to 9 minutes (41 commuters, 41.8%) for males and 5 to 9 minutes (30 commuters, 28.6%) for females.
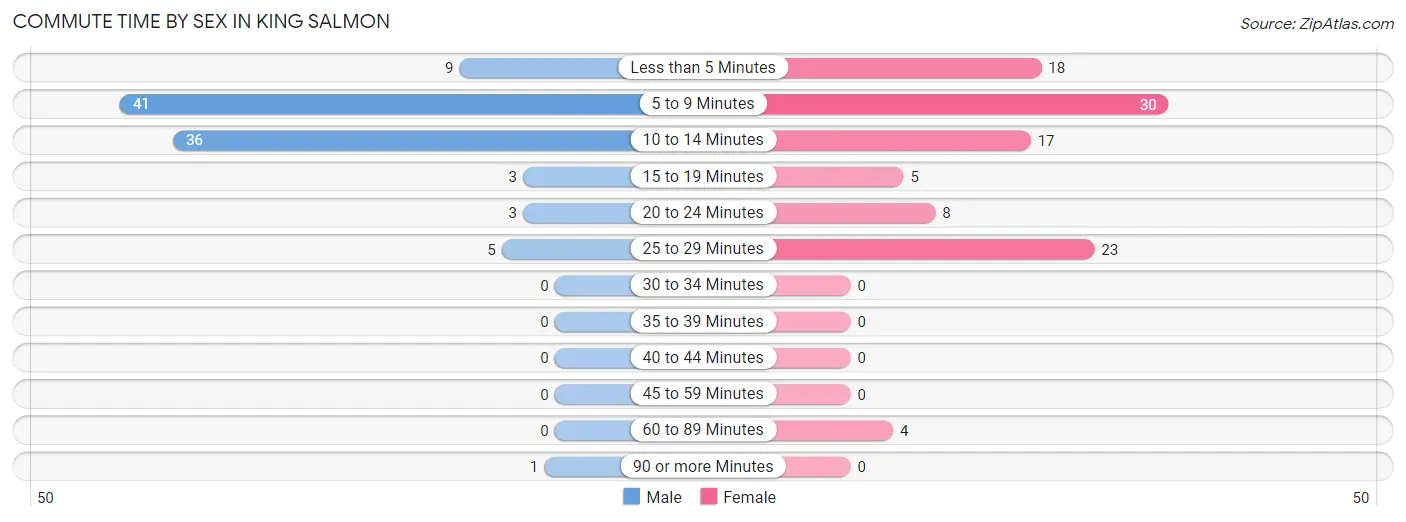
| Commute Time | Male | Female |
| Less than 5 Minutes | 9 (9.2%) | 18 (17.1%) |
| 5 to 9 Minutes | 41 (41.8%) | 30 (28.6%) |
| 10 to 14 Minutes | 36 (36.7%) | 17 (16.2%) |
| 15 to 19 Minutes | 3 (3.1%) | 5 (4.8%) |
| 20 to 24 Minutes | 3 (3.1%) | 8 (7.6%) |
| 25 to 29 Minutes | 5 (5.1%) | 23 (21.9%) |
| 30 to 34 Minutes | 0 (0.0%) | 0 (0.0%) |
| 35 to 39 Minutes | 0 (0.0%) | 0 (0.0%) |
| 40 to 44 Minutes | 0 (0.0%) | 0 (0.0%) |
| 45 to 59 Minutes | 0 (0.0%) | 0 (0.0%) |
| 60 to 89 Minutes | 0 (0.0%) | 4 (3.8%) |
| 90 or more Minutes | 1 (1.0%) | 0 (0.0%) |
Time of Departure to Work by Sex in King Salmon
The most frequent times of departure to work in King Salmon are 6:30 AM to 6:59 AM (18, 18.4%) for males and 7:30 AM to 7:59 AM (42, 40.0%) for females.
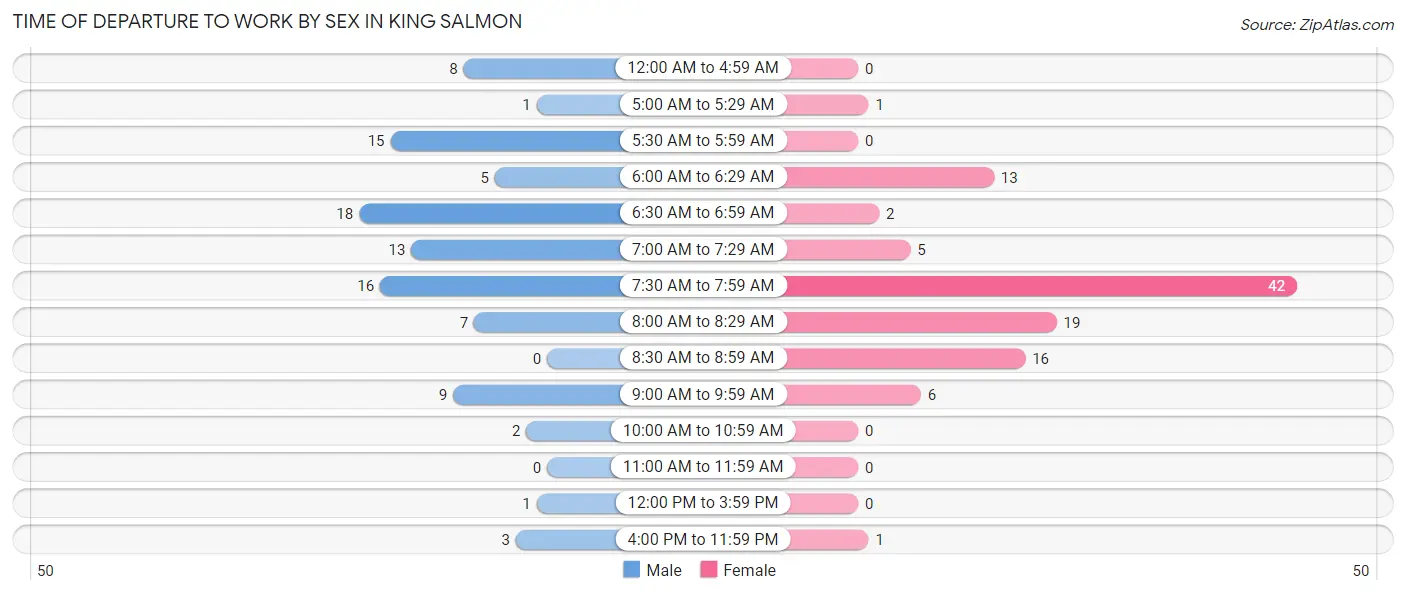
| Time of Departure | Male | Female |
| 12:00 AM to 4:59 AM | 8 (8.2%) | 0 (0.0%) |
| 5:00 AM to 5:29 AM | 1 (1.0%) | 1 (0.9%) |
| 5:30 AM to 5:59 AM | 15 (15.3%) | 0 (0.0%) |
| 6:00 AM to 6:29 AM | 5 (5.1%) | 13 (12.4%) |
| 6:30 AM to 6:59 AM | 18 (18.4%) | 2 (1.9%) |
| 7:00 AM to 7:29 AM | 13 (13.3%) | 5 (4.8%) |
| 7:30 AM to 7:59 AM | 16 (16.3%) | 42 (40.0%) |
| 8:00 AM to 8:29 AM | 7 (7.1%) | 19 (18.1%) |
| 8:30 AM to 8:59 AM | 0 (0.0%) | 16 (15.2%) |
| 9:00 AM to 9:59 AM | 9 (9.2%) | 6 (5.7%) |
| 10:00 AM to 10:59 AM | 2 (2.0%) | 0 (0.0%) |
| 11:00 AM to 11:59 AM | 0 (0.0%) | 0 (0.0%) |
| 12:00 PM to 3:59 PM | 1 (1.0%) | 0 (0.0%) |
| 4:00 PM to 11:59 PM | 3 (3.1%) | 1 (0.9%) |
| Total | 98 (100.0%) | 105 (100.0%) |
Housing Occupancy in King Salmon
Occupancy by Ownership in King Salmon
Of the total 126 dwellings in King Salmon, owner-occupied units account for 58 (46.0%), while renter-occupied units make up 68 (54.0%).
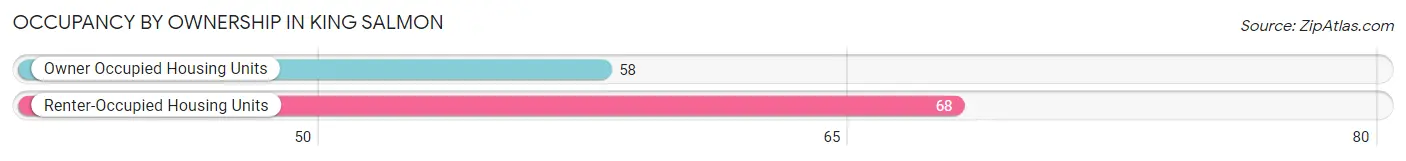
| Occupancy | # Housing Units | % Housing Units |
| Owner Occupied Housing Units | 58 | 46.0% |
| Renter-Occupied Housing Units | 68 | 54.0% |
| Total Occupied Housing Units | 126 | 100.0% |
Occupancy by Household Size in King Salmon
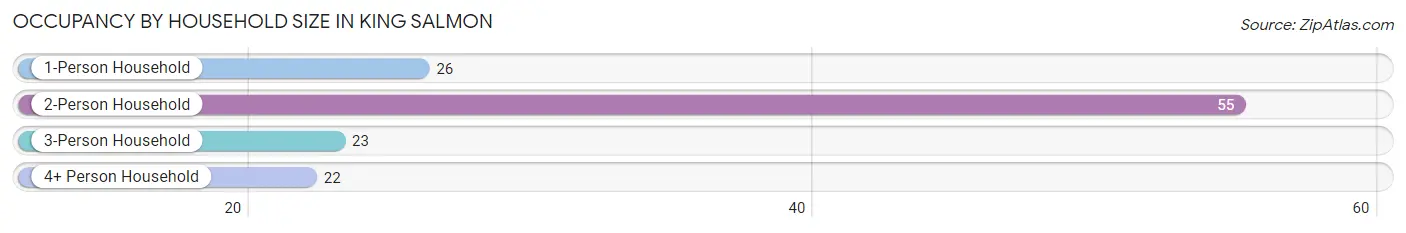
| Household Size | # Housing Units | % Housing Units |
| 1-Person Household | 26 | 20.6% |
| 2-Person Household | 55 | 43.6% |
| 3-Person Household | 23 | 18.2% |
| 4+ Person Household | 22 | 17.5% |
| Total Housing Units | 126 | 100.0% |
Occupancy by Ownership by Household Size in King Salmon
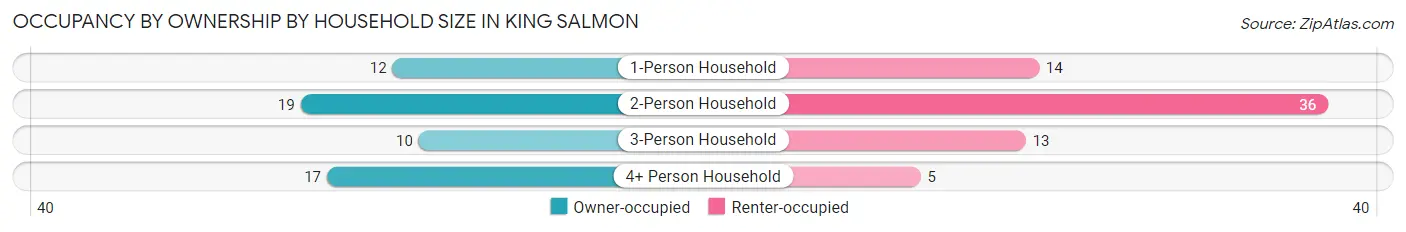
| Household Size | Owner-occupied | Renter-occupied |
| 1-Person Household | 12 (46.2%) | 14 (53.8%) |
| 2-Person Household | 19 (34.5%) | 36 (65.4%) |
| 3-Person Household | 10 (43.5%) | 13 (56.5%) |
| 4+ Person Household | 17 (77.3%) | 5 (22.7%) |
| Total Housing Units | 58 (46.0%) | 68 (54.0%) |
Occupancy by Educational Attainment in King Salmon
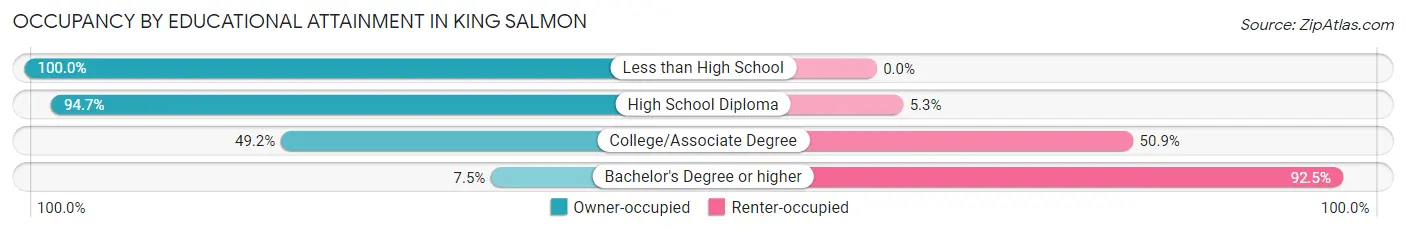
| Household Size | Owner-occupied | Renter-occupied |
| Less than High School | 8 (100.0%) | 0 (0.0%) |
| High School Diploma | 18 (94.7%) | 1 (5.3%) |
| College/Associate Degree | 29 (49.1%) | 30 (50.8%) |
| Bachelor's Degree or higher | 3 (7.5%) | 37 (92.5%) |
Occupancy by Age of Householder in King Salmon
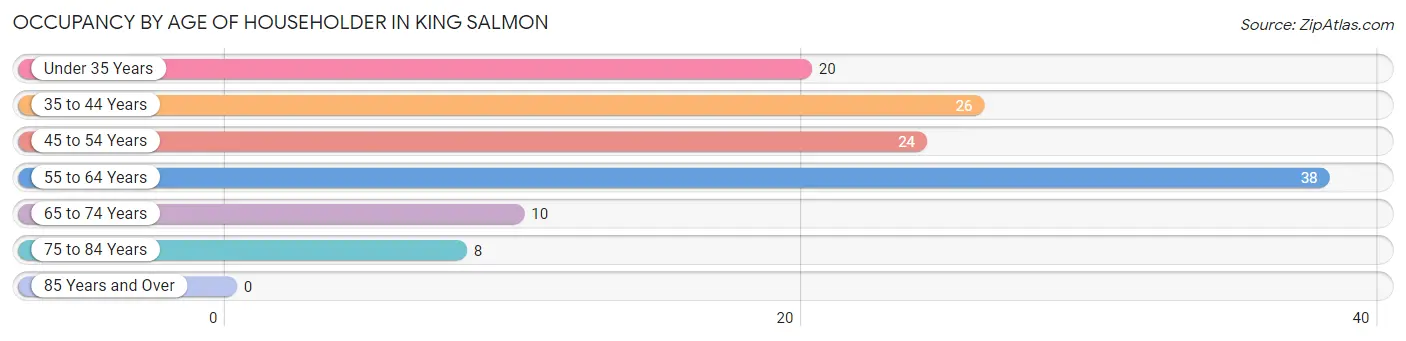
| Age Bracket | # Households | % Households |
| Under 35 Years | 20 | 15.9% |
| 35 to 44 Years | 26 | 20.6% |
| 45 to 54 Years | 24 | 19.1% |
| 55 to 64 Years | 38 | 30.2% |
| 65 to 74 Years | 10 | 7.9% |
| 75 to 84 Years | 8 | 6.4% |
| 85 Years and Over | 0 | 0.0% |
| Total | 126 | 100.0% |
Housing Finances in King Salmon
Median Income by Occupancy in King Salmon
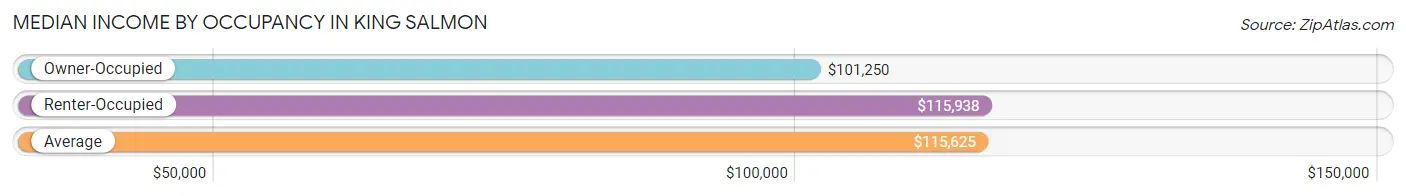
| Occupancy Type | # Households | Median Income |
| Owner-Occupied | 58 (46.0%) | $101,250 |
| Renter-Occupied | 68 (54.0%) | $115,938 |
| Average | 126 (100.0%) | $115,625 |
Occupancy by Householder Income Bracket in King Salmon
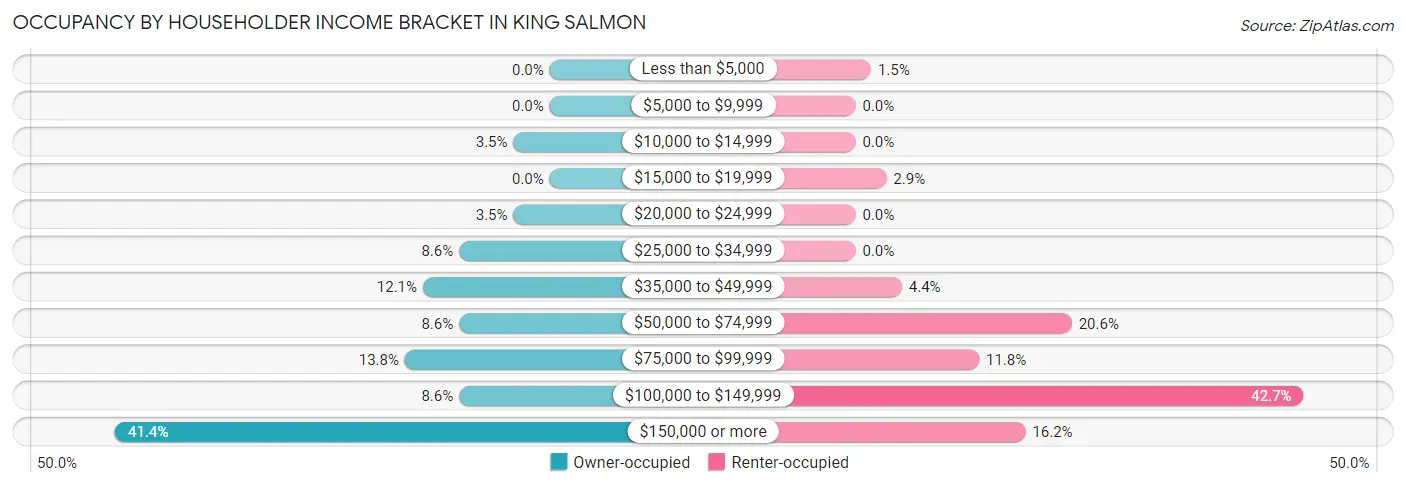
| Income Bracket | Owner-occupied | Renter-occupied |
| Less than $5,000 | 0 (0.0%) | 1 (1.5%) |
| $5,000 to $9,999 | 0 (0.0%) | 0 (0.0%) |
| $10,000 to $14,999 | 2 (3.5%) | 0 (0.0%) |
| $15,000 to $19,999 | 0 (0.0%) | 2 (2.9%) |
| $20,000 to $24,999 | 2 (3.5%) | 0 (0.0%) |
| $25,000 to $34,999 | 5 (8.6%) | 0 (0.0%) |
| $35,000 to $49,999 | 7 (12.1%) | 3 (4.4%) |
| $50,000 to $74,999 | 5 (8.6%) | 14 (20.6%) |
| $75,000 to $99,999 | 8 (13.8%) | 8 (11.8%) |
| $100,000 to $149,999 | 5 (8.6%) | 29 (42.6%) |
| $150,000 or more | 24 (41.4%) | 11 (16.2%) |
| Total | 58 (100.0%) | 68 (100.0%) |
Monthly Housing Cost Tiers in King Salmon
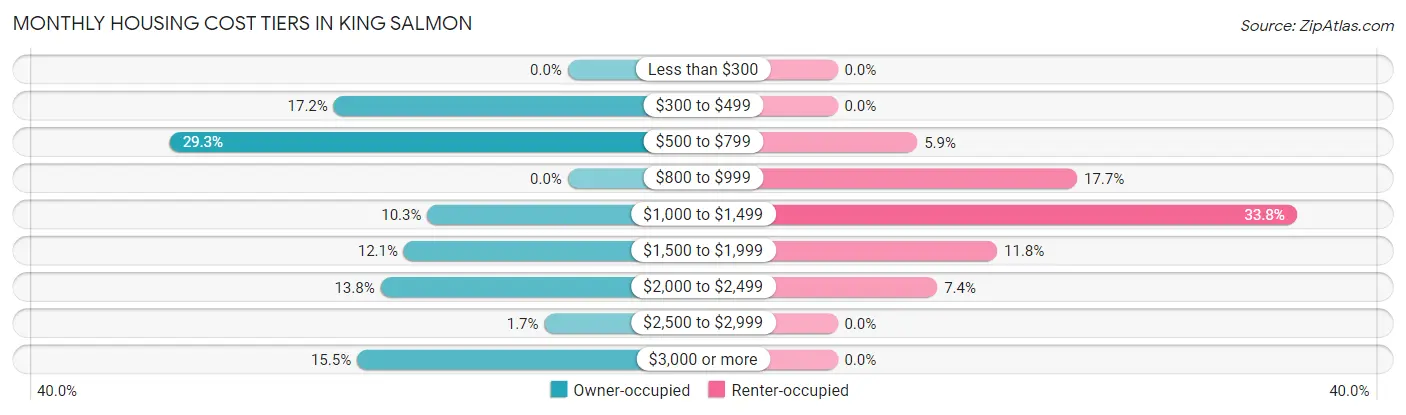
| Monthly Cost | Owner-occupied | Renter-occupied |
| Less than $300 | 0 (0.0%) | 0 (0.0%) |
| $300 to $499 | 10 (17.2%) | 0 (0.0%) |
| $500 to $799 | 17 (29.3%) | 4 (5.9%) |
| $800 to $999 | 0 (0.0%) | 12 (17.6%) |
| $1,000 to $1,499 | 6 (10.3%) | 23 (33.8%) |
| $1,500 to $1,999 | 7 (12.1%) | 8 (11.8%) |
| $2,000 to $2,499 | 8 (13.8%) | 5 (7.3%) |
| $2,500 to $2,999 | 1 (1.7%) | 0 (0.0%) |
| $3,000 or more | 9 (15.5%) | 0 (0.0%) |
| Total | 58 (100.0%) | 68 (100.0%) |
Physical Housing Characteristics in King Salmon
Housing Structures in King Salmon
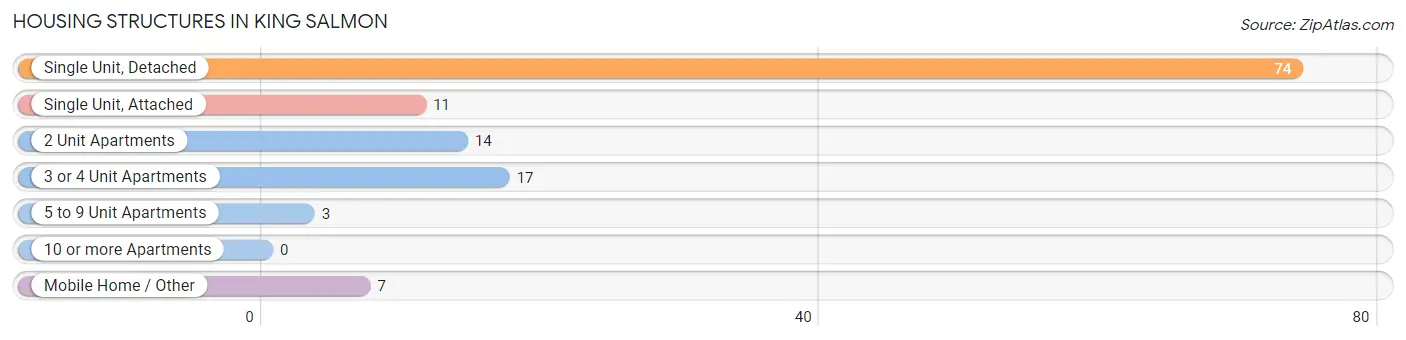
| Structure Type | # Housing Units | % Housing Units |
| Single Unit, Detached | 74 | 58.7% |
| Single Unit, Attached | 11 | 8.7% |
| 2 Unit Apartments | 14 | 11.1% |
| 3 or 4 Unit Apartments | 17 | 13.5% |
| 5 to 9 Unit Apartments | 3 | 2.4% |
| 10 or more Apartments | 0 | 0.0% |
| Mobile Home / Other | 7 | 5.6% |
| Total | 126 | 100.0% |
Housing Structures by Occupancy in King Salmon
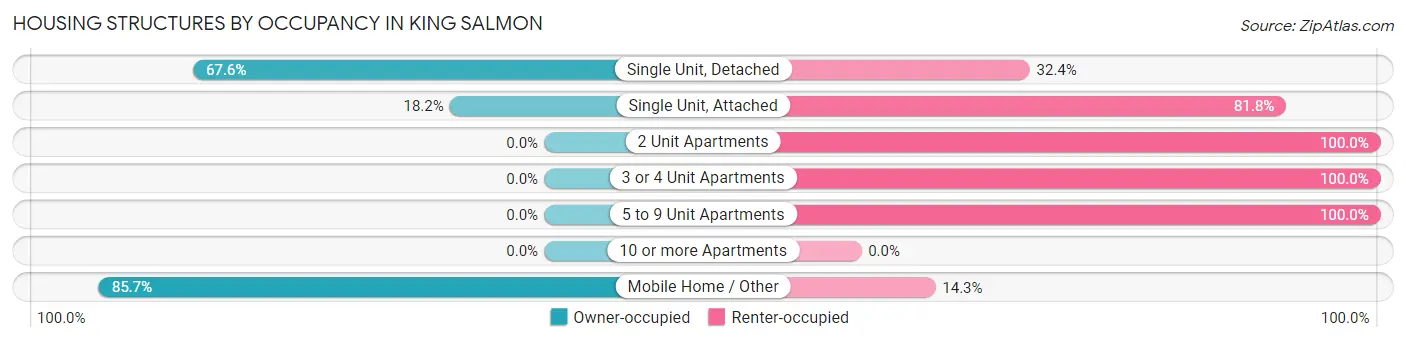
| Structure Type | Owner-occupied | Renter-occupied |
| Single Unit, Detached | 50 (67.6%) | 24 (32.4%) |
| Single Unit, Attached | 2 (18.2%) | 9 (81.8%) |
| 2 Unit Apartments | 0 (0.0%) | 14 (100.0%) |
| 3 or 4 Unit Apartments | 0 (0.0%) | 17 (100.0%) |
| 5 to 9 Unit Apartments | 0 (0.0%) | 3 (100.0%) |
| 10 or more Apartments | 0 (0.0%) | 0 (0.0%) |
| Mobile Home / Other | 6 (85.7%) | 1 (14.3%) |
| Total | 58 (46.0%) | 68 (54.0%) |
Housing Structures by Number of Rooms in King Salmon
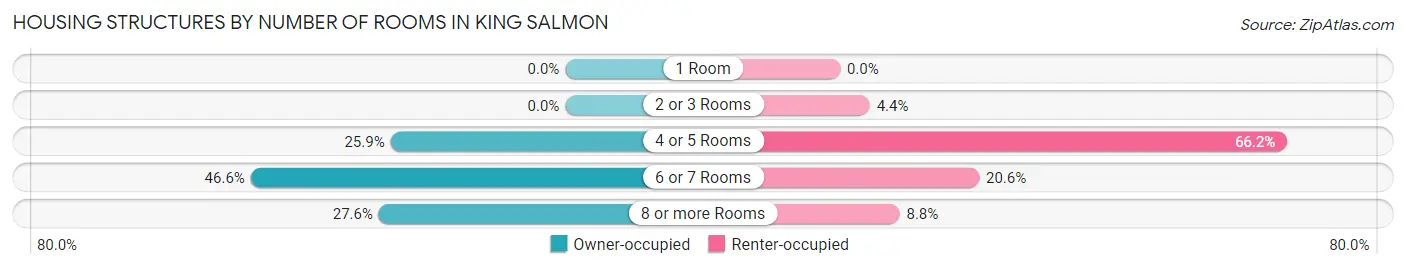
| Number of Rooms | Owner-occupied | Renter-occupied |
| 1 Room | 0 (0.0%) | 0 (0.0%) |
| 2 or 3 Rooms | 0 (0.0%) | 3 (4.4%) |
| 4 or 5 Rooms | 15 (25.9%) | 45 (66.2%) |
| 6 or 7 Rooms | 27 (46.6%) | 14 (20.6%) |
| 8 or more Rooms | 16 (27.6%) | 6 (8.8%) |
| Total | 58 (100.0%) | 68 (100.0%) |
Housing Structure by Heating Type in King Salmon
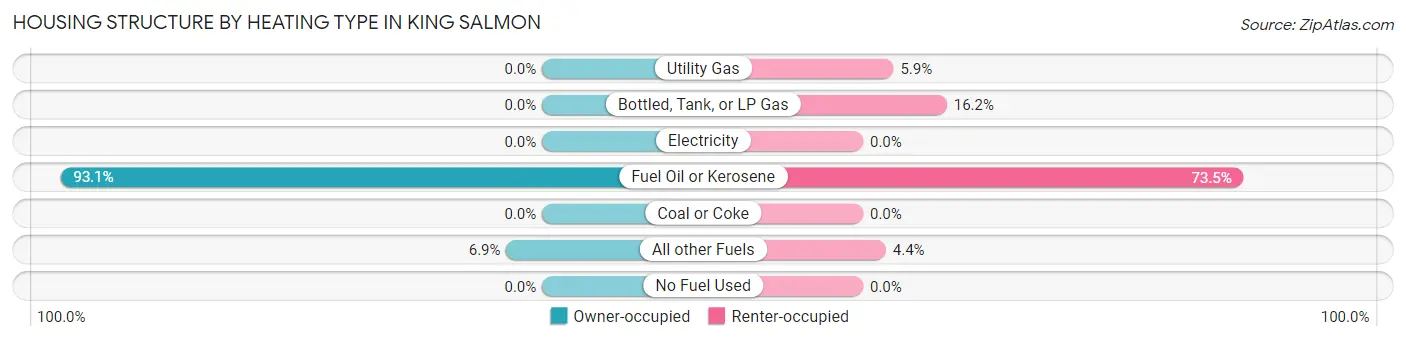
| Heating Type | Owner-occupied | Renter-occupied |
| Utility Gas | 0 (0.0%) | 4 (5.9%) |
| Bottled, Tank, or LP Gas | 0 (0.0%) | 11 (16.2%) |
| Electricity | 0 (0.0%) | 0 (0.0%) |
| Fuel Oil or Kerosene | 54 (93.1%) | 50 (73.5%) |
| Coal or Coke | 0 (0.0%) | 0 (0.0%) |
| All other Fuels | 4 (6.9%) | 3 (4.4%) |
| No Fuel Used | 0 (0.0%) | 0 (0.0%) |
| Total | 58 (100.0%) | 68 (100.0%) |
Household Vehicle Usage in King Salmon
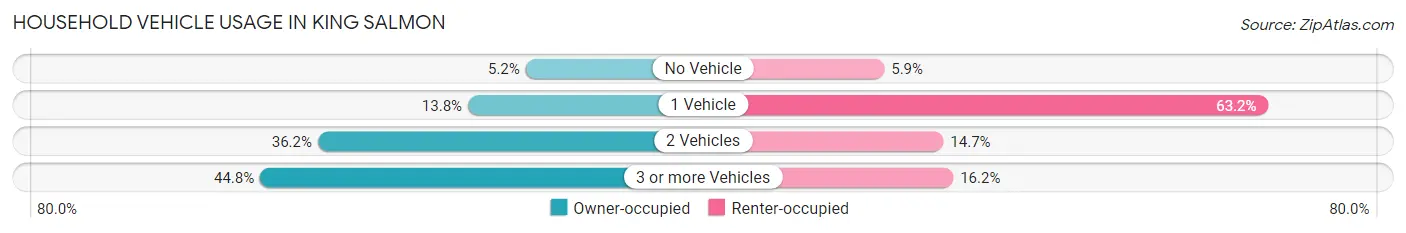
| Vehicles per Household | Owner-occupied | Renter-occupied |
| No Vehicle | 3 (5.2%) | 4 (5.9%) |
| 1 Vehicle | 8 (13.8%) | 43 (63.2%) |
| 2 Vehicles | 21 (36.2%) | 10 (14.7%) |
| 3 or more Vehicles | 26 (44.8%) | 11 (16.2%) |
| Total | 58 (100.0%) | 68 (100.0%) |
Real Estate & Mortgages in King Salmon
Real Estate and Mortgage Overview in King Salmon
| Characteristic | Without Mortgage | With Mortgage |
| Housing Units | 31 | 27 |
| Median Property Value | $182,500 | $330,000 |
| Median Household Income | $47,188 | $21 |
| Monthly Housing Costs | $579 | $9 |
| Real Estate Taxes | $1,500 | $7 |
Property Value by Mortgage Status in King Salmon
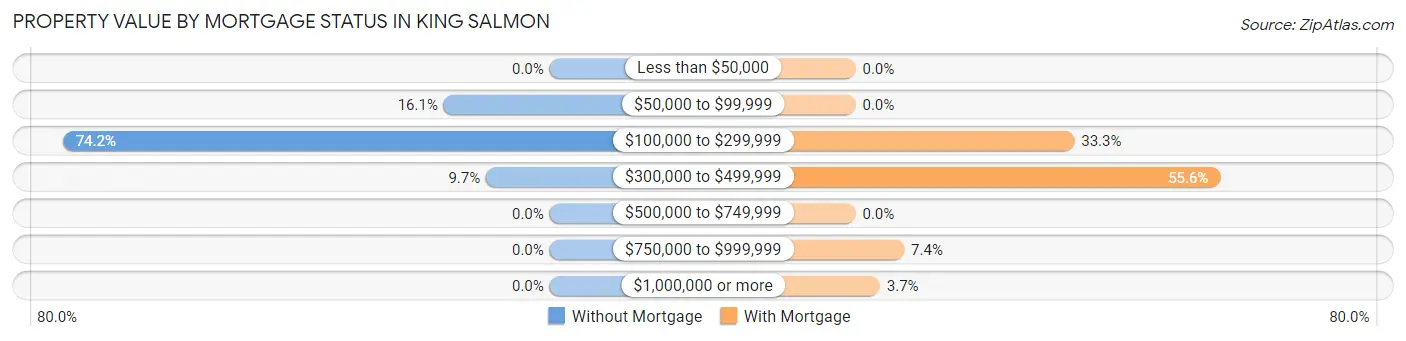
| Property Value | Without Mortgage | With Mortgage |
| Less than $50,000 | 0 (0.0%) | 0 (0.0%) |
| $50,000 to $99,999 | 5 (16.1%) | 0 (0.0%) |
| $100,000 to $299,999 | 23 (74.2%) | 9 (33.3%) |
| $300,000 to $499,999 | 3 (9.7%) | 15 (55.6%) |
| $500,000 to $749,999 | 0 (0.0%) | 0 (0.0%) |
| $750,000 to $999,999 | 0 (0.0%) | 2 (7.4%) |
| $1,000,000 or more | 0 (0.0%) | 1 (3.7%) |
| Total | 31 (100.0%) | 27 (100.0%) |
Household Income by Mortgage Status in King Salmon
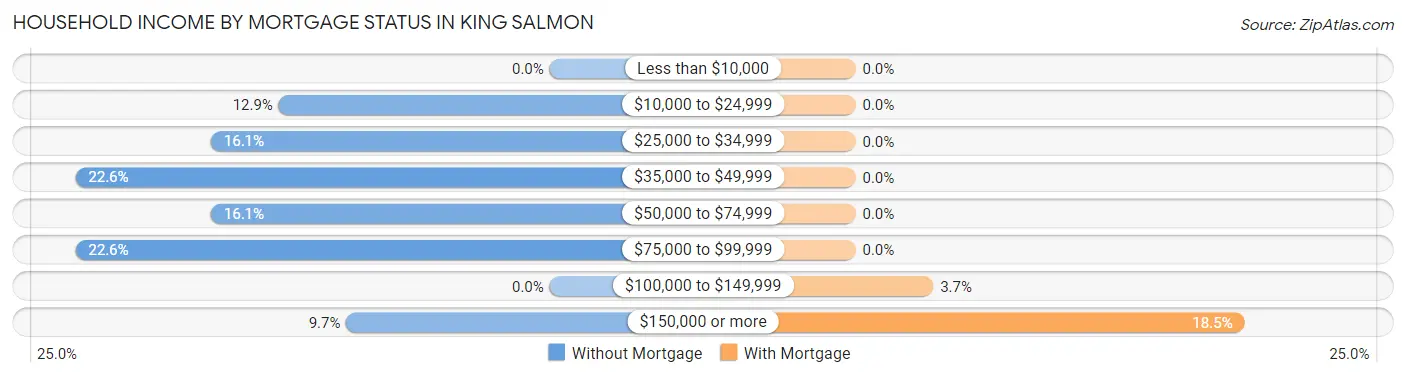
| Household Income | Without Mortgage | With Mortgage |
| Less than $10,000 | 0 (0.0%) | 0 (0.0%) |
| $10,000 to $24,999 | 4 (12.9%) | 0 (0.0%) |
| $25,000 to $34,999 | 5 (16.1%) | 0 (0.0%) |
| $35,000 to $49,999 | 7 (22.6%) | 0 (0.0%) |
| $50,000 to $74,999 | 5 (16.1%) | 0 (0.0%) |
| $75,000 to $99,999 | 7 (22.6%) | 0 (0.0%) |
| $100,000 to $149,999 | 0 (0.0%) | 1 (3.7%) |
| $150,000 or more | 3 (9.7%) | 5 (18.5%) |
| Total | 31 (100.0%) | 27 (100.0%) |
Property Value to Household Income Ratio in King Salmon
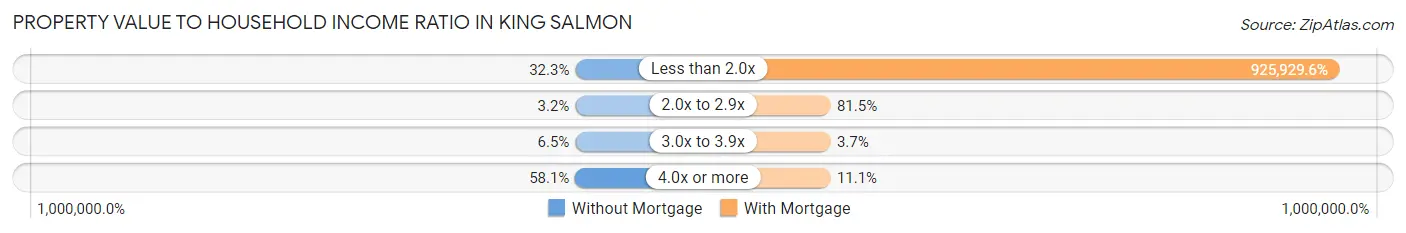
| Value-to-Income Ratio | Without Mortgage | With Mortgage |
| Less than 2.0x | 10 (32.3%) | 250,001 (925,929.6%) |
| 2.0x to 2.9x | 1 (3.2%) | 22 (81.5%) |
| 3.0x to 3.9x | 2 (6.5%) | 1 (3.7%) |
| 4.0x or more | 18 (58.1%) | 3 (11.1%) |
| Total | 31 (100.0%) | 27 (100.0%) |
Real Estate Taxes by Mortgage Status in King Salmon
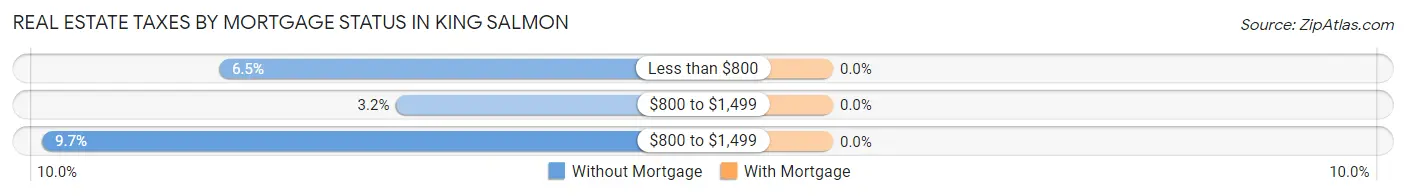
| Property Taxes | Without Mortgage | With Mortgage |
| Less than $800 | 2 (6.5%) | 0 (0.0%) |
| $800 to $1,499 | 1 (3.2%) | 0 (0.0%) |
| $800 to $1,499 | 3 (9.7%) | 0 (0.0%) |
| Total | 31 (100.0%) | 27 (100.0%) |
Health & Disability in King Salmon
Health Insurance Coverage by Age in King Salmon
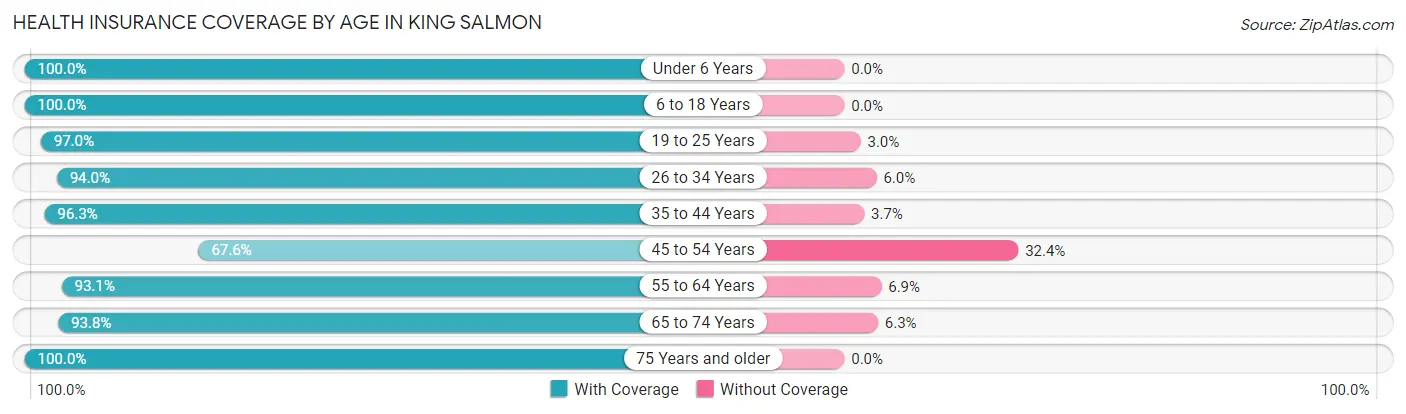
| Age Bracket | With Coverage | Without Coverage |
| Under 6 Years | 53 (100.0%) | 0 (0.0%) |
| 6 to 18 Years | 42 (100.0%) | 0 (0.0%) |
| 19 to 25 Years | 32 (97.0%) | 1 (3.0%) |
| 26 to 34 Years | 47 (94.0%) | 3 (6.0%) |
| 35 to 44 Years | 52 (96.3%) | 2 (3.7%) |
| 45 to 54 Years | 25 (67.6%) | 12 (32.4%) |
| 55 to 64 Years | 54 (93.1%) | 4 (6.9%) |
| 65 to 74 Years | 30 (93.8%) | 2 (6.2%) |
| 75 Years and older | 14 (100.0%) | 0 (0.0%) |
| Total | 349 (93.6%) | 24 (6.4%) |
Health Insurance Coverage by Citizenship Status in King Salmon
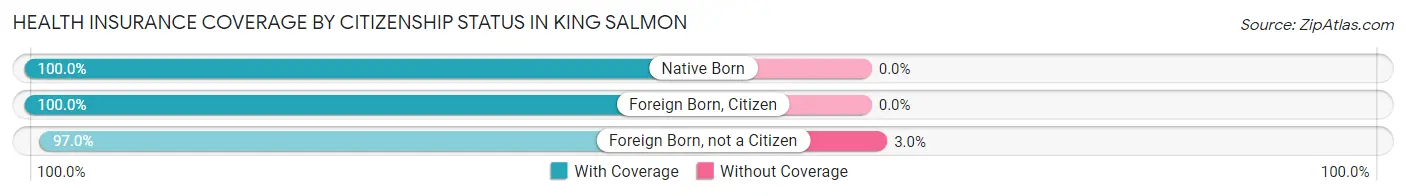
| Citizenship Status | With Coverage | Without Coverage |
| Native Born | 53 (100.0%) | 0 (0.0%) |
| Foreign Born, Citizen | 42 (100.0%) | 0 (0.0%) |
| Foreign Born, not a Citizen | 32 (97.0%) | 1 (3.0%) |
Health Insurance Coverage by Household Income in King Salmon
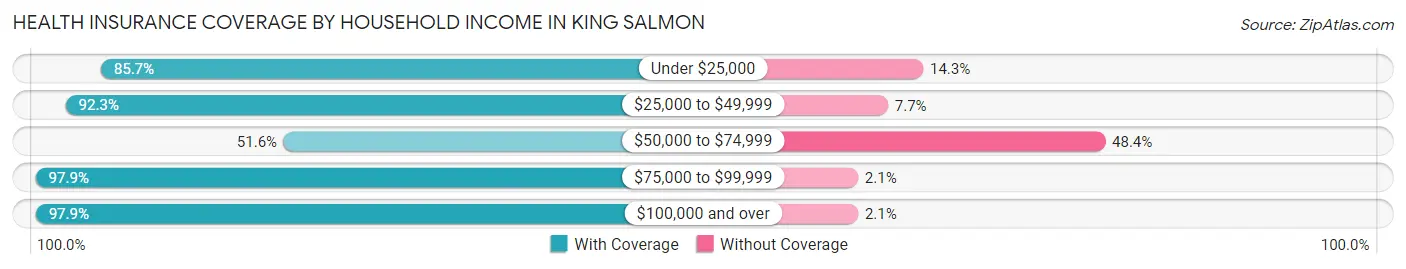
| Household Income | With Coverage | Without Coverage |
| Under $25,000 | 6 (85.7%) | 1 (14.3%) |
| $25,000 to $49,999 | 24 (92.3%) | 2 (7.7%) |
| $50,000 to $74,999 | 16 (51.6%) | 15 (48.4%) |
| $75,000 to $99,999 | 47 (97.9%) | 1 (2.1%) |
| $100,000 and over | 234 (97.9%) | 5 (2.1%) |
Public vs Private Health Insurance Coverage by Age in King Salmon
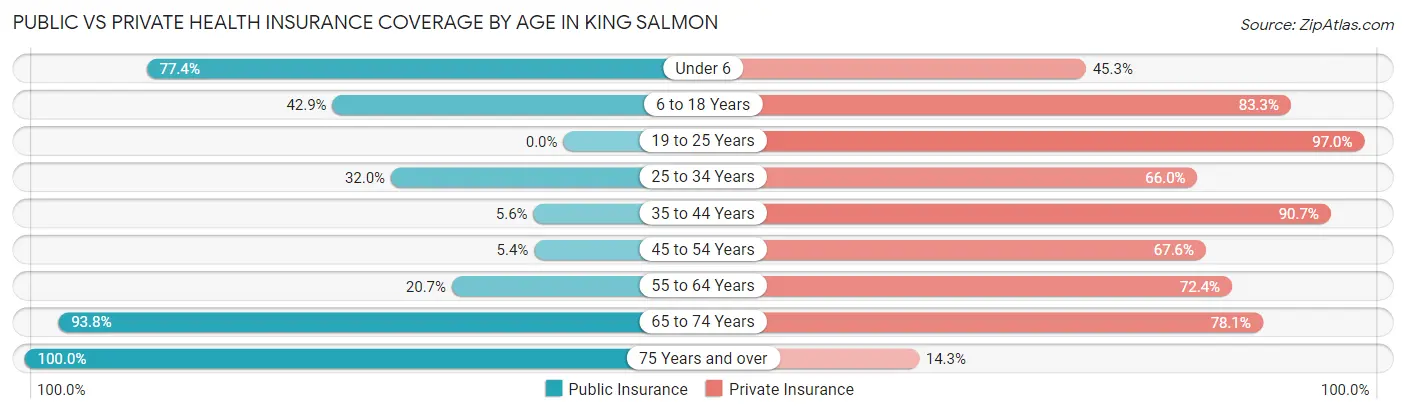
| Age Bracket | Public Insurance | Private Insurance |
| Under 6 | 41 (77.4%) | 24 (45.3%) |
| 6 to 18 Years | 18 (42.9%) | 35 (83.3%) |
| 19 to 25 Years | 0 (0.0%) | 32 (97.0%) |
| 25 to 34 Years | 16 (32.0%) | 33 (66.0%) |
| 35 to 44 Years | 3 (5.6%) | 49 (90.7%) |
| 45 to 54 Years | 2 (5.4%) | 25 (67.6%) |
| 55 to 64 Years | 12 (20.7%) | 42 (72.4%) |
| 65 to 74 Years | 30 (93.8%) | 25 (78.1%) |
| 75 Years and over | 14 (100.0%) | 2 (14.3%) |
| Total | 136 (36.5%) | 267 (71.6%) |
Disability Status by Sex by Age in King Salmon
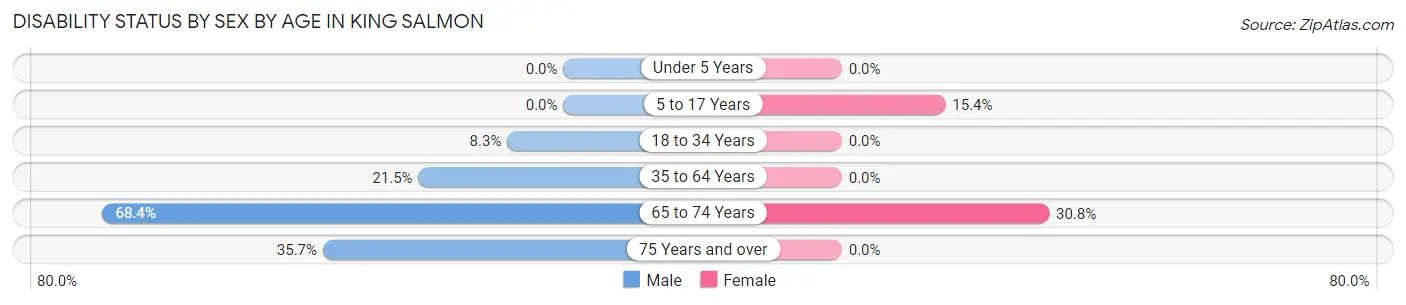
| Age Bracket | Male | Female |
| Under 5 Years | 0 (0.0%) | 0 (0.0%) |
| 5 to 17 Years | 0 (0.0%) | 4 (15.4%) |
| 18 to 34 Years | 2 (8.3%) | 0 (0.0%) |
| 35 to 64 Years | 17 (21.5%) | 0 (0.0%) |
| 65 to 74 Years | 13 (68.4%) | 4 (30.8%) |
| 75 Years and over | 5 (35.7%) | 0 (0.0%) |
Disability Class by Sex by Age in King Salmon
Disability Class: Hearing Difficulty
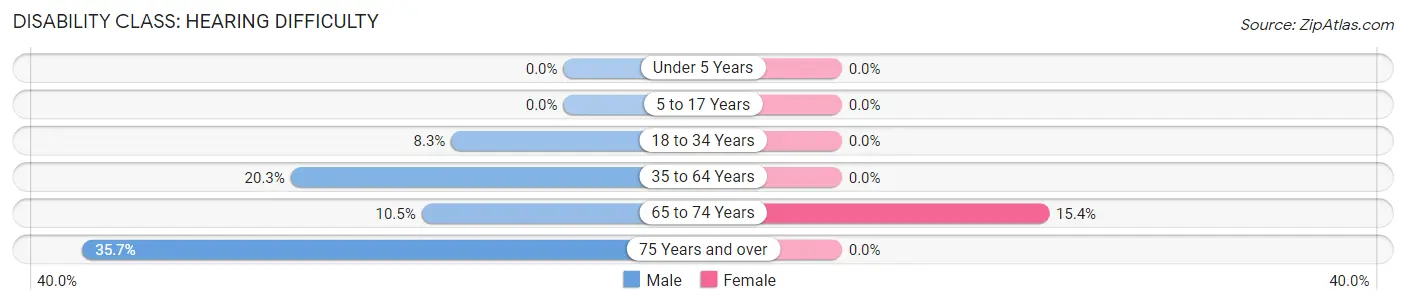
| Age Bracket | Male | Female |
| Under 5 Years | 0 (0.0%) | 0 (0.0%) |
| 5 to 17 Years | 0 (0.0%) | 0 (0.0%) |
| 18 to 34 Years | 2 (8.3%) | 0 (0.0%) |
| 35 to 64 Years | 16 (20.3%) | 0 (0.0%) |
| 65 to 74 Years | 2 (10.5%) | 2 (15.4%) |
| 75 Years and over | 5 (35.7%) | 0 (0.0%) |
Disability Class: Vision Difficulty
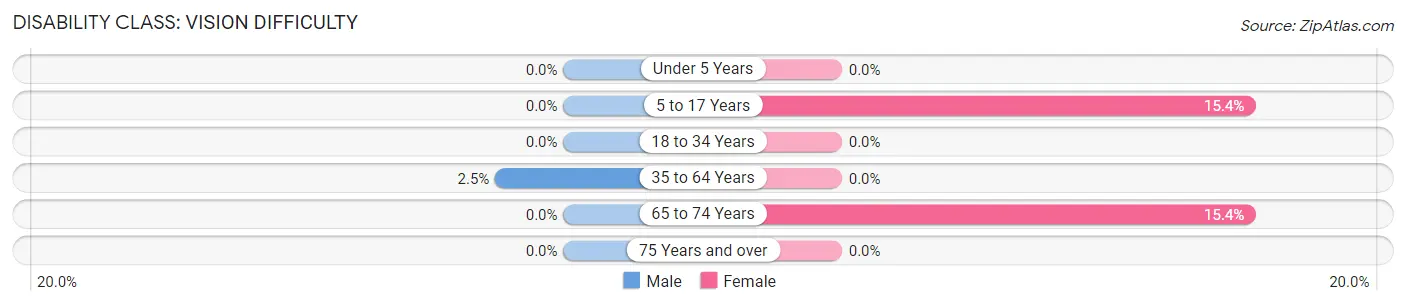
| Age Bracket | Male | Female |
| Under 5 Years | 0 (0.0%) | 0 (0.0%) |
| 5 to 17 Years | 0 (0.0%) | 4 (15.4%) |
| 18 to 34 Years | 0 (0.0%) | 0 (0.0%) |
| 35 to 64 Years | 2 (2.5%) | 0 (0.0%) |
| 65 to 74 Years | 0 (0.0%) | 2 (15.4%) |
| 75 Years and over | 0 (0.0%) | 0 (0.0%) |
Disability Class: Cognitive Difficulty
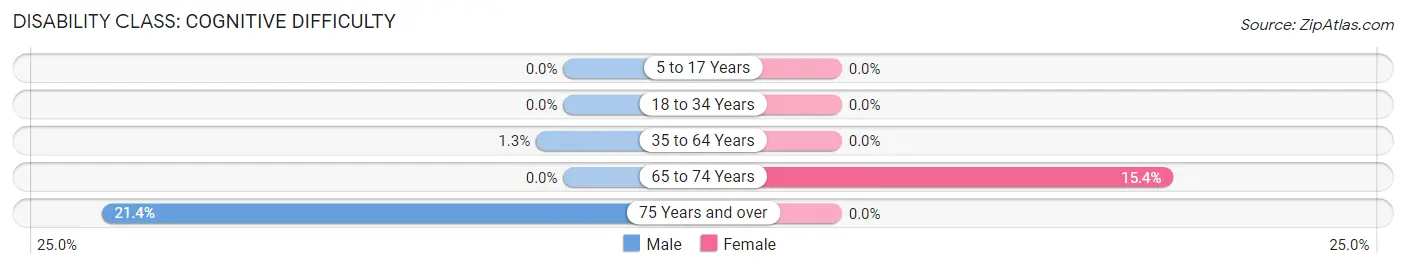
| Age Bracket | Male | Female |
| 5 to 17 Years | 0 (0.0%) | 0 (0.0%) |
| 18 to 34 Years | 0 (0.0%) | 0 (0.0%) |
| 35 to 64 Years | 1 (1.3%) | 0 (0.0%) |
| 65 to 74 Years | 0 (0.0%) | 2 (15.4%) |
| 75 Years and over | 3 (21.4%) | 0 (0.0%) |
Disability Class: Ambulatory Difficulty
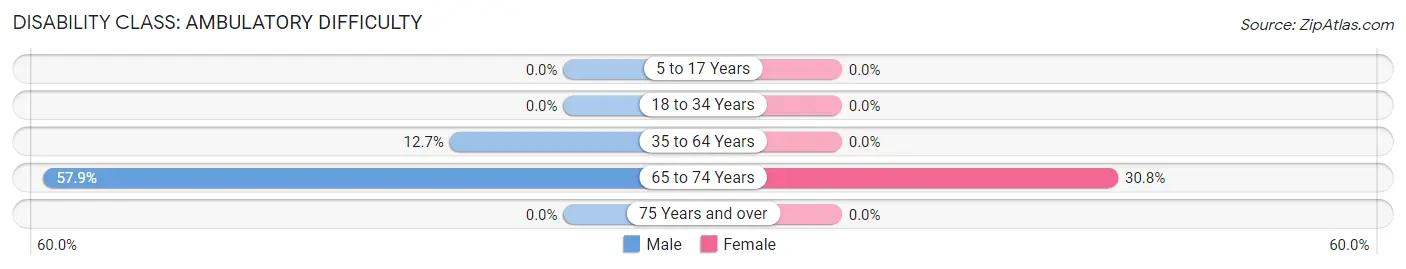
| Age Bracket | Male | Female |
| 5 to 17 Years | 0 (0.0%) | 0 (0.0%) |
| 18 to 34 Years | 0 (0.0%) | 0 (0.0%) |
| 35 to 64 Years | 10 (12.7%) | 0 (0.0%) |
| 65 to 74 Years | 11 (57.9%) | 4 (30.8%) |
| 75 Years and over | 0 (0.0%) | 0 (0.0%) |
Disability Class: Self-Care Difficulty
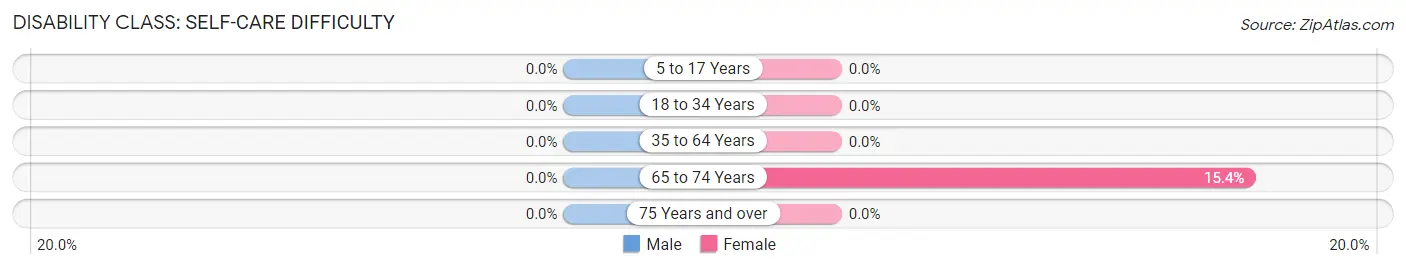
| Age Bracket | Male | Female |
| 5 to 17 Years | 0 (0.0%) | 0 (0.0%) |
| 18 to 34 Years | 0 (0.0%) | 0 (0.0%) |
| 35 to 64 Years | 0 (0.0%) | 0 (0.0%) |
| 65 to 74 Years | 0 (0.0%) | 2 (15.4%) |
| 75 Years and over | 0 (0.0%) | 0 (0.0%) |
Technology Access in King Salmon
Computing Device Access in King Salmon
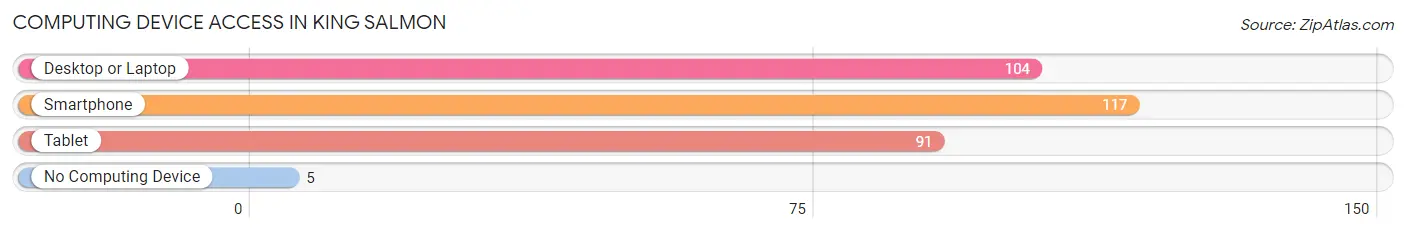
| Device Type | # Households | % Households |
| Desktop or Laptop | 104 | 82.5% |
| Smartphone | 117 | 92.9% |
| Tablet | 91 | 72.2% |
| No Computing Device | 5 | 4.0% |
| Total | 126 | 100.0% |
Internet Access in King Salmon
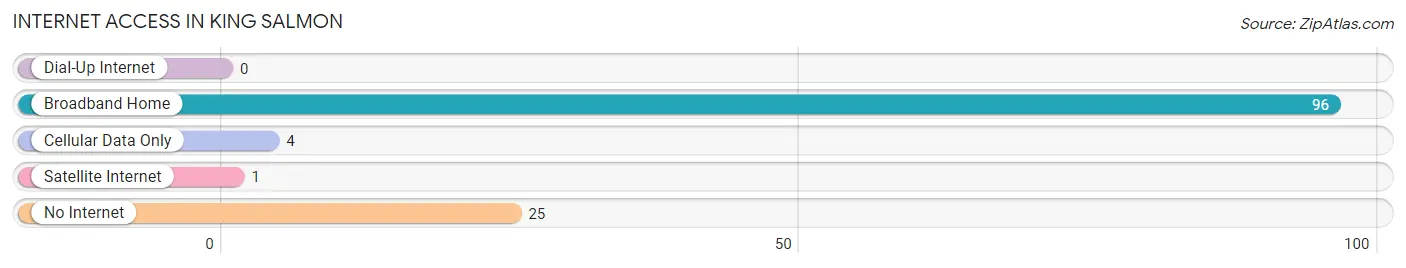
| Internet Type | # Households | % Households |
| Dial-Up Internet | 0 | 0.0% |
| Broadband Home | 96 | 76.2% |
| Cellular Data Only | 4 | 3.2% |
| Satellite Internet | 1 | 0.8% |
| No Internet | 25 | 19.8% |
| Total | 126 | 100.0% |
King Salmon Summary
Salmon, Alaska is a small fishing town located on the western coast of Alaska, in the United States. It is the largest city in the state of Alaska, with a population of approximately 6,000 people. The city is located on the banks of the Naknek River, which is a major salmon fishing river. The city is known for its abundance of salmon, which is why it is called “King Salmon.”
History
The area of King Salmon has been inhabited by the Alutiiq people for thousands of years. The first Europeans to visit the area were Russian fur traders in the late 1700s. The area was later explored by the United States in the early 1800s. In 1891, the first permanent settlement was established in the area, and it was named King Salmon. The town was named after the abundance of salmon in the area.
In the early 1900s, the town began to grow as a fishing and canning center. The canneries were the main source of employment for the town’s residents. In the 1950s, the town began to experience a decline in the fishing industry, and many of the canneries closed. In the 1970s, the town began to experience a resurgence in the fishing industry, and the canneries reopened.
Geography
King Salmon is located on the western coast of Alaska, in the United States. It is located on the banks of the Naknek River, which is a major salmon fishing river. The city is surrounded by mountains and forests, and is located near the Aleutian Islands. The climate in King Salmon is mild, with temperatures ranging from the mid-30s in the winter to the mid-60s in the summer.
Economy
The economy of King Salmon is largely based on fishing and tourism. The city is home to several commercial fishing companies, which employ many of the city’s residents. The city is also home to several tourist attractions, such as the Alaska Salmon Hatchery and the King Salmon Visitor Center. The city is also home to several restaurants, hotels, and other businesses that cater to tourists.
Demographics
As of the 2010 census, the population of King Salmon was 6,000 people. The population is largely made up of Native Americans, with the majority of the population being of Alutiiq descent. The city also has a large population of non-Native Americans, with the majority of the population being of European descent. The median household income in King Salmon is $50,000, and the median age is 35. The city has a high rate of poverty, with approximately 20% of the population living below the poverty line.
Common Questions
What is Per Capita Income in King Salmon?
Per Capita income in King Salmon is $49,567.
What is the Median Family Income in King Salmon?
Median Family Income in King Salmon is $112,222.
What is the Median Household income in King Salmon?
Median Household Income in King Salmon is $115,625.
What is Income or Wage Gap in King Salmon?
Income or Wage Gap in King Salmon is 31.1%.
Women in King Salmon earn 68.9 cents for every dollar earned by a man.
What is Inequality or Gini Index in King Salmon?
Inequality or Gini Index in King Salmon is 0.39.
What is the Total Population of King Salmon?
Total Population of King Salmon is 383.
What is the Total Male Population of King Salmon?
Total Male Population of King Salmon is 202.
What is the Total Female Population of King Salmon?
Total Female Population of King Salmon is 181.
What is the Ratio of Males per 100 Females in King Salmon?
There are 111.60 Males per 100 Females in King Salmon.
What is the Ratio of Females per 100 Males in King Salmon?
There are 89.60 Females per 100 Males in King Salmon.
What is the Median Population Age in King Salmon?
Median Population Age in King Salmon is 36.1 Years.
What is the Average Family Size in King Salmon
Average Family Size in King Salmon is 3.2 People.
What is the Average Household Size in King Salmon
Average Household Size in King Salmon is 2.8 People.
How Large is the Labor Force in King Salmon?
There are 226 People in the Labor Forcein in King Salmon.
What is the Percentage of People in the Labor Force in King Salmon?
75.1% of People are in the Labor Force in King Salmon.
What is the Unemployment Rate in King Salmon?
Unemployment Rate in King Salmon is 2.8%.