Kiana, AK Map & Demographics
Kiana Map
Kiana Overview
$20,511
PER CAPITA INCOME
$63,068
AVG FAMILY INCOME
$62,727
AVG HOUSEHOLD INCOME
5.9%
WAGE / INCOME GAP [ % ]
94.1¢/ $1
WAGE / INCOME GAP [ $ ]
0.43
INEQUALITY / GINI INDEX
422
TOTAL POPULATION
219
MALE POPULATION
203
FEMALE POPULATION
107.88
MALES / 100 FEMALES
92.69
FEMALES / 100 MALES
24.6
MEDIAN AGE
4.7
AVG FAMILY SIZE
4.7
AVG HOUSEHOLD SIZE
152
LABOR FORCE [ PEOPLE ]
52.6%
PERCENT IN LABOR FORCE
28.9%
UNEMPLOYMENT RATE
Kiana Zip Codes
Kiana Area Codes
Income in Kiana
Income Overview in Kiana
Per Capita Income in Kiana is $20,511, while median incomes of families and households are $63,068 and $62,727 respectively.
| Characteristic | Number | Measure |
| Per Capita Income | 422 | $20,511 |
| Median Family Income | 83 | $63,068 |
| Mean Family Income | 83 | $75,254 |
| Median Household Income | 90 | $62,727 |
| Mean Household Income | 90 | $77,344 |
| Income Deficit | 83 | $0 |
| Wage / Income Gap (%) | 422 | 5.93% |
| Wage / Income Gap ($) | 422 | 94.07¢ per $1 |
| Gini / Inequality Index | 422 | 0.43 |
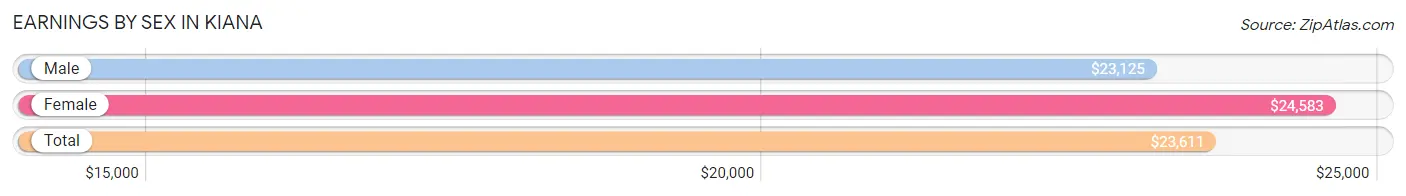
Earnings by Sex in Kiana
Average Earnings in Kiana are $23,611, $23,125 for men and $24,583 for women, a difference of 5.9%.
| Sex | Number | Average Earnings |
| Male | 97 (58.4%) | $23,125 |
| Female | 69 (41.6%) | $24,583 |
| Total | 166 (100.0%) | $23,611 |
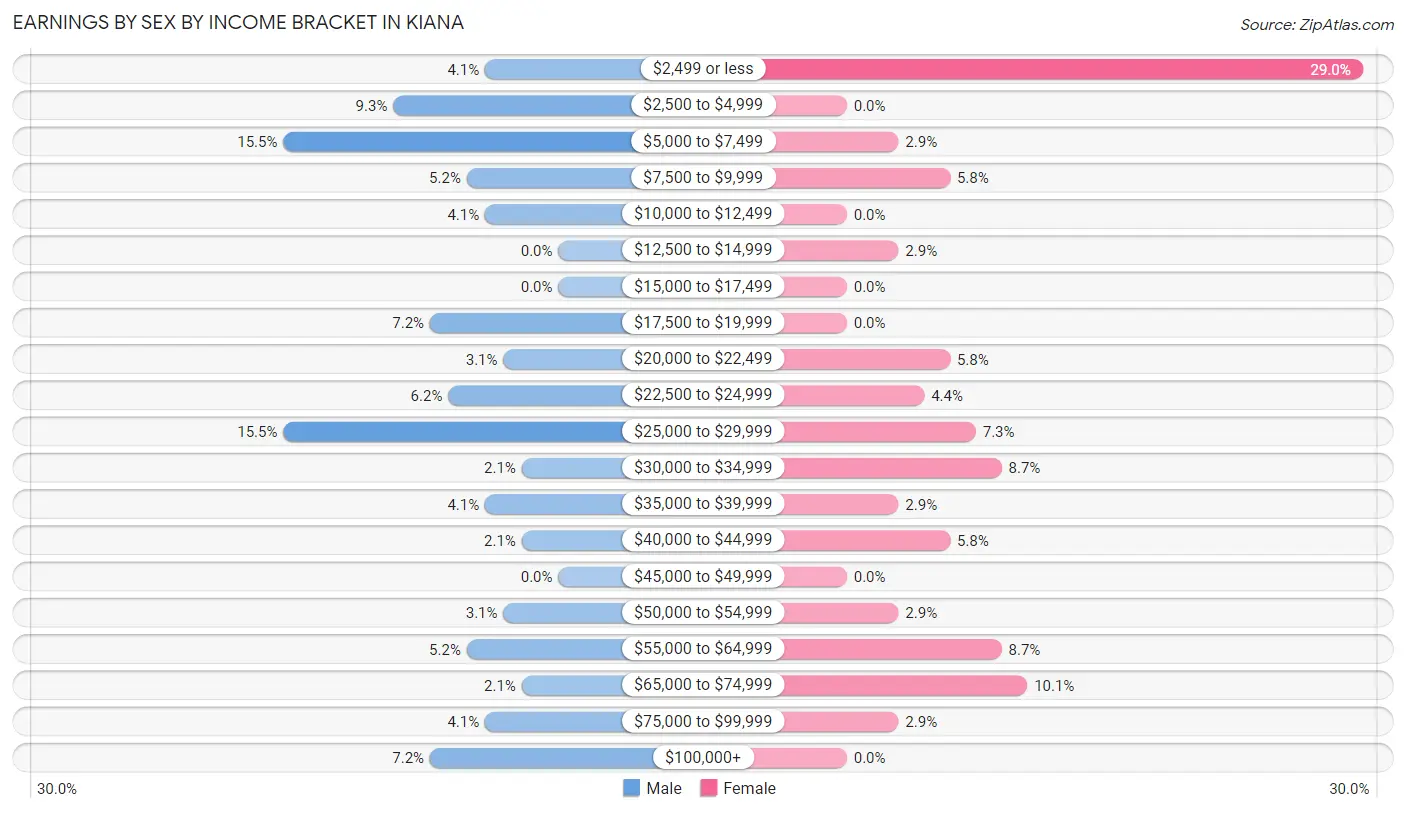
Earnings by Sex by Income Bracket in Kiana
The most common earnings brackets in Kiana are $5,000 to $7,499 for men (15 | 15.5%) and $2,499 or less for women (20 | 29.0%).
| Income | Male | Female |
| $2,499 or less | 4 (4.1%) | 20 (29.0%) |
| $2,500 to $4,999 | 9 (9.3%) | 0 (0.0%) |
| $5,000 to $7,499 | 15 (15.5%) | 2 (2.9%) |
| $7,500 to $9,999 | 5 (5.1%) | 4 (5.8%) |
| $10,000 to $12,499 | 4 (4.1%) | 0 (0.0%) |
| $12,500 to $14,999 | 0 (0.0%) | 2 (2.9%) |
| $15,000 to $17,499 | 0 (0.0%) | 0 (0.0%) |
| $17,500 to $19,999 | 7 (7.2%) | 0 (0.0%) |
| $20,000 to $22,499 | 3 (3.1%) | 4 (5.8%) |
| $22,500 to $24,999 | 6 (6.2%) | 3 (4.3%) |
| $25,000 to $29,999 | 15 (15.5%) | 5 (7.2%) |
| $30,000 to $34,999 | 2 (2.1%) | 6 (8.7%) |
| $35,000 to $39,999 | 4 (4.1%) | 2 (2.9%) |
| $40,000 to $44,999 | 2 (2.1%) | 4 (5.8%) |
| $45,000 to $49,999 | 0 (0.0%) | 0 (0.0%) |
| $50,000 to $54,999 | 3 (3.1%) | 2 (2.9%) |
| $55,000 to $64,999 | 5 (5.1%) | 6 (8.7%) |
| $65,000 to $74,999 | 2 (2.1%) | 7 (10.1%) |
| $75,000 to $99,999 | 4 (4.1%) | 2 (2.9%) |
| $100,000+ | 7 (7.2%) | 0 (0.0%) |
| Total | 97 (100.0%) | 69 (100.0%) |
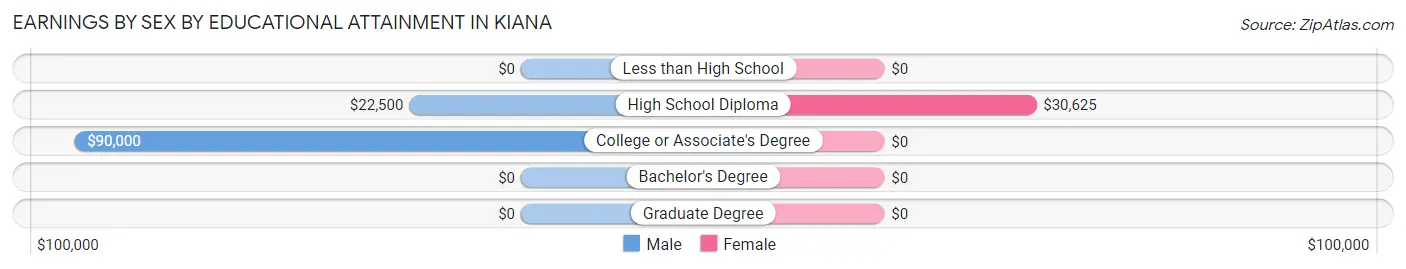
Earnings by Sex by Educational Attainment in Kiana
Average earnings in Kiana are $23,958 for men and $30,000 for women, a difference of 20.1%. Men with an educational attainment of college or associate's degree enjoy the highest average annual earnings of $90,000, while those with high school diploma education earn the least with $22,500. Women with an educational attainment of high school diploma earn the most with the average annual earnings of $30,625, while those with high school diploma education have the smallest earnings of $30,625.
| Educational Attainment | Male Income | Female Income |
| Less than High School | - | - |
| High School Diploma | $22,500 | $30,625 |
| College or Associate's Degree | $90,000 | $0 |
| Bachelor's Degree | - | - |
| Graduate Degree | - | - |
| Total | $23,958 | $30,000 |
Family Income in Kiana
Family Income Brackets in Kiana
According to the Kiana family income data, there are 22 families falling into the $50,000 to $74,999 income range, which is the most common income bracket and makes up 26.5% of all families. Conversely, the $150,000 to $199,999 income bracket is the least frequent group with only 2 families (2.4%) belonging to this category.
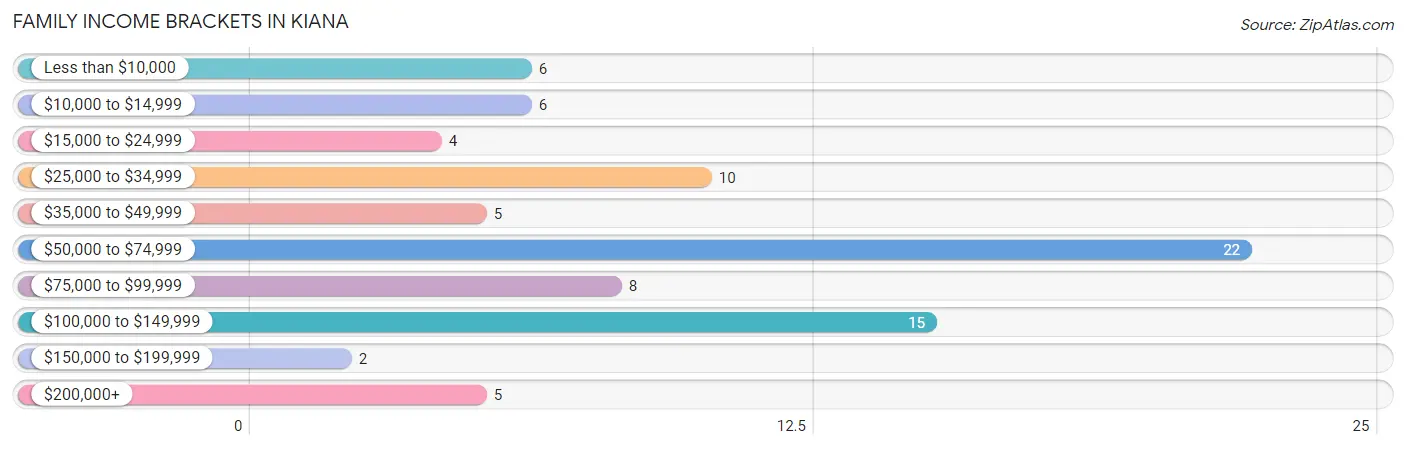
| Income Bracket | # Families | % Families |
| Less than $10,000 | 6 | 7.2% |
| $10,000 to $14,999 | 6 | 7.2% |
| $15,000 to $24,999 | 4 | 4.8% |
| $25,000 to $34,999 | 10 | 12.0% |
| $35,000 to $49,999 | 5 | 6.0% |
| $50,000 to $74,999 | 22 | 26.5% |
| $75,000 to $99,999 | 8 | 9.6% |
| $100,000 to $149,999 | 15 | 18.1% |
| $150,000 to $199,999 | 2 | 2.4% |
| $200,000+ | 5 | 6.0% |
Family Income by Famaliy Size in Kiana
7+ person families (9 | 10.8%) account for the highest median family income in Kiana with $123,750 per family, while 2-person families (22 | 26.5%) have the highest median income of $31,666 per family member.
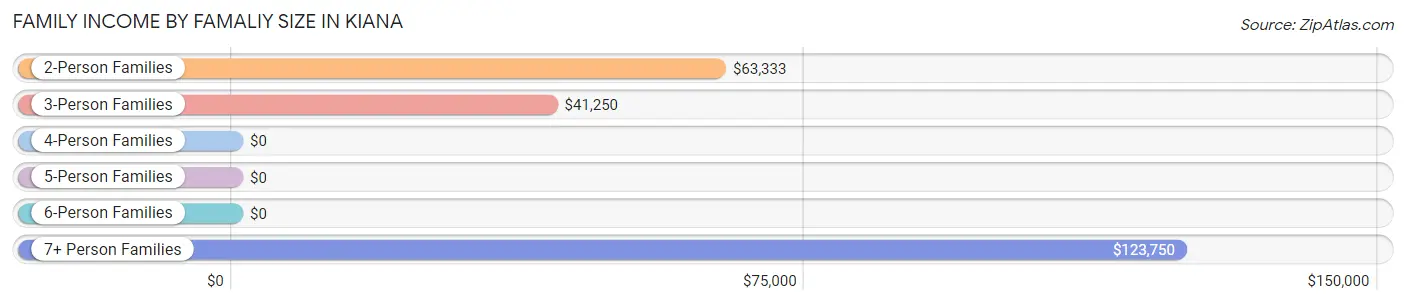
| Income Bracket | # Families | Median Income |
| 2-Person Families | 22 (26.5%) | $63,333 |
| 3-Person Families | 31 (37.3%) | $41,250 |
| 4-Person Families | 8 (9.6%) | $0 |
| 5-Person Families | 13 (15.7%) | $0 |
| 6-Person Families | 0 (0.0%) | $0 |
| 7+ Person Families | 9 (10.8%) | $123,750 |
| Total | 83 (100.0%) | $63,068 |
Family Income by Number of Earners in Kiana
The median family income in Kiana is $63,068, with families comprising 3+ earners (7) having the highest median family income of $155,625, while families with no earners (23) have the lowest median family income of $31,875, accounting for 8.4% and 27.7% of families, respectively.
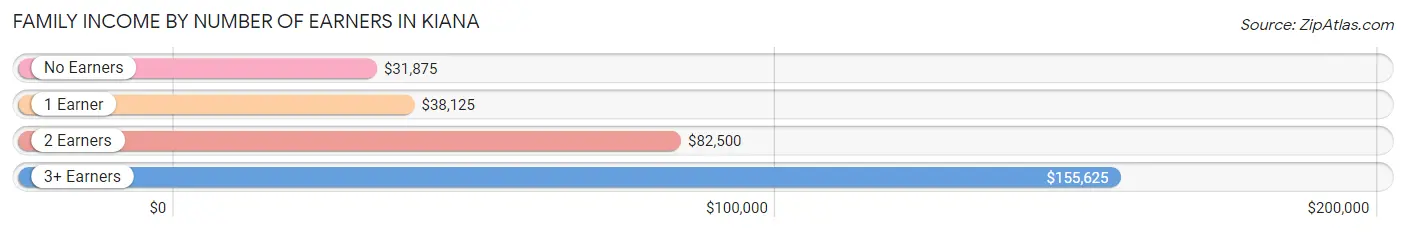
| Number of Earners | # Families | Median Income |
| No Earners | 23 (27.7%) | $31,875 |
| 1 Earner | 21 (25.3%) | $38,125 |
| 2 Earners | 32 (38.6%) | $82,500 |
| 3+ Earners | 7 (8.4%) | $155,625 |
| Total | 83 (100.0%) | $63,068 |
Household Income in Kiana
Household Income Brackets in Kiana
With 26 households falling in the category, the $50,000 to $74,999 income range is the most frequent in Kiana, accounting for 28.9% of all households. In contrast, only 2 households (2.2%) fall into the $15,000 to $24,999 income bracket, making it the least populous group.
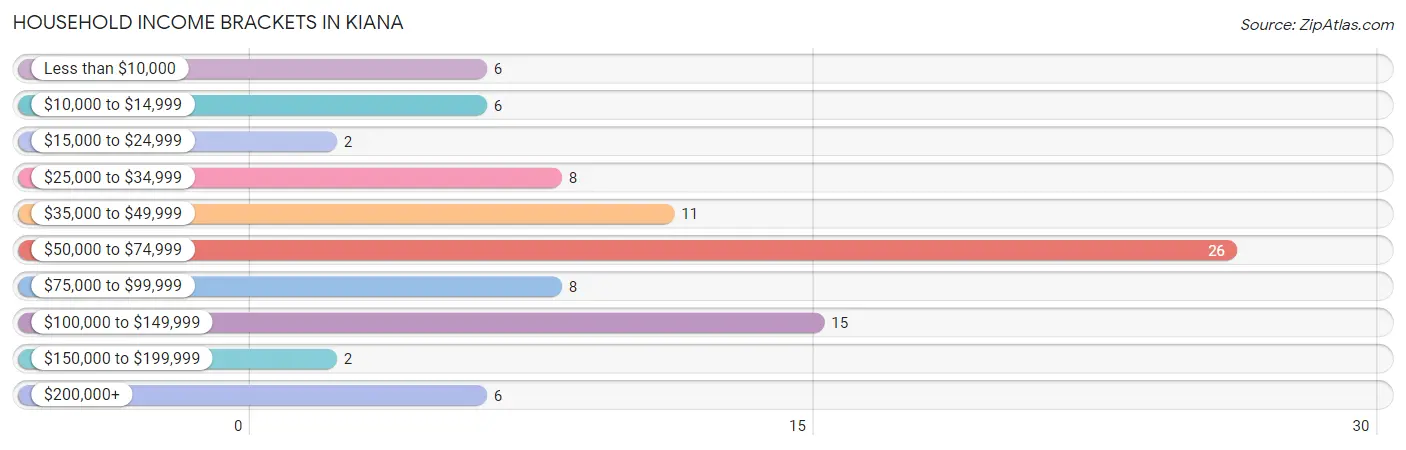
| Income Bracket | # Households | % Households |
| Less than $10,000 | 6 | 6.7% |
| $10,000 to $14,999 | 6 | 6.7% |
| $15,000 to $24,999 | 2 | 2.2% |
| $25,000 to $34,999 | 8 | 8.9% |
| $35,000 to $49,999 | 11 | 12.2% |
| $50,000 to $74,999 | 26 | 28.9% |
| $75,000 to $99,999 | 8 | 8.9% |
| $100,000 to $149,999 | 15 | 16.7% |
| $150,000 to $199,999 | 2 | 2.2% |
| $200,000+ | 6 | 6.7% |
Household Income by Householder Age in Kiana
The median household income in Kiana is $62,727, with the highest median household income of $64,306 found in the 65+ years age bracket for the primary householder. A total of 29 households (32.2%) fall into this category. Meanwhile, the 15 to 24 years age bracket for the primary householder has the lowest median household income of $0, with 2 households (2.2%) in this group.
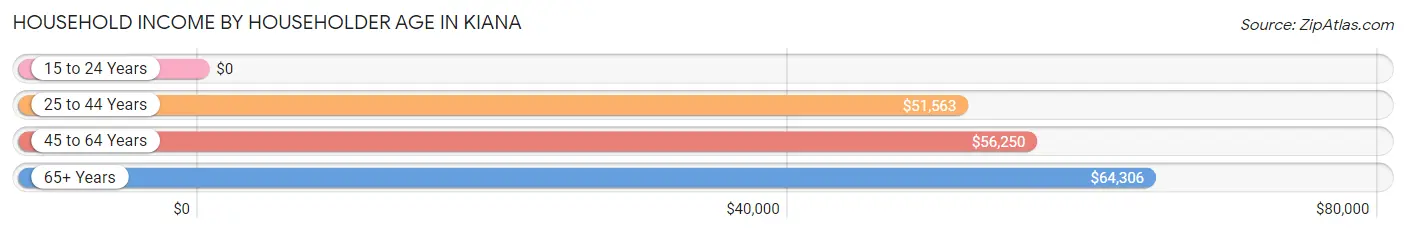
| Income Bracket | # Households | Median Income |
| 15 to 24 Years | 2 (2.2%) | $0 |
| 25 to 44 Years | 21 (23.3%) | $51,563 |
| 45 to 64 Years | 38 (42.2%) | $56,250 |
| 65+ Years | 29 (32.2%) | $64,306 |
| Total | 90 (100.0%) | $62,727 |
Poverty in Kiana
Income Below Poverty by Sex and Age in Kiana
With 23.7% poverty level for males and 25.6% for females among the residents of Kiana, 6 to 11 year old males and 12 to 14 year old females are the most vulnerable to poverty, with 24 males (61.5%) and 2 females (50.0%) in their respective age groups living below the poverty level.
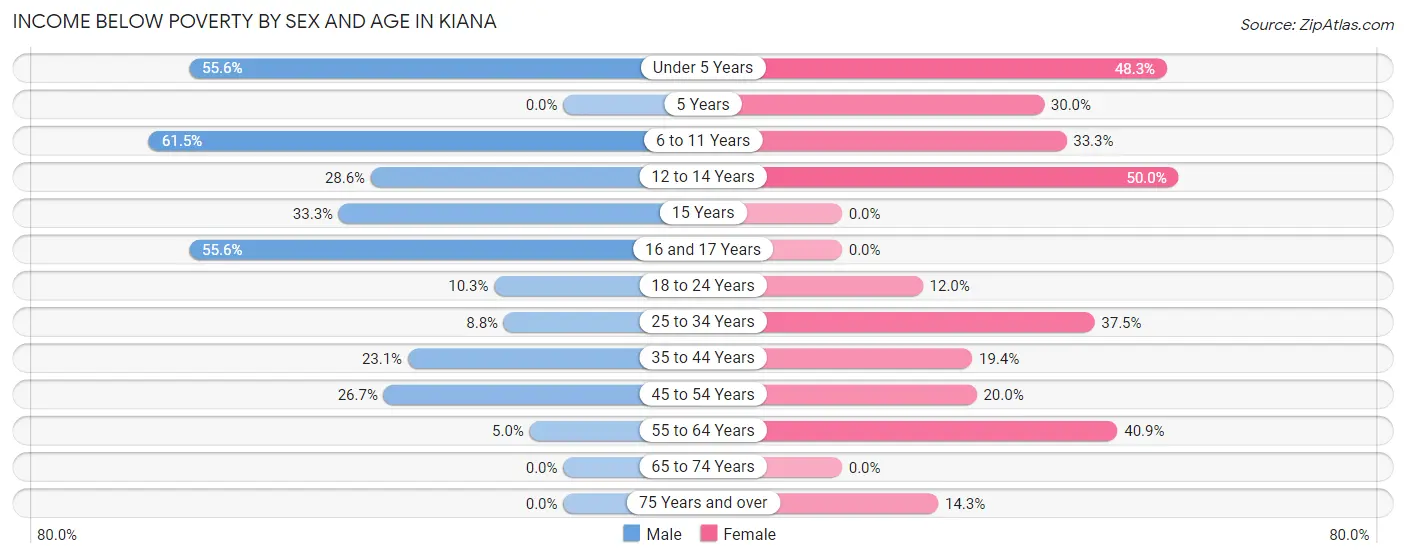
| Age Bracket | Male | Female |
| Under 5 Years | 5 (55.6%) | 14 (48.3%) |
| 5 Years | 0 (0.0%) | 3 (30.0%) |
| 6 to 11 Years | 24 (61.5%) | 9 (33.3%) |
| 12 to 14 Years | 2 (28.6%) | 2 (50.0%) |
| 15 Years | 1 (33.3%) | 0 (0.0%) |
| 16 and 17 Years | 5 (55.6%) | 0 (0.0%) |
| 18 to 24 Years | 4 (10.3%) | 3 (12.0%) |
| 25 to 34 Years | 3 (8.8%) | 3 (37.5%) |
| 35 to 44 Years | 3 (23.1%) | 6 (19.4%) |
| 45 to 54 Years | 4 (26.7%) | 2 (20.0%) |
| 55 to 64 Years | 1 (5.0%) | 9 (40.9%) |
| 65 to 74 Years | 0 (0.0%) | 0 (0.0%) |
| 75 Years and over | 0 (0.0%) | 1 (14.3%) |
| Total | 52 (23.7%) | 52 (25.6%) |
Income Above Poverty by Sex and Age in Kiana
According to the poverty statistics in Kiana, males aged 5 years and females aged 16 and 17 years are the age groups that are most secure financially, with 100.0% of males and 100.0% of females in these age groups living above the poverty line.
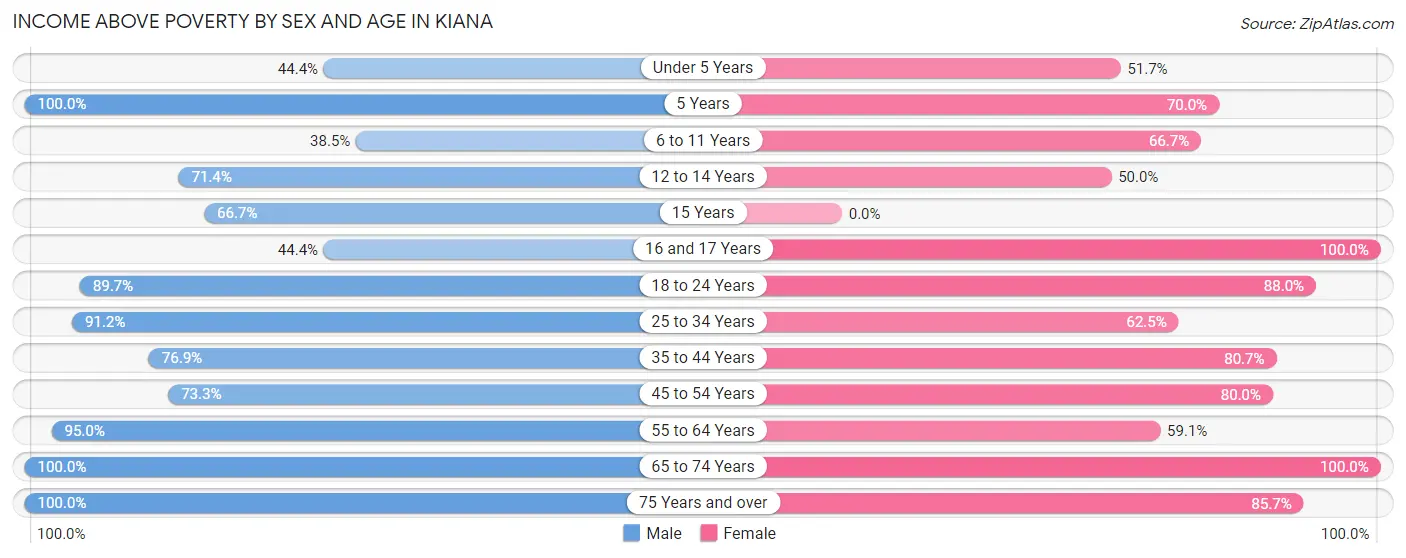
| Age Bracket | Male | Female |
| Under 5 Years | 4 (44.4%) | 15 (51.7%) |
| 5 Years | 5 (100.0%) | 7 (70.0%) |
| 6 to 11 Years | 15 (38.5%) | 18 (66.7%) |
| 12 to 14 Years | 5 (71.4%) | 2 (50.0%) |
| 15 Years | 2 (66.7%) | 0 (0.0%) |
| 16 and 17 Years | 4 (44.4%) | 11 (100.0%) |
| 18 to 24 Years | 35 (89.7%) | 22 (88.0%) |
| 25 to 34 Years | 31 (91.2%) | 5 (62.5%) |
| 35 to 44 Years | 10 (76.9%) | 25 (80.6%) |
| 45 to 54 Years | 11 (73.3%) | 8 (80.0%) |
| 55 to 64 Years | 19 (95.0%) | 13 (59.1%) |
| 65 to 74 Years | 12 (100.0%) | 19 (100.0%) |
| 75 Years and over | 14 (100.0%) | 6 (85.7%) |
| Total | 167 (76.3%) | 151 (74.4%) |
Income Below Poverty Among Married-Couple Families in Kiana
The poverty statistics for married-couple families in Kiana show that 2.6% or 1 of the total 38 families live below the poverty line. Families with 1 or 2 children have the highest poverty rate of 11.1%, comprising of 1 families. On the other hand, families with no children have the lowest poverty rate of 0.0%, which includes 0 families.
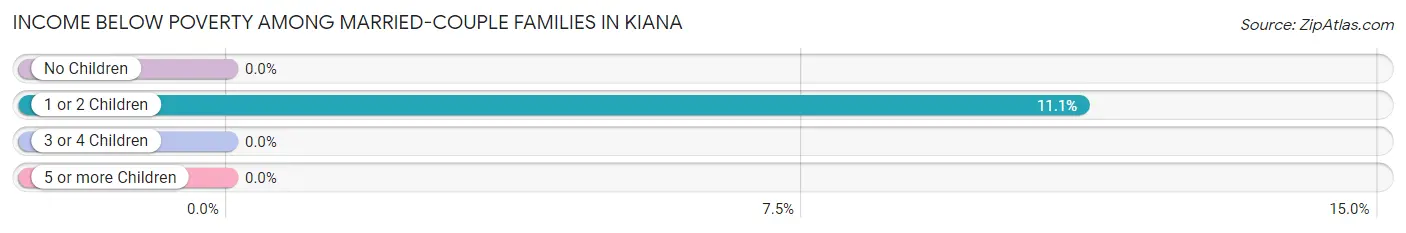
| Children | Above Poverty | Below Poverty |
| No Children | 25 (100.0%) | 0 (0.0%) |
| 1 or 2 Children | 8 (88.9%) | 1 (11.1%) |
| 3 or 4 Children | 4 (100.0%) | 0 (0.0%) |
| 5 or more Children | 0 (0.0%) | 0 (0.0%) |
| Total | 37 (97.4%) | 1 (2.6%) |
Income Below Poverty Among Single-Parent Households in Kiana
According to the poverty data in Kiana, 36.4% or 4 single-father households and 38.2% or 13 single-mother households are living below the poverty line. Among single-father households, those with 3 or 4 children have the highest poverty rate, with 2 households (100.0%) experiencing poverty. Likewise, among single-mother households, those with 3 or 4 children have the highest poverty rate, with 4 households (100.0%) falling below the poverty line.
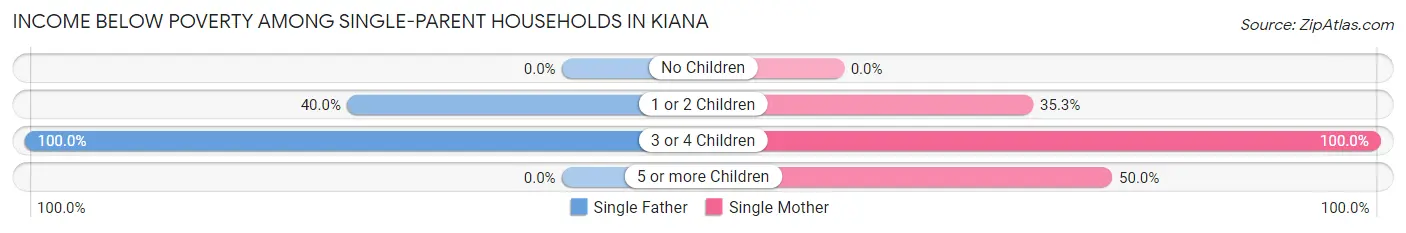
| Children | Single Father | Single Mother |
| No Children | 0 (0.0%) | 0 (0.0%) |
| 1 or 2 Children | 2 (40.0%) | 6 (35.3%) |
| 3 or 4 Children | 2 (100.0%) | 4 (100.0%) |
| 5 or more Children | 0 (0.0%) | 3 (50.0%) |
| Total | 4 (36.4%) | 13 (38.2%) |
Income Below Poverty Among Married-Couple vs Single-Parent Households in Kiana
The poverty data for Kiana shows that 1 of the married-couple family households (2.6%) and 17 of the single-parent households (37.8%) are living below the poverty level. Within the married-couple family households, those with 1 or 2 children have the highest poverty rate, with 1 households (11.1%) falling below the poverty line. Among the single-parent households, those with 3 or 4 children have the highest poverty rate, with 6 household (100.0%) living below poverty.
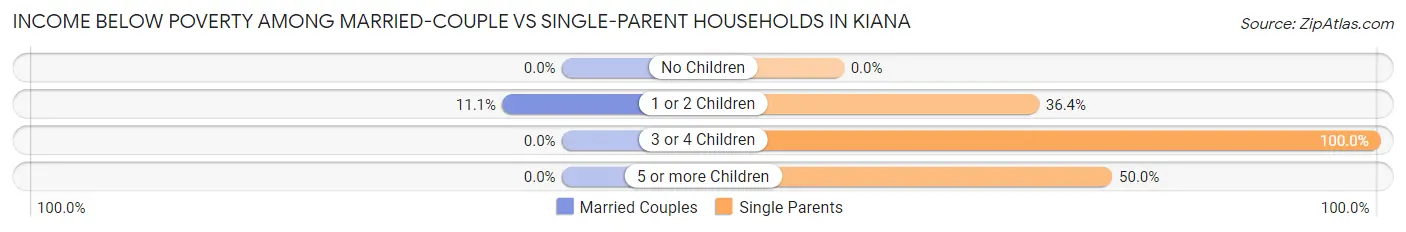
| Children | Married-Couple Families | Single-Parent Households |
| No Children | 0 (0.0%) | 0 (0.0%) |
| 1 or 2 Children | 1 (11.1%) | 8 (36.4%) |
| 3 or 4 Children | 0 (0.0%) | 6 (100.0%) |
| 5 or more Children | 0 (0.0%) | 3 (50.0%) |
| Total | 1 (2.6%) | 17 (37.8%) |
Race in Kiana
The most populous races in Kiana are Native / Alaskan (402 | 95.3%), White / Caucasian (20 | 4.7%), and Hispanic or Latino (14 | 3.3%).
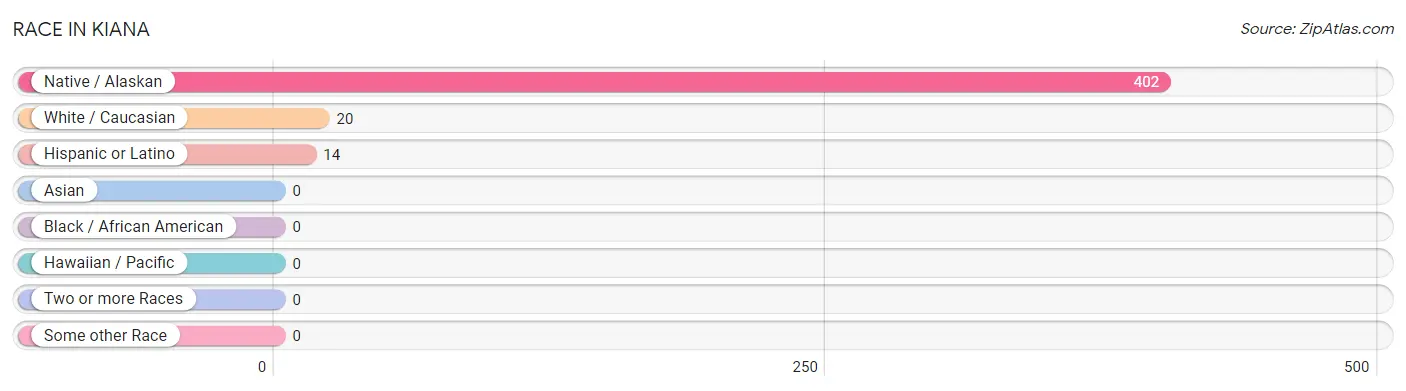
| Race | # Population | % Population |
| Asian | 0 | 0.0% |
| Black / African American | 0 | 0.0% |
| Hawaiian / Pacific | 0 | 0.0% |
| Hispanic or Latino | 14 | 3.3% |
| Native / Alaskan | 402 | 95.3% |
| White / Caucasian | 20 | 4.7% |
| Two or more Races | 0 | 0.0% |
| Some other Race | 0 | 0.0% |
| Total | 422 | 100.0% |
Ancestry in Kiana
The most populous ancestries reported in Kiana are Inupiat (392 | 92.9%), Mexican (14 | 3.3%), Alaska Native (10 | 2.4%), European (4 | 0.9%), and German (4 | 0.9%), together accounting for 100.5% of all Kiana residents.
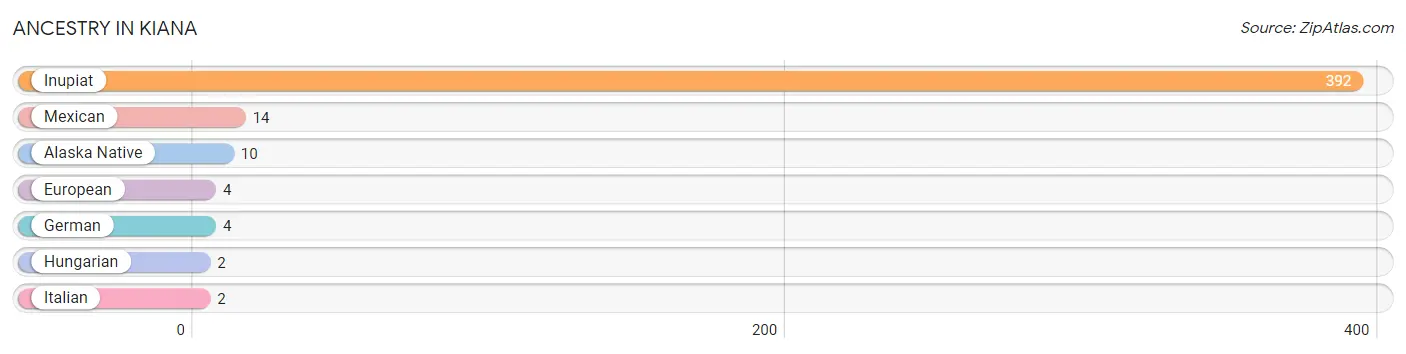
| Ancestry | # Population | % Population |
| Alaska Native | 10 | 2.4% |
| European | 4 | 0.9% |
| German | 4 | 0.9% |
| Hungarian | 2 | 0.5% |
| Inupiat | 392 | 92.9% |
| Italian | 2 | 0.5% |
| Mexican | 14 | 3.3% | View All 7 Rows |
Immigrants in Kiana

| Immigration Origin | # Population | % Population | View All 0 Rows |
Sex and Age in Kiana
Sex and Age in Kiana
The most populous age groups in Kiana are 20 to 24 Years (30 | 13.7%) for men and Under 5 Years (29 | 14.3%) for women.
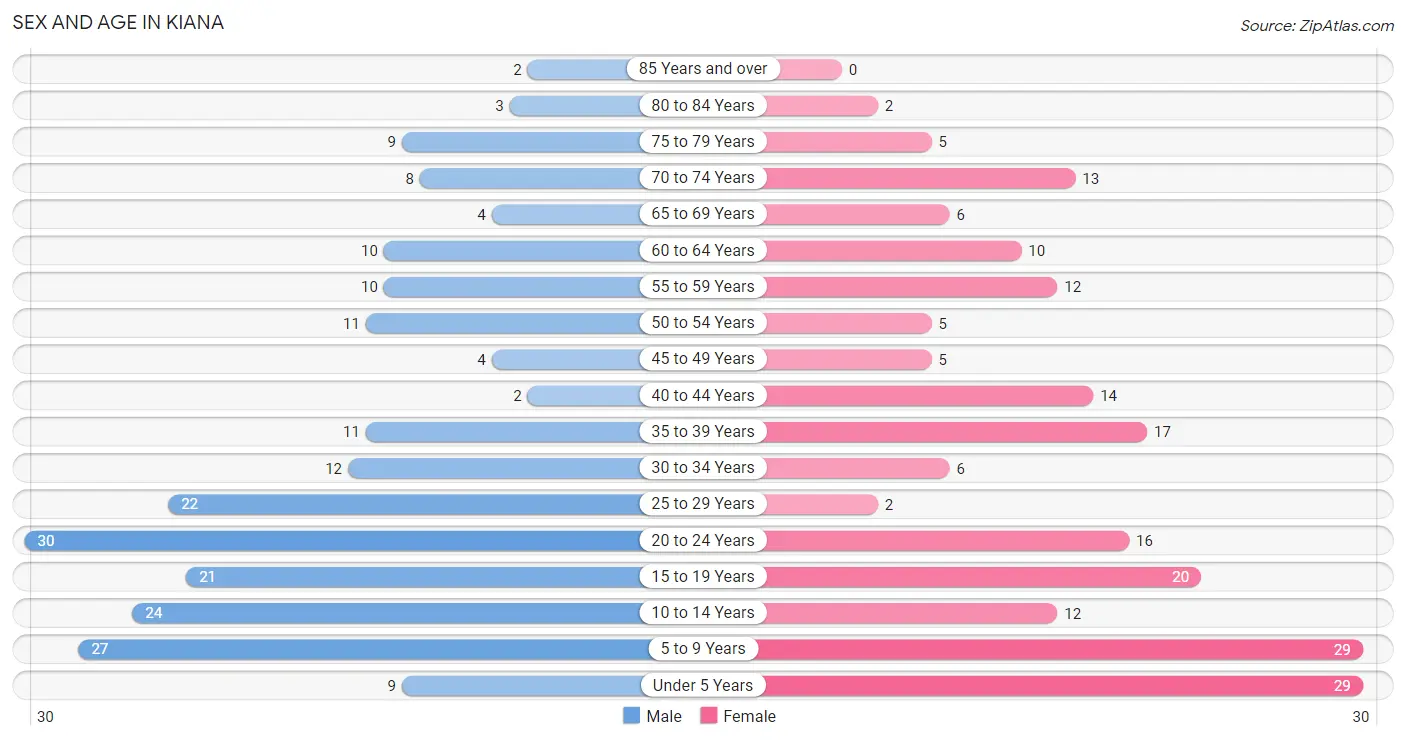
| Age Bracket | Male | Female |
| Under 5 Years | 9 (4.1%) | 29 (14.3%) |
| 5 to 9 Years | 27 (12.3%) | 29 (14.3%) |
| 10 to 14 Years | 24 (11.0%) | 12 (5.9%) |
| 15 to 19 Years | 21 (9.6%) | 20 (9.9%) |
| 20 to 24 Years | 30 (13.7%) | 16 (7.9%) |
| 25 to 29 Years | 22 (10.1%) | 2 (1.0%) |
| 30 to 34 Years | 12 (5.5%) | 6 (3.0%) |
| 35 to 39 Years | 11 (5.0%) | 17 (8.4%) |
| 40 to 44 Years | 2 (0.9%) | 14 (6.9%) |
| 45 to 49 Years | 4 (1.8%) | 5 (2.5%) |
| 50 to 54 Years | 11 (5.0%) | 5 (2.5%) |
| 55 to 59 Years | 10 (4.6%) | 12 (5.9%) |
| 60 to 64 Years | 10 (4.6%) | 10 (4.9%) |
| 65 to 69 Years | 4 (1.8%) | 6 (3.0%) |
| 70 to 74 Years | 8 (3.6%) | 13 (6.4%) |
| 75 to 79 Years | 9 (4.1%) | 5 (2.5%) |
| 80 to 84 Years | 3 (1.4%) | 2 (1.0%) |
| 85 Years and over | 2 (0.9%) | 0 (0.0%) |
| Total | 219 (100.0%) | 203 (100.0%) |
Families and Households in Kiana
Median Family Size in Kiana
The median family size in Kiana is 4.73 persons per family, with single female/mother families (34 | 41.0%) accounting for the largest median family size of 4.82 persons per family. On the other hand, single male/father families (11 | 13.3%) represent the smallest median family size with 4.45 persons per family.
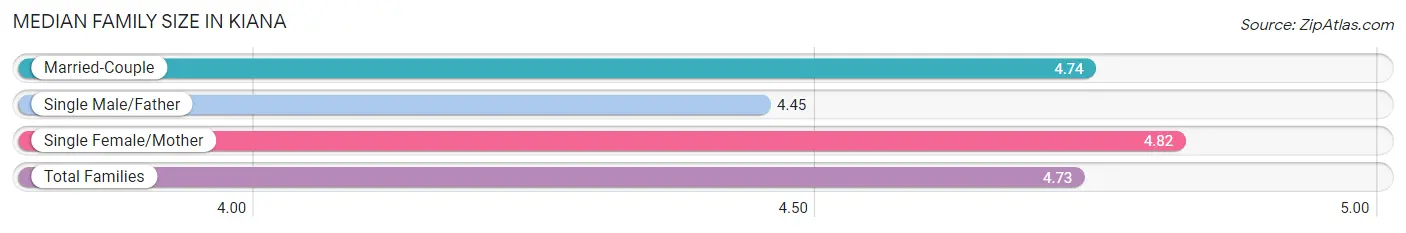
| Family Type | # Families | Family Size |
| Married-Couple | 38 (45.8%) | 4.74 |
| Single Male/Father | 11 (13.3%) | 4.45 |
| Single Female/Mother | 34 (41.0%) | 4.82 |
| Total Families | 83 (100.0%) | 4.73 |
Median Household Size in Kiana
The median household size in Kiana is 4.69 persons per household, with single female/mother households (34 | 37.8%) accounting for the largest median household size of 5.26 persons per household. non-family households (7 | 7.8%) represent the smallest median household size with 1.29 persons per household.
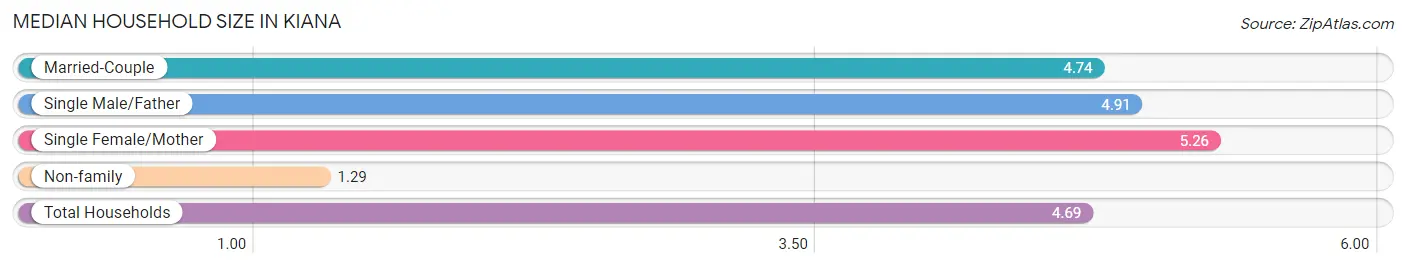
| Household Type | # Households | Household Size |
| Married-Couple | 38 (42.2%) | 4.74 |
| Single Male/Father | 11 (12.2%) | 4.91 |
| Single Female/Mother | 34 (37.8%) | 5.26 |
| Non-family | 7 (7.8%) | 1.29 |
| Total Households | 90 (100.0%) | 4.69 |
Household Size by Marriage Status in Kiana
Out of a total of 90 households in Kiana, 83 (92.2%) are family households, while 7 (7.8%) are nonfamily households. The most numerous type of family households are 3-person households, comprising 30, and the most common type of nonfamily households are 1-person households, comprising 5.
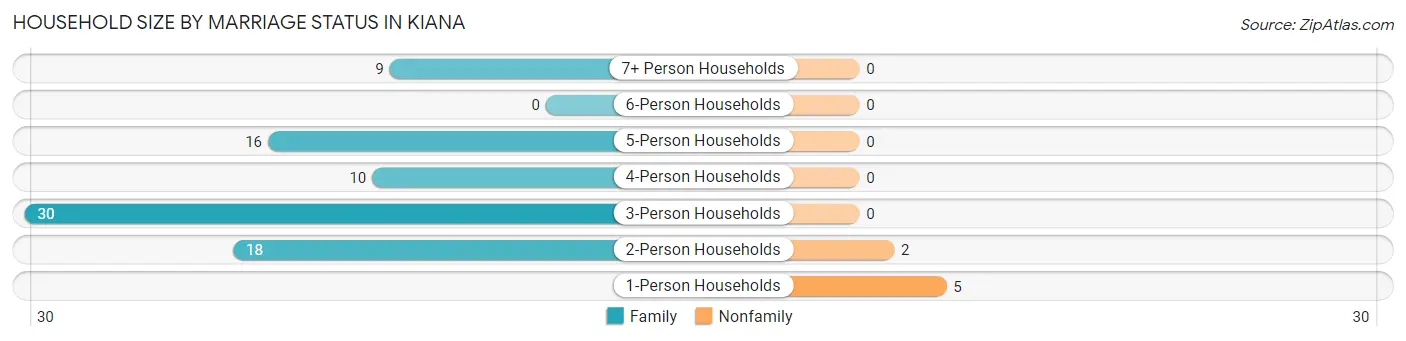
| Household Size | Family Households | Nonfamily Households |
| 1-Person Households | - | 5 (5.6%) |
| 2-Person Households | 18 (20.0%) | 2 (2.2%) |
| 3-Person Households | 30 (33.3%) | 0 (0.0%) |
| 4-Person Households | 10 (11.1%) | 0 (0.0%) |
| 5-Person Households | 16 (17.8%) | 0 (0.0%) |
| 6-Person Households | 0 (0.0%) | 0 (0.0%) |
| 7+ Person Households | 9 (10.0%) | 0 (0.0%) |
| Total | 83 (92.2%) | 7 (7.8%) |
Female Fertility in Kiana
Fertility by Age in Kiana
Average fertility rate in Kiana is 38.0 births per 1,000 women. Women in the age bracket of 20 to 34 years have the highest fertility rate with 125.0 births per 1,000 women. Women in the age bracket of 20 to 34 years acount for 100.0% of all women with births.
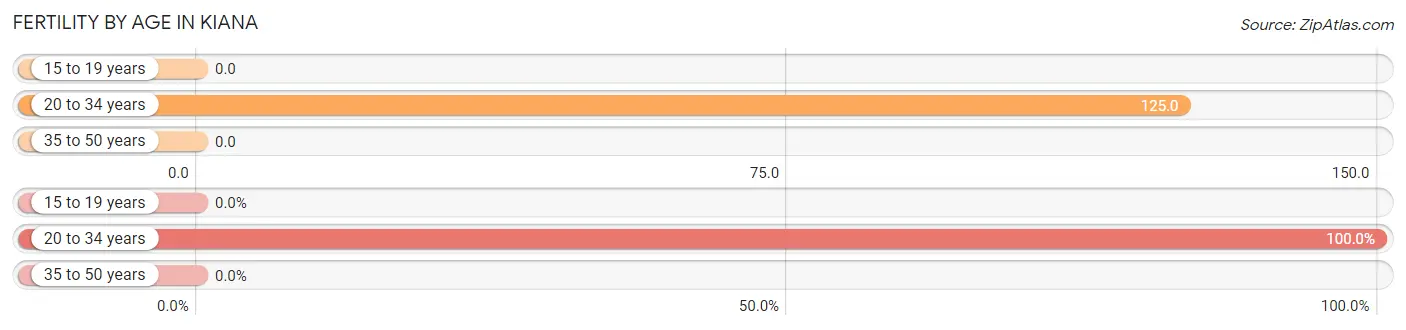
| Age Bracket | Women with Births | Births / 1,000 Women |
| 15 to 19 years | 0 (0.0%) | 0.0 |
| 20 to 34 years | 3 (100.0%) | 125.0 |
| 35 to 50 years | 0 (0.0%) | 0.0 |
| Total | 3 (100.0%) | 38.0 |
Fertility by Age by Marriage Status in Kiana
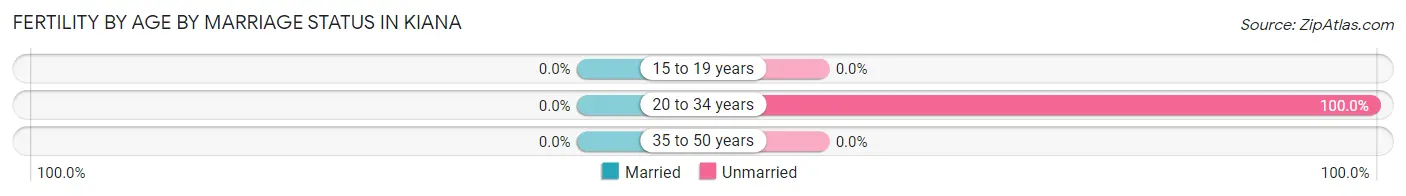
| Age Bracket | Married | Unmarried |
| 15 to 19 years | 0 (0.0%) | 0 (0.0%) |
| 20 to 34 years | 0 (0.0%) | 3 (100.0%) |
| 35 to 50 years | 0 (0.0%) | 0 (0.0%) |
| Total | 0 (0.0%) | 3 (100.0%) |
Fertility by Education in Kiana
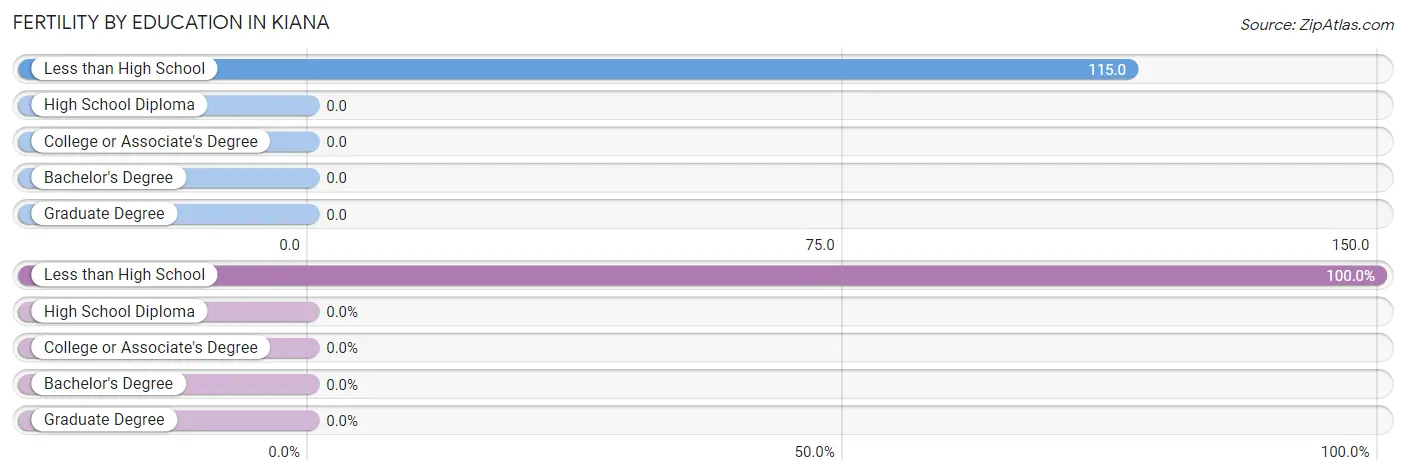
| Educational Attainment | Women with Births | Births / 1,000 Women |
| Less than High School | 3 (100.0%) | 115.0 |
| High School Diploma | 0 (0.0%) | 0.0 |
| College or Associate's Degree | 0 (0.0%) | 0.0 |
| Bachelor's Degree | 0 (0.0%) | 0.0 |
| Graduate Degree | 0 (0.0%) | 0.0 |
| Total | 3 (100.0%) | 38.0 |
Fertility by Education by Marriage Status in Kiana
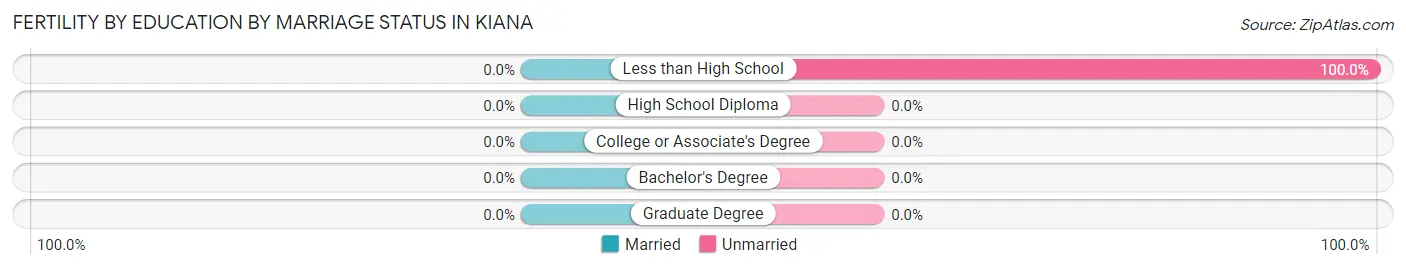
| Educational Attainment | Married | Unmarried |
| Less than High School | 0 (0.0%) | 3 (100.0%) |
| High School Diploma | 0 (0.0%) | 0 (0.0%) |
| College or Associate's Degree | 0 (0.0%) | 0 (0.0%) |
| Bachelor's Degree | 0 (0.0%) | 0 (0.0%) |
| Graduate Degree | 0 (0.0%) | 0 (0.0%) |
| Total | 0 (0.0%) | 3 (100.0%) |
Employment Characteristics in Kiana
Employment by Class of Employer in Kiana
Among the 91 employed individuals in Kiana, private company employees (46 | 50.5%), local government employees (28 | 30.8%), and not-for-profit organizations (8 | 8.8%) make up the most common classes of employment.
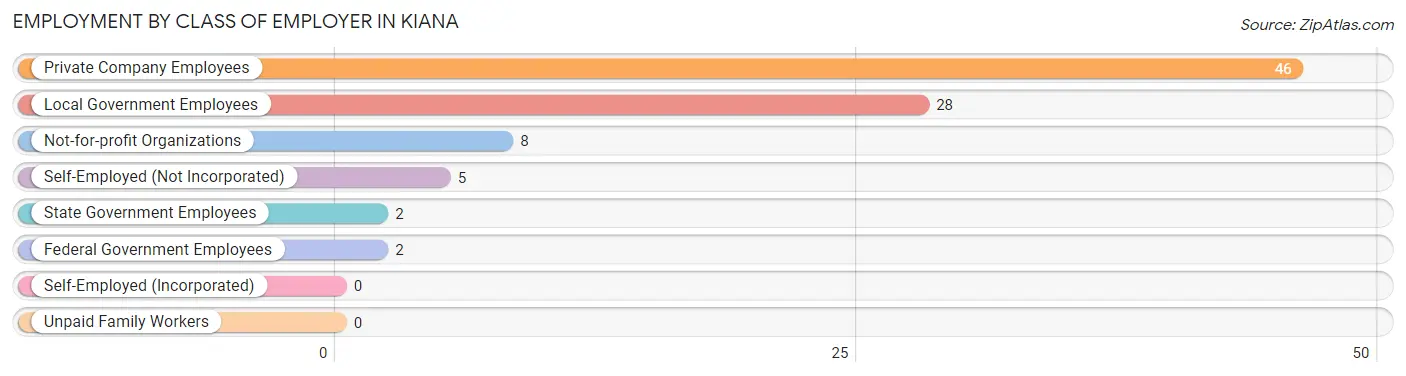
| Employer Class | # Employees | % Employees |
| Private Company Employees | 46 | 50.5% |
| Self-Employed (Incorporated) | 0 | 0.0% |
| Self-Employed (Not Incorporated) | 5 | 5.5% |
| Not-for-profit Organizations | 8 | 8.8% |
| Local Government Employees | 28 | 30.8% |
| State Government Employees | 2 | 2.2% |
| Federal Government Employees | 2 | 2.2% |
| Unpaid Family Workers | 0 | 0.0% |
| Total | 91 | 100.0% |
Employment Status by Age in Kiana
According to the labor force statistics for Kiana, out of the total population over 16 years of age (289), 52.6% or 152 individuals are in the labor force, with 28.9% or 44 of them unemployed. The age group with the highest labor force participation rate is 45 to 54 years, with 84.0% or 21 individuals in the labor force. Within the labor force, the 20 to 24 years age range has the highest percentage of unemployed individuals, with 79.3% or 23 of them being unemployed.
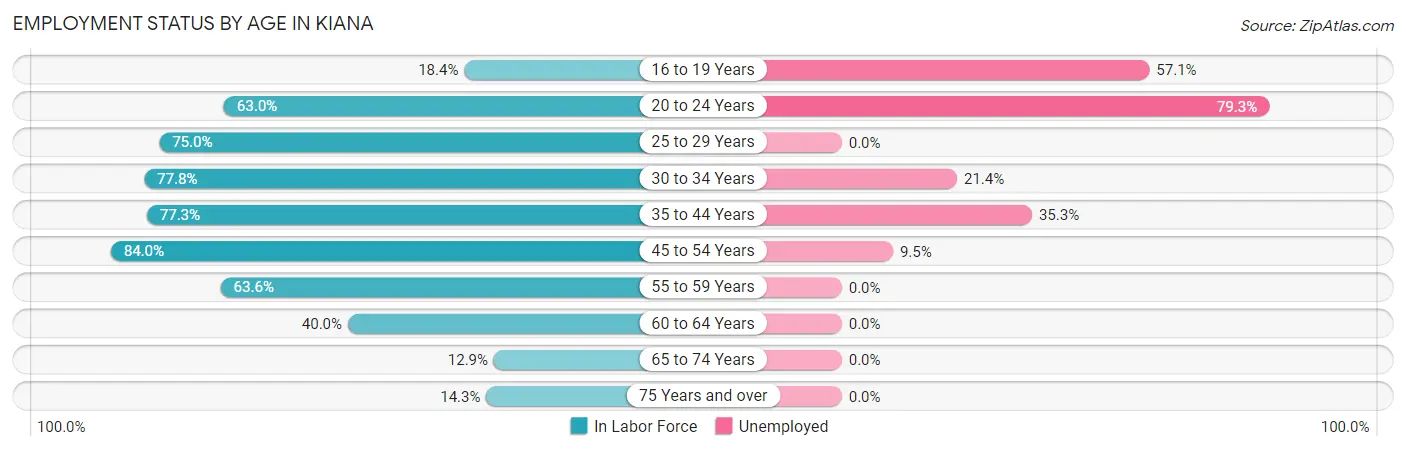
| Age Bracket | In Labor Force | Unemployed |
| 16 to 19 Years | 7 (18.4%) | 4 (57.1%) |
| 20 to 24 Years | 29 (63.0%) | 23 (79.3%) |
| 25 to 29 Years | 18 (75.0%) | 0 (0.0%) |
| 30 to 34 Years | 14 (77.8%) | 3 (21.4%) |
| 35 to 44 Years | 34 (77.3%) | 12 (35.3%) |
| 45 to 54 Years | 21 (84.0%) | 2 (9.5%) |
| 55 to 59 Years | 14 (63.6%) | 0 (0.0%) |
| 60 to 64 Years | 8 (40.0%) | 0 (0.0%) |
| 65 to 74 Years | 4 (12.9%) | 0 (0.0%) |
| 75 Years and over | 3 (14.3%) | 0 (0.0%) |
| Total | 152 (52.6%) | 44 (28.9%) |
Employment Status by Educational Attainment in Kiana
According to labor force statistics for Kiana, 71.2% of individuals (109) out of the total population between 25 and 64 years of age (153) are in the labor force, with 15.6% or 17 of them being unemployed. The group with the highest labor force participation rate are those with the educational attainment of high school diploma, with 81.0% or 85 individuals in the labor force. Within the labor force, individuals with college / associate degree education have the highest percentage of unemployment, with 45.5% or 5 of them being unemployed.
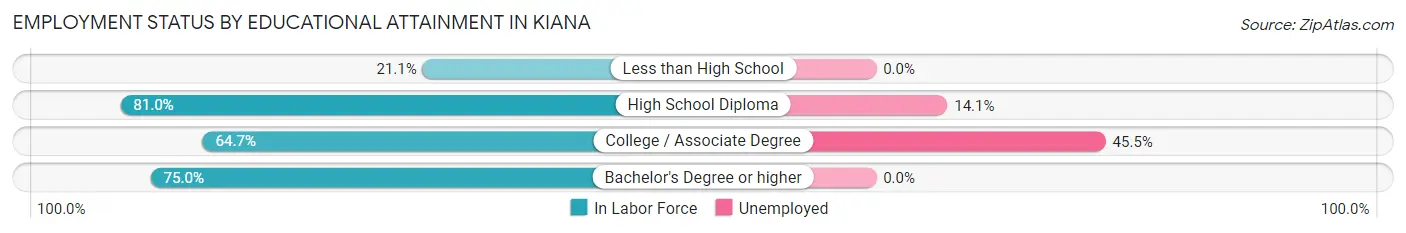
| Educational Attainment | In Labor Force | Unemployed |
| Less than High School | 4 (21.1%) | 0 (0.0%) |
| High School Diploma | 85 (81.0%) | 15 (14.1%) |
| College / Associate Degree | 11 (64.7%) | 8 (45.5%) |
| Bachelor's Degree or higher | 9 (75.0%) | 0 (0.0%) |
| Total | 109 (71.2%) | 24 (15.6%) |
Employment Occupations by Sex in Kiana
Management, Business, Science and Arts Occupations
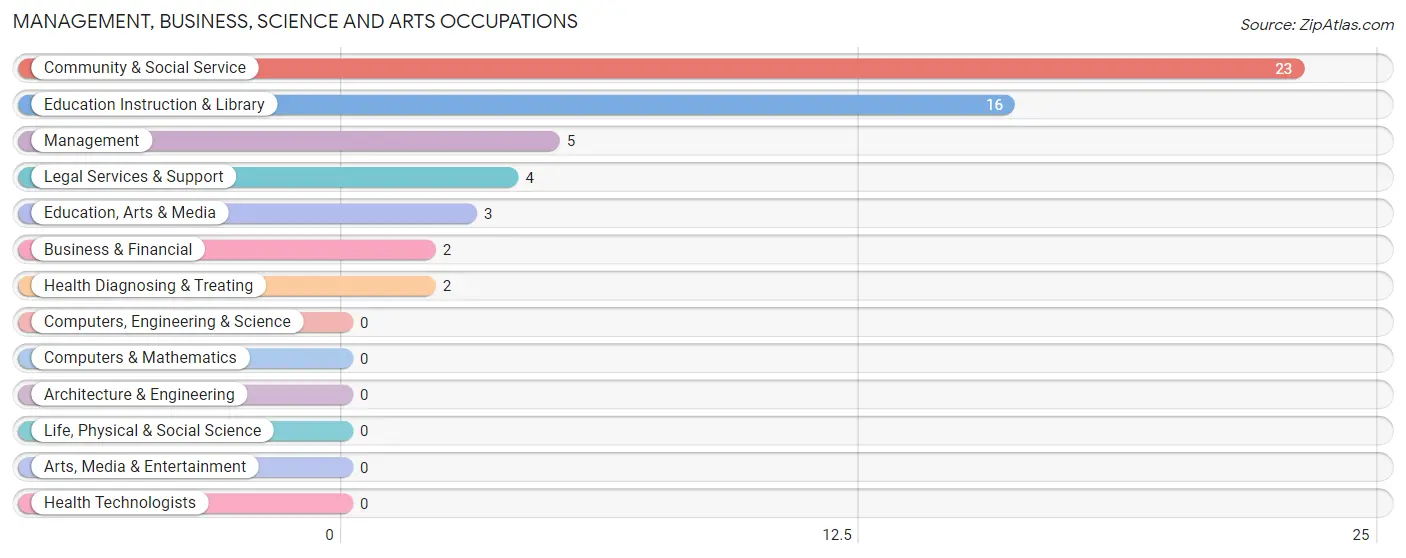
The most common Management, Business, Science and Arts occupations in Kiana are Community & Social Service (23 | 21.3%), Education Instruction & Library (16 | 14.8%), Management (5 | 4.6%), Legal Services & Support (4 | 3.7%), and Education, Arts & Media (3 | 2.8%).
Management, Business, Science and Arts Occupations by Sex
Within the Management, Business, Science and Arts occupations in Kiana, the most male-oriented occupations are Management (100.0%), Education, Arts & Media (100.0%), and Health Diagnosing & Treating (100.0%), while the most female-oriented occupations are Business & Financial (100.0%), Legal Services & Support (100.0%), and Education Instruction & Library (87.5%).
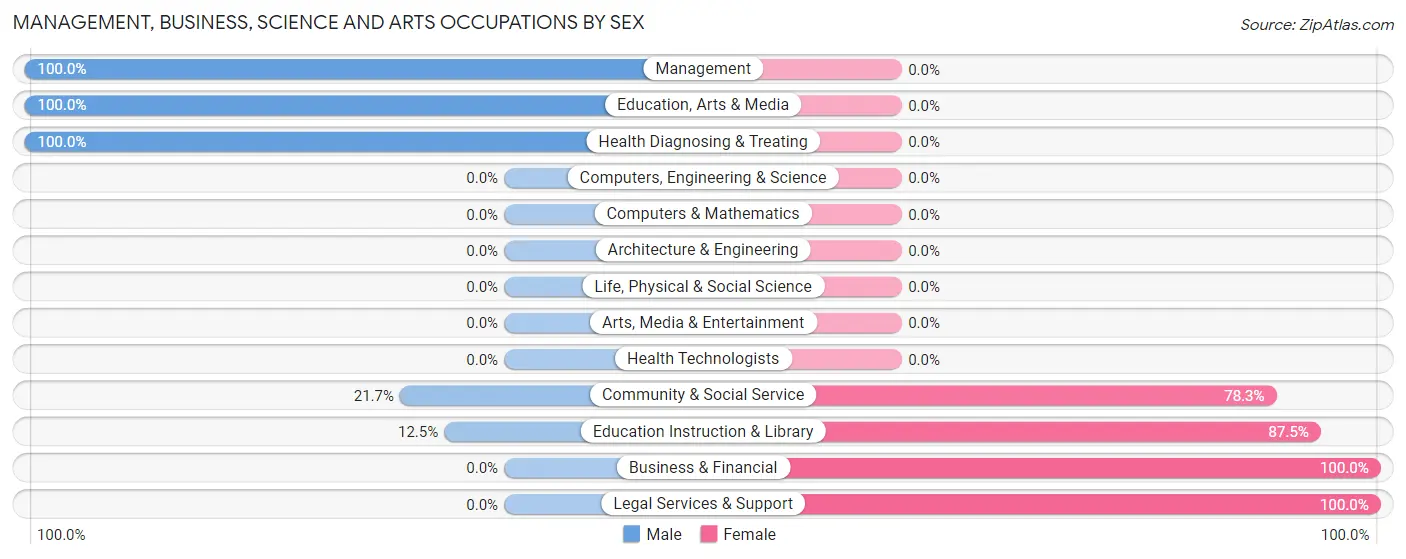
| Occupation | Male | Female |
| Management | 5 (100.0%) | 0 (0.0%) |
| Business & Financial | 0 (0.0%) | 2 (100.0%) |
| Computers, Engineering & Science | 0 (0.0%) | 0 (0.0%) |
| Computers & Mathematics | 0 (0.0%) | 0 (0.0%) |
| Architecture & Engineering | 0 (0.0%) | 0 (0.0%) |
| Life, Physical & Social Science | 0 (0.0%) | 0 (0.0%) |
| Community & Social Service | 5 (21.7%) | 18 (78.3%) |
| Education, Arts & Media | 3 (100.0%) | 0 (0.0%) |
| Legal Services & Support | 0 (0.0%) | 4 (100.0%) |
| Education Instruction & Library | 2 (12.5%) | 14 (87.5%) |
| Arts, Media & Entertainment | 0 (0.0%) | 0 (0.0%) |
| Health Diagnosing & Treating | 2 (100.0%) | 0 (0.0%) |
| Health Technologists | 0 (0.0%) | 0 (0.0%) |
| Total (Category) | 12 (37.5%) | 20 (62.5%) |
| Total (Overall) | 65 (60.2%) | 43 (39.8%) |
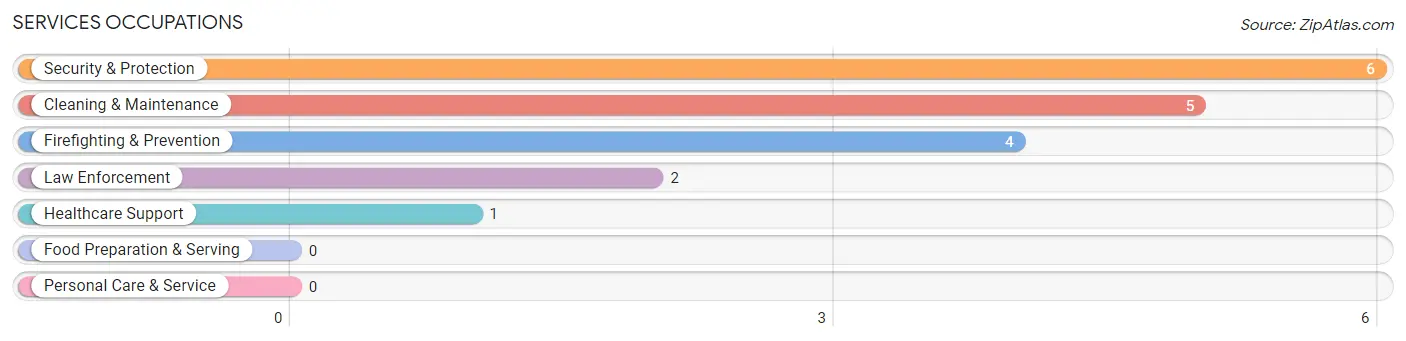
Services Occupations
The most common Services occupations in Kiana are Security & Protection (6 | 5.6%), Cleaning & Maintenance (5 | 4.6%), Firefighting & Prevention (4 | 3.7%), Law Enforcement (2 | 1.8%), and Healthcare Support (1 | 0.9%).
Services Occupations by Sex
Within the Services occupations in Kiana, the most male-oriented occupations are Firefighting & Prevention (50.0%), Cleaning & Maintenance (40.0%), and Security & Protection (33.3%), while the most female-oriented occupations are Healthcare Support (100.0%), Law Enforcement (100.0%), and Security & Protection (66.7%).
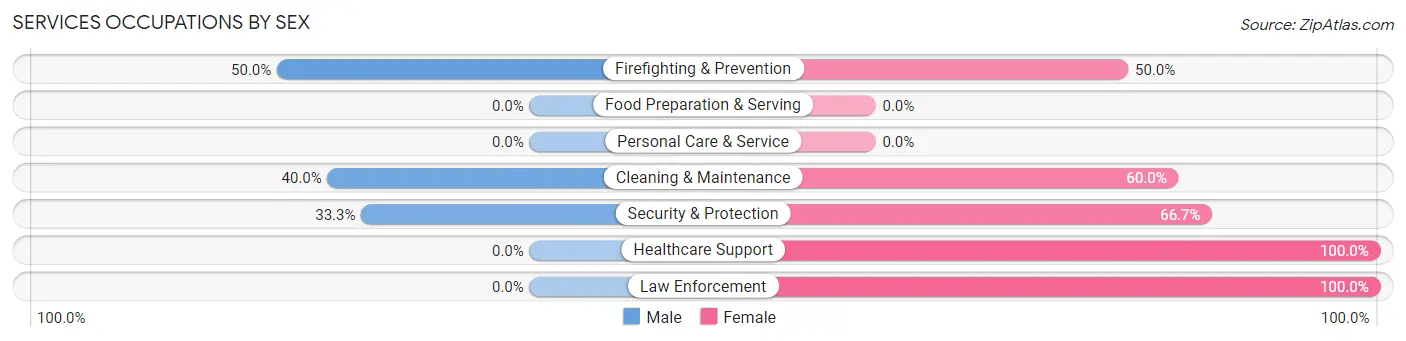
| Occupation | Male | Female |
| Healthcare Support | 0 (0.0%) | 1 (100.0%) |
| Security & Protection | 2 (33.3%) | 4 (66.7%) |
| Firefighting & Prevention | 2 (50.0%) | 2 (50.0%) |
| Law Enforcement | 0 (0.0%) | 2 (100.0%) |
| Food Preparation & Serving | 0 (0.0%) | 0 (0.0%) |
| Cleaning & Maintenance | 2 (40.0%) | 3 (60.0%) |
| Personal Care & Service | 0 (0.0%) | 0 (0.0%) |
| Total (Category) | 4 (33.3%) | 8 (66.7%) |
| Total (Overall) | 65 (60.2%) | 43 (39.8%) |
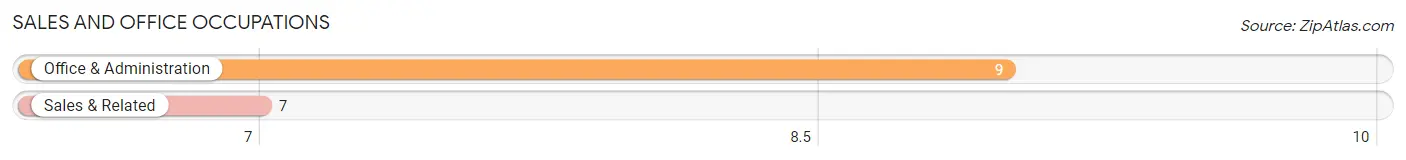
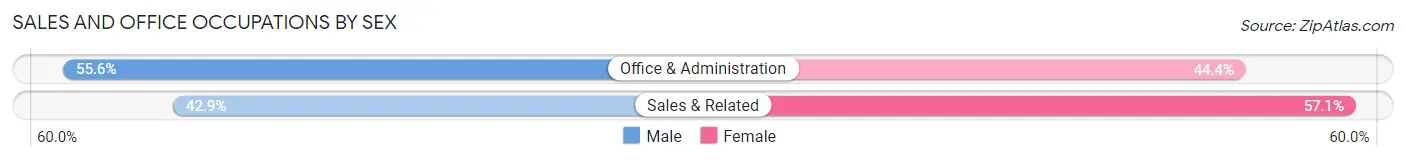
Sales and Office Occupations
The most common Sales and Office occupations in Kiana are Office & Administration (9 | 8.3%), and Sales & Related (7 | 6.5%).
Sales and Office Occupations by Sex
| Occupation | Male | Female |
| Sales & Related | 3 (42.9%) | 4 (57.1%) |
| Office & Administration | 5 (55.6%) | 4 (44.4%) |
| Total (Category) | 8 (50.0%) | 8 (50.0%) |
| Total (Overall) | 65 (60.2%) | 43 (39.8%) |
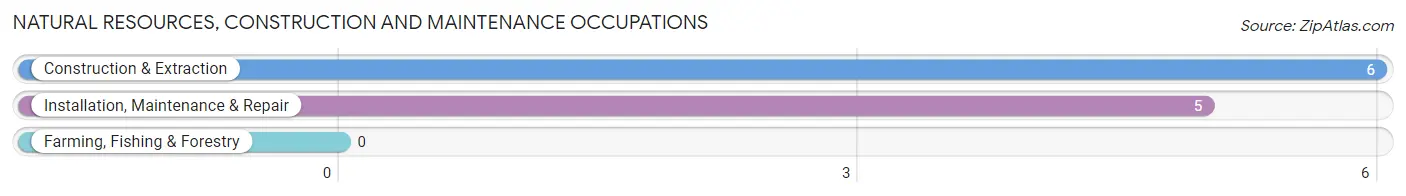
Natural Resources, Construction and Maintenance Occupations
The most common Natural Resources, Construction and Maintenance occupations in Kiana are Construction & Extraction (6 | 5.6%), and Installation, Maintenance & Repair (5 | 4.6%).
Natural Resources, Construction and Maintenance Occupations by Sex
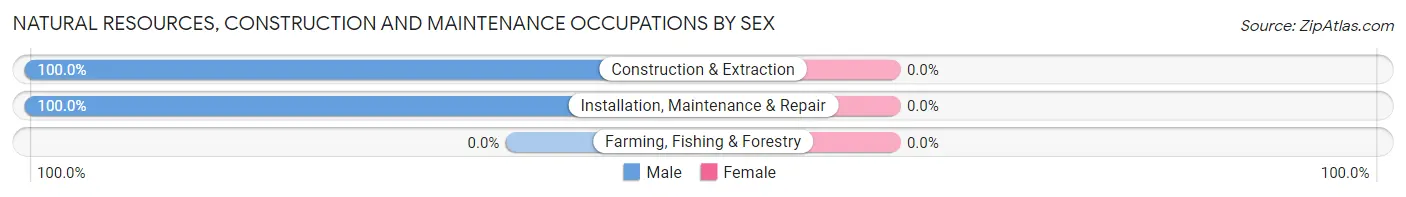
| Occupation | Male | Female |
| Farming, Fishing & Forestry | 0 (0.0%) | 0 (0.0%) |
| Construction & Extraction | 6 (100.0%) | 0 (0.0%) |
| Installation, Maintenance & Repair | 5 (100.0%) | 0 (0.0%) |
| Total (Category) | 11 (100.0%) | 0 (0.0%) |
| Total (Overall) | 65 (60.2%) | 43 (39.8%) |
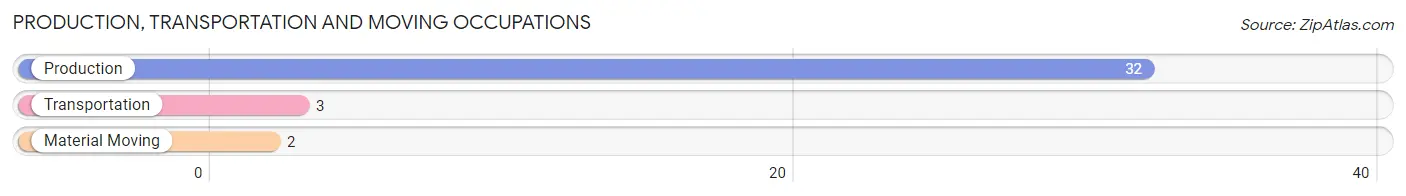
Production, Transportation and Moving Occupations
The most common Production, Transportation and Moving occupations in Kiana are Production (32 | 29.6%), Transportation (3 | 2.8%), and Material Moving (2 | 1.8%).
Production, Transportation and Moving Occupations by Sex
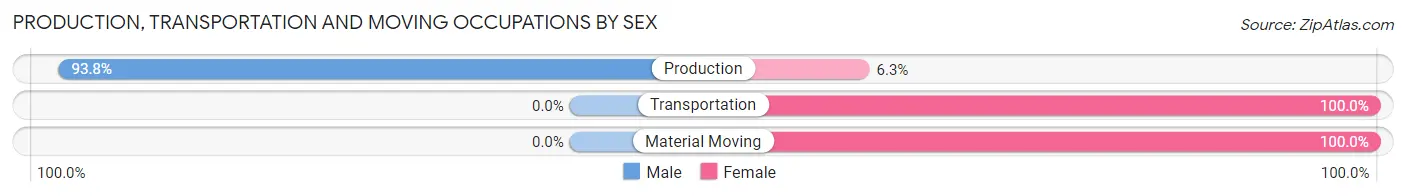
| Occupation | Male | Female |
| Production | 30 (93.8%) | 2 (6.2%) |
| Transportation | 0 (0.0%) | 3 (100.0%) |
| Material Moving | 0 (0.0%) | 2 (100.0%) |
| Total (Category) | 30 (81.1%) | 7 (18.9%) |
| Total (Overall) | 65 (60.2%) | 43 (39.8%) |
Employment Industries by Sex in Kiana
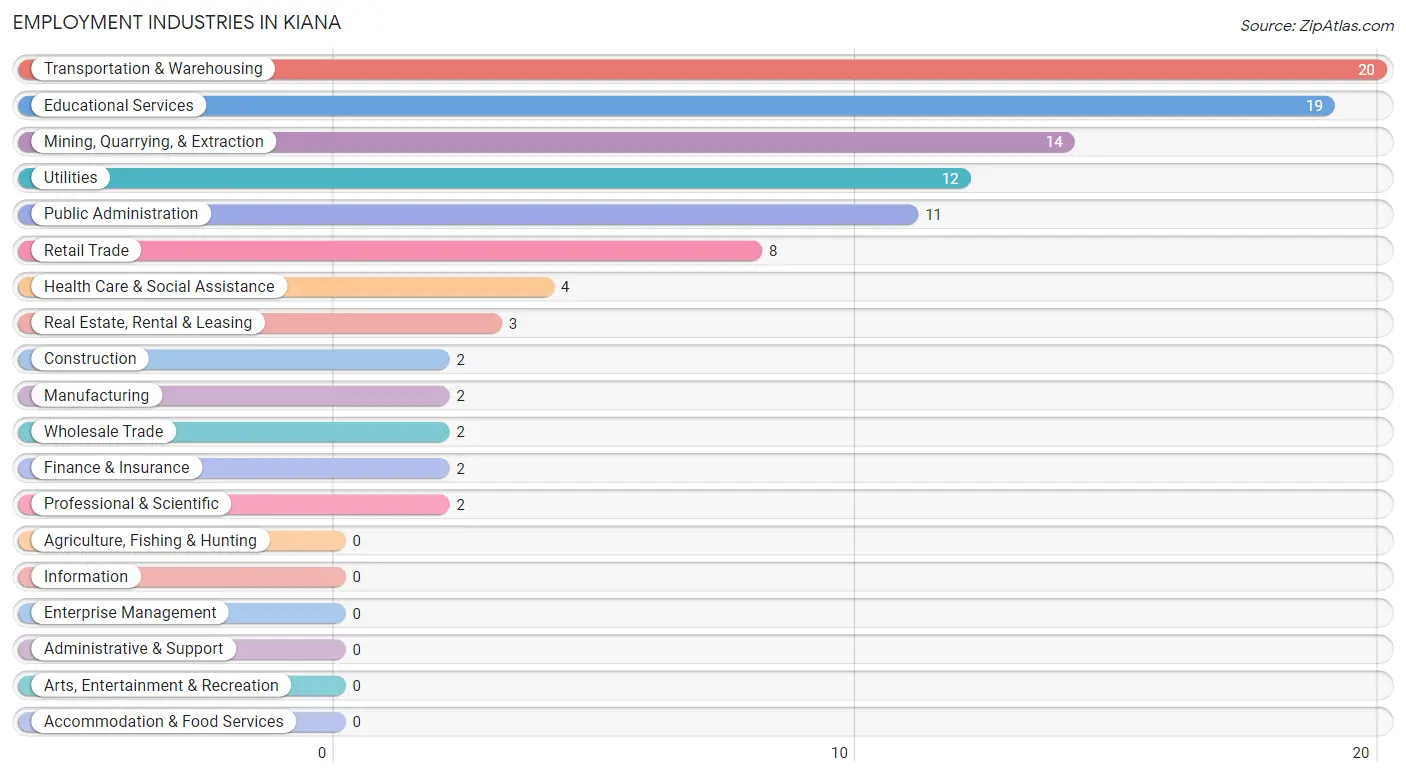
Employment Industries in Kiana
The major employment industries in Kiana include Transportation & Warehousing (20 | 18.5%), Educational Services (19 | 17.6%), Mining, Quarrying, & Extraction (14 | 13.0%), Utilities (12 | 11.1%), and Public Administration (11 | 10.2%).
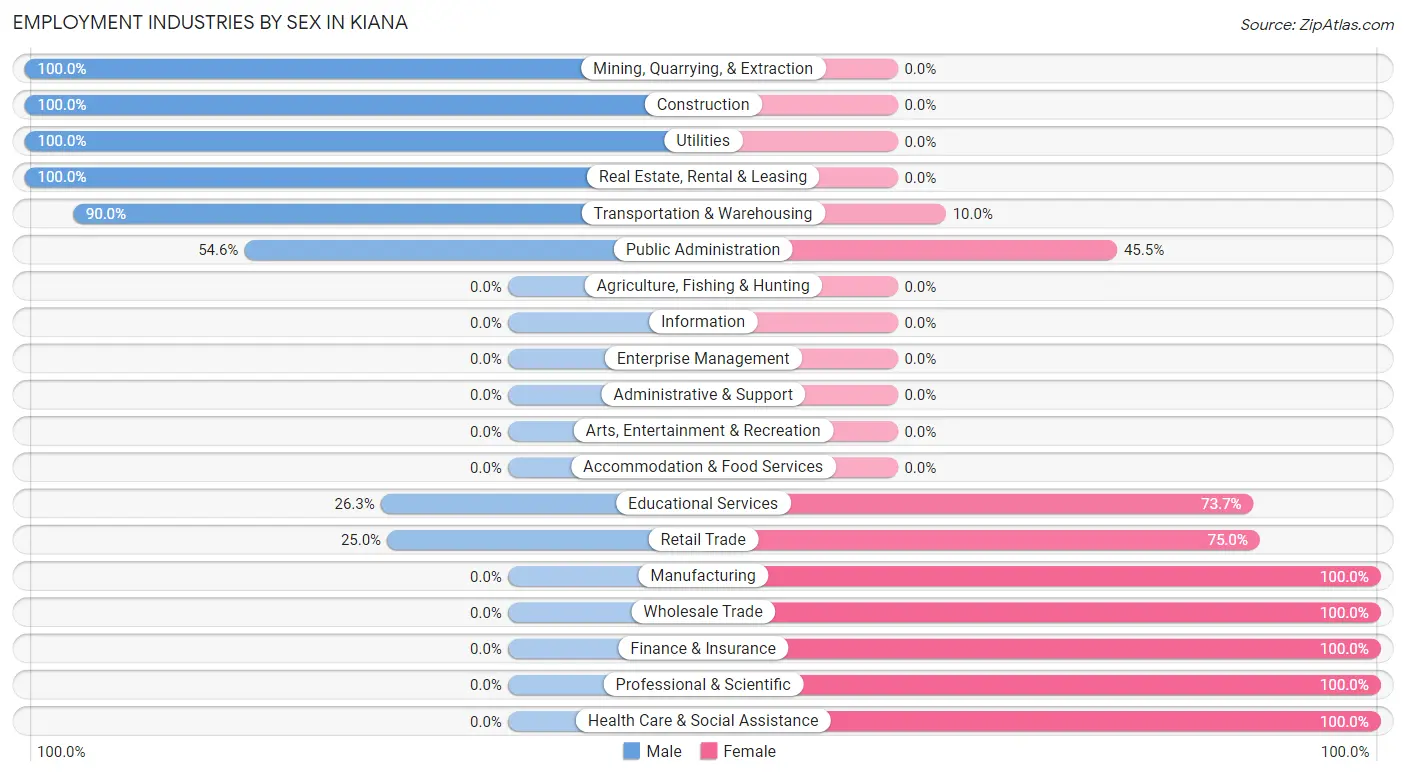
Employment Industries by Sex in Kiana
The Kiana industries that see more men than women are Mining, Quarrying, & Extraction (100.0%), Construction (100.0%), and Utilities (100.0%), whereas the industries that tend to have a higher number of women are Manufacturing (100.0%), Wholesale Trade (100.0%), and Finance & Insurance (100.0%).
| Industry | Male | Female |
| Agriculture, Fishing & Hunting | 0 (0.0%) | 0 (0.0%) |
| Mining, Quarrying, & Extraction | 14 (100.0%) | 0 (0.0%) |
| Construction | 2 (100.0%) | 0 (0.0%) |
| Manufacturing | 0 (0.0%) | 2 (100.0%) |
| Wholesale Trade | 0 (0.0%) | 2 (100.0%) |
| Retail Trade | 2 (25.0%) | 6 (75.0%) |
| Transportation & Warehousing | 18 (90.0%) | 2 (10.0%) |
| Utilities | 12 (100.0%) | 0 (0.0%) |
| Information | 0 (0.0%) | 0 (0.0%) |
| Finance & Insurance | 0 (0.0%) | 2 (100.0%) |
| Real Estate, Rental & Leasing | 3 (100.0%) | 0 (0.0%) |
| Professional & Scientific | 0 (0.0%) | 2 (100.0%) |
| Enterprise Management | 0 (0.0%) | 0 (0.0%) |
| Administrative & Support | 0 (0.0%) | 0 (0.0%) |
| Educational Services | 5 (26.3%) | 14 (73.7%) |
| Health Care & Social Assistance | 0 (0.0%) | 4 (100.0%) |
| Arts, Entertainment & Recreation | 0 (0.0%) | 0 (0.0%) |
| Accommodation & Food Services | 0 (0.0%) | 0 (0.0%) |
| Public Administration | 6 (54.5%) | 5 (45.5%) |
| Total | 65 (60.2%) | 43 (39.8%) |
Education in Kiana
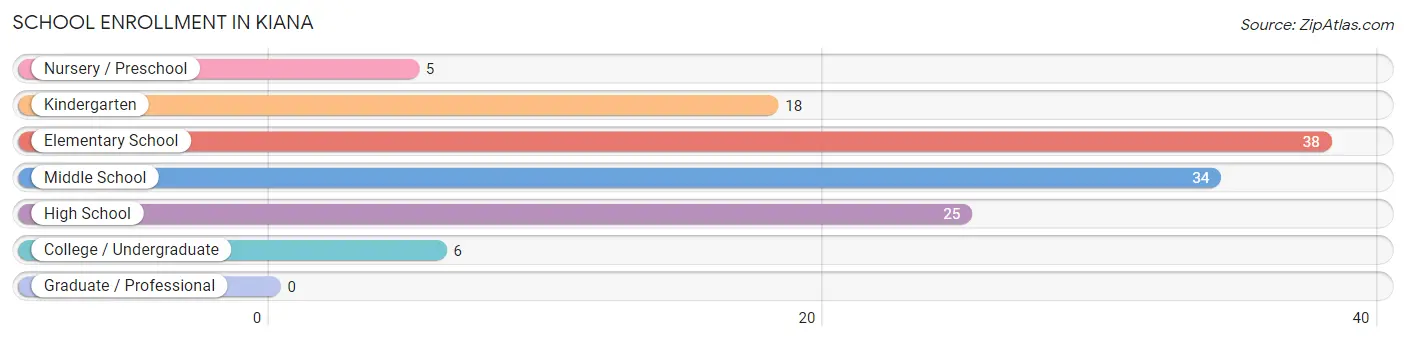
School Enrollment in Kiana
The most common levels of schooling among the 126 students in Kiana are elementary school (38 | 30.2%), middle school (34 | 27.0%), and high school (25 | 19.8%).
| School Level | # Students | % Students |
| Nursery / Preschool | 5 | 4.0% |
| Kindergarten | 18 | 14.3% |
| Elementary School | 38 | 30.2% |
| Middle School | 34 | 27.0% |
| High School | 25 | 19.8% |
| College / Undergraduate | 6 | 4.8% |
| Graduate / Professional | 0 | 0.0% |
| Total | 126 | 100.0% |
School Enrollment by Age by Funding Source in Kiana
Out of a total of 126 students who are enrolled in schools in Kiana, 3 (2.4%) attend a private institution, while the remaining 123 (97.6%) are enrolled in public schools. The age group of 18 to 19 year olds has the highest likelihood of being enrolled in private schools, with 3 (50.0% in the age bracket) enrolled. Conversely, the age group of 3 to 4 year olds has the lowest likelihood of being enrolled in a private school, with 3 (100.0% in the age bracket) attending a public institution.
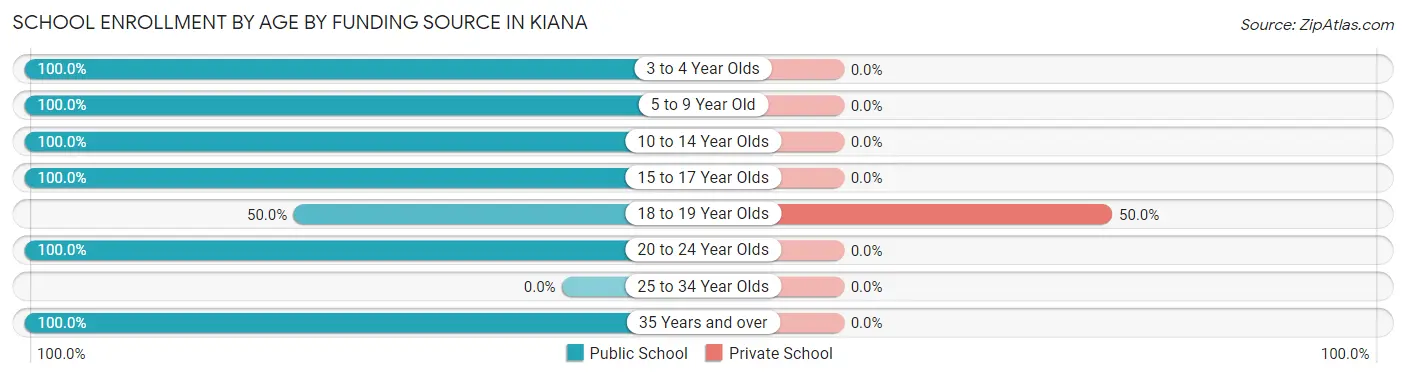
| Age Bracket | Public School | Private School |
| 3 to 4 Year Olds | 3 (100.0%) | 0 (0.0%) |
| 5 to 9 Year Old | 56 (100.0%) | 0 (0.0%) |
| 10 to 14 Year Olds | 36 (100.0%) | 0 (0.0%) |
| 15 to 17 Year Olds | 21 (100.0%) | 0 (0.0%) |
| 18 to 19 Year Olds | 3 (50.0%) | 3 (50.0%) |
| 20 to 24 Year Olds | 3 (100.0%) | 0 (0.0%) |
| 25 to 34 Year Olds | 0 (0.0%) | 0 (0.0%) |
| 35 Years and over | 1 (100.0%) | 0 (0.0%) |
| Total | 123 (97.6%) | 3 (2.4%) |
Educational Attainment by Field of Study in Kiana
Education (11 | 44.0%), bio, nature & agricultural (9 | 36.0%), and science & technology (5 | 20.0%) are the most common fields of study among 25 individuals in Kiana who have obtained a bachelor's degree or higher.
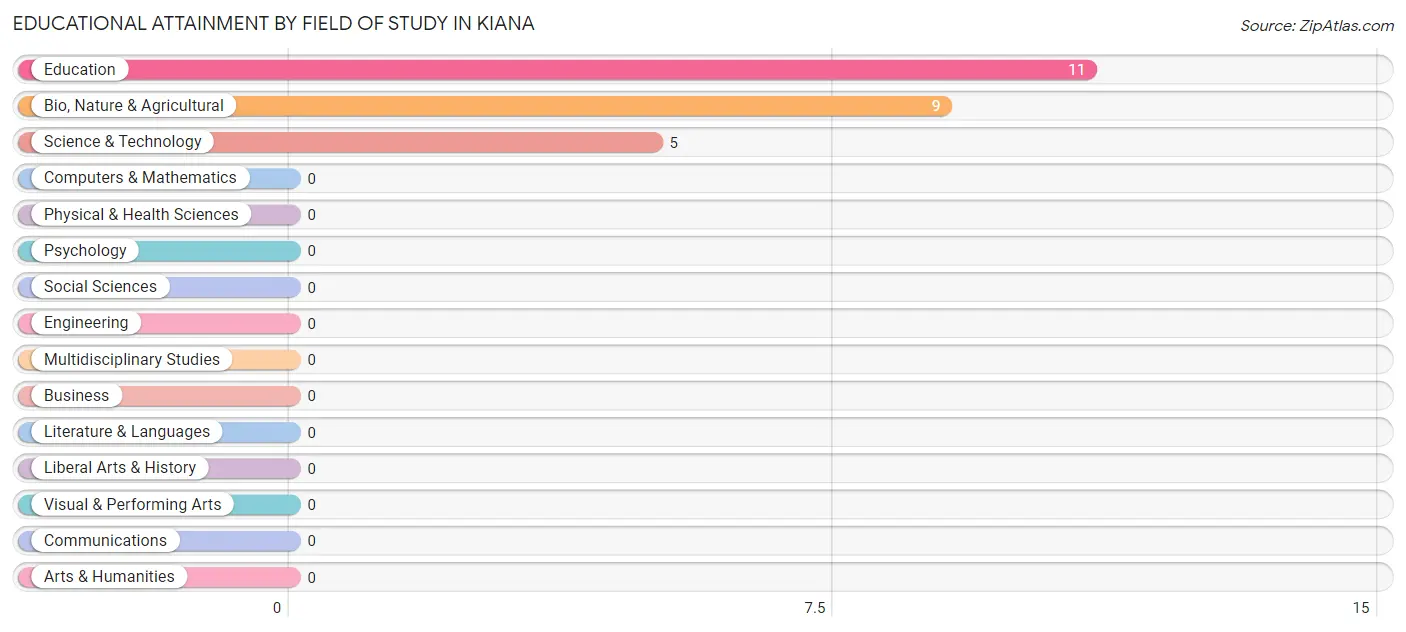
| Field of Study | # Graduates | % Graduates |
| Computers & Mathematics | 0 | 0.0% |
| Bio, Nature & Agricultural | 9 | 36.0% |
| Physical & Health Sciences | 0 | 0.0% |
| Psychology | 0 | 0.0% |
| Social Sciences | 0 | 0.0% |
| Engineering | 0 | 0.0% |
| Multidisciplinary Studies | 0 | 0.0% |
| Science & Technology | 5 | 20.0% |
| Business | 0 | 0.0% |
| Education | 11 | 44.0% |
| Literature & Languages | 0 | 0.0% |
| Liberal Arts & History | 0 | 0.0% |
| Visual & Performing Arts | 0 | 0.0% |
| Communications | 0 | 0.0% |
| Arts & Humanities | 0 | 0.0% |
| Total | 25 | 100.0% |
Transportation & Commute in Kiana
Vehicle Availability by Sex in Kiana
The most prevalent vehicle ownership categories in Kiana are males with no vehicle (28, accounting for 56.0%) and females with no vehicle (34, making up 68.3%).
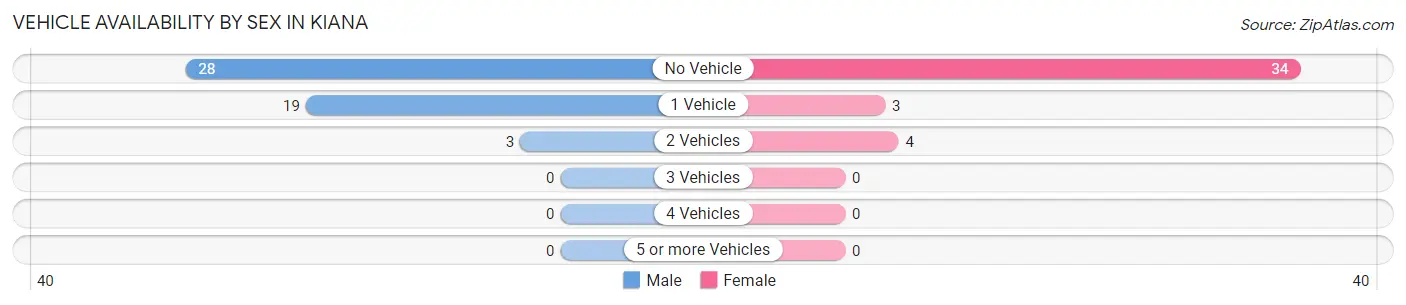
| Vehicles Available | Male | Female |
| No Vehicle | 28 (56.0%) | 34 (82.9%) |
| 1 Vehicle | 19 (38.0%) | 3 (7.3%) |
| 2 Vehicles | 3 (6.0%) | 4 (9.8%) |
| 3 Vehicles | 0 (0.0%) | 0 (0.0%) |
| 4 Vehicles | 0 (0.0%) | 0 (0.0%) |
| 5 or more Vehicles | 0 (0.0%) | 0 (0.0%) |
| Total | 50 (100.0%) | 41 (100.0%) |
Commute Time in Kiana
The most frequently occuring commute durations in Kiana are less than 5 minutes (50 commuters, 63.3%), 5 to 9 minutes (19 commuters, 24.0%), and 10 to 14 minutes (8 commuters, 10.1%).
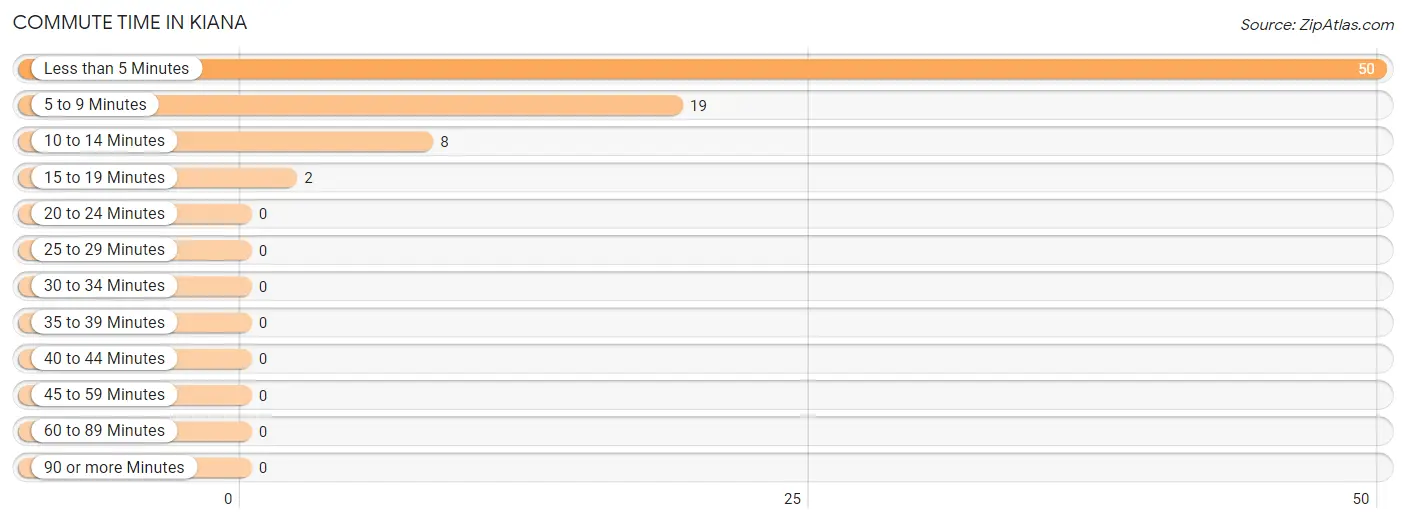
| Commute Time | # Commuters | % Commuters |
| Less than 5 Minutes | 50 | 63.3% |
| 5 to 9 Minutes | 19 | 24.0% |
| 10 to 14 Minutes | 8 | 10.1% |
| 15 to 19 Minutes | 2 | 2.5% |
| 20 to 24 Minutes | 0 | 0.0% |
| 25 to 29 Minutes | 0 | 0.0% |
| 30 to 34 Minutes | 0 | 0.0% |
| 35 to 39 Minutes | 0 | 0.0% |
| 40 to 44 Minutes | 0 | 0.0% |
| 45 to 59 Minutes | 0 | 0.0% |
| 60 to 89 Minutes | 0 | 0.0% |
| 90 or more Minutes | 0 | 0.0% |
Commute Time by Sex in Kiana
The most common commute times in Kiana are less than 5 minutes (32 commuters, 68.1%) for males and less than 5 minutes (18 commuters, 56.2%) for females.
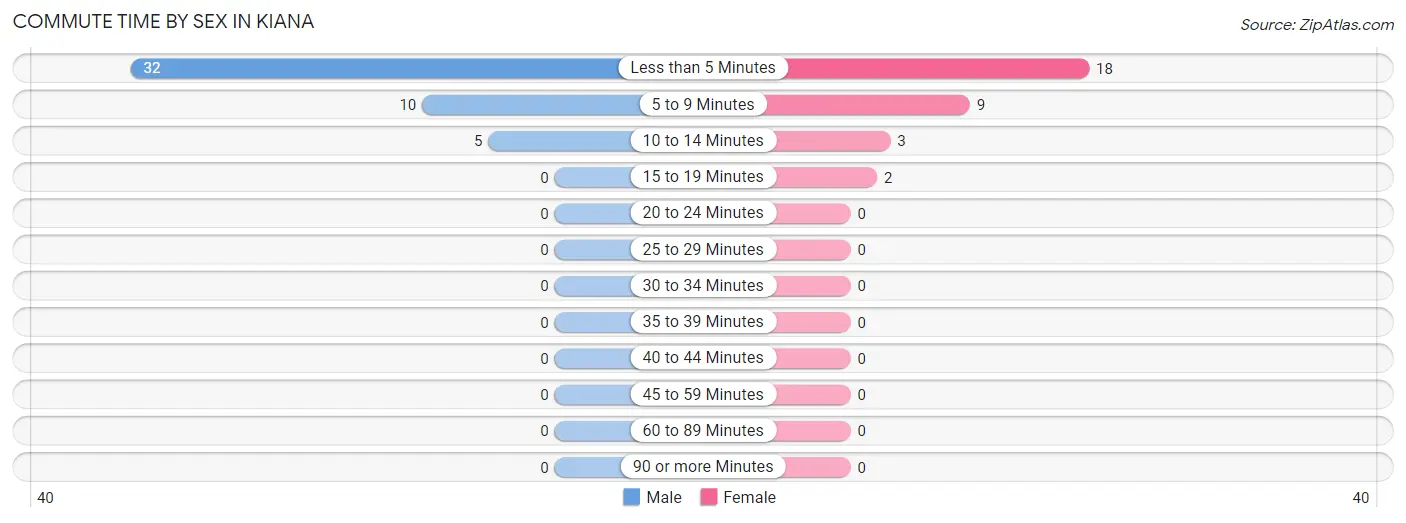
| Commute Time | Male | Female |
| Less than 5 Minutes | 32 (68.1%) | 18 (56.2%) |
| 5 to 9 Minutes | 10 (21.3%) | 9 (28.1%) |
| 10 to 14 Minutes | 5 (10.6%) | 3 (9.4%) |
| 15 to 19 Minutes | 0 (0.0%) | 2 (6.2%) |
| 20 to 24 Minutes | 0 (0.0%) | 0 (0.0%) |
| 25 to 29 Minutes | 0 (0.0%) | 0 (0.0%) |
| 30 to 34 Minutes | 0 (0.0%) | 0 (0.0%) |
| 35 to 39 Minutes | 0 (0.0%) | 0 (0.0%) |
| 40 to 44 Minutes | 0 (0.0%) | 0 (0.0%) |
| 45 to 59 Minutes | 0 (0.0%) | 0 (0.0%) |
| 60 to 89 Minutes | 0 (0.0%) | 0 (0.0%) |
| 90 or more Minutes | 0 (0.0%) | 0 (0.0%) |
Time of Departure to Work by Sex in Kiana
The most frequent times of departure to work in Kiana are 8:00 AM to 8:29 AM (10, 21.3%) for males and 8:00 AM to 8:29 AM (8, 25.0%) for females.
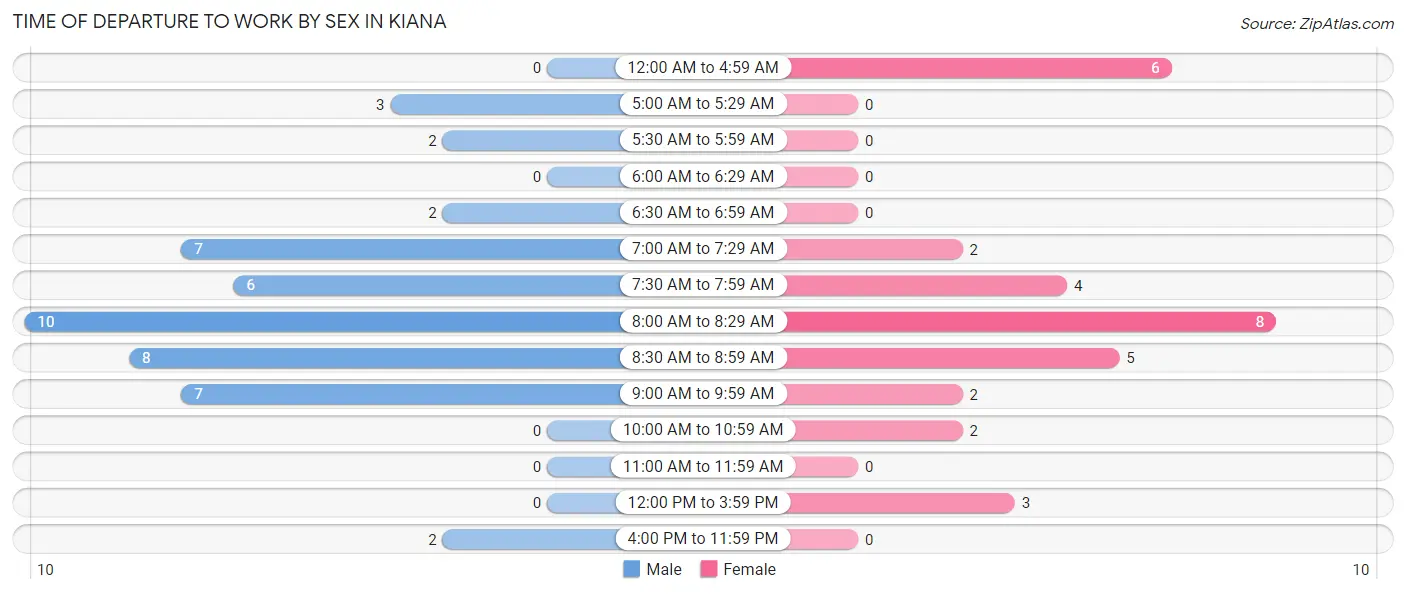
| Time of Departure | Male | Female |
| 12:00 AM to 4:59 AM | 0 (0.0%) | 6 (18.8%) |
| 5:00 AM to 5:29 AM | 3 (6.4%) | 0 (0.0%) |
| 5:30 AM to 5:59 AM | 2 (4.3%) | 0 (0.0%) |
| 6:00 AM to 6:29 AM | 0 (0.0%) | 0 (0.0%) |
| 6:30 AM to 6:59 AM | 2 (4.3%) | 0 (0.0%) |
| 7:00 AM to 7:29 AM | 7 (14.9%) | 2 (6.2%) |
| 7:30 AM to 7:59 AM | 6 (12.8%) | 4 (12.5%) |
| 8:00 AM to 8:29 AM | 10 (21.3%) | 8 (25.0%) |
| 8:30 AM to 8:59 AM | 8 (17.0%) | 5 (15.6%) |
| 9:00 AM to 9:59 AM | 7 (14.9%) | 2 (6.2%) |
| 10:00 AM to 10:59 AM | 0 (0.0%) | 2 (6.2%) |
| 11:00 AM to 11:59 AM | 0 (0.0%) | 0 (0.0%) |
| 12:00 PM to 3:59 PM | 0 (0.0%) | 3 (9.4%) |
| 4:00 PM to 11:59 PM | 2 (4.3%) | 0 (0.0%) |
| Total | 47 (100.0%) | 32 (100.0%) |
Housing Occupancy in Kiana
Occupancy by Ownership in Kiana
Of the total 90 dwellings in Kiana, owner-occupied units account for 73 (81.1%), while renter-occupied units make up 17 (18.9%).
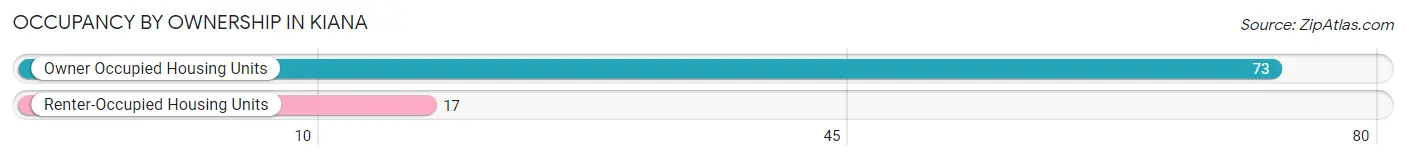
| Occupancy | # Housing Units | % Housing Units |
| Owner Occupied Housing Units | 73 | 81.1% |
| Renter-Occupied Housing Units | 17 | 18.9% |
| Total Occupied Housing Units | 90 | 100.0% |
Occupancy by Household Size in Kiana
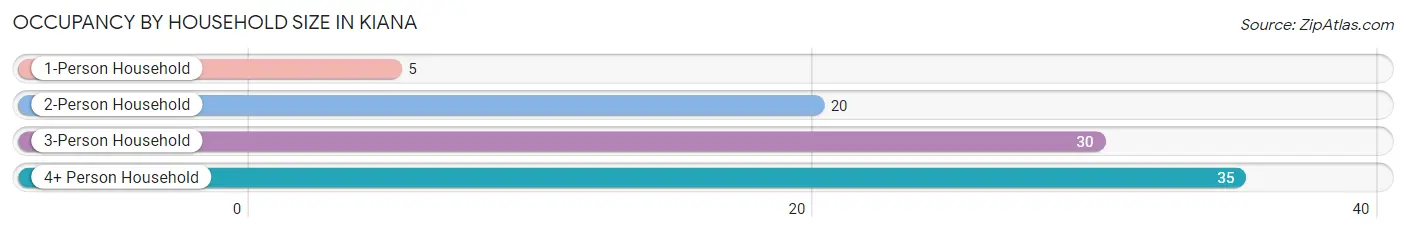
| Household Size | # Housing Units | % Housing Units |
| 1-Person Household | 5 | 5.6% |
| 2-Person Household | 20 | 22.2% |
| 3-Person Household | 30 | 33.3% |
| 4+ Person Household | 35 | 38.9% |
| Total Housing Units | 90 | 100.0% |
Occupancy by Ownership by Household Size in Kiana
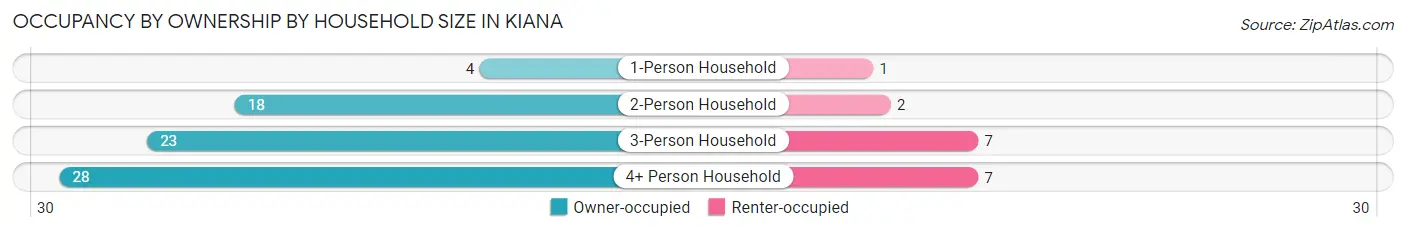
| Household Size | Owner-occupied | Renter-occupied |
| 1-Person Household | 4 (80.0%) | 1 (20.0%) |
| 2-Person Household | 18 (90.0%) | 2 (10.0%) |
| 3-Person Household | 23 (76.7%) | 7 (23.3%) |
| 4+ Person Household | 28 (80.0%) | 7 (20.0%) |
| Total Housing Units | 73 (81.1%) | 17 (18.9%) |
Occupancy by Educational Attainment in Kiana
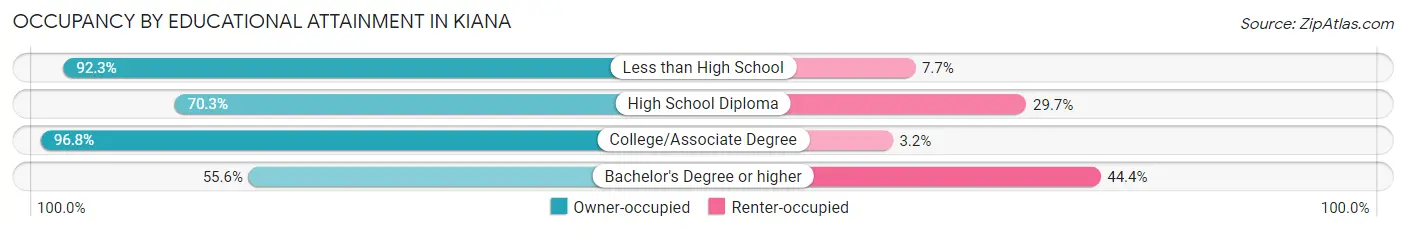
| Household Size | Owner-occupied | Renter-occupied |
| Less than High School | 12 (92.3%) | 1 (7.7%) |
| High School Diploma | 26 (70.3%) | 11 (29.7%) |
| College/Associate Degree | 30 (96.8%) | 1 (3.2%) |
| Bachelor's Degree or higher | 5 (55.6%) | 4 (44.4%) |
Occupancy by Age of Householder in Kiana
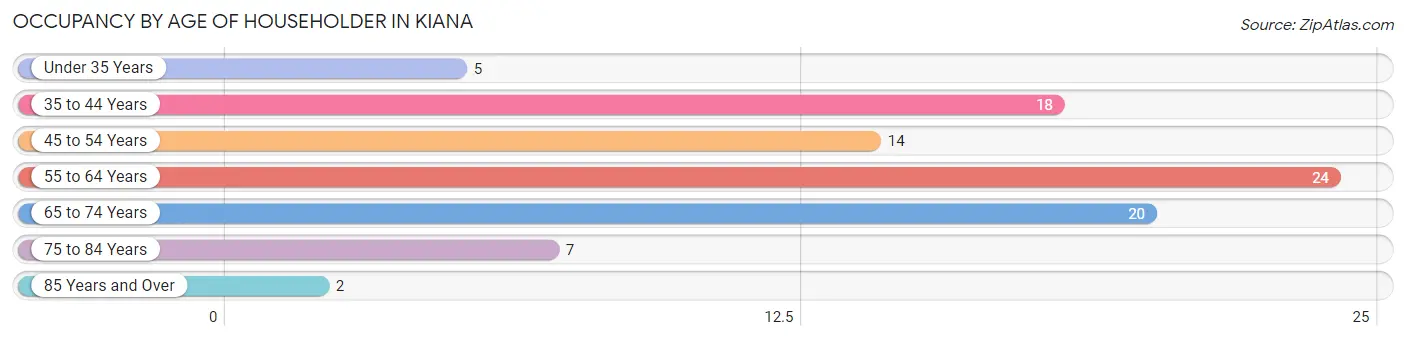
| Age Bracket | # Households | % Households |
| Under 35 Years | 5 | 5.6% |
| 35 to 44 Years | 18 | 20.0% |
| 45 to 54 Years | 14 | 15.6% |
| 55 to 64 Years | 24 | 26.7% |
| 65 to 74 Years | 20 | 22.2% |
| 75 to 84 Years | 7 | 7.8% |
| 85 Years and Over | 2 | 2.2% |
| Total | 90 | 100.0% |
Housing Finances in Kiana
Median Income by Occupancy in Kiana
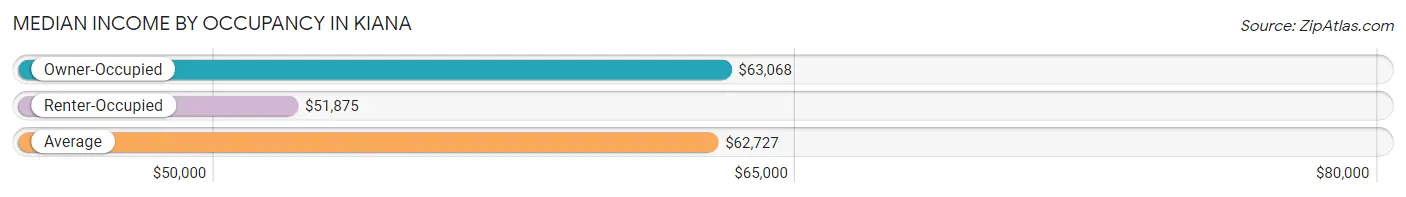
| Occupancy Type | # Households | Median Income |
| Owner-Occupied | 73 (81.1%) | $63,068 |
| Renter-Occupied | 17 (18.9%) | $51,875 |
| Average | 90 (100.0%) | $62,727 |
Occupancy by Householder Income Bracket in Kiana
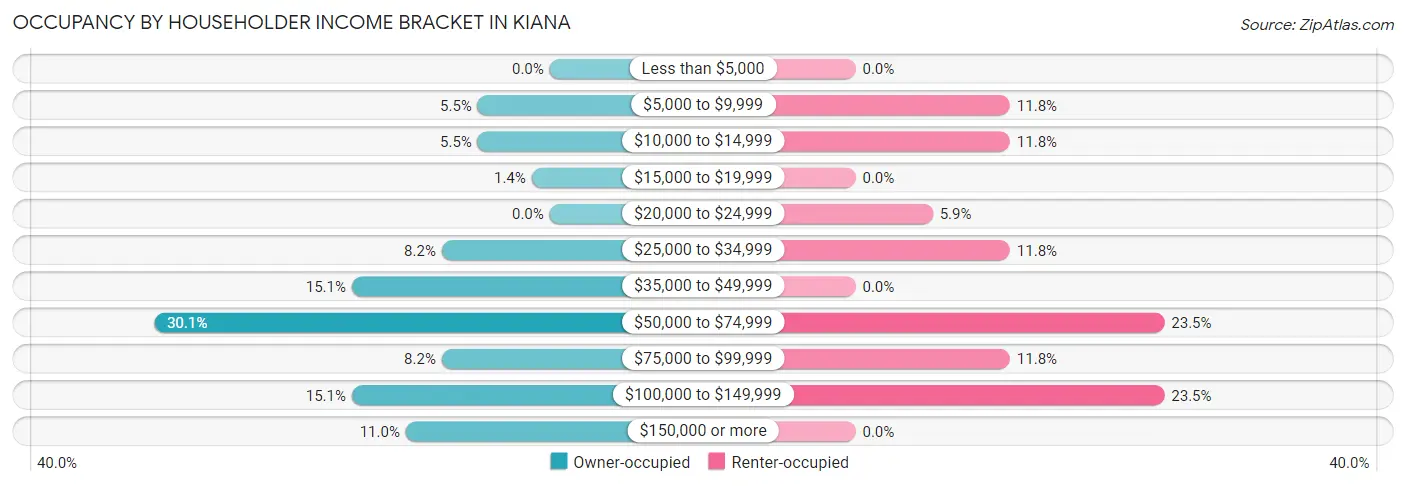
| Income Bracket | Owner-occupied | Renter-occupied |
| Less than $5,000 | 0 (0.0%) | 0 (0.0%) |
| $5,000 to $9,999 | 4 (5.5%) | 2 (11.8%) |
| $10,000 to $14,999 | 4 (5.5%) | 2 (11.8%) |
| $15,000 to $19,999 | 1 (1.4%) | 0 (0.0%) |
| $20,000 to $24,999 | 0 (0.0%) | 1 (5.9%) |
| $25,000 to $34,999 | 6 (8.2%) | 2 (11.8%) |
| $35,000 to $49,999 | 11 (15.1%) | 0 (0.0%) |
| $50,000 to $74,999 | 22 (30.1%) | 4 (23.5%) |
| $75,000 to $99,999 | 6 (8.2%) | 2 (11.8%) |
| $100,000 to $149,999 | 11 (15.1%) | 4 (23.5%) |
| $150,000 or more | 8 (11.0%) | 0 (0.0%) |
| Total | 73 (100.0%) | 17 (100.0%) |
Monthly Housing Cost Tiers in Kiana
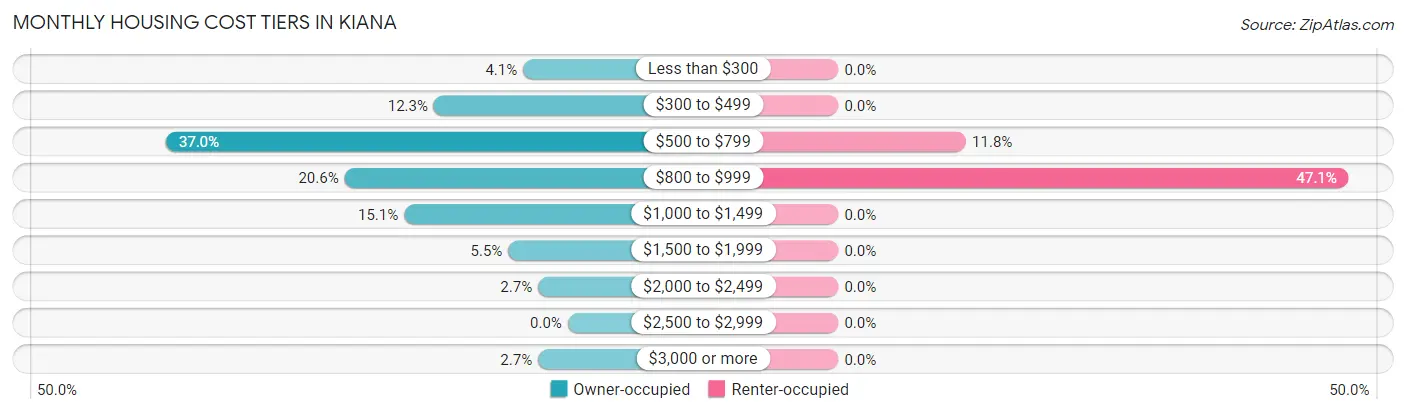
| Monthly Cost | Owner-occupied | Renter-occupied |
| Less than $300 | 3 (4.1%) | 0 (0.0%) |
| $300 to $499 | 9 (12.3%) | 0 (0.0%) |
| $500 to $799 | 27 (37.0%) | 2 (11.8%) |
| $800 to $999 | 15 (20.5%) | 8 (47.1%) |
| $1,000 to $1,499 | 11 (15.1%) | 0 (0.0%) |
| $1,500 to $1,999 | 4 (5.5%) | 0 (0.0%) |
| $2,000 to $2,499 | 2 (2.7%) | 0 (0.0%) |
| $2,500 to $2,999 | 0 (0.0%) | 0 (0.0%) |
| $3,000 or more | 2 (2.7%) | 0 (0.0%) |
| Total | 73 (100.0%) | 17 (100.0%) |
Physical Housing Characteristics in Kiana
Housing Structures in Kiana
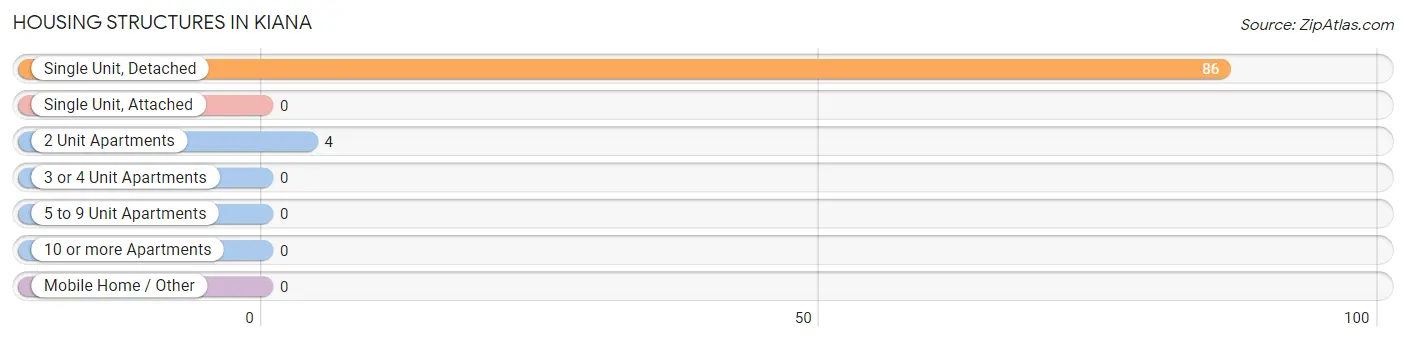
| Structure Type | # Housing Units | % Housing Units |
| Single Unit, Detached | 86 | 95.6% |
| Single Unit, Attached | 0 | 0.0% |
| 2 Unit Apartments | 4 | 4.4% |
| 3 or 4 Unit Apartments | 0 | 0.0% |
| 5 to 9 Unit Apartments | 0 | 0.0% |
| 10 or more Apartments | 0 | 0.0% |
| Mobile Home / Other | 0 | 0.0% |
| Total | 90 | 100.0% |
Housing Structures by Occupancy in Kiana
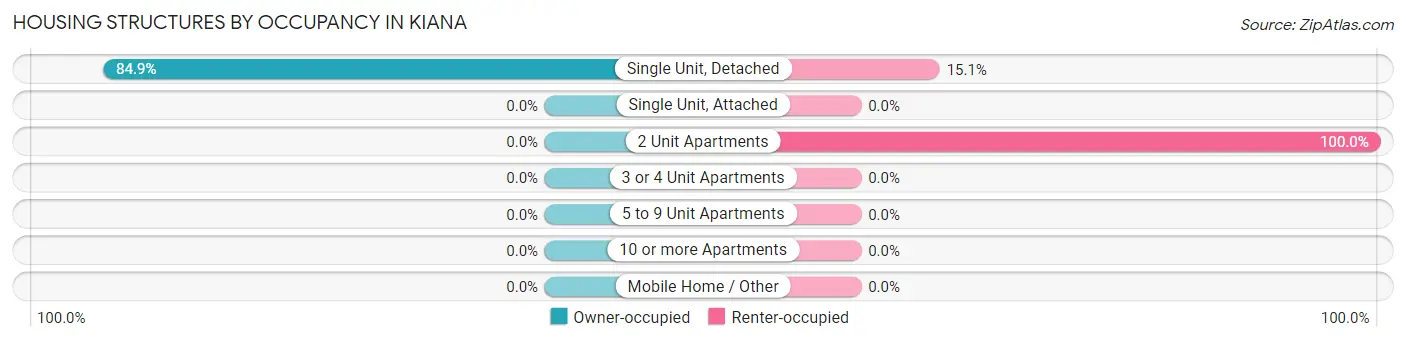
| Structure Type | Owner-occupied | Renter-occupied |
| Single Unit, Detached | 73 (84.9%) | 13 (15.1%) |
| Single Unit, Attached | 0 (0.0%) | 0 (0.0%) |
| 2 Unit Apartments | 0 (0.0%) | 4 (100.0%) |
| 3 or 4 Unit Apartments | 0 (0.0%) | 0 (0.0%) |
| 5 to 9 Unit Apartments | 0 (0.0%) | 0 (0.0%) |
| 10 or more Apartments | 0 (0.0%) | 0 (0.0%) |
| Mobile Home / Other | 0 (0.0%) | 0 (0.0%) |
| Total | 73 (81.1%) | 17 (18.9%) |
Housing Structures by Number of Rooms in Kiana
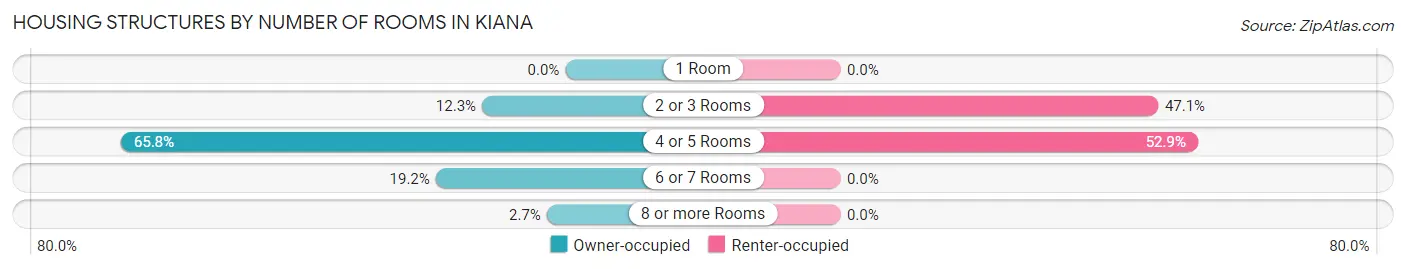
| Number of Rooms | Owner-occupied | Renter-occupied |
| 1 Room | 0 (0.0%) | 0 (0.0%) |
| 2 or 3 Rooms | 9 (12.3%) | 8 (47.1%) |
| 4 or 5 Rooms | 48 (65.7%) | 9 (52.9%) |
| 6 or 7 Rooms | 14 (19.2%) | 0 (0.0%) |
| 8 or more Rooms | 2 (2.7%) | 0 (0.0%) |
| Total | 73 (100.0%) | 17 (100.0%) |
Housing Structure by Heating Type in Kiana
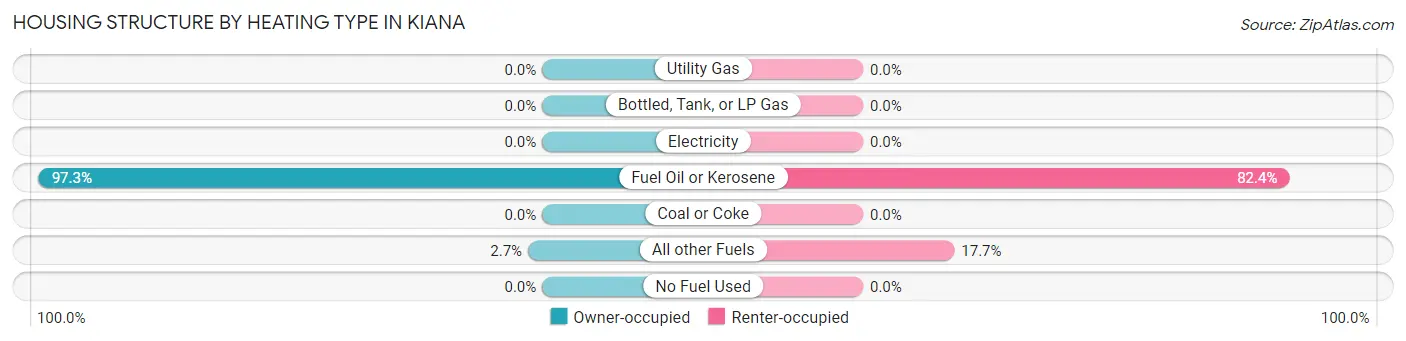
| Heating Type | Owner-occupied | Renter-occupied |
| Utility Gas | 0 (0.0%) | 0 (0.0%) |
| Bottled, Tank, or LP Gas | 0 (0.0%) | 0 (0.0%) |
| Electricity | 0 (0.0%) | 0 (0.0%) |
| Fuel Oil or Kerosene | 71 (97.3%) | 14 (82.4%) |
| Coal or Coke | 0 (0.0%) | 0 (0.0%) |
| All other Fuels | 2 (2.7%) | 3 (17.6%) |
| No Fuel Used | 0 (0.0%) | 0 (0.0%) |
| Total | 73 (100.0%) | 17 (100.0%) |
Household Vehicle Usage in Kiana
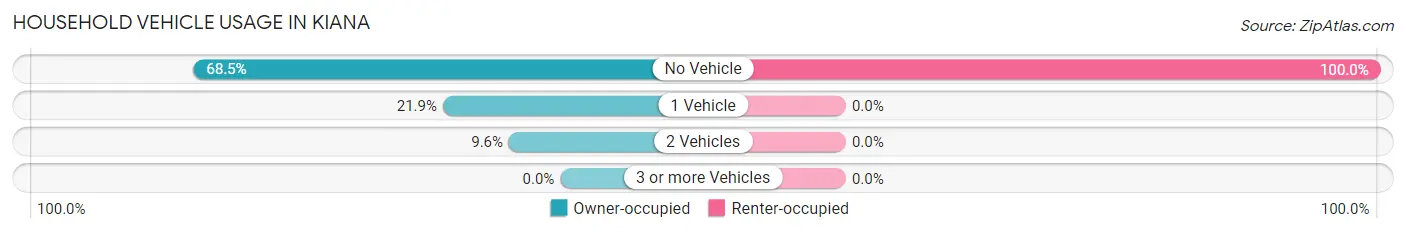
| Vehicles per Household | Owner-occupied | Renter-occupied |
| No Vehicle | 50 (68.5%) | 17 (100.0%) |
| 1 Vehicle | 16 (21.9%) | 0 (0.0%) |
| 2 Vehicles | 7 (9.6%) | 0 (0.0%) |
| 3 or more Vehicles | 0 (0.0%) | 0 (0.0%) |
| Total | 73 (100.0%) | 17 (100.0%) |
Real Estate & Mortgages in Kiana
Real Estate and Mortgage Overview in Kiana
| Characteristic | Without Mortgage | With Mortgage |
| Housing Units | 48 | 25 |
| Median Property Value | $90,000 | $165,600 |
| Median Household Income | $63,409 | $6 |
| Monthly Housing Costs | $650 | $2 |
| Real Estate Taxes | - | - |
Property Value by Mortgage Status in Kiana
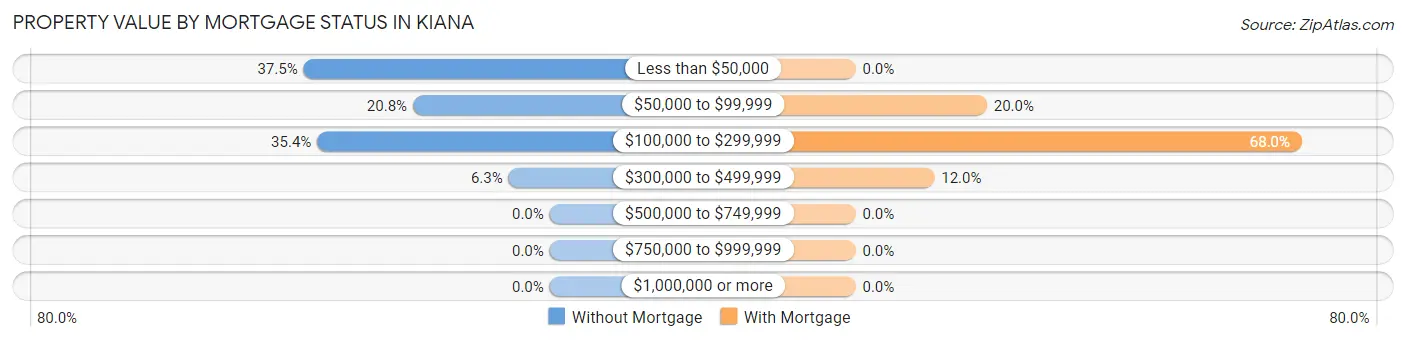
| Property Value | Without Mortgage | With Mortgage |
| Less than $50,000 | 18 (37.5%) | 0 (0.0%) |
| $50,000 to $99,999 | 10 (20.8%) | 5 (20.0%) |
| $100,000 to $299,999 | 17 (35.4%) | 17 (68.0%) |
| $300,000 to $499,999 | 3 (6.2%) | 3 (12.0%) |
| $500,000 to $749,999 | 0 (0.0%) | 0 (0.0%) |
| $750,000 to $999,999 | 0 (0.0%) | 0 (0.0%) |
| $1,000,000 or more | 0 (0.0%) | 0 (0.0%) |
| Total | 48 (100.0%) | 25 (100.0%) |
Household Income by Mortgage Status in Kiana
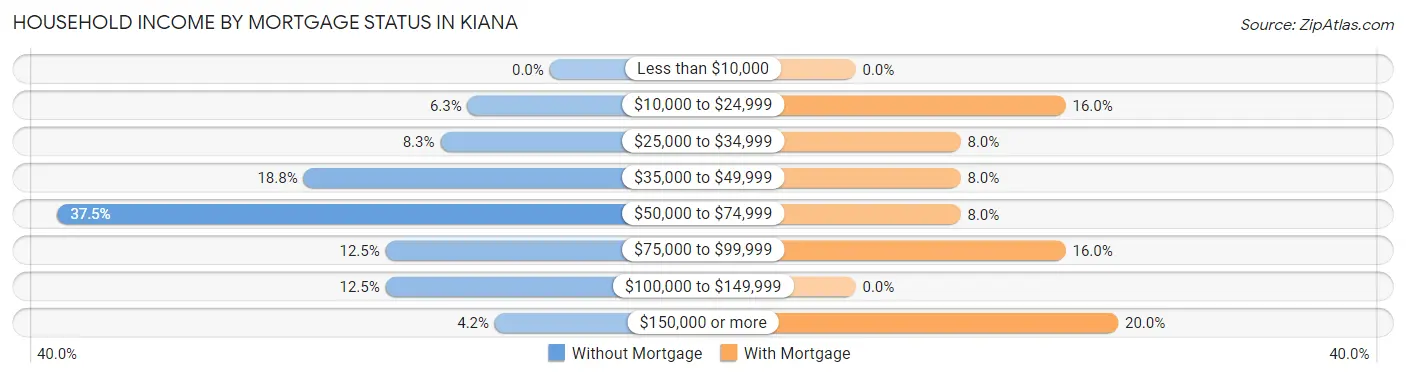
| Household Income | Without Mortgage | With Mortgage |
| Less than $10,000 | 0 (0.0%) | 0 (0.0%) |
| $10,000 to $24,999 | 3 (6.2%) | 4 (16.0%) |
| $25,000 to $34,999 | 4 (8.3%) | 2 (8.0%) |
| $35,000 to $49,999 | 9 (18.8%) | 2 (8.0%) |
| $50,000 to $74,999 | 18 (37.5%) | 2 (8.0%) |
| $75,000 to $99,999 | 6 (12.5%) | 4 (16.0%) |
| $100,000 to $149,999 | 6 (12.5%) | 0 (0.0%) |
| $150,000 or more | 2 (4.2%) | 5 (20.0%) |
| Total | 48 (100.0%) | 25 (100.0%) |
Property Value to Household Income Ratio in Kiana
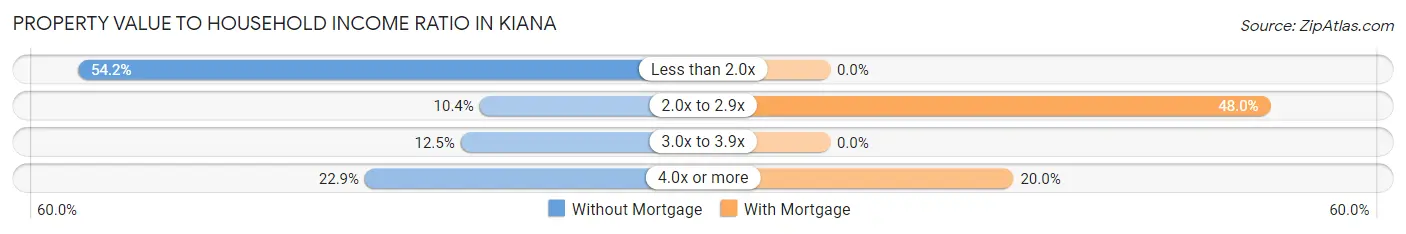
| Value-to-Income Ratio | Without Mortgage | With Mortgage |
| Less than 2.0x | 26 (54.2%) | 0 (0.0%) |
| 2.0x to 2.9x | 5 (10.4%) | 12 (48.0%) |
| 3.0x to 3.9x | 6 (12.5%) | 0 (0.0%) |
| 4.0x or more | 11 (22.9%) | 5 (20.0%) |
| Total | 48 (100.0%) | 25 (100.0%) |
Real Estate Taxes by Mortgage Status in Kiana
| Property Taxes | Without Mortgage | With Mortgage |
| Less than $800 | 0 (0.0%) | 0 (0.0%) |
| $800 to $1,499 | 0 (0.0%) | 0 (0.0%) |
| $800 to $1,499 | 0 (0.0%) | 0 (0.0%) |
| Total | 48 (100.0%) | 25 (100.0%) |
Health & Disability in Kiana
Health Insurance Coverage by Age in Kiana
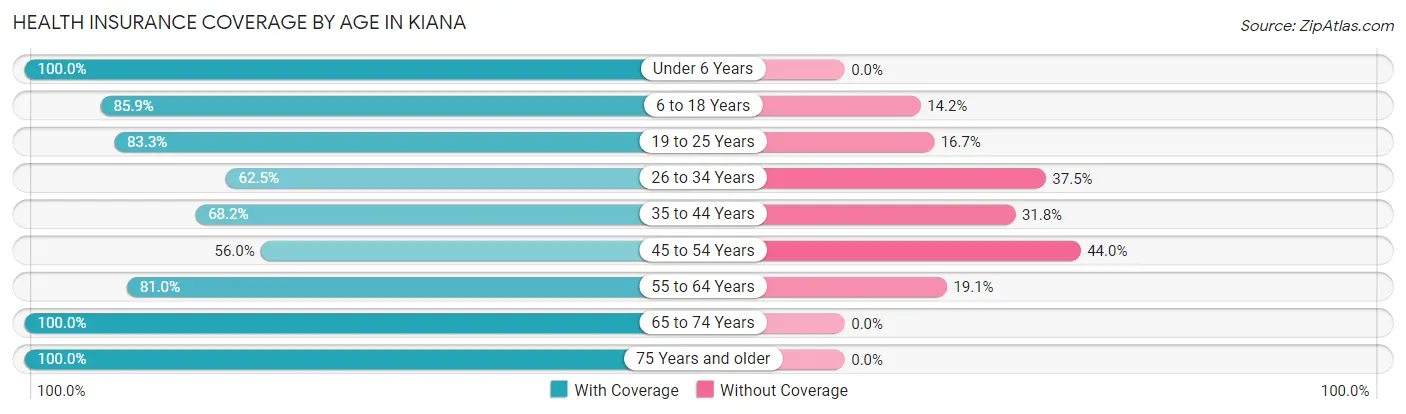
| Age Bracket | With Coverage | Without Coverage |
| Under 6 Years | 53 (100.0%) | 0 (0.0%) |
| 6 to 18 Years | 91 (85.9%) | 15 (14.1%) |
| 19 to 25 Years | 50 (83.3%) | 10 (16.7%) |
| 26 to 34 Years | 25 (62.5%) | 15 (37.5%) |
| 35 to 44 Years | 30 (68.2%) | 14 (31.8%) |
| 45 to 54 Years | 14 (56.0%) | 11 (44.0%) |
| 55 to 64 Years | 34 (80.9%) | 8 (19.1%) |
| 65 to 74 Years | 31 (100.0%) | 0 (0.0%) |
| 75 Years and older | 21 (100.0%) | 0 (0.0%) |
| Total | 349 (82.7%) | 73 (17.3%) |
Health Insurance Coverage by Citizenship Status in Kiana
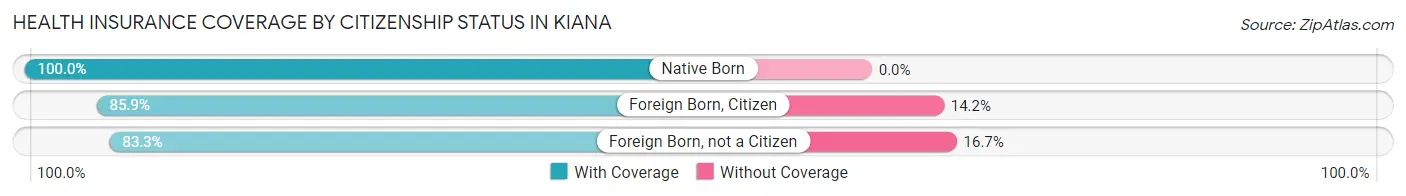
| Citizenship Status | With Coverage | Without Coverage |
| Native Born | 53 (100.0%) | 0 (0.0%) |
| Foreign Born, Citizen | 91 (85.9%) | 15 (14.1%) |
| Foreign Born, not a Citizen | 50 (83.3%) | 10 (16.7%) |
Health Insurance Coverage by Household Income in Kiana
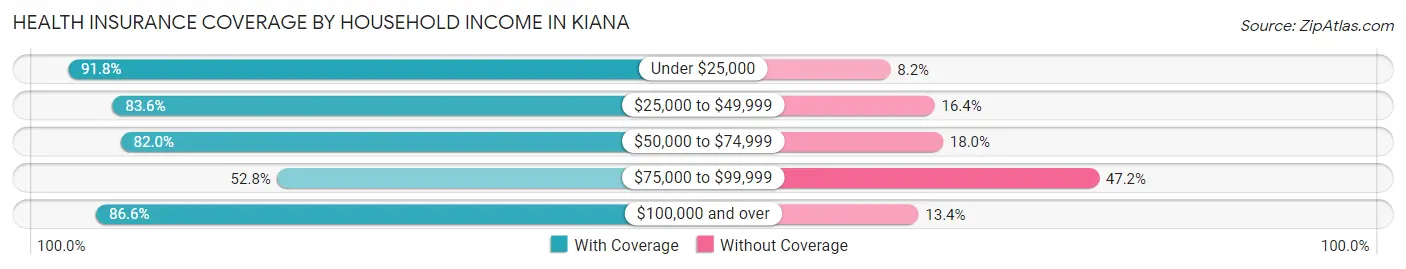
| Household Income | With Coverage | Without Coverage |
| Under $25,000 | 45 (91.8%) | 4 (8.2%) |
| $25,000 to $49,999 | 61 (83.6%) | 12 (16.4%) |
| $50,000 to $74,999 | 82 (82.0%) | 18 (18.0%) |
| $75,000 to $99,999 | 19 (52.8%) | 17 (47.2%) |
| $100,000 and over | 142 (86.6%) | 22 (13.4%) |
Public vs Private Health Insurance Coverage by Age in Kiana
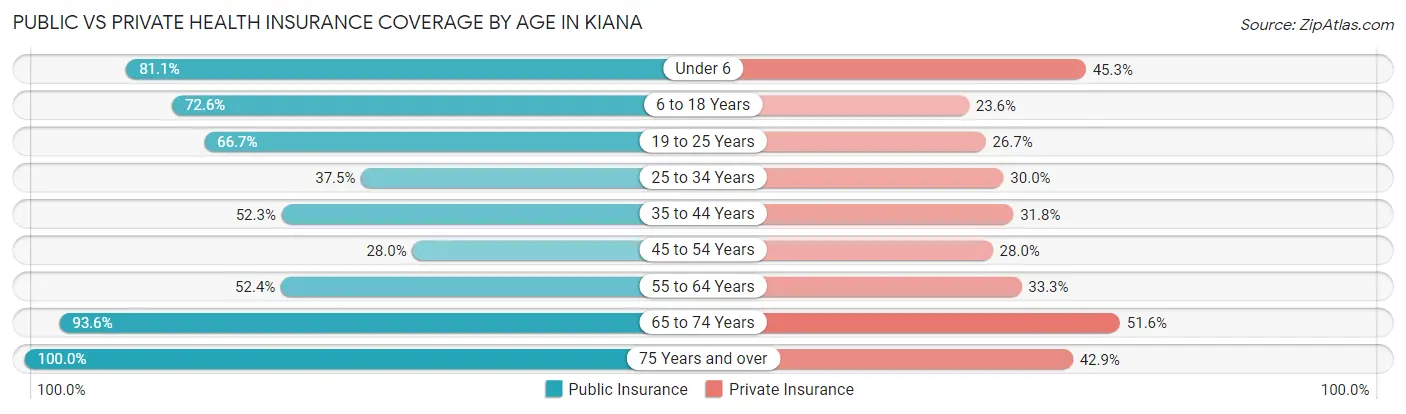
| Age Bracket | Public Insurance | Private Insurance |
| Under 6 | 43 (81.1%) | 24 (45.3%) |
| 6 to 18 Years | 77 (72.6%) | 25 (23.6%) |
| 19 to 25 Years | 40 (66.7%) | 16 (26.7%) |
| 25 to 34 Years | 15 (37.5%) | 12 (30.0%) |
| 35 to 44 Years | 23 (52.3%) | 14 (31.8%) |
| 45 to 54 Years | 7 (28.0%) | 7 (28.0%) |
| 55 to 64 Years | 22 (52.4%) | 14 (33.3%) |
| 65 to 74 Years | 29 (93.5%) | 16 (51.6%) |
| 75 Years and over | 21 (100.0%) | 9 (42.9%) |
| Total | 277 (65.6%) | 137 (32.5%) |
Disability Status by Sex by Age in Kiana
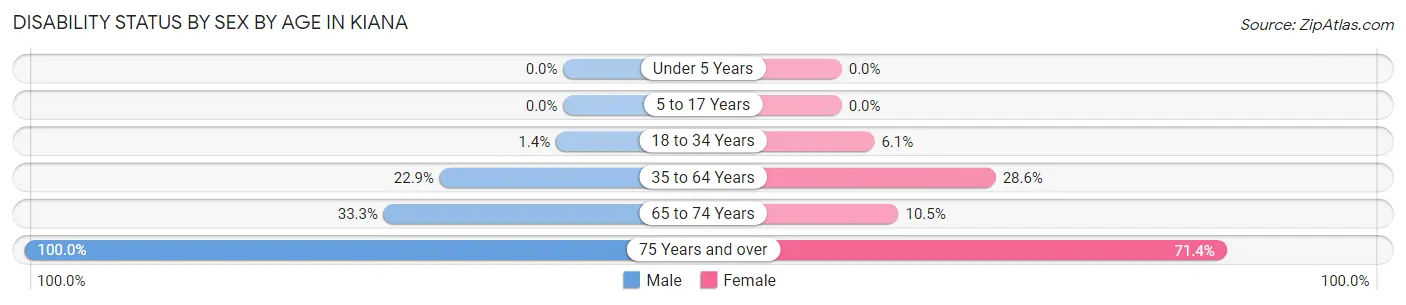
| Age Bracket | Male | Female |
| Under 5 Years | 0 (0.0%) | 0 (0.0%) |
| 5 to 17 Years | 0 (0.0%) | 0 (0.0%) |
| 18 to 34 Years | 1 (1.4%) | 2 (6.1%) |
| 35 to 64 Years | 11 (22.9%) | 18 (28.6%) |
| 65 to 74 Years | 4 (33.3%) | 2 (10.5%) |
| 75 Years and over | 14 (100.0%) | 5 (71.4%) |
Disability Class by Sex by Age in Kiana
Disability Class: Hearing Difficulty
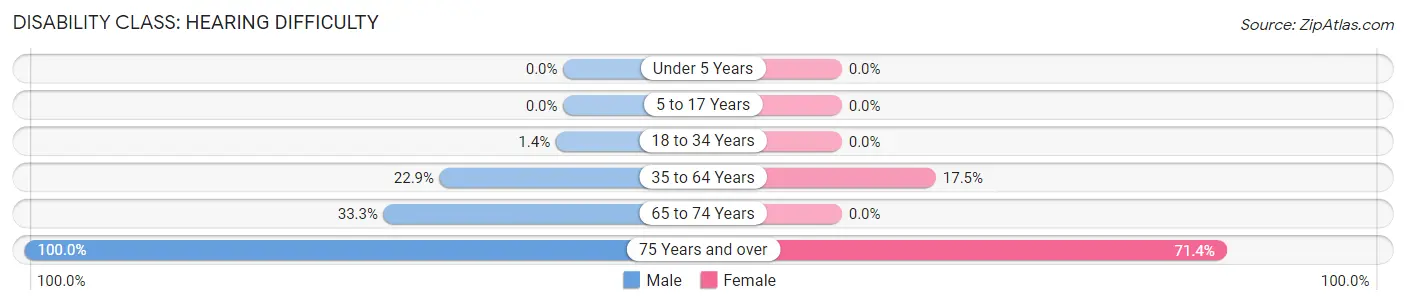
| Age Bracket | Male | Female |
| Under 5 Years | 0 (0.0%) | 0 (0.0%) |
| 5 to 17 Years | 0 (0.0%) | 0 (0.0%) |
| 18 to 34 Years | 1 (1.4%) | 0 (0.0%) |
| 35 to 64 Years | 11 (22.9%) | 11 (17.5%) |
| 65 to 74 Years | 4 (33.3%) | 0 (0.0%) |
| 75 Years and over | 14 (100.0%) | 5 (71.4%) |
Disability Class: Vision Difficulty
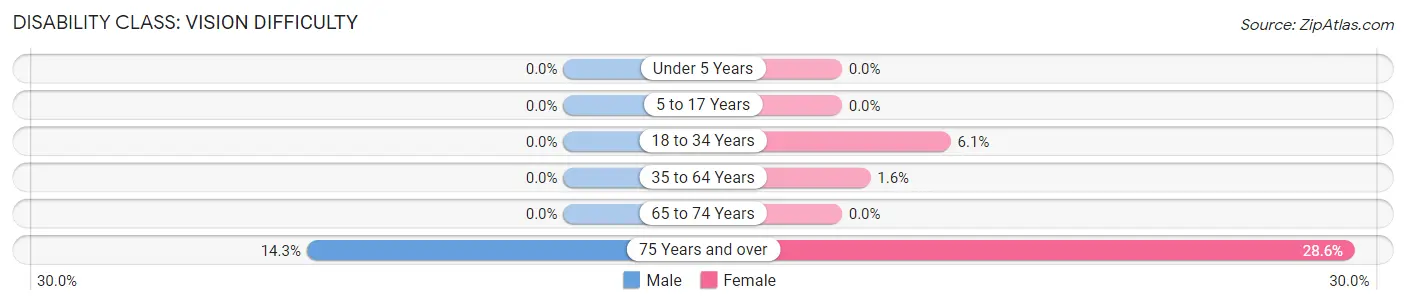
| Age Bracket | Male | Female |
| Under 5 Years | 0 (0.0%) | 0 (0.0%) |
| 5 to 17 Years | 0 (0.0%) | 0 (0.0%) |
| 18 to 34 Years | 0 (0.0%) | 2 (6.1%) |
| 35 to 64 Years | 0 (0.0%) | 1 (1.6%) |
| 65 to 74 Years | 0 (0.0%) | 0 (0.0%) |
| 75 Years and over | 2 (14.3%) | 2 (28.6%) |
Disability Class: Cognitive Difficulty
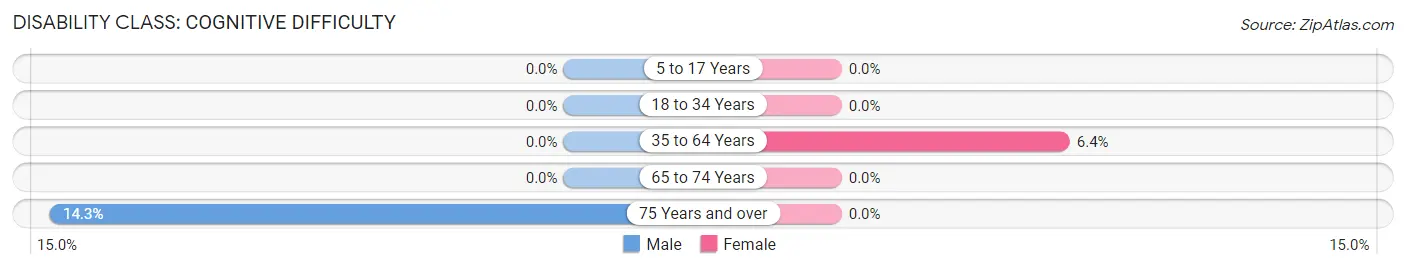
| Age Bracket | Male | Female |
| 5 to 17 Years | 0 (0.0%) | 0 (0.0%) |
| 18 to 34 Years | 0 (0.0%) | 0 (0.0%) |
| 35 to 64 Years | 0 (0.0%) | 4 (6.4%) |
| 65 to 74 Years | 0 (0.0%) | 0 (0.0%) |
| 75 Years and over | 2 (14.3%) | 0 (0.0%) |
Disability Class: Ambulatory Difficulty
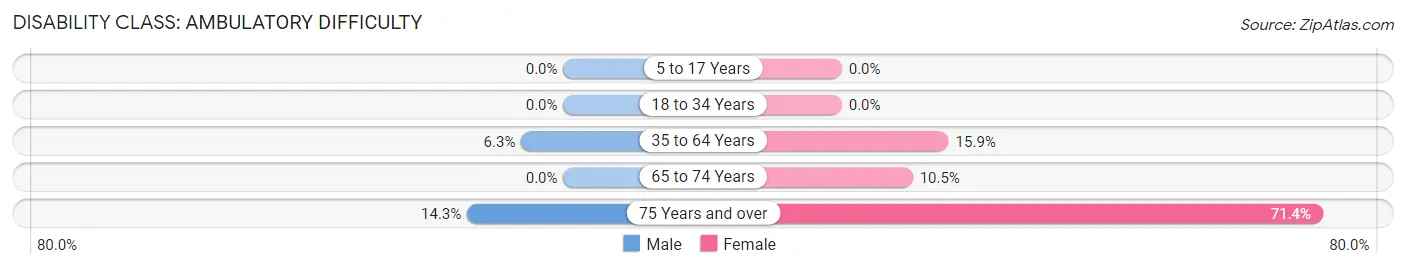
| Age Bracket | Male | Female |
| 5 to 17 Years | 0 (0.0%) | 0 (0.0%) |
| 18 to 34 Years | 0 (0.0%) | 0 (0.0%) |
| 35 to 64 Years | 3 (6.2%) | 10 (15.9%) |
| 65 to 74 Years | 0 (0.0%) | 2 (10.5%) |
| 75 Years and over | 2 (14.3%) | 5 (71.4%) |
Disability Class: Self-Care Difficulty
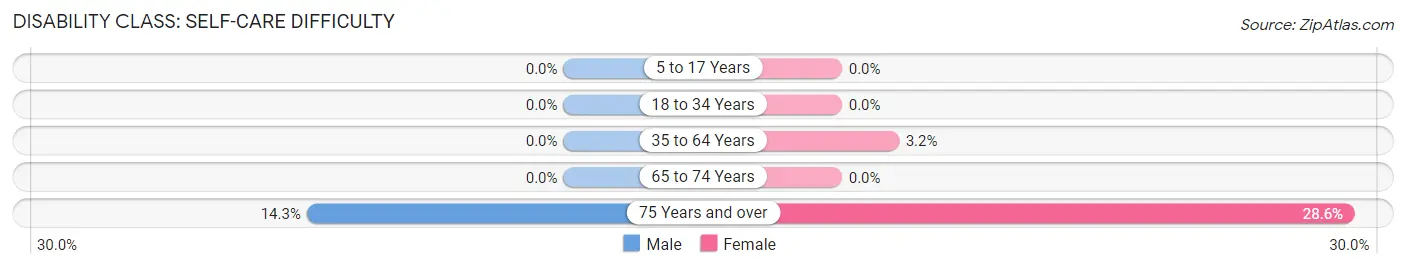
| Age Bracket | Male | Female |
| 5 to 17 Years | 0 (0.0%) | 0 (0.0%) |
| 18 to 34 Years | 0 (0.0%) | 0 (0.0%) |
| 35 to 64 Years | 0 (0.0%) | 2 (3.2%) |
| 65 to 74 Years | 0 (0.0%) | 0 (0.0%) |
| 75 Years and over | 2 (14.3%) | 2 (28.6%) |
Technology Access in Kiana
Computing Device Access in Kiana
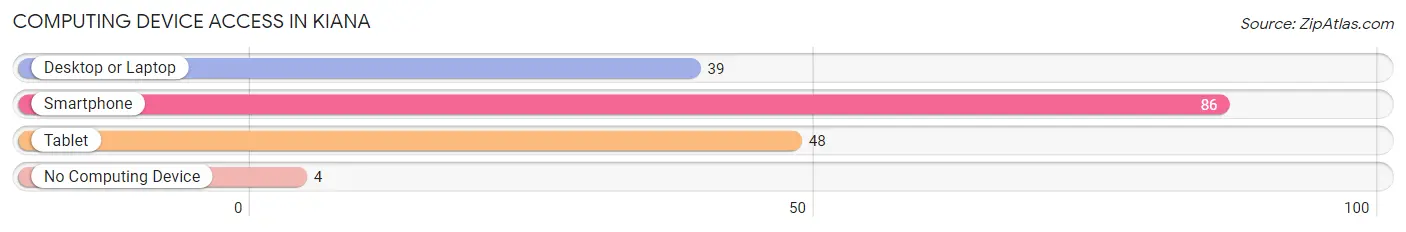
| Device Type | # Households | % Households |
| Desktop or Laptop | 39 | 43.3% |
| Smartphone | 86 | 95.6% |
| Tablet | 48 | 53.3% |
| No Computing Device | 4 | 4.4% |
| Total | 90 | 100.0% |
Internet Access in Kiana
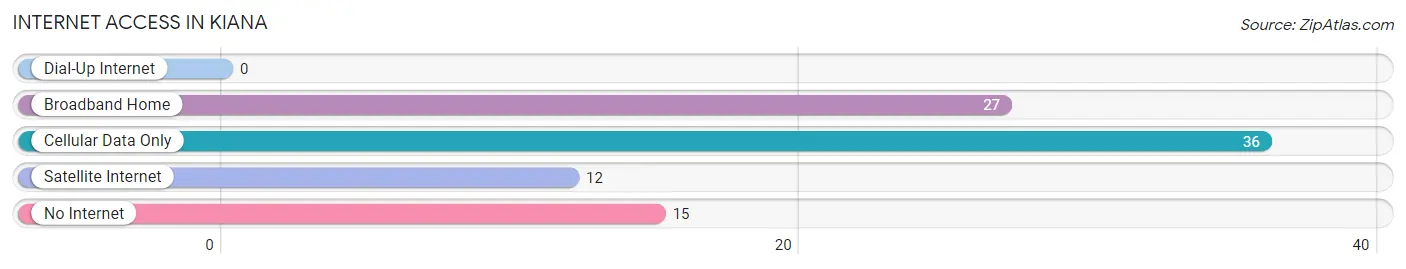
| Internet Type | # Households | % Households |
| Dial-Up Internet | 0 | 0.0% |
| Broadband Home | 27 | 30.0% |
| Cellular Data Only | 36 | 40.0% |
| Satellite Internet | 12 | 13.3% |
| No Internet | 15 | 16.7% |
| Total | 90 | 100.0% |
Kiana Summary
Kiana, Alaska is a small city located in the Northwest Arctic Borough of Alaska. It is situated on the Kobuk River, about 40 miles east of Kotzebue. The city has a population of about 500 people, and is the largest city in the Northwest Arctic Borough.
History
Kiana was first settled by the Inupiat people in the late 1800s. The Inupiat people were nomadic hunters and gatherers who lived off the land. They were known for their subsistence lifestyle, which included hunting, fishing, and gathering. The Inupiat people were also known for their strong spiritual beliefs and their close connection to the land.
In the early 1900s, Kiana was a trading post for the Inupiat people. The trading post was a place where the Inupiat people could trade goods and services with other tribes and with traders from the outside world.
In the 1950s, the U.S. government began to build roads and schools in Kiana. This allowed the Inupiat people to have access to more resources and to become more connected to the outside world.
In the 1970s, the Alaska Native Claims Settlement Act (ANCSA) was passed, which allowed the Inupiat people to receive land and money in exchange for their traditional lands. This allowed the Inupiat people to become more self-sufficient and to have more control over their own lives.
Geography
Kiana is located in the Northwest Arctic Borough of Alaska. It is situated on the Kobuk River, about 40 miles east of Kotzebue. The city is surrounded by mountains and tundra, and is located in a region known as the “Arctic Slope.”
The climate in Kiana is cold and dry, with temperatures ranging from -20 to 70 degrees Fahrenheit. The area receives an average of 16 inches of precipitation per year, with most of it falling in the form of snow.
Economy
Kiana’s economy is largely based on subsistence activities, such as hunting, fishing, and gathering. The Inupiat people also rely on the land for their livelihood, and many of them are employed in the oil and gas industry.
The city also has a small tourism industry, with visitors coming to experience the unique culture and landscape of the Arctic Slope.
Demographics
As of the 2010 census, Kiana had a population of 498 people. The population is predominantly Inupiat, with a small number of non-Native residents. The median age of the population is 28.7 years, and the median household income is $45,000.
Kiana is a small city with a unique culture and history. It is a place where the Inupiat people have been able to maintain their traditional lifestyle and culture, while also adapting to the modern world. The city is a great example of how different cultures can coexist and thrive in the same area.
Common Questions
What is Per Capita Income in Kiana?
Per Capita income in Kiana is $20,511.
What is the Median Family Income in Kiana?
Median Family Income in Kiana is $63,068.
What is the Median Household income in Kiana?
Median Household Income in Kiana is $62,727.
What is Income or Wage Gap in Kiana?
Income or Wage Gap in Kiana is 5.9%.
Women in Kiana earn 94.1 cents for every dollar earned by a man.
What is Inequality or Gini Index in Kiana?
Inequality or Gini Index in Kiana is 0.43.
What is the Total Population of Kiana?
Total Population of Kiana is 422.
What is the Total Male Population of Kiana?
Total Male Population of Kiana is 219.
What is the Total Female Population of Kiana?
Total Female Population of Kiana is 203.
What is the Ratio of Males per 100 Females in Kiana?
There are 107.88 Males per 100 Females in Kiana.
What is the Ratio of Females per 100 Males in Kiana?
There are 92.69 Females per 100 Males in Kiana.
What is the Median Population Age in Kiana?
Median Population Age in Kiana is 24.6 Years.
What is the Average Family Size in Kiana
Average Family Size in Kiana is 4.7 People.
What is the Average Household Size in Kiana
Average Household Size in Kiana is 4.7 People.
How Large is the Labor Force in Kiana?
There are 152 People in the Labor Forcein in Kiana.
What is the Percentage of People in the Labor Force in Kiana?
52.6% of People are in the Labor Force in Kiana.
What is the Unemployment Rate in Kiana?
Unemployment Rate in Kiana is 28.9%.