Karluk, AK Map & Demographics
Karluk Map
Karluk Overview
$28,848
PER CAPITA INCOME
25.3%
WAGE / INCOME GAP [ % ]
74.7¢/ $1
WAGE / INCOME GAP [ $ ]
0.40
INEQUALITY / GINI INDEX
27
TOTAL POPULATION
18
MALE POPULATION
9
FEMALE POPULATION
200.00
MALES / 100 FEMALES
50.00
FEMALES / 100 MALES
23.8
MEDIAN AGE
2.5
AVG FAMILY SIZE
2.5
AVG HOUSEHOLD SIZE
19
LABOR FORCE [ PEOPLE ]
70.4%
PERCENT IN LABOR FORCE
15.8%
UNEMPLOYMENT RATE
Karluk Zip Codes
Karluk Area Codes
Income in Karluk
Income Overview in Karluk
| Characteristic | Number | Measure |
| Per Capita Income | 27 | $28,848 |
| Median Family Income | 11 | $0 |
| Mean Family Income | 11 | $79,982 |
| Median Household Income | 11 | $0 |
| Mean Household Income | 11 | $79,982 |
| Income Deficit | 11 | $0 |
| Wage / Income Gap (%) | 27 | 25.30% |
| Wage / Income Gap ($) | 27 | 74.70¢ per $1 |
| Gini / Inequality Index | 27 | 0.40 |
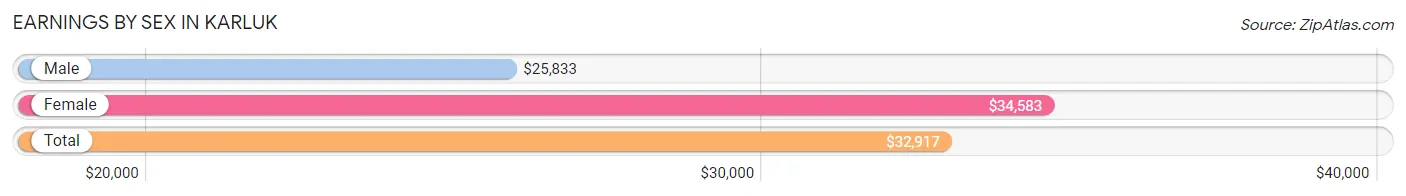
Earnings by Sex in Karluk
Average Earnings in Karluk are $32,917, $25,833 for men and $34,583 for women, a difference of 25.3%.
| Sex | Number | Average Earnings |
| Male | 10 (52.6%) | $25,833 |
| Female | 9 (47.4%) | $34,583 |
| Total | 19 (100.0%) | $32,917 |
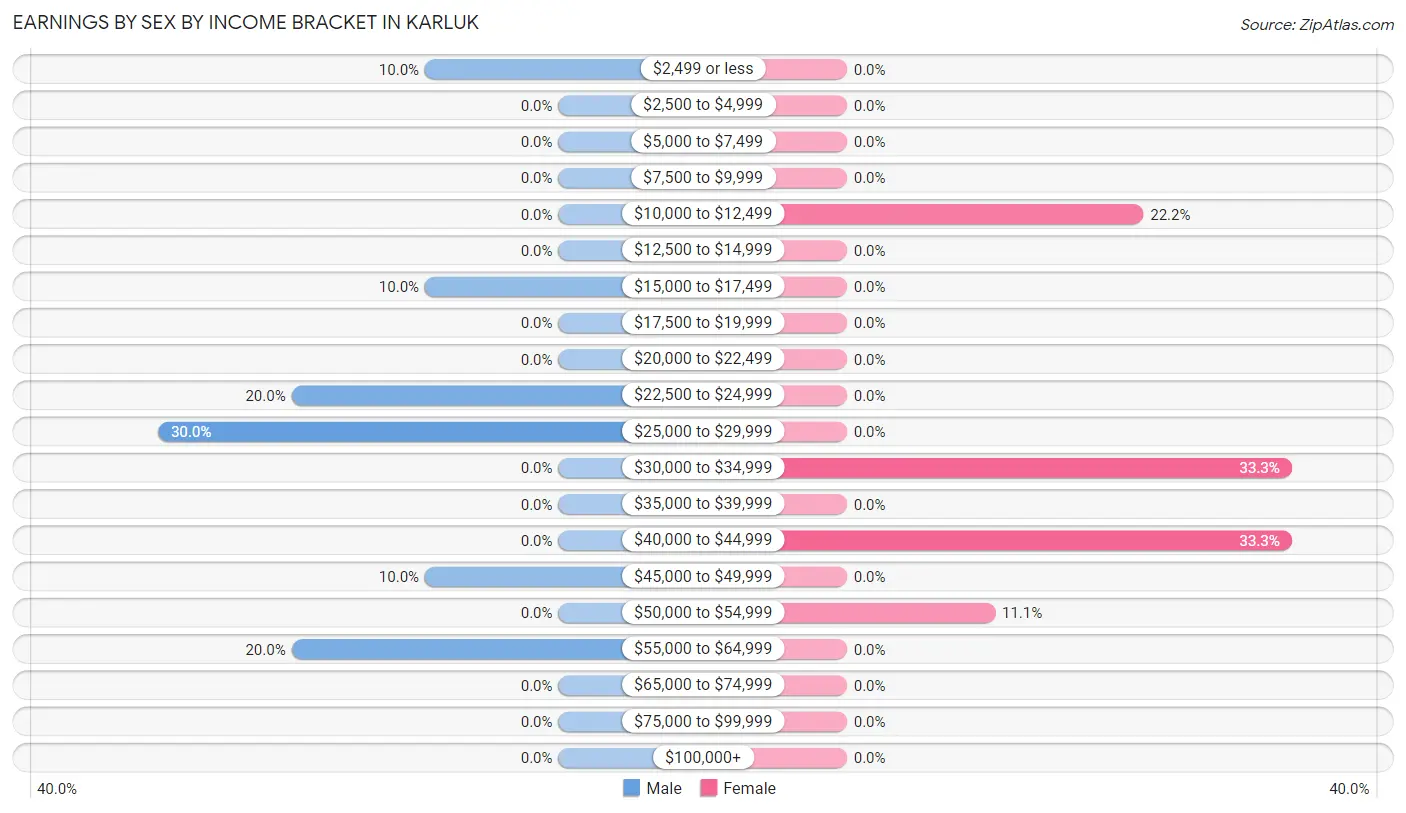
Earnings by Sex by Income Bracket in Karluk
The most common earnings brackets in Karluk are $25,000 to $29,999 for men (3 | 30.0%) and $30,000 to $34,999 for women (3 | 33.3%).
| Income | Male | Female |
| $2,499 or less | 1 (10.0%) | 0 (0.0%) |
| $2,500 to $4,999 | 0 (0.0%) | 0 (0.0%) |
| $5,000 to $7,499 | 0 (0.0%) | 0 (0.0%) |
| $7,500 to $9,999 | 0 (0.0%) | 0 (0.0%) |
| $10,000 to $12,499 | 0 (0.0%) | 2 (22.2%) |
| $12,500 to $14,999 | 0 (0.0%) | 0 (0.0%) |
| $15,000 to $17,499 | 1 (10.0%) | 0 (0.0%) |
| $17,500 to $19,999 | 0 (0.0%) | 0 (0.0%) |
| $20,000 to $22,499 | 0 (0.0%) | 0 (0.0%) |
| $22,500 to $24,999 | 2 (20.0%) | 0 (0.0%) |
| $25,000 to $29,999 | 3 (30.0%) | 0 (0.0%) |
| $30,000 to $34,999 | 0 (0.0%) | 3 (33.3%) |
| $35,000 to $39,999 | 0 (0.0%) | 0 (0.0%) |
| $40,000 to $44,999 | 0 (0.0%) | 3 (33.3%) |
| $45,000 to $49,999 | 1 (10.0%) | 0 (0.0%) |
| $50,000 to $54,999 | 0 (0.0%) | 1 (11.1%) |
| $55,000 to $64,999 | 2 (20.0%) | 0 (0.0%) |
| $65,000 to $74,999 | 0 (0.0%) | 0 (0.0%) |
| $75,000 to $99,999 | 0 (0.0%) | 0 (0.0%) |
| $100,000+ | 0 (0.0%) | 0 (0.0%) |
| Total | 10 (100.0%) | 9 (100.0%) |
Earnings by Sex by Educational Attainment in Karluk

| Educational Attainment | Male Income | Female Income |
| Less than High School | - | - |
| High School Diploma | - | - |
| College or Associate's Degree | - | - |
| Bachelor's Degree | - | - |
| Graduate Degree | - | - |
| Total | - | - |
Family Income in Karluk
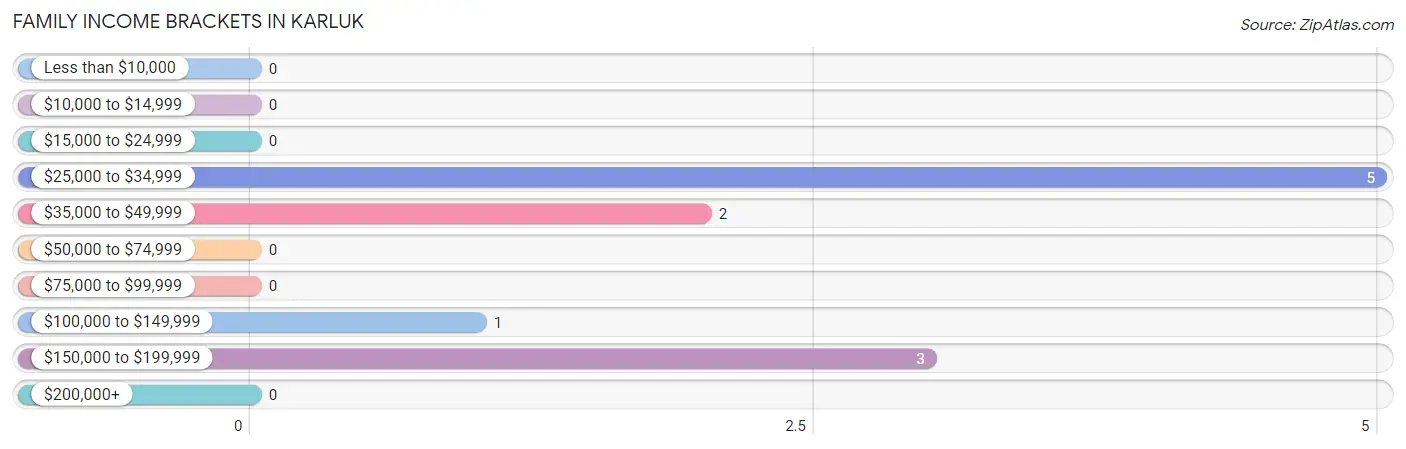
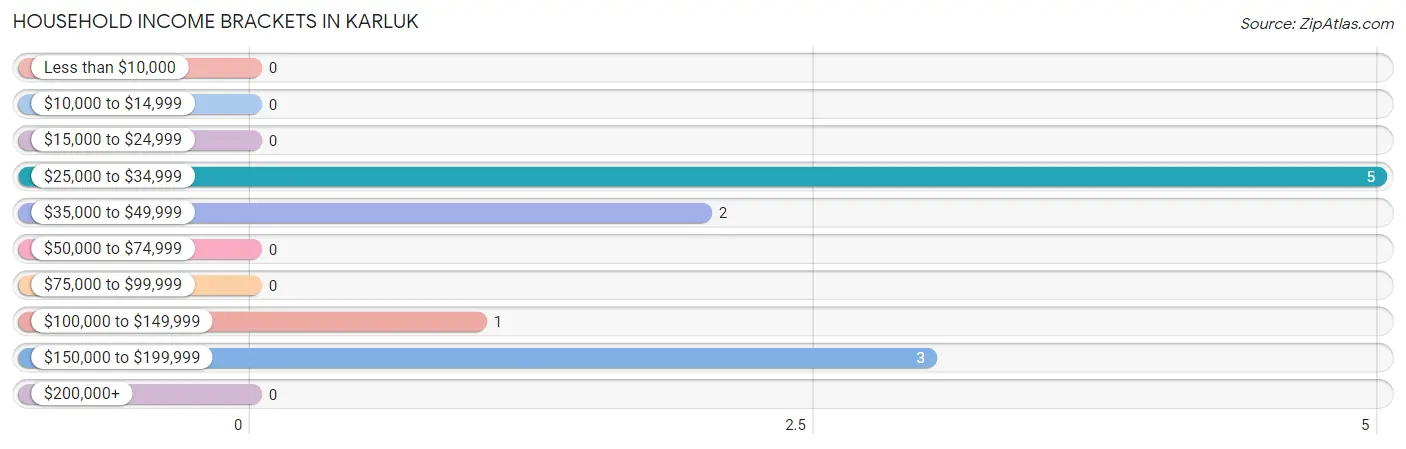
Family Income Brackets in Karluk
According to the Karluk family income data, there are 5 families falling into the $25,000 to $34,999 income range, which is the most common income bracket and makes up 45.5% of all families.
| Income Bracket | # Families | % Families |
| Less than $10,000 | 0 | 0.0% |
| $10,000 to $14,999 | 0 | 0.0% |
| $15,000 to $24,999 | 0 | 0.0% |
| $25,000 to $34,999 | 5 | 45.5% |
| $35,000 to $49,999 | 2 | 18.2% |
| $50,000 to $74,999 | 0 | 0.0% |
| $75,000 to $99,999 | 0 | 0.0% |
| $100,000 to $149,999 | 1 | 9.1% |
| $150,000 to $199,999 | 3 | 27.3% |
| $200,000+ | 0 | 0.0% |
Family Income by Famaliy Size in Karluk
| Income Bracket | # Families | Median Income |
| 2-Person Families | 8 (72.7%) | $0 |
| 3-Person Families | 0 (0.0%) | $0 |
| 4-Person Families | 0 (0.0%) | $0 |
| 5-Person Families | 0 (0.0%) | $0 |
| 6-Person Families | 3 (27.3%) | $0 |
| 7+ Person Families | 0 (0.0%) | $0 |
| Total | 11 (100.0%) | $0 |
Family Income by Number of Earners in Karluk
| Number of Earners | # Families | Median Income |
| No Earners | 5 (45.5%) | $0 |
| 1 Earner | 0 (0.0%) | $0 |
| 2 Earners | 3 (27.3%) | $0 |
| 3+ Earners | 3 (27.3%) | $0 |
| Total | 11 (100.0%) | $0 |
Household Income in Karluk
Household Income Brackets in Karluk
With 5 households falling in the category, the $25,000 to $34,999 income range is the most frequent in Karluk, accounting for 45.5% of all households.
| Income Bracket | # Households | % Households |
| Less than $10,000 | 0 | 0.0% |
| $10,000 to $14,999 | 0 | 0.0% |
| $15,000 to $24,999 | 0 | 0.0% |
| $25,000 to $34,999 | 5 | 45.5% |
| $35,000 to $49,999 | 2 | 18.2% |
| $50,000 to $74,999 | 0 | 0.0% |
| $75,000 to $99,999 | 0 | 0.0% |
| $100,000 to $149,999 | 1 | 9.1% |
| $150,000 to $199,999 | 3 | 27.3% |
| $200,000+ | 0 | 0.0% |
Household Income by Householder Age in Karluk
| Income Bracket | # Households | Median Income |
| 15 to 24 Years | 2 (18.2%) | $0 |
| 25 to 44 Years | 3 (27.3%) | $0 |
| 45 to 64 Years | 1 (9.1%) | $0 |
| 65+ Years | 5 (45.5%) | $0 |
| Total | 11 (100.0%) | $0 |
Poverty in Karluk
Income Below Poverty by Sex and Age in Karluk
| Age Bracket | Male | Female |
| Under 5 Years | 0 (0.0%) | 0 (0.0%) |
| 5 Years | 0 (0.0%) | 0 (0.0%) |
| 6 to 11 Years | 0 (0.0%) | 0 (0.0%) |
| 12 to 14 Years | 0 (0.0%) | 0 (0.0%) |
| 15 Years | 0 (0.0%) | 0 (0.0%) |
| 16 and 17 Years | 0 (0.0%) | 0 (0.0%) |
| 18 to 24 Years | 0 (0.0%) | 0 (0.0%) |
| 25 to 34 Years | 0 (0.0%) | 0 (0.0%) |
| 35 to 44 Years | 0 (0.0%) | 0 (0.0%) |
| 45 to 54 Years | 0 (0.0%) | 0 (0.0%) |
| 55 to 64 Years | 0 (0.0%) | 0 (0.0%) |
| 65 to 74 Years | 0 (0.0%) | 0 (0.0%) |
| 75 Years and over | 0 (0.0%) | 0 (0.0%) |
| Total | 0 (0.0%) | 0 (0.0%) |
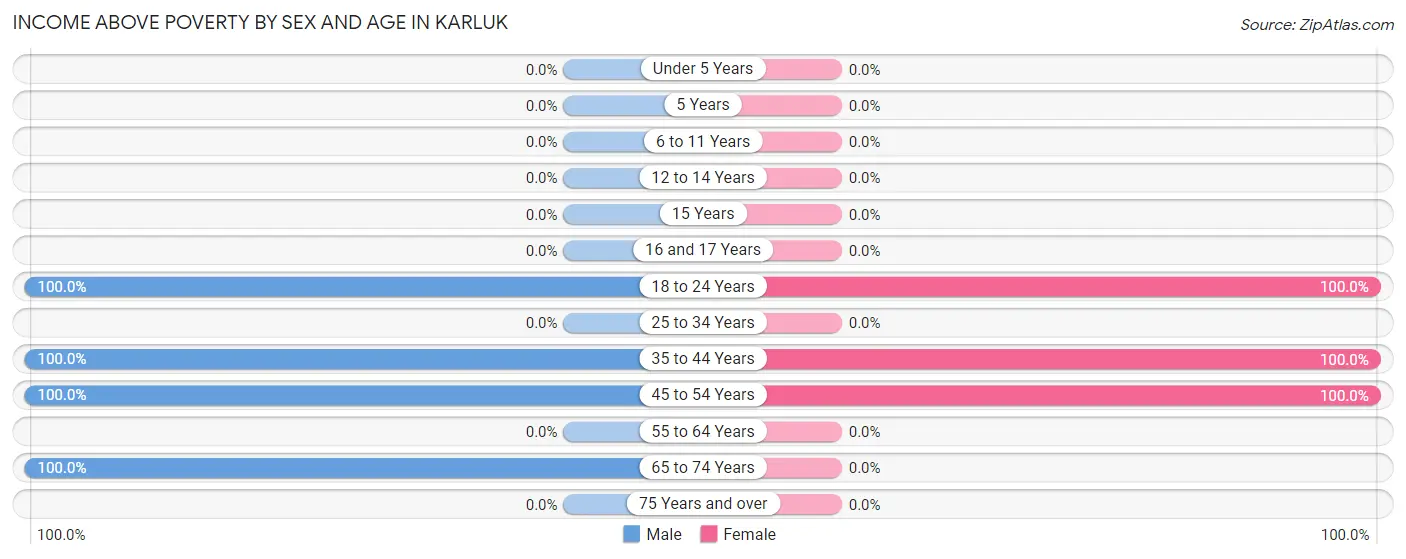
Income Above Poverty by Sex and Age in Karluk
According to the poverty statistics in Karluk, males aged 18 to 24 years and females aged 18 to 24 years are the age groups that are most secure financially, with 100.0% of males and 100.0% of females in these age groups living above the poverty line.
| Age Bracket | Male | Female |
| Under 5 Years | 0 (0.0%) | 0 (0.0%) |
| 5 Years | 0 (0.0%) | 0 (0.0%) |
| 6 to 11 Years | 0 (0.0%) | 0 (0.0%) |
| 12 to 14 Years | 0 (0.0%) | 0 (0.0%) |
| 15 Years | 0 (0.0%) | 0 (0.0%) |
| 16 and 17 Years | 0 (0.0%) | 0 (0.0%) |
| 18 to 24 Years | 9 (100.0%) | 5 (100.0%) |
| 25 to 34 Years | 0 (0.0%) | 0 (0.0%) |
| 35 to 44 Years | 3 (100.0%) | 3 (100.0%) |
| 45 to 54 Years | 1 (100.0%) | 1 (100.0%) |
| 55 to 64 Years | 0 (0.0%) | 0 (0.0%) |
| 65 to 74 Years | 5 (100.0%) | 0 (0.0%) |
| 75 Years and over | 0 (0.0%) | 0 (0.0%) |
| Total | 18 (100.0%) | 9 (100.0%) |
Income Below Poverty Among Married-Couple Families in Karluk
| Children | Above Poverty | Below Poverty |
| No Children | 5 (100.0%) | 0 (0.0%) |
| 1 or 2 Children | 0 (0.0%) | 0 (0.0%) |
| 3 or 4 Children | 0 (0.0%) | 0 (0.0%) |
| 5 or more Children | 0 (0.0%) | 0 (0.0%) |
| Total | 5 (100.0%) | 0 (0.0%) |
Income Below Poverty Among Single-Parent Households in Karluk
| Children | Single Father | Single Mother |
| No Children | 0 (0.0%) | 0 (0.0%) |
| 1 or 2 Children | 0 (0.0%) | 0 (0.0%) |
| 3 or 4 Children | 0 (0.0%) | 0 (0.0%) |
| 5 or more Children | 0 (0.0%) | 0 (0.0%) |
| Total | 0 (0.0%) | 0 (0.0%) |
Income Below Poverty Among Married-Couple vs Single-Parent Households in Karluk
| Children | Married-Couple Families | Single-Parent Households |
| No Children | 0 (0.0%) | 0 (0.0%) |
| 1 or 2 Children | 0 (0.0%) | 0 (0.0%) |
| 3 or 4 Children | 0 (0.0%) | 0 (0.0%) |
| 5 or more Children | 0 (0.0%) | 0 (0.0%) |
| Total | 0 (0.0%) | 0 (0.0%) |
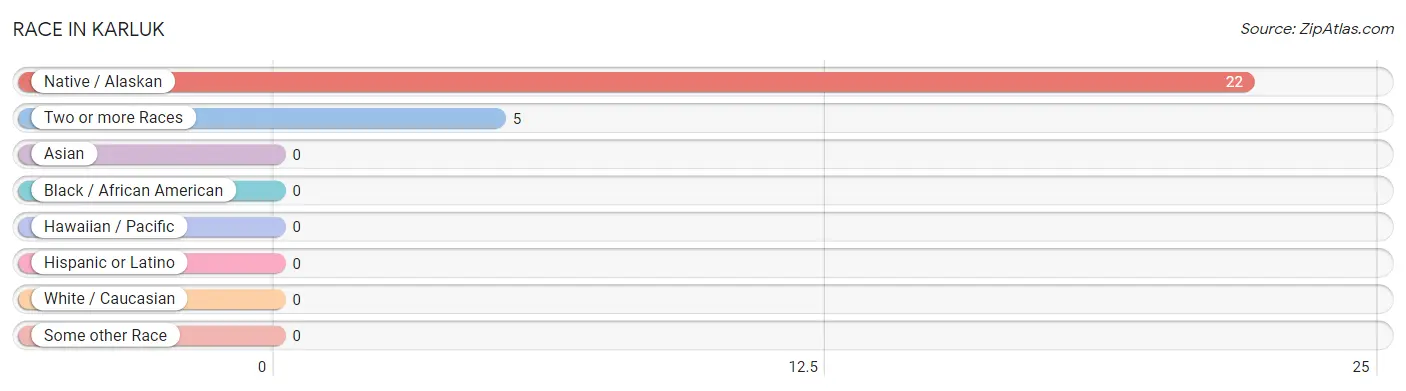
Race in Karluk
The most populous races in Karluk are Native / Alaskan (22 | 81.5%), and Two or more Races (5 | 18.5%).
| Race | # Population | % Population |
| Asian | 0 | 0.0% |
| Black / African American | 0 | 0.0% |
| Hawaiian / Pacific | 0 | 0.0% |
| Hispanic or Latino | 0 | 0.0% |
| Native / Alaskan | 22 | 81.5% |
| White / Caucasian | 0 | 0.0% |
| Two or more Races | 5 | 18.5% |
| Some other Race | 0 | 0.0% |
| Total | 27 | 100.0% |
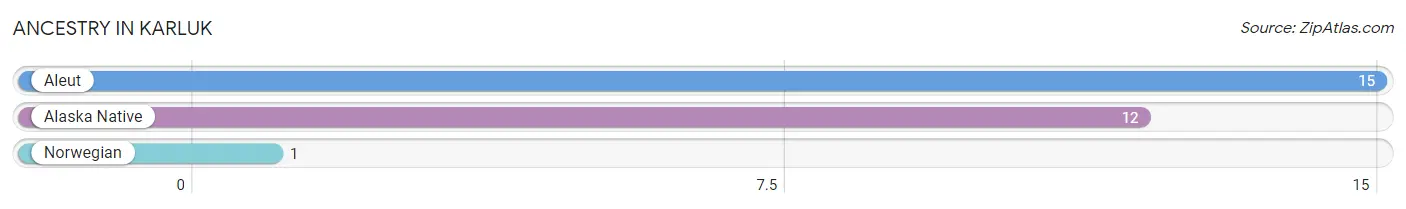
Ancestry in Karluk
The most populous ancestries reported in Karluk are Aleut (15 | 55.6%), Alaska Native (12 | 44.4%), and Norwegian (1 | 3.7%), together accounting for 103.7% of all Karluk residents.
| Ancestry | # Population | % Population |
| Alaska Native | 12 | 44.4% |
| Aleut | 15 | 55.6% |
| Norwegian | 1 | 3.7% | View All 3 Rows |
Immigrants in Karluk

| Immigration Origin | # Population | % Population | View All 0 Rows |
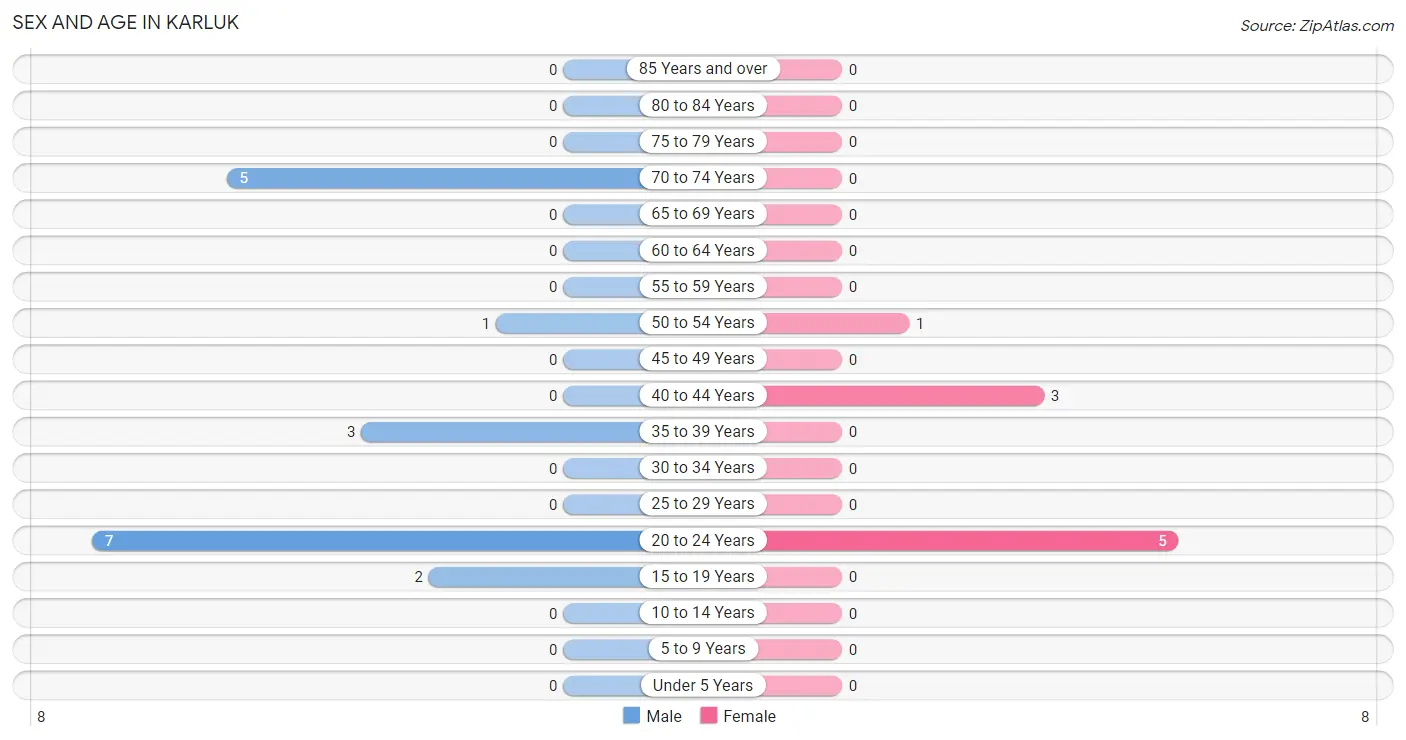
Sex and Age in Karluk
Sex and Age in Karluk
The most populous age groups in Karluk are 20 to 24 Years (7 | 38.9%) for men and 20 to 24 Years (5 | 55.6%) for women.
| Age Bracket | Male | Female |
| Under 5 Years | 0 (0.0%) | 0 (0.0%) |
| 5 to 9 Years | 0 (0.0%) | 0 (0.0%) |
| 10 to 14 Years | 0 (0.0%) | 0 (0.0%) |
| 15 to 19 Years | 2 (11.1%) | 0 (0.0%) |
| 20 to 24 Years | 7 (38.9%) | 5 (55.6%) |
| 25 to 29 Years | 0 (0.0%) | 0 (0.0%) |
| 30 to 34 Years | 0 (0.0%) | 0 (0.0%) |
| 35 to 39 Years | 3 (16.7%) | 0 (0.0%) |
| 40 to 44 Years | 0 (0.0%) | 3 (33.3%) |
| 45 to 49 Years | 0 (0.0%) | 0 (0.0%) |
| 50 to 54 Years | 1 (5.6%) | 1 (11.1%) |
| 55 to 59 Years | 0 (0.0%) | 0 (0.0%) |
| 60 to 64 Years | 0 (0.0%) | 0 (0.0%) |
| 65 to 69 Years | 0 (0.0%) | 0 (0.0%) |
| 70 to 74 Years | 5 (27.8%) | 0 (0.0%) |
| 75 to 79 Years | 0 (0.0%) | 0 (0.0%) |
| 80 to 84 Years | 0 (0.0%) | 0 (0.0%) |
| 85 Years and over | 0 (0.0%) | 0 (0.0%) |
| Total | 18 (100.0%) | 9 (100.0%) |
Families and Households in Karluk
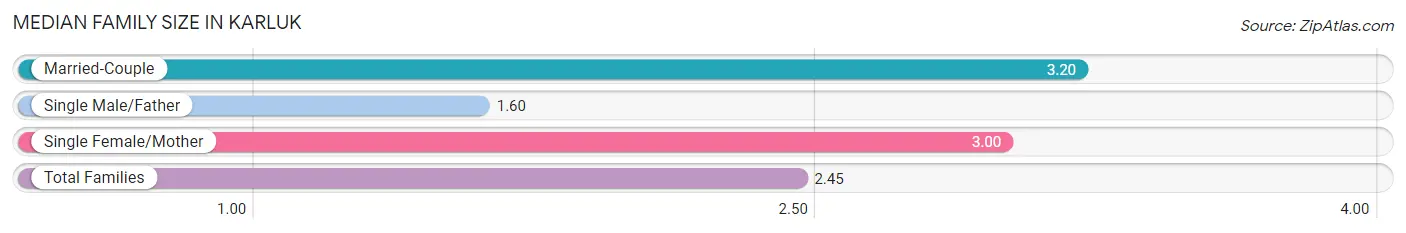
Median Family Size in Karluk
The median family size in Karluk is 2.45 persons per family, with married-couple families (5 | 45.5%) accounting for the largest median family size of 3.2 persons per family. On the other hand, single male/father families (5 | 45.5%) represent the smallest median family size with 1.60 persons per family.
| Family Type | # Families | Family Size |
| Married-Couple | 5 (45.5%) | 3.20 |
| Single Male/Father | 5 (45.5%) | 1.60 |
| Single Female/Mother | 1 (9.1%) | 3.00 |
| Total Families | 11 (100.0%) | 2.45 |
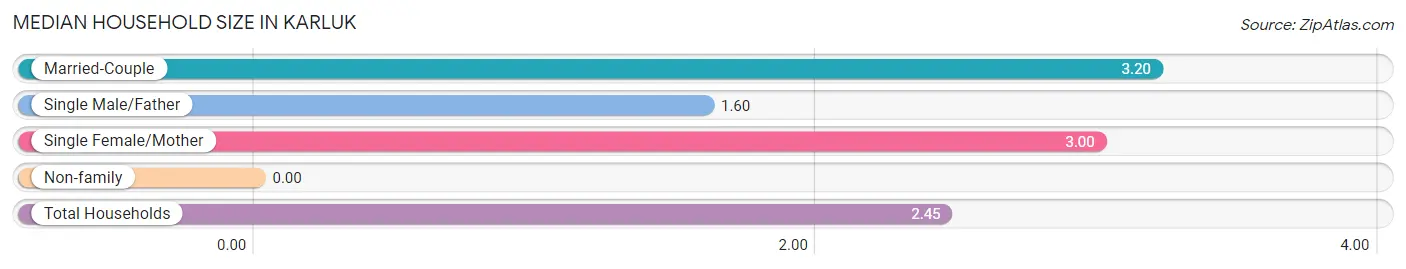
Median Household Size in Karluk
| Household Type | # Households | Household Size |
| Married-Couple | 5 (45.5%) | 3.20 |
| Single Male/Father | 5 (45.5%) | 1.60 |
| Single Female/Mother | 1 (9.1%) | 3.00 |
| Non-family | 0 (0.0%) | - |
| Total Households | 11 (100.0%) | 2.45 |
Household Size by Marriage Status in Karluk
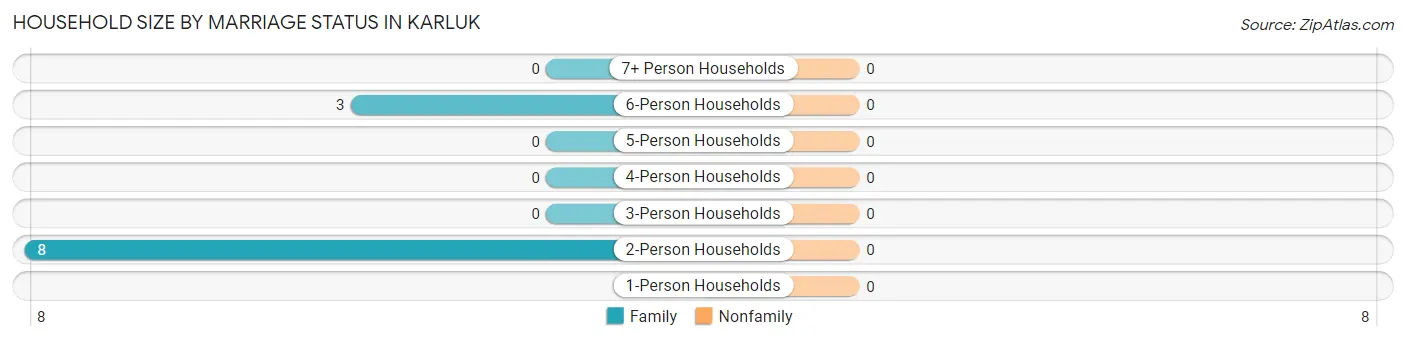
| Household Size | Family Households | Nonfamily Households |
| 1-Person Households | - | 0 (0.0%) |
| 2-Person Households | 8 (72.7%) | 0 (0.0%) |
| 3-Person Households | 0 (0.0%) | 0 (0.0%) |
| 4-Person Households | 0 (0.0%) | 0 (0.0%) |
| 5-Person Households | 0 (0.0%) | 0 (0.0%) |
| 6-Person Households | 3 (27.3%) | 0 (0.0%) |
| 7+ Person Households | 0 (0.0%) | 0 (0.0%) |
| Total | 11 (100.0%) | 0 (0.0%) |
Female Fertility in Karluk
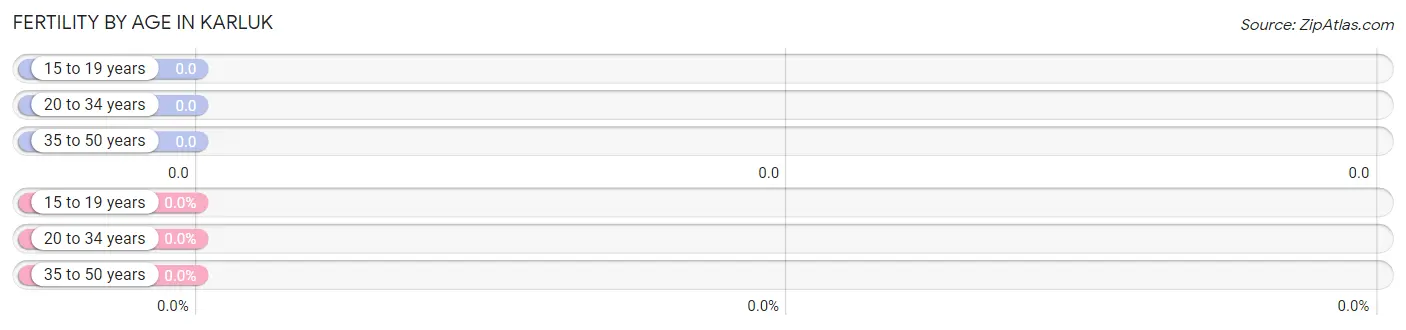
Fertility by Age in Karluk
| Age Bracket | Women with Births | Births / 1,000 Women |
| 15 to 19 years | 0 (0.0%) | 0.0 |
| 20 to 34 years | 0 (0.0%) | 0.0 |
| 35 to 50 years | 0 (0.0%) | 0.0 |
| Total | 0 (0.0%) | 0.0 |
Fertility by Age by Marriage Status in Karluk
| Age Bracket | Married | Unmarried |
| 15 to 19 years | 0 (0.0%) | 0 (0.0%) |
| 20 to 34 years | 0 (0.0%) | 0 (0.0%) |
| 35 to 50 years | 0 (0.0%) | 0 (0.0%) |
| Total | 0 (0.0%) | 0 (0.0%) |
Fertility by Education in Karluk
| Educational Attainment | Women with Births | Births / 1,000 Women |
| Less than High School | 0 (0.0%) | 0.0 |
| High School Diploma | 0 (0.0%) | 0.0 |
| College or Associate's Degree | 0 (0.0%) | 0.0 |
| Bachelor's Degree | 0 (0.0%) | 0.0 |
| Graduate Degree | 0 (0.0%) | 0.0 |
| Total | 0 (0.0%) | 0.0 |
Fertility by Education by Marriage Status in Karluk
| Educational Attainment | Married | Unmarried |
| Less than High School | 0 (0.0%) | 0 (0.0%) |
| High School Diploma | 0 (0.0%) | 0 (0.0%) |
| College or Associate's Degree | 0 (0.0%) | 0 (0.0%) |
| Bachelor's Degree | 0 (0.0%) | 0 (0.0%) |
| Graduate Degree | 0 (0.0%) | 0 (0.0%) |
| Total | 0 (0.0%) | 0 (0.0%) |
Employment Characteristics in Karluk
Employment by Class of Employer in Karluk
Among the 16 employed individuals in Karluk, local government employees (15 | 93.8%), and state government employees (1 | 6.2%) make up the most common classes of employment.
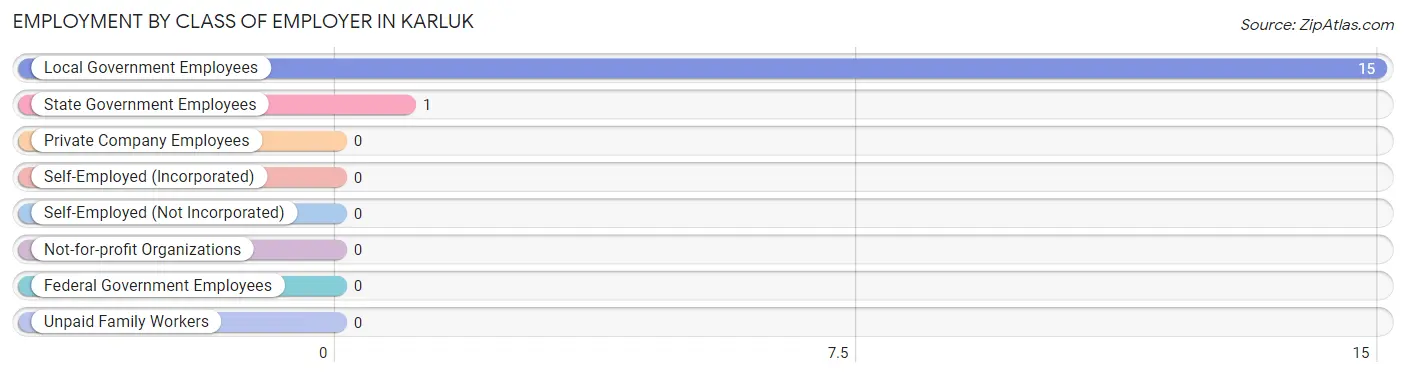
| Employer Class | # Employees | % Employees |
| Private Company Employees | 0 | 0.0% |
| Self-Employed (Incorporated) | 0 | 0.0% |
| Self-Employed (Not Incorporated) | 0 | 0.0% |
| Not-for-profit Organizations | 0 | 0.0% |
| Local Government Employees | 15 | 93.8% |
| State Government Employees | 1 | 6.2% |
| Federal Government Employees | 0 | 0.0% |
| Unpaid Family Workers | 0 | 0.0% |
| Total | 16 | 100.0% |
Employment Status by Age in Karluk
According to the labor force statistics for Karluk, out of the total population over 16 years of age (27), 70.4% or 19 individuals are in the labor force, with 15.8% or 3 of them unemployed. The age group with the highest labor force participation rate is 16 to 19 years, with 100.0% or 2 individuals in the labor force. Within the labor force, the 20 to 24 years age range has the highest percentage of unemployed individuals, with 25.0% or 3 of them being unemployed.
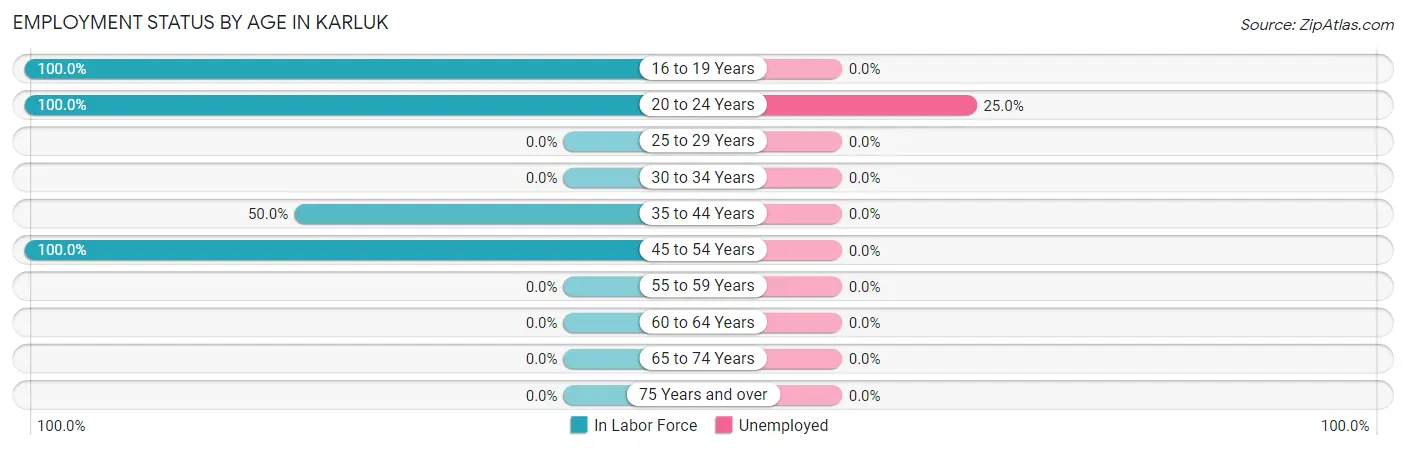
| Age Bracket | In Labor Force | Unemployed |
| 16 to 19 Years | 2 (100.0%) | 0 (0.0%) |
| 20 to 24 Years | 12 (100.0%) | 3 (25.0%) |
| 25 to 29 Years | 0 (0.0%) | 0 (0.0%) |
| 30 to 34 Years | 0 (0.0%) | 0 (0.0%) |
| 35 to 44 Years | 3 (50.0%) | 0 (0.0%) |
| 45 to 54 Years | 2 (100.0%) | 0 (0.0%) |
| 55 to 59 Years | 0 (0.0%) | 0 (0.0%) |
| 60 to 64 Years | 0 (0.0%) | 0 (0.0%) |
| 65 to 74 Years | 0 (0.0%) | 0 (0.0%) |
| 75 Years and over | 0 (0.0%) | 0 (0.0%) |
| Total | 19 (70.4%) | 3 (15.8%) |
Employment Status by Educational Attainment in Karluk
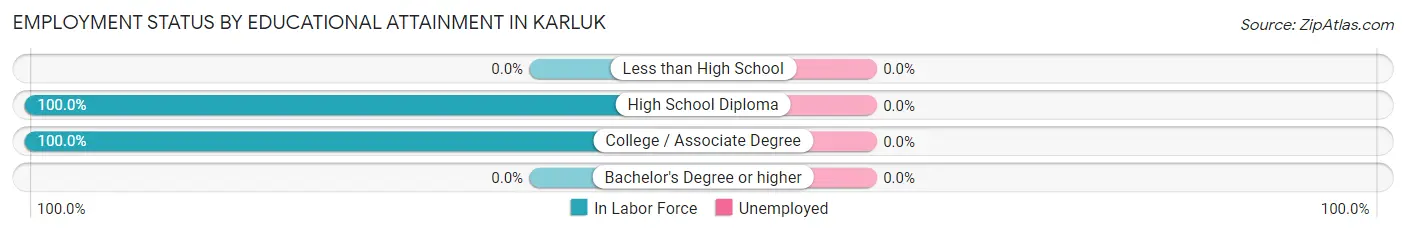
| Educational Attainment | In Labor Force | Unemployed |
| Less than High School | 0 (0.0%) | 0 (0.0%) |
| High School Diploma | 1 (100.0%) | 0 (0.0%) |
| College / Associate Degree | 4 (100.0%) | 0 (0.0%) |
| Bachelor's Degree or higher | 0 (0.0%) | 0 (0.0%) |
| Total | 5 (62.5%) | 0 (0.0%) |
Employment Occupations by Sex in Karluk
Management, Business, Science and Arts Occupations
The most common Management, Business, Science and Arts occupations in Karluk are , and Management (1 | 6.2%).
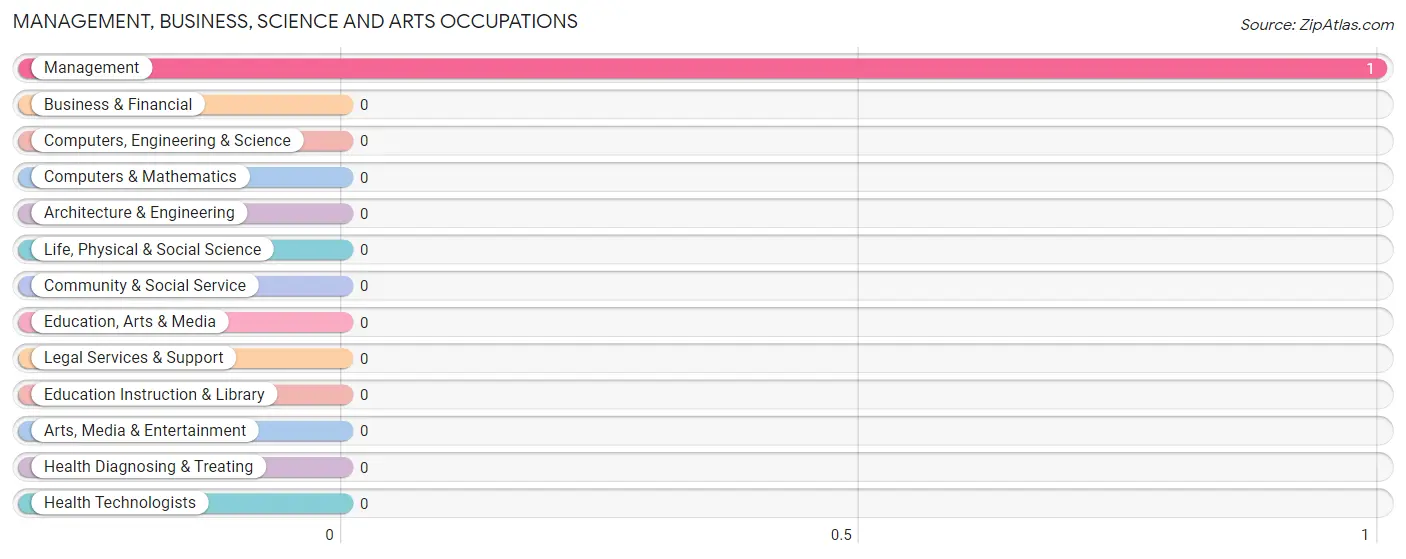
Management, Business, Science and Arts Occupations by Sex
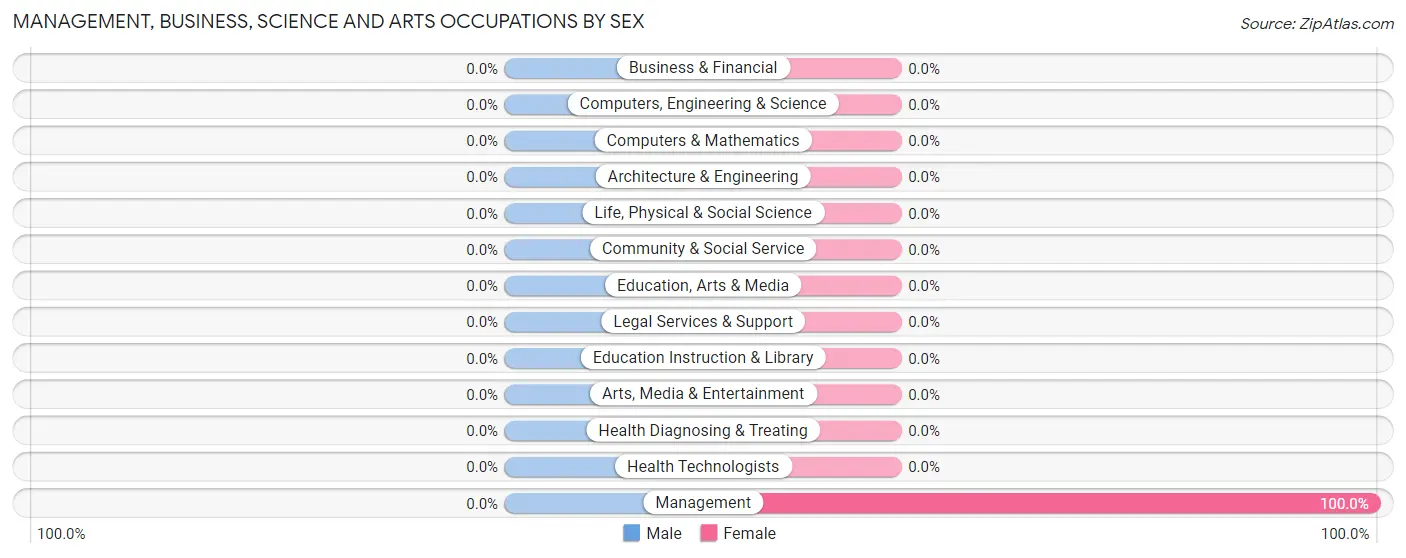
| Occupation | Male | Female |
| Management | 0 (0.0%) | 1 (100.0%) |
| Business & Financial | 0 (0.0%) | 0 (0.0%) |
| Computers, Engineering & Science | 0 (0.0%) | 0 (0.0%) |
| Computers & Mathematics | 0 (0.0%) | 0 (0.0%) |
| Architecture & Engineering | 0 (0.0%) | 0 (0.0%) |
| Life, Physical & Social Science | 0 (0.0%) | 0 (0.0%) |
| Community & Social Service | 0 (0.0%) | 0 (0.0%) |
| Education, Arts & Media | 0 (0.0%) | 0 (0.0%) |
| Legal Services & Support | 0 (0.0%) | 0 (0.0%) |
| Education Instruction & Library | 0 (0.0%) | 0 (0.0%) |
| Arts, Media & Entertainment | 0 (0.0%) | 0 (0.0%) |
| Health Diagnosing & Treating | 0 (0.0%) | 0 (0.0%) |
| Health Technologists | 0 (0.0%) | 0 (0.0%) |
| Total (Category) | 0 (0.0%) | 1 (100.0%) |
| Total (Overall) | 7 (43.8%) | 9 (56.2%) |
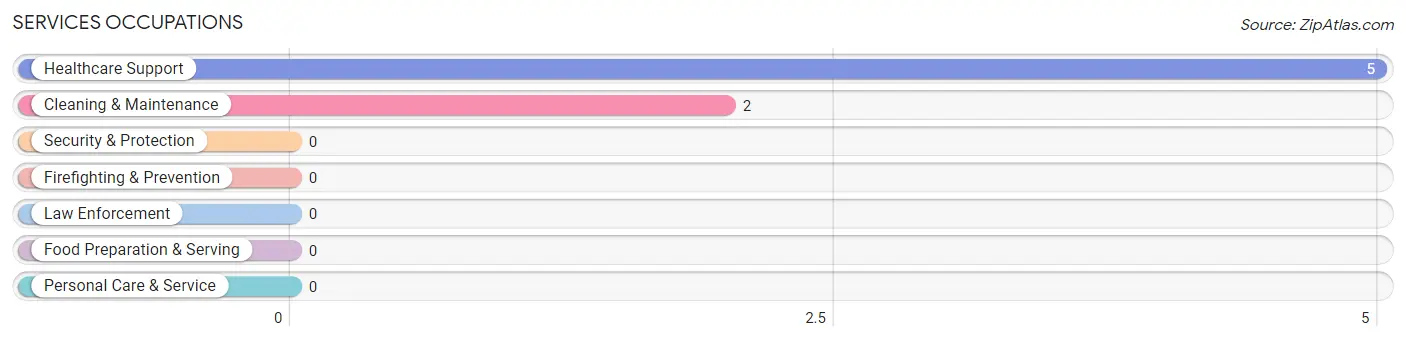
Services Occupations
The most common Services occupations in Karluk are Healthcare Support (5 | 31.2%), and Cleaning & Maintenance (2 | 12.5%).
Services Occupations by Sex
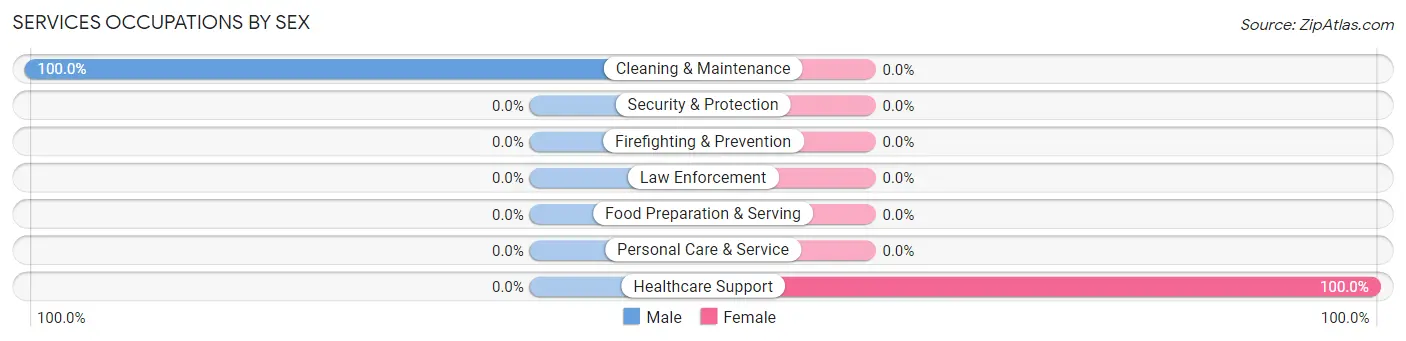
| Occupation | Male | Female |
| Healthcare Support | 0 (0.0%) | 5 (100.0%) |
| Security & Protection | 0 (0.0%) | 0 (0.0%) |
| Firefighting & Prevention | 0 (0.0%) | 0 (0.0%) |
| Law Enforcement | 0 (0.0%) | 0 (0.0%) |
| Food Preparation & Serving | 0 (0.0%) | 0 (0.0%) |
| Cleaning & Maintenance | 2 (100.0%) | 0 (0.0%) |
| Personal Care & Service | 0 (0.0%) | 0 (0.0%) |
| Total (Category) | 2 (28.6%) | 5 (71.4%) |
| Total (Overall) | 7 (43.8%) | 9 (56.2%) |
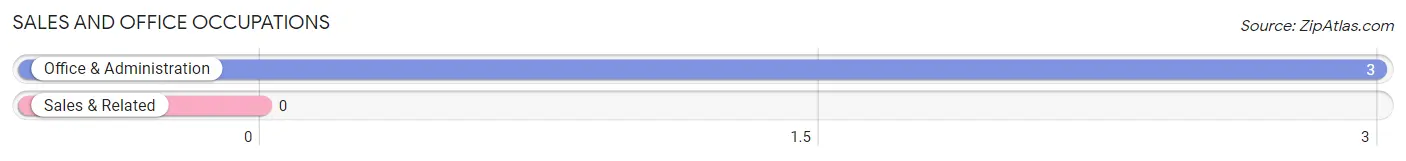
Sales and Office Occupations
The most common Sales and Office occupations in Karluk are , and Office & Administration (3 | 18.8%).
Sales and Office Occupations by Sex
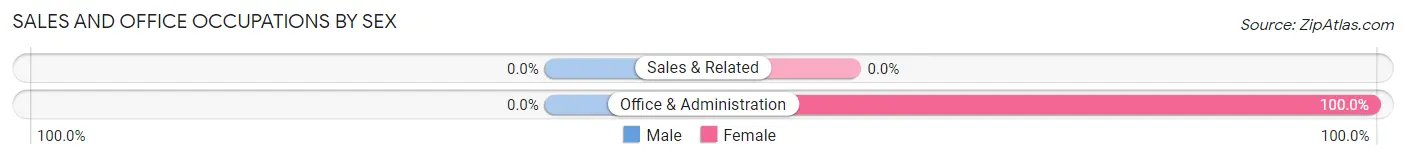
| Occupation | Male | Female |
| Sales & Related | 0 (0.0%) | 0 (0.0%) |
| Office & Administration | 0 (0.0%) | 3 (100.0%) |
| Total (Category) | 0 (0.0%) | 3 (100.0%) |
| Total (Overall) | 7 (43.8%) | 9 (56.2%) |
Natural Resources, Construction and Maintenance Occupations
The most common Natural Resources, Construction and Maintenance occupations in Karluk are , and Construction & Extraction (2 | 12.5%).
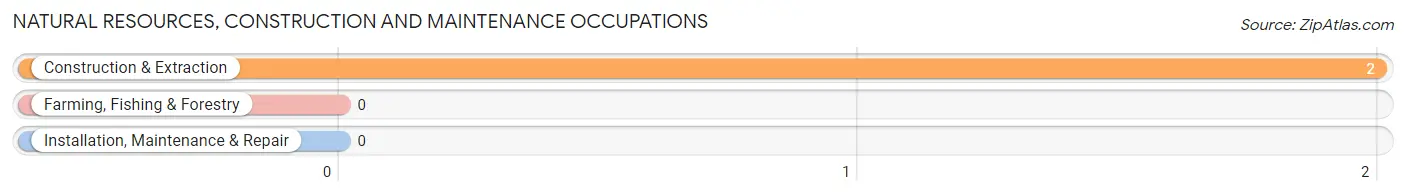
Natural Resources, Construction and Maintenance Occupations by Sex
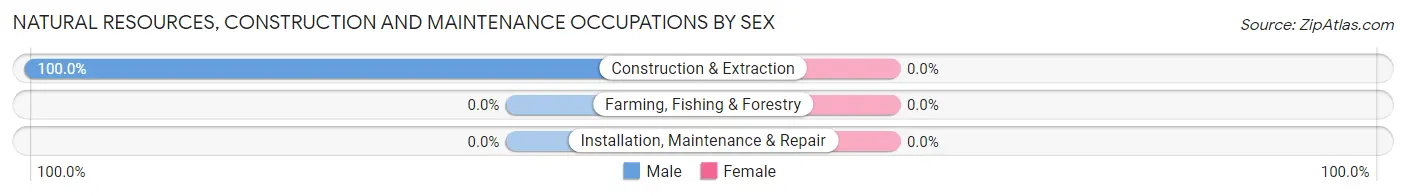
| Occupation | Male | Female |
| Farming, Fishing & Forestry | 0 (0.0%) | 0 (0.0%) |
| Construction & Extraction | 2 (100.0%) | 0 (0.0%) |
| Installation, Maintenance & Repair | 0 (0.0%) | 0 (0.0%) |
| Total (Category) | 2 (100.0%) | 0 (0.0%) |
| Total (Overall) | 7 (43.8%) | 9 (56.2%) |
Production, Transportation and Moving Occupations
The most common Production, Transportation and Moving occupations in Karluk are Material Moving (2 | 12.5%), and Production (1 | 6.2%).
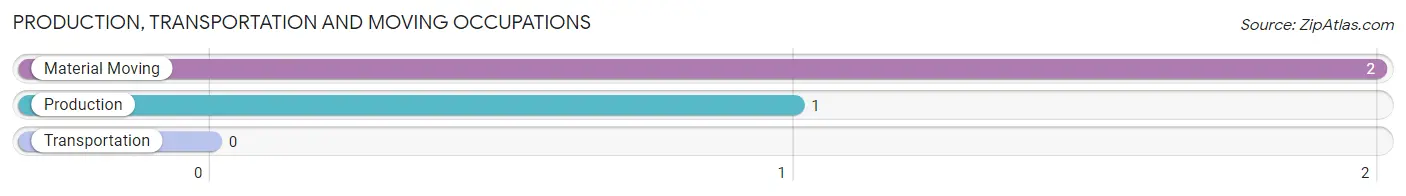
Production, Transportation and Moving Occupations by Sex
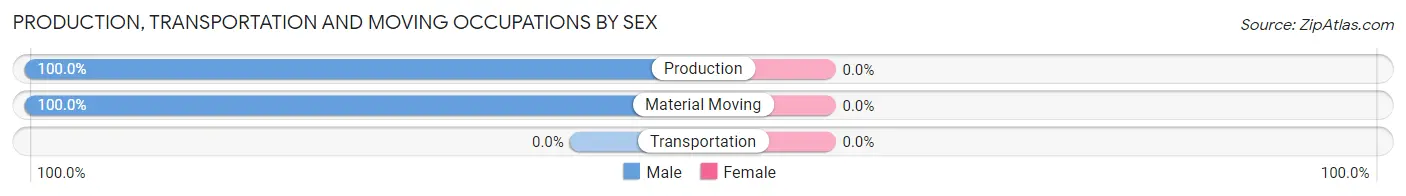
| Occupation | Male | Female |
| Production | 1 (100.0%) | 0 (0.0%) |
| Transportation | 0 (0.0%) | 0 (0.0%) |
| Material Moving | 2 (100.0%) | 0 (0.0%) |
| Total (Category) | 3 (100.0%) | 0 (0.0%) |
| Total (Overall) | 7 (43.8%) | 9 (56.2%) |
Employment Industries by Sex in Karluk
Employment Industries in Karluk
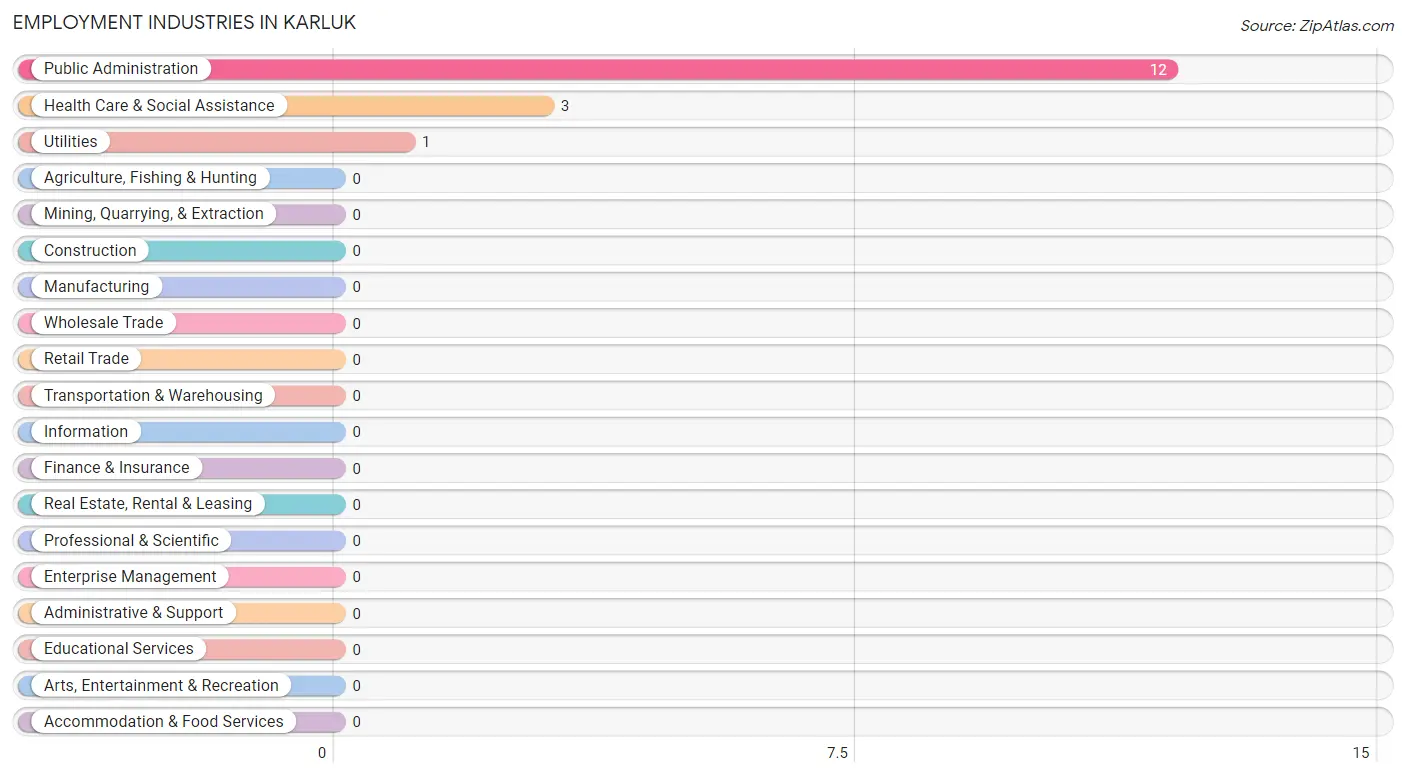
The major employment industries in Karluk include Public Administration (12 | 75.0%), Health Care & Social Assistance (3 | 18.8%), and Utilities (1 | 6.2%).
Employment Industries by Sex in Karluk
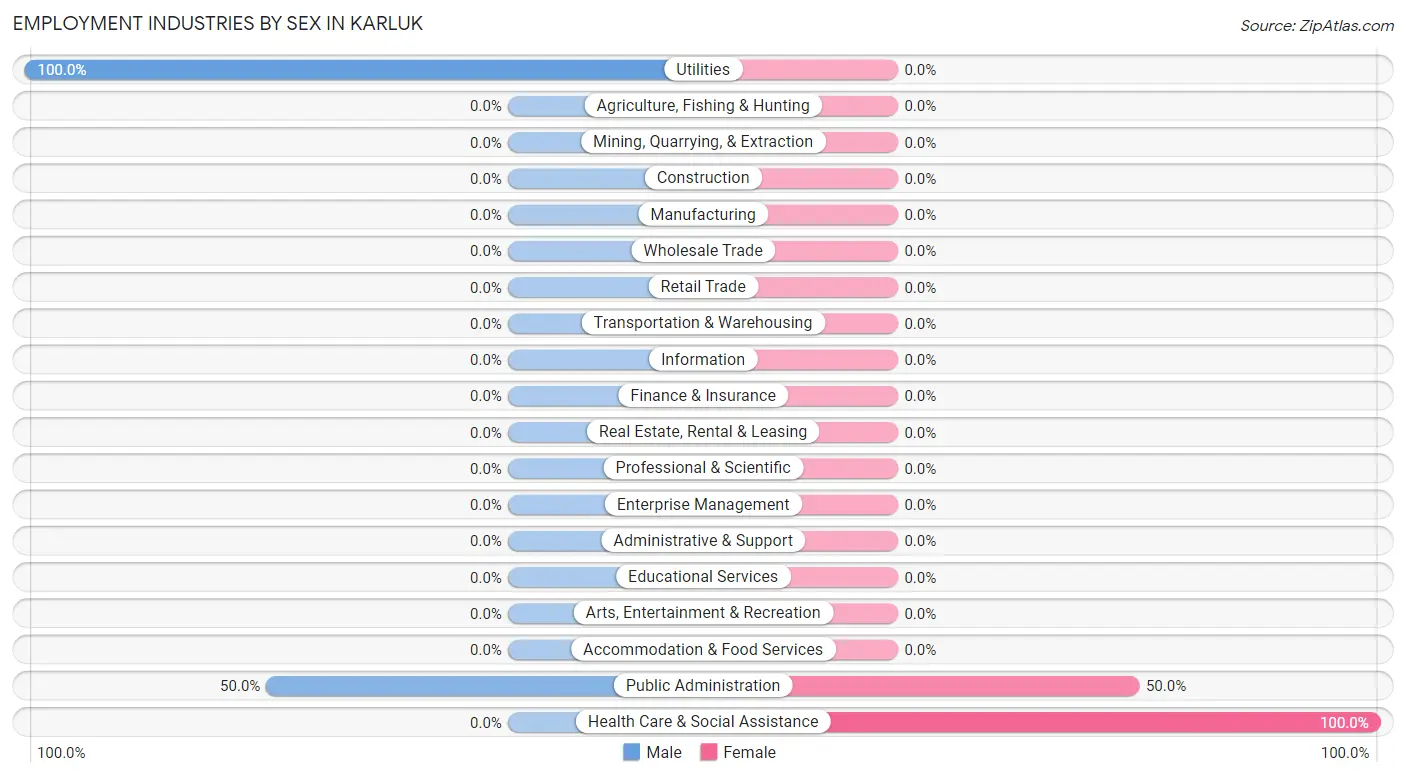
The Karluk industries that see more men than women are Utilities (100.0%), and Public Administration (50.0%), whereas the industries that tend to have a higher number of women are Health Care & Social Assistance (100.0%), and Public Administration (50.0%).
| Industry | Male | Female |
| Agriculture, Fishing & Hunting | 0 (0.0%) | 0 (0.0%) |
| Mining, Quarrying, & Extraction | 0 (0.0%) | 0 (0.0%) |
| Construction | 0 (0.0%) | 0 (0.0%) |
| Manufacturing | 0 (0.0%) | 0 (0.0%) |
| Wholesale Trade | 0 (0.0%) | 0 (0.0%) |
| Retail Trade | 0 (0.0%) | 0 (0.0%) |
| Transportation & Warehousing | 0 (0.0%) | 0 (0.0%) |
| Utilities | 1 (100.0%) | 0 (0.0%) |
| Information | 0 (0.0%) | 0 (0.0%) |
| Finance & Insurance | 0 (0.0%) | 0 (0.0%) |
| Real Estate, Rental & Leasing | 0 (0.0%) | 0 (0.0%) |
| Professional & Scientific | 0 (0.0%) | 0 (0.0%) |
| Enterprise Management | 0 (0.0%) | 0 (0.0%) |
| Administrative & Support | 0 (0.0%) | 0 (0.0%) |
| Educational Services | 0 (0.0%) | 0 (0.0%) |
| Health Care & Social Assistance | 0 (0.0%) | 3 (100.0%) |
| Arts, Entertainment & Recreation | 0 (0.0%) | 0 (0.0%) |
| Accommodation & Food Services | 0 (0.0%) | 0 (0.0%) |
| Public Administration | 6 (50.0%) | 6 (50.0%) |
| Total | 7 (43.8%) | 9 (56.2%) |
Education in Karluk
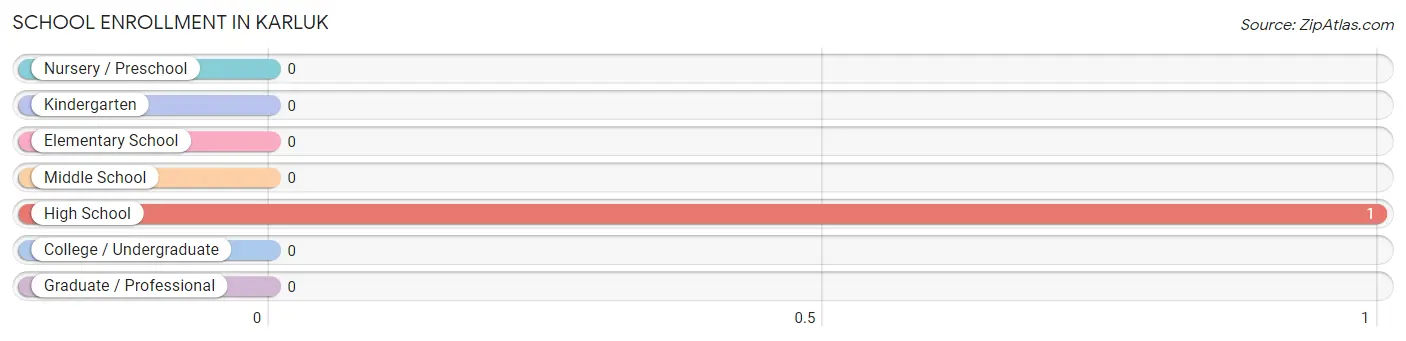
School Enrollment in Karluk
| School Level | # Students | % Students |
| Nursery / Preschool | 0 | 0.0% |
| Kindergarten | 0 | 0.0% |
| Elementary School | 0 | 0.0% |
| Middle School | 0 | 0.0% |
| High School | 1 | 100.0% |
| College / Undergraduate | 0 | 0.0% |
| Graduate / Professional | 0 | 0.0% |
| Total | 1 | 100.0% |
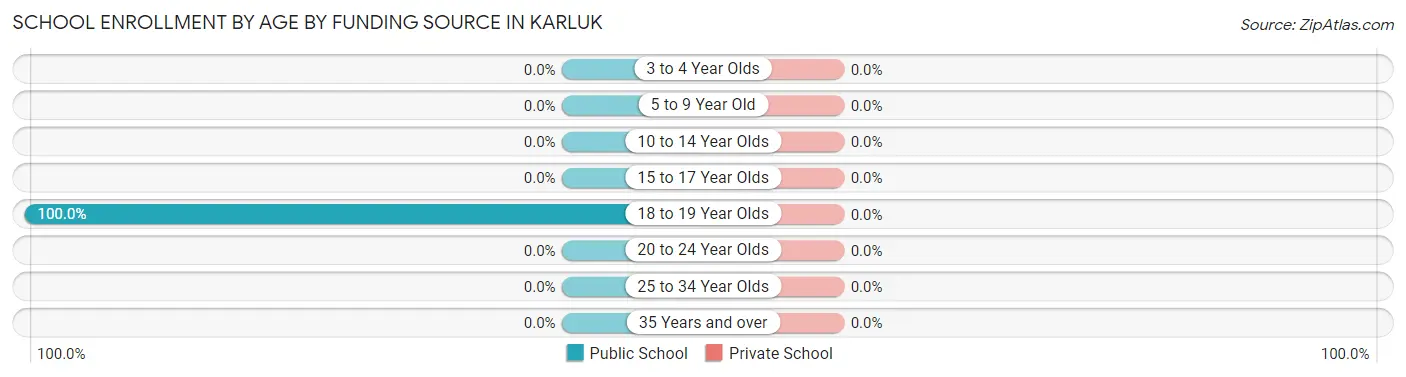
School Enrollment by Age by Funding Source in Karluk
| Age Bracket | Public School | Private School |
| 3 to 4 Year Olds | 0 (0.0%) | 0 (0.0%) |
| 5 to 9 Year Old | 0 (0.0%) | 0 (0.0%) |
| 10 to 14 Year Olds | 0 (0.0%) | 0 (0.0%) |
| 15 to 17 Year Olds | 0 (0.0%) | 0 (0.0%) |
| 18 to 19 Year Olds | 1 (100.0%) | 0 (0.0%) |
| 20 to 24 Year Olds | 0 (0.0%) | 0 (0.0%) |
| 25 to 34 Year Olds | 0 (0.0%) | 0 (0.0%) |
| 35 Years and over | 0 (0.0%) | 0 (0.0%) |
| Total | 1 (100.0%) | 0 (0.0%) |
Educational Attainment by Field of Study in Karluk
, and business (3 | 100.0%) are the most common fields of study among 3 individuals in Karluk who have obtained a bachelor's degree or higher.
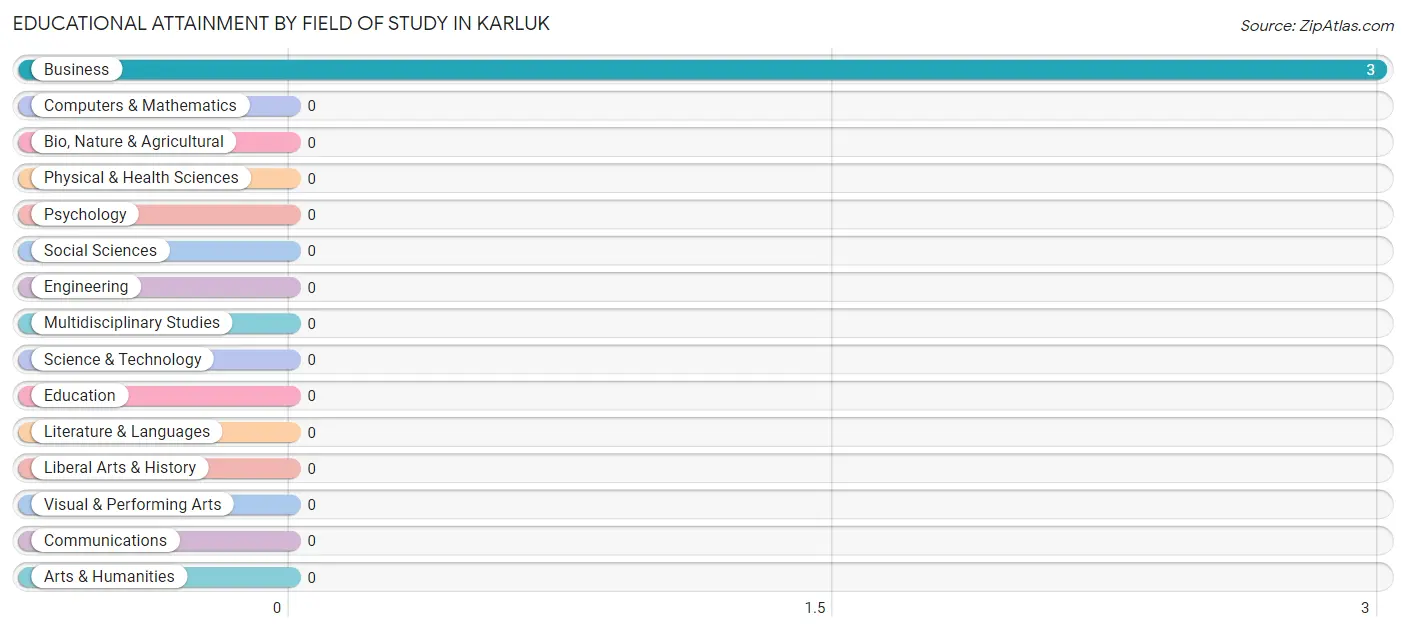
| Field of Study | # Graduates | % Graduates |
| Computers & Mathematics | 0 | 0.0% |
| Bio, Nature & Agricultural | 0 | 0.0% |
| Physical & Health Sciences | 0 | 0.0% |
| Psychology | 0 | 0.0% |
| Social Sciences | 0 | 0.0% |
| Engineering | 0 | 0.0% |
| Multidisciplinary Studies | 0 | 0.0% |
| Science & Technology | 0 | 0.0% |
| Business | 3 | 100.0% |
| Education | 0 | 0.0% |
| Literature & Languages | 0 | 0.0% |
| Liberal Arts & History | 0 | 0.0% |
| Visual & Performing Arts | 0 | 0.0% |
| Communications | 0 | 0.0% |
| Arts & Humanities | 0 | 0.0% |
| Total | 3 | 100.0% |
Transportation & Commute in Karluk
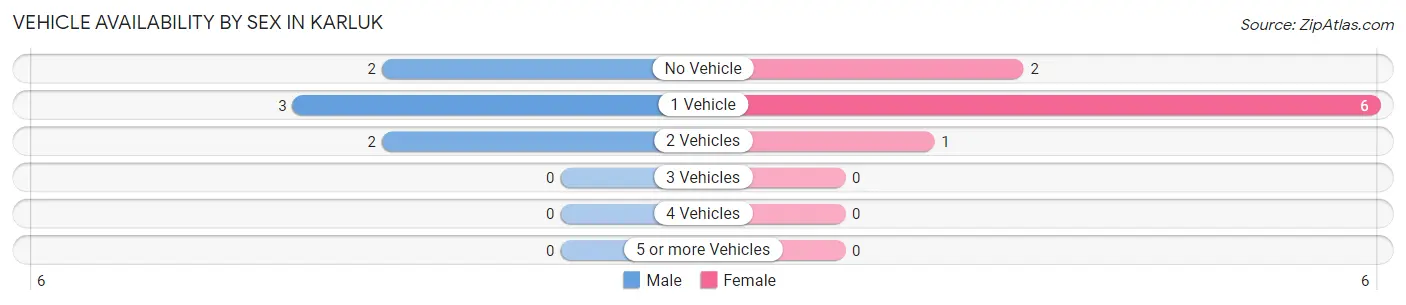
Vehicle Availability by Sex in Karluk
The most prevalent vehicle ownership categories in Karluk are males with 1 vehicle (3, accounting for 42.9%) and females with 1 vehicle (6, making up 33.3%).
| Vehicles Available | Male | Female |
| No Vehicle | 2 (28.6%) | 2 (22.2%) |
| 1 Vehicle | 3 (42.9%) | 6 (66.7%) |
| 2 Vehicles | 2 (28.6%) | 1 (11.1%) |
| 3 Vehicles | 0 (0.0%) | 0 (0.0%) |
| 4 Vehicles | 0 (0.0%) | 0 (0.0%) |
| 5 or more Vehicles | 0 (0.0%) | 0 (0.0%) |
| Total | 7 (100.0%) | 9 (100.0%) |
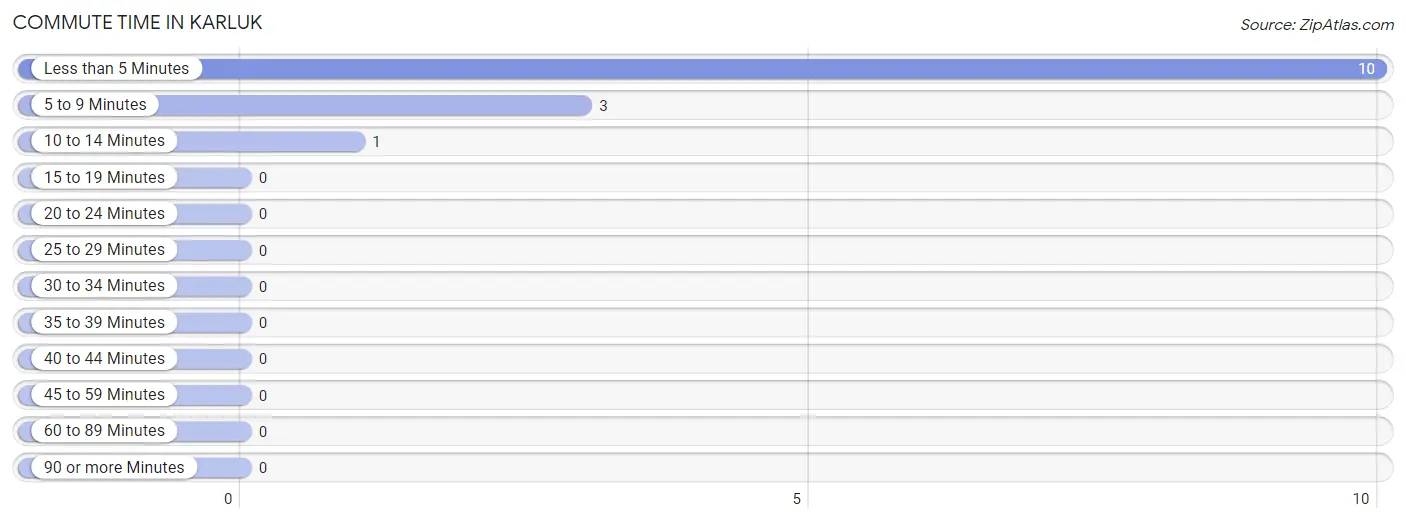
Commute Time in Karluk
The most frequently occuring commute durations in Karluk are less than 5 minutes (10 commuters, 71.4%), 5 to 9 minutes (3 commuters, 21.4%), and 10 to 14 minutes (1 commuters, 7.1%).
| Commute Time | # Commuters | % Commuters |
| Less than 5 Minutes | 10 | 71.4% |
| 5 to 9 Minutes | 3 | 21.4% |
| 10 to 14 Minutes | 1 | 7.1% |
| 15 to 19 Minutes | 0 | 0.0% |
| 20 to 24 Minutes | 0 | 0.0% |
| 25 to 29 Minutes | 0 | 0.0% |
| 30 to 34 Minutes | 0 | 0.0% |
| 35 to 39 Minutes | 0 | 0.0% |
| 40 to 44 Minutes | 0 | 0.0% |
| 45 to 59 Minutes | 0 | 0.0% |
| 60 to 89 Minutes | 0 | 0.0% |
| 90 or more Minutes | 0 | 0.0% |
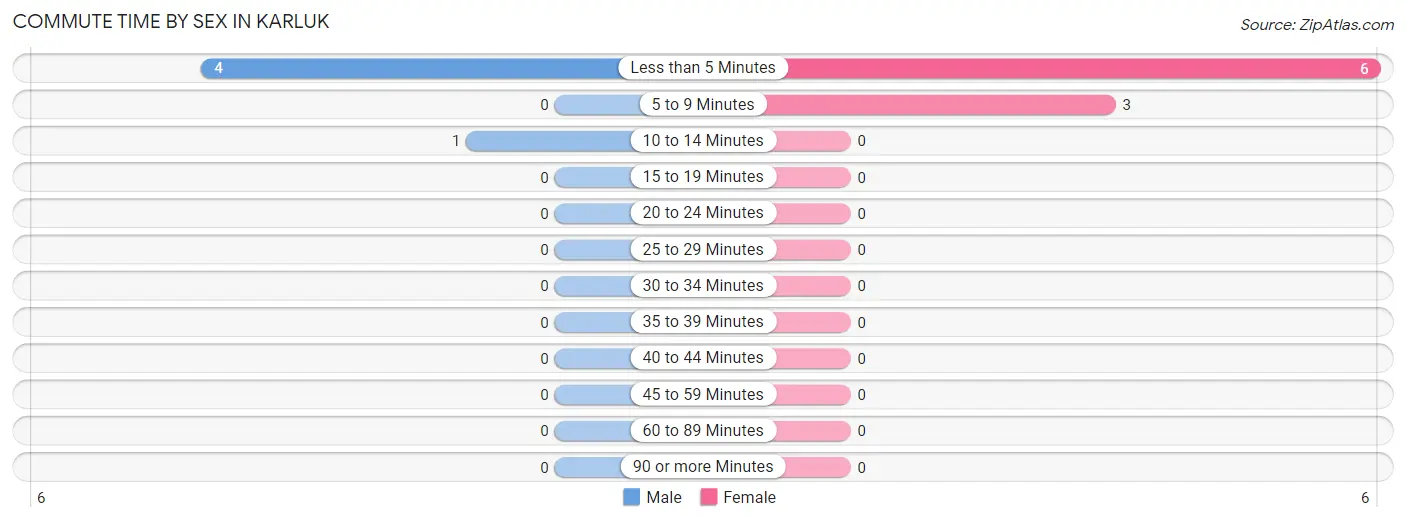
Commute Time by Sex in Karluk
The most common commute times in Karluk are less than 5 minutes (4 commuters, 80.0%) for males and less than 5 minutes (6 commuters, 66.7%) for females.
| Commute Time | Male | Female |
| Less than 5 Minutes | 4 (80.0%) | 6 (66.7%) |
| 5 to 9 Minutes | 0 (0.0%) | 3 (33.3%) |
| 10 to 14 Minutes | 1 (20.0%) | 0 (0.0%) |
| 15 to 19 Minutes | 0 (0.0%) | 0 (0.0%) |
| 20 to 24 Minutes | 0 (0.0%) | 0 (0.0%) |
| 25 to 29 Minutes | 0 (0.0%) | 0 (0.0%) |
| 30 to 34 Minutes | 0 (0.0%) | 0 (0.0%) |
| 35 to 39 Minutes | 0 (0.0%) | 0 (0.0%) |
| 40 to 44 Minutes | 0 (0.0%) | 0 (0.0%) |
| 45 to 59 Minutes | 0 (0.0%) | 0 (0.0%) |
| 60 to 89 Minutes | 0 (0.0%) | 0 (0.0%) |
| 90 or more Minutes | 0 (0.0%) | 0 (0.0%) |
Time of Departure to Work by Sex in Karluk
The most frequent times of departure to work in Karluk are 8:00 AM to 8:29 AM (4, 80.0%) for males and 8:00 AM to 8:29 AM (3, 33.3%) for females.
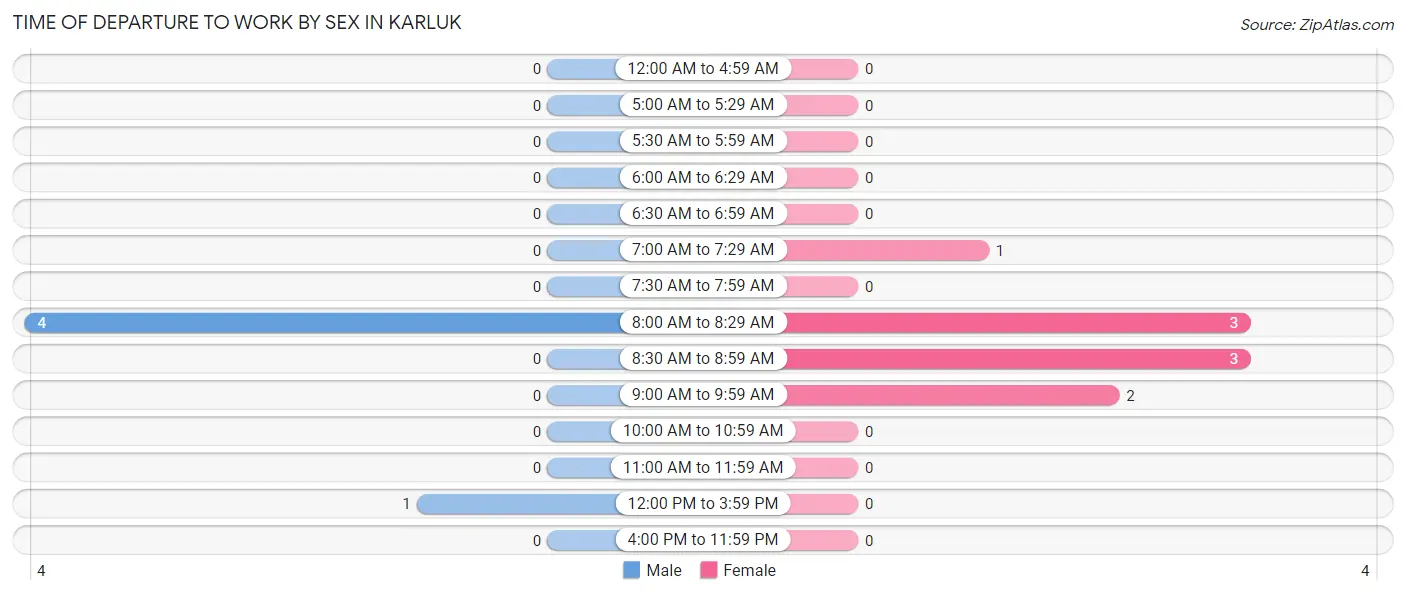
| Time of Departure | Male | Female |
| 12:00 AM to 4:59 AM | 0 (0.0%) | 0 (0.0%) |
| 5:00 AM to 5:29 AM | 0 (0.0%) | 0 (0.0%) |
| 5:30 AM to 5:59 AM | 0 (0.0%) | 0 (0.0%) |
| 6:00 AM to 6:29 AM | 0 (0.0%) | 0 (0.0%) |
| 6:30 AM to 6:59 AM | 0 (0.0%) | 0 (0.0%) |
| 7:00 AM to 7:29 AM | 0 (0.0%) | 1 (11.1%) |
| 7:30 AM to 7:59 AM | 0 (0.0%) | 0 (0.0%) |
| 8:00 AM to 8:29 AM | 4 (80.0%) | 3 (33.3%) |
| 8:30 AM to 8:59 AM | 0 (0.0%) | 3 (33.3%) |
| 9:00 AM to 9:59 AM | 0 (0.0%) | 2 (22.2%) |
| 10:00 AM to 10:59 AM | 0 (0.0%) | 0 (0.0%) |
| 11:00 AM to 11:59 AM | 0 (0.0%) | 0 (0.0%) |
| 12:00 PM to 3:59 PM | 1 (20.0%) | 0 (0.0%) |
| 4:00 PM to 11:59 PM | 0 (0.0%) | 0 (0.0%) |
| Total | 5 (100.0%) | 9 (100.0%) |
Housing Occupancy in Karluk
Occupancy by Ownership in Karluk
Of the total 11 dwellings in Karluk, owner-occupied units account for 11 (100.0%), while renter-occupied units make up 0 (0.0%).
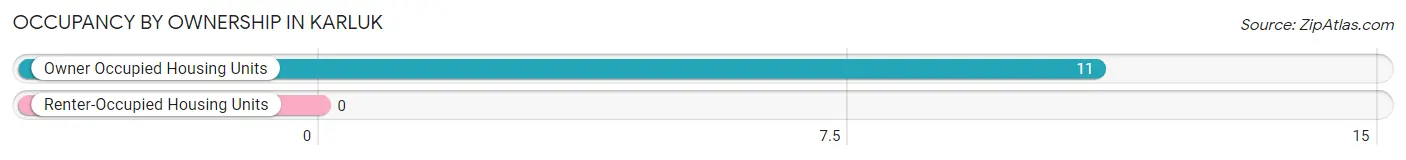
| Occupancy | # Housing Units | % Housing Units |
| Owner Occupied Housing Units | 11 | 100.0% |
| Renter-Occupied Housing Units | 0 | 0.0% |
| Total Occupied Housing Units | 11 | 100.0% |
Occupancy by Household Size in Karluk
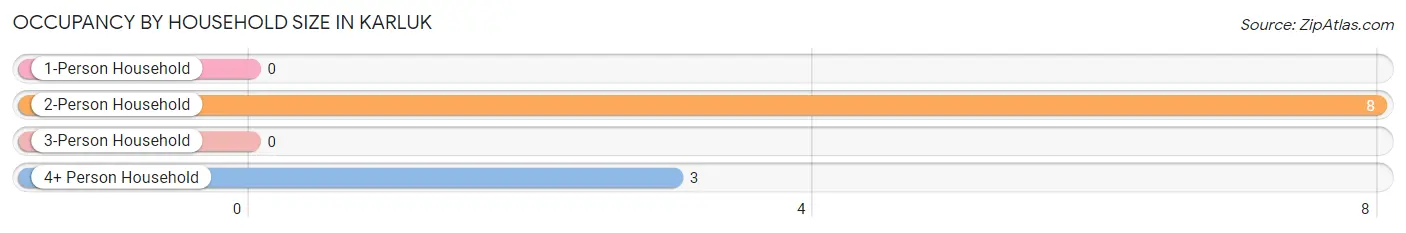
| Household Size | # Housing Units | % Housing Units |
| 1-Person Household | 0 | 0.0% |
| 2-Person Household | 8 | 72.7% |
| 3-Person Household | 0 | 0.0% |
| 4+ Person Household | 3 | 27.3% |
| Total Housing Units | 11 | 100.0% |
Occupancy by Ownership by Household Size in Karluk
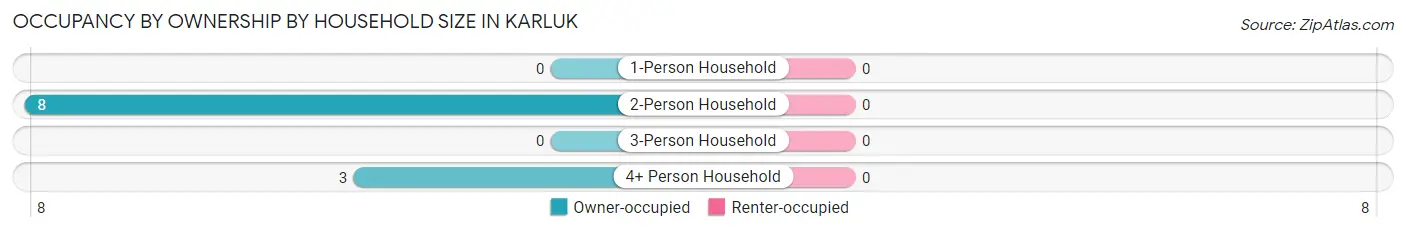
| Household Size | Owner-occupied | Renter-occupied |
| 1-Person Household | 0 (0.0%) | 0 (0.0%) |
| 2-Person Household | 8 (100.0%) | 0 (0.0%) |
| 3-Person Household | 0 (0.0%) | 0 (0.0%) |
| 4+ Person Household | 3 (100.0%) | 0 (0.0%) |
| Total Housing Units | 11 (100.0%) | 0 (0.0%) |
Occupancy by Educational Attainment in Karluk
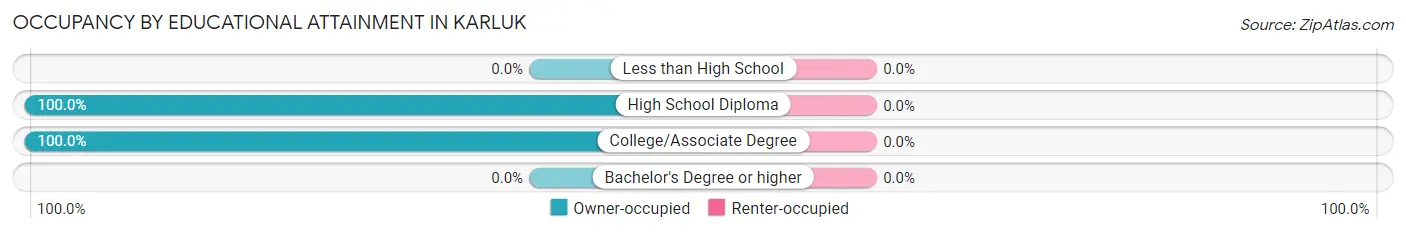
| Household Size | Owner-occupied | Renter-occupied |
| Less than High School | 0 (0.0%) | 0 (0.0%) |
| High School Diploma | 5 (100.0%) | 0 (0.0%) |
| College/Associate Degree | 6 (100.0%) | 0 (0.0%) |
| Bachelor's Degree or higher | 0 (0.0%) | 0 (0.0%) |
Occupancy by Age of Householder in Karluk
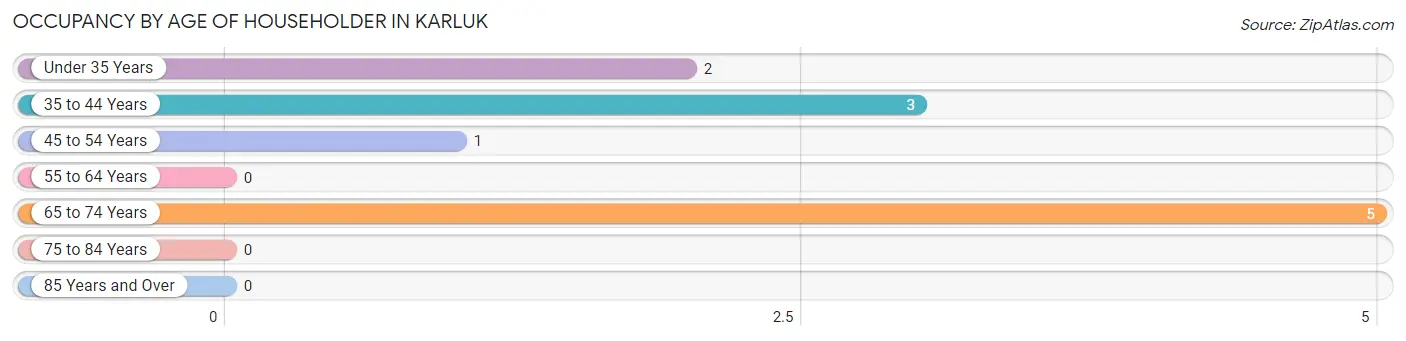
| Age Bracket | # Households | % Households |
| Under 35 Years | 2 | 18.2% |
| 35 to 44 Years | 3 | 27.3% |
| 45 to 54 Years | 1 | 9.1% |
| 55 to 64 Years | 0 | 0.0% |
| 65 to 74 Years | 5 | 45.5% |
| 75 to 84 Years | 0 | 0.0% |
| 85 Years and Over | 0 | 0.0% |
| Total | 11 | 100.0% |
Housing Finances in Karluk
Median Income by Occupancy in Karluk
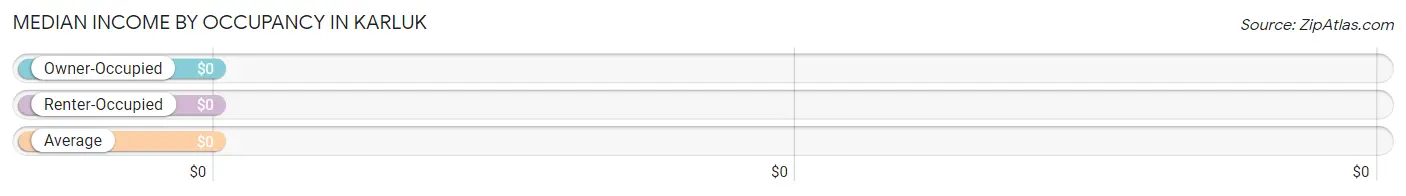
| Occupancy Type | # Households | Median Income |
| Owner-Occupied | 11 (100.0%) | $0 |
| Renter-Occupied | 0 (0.0%) | $0 |
| Average | 11 (100.0%) | $0 |
Occupancy by Householder Income Bracket in Karluk
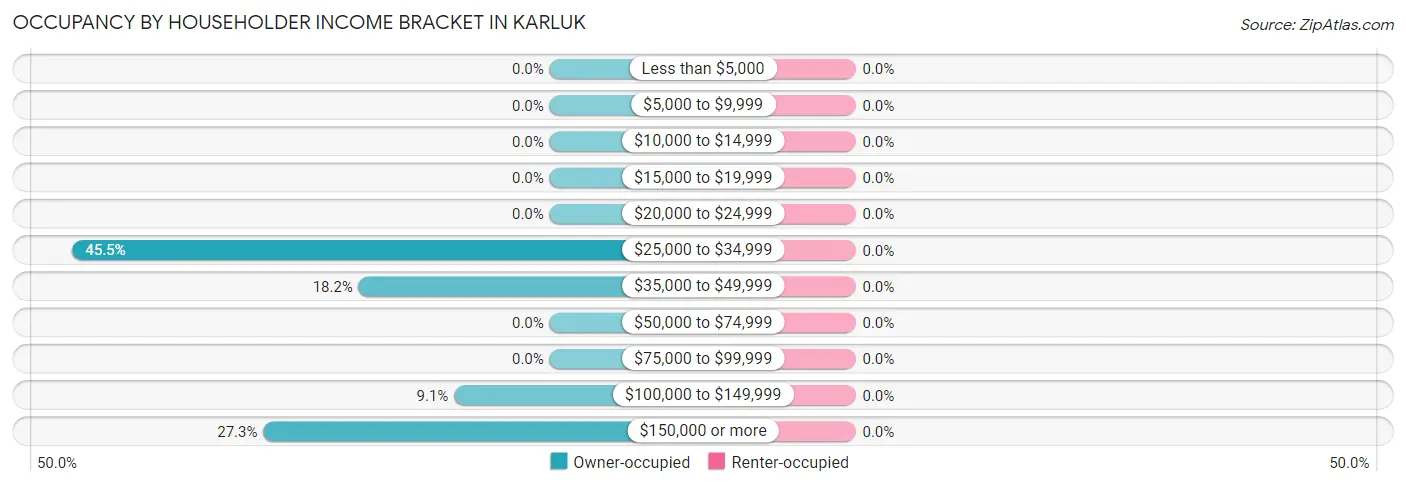
| Income Bracket | Owner-occupied | Renter-occupied |
| Less than $5,000 | 0 (0.0%) | 0 (0.0%) |
| $5,000 to $9,999 | 0 (0.0%) | 0 (0.0%) |
| $10,000 to $14,999 | 0 (0.0%) | 0 (0.0%) |
| $15,000 to $19,999 | 0 (0.0%) | 0 (0.0%) |
| $20,000 to $24,999 | 0 (0.0%) | 0 (0.0%) |
| $25,000 to $34,999 | 5 (45.5%) | 0 (0.0%) |
| $35,000 to $49,999 | 2 (18.2%) | 0 (0.0%) |
| $50,000 to $74,999 | 0 (0.0%) | 0 (0.0%) |
| $75,000 to $99,999 | 0 (0.0%) | 0 (0.0%) |
| $100,000 to $149,999 | 1 (9.1%) | 0 (0.0%) |
| $150,000 or more | 3 (27.3%) | 0 (0.0%) |
| Total | 11 (100.0%) | 0 (0.0%) |
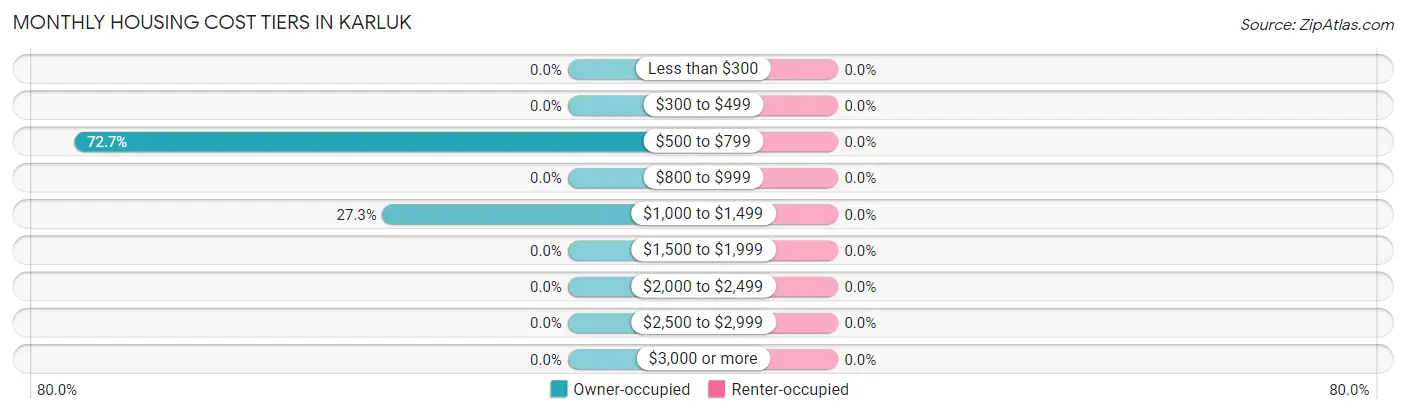
Monthly Housing Cost Tiers in Karluk
| Monthly Cost | Owner-occupied | Renter-occupied |
| Less than $300 | 0 (0.0%) | 0 (0.0%) |
| $300 to $499 | 0 (0.0%) | 0 (0.0%) |
| $500 to $799 | 8 (72.7%) | 0 (0.0%) |
| $800 to $999 | 0 (0.0%) | 0 (0.0%) |
| $1,000 to $1,499 | 3 (27.3%) | 0 (0.0%) |
| $1,500 to $1,999 | 0 (0.0%) | 0 (0.0%) |
| $2,000 to $2,499 | 0 (0.0%) | 0 (0.0%) |
| $2,500 to $2,999 | 0 (0.0%) | 0 (0.0%) |
| $3,000 or more | 0 (0.0%) | 0 (0.0%) |
| Total | 11 (100.0%) | 0 (0.0%) |
Physical Housing Characteristics in Karluk
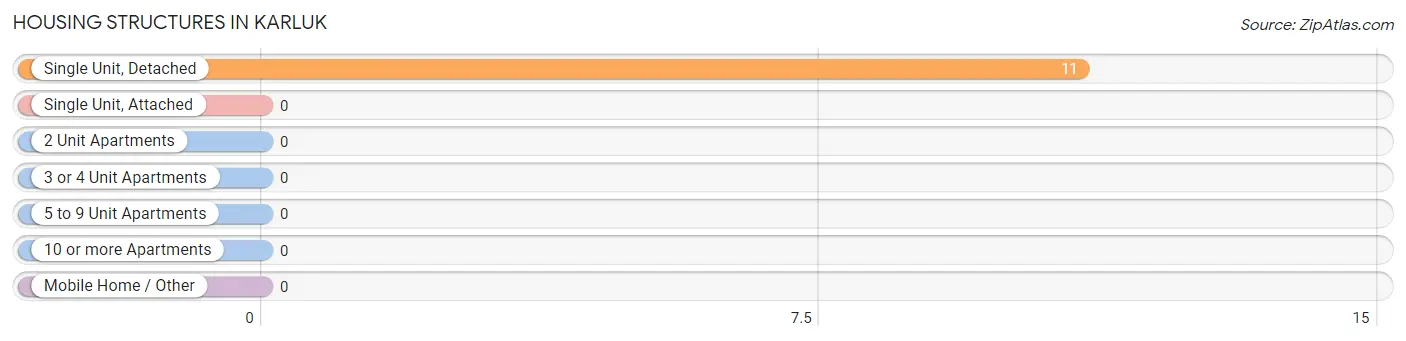
Housing Structures in Karluk
| Structure Type | # Housing Units | % Housing Units |
| Single Unit, Detached | 11 | 100.0% |
| Single Unit, Attached | 0 | 0.0% |
| 2 Unit Apartments | 0 | 0.0% |
| 3 or 4 Unit Apartments | 0 | 0.0% |
| 5 to 9 Unit Apartments | 0 | 0.0% |
| 10 or more Apartments | 0 | 0.0% |
| Mobile Home / Other | 0 | 0.0% |
| Total | 11 | 100.0% |
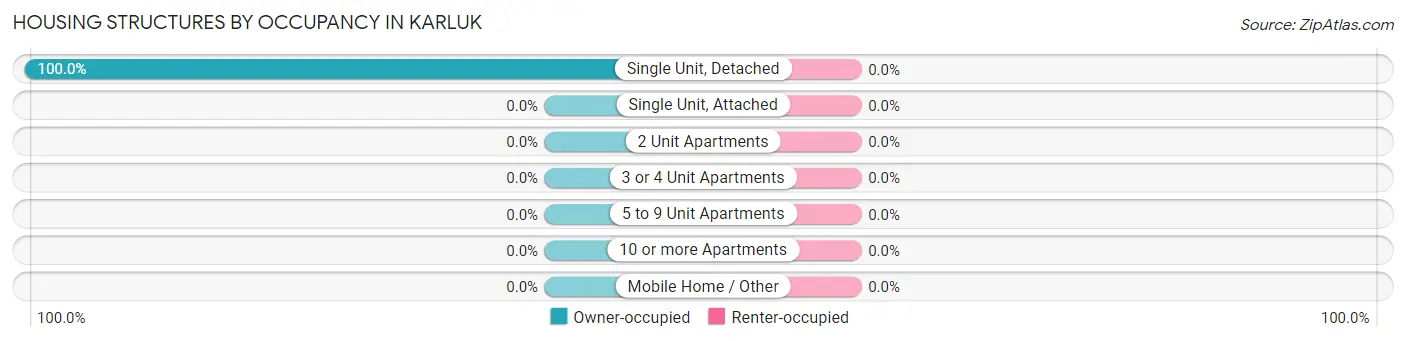
Housing Structures by Occupancy in Karluk
| Structure Type | Owner-occupied | Renter-occupied |
| Single Unit, Detached | 11 (100.0%) | 0 (0.0%) |
| Single Unit, Attached | 0 (0.0%) | 0 (0.0%) |
| 2 Unit Apartments | 0 (0.0%) | 0 (0.0%) |
| 3 or 4 Unit Apartments | 0 (0.0%) | 0 (0.0%) |
| 5 to 9 Unit Apartments | 0 (0.0%) | 0 (0.0%) |
| 10 or more Apartments | 0 (0.0%) | 0 (0.0%) |
| Mobile Home / Other | 0 (0.0%) | 0 (0.0%) |
| Total | 11 (100.0%) | 0 (0.0%) |
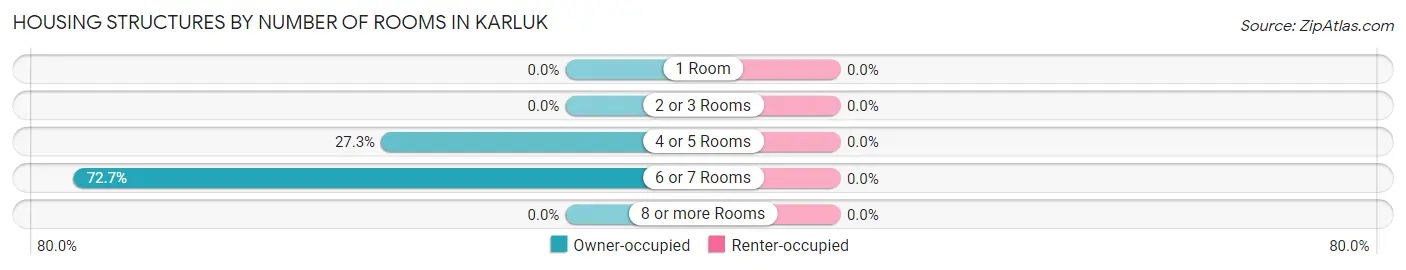
Housing Structures by Number of Rooms in Karluk
| Number of Rooms | Owner-occupied | Renter-occupied |
| 1 Room | 0 (0.0%) | 0 (0.0%) |
| 2 or 3 Rooms | 0 (0.0%) | 0 (0.0%) |
| 4 or 5 Rooms | 3 (27.3%) | 0 (0.0%) |
| 6 or 7 Rooms | 8 (72.7%) | 0 (0.0%) |
| 8 or more Rooms | 0 (0.0%) | 0 (0.0%) |
| Total | 11 (100.0%) | 0 (0.0%) |
Housing Structure by Heating Type in Karluk
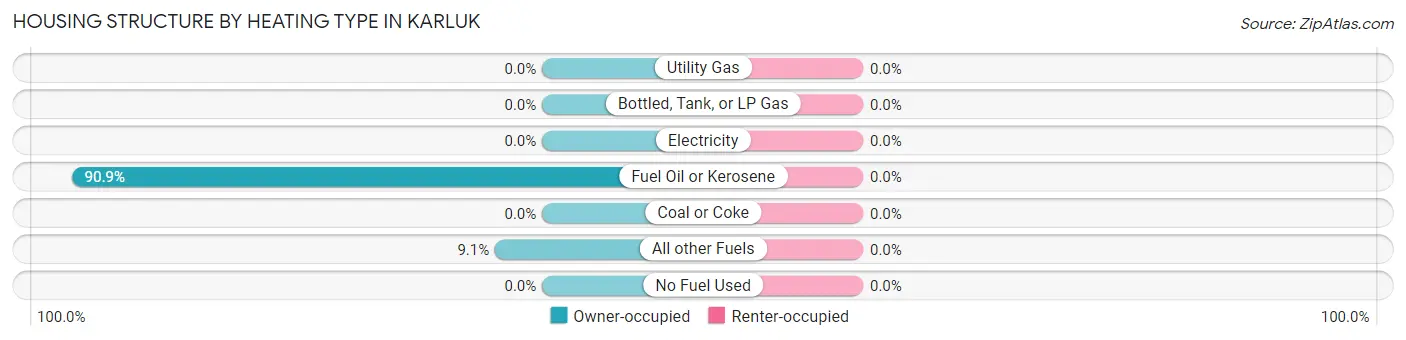
| Heating Type | Owner-occupied | Renter-occupied |
| Utility Gas | 0 (0.0%) | 0 (0.0%) |
| Bottled, Tank, or LP Gas | 0 (0.0%) | 0 (0.0%) |
| Electricity | 0 (0.0%) | 0 (0.0%) |
| Fuel Oil or Kerosene | 10 (90.9%) | 0 (0.0%) |
| Coal or Coke | 0 (0.0%) | 0 (0.0%) |
| All other Fuels | 1 (9.1%) | 0 (0.0%) |
| No Fuel Used | 0 (0.0%) | 0 (0.0%) |
| Total | 11 (100.0%) | 0 (0.0%) |
Household Vehicle Usage in Karluk
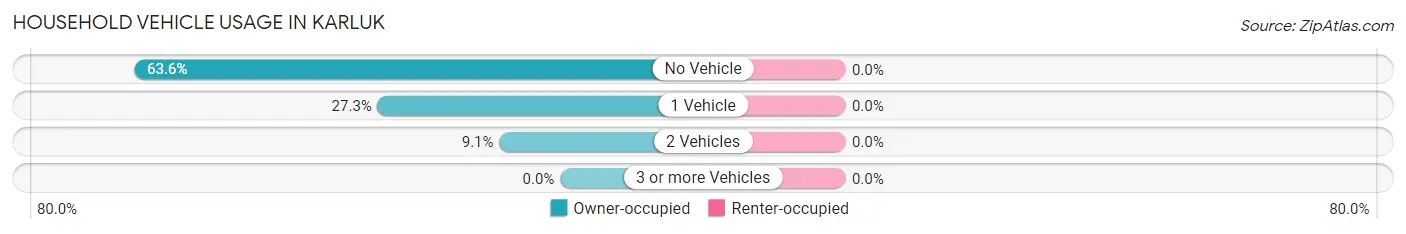
| Vehicles per Household | Owner-occupied | Renter-occupied |
| No Vehicle | 7 (63.6%) | 0 (0.0%) |
| 1 Vehicle | 3 (27.3%) | 0 (0.0%) |
| 2 Vehicles | 1 (9.1%) | 0 (0.0%) |
| 3 or more Vehicles | 0 (0.0%) | 0 (0.0%) |
| Total | 11 (100.0%) | 0 (0.0%) |
Real Estate & Mortgages in Karluk
Real Estate and Mortgage Overview in Karluk
| Characteristic | Without Mortgage | With Mortgage |
| Housing Units | 9 | 2 |
| Median Property Value | $131,300 | $0 |
| Median Household Income | - | - |
| Monthly Housing Costs | $675 | $0 |
| Real Estate Taxes | - | - |
Property Value by Mortgage Status in Karluk
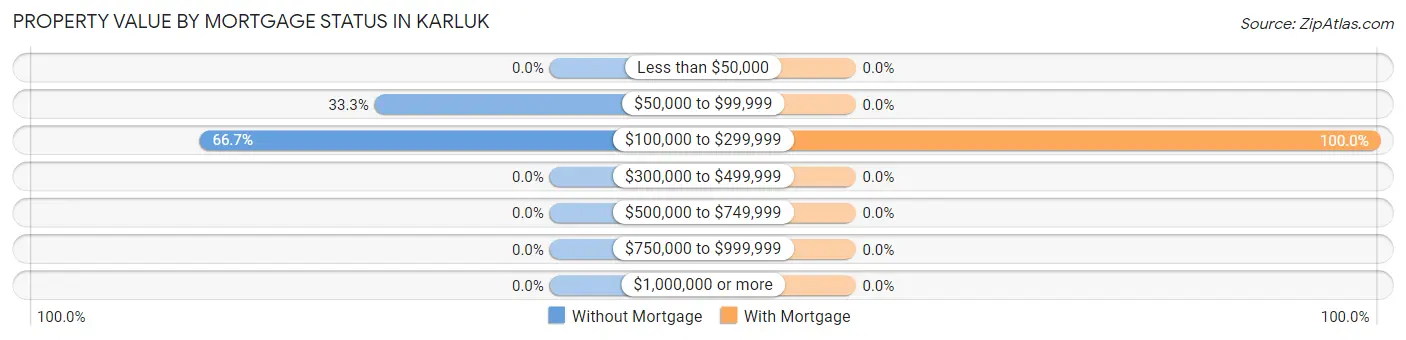
| Property Value | Without Mortgage | With Mortgage |
| Less than $50,000 | 0 (0.0%) | 0 (0.0%) |
| $50,000 to $99,999 | 3 (33.3%) | 0 (0.0%) |
| $100,000 to $299,999 | 6 (66.7%) | 2 (100.0%) |
| $300,000 to $499,999 | 0 (0.0%) | 0 (0.0%) |
| $500,000 to $749,999 | 0 (0.0%) | 0 (0.0%) |
| $750,000 to $999,999 | 0 (0.0%) | 0 (0.0%) |
| $1,000,000 or more | 0 (0.0%) | 0 (0.0%) |
| Total | 9 (100.0%) | 2 (100.0%) |
Household Income by Mortgage Status in Karluk
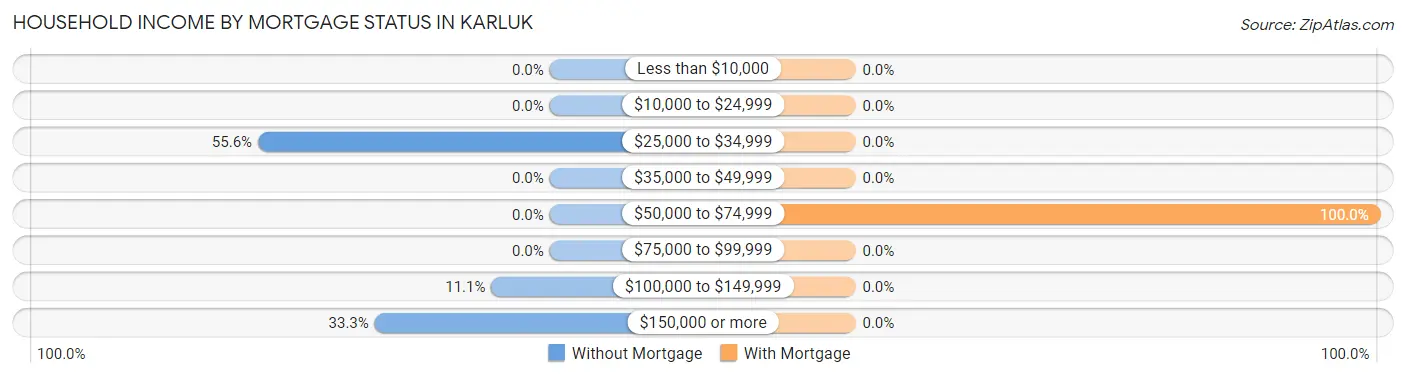
| Household Income | Without Mortgage | With Mortgage |
| Less than $10,000 | 0 (0.0%) | 0 (0.0%) |
| $10,000 to $24,999 | 0 (0.0%) | 0 (0.0%) |
| $25,000 to $34,999 | 5 (55.6%) | 0 (0.0%) |
| $35,000 to $49,999 | 0 (0.0%) | 0 (0.0%) |
| $50,000 to $74,999 | 0 (0.0%) | 2 (100.0%) |
| $75,000 to $99,999 | 0 (0.0%) | 0 (0.0%) |
| $100,000 to $149,999 | 1 (11.1%) | 0 (0.0%) |
| $150,000 or more | 3 (33.3%) | 0 (0.0%) |
| Total | 9 (100.0%) | 2 (100.0%) |
Property Value to Household Income Ratio in Karluk
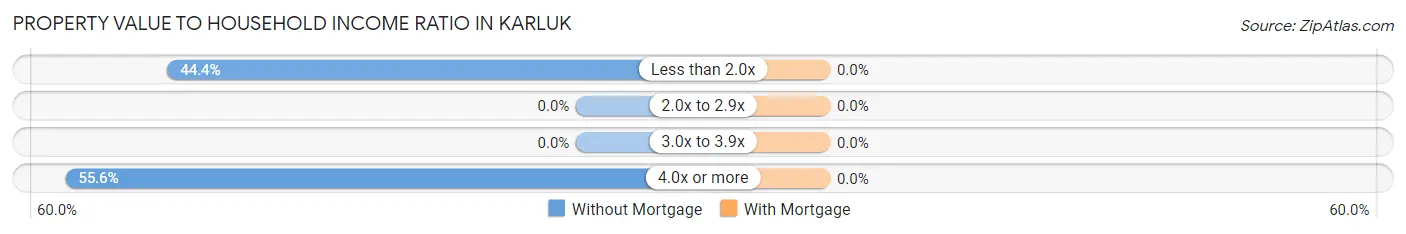
| Value-to-Income Ratio | Without Mortgage | With Mortgage |
| Less than 2.0x | 4 (44.4%) | 0 (0.0%) |
| 2.0x to 2.9x | 0 (0.0%) | 0 (0.0%) |
| 3.0x to 3.9x | 0 (0.0%) | 0 (0.0%) |
| 4.0x or more | 5 (55.6%) | 0 (0.0%) |
| Total | 9 (100.0%) | 2 (100.0%) |
Real Estate Taxes by Mortgage Status in Karluk
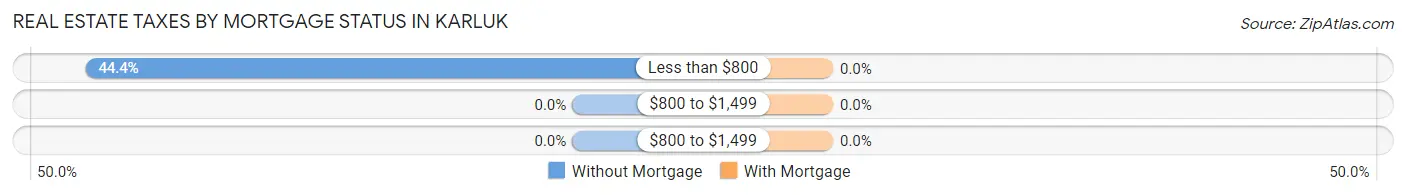
| Property Taxes | Without Mortgage | With Mortgage |
| Less than $800 | 4 (44.4%) | 0 (0.0%) |
| $800 to $1,499 | 0 (0.0%) | 0 (0.0%) |
| $800 to $1,499 | 0 (0.0%) | 0 (0.0%) |
| Total | 9 (100.0%) | 2 (100.0%) |
Health & Disability in Karluk
Health Insurance Coverage by Age in Karluk
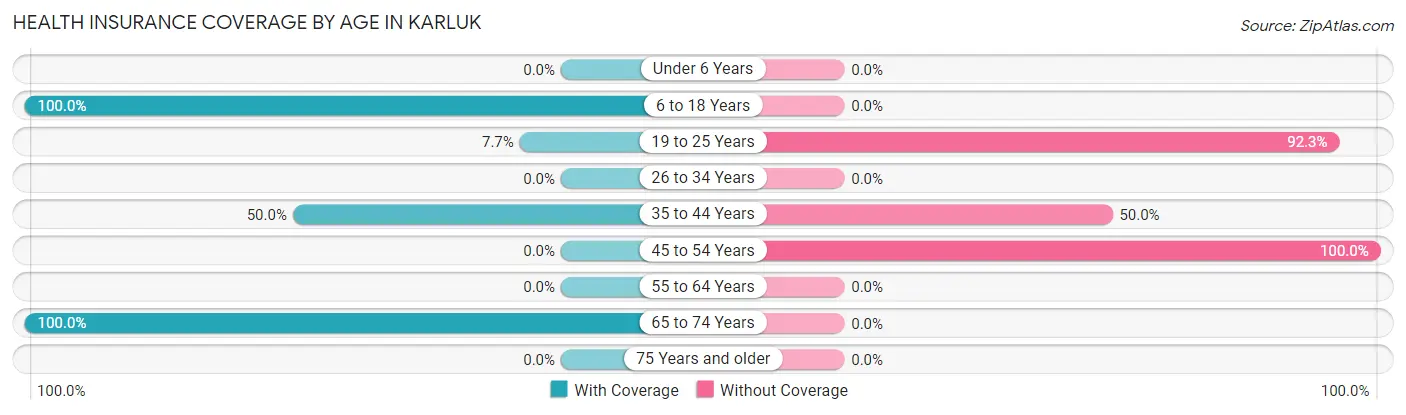
| Age Bracket | With Coverage | Without Coverage |
| Under 6 Years | 0 (0.0%) | 0 (0.0%) |
| 6 to 18 Years | 1 (100.0%) | 0 (0.0%) |
| 19 to 25 Years | 1 (7.7%) | 12 (92.3%) |
| 26 to 34 Years | 0 (0.0%) | 0 (0.0%) |
| 35 to 44 Years | 3 (50.0%) | 3 (50.0%) |
| 45 to 54 Years | 0 (0.0%) | 2 (100.0%) |
| 55 to 64 Years | 0 (0.0%) | 0 (0.0%) |
| 65 to 74 Years | 5 (100.0%) | 0 (0.0%) |
| 75 Years and older | 0 (0.0%) | 0 (0.0%) |
| Total | 10 (37.0%) | 17 (63.0%) |
Health Insurance Coverage by Citizenship Status in Karluk
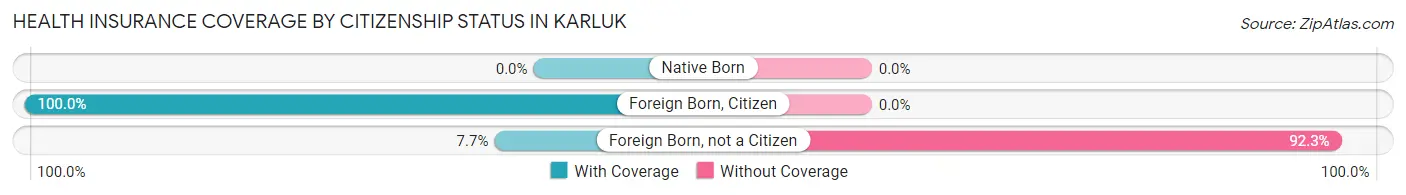
| Citizenship Status | With Coverage | Without Coverage |
| Native Born | 0 (0.0%) | 0 (0.0%) |
| Foreign Born, Citizen | 1 (100.0%) | 0 (0.0%) |
| Foreign Born, not a Citizen | 1 (7.7%) | 12 (92.3%) |
Health Insurance Coverage by Household Income in Karluk
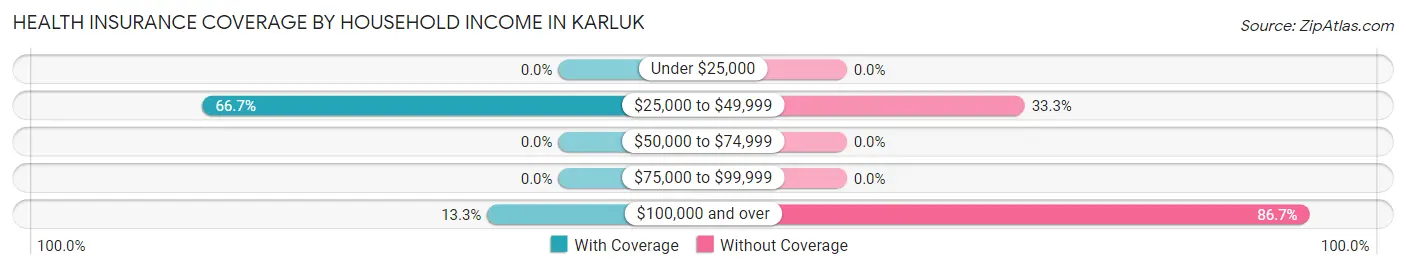
| Household Income | With Coverage | Without Coverage |
| Under $25,000 | 0 (0.0%) | 0 (0.0%) |
| $25,000 to $49,999 | 8 (66.7%) | 4 (33.3%) |
| $50,000 to $74,999 | 0 (0.0%) | 0 (0.0%) |
| $75,000 to $99,999 | 0 (0.0%) | 0 (0.0%) |
| $100,000 and over | 2 (13.3%) | 13 (86.7%) |
Public vs Private Health Insurance Coverage by Age in Karluk
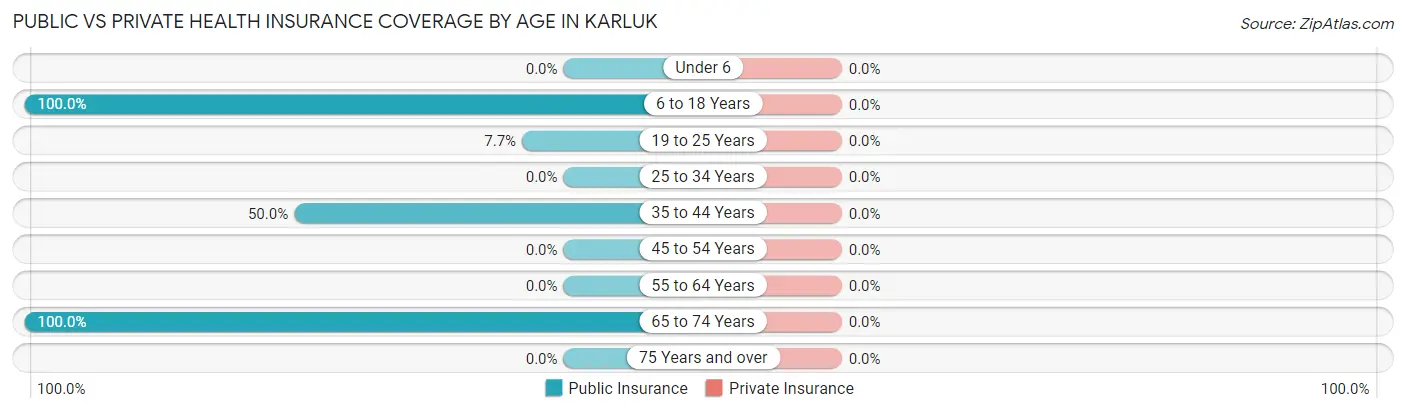
| Age Bracket | Public Insurance | Private Insurance |
| Under 6 | 0 (0.0%) | 0 (0.0%) |
| 6 to 18 Years | 1 (100.0%) | 0 (0.0%) |
| 19 to 25 Years | 1 (7.7%) | 0 (0.0%) |
| 25 to 34 Years | 0 (0.0%) | 0 (0.0%) |
| 35 to 44 Years | 3 (50.0%) | 0 (0.0%) |
| 45 to 54 Years | 0 (0.0%) | 0 (0.0%) |
| 55 to 64 Years | 0 (0.0%) | 0 (0.0%) |
| 65 to 74 Years | 5 (100.0%) | 0 (0.0%) |
| 75 Years and over | 0 (0.0%) | 0 (0.0%) |
| Total | 10 (37.0%) | 0 (0.0%) |
Disability Status by Sex by Age in Karluk
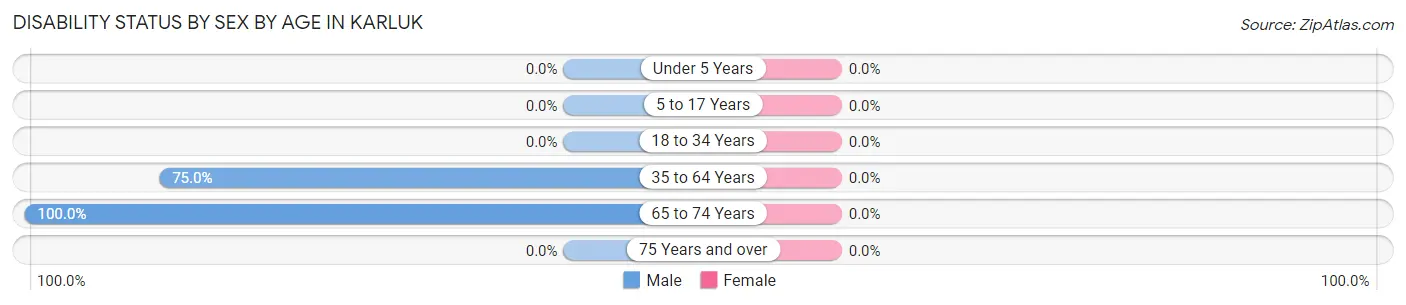
| Age Bracket | Male | Female |
| Under 5 Years | 0 (0.0%) | 0 (0.0%) |
| 5 to 17 Years | 0 (0.0%) | 0 (0.0%) |
| 18 to 34 Years | 0 (0.0%) | 0 (0.0%) |
| 35 to 64 Years | 3 (75.0%) | 0 (0.0%) |
| 65 to 74 Years | 5 (100.0%) | 0 (0.0%) |
| 75 Years and over | 0 (0.0%) | 0 (0.0%) |
Disability Class by Sex by Age in Karluk
Disability Class: Hearing Difficulty
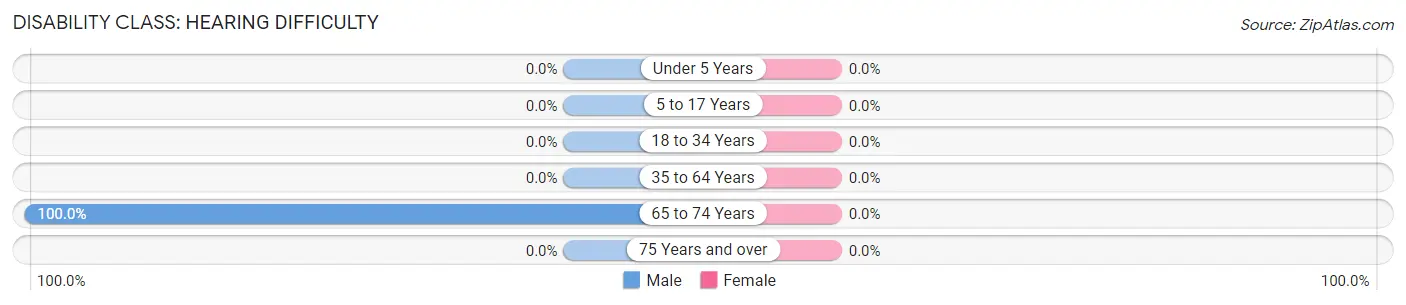
| Age Bracket | Male | Female |
| Under 5 Years | 0 (0.0%) | 0 (0.0%) |
| 5 to 17 Years | 0 (0.0%) | 0 (0.0%) |
| 18 to 34 Years | 0 (0.0%) | 0 (0.0%) |
| 35 to 64 Years | 0 (0.0%) | 0 (0.0%) |
| 65 to 74 Years | 5 (100.0%) | 0 (0.0%) |
| 75 Years and over | 0 (0.0%) | 0 (0.0%) |
Disability Class: Vision Difficulty
| Age Bracket | Male | Female |
| Under 5 Years | 0 (0.0%) | 0 (0.0%) |
| 5 to 17 Years | 0 (0.0%) | 0 (0.0%) |
| 18 to 34 Years | 0 (0.0%) | 0 (0.0%) |
| 35 to 64 Years | 0 (0.0%) | 0 (0.0%) |
| 65 to 74 Years | 0 (0.0%) | 0 (0.0%) |
| 75 Years and over | 0 (0.0%) | 0 (0.0%) |
Disability Class: Cognitive Difficulty
| Age Bracket | Male | Female |
| 5 to 17 Years | 0 (0.0%) | 0 (0.0%) |
| 18 to 34 Years | 0 (0.0%) | 0 (0.0%) |
| 35 to 64 Years | 0 (0.0%) | 0 (0.0%) |
| 65 to 74 Years | 0 (0.0%) | 0 (0.0%) |
| 75 Years and over | 0 (0.0%) | 0 (0.0%) |
Disability Class: Ambulatory Difficulty
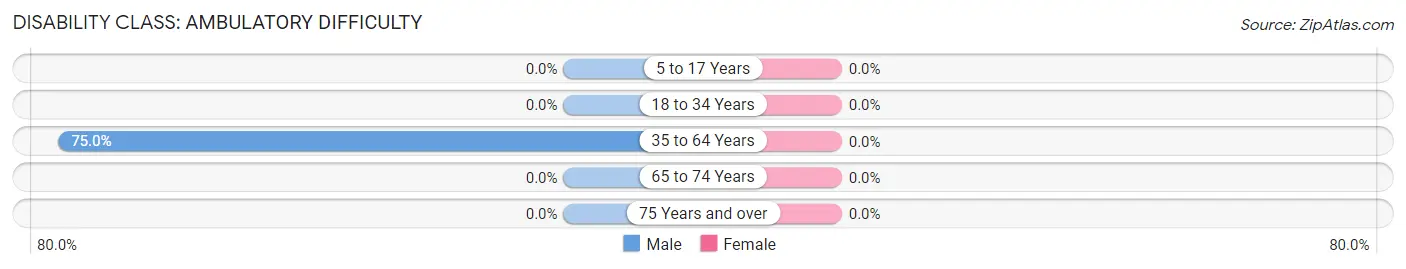
| Age Bracket | Male | Female |
| 5 to 17 Years | 0 (0.0%) | 0 (0.0%) |
| 18 to 34 Years | 0 (0.0%) | 0 (0.0%) |
| 35 to 64 Years | 3 (75.0%) | 0 (0.0%) |
| 65 to 74 Years | 0 (0.0%) | 0 (0.0%) |
| 75 Years and over | 0 (0.0%) | 0 (0.0%) |
Disability Class: Self-Care Difficulty
| Age Bracket | Male | Female |
| 5 to 17 Years | 0 (0.0%) | 0 (0.0%) |
| 18 to 34 Years | 0 (0.0%) | 0 (0.0%) |
| 35 to 64 Years | 0 (0.0%) | 0 (0.0%) |
| 65 to 74 Years | 0 (0.0%) | 0 (0.0%) |
| 75 Years and over | 0 (0.0%) | 0 (0.0%) |
Technology Access in Karluk
Computing Device Access in Karluk
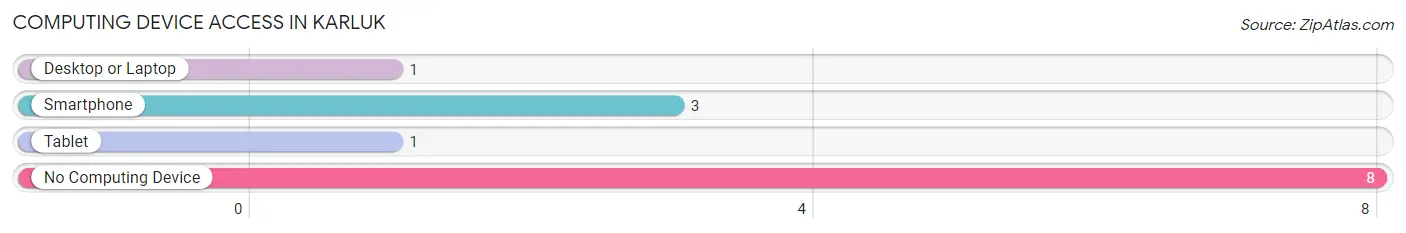
| Device Type | # Households | % Households |
| Desktop or Laptop | 1 | 9.1% |
| Smartphone | 3 | 27.3% |
| Tablet | 1 | 9.1% |
| No Computing Device | 8 | 72.7% |
| Total | 11 | 100.0% |
Internet Access in Karluk
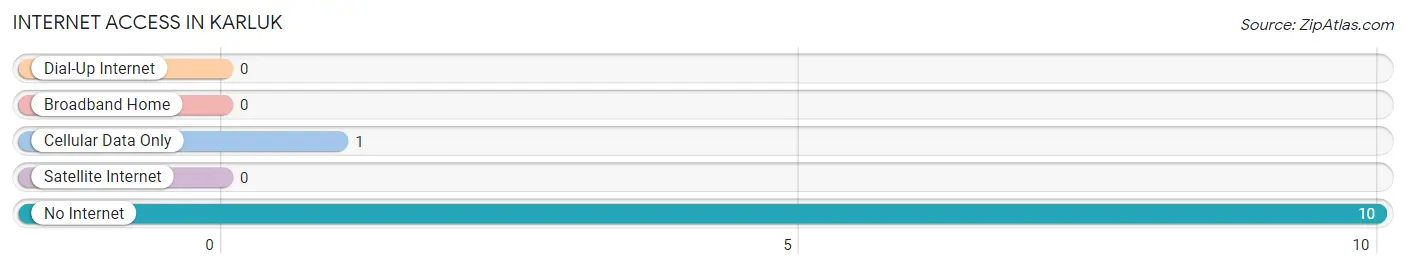
| Internet Type | # Households | % Households |
| Dial-Up Internet | 0 | 0.0% |
| Broadband Home | 0 | 0.0% |
| Cellular Data Only | 1 | 9.1% |
| Satellite Internet | 0 | 0.0% |
| No Internet | 10 | 90.9% |
| Total | 11 | 100.0% |
Karluk Summary
Karluk, Alaska is a small unincorporated community located on Kodiak Island in the Kodiak Island Borough of Alaska. It is located on the western shore of Karluk Lagoon, about 25 miles southwest of the city of Kodiak. The population of Karluk was estimated to be around 100 people in 2020.
History
Karluk has a long and rich history. It was first inhabited by the Alutiiq people, who have lived in the area for thousands of years. The Alutiiq people were hunters and gatherers, and they relied on the abundant resources of the area for their subsistence.
In 1784, the Russian explorer Grigory Shelikhov arrived in the area and established a trading post at Karluk. This trading post was the first permanent Russian settlement in Alaska. The settlement was named after the nearby Karluk River, which was named after the Alutiiq word for “river”.
In 1867, the United States purchased Alaska from Russia, and Karluk became part of the United States. In the late 1800s, the area around Karluk was used for commercial fishing and canning. The canneries were the main source of employment for the local population.
In the early 1900s, the area around Karluk was used for logging. The logging industry provided employment for many of the local residents. In the 1950s, the canneries and logging operations closed, and the local economy shifted to fishing and subsistence activities.
Geography
Karluk is located on the western shore of Karluk Lagoon, about 25 miles southwest of the city of Kodiak. The lagoon is a shallow, saltwater body of water that is connected to the Pacific Ocean. The area around Karluk is mostly flat, with some low hills and mountains in the distance. The climate is mild and wet, with temperatures ranging from the mid-30s in the winter to the mid-60s in the summer.
Economy
The economy of Karluk is largely based on fishing and subsistence activities. Commercial fishing is the main source of employment for the local population. The local fishermen catch a variety of fish, including salmon, halibut, cod, and rockfish. The fish are sold to local markets and restaurants, as well as to larger markets in Anchorage and Seattle.
Subsistence activities are also important to the local economy. The Alutiiq people have a long history of hunting and gathering in the area. They hunt for deer, moose, and other game, and they gather berries, seaweed, and other plants.
Demographics
The population of Karluk was estimated to be around 100 people in 2020. The majority of the population is of Alutiiq descent. The median age of the population is around 40 years old. The median household income is around $50,000. The majority of the population is employed in the fishing and subsistence activities.
Common Questions
What is Per Capita Income in Karluk?
Per Capita income in Karluk is $28,848.
What is Income or Wage Gap in Karluk?
Income or Wage Gap in Karluk is 25.3%.
Women in Karluk earn 74.7 cents for every dollar earned by a man.
What is Inequality or Gini Index in Karluk?
Inequality or Gini Index in Karluk is 0.40.
What is the Total Population of Karluk?
Total Population of Karluk is 27.
What is the Total Male Population of Karluk?
Total Male Population of Karluk is 18.
What is the Total Female Population of Karluk?
Total Female Population of Karluk is 9.
What is the Ratio of Males per 100 Females in Karluk?
There are 200.00 Males per 100 Females in Karluk.
What is the Ratio of Females per 100 Males in Karluk?
There are 50.00 Females per 100 Males in Karluk.
What is the Median Population Age in Karluk?
Median Population Age in Karluk is 23.8 Years.
What is the Average Family Size in Karluk
Average Family Size in Karluk is 2.5 People.
What is the Average Household Size in Karluk
Average Household Size in Karluk is 2.5 People.
How Large is the Labor Force in Karluk?
There are 19 People in the Labor Forcein in Karluk.
What is the Percentage of People in the Labor Force in Karluk?
70.4% of People are in the Labor Force in Karluk.
What is the Unemployment Rate in Karluk?
Unemployment Rate in Karluk is 15.8%.