Kaktovik, AK Map & Demographics
Kaktovik Map
Kaktovik Overview
$32,169
PER CAPITA INCOME
$74,583
AVG FAMILY INCOME
$86,458
AVG HOUSEHOLD INCOME
46.1%
WAGE / INCOME GAP [ % ]
53.9¢/ $1
WAGE / INCOME GAP [ $ ]
0.38
INEQUALITY / GINI INDEX
201
TOTAL POPULATION
115
MALE POPULATION
86
FEMALE POPULATION
133.72
MALES / 100 FEMALES
74.78
FEMALES / 100 MALES
27.8
MEDIAN AGE
3.5
AVG FAMILY SIZE
3.2
AVG HOUSEHOLD SIZE
94
LABOR FORCE [ PEOPLE ]
61.4%
PERCENT IN LABOR FORCE
16.9%
UNEMPLOYMENT RATE
Kaktovik Zip Codes
Kaktovik Area Codes
Income in Kaktovik
Income Overview in Kaktovik
Per Capita Income in Kaktovik is $32,169, while median incomes of families and households are $74,583 and $86,458 respectively.
| Characteristic | Number | Measure |
| Per Capita Income | 201 | $32,169 |
| Median Family Income | 49 | $74,583 |
| Mean Family Income | 49 | $100,402 |
| Median Household Income | 61 | $86,458 |
| Mean Household Income | 61 | $120,348 |
| Income Deficit | 49 | $0 |
| Wage / Income Gap (%) | 201 | 46.05% |
| Wage / Income Gap ($) | 201 | 53.95¢ per $1 |
| Gini / Inequality Index | 201 | 0.38 |
Earnings by Sex in Kaktovik
Average Earnings in Kaktovik are $36,250, $43,250 for men and $23,333 for women, a difference of 46.1%.
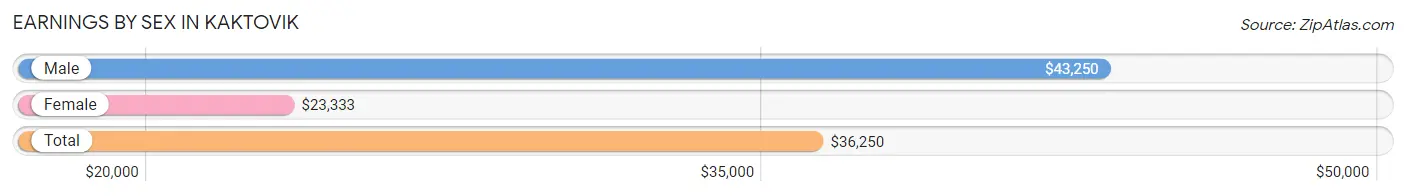
| Sex | Number | Average Earnings |
| Male | 71 (62.8%) | $43,250 |
| Female | 42 (37.2%) | $23,333 |
| Total | 113 (100.0%) | $36,250 |
Earnings by Sex by Income Bracket in Kaktovik
The most common earnings brackets in Kaktovik are $25,000 to $29,999 for men (10 | 14.1%) and $5,000 to $7,499 for women (8 | 19.1%).
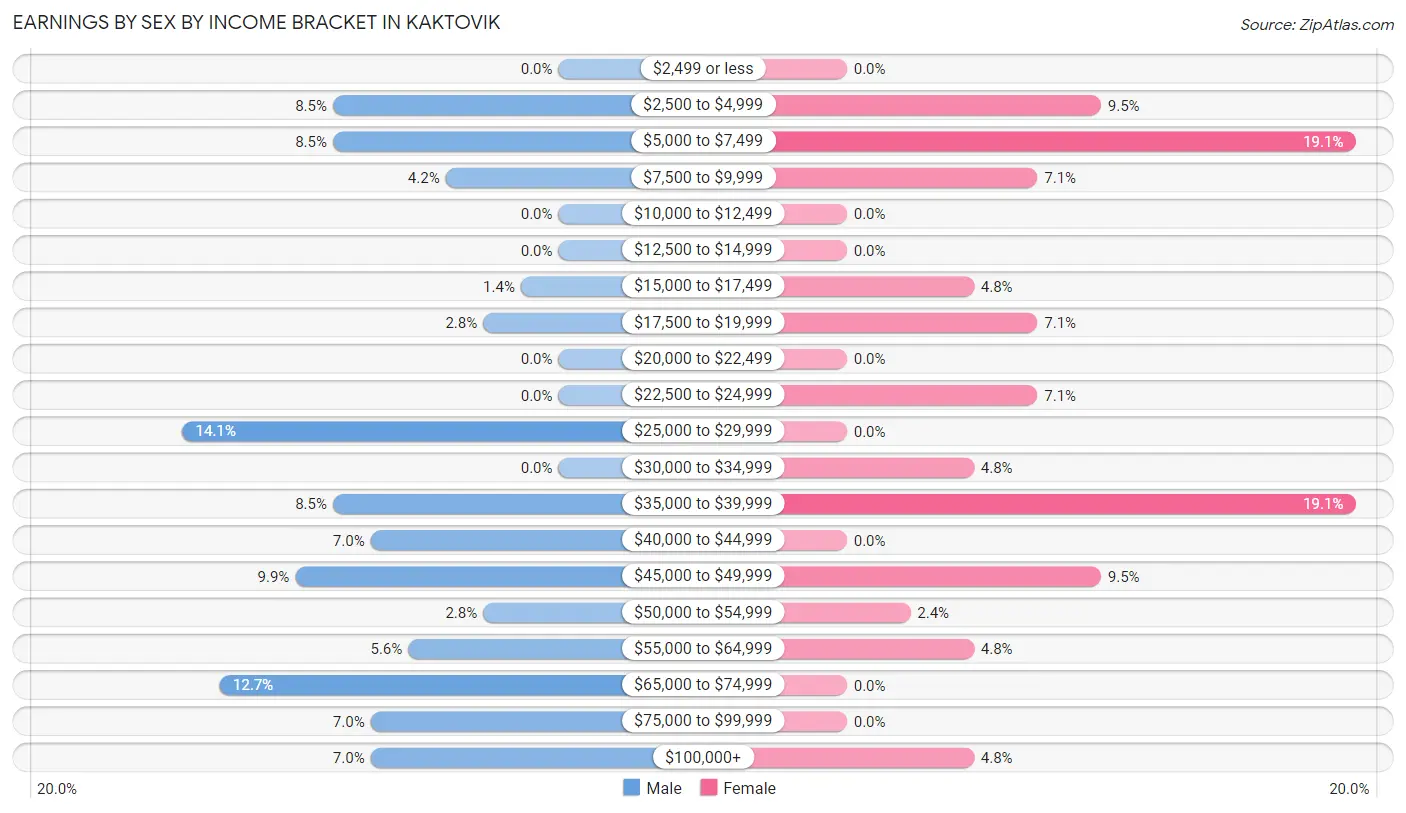
| Income | Male | Female |
| $2,499 or less | 0 (0.0%) | 0 (0.0%) |
| $2,500 to $4,999 | 6 (8.5%) | 4 (9.5%) |
| $5,000 to $7,499 | 6 (8.5%) | 8 (19.1%) |
| $7,500 to $9,999 | 3 (4.2%) | 3 (7.1%) |
| $10,000 to $12,499 | 0 (0.0%) | 0 (0.0%) |
| $12,500 to $14,999 | 0 (0.0%) | 0 (0.0%) |
| $15,000 to $17,499 | 1 (1.4%) | 2 (4.8%) |
| $17,500 to $19,999 | 2 (2.8%) | 3 (7.1%) |
| $20,000 to $22,499 | 0 (0.0%) | 0 (0.0%) |
| $22,500 to $24,999 | 0 (0.0%) | 3 (7.1%) |
| $25,000 to $29,999 | 10 (14.1%) | 0 (0.0%) |
| $30,000 to $34,999 | 0 (0.0%) | 2 (4.8%) |
| $35,000 to $39,999 | 6 (8.5%) | 8 (19.1%) |
| $40,000 to $44,999 | 5 (7.0%) | 0 (0.0%) |
| $45,000 to $49,999 | 7 (9.9%) | 4 (9.5%) |
| $50,000 to $54,999 | 2 (2.8%) | 1 (2.4%) |
| $55,000 to $64,999 | 4 (5.6%) | 2 (4.8%) |
| $65,000 to $74,999 | 9 (12.7%) | 0 (0.0%) |
| $75,000 to $99,999 | 5 (7.0%) | 0 (0.0%) |
| $100,000+ | 5 (7.0%) | 2 (4.8%) |
| Total | 71 (100.0%) | 42 (100.0%) |
Earnings by Sex by Educational Attainment in Kaktovik
Average earnings in Kaktovik are $48,750 for men and $37,083 for women, a difference of 23.9%. Men with an educational attainment of high school diploma enjoy the highest average annual earnings of $49,750, while those with college or associate's degree education earn the least with $36,563. Women with an educational attainment of high school diploma earn the most with the average annual earnings of $38,000, while those with college or associate's degree education have the smallest earnings of $36,667.
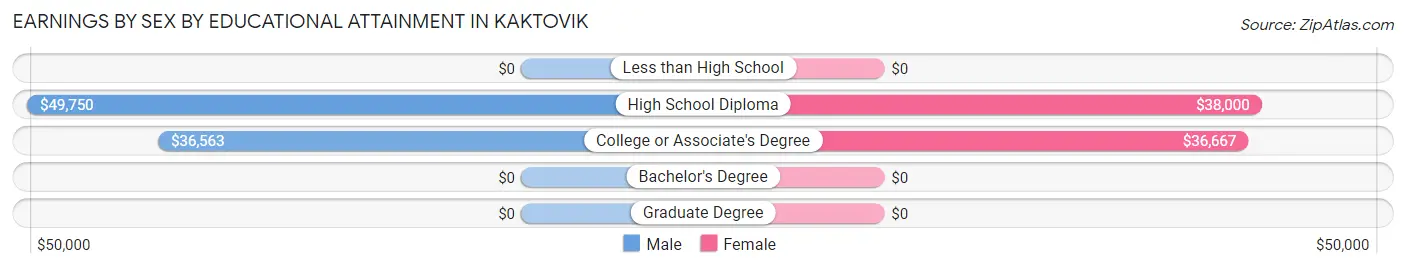
| Educational Attainment | Male Income | Female Income |
| Less than High School | - | - |
| High School Diploma | $49,750 | $38,000 |
| College or Associate's Degree | $36,563 | $36,667 |
| Bachelor's Degree | - | - |
| Graduate Degree | - | - |
| Total | $48,750 | $37,083 |
Family Income in Kaktovik
Family Income Brackets in Kaktovik
According to the Kaktovik family income data, there are 13 families falling into the $50,000 to $74,999 income range, which is the most common income bracket and makes up 26.5% of all families.
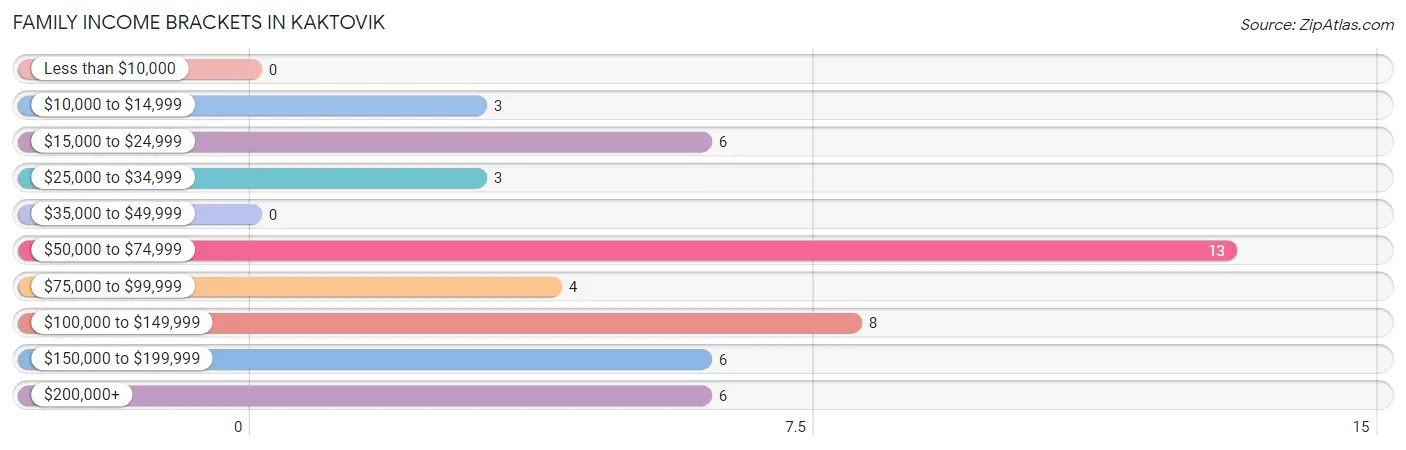
| Income Bracket | # Families | % Families |
| Less than $10,000 | 0 | 0.0% |
| $10,000 to $14,999 | 3 | 6.1% |
| $15,000 to $24,999 | 6 | 12.2% |
| $25,000 to $34,999 | 3 | 6.1% |
| $35,000 to $49,999 | 0 | 0.0% |
| $50,000 to $74,999 | 13 | 26.5% |
| $75,000 to $99,999 | 4 | 8.2% |
| $100,000 to $149,999 | 8 | 16.3% |
| $150,000 to $199,999 | 6 | 12.2% |
| $200,000+ | 6 | 12.2% |
Family Income by Famaliy Size in Kaktovik
| Income Bracket | # Families | Median Income |
| 2-Person Families | 9 (18.4%) | $0 |
| 3-Person Families | 15 (30.6%) | $0 |
| 4-Person Families | 4 (8.2%) | $0 |
| 5-Person Families | 7 (14.3%) | $0 |
| 6-Person Families | 3 (6.1%) | $0 |
| 7+ Person Families | 11 (22.5%) | $0 |
| Total | 49 (100.0%) | $74,583 |
Family Income by Number of Earners in Kaktovik
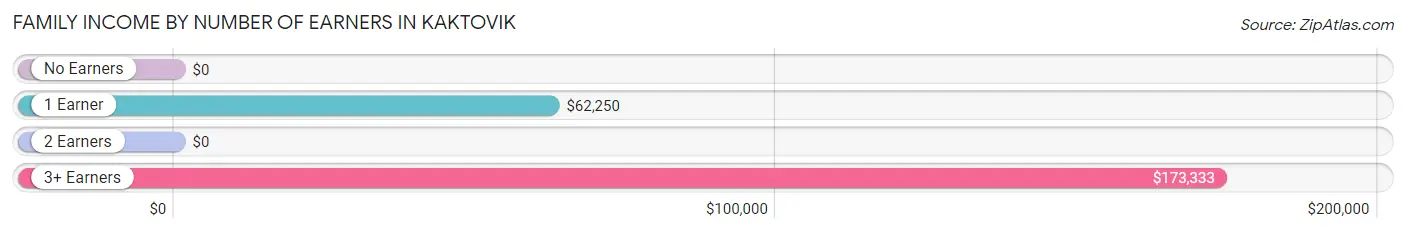
| Number of Earners | # Families | Median Income |
| No Earners | 9 (18.4%) | $0 |
| 1 Earner | 17 (34.7%) | $62,250 |
| 2 Earners | 7 (14.3%) | $0 |
| 3+ Earners | 16 (32.7%) | $173,333 |
| Total | 49 (100.0%) | $74,583 |
Household Income in Kaktovik
Household Income Brackets in Kaktovik
With 16 households falling in the category, the $50,000 to $74,999 income range is the most frequent in Kaktovik, accounting for 26.2% of all households.
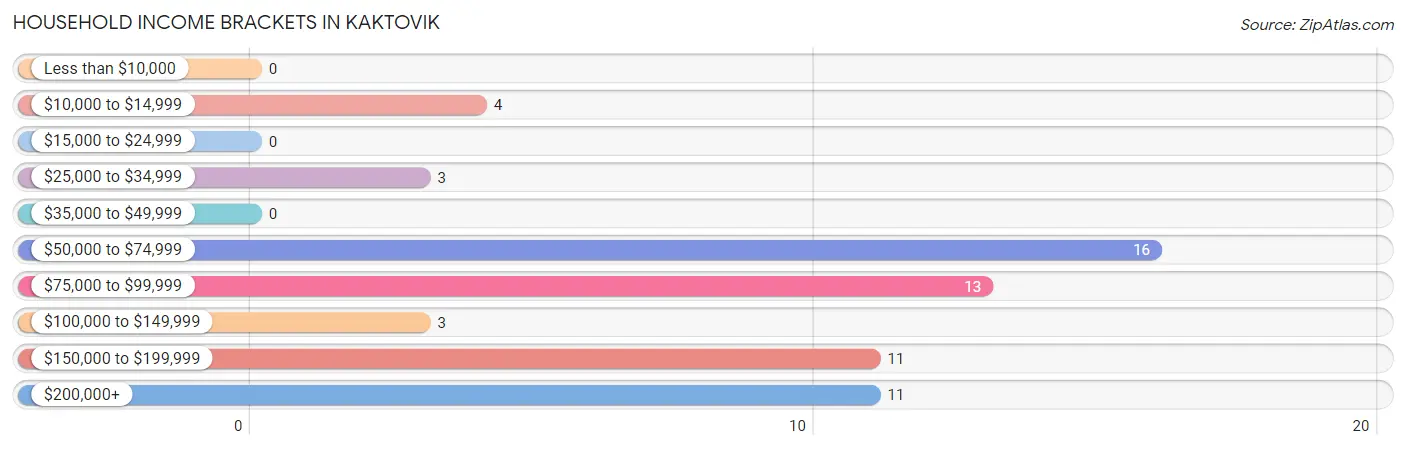
| Income Bracket | # Households | % Households |
| Less than $10,000 | 0 | 0.0% |
| $10,000 to $14,999 | 4 | 6.6% |
| $15,000 to $24,999 | 0 | 0.0% |
| $25,000 to $34,999 | 3 | 4.9% |
| $35,000 to $49,999 | 0 | 0.0% |
| $50,000 to $74,999 | 16 | 26.2% |
| $75,000 to $99,999 | 13 | 21.3% |
| $100,000 to $149,999 | 3 | 4.9% |
| $150,000 to $199,999 | 11 | 18.0% |
| $200,000+ | 11 | 18.0% |
Household Income by Householder Age in Kaktovik
The median household income in Kaktovik is $86,458, with the highest median household income of $103,333 found in the 45 to 64 years age bracket for the primary householder. A total of 28 households (45.9%) fall into this category.
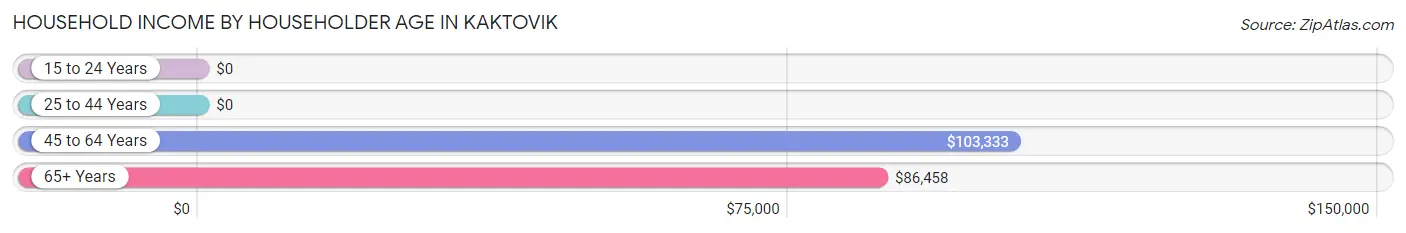
| Income Bracket | # Households | Median Income |
| 15 to 24 Years | 0 (0.0%) | $0 |
| 25 to 44 Years | 22 (36.1%) | $0 |
| 45 to 64 Years | 28 (45.9%) | $103,333 |
| 65+ Years | 11 (18.0%) | $86,458 |
| Total | 61 (100.0%) | $86,458 |
Poverty in Kaktovik
Income Below Poverty by Sex and Age in Kaktovik
With 9.1% poverty level for males and 17.4% for females among the residents of Kaktovik, 75 year old and over males and 35 to 44 year old females are the most vulnerable to poverty, with 6 males (100.0%) and 3 females (60.0%) in their respective age groups living below the poverty level.
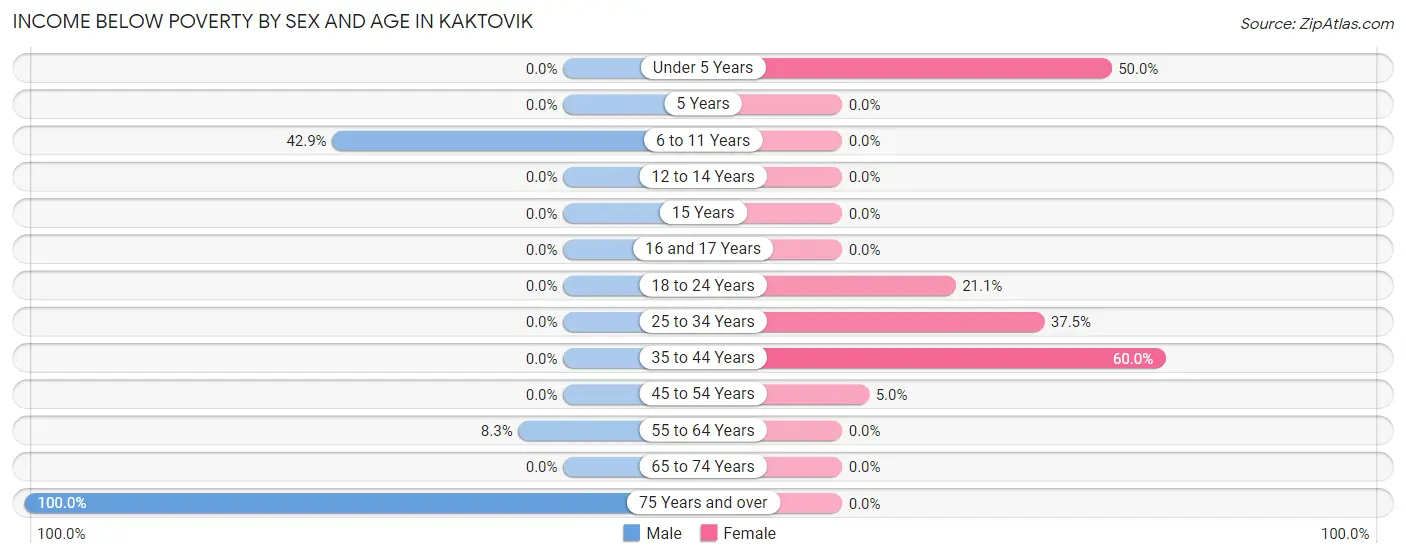
| Age Bracket | Male | Female |
| Under 5 Years | 0 (0.0%) | 4 (50.0%) |
| 5 Years | 0 (0.0%) | 0 (0.0%) |
| 6 to 11 Years | 3 (42.9%) | 0 (0.0%) |
| 12 to 14 Years | 0 (0.0%) | 0 (0.0%) |
| 15 Years | 0 (0.0%) | 0 (0.0%) |
| 16 and 17 Years | 0 (0.0%) | 0 (0.0%) |
| 18 to 24 Years | 0 (0.0%) | 4 (21.0%) |
| 25 to 34 Years | 0 (0.0%) | 3 (37.5%) |
| 35 to 44 Years | 0 (0.0%) | 3 (60.0%) |
| 45 to 54 Years | 0 (0.0%) | 1 (5.0%) |
| 55 to 64 Years | 1 (8.3%) | 0 (0.0%) |
| 65 to 74 Years | 0 (0.0%) | 0 (0.0%) |
| 75 Years and over | 6 (100.0%) | 0 (0.0%) |
| Total | 10 (9.1%) | 15 (17.4%) |
Income Above Poverty by Sex and Age in Kaktovik
According to the poverty statistics in Kaktovik, males aged under 5 years and females aged 6 to 11 years are the age groups that are most secure financially, with 100.0% of males and 100.0% of females in these age groups living above the poverty line.
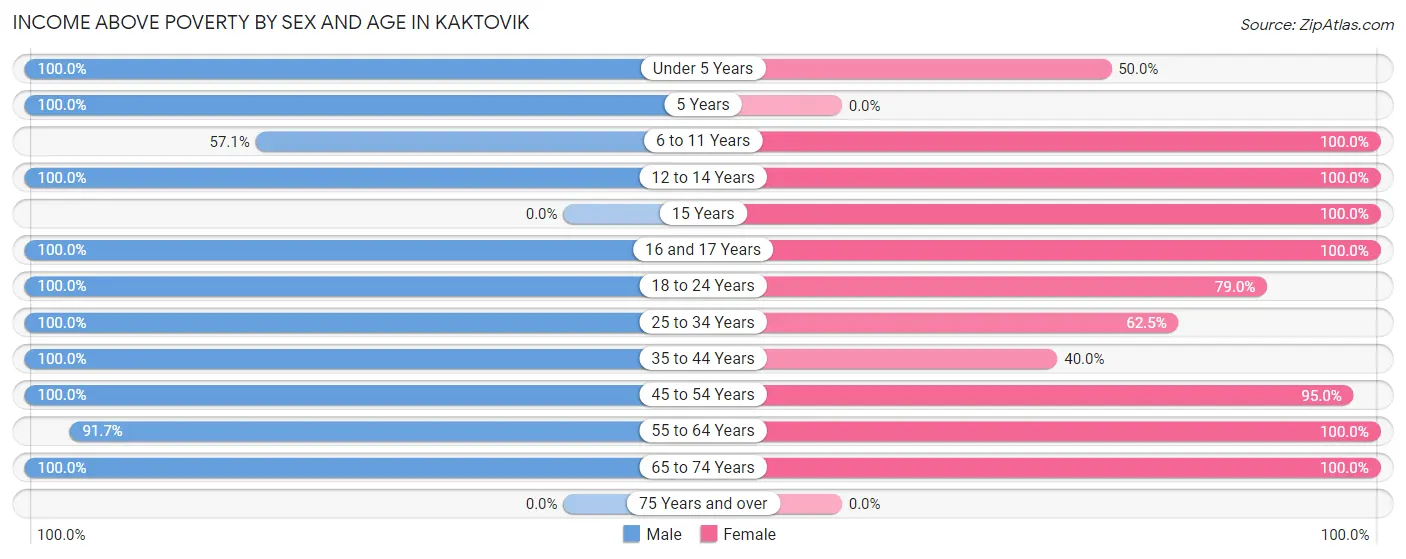
| Age Bracket | Male | Female |
| Under 5 Years | 7 (100.0%) | 4 (50.0%) |
| 5 Years | 3 (100.0%) | 0 (0.0%) |
| 6 to 11 Years | 4 (57.1%) | 7 (100.0%) |
| 12 to 14 Years | 7 (100.0%) | 6 (100.0%) |
| 15 Years | 0 (0.0%) | 3 (100.0%) |
| 16 and 17 Years | 9 (100.0%) | 2 (100.0%) |
| 18 to 24 Years | 7 (100.0%) | 15 (78.9%) |
| 25 to 34 Years | 20 (100.0%) | 5 (62.5%) |
| 35 to 44 Years | 19 (100.0%) | 2 (40.0%) |
| 45 to 54 Years | 11 (100.0%) | 19 (95.0%) |
| 55 to 64 Years | 11 (91.7%) | 5 (100.0%) |
| 65 to 74 Years | 2 (100.0%) | 3 (100.0%) |
| 75 Years and over | 0 (0.0%) | 0 (0.0%) |
| Total | 100 (90.9%) | 71 (82.6%) |
Income Below Poverty Among Married-Couple Families in Kaktovik
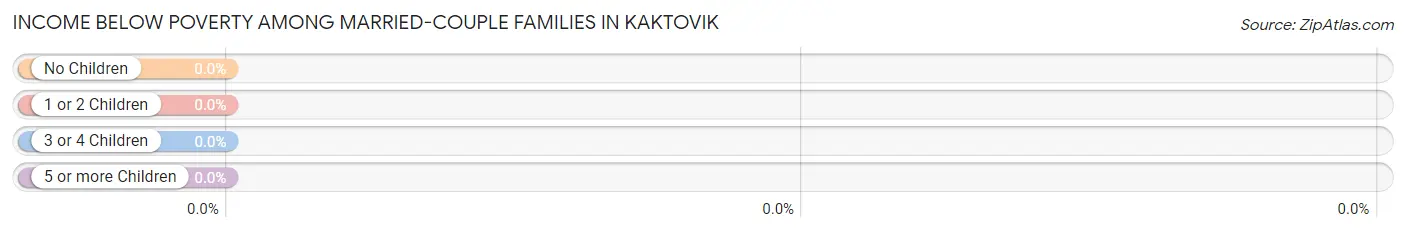
| Children | Above Poverty | Below Poverty |
| No Children | 0 (0.0%) | 0 (0.0%) |
| 1 or 2 Children | 1 (100.0%) | 0 (0.0%) |
| 3 or 4 Children | 3 (100.0%) | 0 (0.0%) |
| 5 or more Children | 0 (0.0%) | 0 (0.0%) |
| Total | 4 (100.0%) | 0 (0.0%) |
Income Below Poverty Among Single-Parent Households in Kaktovik
According to the poverty data in Kaktovik, 20.0% or 6 single-father households and 20.0% or 3 single-mother households are living below the poverty line. Among single-father households, those with 1 or 2 children have the highest poverty rate, with 6 households (28.6%) experiencing poverty. Likewise, among single-mother households, those with 1 or 2 children have the highest poverty rate, with 3 households (33.3%) falling below the poverty line.
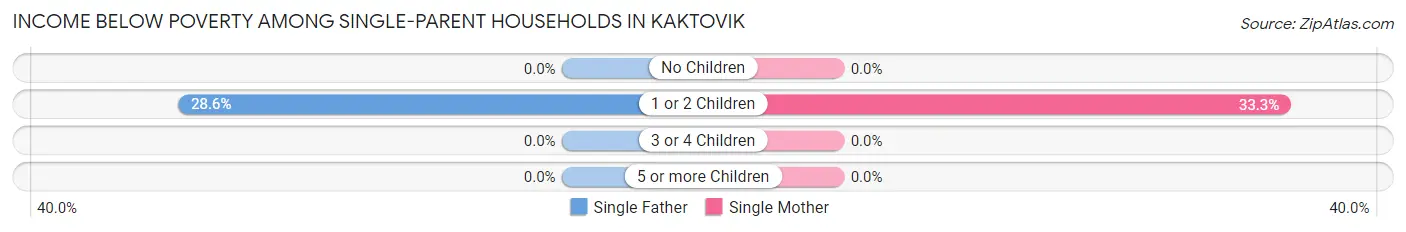
| Children | Single Father | Single Mother |
| No Children | 0 (0.0%) | 0 (0.0%) |
| 1 or 2 Children | 6 (28.6%) | 3 (33.3%) |
| 3 or 4 Children | 0 (0.0%) | 0 (0.0%) |
| 5 or more Children | 0 (0.0%) | 0 (0.0%) |
| Total | 6 (20.0%) | 3 (20.0%) |
Income Below Poverty Among Married-Couple vs Single-Parent Households in Kaktovik
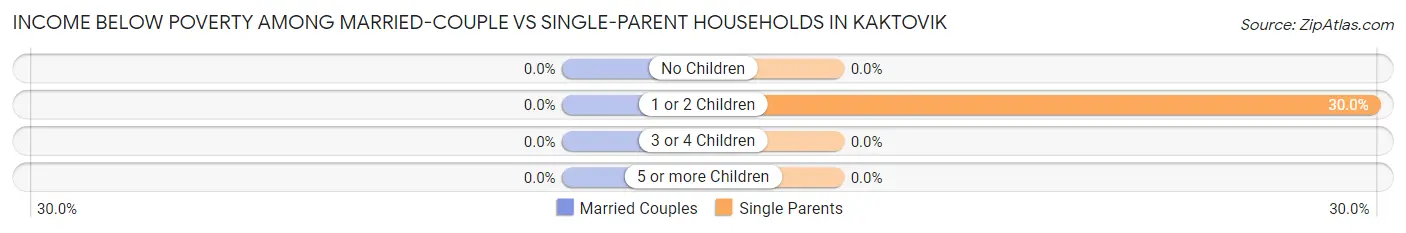
| Children | Married-Couple Families | Single-Parent Households |
| No Children | 0 (0.0%) | 0 (0.0%) |
| 1 or 2 Children | 0 (0.0%) | 9 (30.0%) |
| 3 or 4 Children | 0 (0.0%) | 0 (0.0%) |
| 5 or more Children | 0 (0.0%) | 0 (0.0%) |
| Total | 0 (0.0%) | 9 (20.0%) |
Race in Kaktovik
The most populous races in Kaktovik are Native / Alaskan (187 | 93.0%), Two or more Races (9 | 4.5%), and White / Caucasian (5 | 2.5%).
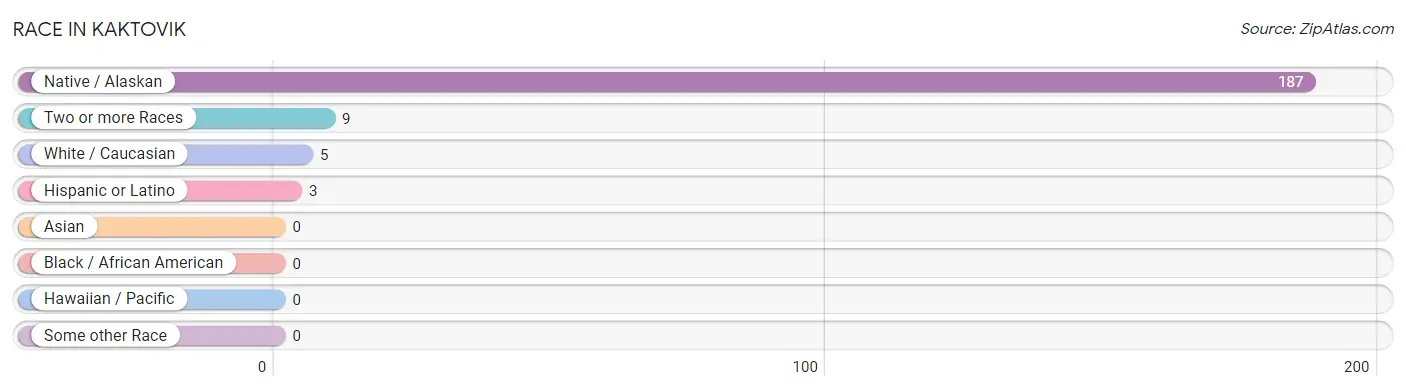
| Race | # Population | % Population |
| Asian | 0 | 0.0% |
| Black / African American | 0 | 0.0% |
| Hawaiian / Pacific | 0 | 0.0% |
| Hispanic or Latino | 3 | 1.5% |
| Native / Alaskan | 187 | 93.0% |
| White / Caucasian | 5 | 2.5% |
| Two or more Races | 9 | 4.5% |
| Some other Race | 0 | 0.0% |
| Total | 201 | 100.0% |
Ancestry in Kaktovik
The most populous ancestries reported in Kaktovik are Inupiat (189 | 94.0%), Alaska Native (4 | 2.0%), French American Indian (3 | 1.5%), Irish (3 | 1.5%), and Mexican (3 | 1.5%), together accounting for 100.5% of all Kaktovik residents.
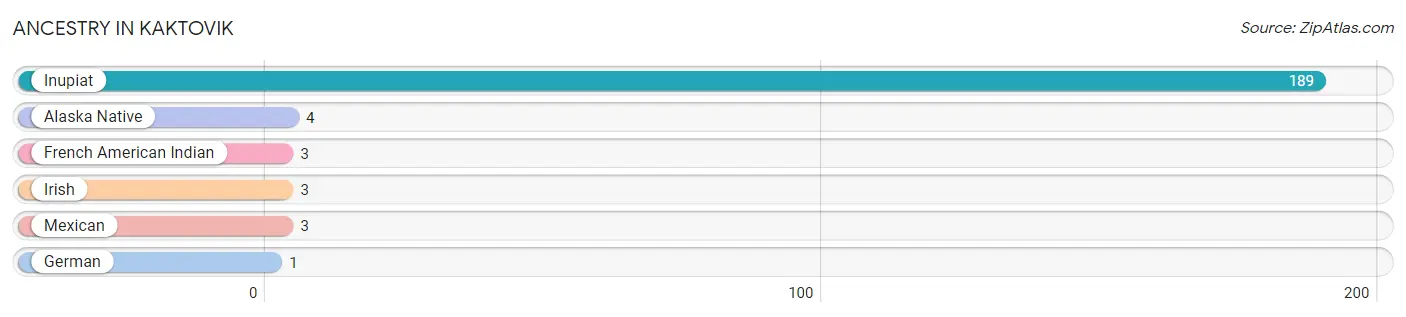
| Ancestry | # Population | % Population |
| Alaska Native | 4 | 2.0% |
| French American Indian | 3 | 1.5% |
| German | 1 | 0.5% |
| Inupiat | 189 | 94.0% |
| Irish | 3 | 1.5% |
| Mexican | 3 | 1.5% | View All 6 Rows |
Immigrants in Kaktovik
The most numerous immigrant groups reported in Kaktovik came from , and Canada (6 | 3.0%), together accounting for 3.0% of all Kaktovik residents.

| Immigration Origin | # Population | % Population |
| Canada | 6 | 3.0% | View All 1 Rows |
Sex and Age in Kaktovik
Sex and Age in Kaktovik
The most populous age groups in Kaktovik are 35 to 39 Years (14 | 12.2%) for men and 45 to 49 Years (14 | 16.3%) for women.
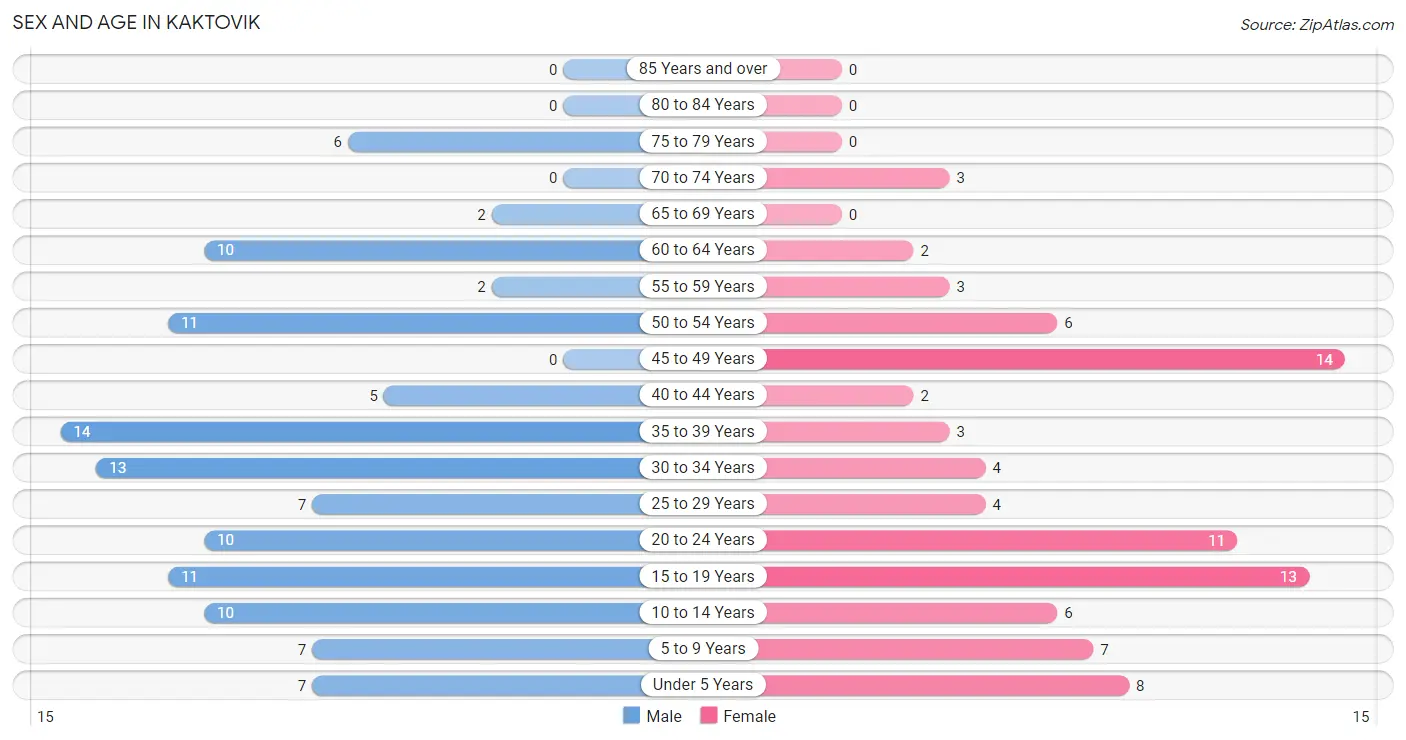
| Age Bracket | Male | Female |
| Under 5 Years | 7 (6.1%) | 8 (9.3%) |
| 5 to 9 Years | 7 (6.1%) | 7 (8.1%) |
| 10 to 14 Years | 10 (8.7%) | 6 (7.0%) |
| 15 to 19 Years | 11 (9.6%) | 13 (15.1%) |
| 20 to 24 Years | 10 (8.7%) | 11 (12.8%) |
| 25 to 29 Years | 7 (6.1%) | 4 (4.6%) |
| 30 to 34 Years | 13 (11.3%) | 4 (4.6%) |
| 35 to 39 Years | 14 (12.2%) | 3 (3.5%) |
| 40 to 44 Years | 5 (4.3%) | 2 (2.3%) |
| 45 to 49 Years | 0 (0.0%) | 14 (16.3%) |
| 50 to 54 Years | 11 (9.6%) | 6 (7.0%) |
| 55 to 59 Years | 2 (1.7%) | 3 (3.5%) |
| 60 to 64 Years | 10 (8.7%) | 2 (2.3%) |
| 65 to 69 Years | 2 (1.7%) | 0 (0.0%) |
| 70 to 74 Years | 0 (0.0%) | 3 (3.5%) |
| 75 to 79 Years | 6 (5.2%) | 0 (0.0%) |
| 80 to 84 Years | 0 (0.0%) | 0 (0.0%) |
| 85 Years and over | 0 (0.0%) | 0 (0.0%) |
| Total | 115 (100.0%) | 86 (100.0%) |
Families and Households in Kaktovik
Median Family Size in Kaktovik
The median family size in Kaktovik is 3.45 persons per family, with married-couple families (4 | 8.2%) accounting for the largest median family size of 8.5 persons per family. On the other hand, single male/father families (30 | 61.2%) represent the smallest median family size with 2.27 persons per family.
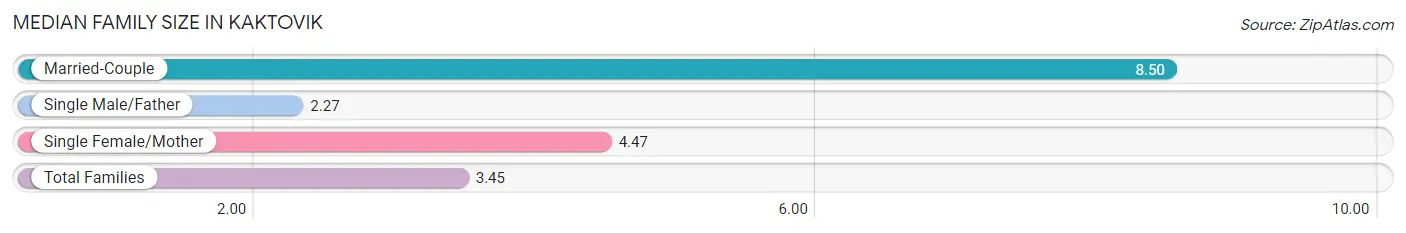
| Family Type | # Families | Family Size |
| Married-Couple | 4 (8.2%) | 8.50 |
| Single Male/Father | 30 (61.2%) | 2.27 |
| Single Female/Mother | 15 (30.6%) | 4.47 |
| Total Families | 49 (100.0%) | 3.45 |
Median Household Size in Kaktovik
The median household size in Kaktovik is 3.21 persons per household, with married-couple households (4 | 6.6%) accounting for the largest median household size of 9.5 persons per household. non-family households (12 | 19.7%) represent the smallest median household size with 1.17 persons per household.
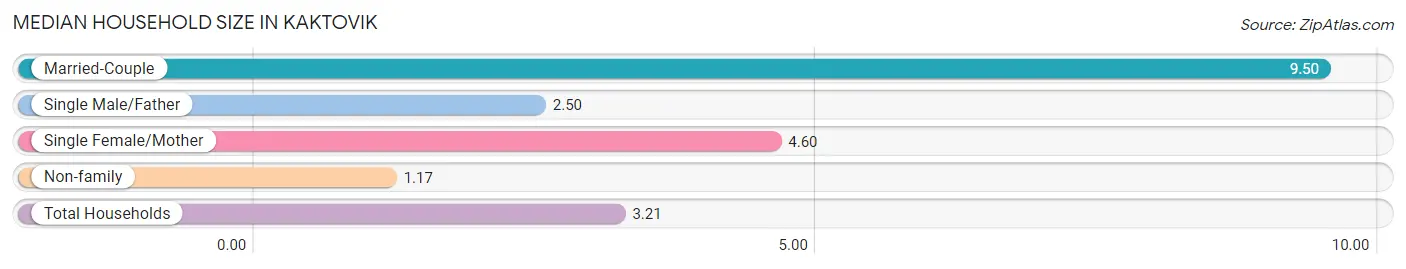
| Household Type | # Households | Household Size |
| Married-Couple | 4 (6.6%) | 9.50 |
| Single Male/Father | 30 (49.2%) | 2.50 |
| Single Female/Mother | 15 (24.6%) | 4.60 |
| Non-family | 12 (19.7%) | 1.17 |
| Total Households | 61 (100.0%) | 3.21 |
Household Size by Marriage Status in Kaktovik
Out of a total of 61 households in Kaktovik, 49 (80.3%) are family households, while 12 (19.7%) are nonfamily households. The most numerous type of family households are 7+ person households, comprising 14, and the most common type of nonfamily households are 1-person households, comprising 8.
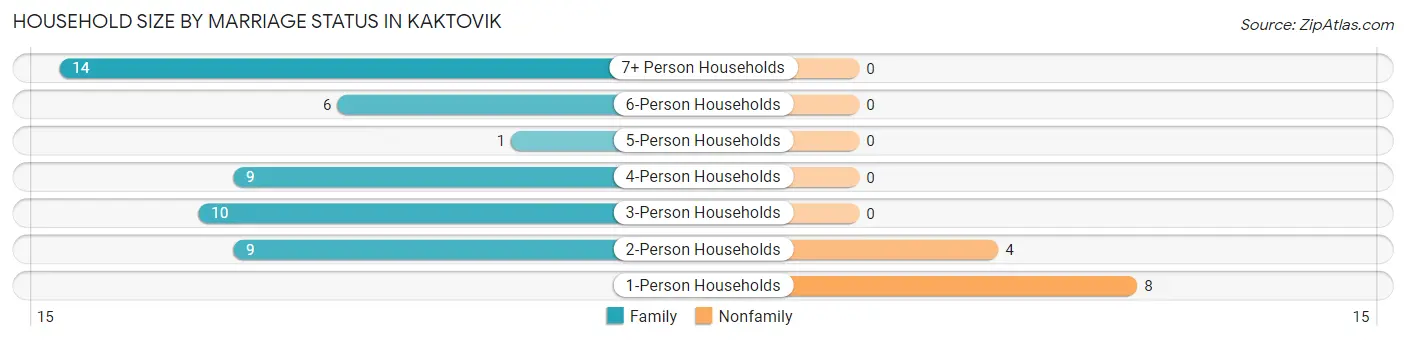
| Household Size | Family Households | Nonfamily Households |
| 1-Person Households | - | 8 (13.1%) |
| 2-Person Households | 9 (14.7%) | 4 (6.6%) |
| 3-Person Households | 10 (16.4%) | 0 (0.0%) |
| 4-Person Households | 9 (14.7%) | 0 (0.0%) |
| 5-Person Households | 1 (1.6%) | 0 (0.0%) |
| 6-Person Households | 6 (9.8%) | 0 (0.0%) |
| 7+ Person Households | 14 (23.0%) | 0 (0.0%) |
| Total | 49 (80.3%) | 12 (19.7%) |
Female Fertility in Kaktovik
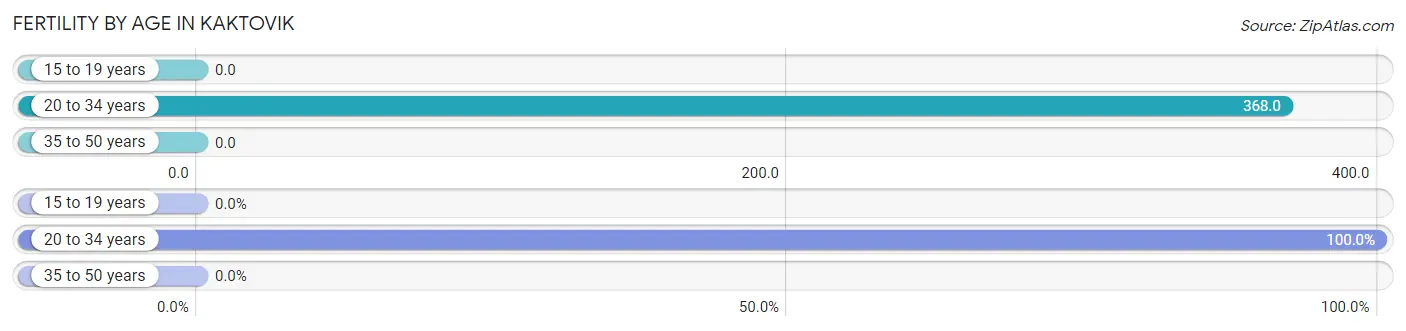
Fertility by Age in Kaktovik
Average fertility rate in Kaktovik is 137.0 births per 1,000 women. Women in the age bracket of 20 to 34 years have the highest fertility rate with 368.0 births per 1,000 women. Women in the age bracket of 20 to 34 years acount for 100.0% of all women with births.
| Age Bracket | Women with Births | Births / 1,000 Women |
| 15 to 19 years | 0 (0.0%) | 0.0 |
| 20 to 34 years | 7 (100.0%) | 368.0 |
| 35 to 50 years | 0 (0.0%) | 0.0 |
| Total | 7 (100.0%) | 137.0 |
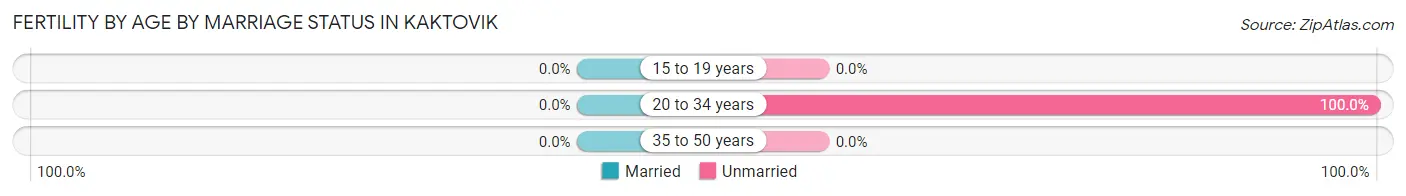
Fertility by Age by Marriage Status in Kaktovik
| Age Bracket | Married | Unmarried |
| 15 to 19 years | 0 (0.0%) | 0 (0.0%) |
| 20 to 34 years | 0 (0.0%) | 7 (100.0%) |
| 35 to 50 years | 0 (0.0%) | 0 (0.0%) |
| Total | 0 (0.0%) | 7 (100.0%) |
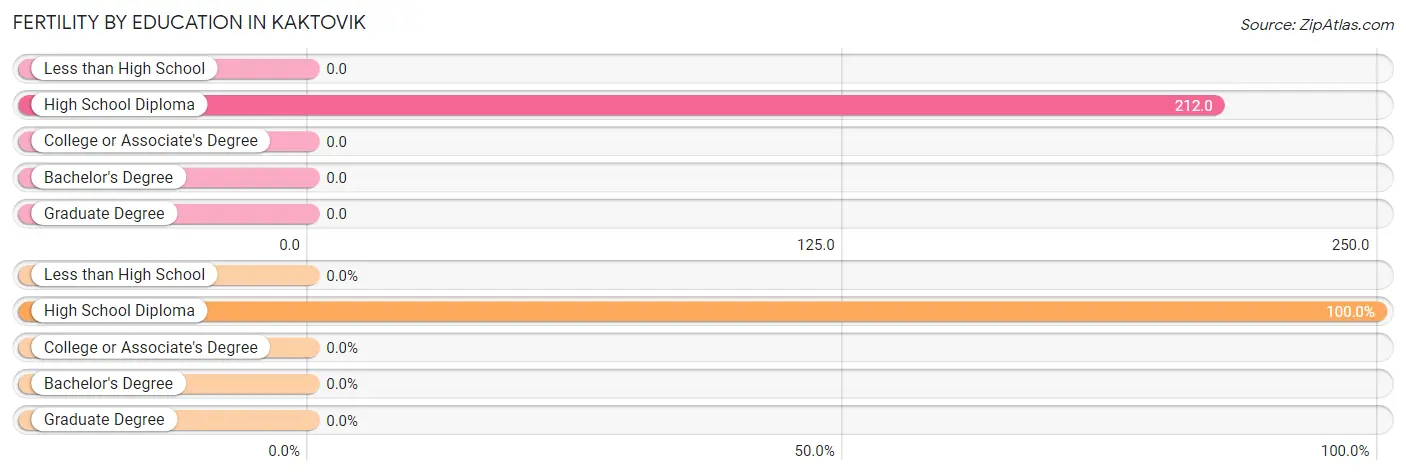
Fertility by Education in Kaktovik
| Educational Attainment | Women with Births | Births / 1,000 Women |
| Less than High School | 0 (0.0%) | 0.0 |
| High School Diploma | 7 (100.0%) | 212.0 |
| College or Associate's Degree | 0 (0.0%) | 0.0 |
| Bachelor's Degree | 0 (0.0%) | 0.0 |
| Graduate Degree | 0 (0.0%) | 0.0 |
| Total | 7 (100.0%) | 137.0 |
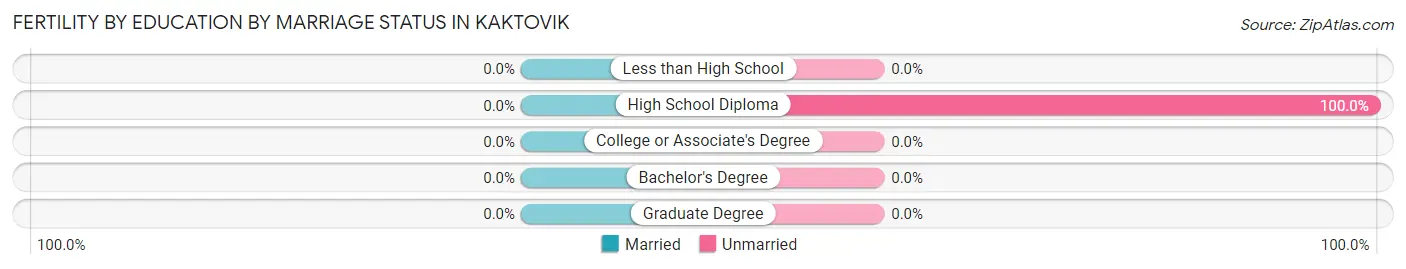
Fertility by Education by Marriage Status in Kaktovik
| Educational Attainment | Married | Unmarried |
| Less than High School | 0 (0.0%) | 0 (0.0%) |
| High School Diploma | 0 (0.0%) | 7 (100.0%) |
| College or Associate's Degree | 0 (0.0%) | 0 (0.0%) |
| Bachelor's Degree | 0 (0.0%) | 0 (0.0%) |
| Graduate Degree | 0 (0.0%) | 0 (0.0%) |
| Total | 0 (0.0%) | 7 (100.0%) |
Employment Characteristics in Kaktovik
Employment by Class of Employer in Kaktovik
Among the 64 employed individuals in Kaktovik, local government employees (32 | 50.0%), private company employees (19 | 29.7%), and federal government employees (7 | 10.9%) make up the most common classes of employment.
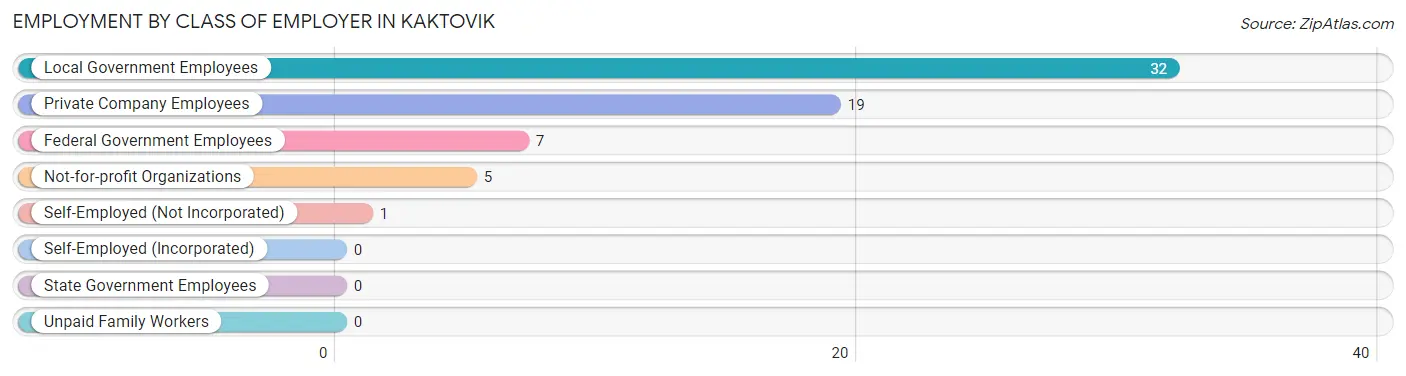
| Employer Class | # Employees | % Employees |
| Private Company Employees | 19 | 29.7% |
| Self-Employed (Incorporated) | 0 | 0.0% |
| Self-Employed (Not Incorporated) | 1 | 1.6% |
| Not-for-profit Organizations | 5 | 7.8% |
| Local Government Employees | 32 | 50.0% |
| State Government Employees | 0 | 0.0% |
| Federal Government Employees | 7 | 10.9% |
| Unpaid Family Workers | 0 | 0.0% |
| Total | 64 | 100.0% |
Employment Status by Age in Kaktovik
According to the labor force statistics for Kaktovik, out of the total population over 16 years of age (153), 61.4% or 94 individuals are in the labor force, with 16.9% or 16 of them unemployed. The age group with the highest labor force participation rate is 30 to 34 years, with 100.0% or 17 individuals in the labor force. Within the labor force, the 20 to 24 years age range has the highest percentage of unemployed individuals, with 58.3% or 10 of them being unemployed.
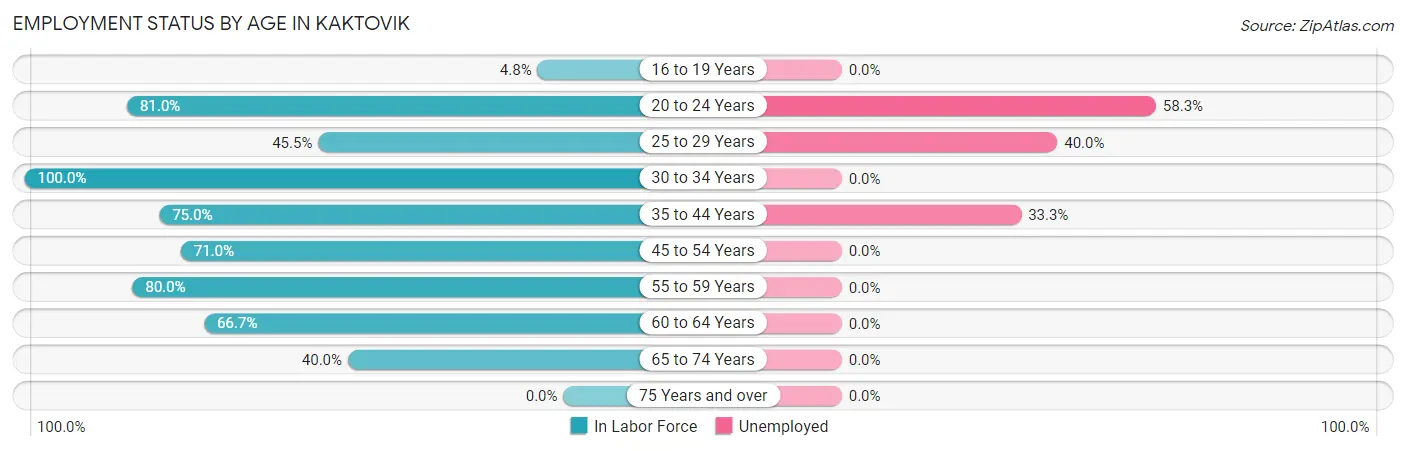
| Age Bracket | In Labor Force | Unemployed |
| 16 to 19 Years | 1 (4.8%) | 0 (0.0%) |
| 20 to 24 Years | 17 (81.0%) | 10 (58.3%) |
| 25 to 29 Years | 5 (45.5%) | 2 (40.0%) |
| 30 to 34 Years | 17 (100.0%) | 0 (0.0%) |
| 35 to 44 Years | 18 (75.0%) | 6 (33.3%) |
| 45 to 54 Years | 22 (71.0%) | 0 (0.0%) |
| 55 to 59 Years | 4 (80.0%) | 0 (0.0%) |
| 60 to 64 Years | 8 (66.7%) | 0 (0.0%) |
| 65 to 74 Years | 2 (40.0%) | 0 (0.0%) |
| 75 Years and over | 0 (0.0%) | 0 (0.0%) |
| Total | 94 (61.4%) | 16 (16.9%) |
Employment Status by Educational Attainment in Kaktovik
According to labor force statistics for Kaktovik, 74.0% of individuals (74) out of the total population between 25 and 64 years of age (100) are in the labor force, with 10.8% or 8 of them being unemployed. The group with the highest labor force participation rate are those with the educational attainment of college / associate degree, with 96.2% or 25 individuals in the labor force. Within the labor force, individuals with high school diploma education have the highest percentage of unemployment, with 12.5% or 6 of them being unemployed.
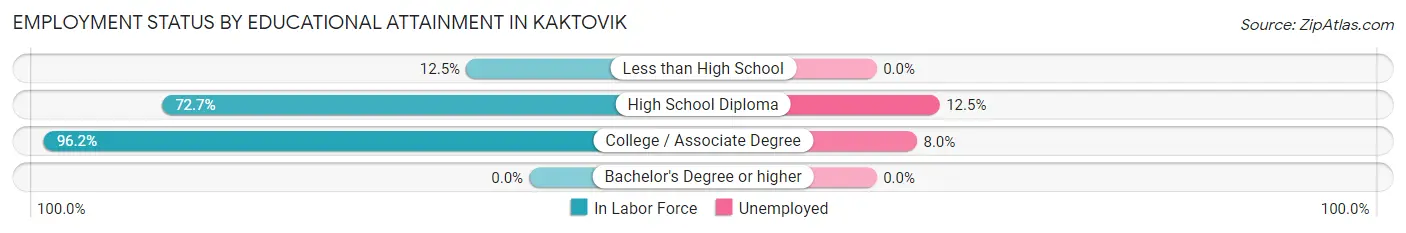
| Educational Attainment | In Labor Force | Unemployed |
| Less than High School | 1 (12.5%) | 0 (0.0%) |
| High School Diploma | 48 (72.7%) | 8 (12.5%) |
| College / Associate Degree | 25 (96.2%) | 2 (8.0%) |
| Bachelor's Degree or higher | 0 (0.0%) | 0 (0.0%) |
| Total | 74 (74.0%) | 11 (10.8%) |
Employment Occupations by Sex in Kaktovik
Management, Business, Science and Arts Occupations
The most common Management, Business, Science and Arts occupations in Kaktovik are Management (4 | 5.4%), and Business & Financial (1 | 1.3%).
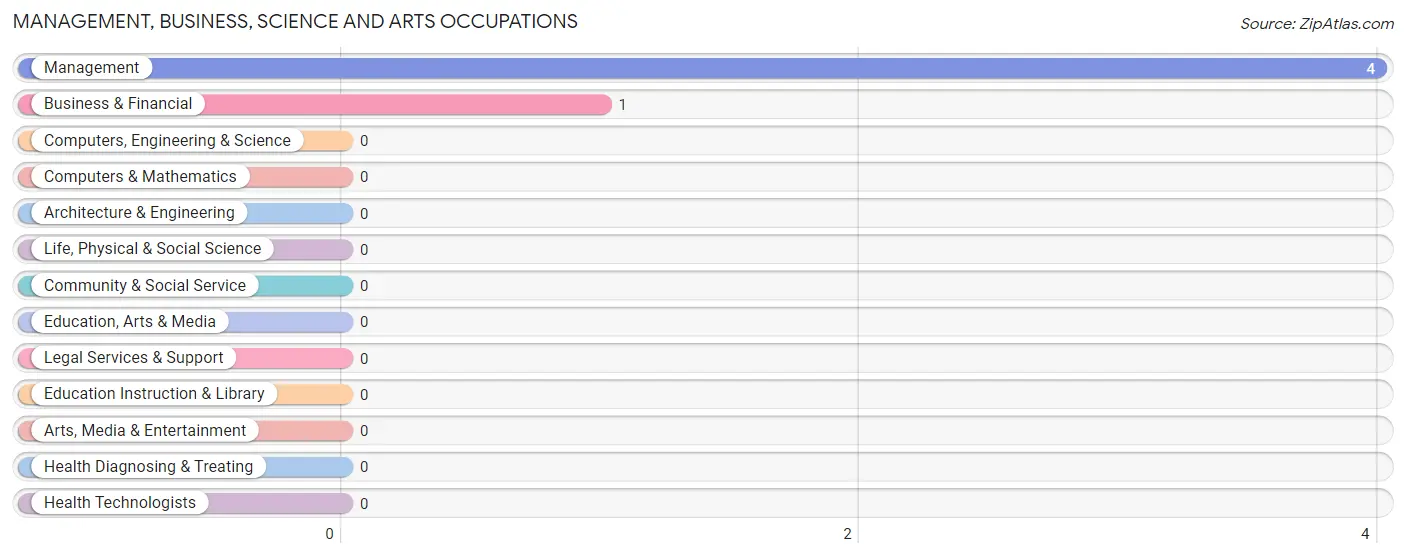
Management, Business, Science and Arts Occupations by Sex
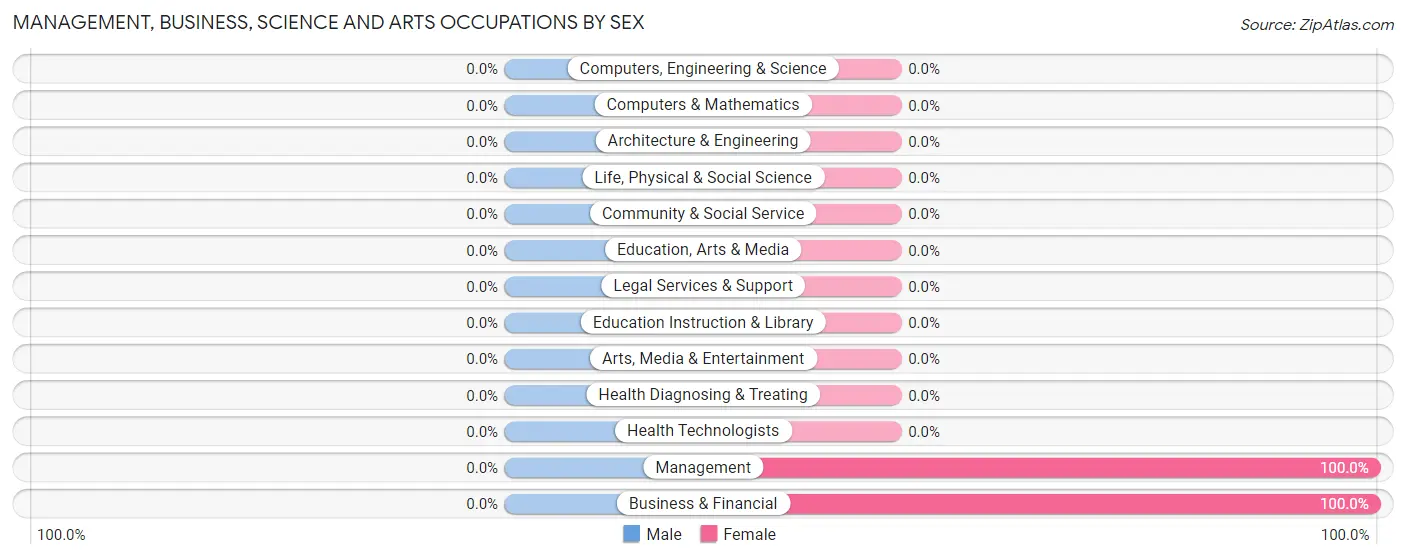
| Occupation | Male | Female |
| Management | 0 (0.0%) | 4 (100.0%) |
| Business & Financial | 0 (0.0%) | 1 (100.0%) |
| Computers, Engineering & Science | 0 (0.0%) | 0 (0.0%) |
| Computers & Mathematics | 0 (0.0%) | 0 (0.0%) |
| Architecture & Engineering | 0 (0.0%) | 0 (0.0%) |
| Life, Physical & Social Science | 0 (0.0%) | 0 (0.0%) |
| Community & Social Service | 0 (0.0%) | 0 (0.0%) |
| Education, Arts & Media | 0 (0.0%) | 0 (0.0%) |
| Legal Services & Support | 0 (0.0%) | 0 (0.0%) |
| Education Instruction & Library | 0 (0.0%) | 0 (0.0%) |
| Arts, Media & Entertainment | 0 (0.0%) | 0 (0.0%) |
| Health Diagnosing & Treating | 0 (0.0%) | 0 (0.0%) |
| Health Technologists | 0 (0.0%) | 0 (0.0%) |
| Total (Category) | 0 (0.0%) | 5 (100.0%) |
| Total (Overall) | 47 (63.5%) | 27 (36.5%) |
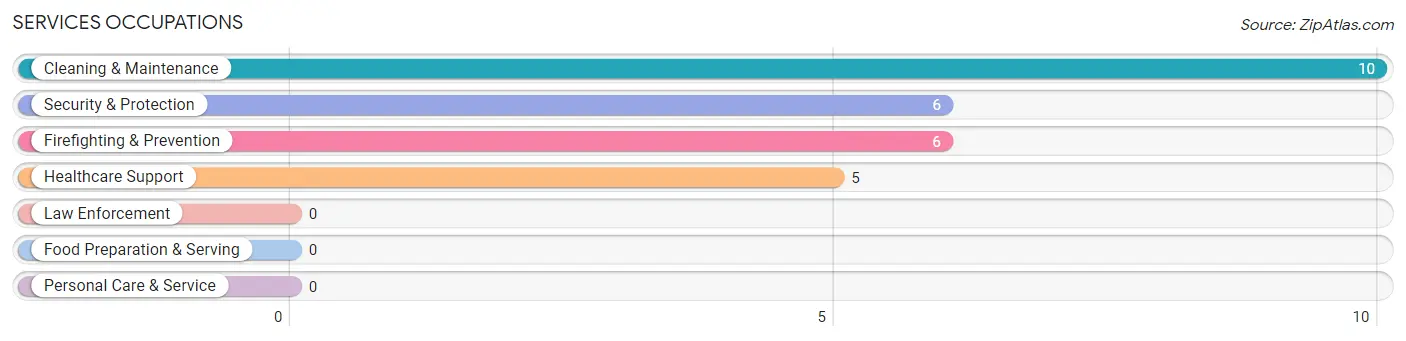
Services Occupations
The most common Services occupations in Kaktovik are Cleaning & Maintenance (10 | 13.5%), Security & Protection (6 | 8.1%), Firefighting & Prevention (6 | 8.1%), and Healthcare Support (5 | 6.8%).
Services Occupations by Sex
Within the Services occupations in Kaktovik, the most male-oriented occupations are Security & Protection (100.0%), Firefighting & Prevention (100.0%), and Cleaning & Maintenance (20.0%), while the most female-oriented occupations are Healthcare Support (100.0%), and Cleaning & Maintenance (80.0%).
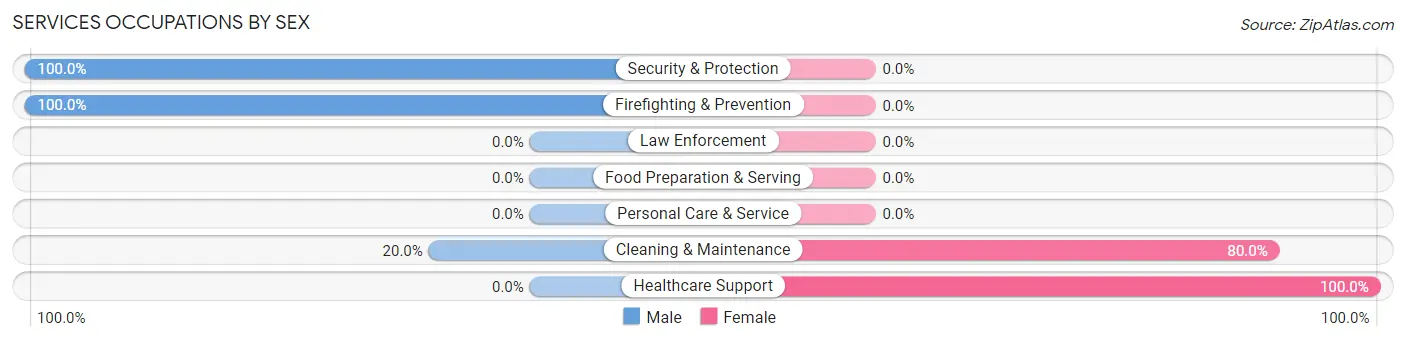
| Occupation | Male | Female |
| Healthcare Support | 0 (0.0%) | 5 (100.0%) |
| Security & Protection | 6 (100.0%) | 0 (0.0%) |
| Firefighting & Prevention | 6 (100.0%) | 0 (0.0%) |
| Law Enforcement | 0 (0.0%) | 0 (0.0%) |
| Food Preparation & Serving | 0 (0.0%) | 0 (0.0%) |
| Cleaning & Maintenance | 2 (20.0%) | 8 (80.0%) |
| Personal Care & Service | 0 (0.0%) | 0 (0.0%) |
| Total (Category) | 8 (38.1%) | 13 (61.9%) |
| Total (Overall) | 47 (63.5%) | 27 (36.5%) |
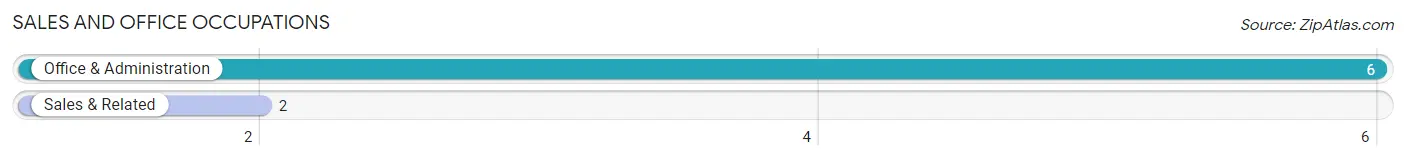
Sales and Office Occupations
The most common Sales and Office occupations in Kaktovik are Office & Administration (6 | 8.1%), and Sales & Related (2 | 2.7%).
Sales and Office Occupations by Sex
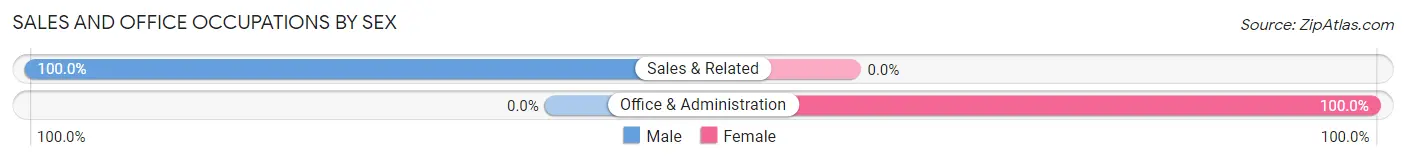
| Occupation | Male | Female |
| Sales & Related | 2 (100.0%) | 0 (0.0%) |
| Office & Administration | 0 (0.0%) | 6 (100.0%) |
| Total (Category) | 2 (25.0%) | 6 (75.0%) |
| Total (Overall) | 47 (63.5%) | 27 (36.5%) |
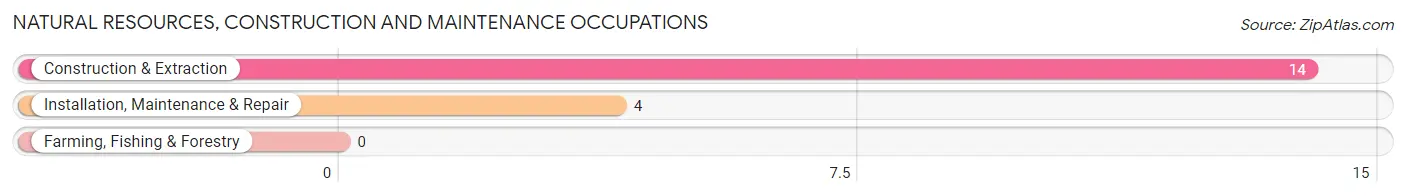
Natural Resources, Construction and Maintenance Occupations
The most common Natural Resources, Construction and Maintenance occupations in Kaktovik are Construction & Extraction (14 | 18.9%), and Installation, Maintenance & Repair (4 | 5.4%).
Natural Resources, Construction and Maintenance Occupations by Sex
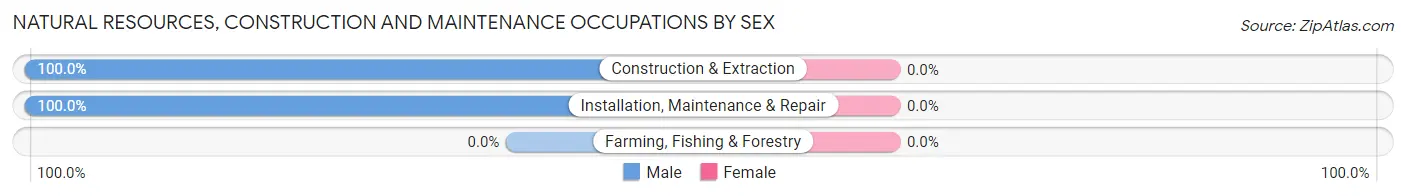
| Occupation | Male | Female |
| Farming, Fishing & Forestry | 0 (0.0%) | 0 (0.0%) |
| Construction & Extraction | 14 (100.0%) | 0 (0.0%) |
| Installation, Maintenance & Repair | 4 (100.0%) | 0 (0.0%) |
| Total (Category) | 18 (100.0%) | 0 (0.0%) |
| Total (Overall) | 47 (63.5%) | 27 (36.5%) |
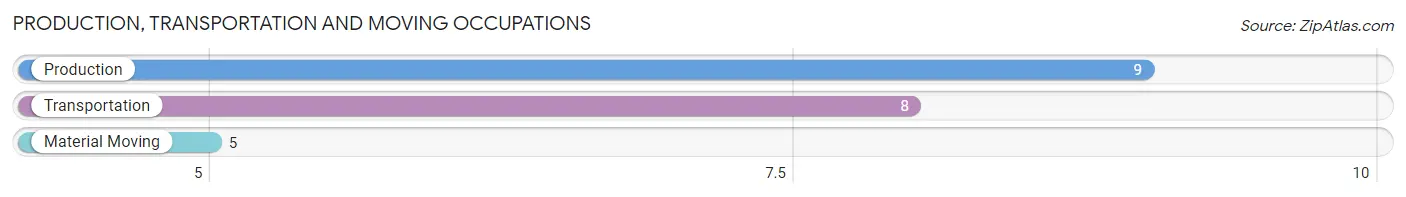
Production, Transportation and Moving Occupations
The most common Production, Transportation and Moving occupations in Kaktovik are Production (9 | 12.2%), Transportation (8 | 10.8%), and Material Moving (5 | 6.8%).
Production, Transportation and Moving Occupations by Sex
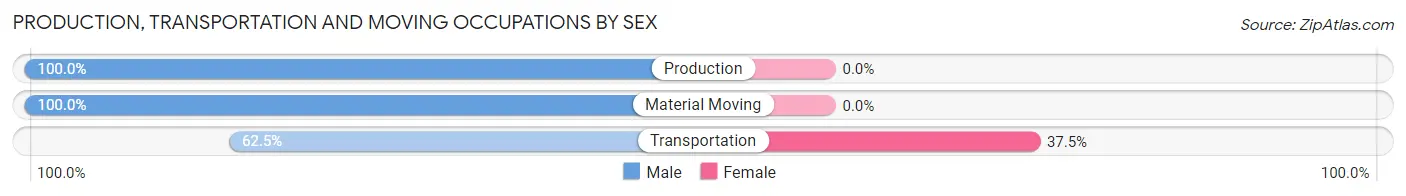
| Occupation | Male | Female |
| Production | 9 (100.0%) | 0 (0.0%) |
| Transportation | 5 (62.5%) | 3 (37.5%) |
| Material Moving | 5 (100.0%) | 0 (0.0%) |
| Total (Category) | 19 (86.4%) | 3 (13.6%) |
| Total (Overall) | 47 (63.5%) | 27 (36.5%) |
Employment Industries by Sex in Kaktovik
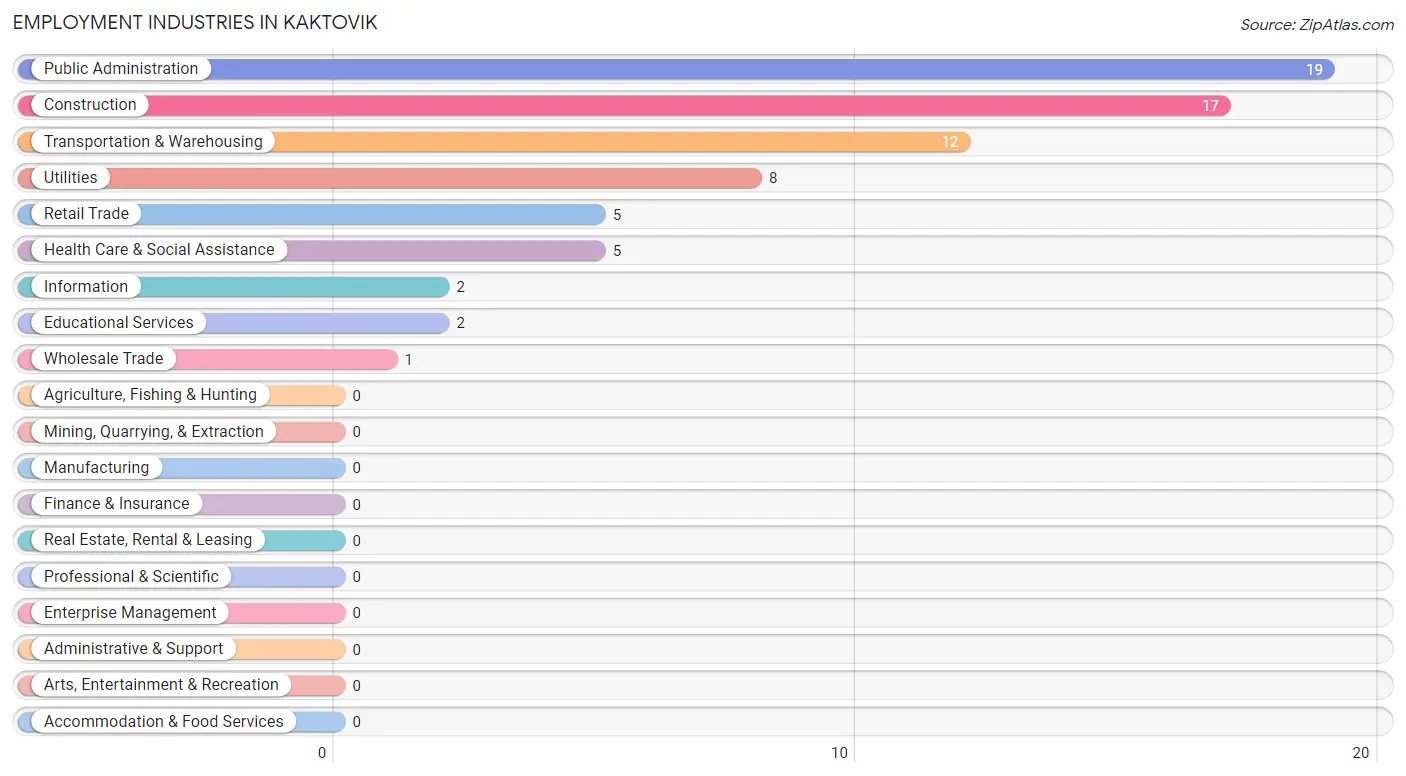
Employment Industries in Kaktovik
The major employment industries in Kaktovik include Public Administration (19 | 25.7%), Construction (17 | 23.0%), Transportation & Warehousing (12 | 16.2%), Utilities (8 | 10.8%), and Retail Trade (5 | 6.8%).
Employment Industries by Sex in Kaktovik
The Kaktovik industries that see more men than women are Wholesale Trade (100.0%), Retail Trade (100.0%), and Utilities (100.0%), whereas the industries that tend to have a higher number of women are Health Care & Social Assistance (100.0%), Public Administration (68.4%), and Transportation & Warehousing (41.7%).
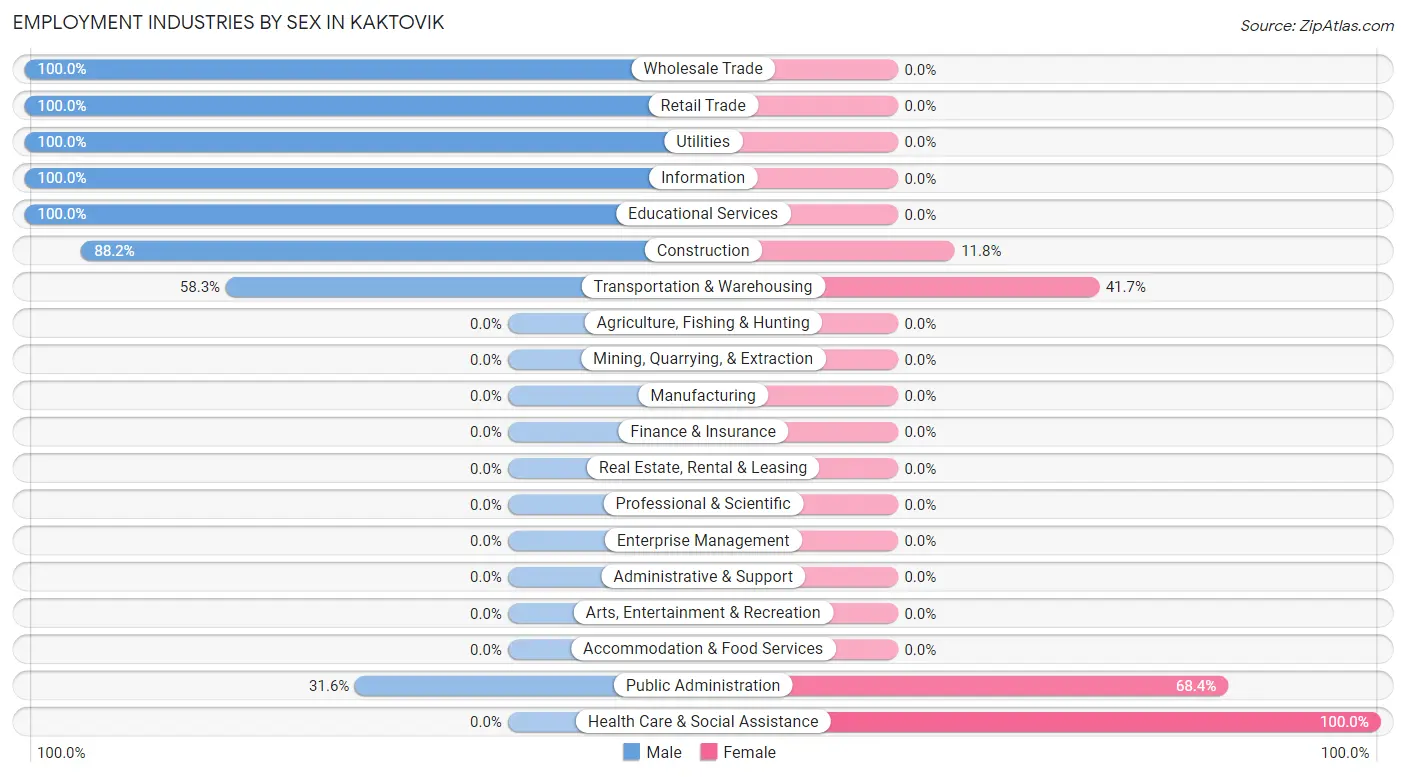
| Industry | Male | Female |
| Agriculture, Fishing & Hunting | 0 (0.0%) | 0 (0.0%) |
| Mining, Quarrying, & Extraction | 0 (0.0%) | 0 (0.0%) |
| Construction | 15 (88.2%) | 2 (11.8%) |
| Manufacturing | 0 (0.0%) | 0 (0.0%) |
| Wholesale Trade | 1 (100.0%) | 0 (0.0%) |
| Retail Trade | 5 (100.0%) | 0 (0.0%) |
| Transportation & Warehousing | 7 (58.3%) | 5 (41.7%) |
| Utilities | 8 (100.0%) | 0 (0.0%) |
| Information | 2 (100.0%) | 0 (0.0%) |
| Finance & Insurance | 0 (0.0%) | 0 (0.0%) |
| Real Estate, Rental & Leasing | 0 (0.0%) | 0 (0.0%) |
| Professional & Scientific | 0 (0.0%) | 0 (0.0%) |
| Enterprise Management | 0 (0.0%) | 0 (0.0%) |
| Administrative & Support | 0 (0.0%) | 0 (0.0%) |
| Educational Services | 2 (100.0%) | 0 (0.0%) |
| Health Care & Social Assistance | 0 (0.0%) | 5 (100.0%) |
| Arts, Entertainment & Recreation | 0 (0.0%) | 0 (0.0%) |
| Accommodation & Food Services | 0 (0.0%) | 0 (0.0%) |
| Public Administration | 6 (31.6%) | 13 (68.4%) |
| Total | 47 (63.5%) | 27 (36.5%) |
Education in Kaktovik
School Enrollment in Kaktovik
The most common levels of schooling among the 46 students in Kaktovik are high school (18 | 39.1%), elementary school (10 | 21.7%), and middle school (10 | 21.7%).
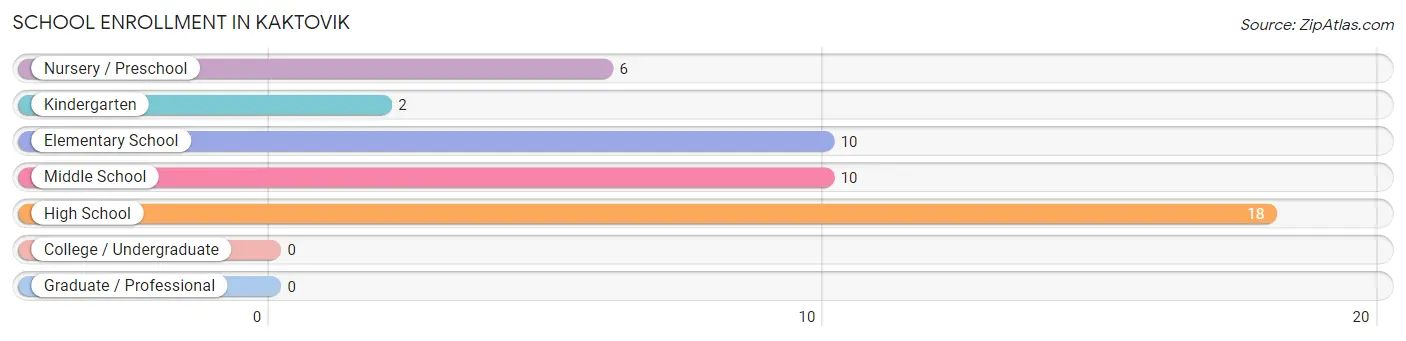
| School Level | # Students | % Students |
| Nursery / Preschool | 6 | 13.0% |
| Kindergarten | 2 | 4.3% |
| Elementary School | 10 | 21.7% |
| Middle School | 10 | 21.7% |
| High School | 18 | 39.1% |
| College / Undergraduate | 0 | 0.0% |
| Graduate / Professional | 0 | 0.0% |
| Total | 46 | 100.0% |
School Enrollment by Age by Funding Source in Kaktovik
Out of a total of 46 students who are enrolled in schools in Kaktovik, 2 (4.3%) attend a private institution, while the remaining 44 (95.7%) are enrolled in public schools. The age group of 5 to 9 year old has the highest likelihood of being enrolled in private schools, with 2 (14.3% in the age bracket) enrolled. Conversely, the age group of 3 to 4 year olds has the lowest likelihood of being enrolled in a private school, with 2 (100.0% in the age bracket) attending a public institution.
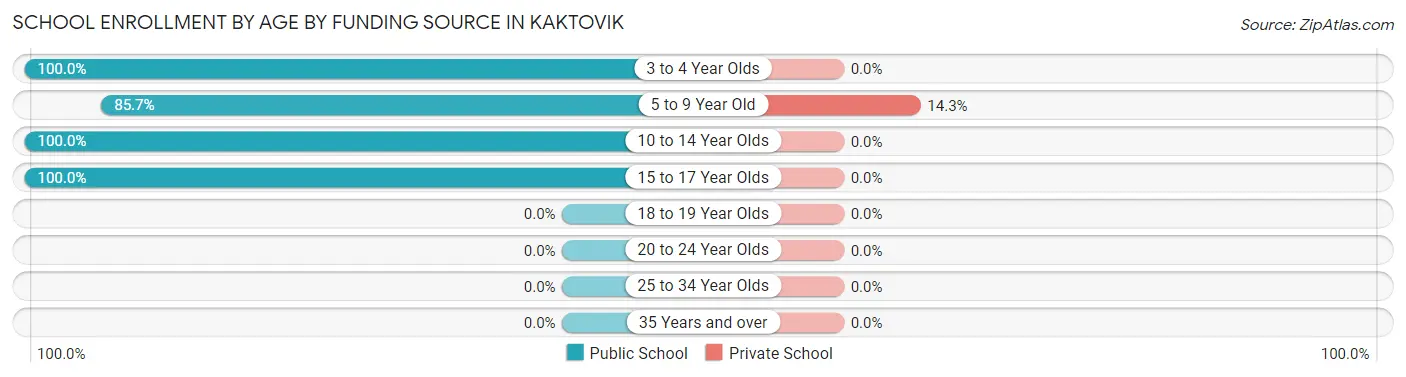
| Age Bracket | Public School | Private School |
| 3 to 4 Year Olds | 2 (100.0%) | 0 (0.0%) |
| 5 to 9 Year Old | 12 (85.7%) | 2 (14.3%) |
| 10 to 14 Year Olds | 16 (100.0%) | 0 (0.0%) |
| 15 to 17 Year Olds | 14 (100.0%) | 0 (0.0%) |
| 18 to 19 Year Olds | 0 (0.0%) | 0 (0.0%) |
| 20 to 24 Year Olds | 0 (0.0%) | 0 (0.0%) |
| 25 to 34 Year Olds | 0 (0.0%) | 0 (0.0%) |
| 35 Years and over | 0 (0.0%) | 0 (0.0%) |
| Total | 44 (95.7%) | 2 (4.3%) |
Educational Attainment by Field of Study in Kaktovik
| Field of Study | # Graduates | % Graduates |
| Computers & Mathematics | 0 | 0.0% |
| Bio, Nature & Agricultural | 0 | 0.0% |
| Physical & Health Sciences | 0 | 0.0% |
| Psychology | 0 | 0.0% |
| Social Sciences | 0 | 0.0% |
| Engineering | 0 | 0.0% |
| Multidisciplinary Studies | 0 | 0.0% |
| Science & Technology | 0 | 0.0% |
| Business | 0 | 0.0% |
| Education | 0 | 0.0% |
| Literature & Languages | 0 | 0.0% |
| Liberal Arts & History | 0 | 0.0% |
| Visual & Performing Arts | 0 | 0.0% |
| Communications | 0 | 0.0% |
| Arts & Humanities | 0 | 0.0% |
| Total | 0 | 0.0% |
Transportation & Commute in Kaktovik
Vehicle Availability by Sex in Kaktovik
The most prevalent vehicle ownership categories in Kaktovik are males with no vehicle (19, accounting for 54.3%) and females with no vehicle (7, making up 79.2%).
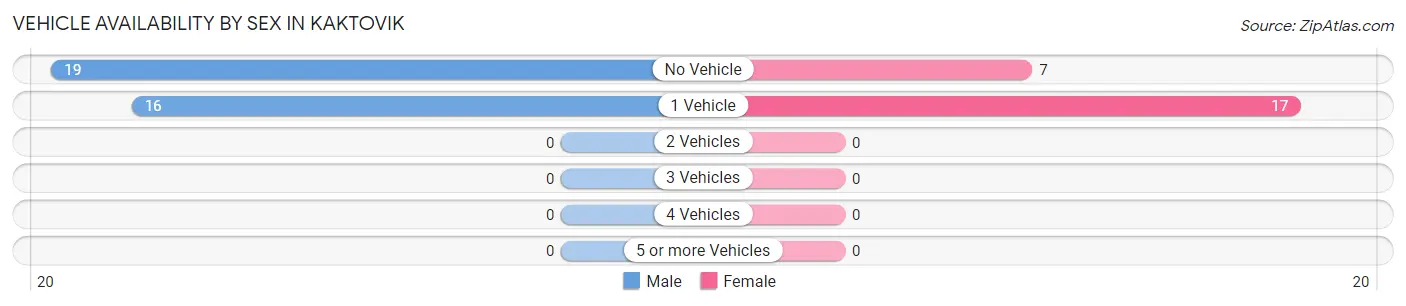
| Vehicles Available | Male | Female |
| No Vehicle | 19 (54.3%) | 7 (29.2%) |
| 1 Vehicle | 16 (45.7%) | 17 (70.8%) |
| 2 Vehicles | 0 (0.0%) | 0 (0.0%) |
| 3 Vehicles | 0 (0.0%) | 0 (0.0%) |
| 4 Vehicles | 0 (0.0%) | 0 (0.0%) |
| 5 or more Vehicles | 0 (0.0%) | 0 (0.0%) |
| Total | 35 (100.0%) | 24 (100.0%) |
Commute Time in Kaktovik
The most frequently occuring commute durations in Kaktovik are less than 5 minutes (42 commuters, 66.7%), 5 to 9 minutes (11 commuters, 17.5%), and 10 to 14 minutes (10 commuters, 15.9%).
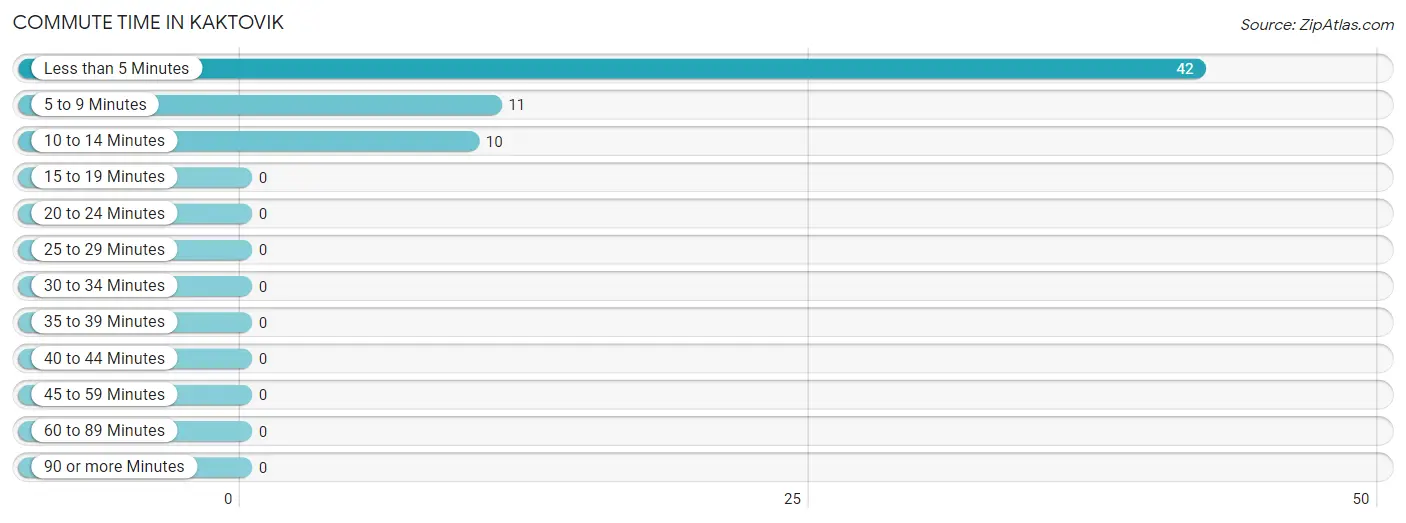
| Commute Time | # Commuters | % Commuters |
| Less than 5 Minutes | 42 | 66.7% |
| 5 to 9 Minutes | 11 | 17.5% |
| 10 to 14 Minutes | 10 | 15.9% |
| 15 to 19 Minutes | 0 | 0.0% |
| 20 to 24 Minutes | 0 | 0.0% |
| 25 to 29 Minutes | 0 | 0.0% |
| 30 to 34 Minutes | 0 | 0.0% |
| 35 to 39 Minutes | 0 | 0.0% |
| 40 to 44 Minutes | 0 | 0.0% |
| 45 to 59 Minutes | 0 | 0.0% |
| 60 to 89 Minutes | 0 | 0.0% |
| 90 or more Minutes | 0 | 0.0% |
Commute Time by Sex in Kaktovik
The most common commute times in Kaktovik are less than 5 minutes (25 commuters, 64.1%) for males and less than 5 minutes (17 commuters, 70.8%) for females.
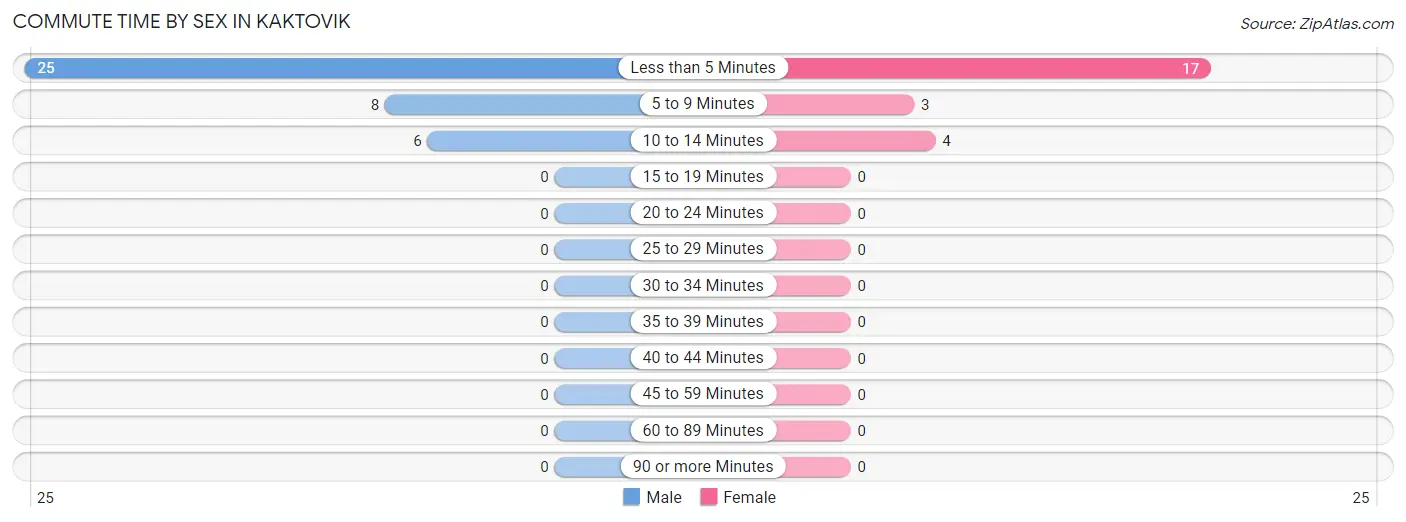
| Commute Time | Male | Female |
| Less than 5 Minutes | 25 (64.1%) | 17 (70.8%) |
| 5 to 9 Minutes | 8 (20.5%) | 3 (12.5%) |
| 10 to 14 Minutes | 6 (15.4%) | 4 (16.7%) |
| 15 to 19 Minutes | 0 (0.0%) | 0 (0.0%) |
| 20 to 24 Minutes | 0 (0.0%) | 0 (0.0%) |
| 25 to 29 Minutes | 0 (0.0%) | 0 (0.0%) |
| 30 to 34 Minutes | 0 (0.0%) | 0 (0.0%) |
| 35 to 39 Minutes | 0 (0.0%) | 0 (0.0%) |
| 40 to 44 Minutes | 0 (0.0%) | 0 (0.0%) |
| 45 to 59 Minutes | 0 (0.0%) | 0 (0.0%) |
| 60 to 89 Minutes | 0 (0.0%) | 0 (0.0%) |
| 90 or more Minutes | 0 (0.0%) | 0 (0.0%) |
Time of Departure to Work by Sex in Kaktovik
The most frequent times of departure to work in Kaktovik are 8:00 AM to 8:29 AM (19, 48.7%) for males and 8:00 AM to 8:29 AM (13, 54.2%) for females.
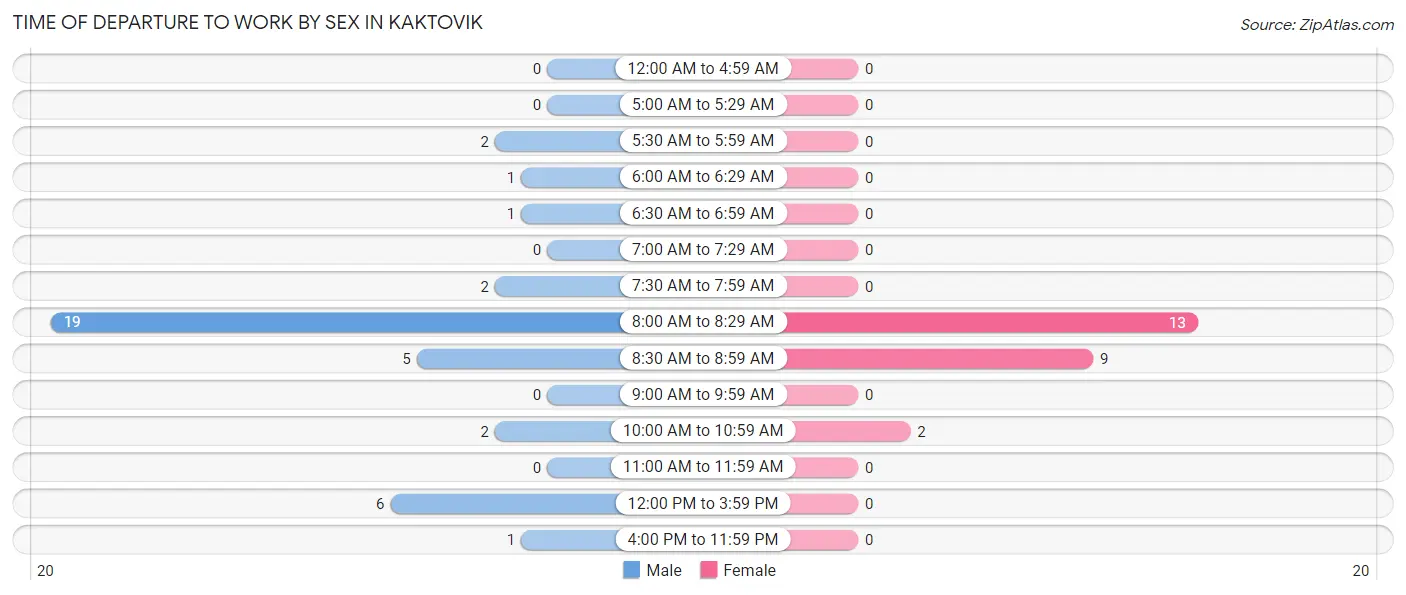
| Time of Departure | Male | Female |
| 12:00 AM to 4:59 AM | 0 (0.0%) | 0 (0.0%) |
| 5:00 AM to 5:29 AM | 0 (0.0%) | 0 (0.0%) |
| 5:30 AM to 5:59 AM | 2 (5.1%) | 0 (0.0%) |
| 6:00 AM to 6:29 AM | 1 (2.6%) | 0 (0.0%) |
| 6:30 AM to 6:59 AM | 1 (2.6%) | 0 (0.0%) |
| 7:00 AM to 7:29 AM | 0 (0.0%) | 0 (0.0%) |
| 7:30 AM to 7:59 AM | 2 (5.1%) | 0 (0.0%) |
| 8:00 AM to 8:29 AM | 19 (48.7%) | 13 (54.2%) |
| 8:30 AM to 8:59 AM | 5 (12.8%) | 9 (37.5%) |
| 9:00 AM to 9:59 AM | 0 (0.0%) | 0 (0.0%) |
| 10:00 AM to 10:59 AM | 2 (5.1%) | 2 (8.3%) |
| 11:00 AM to 11:59 AM | 0 (0.0%) | 0 (0.0%) |
| 12:00 PM to 3:59 PM | 6 (15.4%) | 0 (0.0%) |
| 4:00 PM to 11:59 PM | 1 (2.6%) | 0 (0.0%) |
| Total | 39 (100.0%) | 24 (100.0%) |
Housing Occupancy in Kaktovik
Occupancy by Ownership in Kaktovik
Of the total 61 dwellings in Kaktovik, owner-occupied units account for 54 (88.5%), while renter-occupied units make up 7 (11.5%).
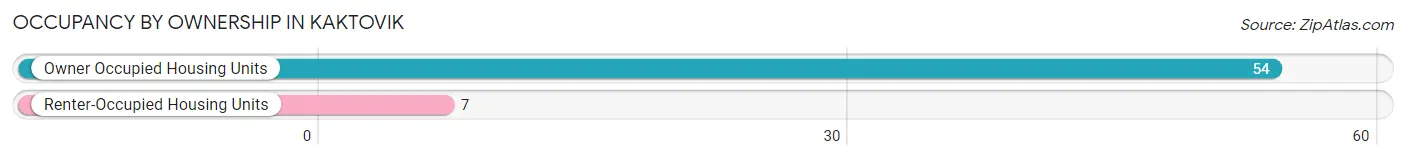
| Occupancy | # Housing Units | % Housing Units |
| Owner Occupied Housing Units | 54 | 88.5% |
| Renter-Occupied Housing Units | 7 | 11.5% |
| Total Occupied Housing Units | 61 | 100.0% |
Occupancy by Household Size in Kaktovik
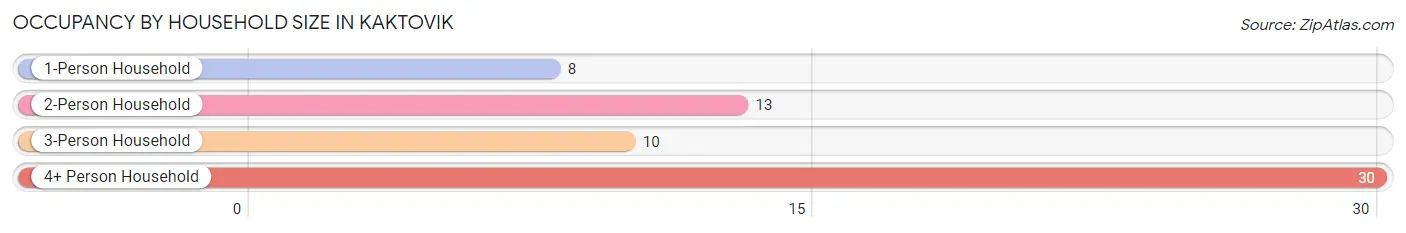
| Household Size | # Housing Units | % Housing Units |
| 1-Person Household | 8 | 13.1% |
| 2-Person Household | 13 | 21.3% |
| 3-Person Household | 10 | 16.4% |
| 4+ Person Household | 30 | 49.2% |
| Total Housing Units | 61 | 100.0% |
Occupancy by Ownership by Household Size in Kaktovik
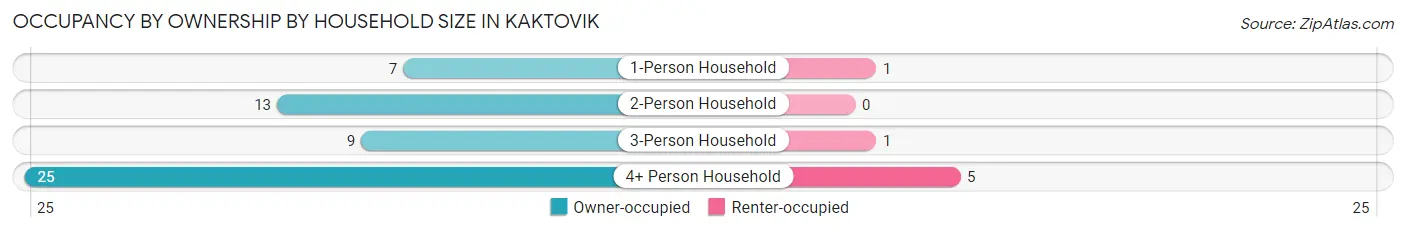
| Household Size | Owner-occupied | Renter-occupied |
| 1-Person Household | 7 (87.5%) | 1 (12.5%) |
| 2-Person Household | 13 (100.0%) | 0 (0.0%) |
| 3-Person Household | 9 (90.0%) | 1 (10.0%) |
| 4+ Person Household | 25 (83.3%) | 5 (16.7%) |
| Total Housing Units | 54 (88.5%) | 7 (11.5%) |
Occupancy by Educational Attainment in Kaktovik
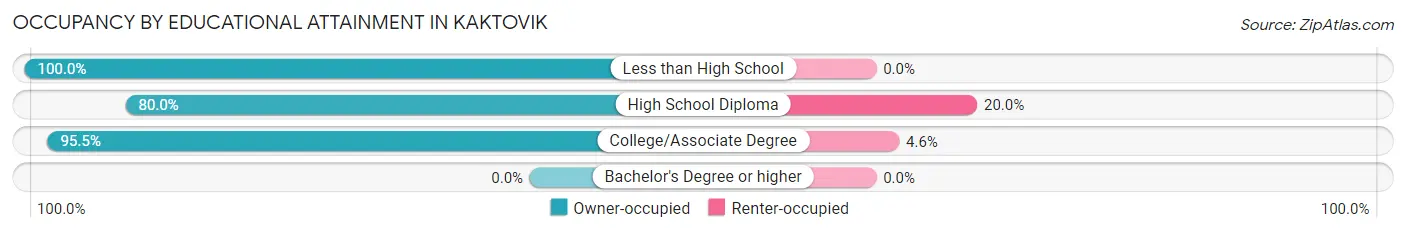
| Household Size | Owner-occupied | Renter-occupied |
| Less than High School | 9 (100.0%) | 0 (0.0%) |
| High School Diploma | 24 (80.0%) | 6 (20.0%) |
| College/Associate Degree | 21 (95.5%) | 1 (4.5%) |
| Bachelor's Degree or higher | 0 (0.0%) | 0 (0.0%) |
Occupancy by Age of Householder in Kaktovik
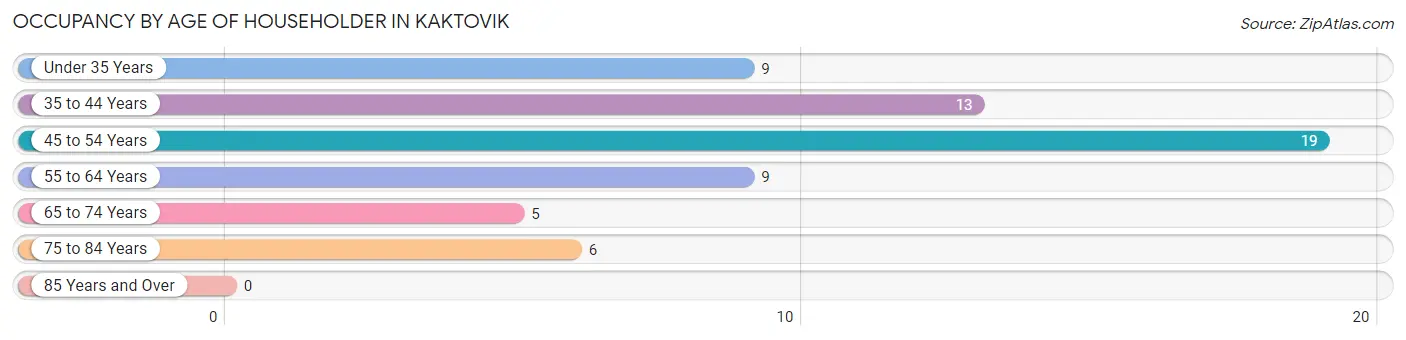
| Age Bracket | # Households | % Households |
| Under 35 Years | 9 | 14.7% |
| 35 to 44 Years | 13 | 21.3% |
| 45 to 54 Years | 19 | 31.1% |
| 55 to 64 Years | 9 | 14.7% |
| 65 to 74 Years | 5 | 8.2% |
| 75 to 84 Years | 6 | 9.8% |
| 85 Years and Over | 0 | 0.0% |
| Total | 61 | 100.0% |
Housing Finances in Kaktovik
Median Income by Occupancy in Kaktovik
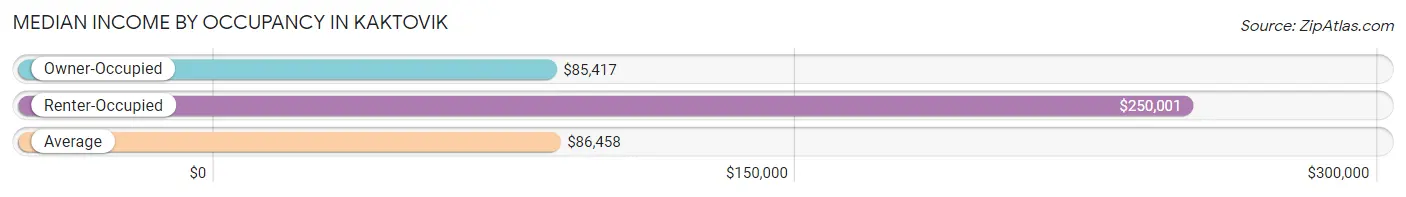
| Occupancy Type | # Households | Median Income |
| Owner-Occupied | 54 (88.5%) | $85,417 |
| Renter-Occupied | 7 (11.5%) | $250,001 |
| Average | 61 (100.0%) | $86,458 |
Occupancy by Householder Income Bracket in Kaktovik
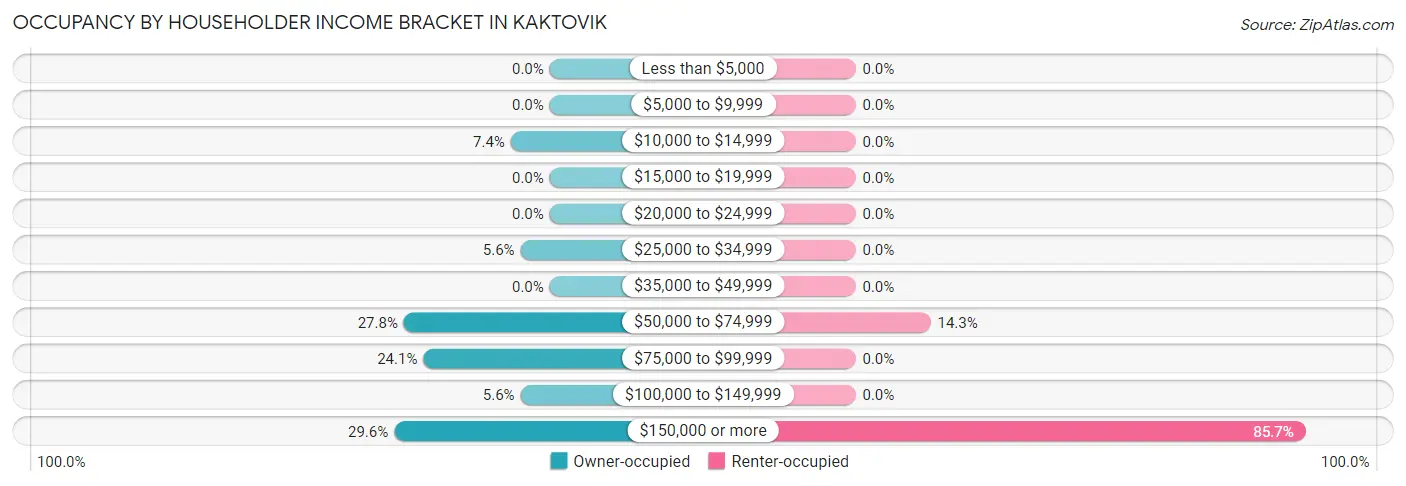
| Income Bracket | Owner-occupied | Renter-occupied |
| Less than $5,000 | 0 (0.0%) | 0 (0.0%) |
| $5,000 to $9,999 | 0 (0.0%) | 0 (0.0%) |
| $10,000 to $14,999 | 4 (7.4%) | 0 (0.0%) |
| $15,000 to $19,999 | 0 (0.0%) | 0 (0.0%) |
| $20,000 to $24,999 | 0 (0.0%) | 0 (0.0%) |
| $25,000 to $34,999 | 3 (5.6%) | 0 (0.0%) |
| $35,000 to $49,999 | 0 (0.0%) | 0 (0.0%) |
| $50,000 to $74,999 | 15 (27.8%) | 1 (14.3%) |
| $75,000 to $99,999 | 13 (24.1%) | 0 (0.0%) |
| $100,000 to $149,999 | 3 (5.6%) | 0 (0.0%) |
| $150,000 or more | 16 (29.6%) | 6 (85.7%) |
| Total | 54 (100.0%) | 7 (100.0%) |
Monthly Housing Cost Tiers in Kaktovik
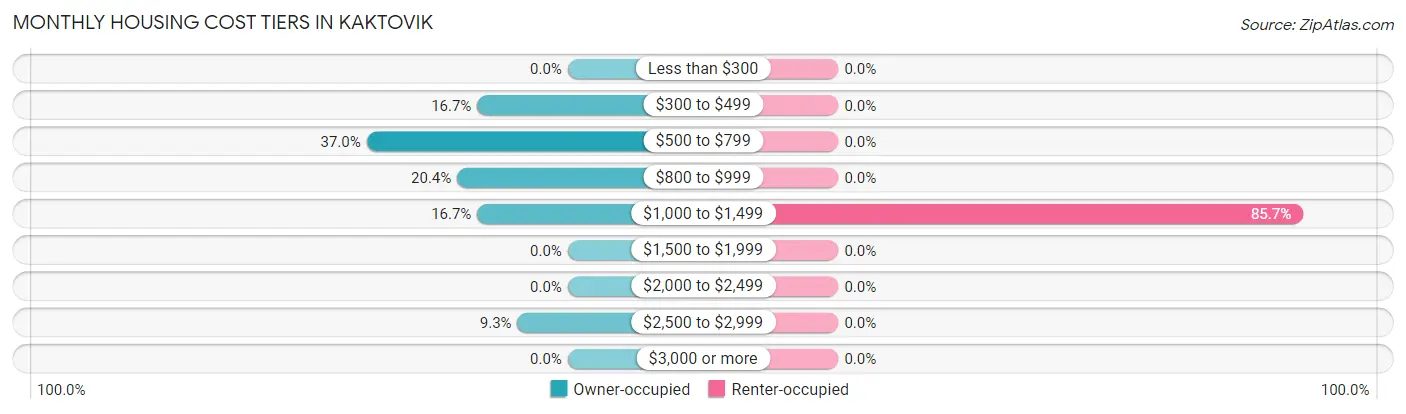
| Monthly Cost | Owner-occupied | Renter-occupied |
| Less than $300 | 0 (0.0%) | 0 (0.0%) |
| $300 to $499 | 9 (16.7%) | 0 (0.0%) |
| $500 to $799 | 20 (37.0%) | 0 (0.0%) |
| $800 to $999 | 11 (20.4%) | 0 (0.0%) |
| $1,000 to $1,499 | 9 (16.7%) | 6 (85.7%) |
| $1,500 to $1,999 | 0 (0.0%) | 0 (0.0%) |
| $2,000 to $2,499 | 0 (0.0%) | 0 (0.0%) |
| $2,500 to $2,999 | 5 (9.3%) | 0 (0.0%) |
| $3,000 or more | 0 (0.0%) | 0 (0.0%) |
| Total | 54 (100.0%) | 7 (100.0%) |
Physical Housing Characteristics in Kaktovik
Housing Structures in Kaktovik
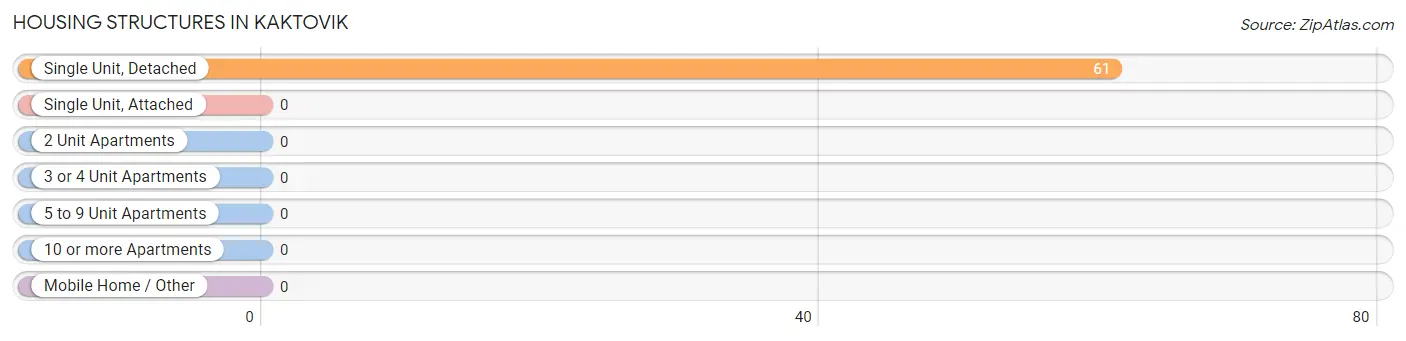
| Structure Type | # Housing Units | % Housing Units |
| Single Unit, Detached | 61 | 100.0% |
| Single Unit, Attached | 0 | 0.0% |
| 2 Unit Apartments | 0 | 0.0% |
| 3 or 4 Unit Apartments | 0 | 0.0% |
| 5 to 9 Unit Apartments | 0 | 0.0% |
| 10 or more Apartments | 0 | 0.0% |
| Mobile Home / Other | 0 | 0.0% |
| Total | 61 | 100.0% |
Housing Structures by Occupancy in Kaktovik
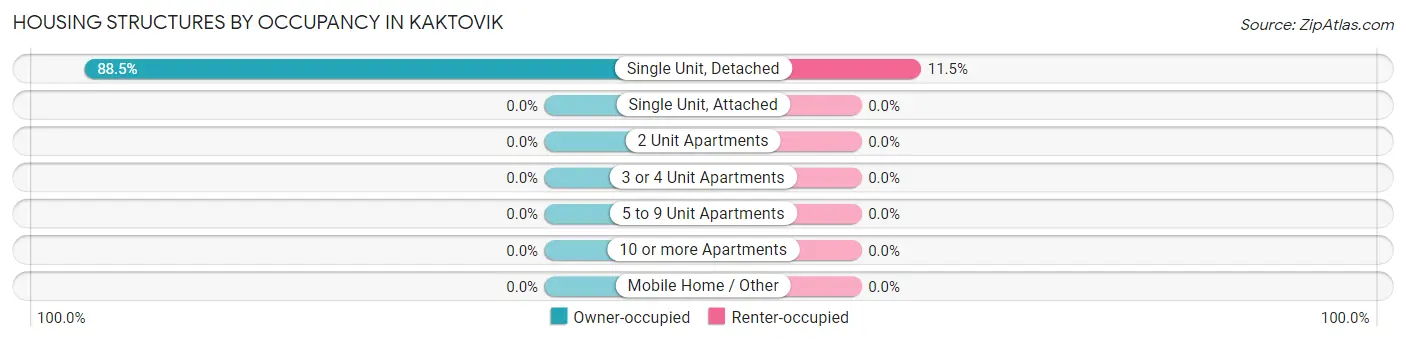
| Structure Type | Owner-occupied | Renter-occupied |
| Single Unit, Detached | 54 (88.5%) | 7 (11.5%) |
| Single Unit, Attached | 0 (0.0%) | 0 (0.0%) |
| 2 Unit Apartments | 0 (0.0%) | 0 (0.0%) |
| 3 or 4 Unit Apartments | 0 (0.0%) | 0 (0.0%) |
| 5 to 9 Unit Apartments | 0 (0.0%) | 0 (0.0%) |
| 10 or more Apartments | 0 (0.0%) | 0 (0.0%) |
| Mobile Home / Other | 0 (0.0%) | 0 (0.0%) |
| Total | 54 (88.5%) | 7 (11.5%) |
Housing Structures by Number of Rooms in Kaktovik
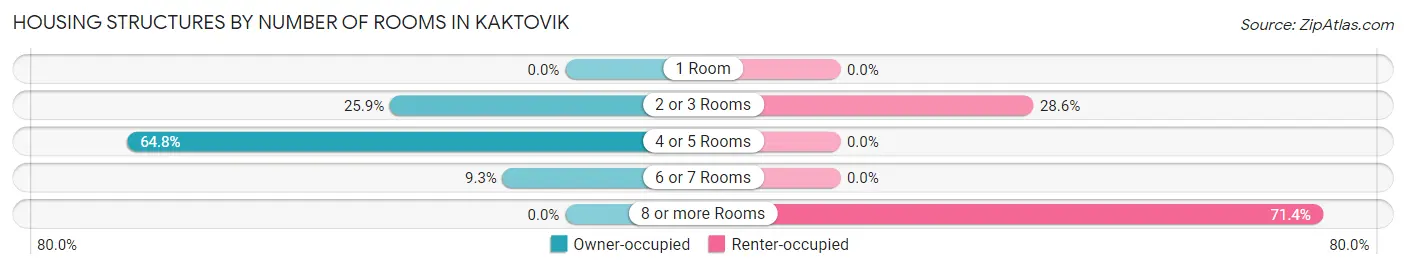
| Number of Rooms | Owner-occupied | Renter-occupied |
| 1 Room | 0 (0.0%) | 0 (0.0%) |
| 2 or 3 Rooms | 14 (25.9%) | 2 (28.6%) |
| 4 or 5 Rooms | 35 (64.8%) | 0 (0.0%) |
| 6 or 7 Rooms | 5 (9.3%) | 0 (0.0%) |
| 8 or more Rooms | 0 (0.0%) | 5 (71.4%) |
| Total | 54 (100.0%) | 7 (100.0%) |
Housing Structure by Heating Type in Kaktovik
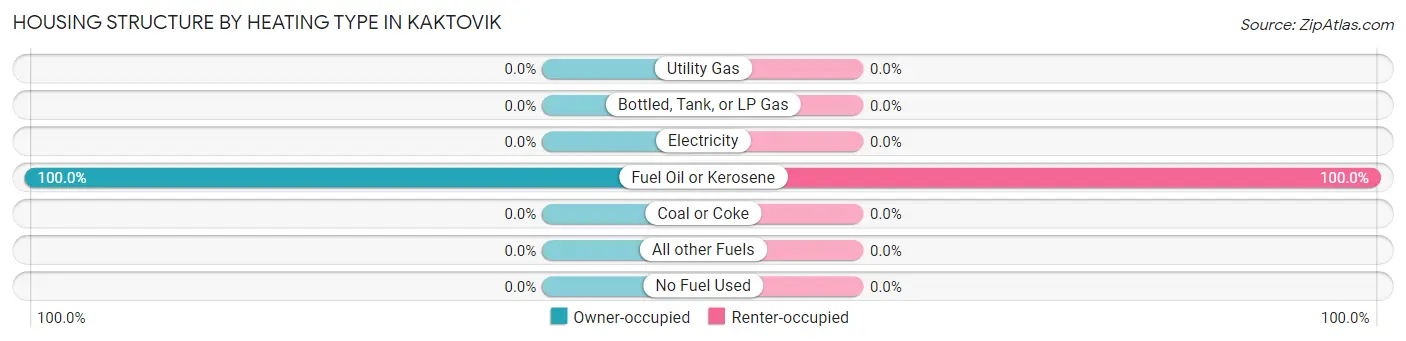
| Heating Type | Owner-occupied | Renter-occupied |
| Utility Gas | 0 (0.0%) | 0 (0.0%) |
| Bottled, Tank, or LP Gas | 0 (0.0%) | 0 (0.0%) |
| Electricity | 0 (0.0%) | 0 (0.0%) |
| Fuel Oil or Kerosene | 54 (100.0%) | 7 (100.0%) |
| Coal or Coke | 0 (0.0%) | 0 (0.0%) |
| All other Fuels | 0 (0.0%) | 0 (0.0%) |
| No Fuel Used | 0 (0.0%) | 0 (0.0%) |
| Total | 54 (100.0%) | 7 (100.0%) |
Household Vehicle Usage in Kaktovik
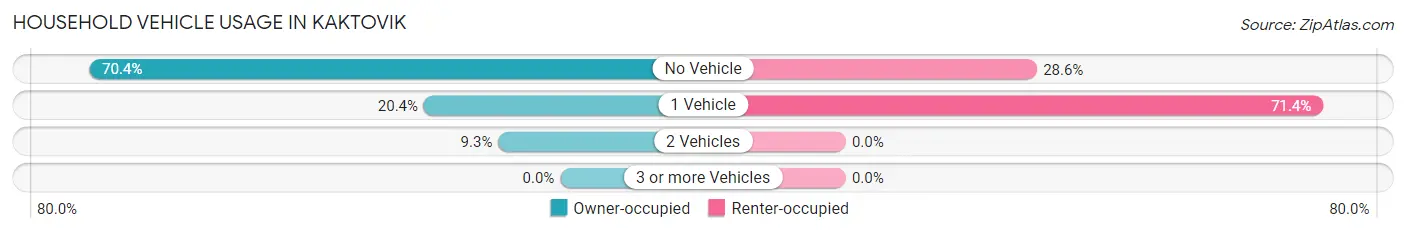
| Vehicles per Household | Owner-occupied | Renter-occupied |
| No Vehicle | 38 (70.4%) | 2 (28.6%) |
| 1 Vehicle | 11 (20.4%) | 5 (71.4%) |
| 2 Vehicles | 5 (9.3%) | 0 (0.0%) |
| 3 or more Vehicles | 0 (0.0%) | 0 (0.0%) |
| Total | 54 (100.0%) | 7 (100.0%) |
Real Estate & Mortgages in Kaktovik
Real Estate and Mortgage Overview in Kaktovik
| Characteristic | Without Mortgage | With Mortgage |
| Housing Units | 45 | 9 |
| Median Property Value | $87,500 | $0 |
| Median Household Income | $75,625 | $9 |
| Monthly Housing Costs | $642 | $0 |
| Real Estate Taxes | $1,396 | $0 |
Property Value by Mortgage Status in Kaktovik
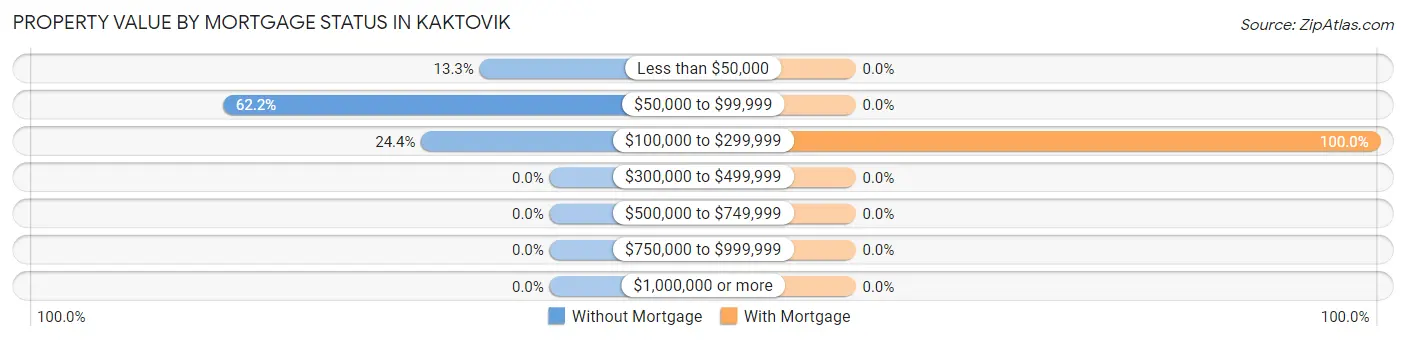
| Property Value | Without Mortgage | With Mortgage |
| Less than $50,000 | 6 (13.3%) | 0 (0.0%) |
| $50,000 to $99,999 | 28 (62.2%) | 0 (0.0%) |
| $100,000 to $299,999 | 11 (24.4%) | 9 (100.0%) |
| $300,000 to $499,999 | 0 (0.0%) | 0 (0.0%) |
| $500,000 to $749,999 | 0 (0.0%) | 0 (0.0%) |
| $750,000 to $999,999 | 0 (0.0%) | 0 (0.0%) |
| $1,000,000 or more | 0 (0.0%) | 0 (0.0%) |
| Total | 45 (100.0%) | 9 (100.0%) |
Household Income by Mortgage Status in Kaktovik
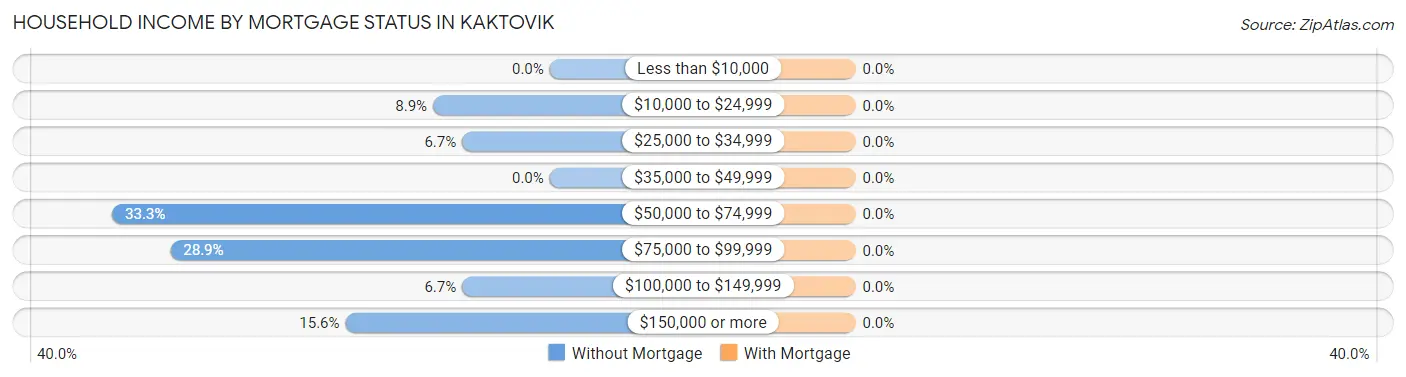
| Household Income | Without Mortgage | With Mortgage |
| Less than $10,000 | 0 (0.0%) | 0 (0.0%) |
| $10,000 to $24,999 | 4 (8.9%) | 0 (0.0%) |
| $25,000 to $34,999 | 3 (6.7%) | 0 (0.0%) |
| $35,000 to $49,999 | 0 (0.0%) | 0 (0.0%) |
| $50,000 to $74,999 | 15 (33.3%) | 0 (0.0%) |
| $75,000 to $99,999 | 13 (28.9%) | 0 (0.0%) |
| $100,000 to $149,999 | 3 (6.7%) | 0 (0.0%) |
| $150,000 or more | 7 (15.6%) | 0 (0.0%) |
| Total | 45 (100.0%) | 9 (100.0%) |
Property Value to Household Income Ratio in Kaktovik
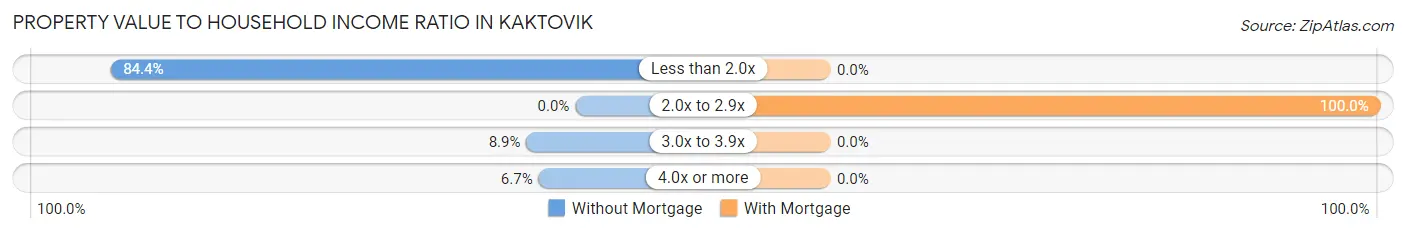
| Value-to-Income Ratio | Without Mortgage | With Mortgage |
| Less than 2.0x | 38 (84.4%) | 0 (0.0%) |
| 2.0x to 2.9x | 0 (0.0%) | 9 (100.0%) |
| 3.0x to 3.9x | 4 (8.9%) | 0 (0.0%) |
| 4.0x or more | 3 (6.7%) | 0 (0.0%) |
| Total | 45 (100.0%) | 9 (100.0%) |
Real Estate Taxes by Mortgage Status in Kaktovik
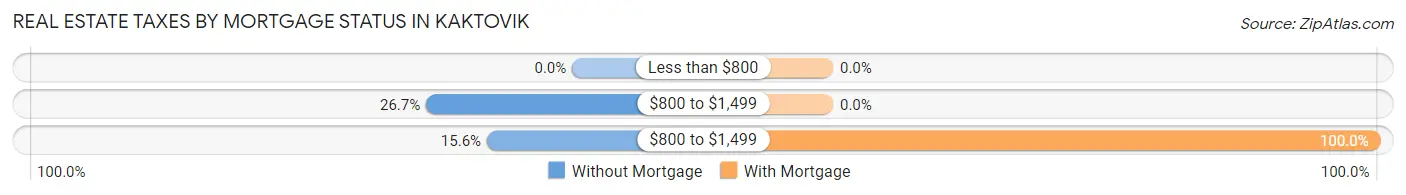
| Property Taxes | Without Mortgage | With Mortgage |
| Less than $800 | 0 (0.0%) | 0 (0.0%) |
| $800 to $1,499 | 12 (26.7%) | 0 (0.0%) |
| $800 to $1,499 | 7 (15.6%) | 9 (100.0%) |
| Total | 45 (100.0%) | 9 (100.0%) |
Health & Disability in Kaktovik
Health Insurance Coverage by Age in Kaktovik
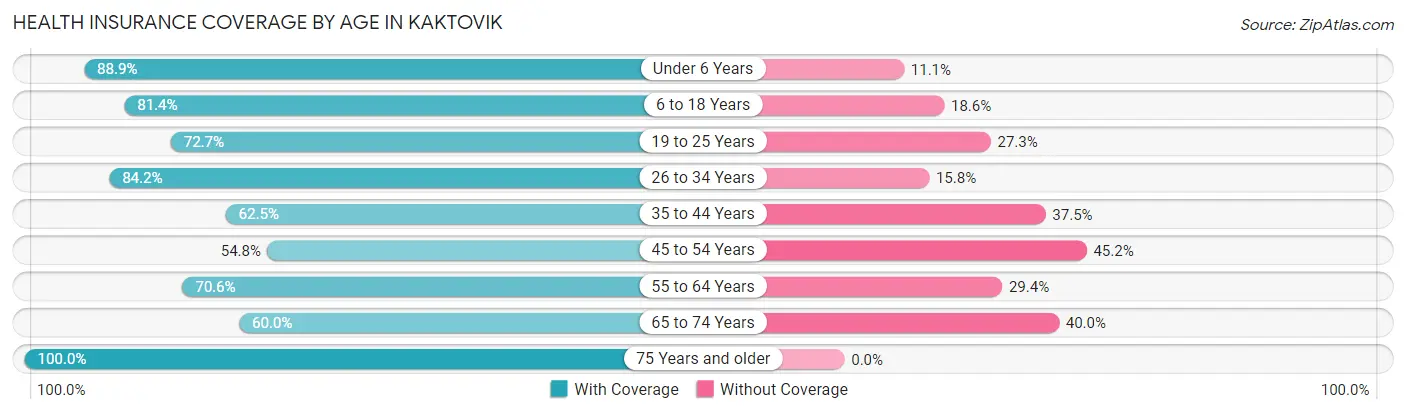
| Age Bracket | With Coverage | Without Coverage |
| Under 6 Years | 16 (88.9%) | 2 (11.1%) |
| 6 to 18 Years | 35 (81.4%) | 8 (18.6%) |
| 19 to 25 Years | 24 (72.7%) | 9 (27.3%) |
| 26 to 34 Years | 16 (84.2%) | 3 (15.8%) |
| 35 to 44 Years | 15 (62.5%) | 9 (37.5%) |
| 45 to 54 Years | 17 (54.8%) | 14 (45.2%) |
| 55 to 64 Years | 12 (70.6%) | 5 (29.4%) |
| 65 to 74 Years | 3 (60.0%) | 2 (40.0%) |
| 75 Years and older | 6 (100.0%) | 0 (0.0%) |
| Total | 144 (73.5%) | 52 (26.5%) |
Health Insurance Coverage by Citizenship Status in Kaktovik
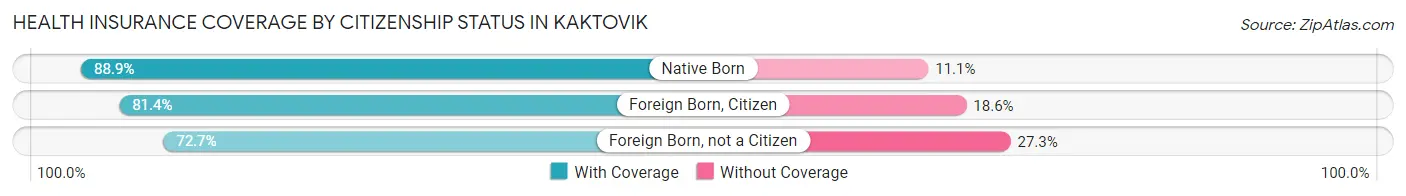
| Citizenship Status | With Coverage | Without Coverage |
| Native Born | 16 (88.9%) | 2 (11.1%) |
| Foreign Born, Citizen | 35 (81.4%) | 8 (18.6%) |
| Foreign Born, not a Citizen | 24 (72.7%) | 9 (27.3%) |
Health Insurance Coverage by Household Income in Kaktovik
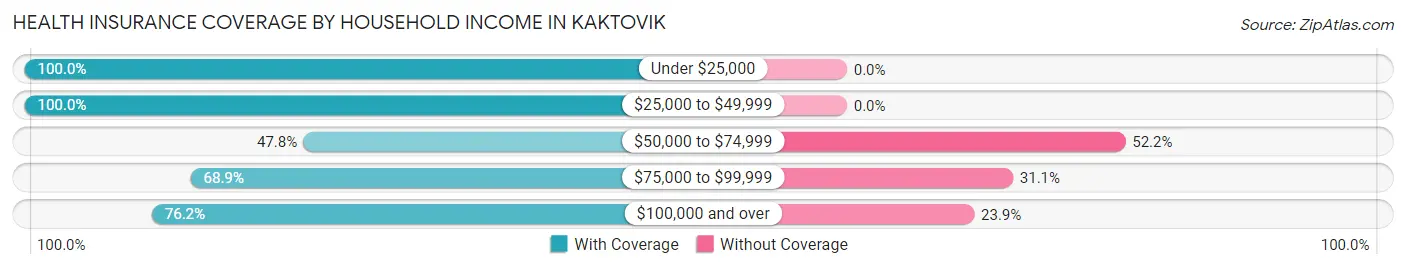
| Household Income | With Coverage | Without Coverage |
| Under $25,000 | 9 (100.0%) | 0 (0.0%) |
| $25,000 to $49,999 | 10 (100.0%) | 0 (0.0%) |
| $50,000 to $74,999 | 11 (47.8%) | 12 (52.2%) |
| $75,000 to $99,999 | 31 (68.9%) | 14 (31.1%) |
| $100,000 and over | 83 (76.1%) | 26 (23.8%) |
Public vs Private Health Insurance Coverage by Age in Kaktovik
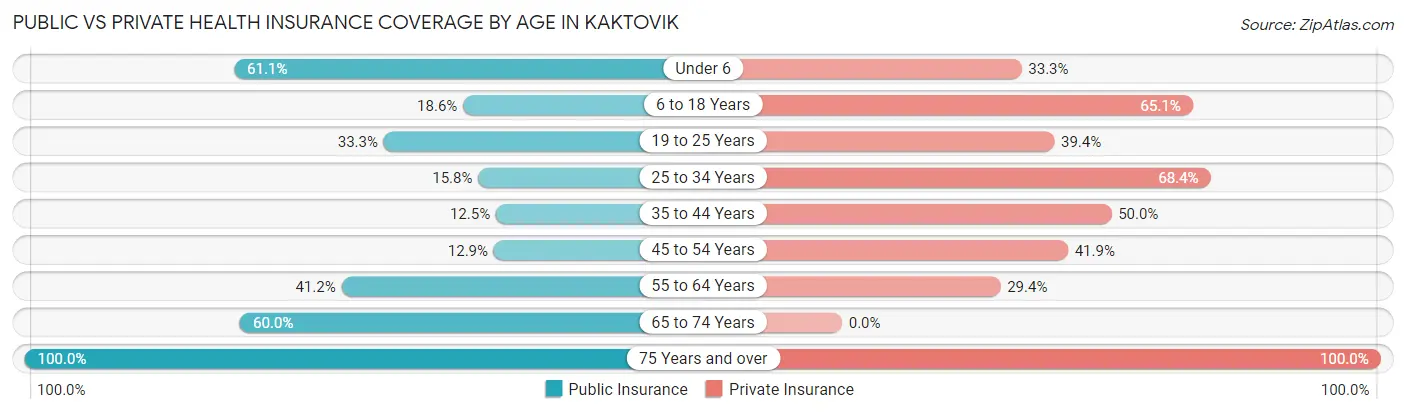
| Age Bracket | Public Insurance | Private Insurance |
| Under 6 | 11 (61.1%) | 6 (33.3%) |
| 6 to 18 Years | 8 (18.6%) | 28 (65.1%) |
| 19 to 25 Years | 11 (33.3%) | 13 (39.4%) |
| 25 to 34 Years | 3 (15.8%) | 13 (68.4%) |
| 35 to 44 Years | 3 (12.5%) | 12 (50.0%) |
| 45 to 54 Years | 4 (12.9%) | 13 (41.9%) |
| 55 to 64 Years | 7 (41.2%) | 5 (29.4%) |
| 65 to 74 Years | 3 (60.0%) | 0 (0.0%) |
| 75 Years and over | 6 (100.0%) | 6 (100.0%) |
| Total | 56 (28.6%) | 96 (49.0%) |
Disability Status by Sex by Age in Kaktovik
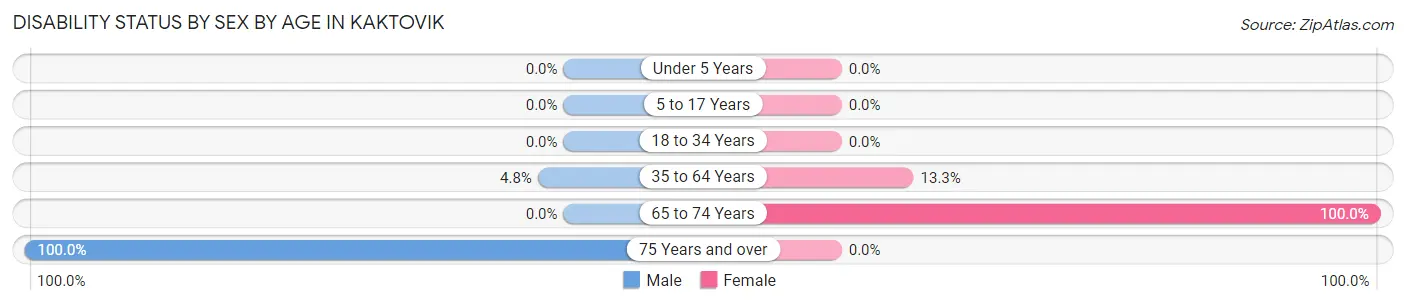
| Age Bracket | Male | Female |
| Under 5 Years | 0 (0.0%) | 0 (0.0%) |
| 5 to 17 Years | 0 (0.0%) | 0 (0.0%) |
| 18 to 34 Years | 0 (0.0%) | 0 (0.0%) |
| 35 to 64 Years | 2 (4.8%) | 4 (13.3%) |
| 65 to 74 Years | 0 (0.0%) | 3 (100.0%) |
| 75 Years and over | 6 (100.0%) | 0 (0.0%) |
Disability Class by Sex by Age in Kaktovik
Disability Class: Hearing Difficulty
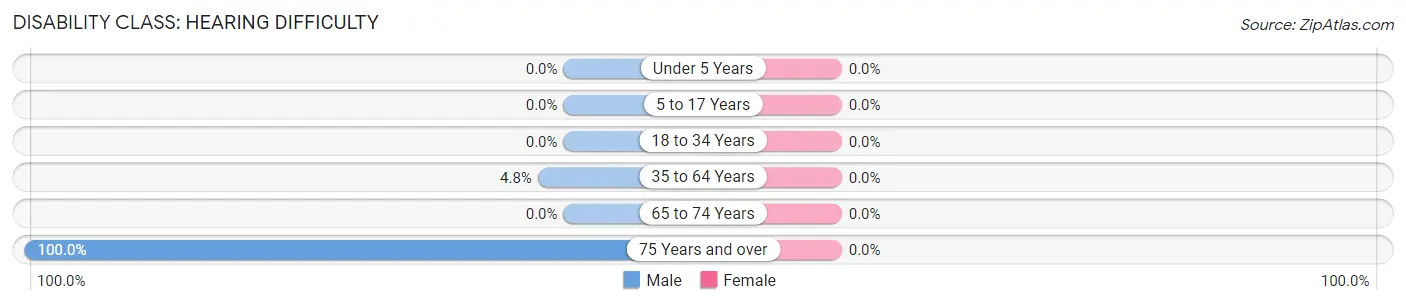
| Age Bracket | Male | Female |
| Under 5 Years | 0 (0.0%) | 0 (0.0%) |
| 5 to 17 Years | 0 (0.0%) | 0 (0.0%) |
| 18 to 34 Years | 0 (0.0%) | 0 (0.0%) |
| 35 to 64 Years | 2 (4.8%) | 0 (0.0%) |
| 65 to 74 Years | 0 (0.0%) | 0 (0.0%) |
| 75 Years and over | 6 (100.0%) | 0 (0.0%) |
Disability Class: Vision Difficulty
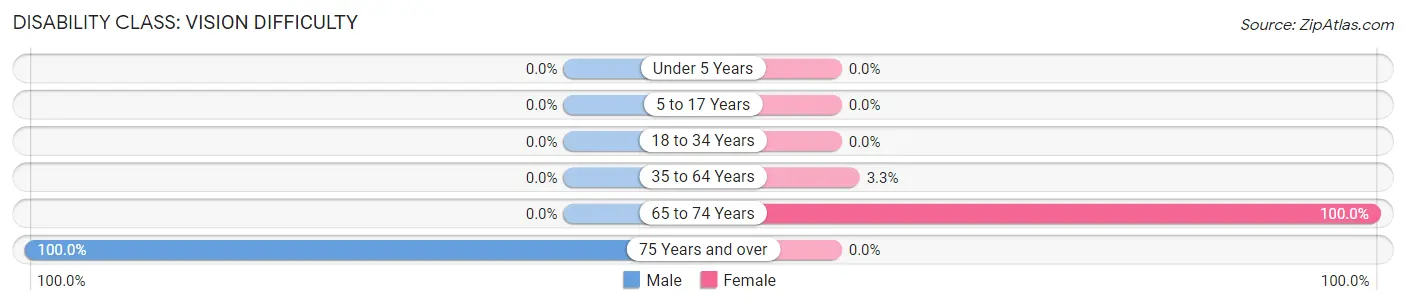
| Age Bracket | Male | Female |
| Under 5 Years | 0 (0.0%) | 0 (0.0%) |
| 5 to 17 Years | 0 (0.0%) | 0 (0.0%) |
| 18 to 34 Years | 0 (0.0%) | 0 (0.0%) |
| 35 to 64 Years | 0 (0.0%) | 1 (3.3%) |
| 65 to 74 Years | 0 (0.0%) | 3 (100.0%) |
| 75 Years and over | 6 (100.0%) | 0 (0.0%) |
Disability Class: Cognitive Difficulty
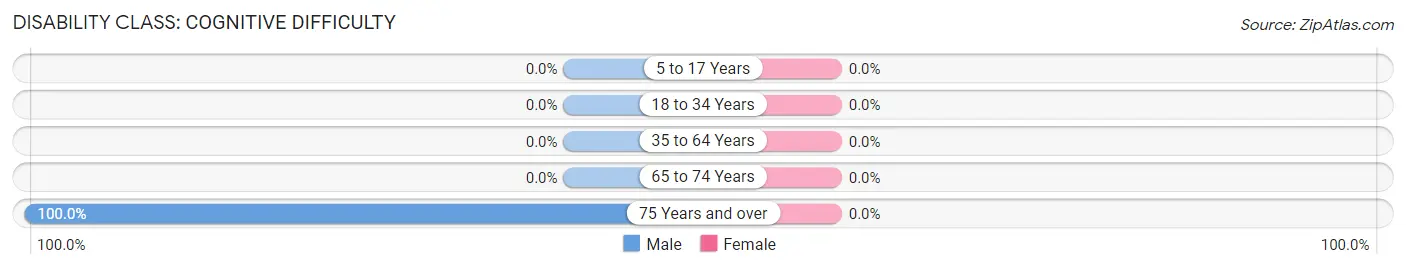
| Age Bracket | Male | Female |
| 5 to 17 Years | 0 (0.0%) | 0 (0.0%) |
| 18 to 34 Years | 0 (0.0%) | 0 (0.0%) |
| 35 to 64 Years | 0 (0.0%) | 0 (0.0%) |
| 65 to 74 Years | 0 (0.0%) | 0 (0.0%) |
| 75 Years and over | 6 (100.0%) | 0 (0.0%) |
Disability Class: Ambulatory Difficulty
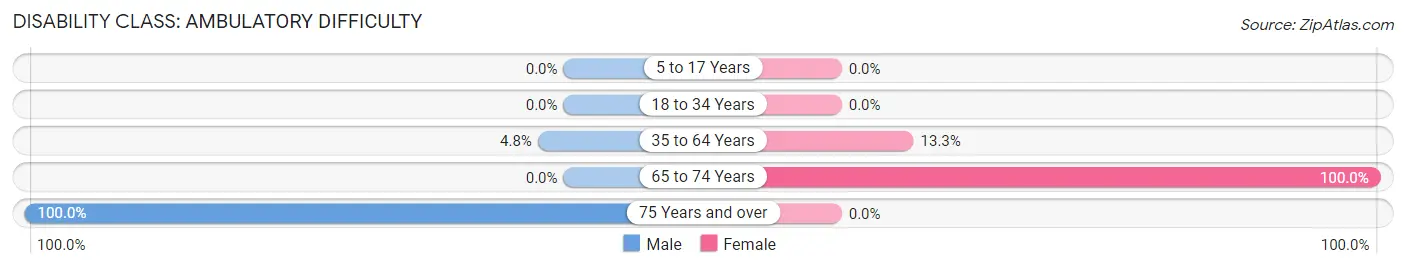
| Age Bracket | Male | Female |
| 5 to 17 Years | 0 (0.0%) | 0 (0.0%) |
| 18 to 34 Years | 0 (0.0%) | 0 (0.0%) |
| 35 to 64 Years | 2 (4.8%) | 4 (13.3%) |
| 65 to 74 Years | 0 (0.0%) | 3 (100.0%) |
| 75 Years and over | 6 (100.0%) | 0 (0.0%) |
Disability Class: Self-Care Difficulty
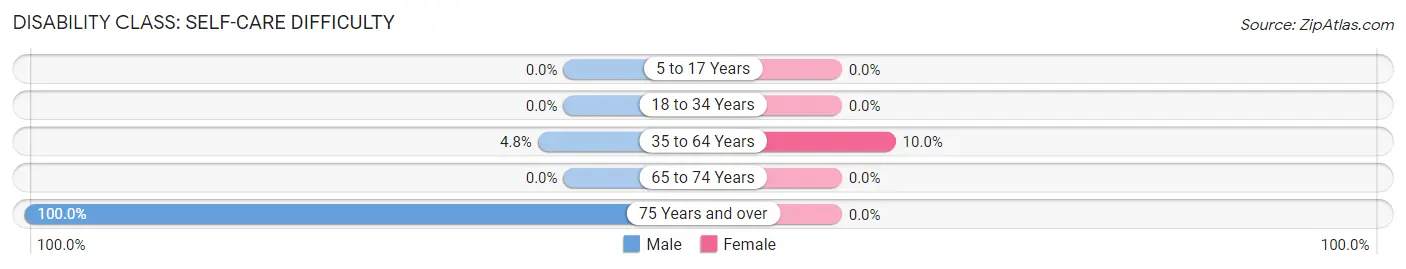
| Age Bracket | Male | Female |
| 5 to 17 Years | 0 (0.0%) | 0 (0.0%) |
| 18 to 34 Years | 0 (0.0%) | 0 (0.0%) |
| 35 to 64 Years | 2 (4.8%) | 3 (10.0%) |
| 65 to 74 Years | 0 (0.0%) | 0 (0.0%) |
| 75 Years and over | 6 (100.0%) | 0 (0.0%) |
Technology Access in Kaktovik
Computing Device Access in Kaktovik
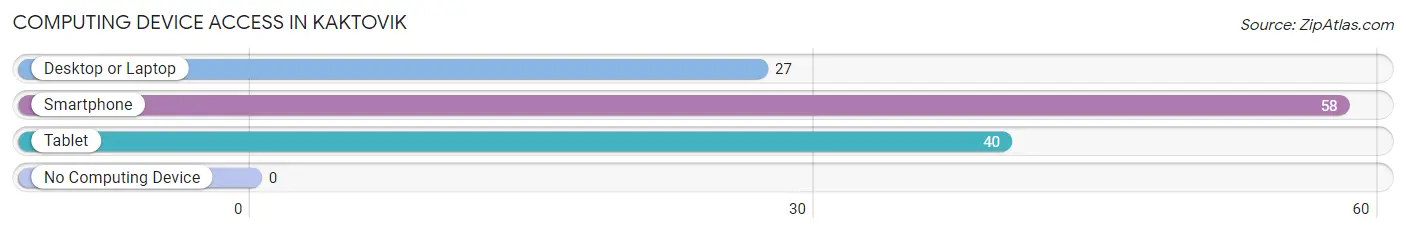
| Device Type | # Households | % Households |
| Desktop or Laptop | 27 | 44.3% |
| Smartphone | 58 | 95.1% |
| Tablet | 40 | 65.6% |
| No Computing Device | 0 | 0.0% |
| Total | 61 | 100.0% |
Internet Access in Kaktovik
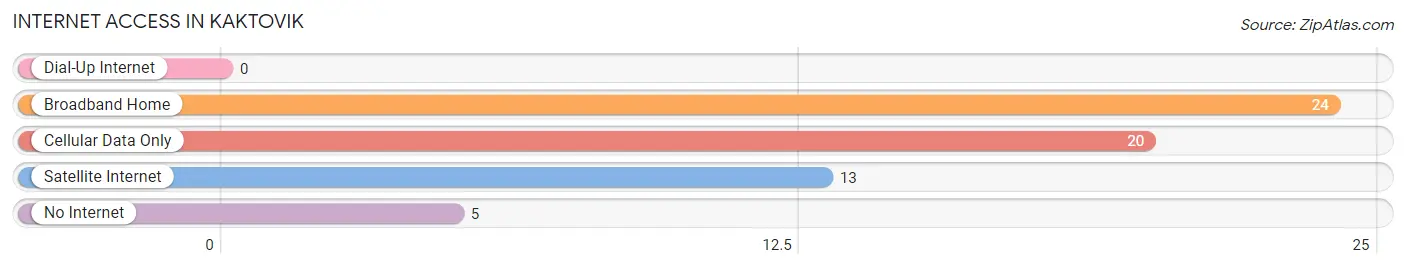
| Internet Type | # Households | % Households |
| Dial-Up Internet | 0 | 0.0% |
| Broadband Home | 24 | 39.3% |
| Cellular Data Only | 20 | 32.8% |
| Satellite Internet | 13 | 21.3% |
| No Internet | 5 | 8.2% |
| Total | 61 | 100.0% |
Kaktovik Summary
Kaktovik is a small Inupiat Eskimo village located on Barter Island in the North Slope Borough of Alaska. It is the only permanent settlement on the island, and is home to approximately 300 people. The village is located on the Beaufort Sea, and is accessible only by air or boat.
History
Kaktovik has a long history of human habitation, with archaeological evidence suggesting that the area has been inhabited for at least 4,000 years. The Inupiat people have lived in the area for centuries, and the village was first recorded by Europeans in 1826. The village was originally known as “Kaktovik,” which is an Inupiat word meaning “place of many whales.”
The village was originally a whaling and trading center, and the Inupiat people relied heavily on the sea for their subsistence. In the early 1900s, the U.S. government began to establish schools and other services in the area, and the village began to grow. In the 1950s, the U.S. Army Corps of Engineers built a causeway connecting Barter Island to the mainland, allowing for easier access to the village.
Geography
Kaktovik is located on Barter Island, which is part of the North Slope Borough of Alaska. The island is located in the Beaufort Sea, and is approximately 8 miles long and 2 miles wide. The island is surrounded by shallow waters, and is home to a variety of wildlife, including polar bears, seals, walruses, and whales.
The village is located on the eastern side of the island, and is accessible only by air or boat. The climate in the area is cold and dry, with temperatures ranging from -20 to 60 degrees Fahrenheit. The area receives an average of 8 inches of precipitation per year, and is covered in tundra vegetation.
Economy
Kaktovik’s economy is largely based on subsistence activities, such as hunting, fishing, and gathering. The village is also home to a small commercial fishing industry, and the local economy is supplemented by tourism and oil and gas exploration.
The village is home to a variety of businesses, including a grocery store, a post office, a hotel, and a restaurant. The village also has a small airport, and is served by a weekly ferry from the mainland.
Demographics
Kaktovik is home to approximately 300 people, all of whom are of Inupiat descent. The village is predominantly English-speaking, and the majority of the population is Christian. The median household income in the village is approximately $50,000, and the unemployment rate is around 10%.
Kaktovik is a small, isolated village, but it is an important part of the Inupiat culture and history. The village is home to a variety of businesses and services, and the local economy is largely based on subsistence activities. The village is also home to a variety of wildlife, and is a popular destination for tourists and wildlife enthusiasts.
Common Questions
What is Per Capita Income in Kaktovik?
Per Capita income in Kaktovik is $32,169.
What is the Median Family Income in Kaktovik?
Median Family Income in Kaktovik is $74,583.
What is the Median Household income in Kaktovik?
Median Household Income in Kaktovik is $86,458.
What is Income or Wage Gap in Kaktovik?
Income or Wage Gap in Kaktovik is 46.1%.
Women in Kaktovik earn 53.9 cents for every dollar earned by a man.
What is Inequality or Gini Index in Kaktovik?
Inequality or Gini Index in Kaktovik is 0.38.
What is the Total Population of Kaktovik?
Total Population of Kaktovik is 201.
What is the Total Male Population of Kaktovik?
Total Male Population of Kaktovik is 115.
What is the Total Female Population of Kaktovik?
Total Female Population of Kaktovik is 86.
What is the Ratio of Males per 100 Females in Kaktovik?
There are 133.72 Males per 100 Females in Kaktovik.
What is the Ratio of Females per 100 Males in Kaktovik?
There are 74.78 Females per 100 Males in Kaktovik.
What is the Median Population Age in Kaktovik?
Median Population Age in Kaktovik is 27.8 Years.
What is the Average Family Size in Kaktovik
Average Family Size in Kaktovik is 3.5 People.
What is the Average Household Size in Kaktovik
Average Household Size in Kaktovik is 3.2 People.
How Large is the Labor Force in Kaktovik?
There are 94 People in the Labor Forcein in Kaktovik.
What is the Percentage of People in the Labor Force in Kaktovik?
61.4% of People are in the Labor Force in Kaktovik.
What is the Unemployment Rate in Kaktovik?
Unemployment Rate in Kaktovik is 16.9%.