Kake, AK Map & Demographics
Kake Map
Kake Overview
$28,748
PER CAPITA INCOME
$69,375
AVG FAMILY INCOME
$61,250
AVG HOUSEHOLD INCOME
28.3%
WAGE / INCOME GAP [ % ]
71.7¢/ $1
WAGE / INCOME GAP [ $ ]
0.49
INEQUALITY / GINI INDEX
473
TOTAL POPULATION
229
MALE POPULATION
244
FEMALE POPULATION
93.85
MALES / 100 FEMALES
106.55
FEMALES / 100 MALES
37.3
MEDIAN AGE
3.2
AVG FAMILY SIZE
2.8
AVG HOUSEHOLD SIZE
203
LABOR FORCE [ PEOPLE ]
56.1%
PERCENT IN LABOR FORCE
9.4%
UNEMPLOYMENT RATE
Kake Zip Codes
Kake Area Codes
Income in Kake
Income Overview in Kake
Per Capita Income in Kake is $28,748, while median incomes of families and households are $69,375 and $61,250 respectively.
| Characteristic | Number | Measure |
| Per Capita Income | 473 | $28,748 |
| Median Family Income | 123 | $69,375 |
| Mean Family Income | 123 | $93,552 |
| Median Household Income | 172 | $61,250 |
| Mean Household Income | 172 | $78,697 |
| Income Deficit | 123 | $0 |
| Wage / Income Gap (%) | 473 | 28.33% |
| Wage / Income Gap ($) | 473 | 71.67¢ per $1 |
| Gini / Inequality Index | 473 | 0.49 |
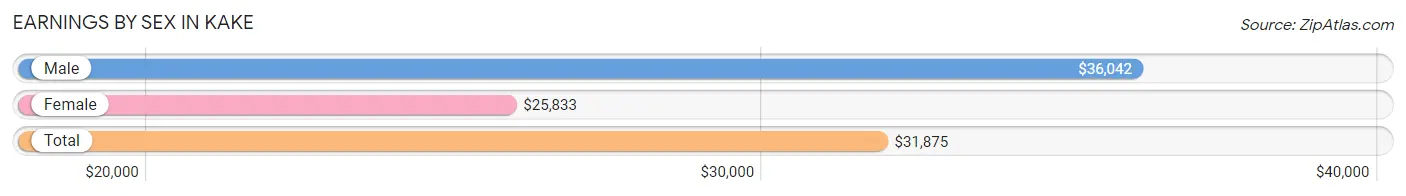
Earnings by Sex in Kake
Average Earnings in Kake are $31,875, $36,042 for men and $25,833 for women, a difference of 28.3%.
| Sex | Number | Average Earnings |
| Male | 101 (46.5%) | $36,042 |
| Female | 116 (53.5%) | $25,833 |
| Total | 217 (100.0%) | $31,875 |
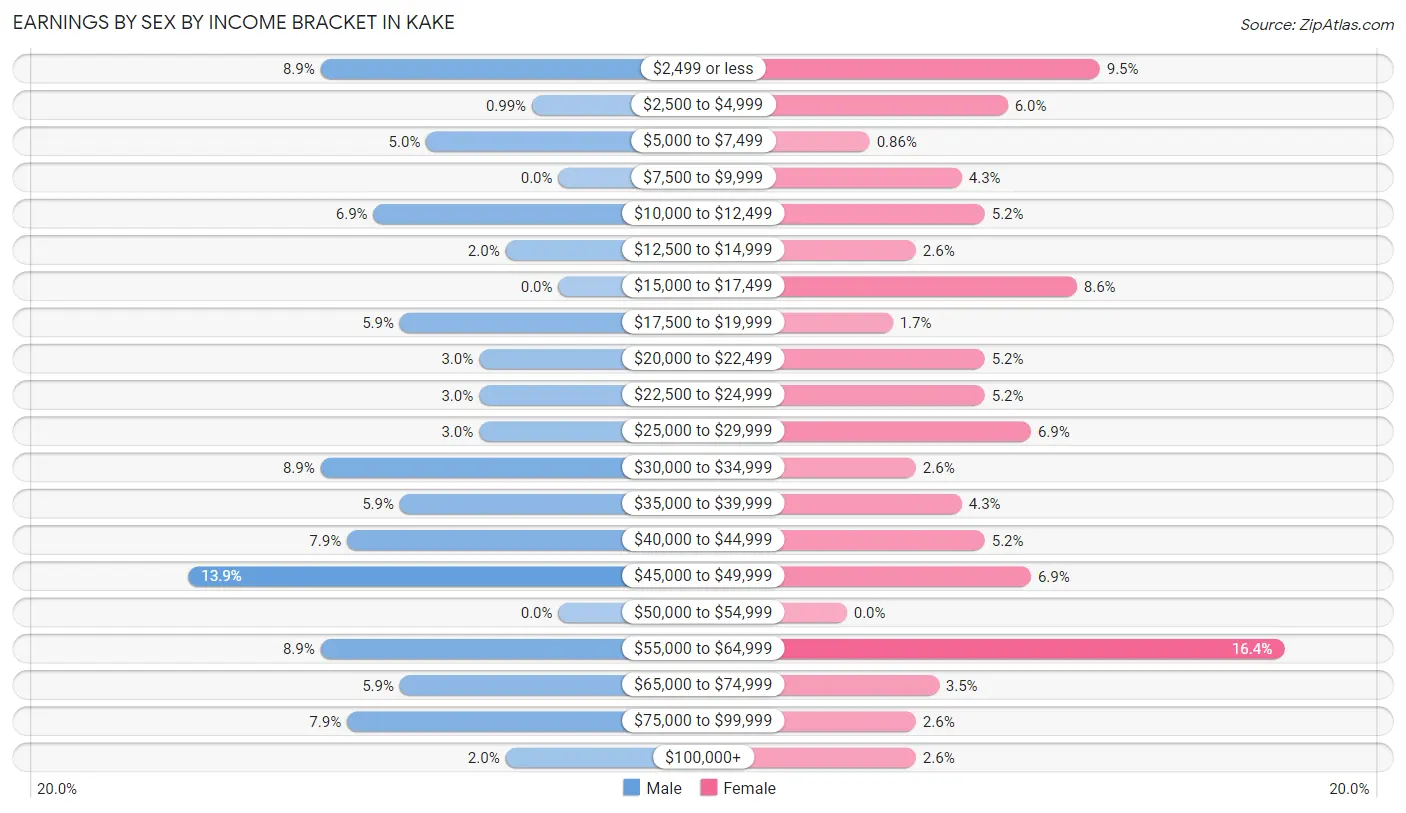
Earnings by Sex by Income Bracket in Kake
The most common earnings brackets in Kake are $45,000 to $49,999 for men (14 | 13.9%) and $55,000 to $64,999 for women (19 | 16.4%).
| Income | Male | Female |
| $2,499 or less | 9 (8.9%) | 11 (9.5%) |
| $2,500 to $4,999 | 1 (1.0%) | 7 (6.0%) |
| $5,000 to $7,499 | 5 (5.0%) | 1 (0.9%) |
| $7,500 to $9,999 | 0 (0.0%) | 5 (4.3%) |
| $10,000 to $12,499 | 7 (6.9%) | 6 (5.2%) |
| $12,500 to $14,999 | 2 (2.0%) | 3 (2.6%) |
| $15,000 to $17,499 | 0 (0.0%) | 10 (8.6%) |
| $17,500 to $19,999 | 6 (5.9%) | 2 (1.7%) |
| $20,000 to $22,499 | 3 (3.0%) | 6 (5.2%) |
| $22,500 to $24,999 | 3 (3.0%) | 6 (5.2%) |
| $25,000 to $29,999 | 3 (3.0%) | 8 (6.9%) |
| $30,000 to $34,999 | 9 (8.9%) | 3 (2.6%) |
| $35,000 to $39,999 | 6 (5.9%) | 5 (4.3%) |
| $40,000 to $44,999 | 8 (7.9%) | 6 (5.2%) |
| $45,000 to $49,999 | 14 (13.9%) | 8 (6.9%) |
| $50,000 to $54,999 | 0 (0.0%) | 0 (0.0%) |
| $55,000 to $64,999 | 9 (8.9%) | 19 (16.4%) |
| $65,000 to $74,999 | 6 (5.9%) | 4 (3.5%) |
| $75,000 to $99,999 | 8 (7.9%) | 3 (2.6%) |
| $100,000+ | 2 (2.0%) | 3 (2.6%) |
| Total | 101 (100.0%) | 116 (100.0%) |
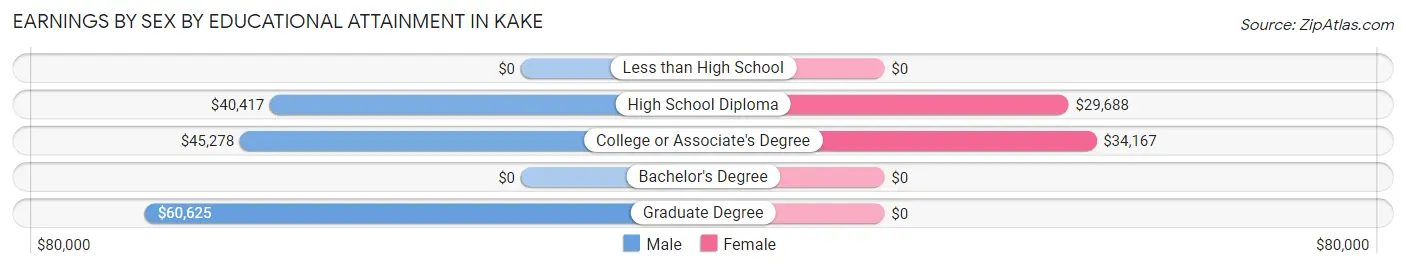
Earnings by Sex by Educational Attainment in Kake
Average earnings in Kake are $41,250 for men and $32,917 for women, a difference of 20.2%. Men with an educational attainment of graduate degree enjoy the highest average annual earnings of $60,625, while those with high school diploma education earn the least with $40,417. Women with an educational attainment of college or associate's degree earn the most with the average annual earnings of $34,167, while those with high school diploma education have the smallest earnings of $29,688.
| Educational Attainment | Male Income | Female Income |
| Less than High School | - | - |
| High School Diploma | $40,417 | $29,688 |
| College or Associate's Degree | $45,278 | $34,167 |
| Bachelor's Degree | - | - |
| Graduate Degree | $60,625 | $0 |
| Total | $41,250 | $32,917 |
Family Income in Kake
Family Income Brackets in Kake
According to the Kake family income data, there are 31 families falling into the $100,000 to $149,999 income range, which is the most common income bracket and makes up 25.2% of all families. Conversely, the $10,000 to $14,999 income bracket is the least frequent group with only 1 families (0.8%) belonging to this category.
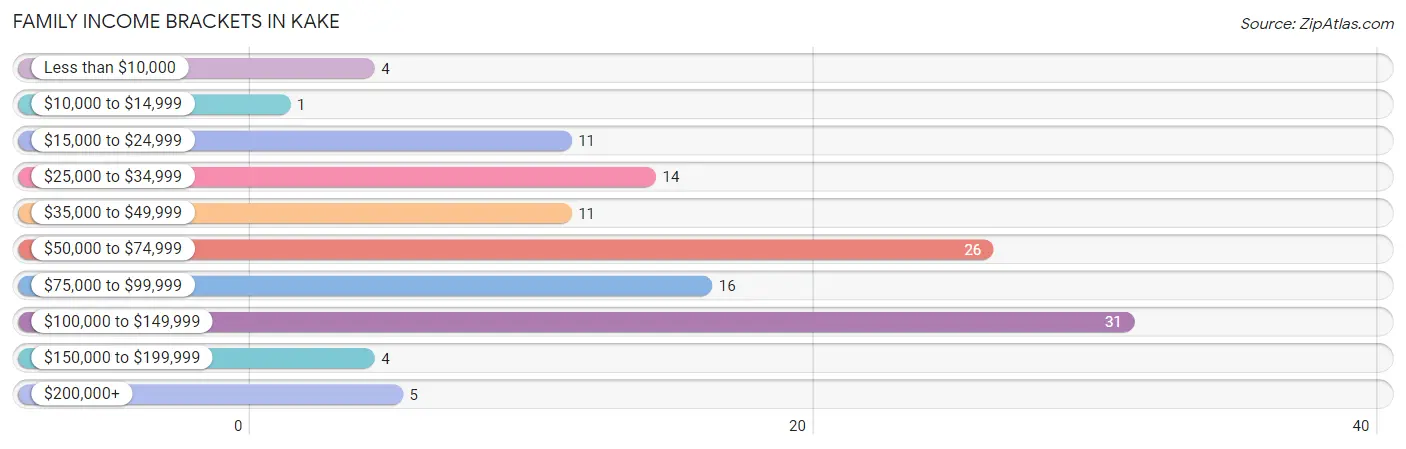
| Income Bracket | # Families | % Families |
| Less than $10,000 | 4 | 3.3% |
| $10,000 to $14,999 | 1 | 0.8% |
| $15,000 to $24,999 | 11 | 8.9% |
| $25,000 to $34,999 | 14 | 11.4% |
| $35,000 to $49,999 | 11 | 8.9% |
| $50,000 to $74,999 | 26 | 21.1% |
| $75,000 to $99,999 | 16 | 13.0% |
| $100,000 to $149,999 | 31 | 25.2% |
| $150,000 to $199,999 | 4 | 3.3% |
| $200,000+ | 5 | 4.1% |
Family Income by Famaliy Size in Kake
6-person families (10 | 8.1%) account for the highest median family income in Kake with $92,500 per family, while 4-person families (23 | 18.7%) have the highest median income of $22,344 per family member.
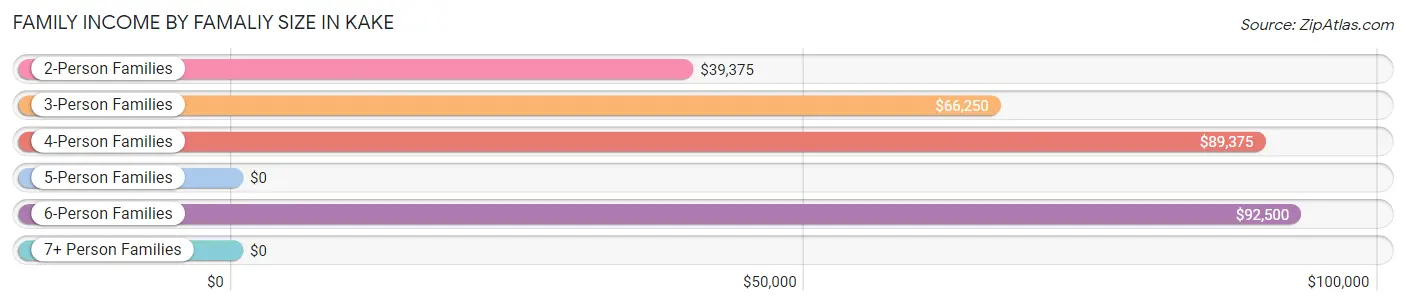
| Income Bracket | # Families | Median Income |
| 2-Person Families | 47 (38.2%) | $39,375 |
| 3-Person Families | 17 (13.8%) | $66,250 |
| 4-Person Families | 23 (18.7%) | $89,375 |
| 5-Person Families | 11 (8.9%) | $0 |
| 6-Person Families | 10 (8.1%) | $92,500 |
| 7+ Person Families | 15 (12.2%) | $0 |
| Total | 123 (100.0%) | $69,375 |
Family Income by Number of Earners in Kake
The median family income in Kake is $69,375, with families comprising 3+ earners (10) having the highest median family income of $117,500, while families with no earners (31) have the lowest median family income of $28,125, accounting for 8.1% and 25.2% of families, respectively.
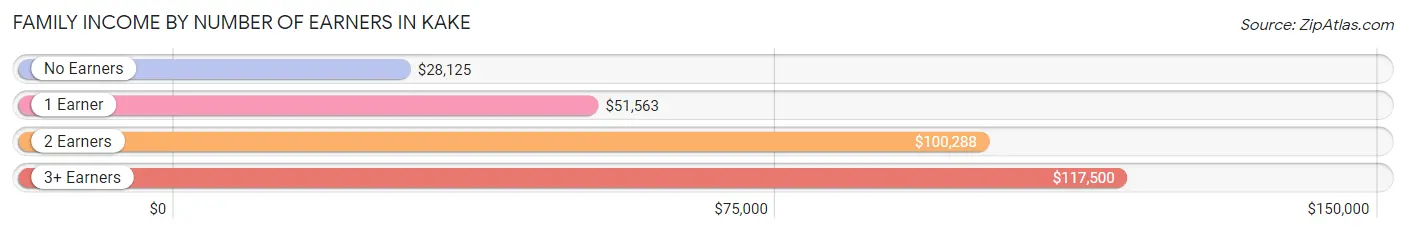
| Number of Earners | # Families | Median Income |
| No Earners | 31 (25.2%) | $28,125 |
| 1 Earner | 29 (23.6%) | $51,563 |
| 2 Earners | 53 (43.1%) | $100,288 |
| 3+ Earners | 10 (8.1%) | $117,500 |
| Total | 123 (100.0%) | $69,375 |
Household Income in Kake
Household Income Brackets in Kake
With 33 households falling in the category, the $100,000 to $149,999 income range is the most frequent in Kake, accounting for 19.2% of all households. In contrast, only 4 households (2.3%) fall into the $10,000 to $14,999 income bracket, making it the least populous group.
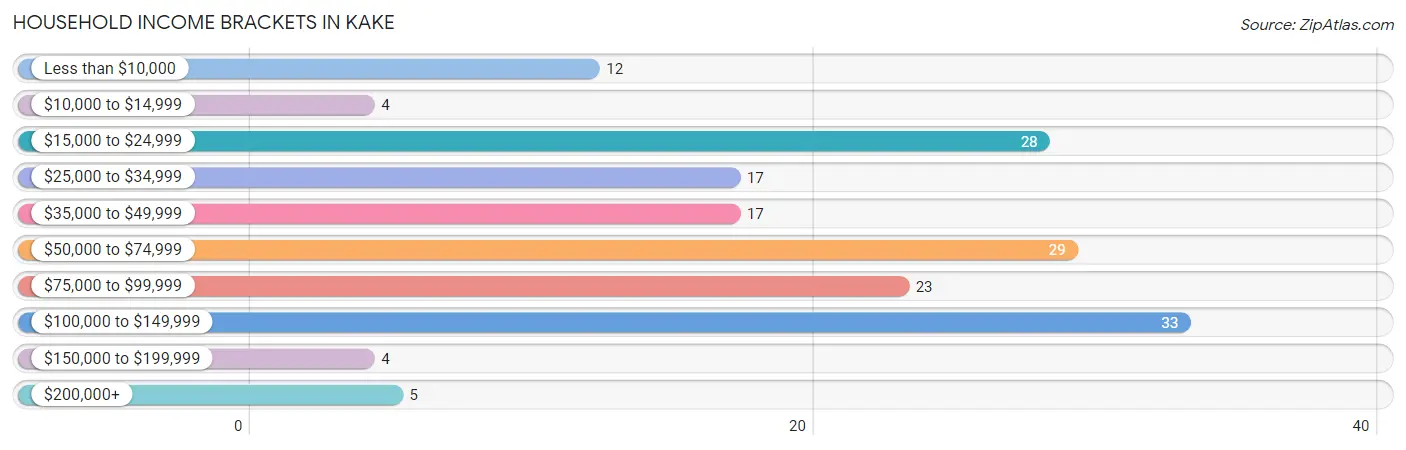
| Income Bracket | # Households | % Households |
| Less than $10,000 | 12 | 7.0% |
| $10,000 to $14,999 | 4 | 2.3% |
| $15,000 to $24,999 | 28 | 16.3% |
| $25,000 to $34,999 | 17 | 9.9% |
| $35,000 to $49,999 | 17 | 9.9% |
| $50,000 to $74,999 | 29 | 16.9% |
| $75,000 to $99,999 | 23 | 13.4% |
| $100,000 to $149,999 | 33 | 19.2% |
| $150,000 to $199,999 | 4 | 2.3% |
| $200,000+ | 5 | 2.9% |
Household Income by Householder Age in Kake
The median household income in Kake is $61,250, with the highest median household income of $88,750 found in the 25 to 44 years age bracket for the primary householder. A total of 54 households (31.4%) fall into this category. Meanwhile, the 15 to 24 years age bracket for the primary householder has the lowest median household income of $0, with 2 households (1.2%) in this group.
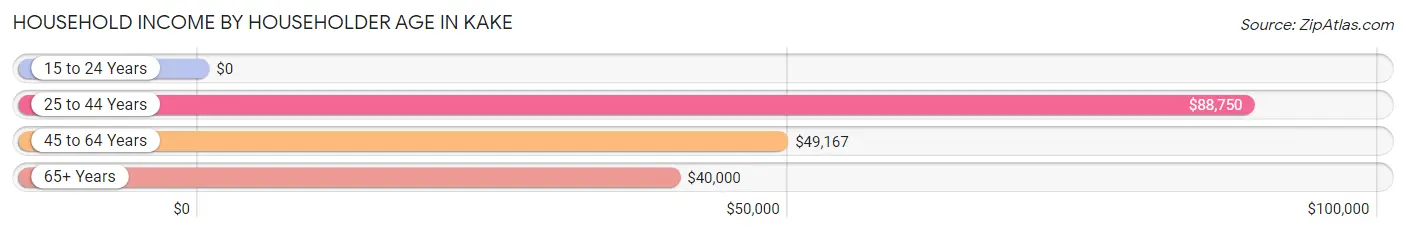
| Income Bracket | # Households | Median Income |
| 15 to 24 Years | 2 (1.2%) | $0 |
| 25 to 44 Years | 54 (31.4%) | $88,750 |
| 45 to 64 Years | 62 (36.0%) | $49,167 |
| 65+ Years | 54 (31.4%) | $40,000 |
| Total | 172 (100.0%) | $61,250 |
Poverty in Kake
Income Below Poverty by Sex and Age in Kake
With 16.2% poverty level for males and 13.5% for females among the residents of Kake, 12 to 14 year old males and 12 to 14 year old females are the most vulnerable to poverty, with 4 males (44.4%) and 2 females (40.0%) in their respective age groups living below the poverty level.
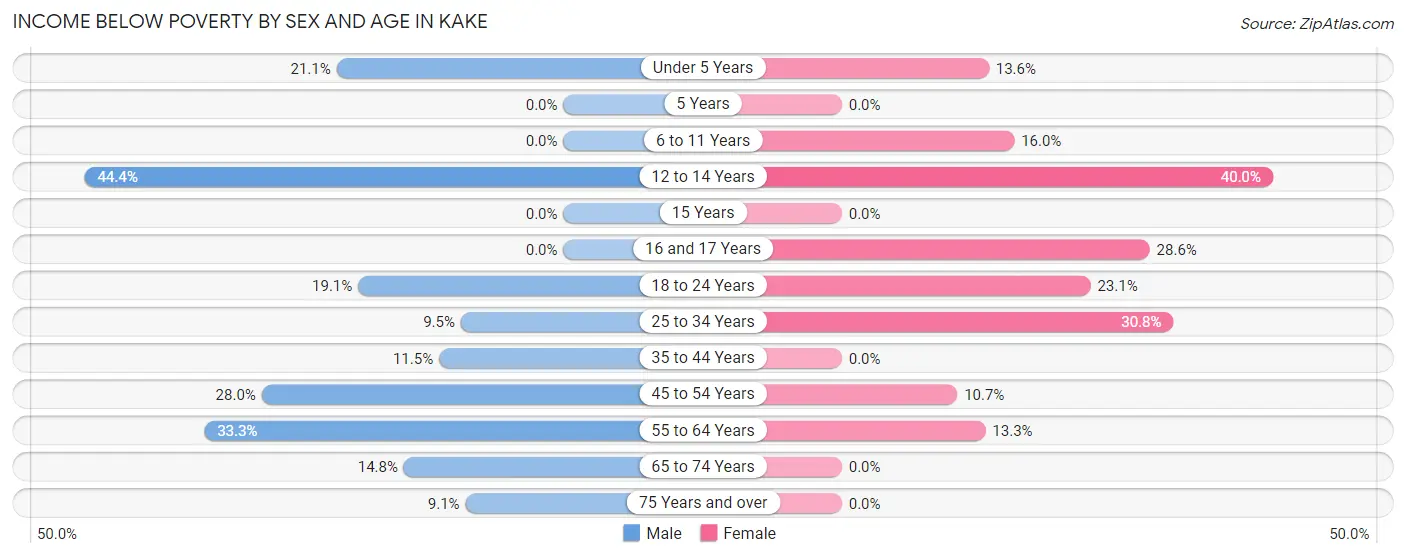
| Age Bracket | Male | Female |
| Under 5 Years | 4 (21.0%) | 3 (13.6%) |
| 5 Years | 0 (0.0%) | 0 (0.0%) |
| 6 to 11 Years | 0 (0.0%) | 4 (16.0%) |
| 12 to 14 Years | 4 (44.4%) | 2 (40.0%) |
| 15 Years | 0 (0.0%) | 0 (0.0%) |
| 16 and 17 Years | 0 (0.0%) | 2 (28.6%) |
| 18 to 24 Years | 4 (19.1%) | 3 (23.1%) |
| 25 to 34 Years | 2 (9.5%) | 12 (30.8%) |
| 35 to 44 Years | 3 (11.5%) | 0 (0.0%) |
| 45 to 54 Years | 7 (28.0%) | 3 (10.7%) |
| 55 to 64 Years | 7 (33.3%) | 4 (13.3%) |
| 65 to 74 Years | 4 (14.8%) | 0 (0.0%) |
| 75 Years and over | 2 (9.1%) | 0 (0.0%) |
| Total | 37 (16.2%) | 33 (13.5%) |
Income Above Poverty by Sex and Age in Kake
According to the poverty statistics in Kake, males aged 5 years and females aged 5 years are the age groups that are most secure financially, with 100.0% of males and 100.0% of females in these age groups living above the poverty line.
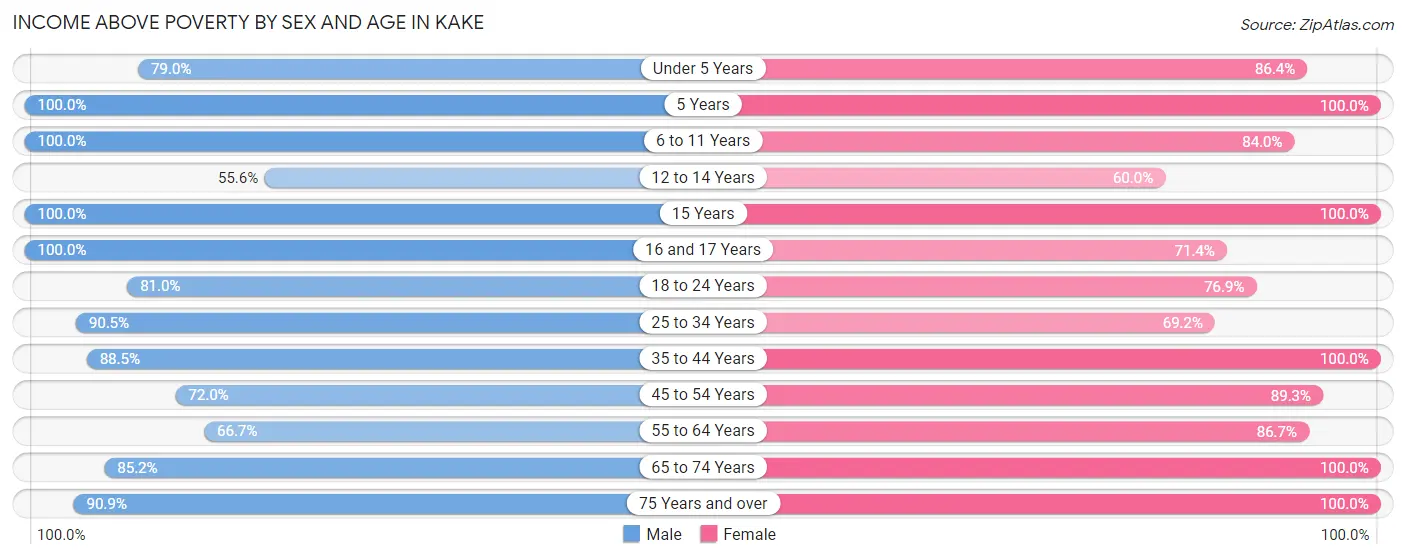
| Age Bracket | Male | Female |
| Under 5 Years | 15 (78.9%) | 19 (86.4%) |
| 5 Years | 8 (100.0%) | 2 (100.0%) |
| 6 to 11 Years | 17 (100.0%) | 21 (84.0%) |
| 12 to 14 Years | 5 (55.6%) | 3 (60.0%) |
| 15 Years | 2 (100.0%) | 2 (100.0%) |
| 16 and 17 Years | 11 (100.0%) | 5 (71.4%) |
| 18 to 24 Years | 17 (80.9%) | 10 (76.9%) |
| 25 to 34 Years | 19 (90.5%) | 27 (69.2%) |
| 35 to 44 Years | 23 (88.5%) | 33 (100.0%) |
| 45 to 54 Years | 18 (72.0%) | 25 (89.3%) |
| 55 to 64 Years | 14 (66.7%) | 26 (86.7%) |
| 65 to 74 Years | 23 (85.2%) | 27 (100.0%) |
| 75 Years and over | 20 (90.9%) | 11 (100.0%) |
| Total | 192 (83.8%) | 211 (86.5%) |
Income Below Poverty Among Married-Couple Families in Kake
The poverty statistics for married-couple families in Kake show that 9.2% or 8 of the total 87 families live below the poverty line. Families with 3 or 4 children have the highest poverty rate of 15.8%, comprising of 3 families. On the other hand, families with 1 or 2 children have the lowest poverty rate of 0.0%, which includes 0 families.
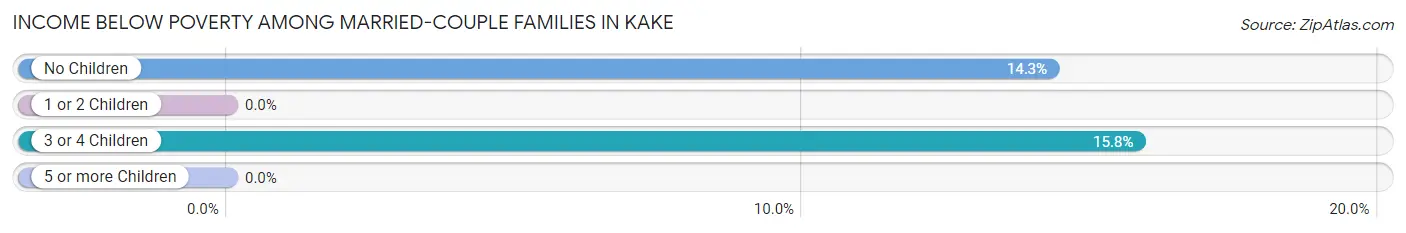
| Children | Above Poverty | Below Poverty |
| No Children | 30 (85.7%) | 5 (14.3%) |
| 1 or 2 Children | 20 (100.0%) | 0 (0.0%) |
| 3 or 4 Children | 16 (84.2%) | 3 (15.8%) |
| 5 or more Children | 13 (100.0%) | 0 (0.0%) |
| Total | 79 (90.8%) | 8 (9.2%) |
Income Below Poverty Among Single-Parent Households in Kake
According to the poverty data in Kake, 14.3% or 2 single-father households and 4.5% or 1 single-mother households are living below the poverty line. Among single-father households, those with 1 or 2 children have the highest poverty rate, with 2 households (22.2%) experiencing poverty. Likewise, among single-mother households, those with 3 or 4 children have the highest poverty rate, with 1 households (100.0%) falling below the poverty line.
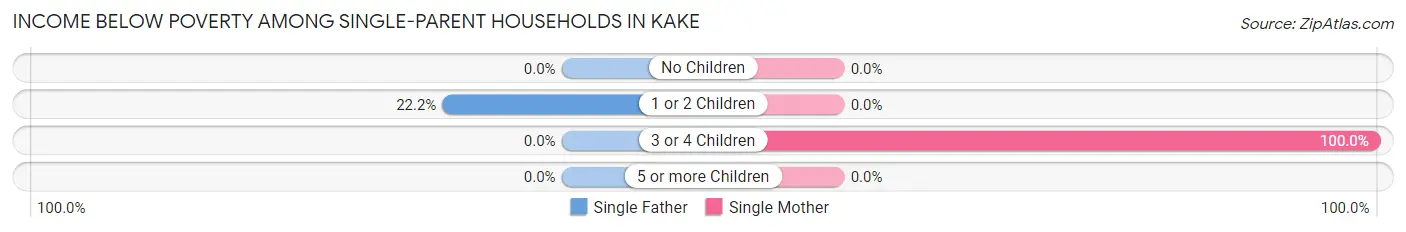
| Children | Single Father | Single Mother |
| No Children | 0 (0.0%) | 0 (0.0%) |
| 1 or 2 Children | 2 (22.2%) | 0 (0.0%) |
| 3 or 4 Children | 0 (0.0%) | 1 (100.0%) |
| 5 or more Children | 0 (0.0%) | 0 (0.0%) |
| Total | 2 (14.3%) | 1 (4.5%) |
Income Below Poverty Among Married-Couple vs Single-Parent Households in Kake
The poverty data for Kake shows that 8 of the married-couple family households (9.2%) and 3 of the single-parent households (8.3%) are living below the poverty level. Within the married-couple family households, those with 3 or 4 children have the highest poverty rate, with 3 households (15.8%) falling below the poverty line. Among the single-parent households, those with 3 or 4 children have the highest poverty rate, with 1 household (33.3%) living below poverty.
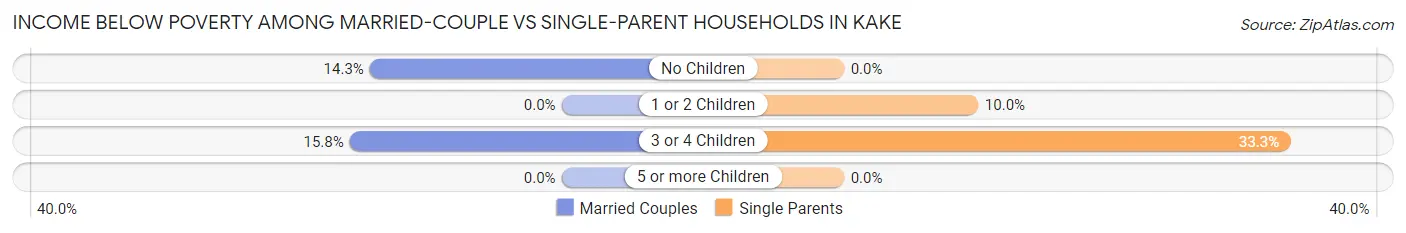
| Children | Married-Couple Families | Single-Parent Households |
| No Children | 5 (14.3%) | 0 (0.0%) |
| 1 or 2 Children | 0 (0.0%) | 2 (10.0%) |
| 3 or 4 Children | 3 (15.8%) | 1 (33.3%) |
| 5 or more Children | 0 (0.0%) | 0 (0.0%) |
| Total | 8 (9.2%) | 3 (8.3%) |
Race in Kake
The most populous races in Kake are Native / Alaskan (255 | 53.9%), Two or more Races (124 | 26.2%), and White / Caucasian (88 | 18.6%).
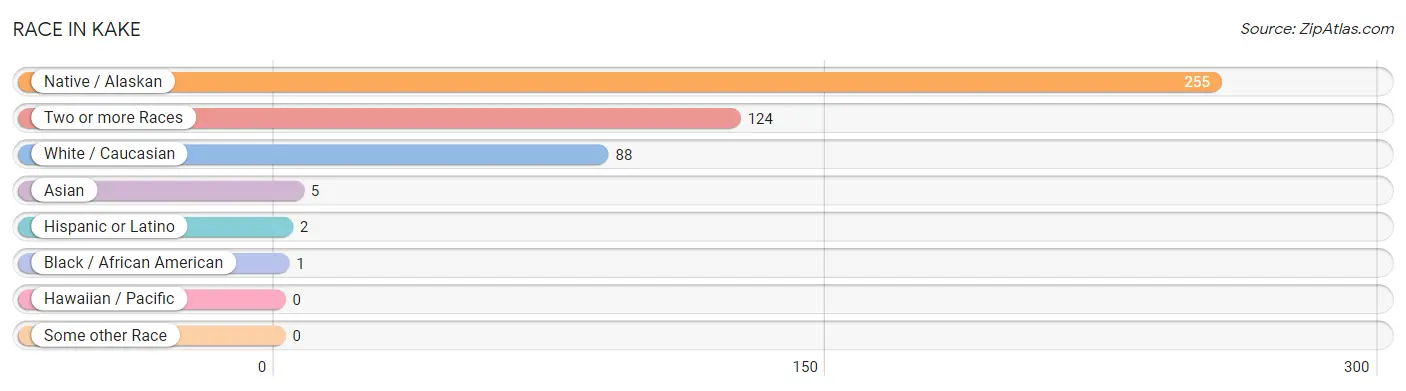
| Race | # Population | % Population |
| Asian | 5 | 1.1% |
| Black / African American | 1 | 0.2% |
| Hawaiian / Pacific | 0 | 0.0% |
| Hispanic or Latino | 2 | 0.4% |
| Native / Alaskan | 255 | 53.9% |
| White / Caucasian | 88 | 18.6% |
| Two or more Races | 124 | 26.2% |
| Some other Race | 0 | 0.0% |
| Total | 473 | 100.0% |
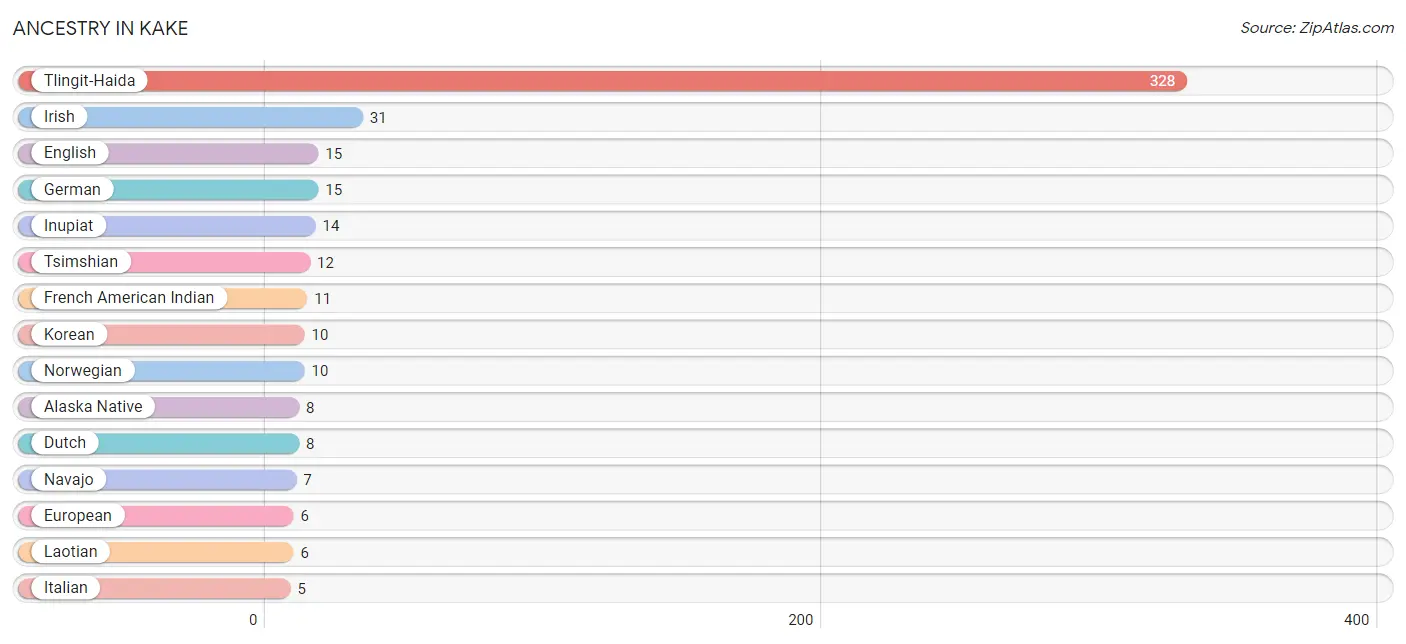
Ancestry in Kake
The most populous ancestries reported in Kake are Tlingit-Haida (328 | 69.3%), Irish (31 | 6.6%), English (15 | 3.2%), German (15 | 3.2%), and Inupiat (14 | 3.0%), together accounting for 85.2% of all Kake residents.
| Ancestry | # Population | % Population |
| African | 4 | 0.9% |
| Alaska Native | 8 | 1.7% |
| Aleut | 1 | 0.2% |
| Canadian | 2 | 0.4% |
| Czechoslovakian | 2 | 0.4% |
| Dutch | 8 | 1.7% |
| English | 15 | 3.2% |
| European | 6 | 1.3% |
| French | 3 | 0.6% |
| French American Indian | 11 | 2.3% |
| German | 15 | 3.2% |
| Inupiat | 14 | 3.0% |
| Irish | 31 | 6.6% |
| Italian | 5 | 1.1% |
| Korean | 10 | 2.1% |
| Laotian | 6 | 1.3% |
| Native Hawaiian | 2 | 0.4% |
| Navajo | 7 | 1.5% |
| Norwegian | 10 | 2.1% |
| Slovak | 2 | 0.4% |
| Subsaharan African | 4 | 0.9% |
| Tlingit-Haida | 328 | 69.3% |
| Tsimshian | 12 | 2.5% |
| Yakama | 2 | 0.4% | View All 24 Rows |
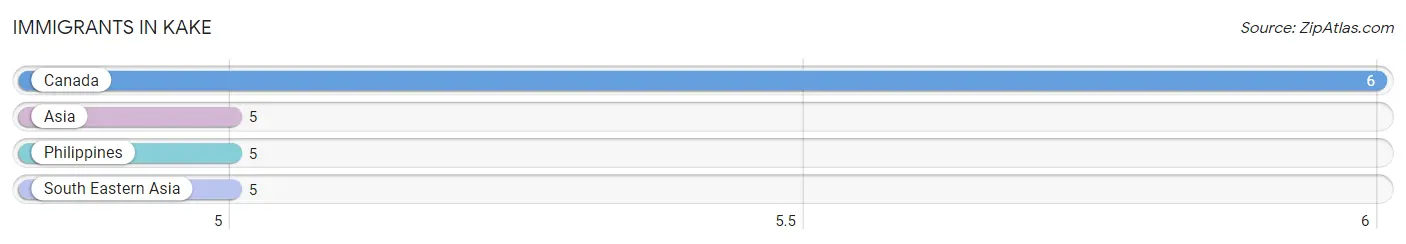
Immigrants in Kake
The most numerous immigrant groups reported in Kake came from Canada (6 | 1.3%), Asia (5 | 1.1%), Philippines (5 | 1.1%), and South Eastern Asia (5 | 1.1%), together accounting for 4.4% of all Kake residents.
| Immigration Origin | # Population | % Population |
| Asia | 5 | 1.1% |
| Canada | 6 | 1.3% |
| Philippines | 5 | 1.1% |
| South Eastern Asia | 5 | 1.1% | View All 4 Rows |
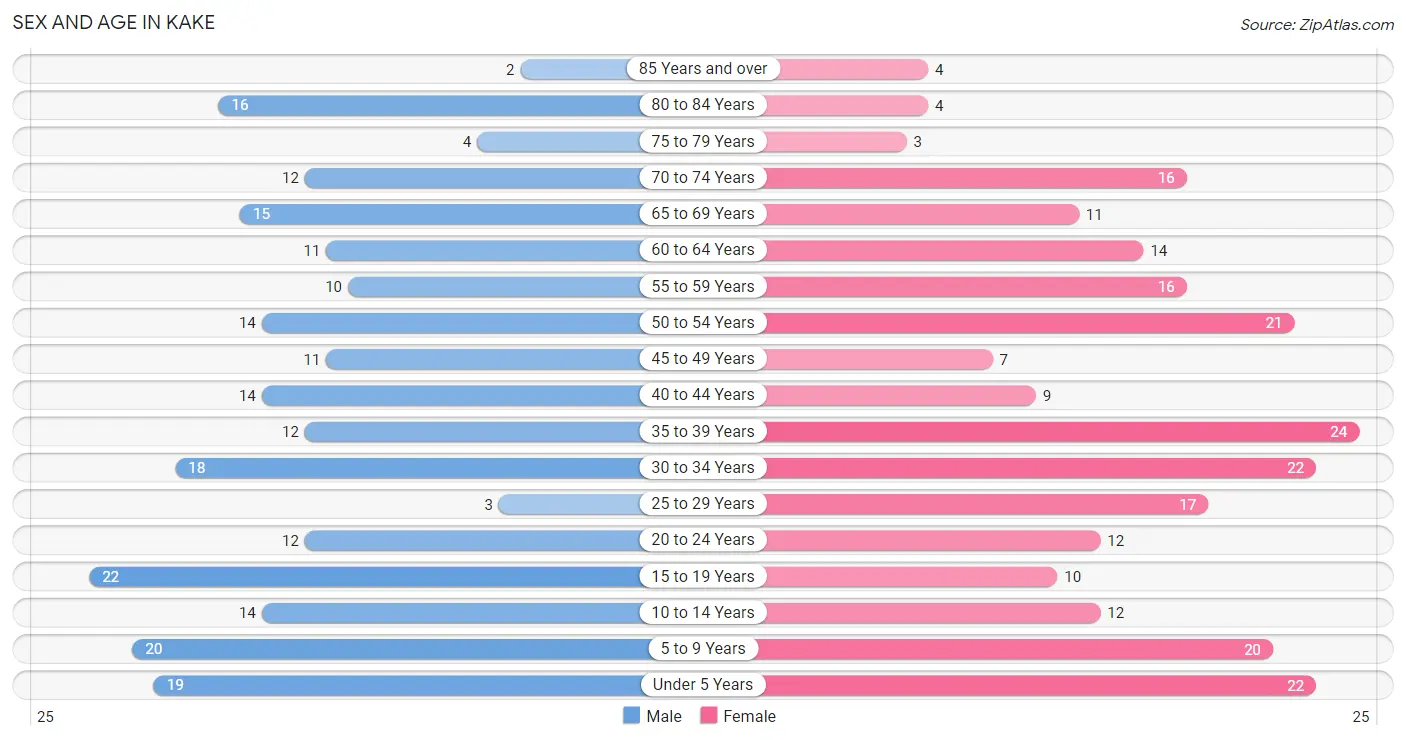
Sex and Age in Kake
Sex and Age in Kake
The most populous age groups in Kake are 15 to 19 Years (22 | 9.6%) for men and 35 to 39 Years (24 | 9.8%) for women.
| Age Bracket | Male | Female |
| Under 5 Years | 19 (8.3%) | 22 (9.0%) |
| 5 to 9 Years | 20 (8.7%) | 20 (8.2%) |
| 10 to 14 Years | 14 (6.1%) | 12 (4.9%) |
| 15 to 19 Years | 22 (9.6%) | 10 (4.1%) |
| 20 to 24 Years | 12 (5.2%) | 12 (4.9%) |
| 25 to 29 Years | 3 (1.3%) | 17 (7.0%) |
| 30 to 34 Years | 18 (7.9%) | 22 (9.0%) |
| 35 to 39 Years | 12 (5.2%) | 24 (9.8%) |
| 40 to 44 Years | 14 (6.1%) | 9 (3.7%) |
| 45 to 49 Years | 11 (4.8%) | 7 (2.9%) |
| 50 to 54 Years | 14 (6.1%) | 21 (8.6%) |
| 55 to 59 Years | 10 (4.4%) | 16 (6.6%) |
| 60 to 64 Years | 11 (4.8%) | 14 (5.7%) |
| 65 to 69 Years | 15 (6.6%) | 11 (4.5%) |
| 70 to 74 Years | 12 (5.2%) | 16 (6.6%) |
| 75 to 79 Years | 4 (1.8%) | 3 (1.2%) |
| 80 to 84 Years | 16 (7.0%) | 4 (1.6%) |
| 85 Years and over | 2 (0.9%) | 4 (1.6%) |
| Total | 229 (100.0%) | 244 (100.0%) |
Families and Households in Kake
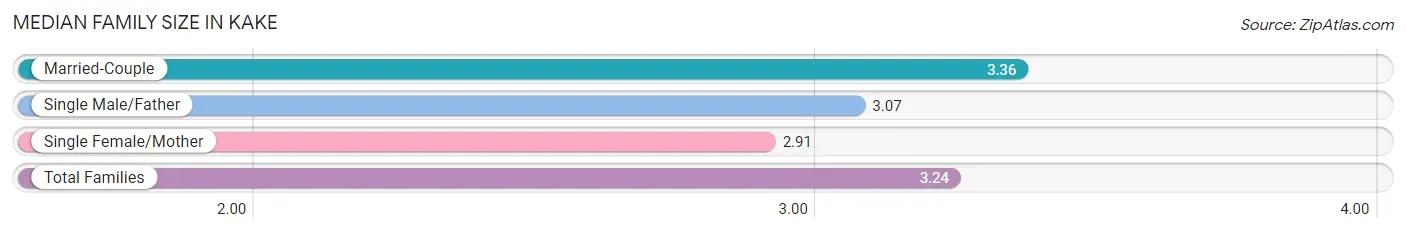
Median Family Size in Kake
The median family size in Kake is 3.24 persons per family, with married-couple families (87 | 70.7%) accounting for the largest median family size of 3.36 persons per family. On the other hand, single female/mother families (22 | 17.9%) represent the smallest median family size with 2.91 persons per family.
| Family Type | # Families | Family Size |
| Married-Couple | 87 (70.7%) | 3.36 |
| Single Male/Father | 14 (11.4%) | 3.07 |
| Single Female/Mother | 22 (17.9%) | 2.91 |
| Total Families | 123 (100.0%) | 3.24 |
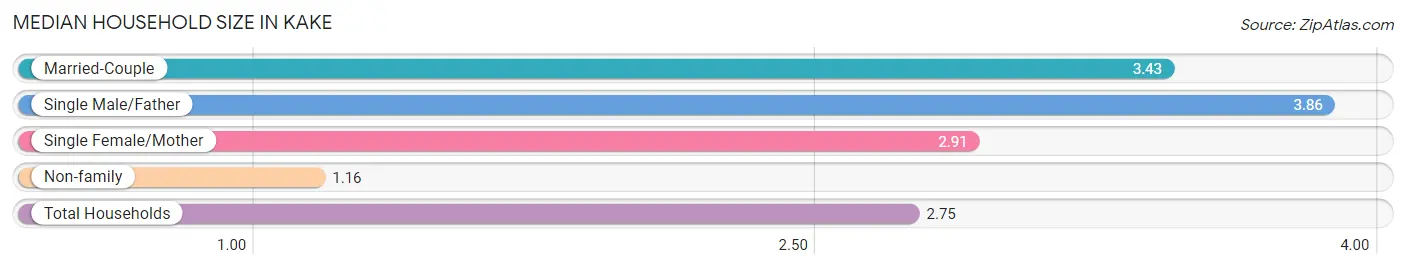
Median Household Size in Kake
The median household size in Kake is 2.75 persons per household, with single male/father households (14 | 8.1%) accounting for the largest median household size of 3.86 persons per household. non-family households (49 | 28.5%) represent the smallest median household size with 1.16 persons per household.
| Household Type | # Households | Household Size |
| Married-Couple | 87 (50.6%) | 3.43 |
| Single Male/Father | 14 (8.1%) | 3.86 |
| Single Female/Mother | 22 (12.8%) | 2.91 |
| Non-family | 49 (28.5%) | 1.16 |
| Total Households | 172 (100.0%) | 2.75 |
Household Size by Marriage Status in Kake
Out of a total of 172 households in Kake, 123 (71.5%) are family households, while 49 (28.5%) are nonfamily households. The most numerous type of family households are 2-person households, comprising 46, and the most common type of nonfamily households are 1-person households, comprising 40.
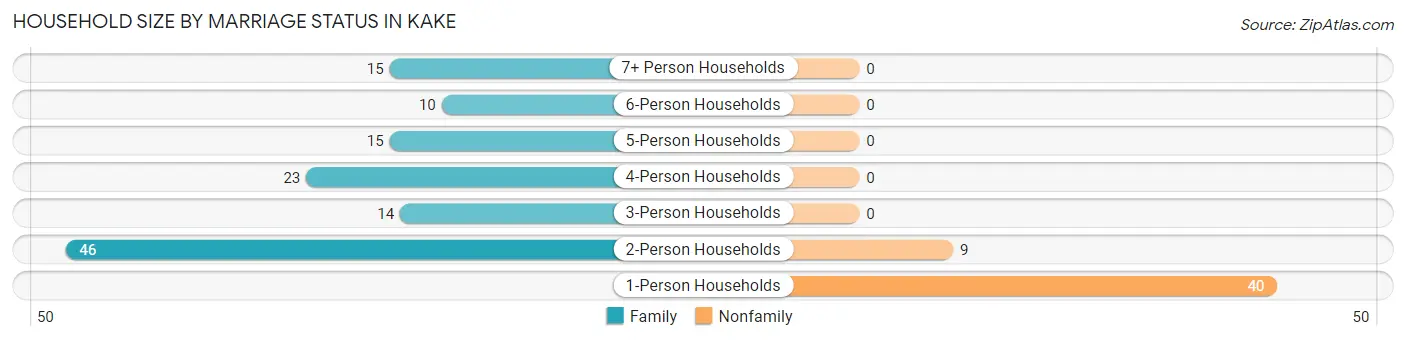
| Household Size | Family Households | Nonfamily Households |
| 1-Person Households | - | 40 (23.3%) |
| 2-Person Households | 46 (26.7%) | 9 (5.2%) |
| 3-Person Households | 14 (8.1%) | 0 (0.0%) |
| 4-Person Households | 23 (13.4%) | 0 (0.0%) |
| 5-Person Households | 15 (8.7%) | 0 (0.0%) |
| 6-Person Households | 10 (5.8%) | 0 (0.0%) |
| 7+ Person Households | 15 (8.7%) | 0 (0.0%) |
| Total | 123 (71.5%) | 49 (28.5%) |
Female Fertility in Kake
Fertility by Age in Kake
Average fertility rate in Kake is 83.0 births per 1,000 women. Women in the age bracket of 20 to 34 years have the highest fertility rate with 176.0 births per 1,000 women. Women in the age bracket of 20 to 34 years acount for 100.0% of all women with births.
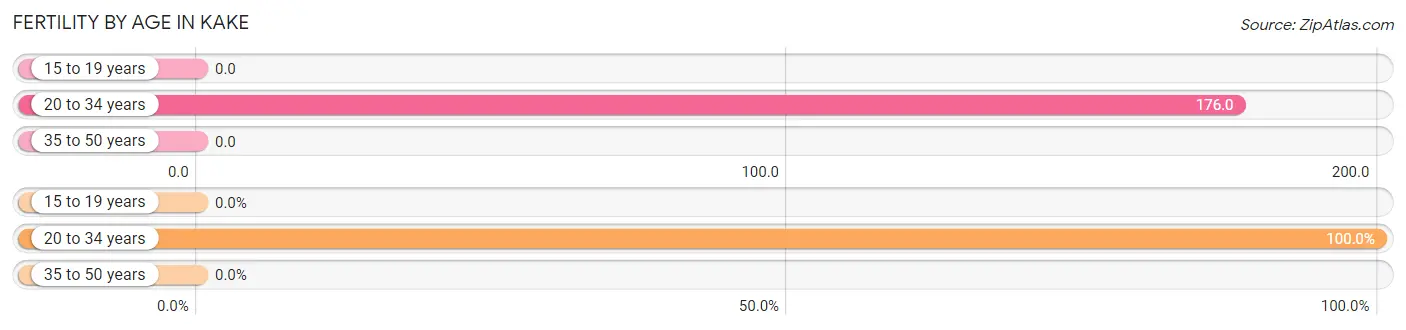
| Age Bracket | Women with Births | Births / 1,000 Women |
| 15 to 19 years | 0 (0.0%) | 0.0 |
| 20 to 34 years | 9 (100.0%) | 176.0 |
| 35 to 50 years | 0 (0.0%) | 0.0 |
| Total | 9 (100.0%) | 83.0 |
Fertility by Age by Marriage Status in Kake
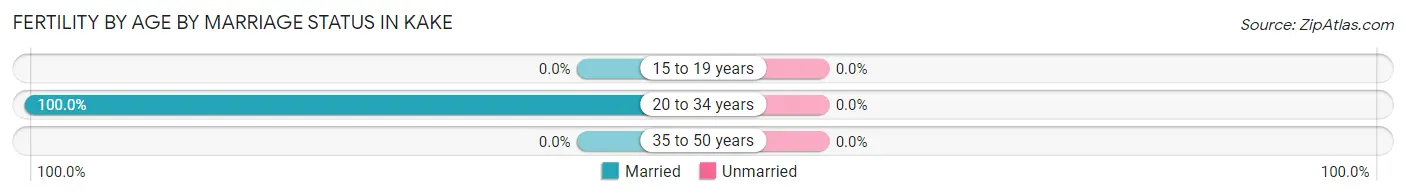
| Age Bracket | Married | Unmarried |
| 15 to 19 years | 0 (0.0%) | 0 (0.0%) |
| 20 to 34 years | 9 (100.0%) | 0 (0.0%) |
| 35 to 50 years | 0 (0.0%) | 0 (0.0%) |
| Total | 9 (100.0%) | 0 (0.0%) |
Fertility by Education in Kake
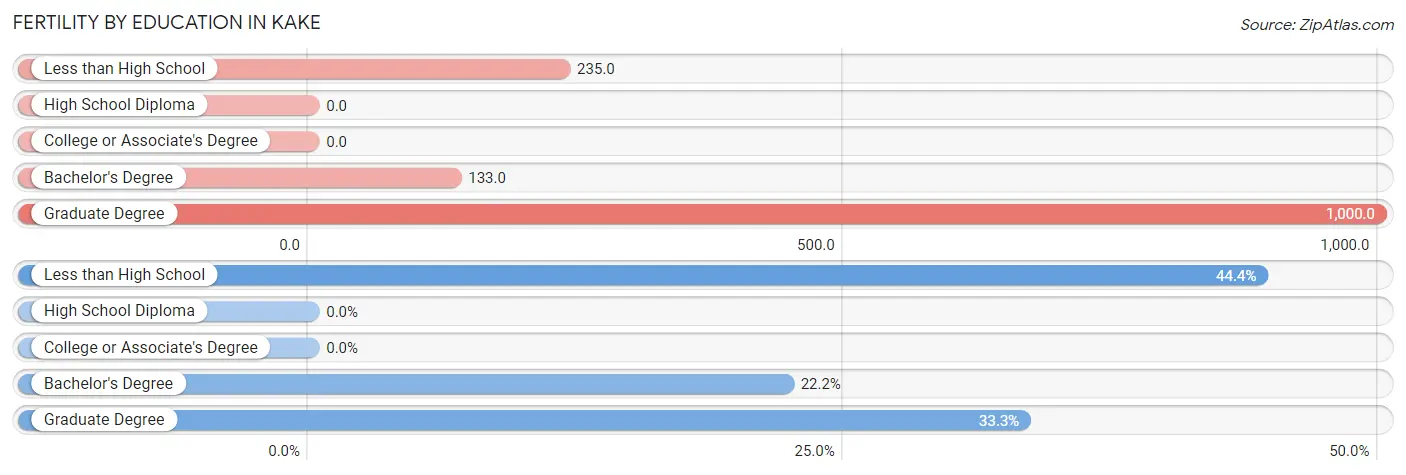
| Educational Attainment | Women with Births | Births / 1,000 Women |
| Less than High School | 4 (44.4%) | 235.0 |
| High School Diploma | 0 (0.0%) | 0.0 |
| College or Associate's Degree | 0 (0.0%) | 0.0 |
| Bachelor's Degree | 2 (22.2%) | 133.0 |
| Graduate Degree | 3 (33.3%) | 1,000.0 |
| Total | 9 (100.0%) | 83.0 |
Fertility by Education by Marriage Status in Kake
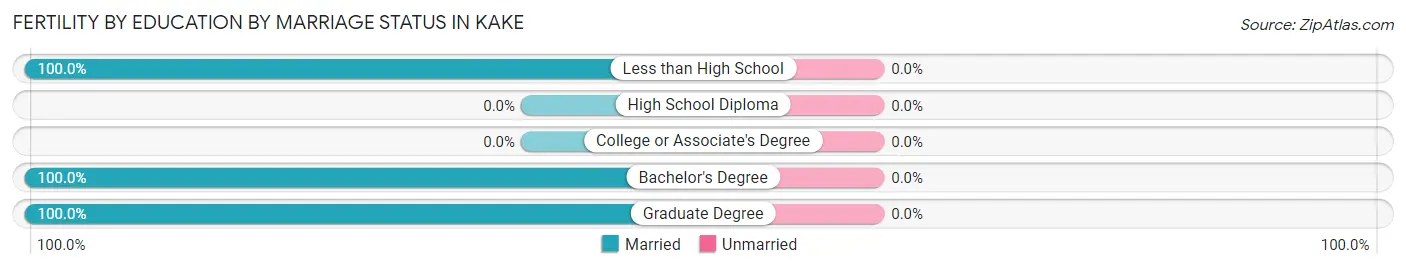
| Educational Attainment | Married | Unmarried |
| Less than High School | 4 (100.0%) | 0 (0.0%) |
| High School Diploma | 0 (0.0%) | 0 (0.0%) |
| College or Associate's Degree | 0 (0.0%) | 0 (0.0%) |
| Bachelor's Degree | 2 (100.0%) | 0 (0.0%) |
| Graduate Degree | 3 (100.0%) | 0 (0.0%) |
| Total | 9 (100.0%) | 0 (0.0%) |
Employment Characteristics in Kake
Employment by Class of Employer in Kake
Among the 178 employed individuals in Kake, local government employees (69 | 38.8%), private company employees (52 | 29.2%), and state government employees (20 | 11.2%) make up the most common classes of employment.
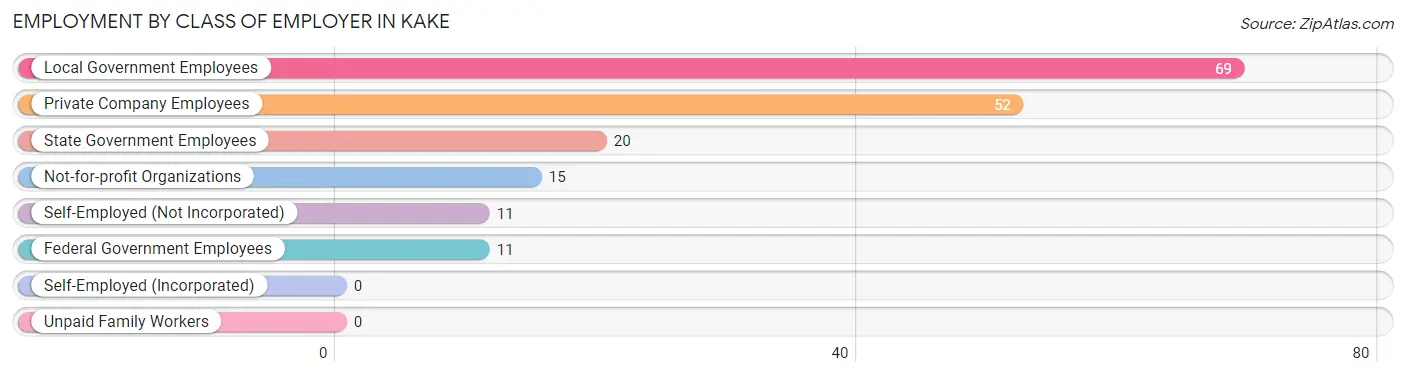
| Employer Class | # Employees | % Employees |
| Private Company Employees | 52 | 29.2% |
| Self-Employed (Incorporated) | 0 | 0.0% |
| Self-Employed (Not Incorporated) | 11 | 6.2% |
| Not-for-profit Organizations | 15 | 8.4% |
| Local Government Employees | 69 | 38.8% |
| State Government Employees | 20 | 11.2% |
| Federal Government Employees | 11 | 6.2% |
| Unpaid Family Workers | 0 | 0.0% |
| Total | 178 | 100.0% |
Employment Status by Age in Kake
According to the labor force statistics for Kake, out of the total population over 16 years of age (362), 56.1% or 203 individuals are in the labor force, with 9.4% or 19 of them unemployed. The age group with the highest labor force participation rate is 45 to 54 years, with 94.3% or 50 individuals in the labor force. Within the labor force, the 60 to 64 years age range has the highest percentage of unemployed individuals, with 25.0% or 2 of them being unemployed.
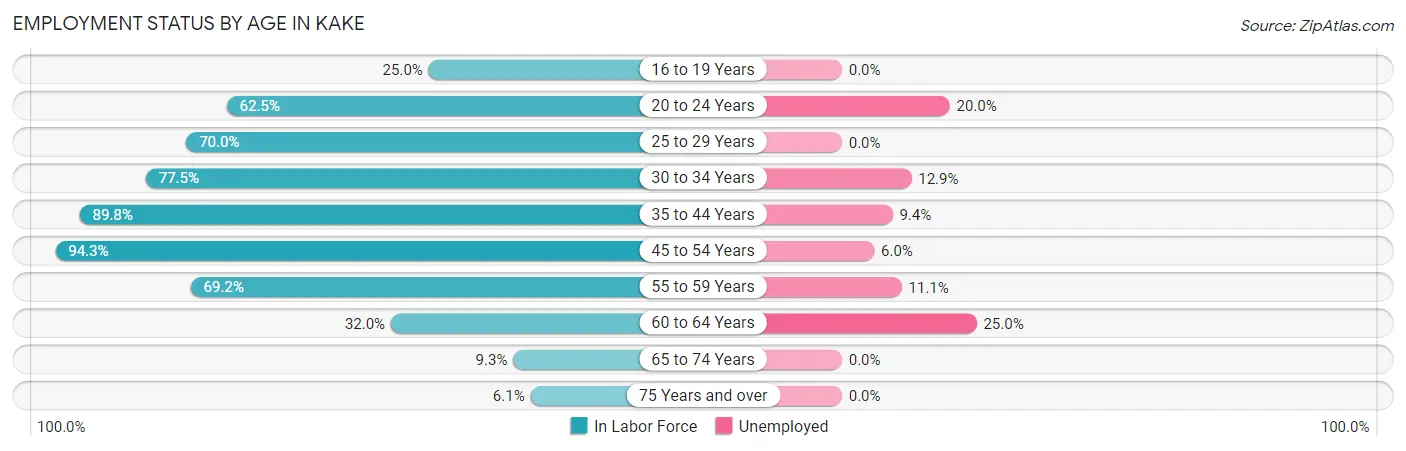
| Age Bracket | In Labor Force | Unemployed |
| 16 to 19 Years | 7 (25.0%) | 0 (0.0%) |
| 20 to 24 Years | 15 (62.5%) | 3 (20.0%) |
| 25 to 29 Years | 14 (70.0%) | 0 (0.0%) |
| 30 to 34 Years | 31 (77.5%) | 4 (12.9%) |
| 35 to 44 Years | 53 (89.8%) | 5 (9.4%) |
| 45 to 54 Years | 50 (94.3%) | 3 (6.0%) |
| 55 to 59 Years | 18 (69.2%) | 2 (11.1%) |
| 60 to 64 Years | 8 (32.0%) | 2 (25.0%) |
| 65 to 74 Years | 5 (9.3%) | 0 (0.0%) |
| 75 Years and over | 2 (6.1%) | 0 (0.0%) |
| Total | 203 (56.1%) | 19 (9.4%) |
Employment Status by Educational Attainment in Kake
According to labor force statistics for Kake, 78.0% of individuals (174) out of the total population between 25 and 64 years of age (223) are in the labor force, with 9.2% or 16 of them being unemployed. The group with the highest labor force participation rate are those with the educational attainment of college / associate degree, with 87.2% or 75 individuals in the labor force. Within the labor force, individuals with less than high school education have the highest percentage of unemployment, with 100.0% or 3 of them being unemployed.
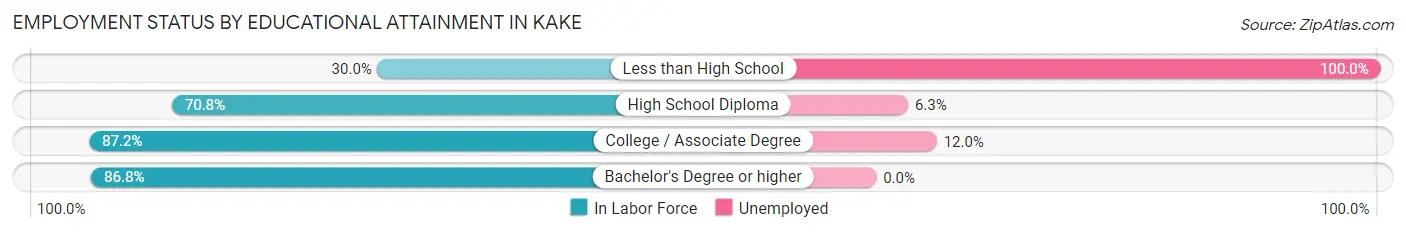
| Educational Attainment | In Labor Force | Unemployed |
| Less than High School | 3 (30.0%) | 10 (100.0%) |
| High School Diploma | 63 (70.8%) | 6 (6.3%) |
| College / Associate Degree | 75 (87.2%) | 10 (12.0%) |
| Bachelor's Degree or higher | 33 (86.8%) | 0 (0.0%) |
| Total | 174 (78.0%) | 21 (9.2%) |
Employment Occupations by Sex in Kake
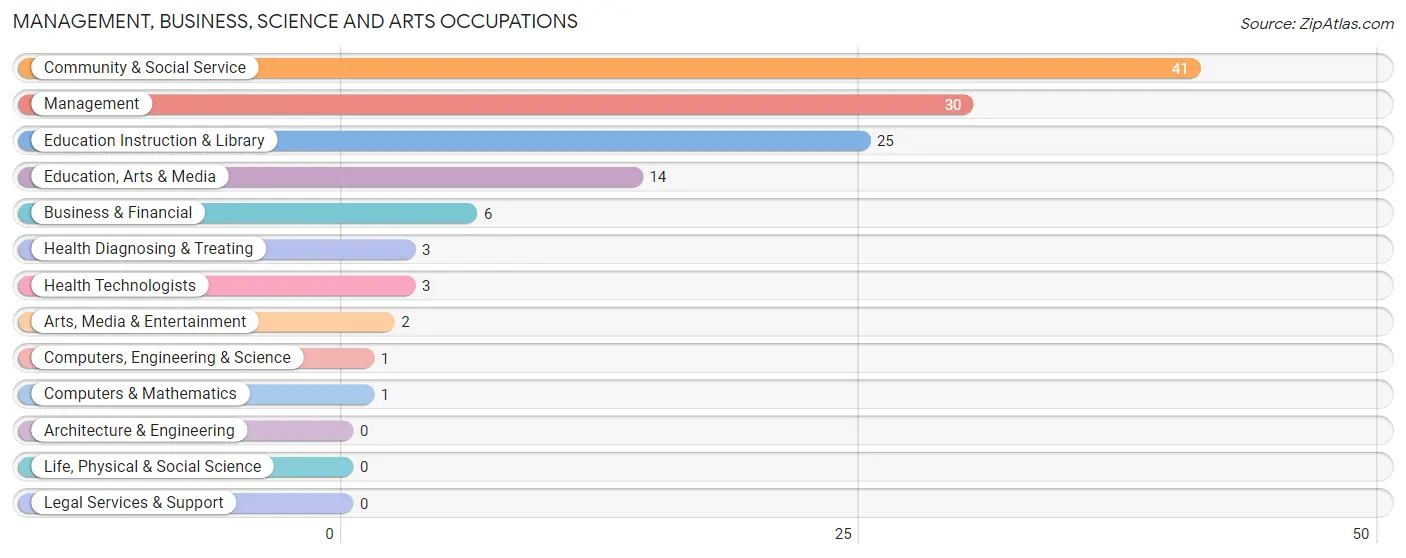
Management, Business, Science and Arts Occupations
The most common Management, Business, Science and Arts occupations in Kake are Community & Social Service (41 | 22.3%), Management (30 | 16.3%), Education Instruction & Library (25 | 13.6%), Education, Arts & Media (14 | 7.6%), and Business & Financial (6 | 3.3%).
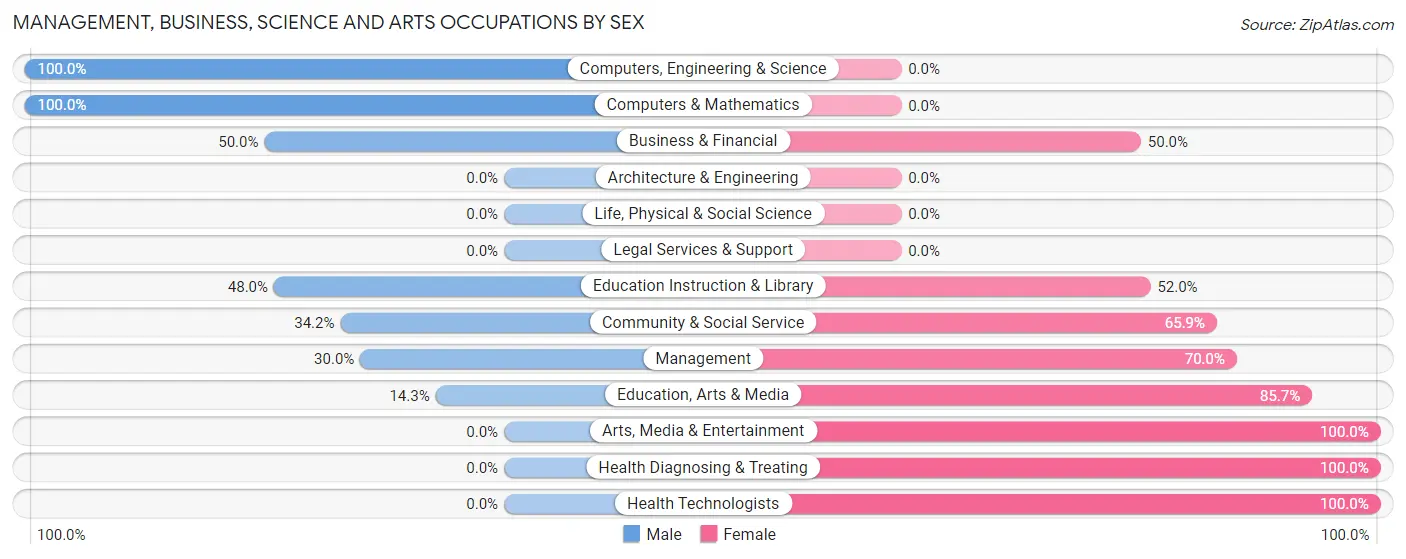
Management, Business, Science and Arts Occupations by Sex
Within the Management, Business, Science and Arts occupations in Kake, the most male-oriented occupations are Computers, Engineering & Science (100.0%), Computers & Mathematics (100.0%), and Business & Financial (50.0%), while the most female-oriented occupations are Arts, Media & Entertainment (100.0%), Health Diagnosing & Treating (100.0%), and Health Technologists (100.0%).
| Occupation | Male | Female |
| Management | 9 (30.0%) | 21 (70.0%) |
| Business & Financial | 3 (50.0%) | 3 (50.0%) |
| Computers, Engineering & Science | 1 (100.0%) | 0 (0.0%) |
| Computers & Mathematics | 1 (100.0%) | 0 (0.0%) |
| Architecture & Engineering | 0 (0.0%) | 0 (0.0%) |
| Life, Physical & Social Science | 0 (0.0%) | 0 (0.0%) |
| Community & Social Service | 14 (34.2%) | 27 (65.8%) |
| Education, Arts & Media | 2 (14.3%) | 12 (85.7%) |
| Legal Services & Support | 0 (0.0%) | 0 (0.0%) |
| Education Instruction & Library | 12 (48.0%) | 13 (52.0%) |
| Arts, Media & Entertainment | 0 (0.0%) | 2 (100.0%) |
| Health Diagnosing & Treating | 0 (0.0%) | 3 (100.0%) |
| Health Technologists | 0 (0.0%) | 3 (100.0%) |
| Total (Category) | 27 (33.3%) | 54 (66.7%) |
| Total (Overall) | 75 (40.8%) | 109 (59.2%) |
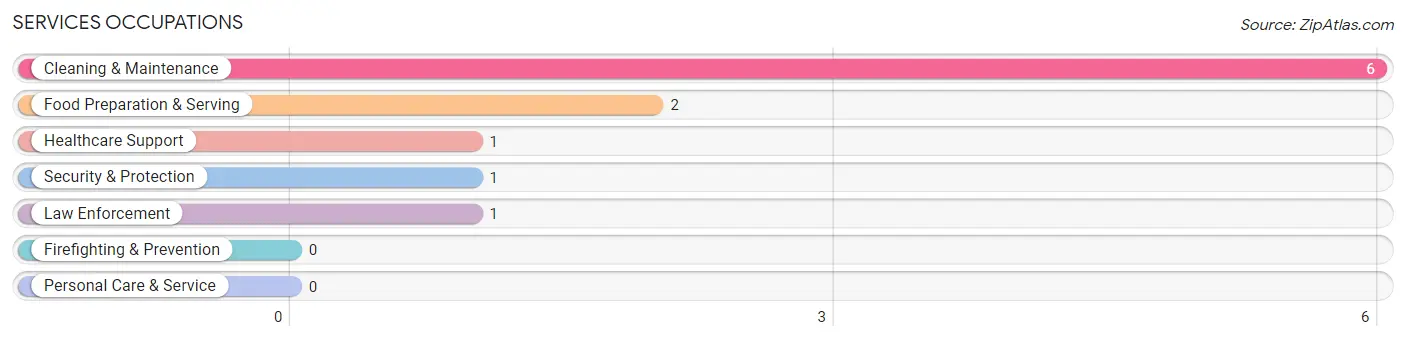
Services Occupations
The most common Services occupations in Kake are Cleaning & Maintenance (6 | 3.3%), Food Preparation & Serving (2 | 1.1%), Healthcare Support (1 | 0.5%), Security & Protection (1 | 0.5%), and Law Enforcement (1 | 0.5%).
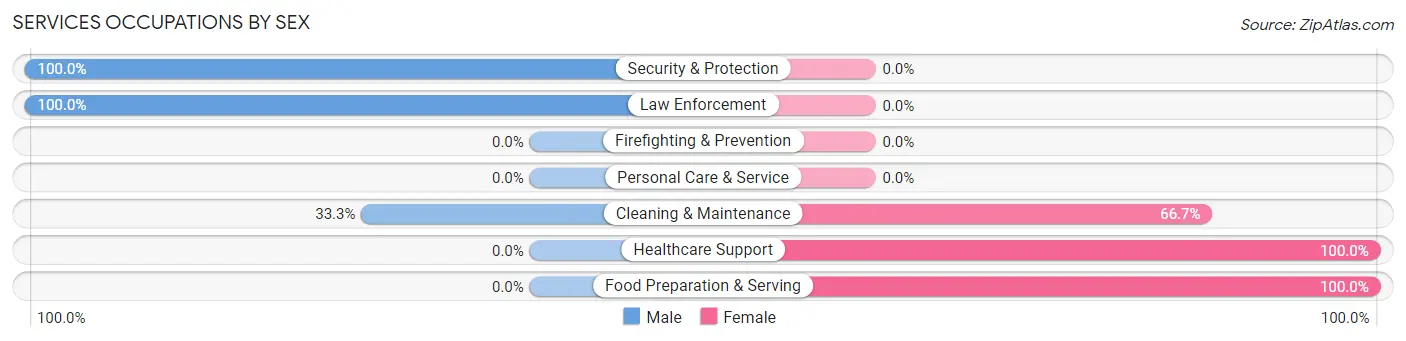
Services Occupations by Sex
Within the Services occupations in Kake, the most male-oriented occupations are Security & Protection (100.0%), Law Enforcement (100.0%), and Cleaning & Maintenance (33.3%), while the most female-oriented occupations are Healthcare Support (100.0%), Food Preparation & Serving (100.0%), and Cleaning & Maintenance (66.7%).
| Occupation | Male | Female |
| Healthcare Support | 0 (0.0%) | 1 (100.0%) |
| Security & Protection | 1 (100.0%) | 0 (0.0%) |
| Firefighting & Prevention | 0 (0.0%) | 0 (0.0%) |
| Law Enforcement | 1 (100.0%) | 0 (0.0%) |
| Food Preparation & Serving | 0 (0.0%) | 2 (100.0%) |
| Cleaning & Maintenance | 2 (33.3%) | 4 (66.7%) |
| Personal Care & Service | 0 (0.0%) | 0 (0.0%) |
| Total (Category) | 3 (30.0%) | 7 (70.0%) |
| Total (Overall) | 75 (40.8%) | 109 (59.2%) |
Sales and Office Occupations
The most common Sales and Office occupations in Kake are Office & Administration (41 | 22.3%), and Sales & Related (11 | 6.0%).
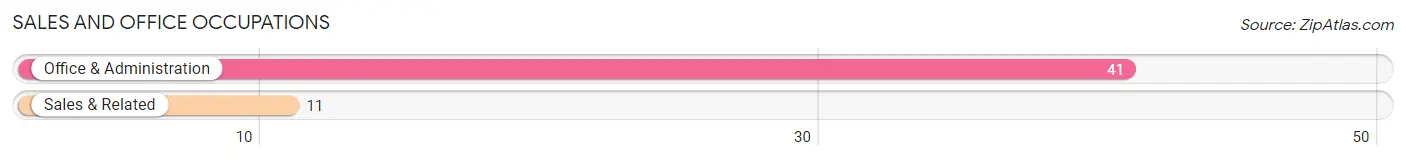
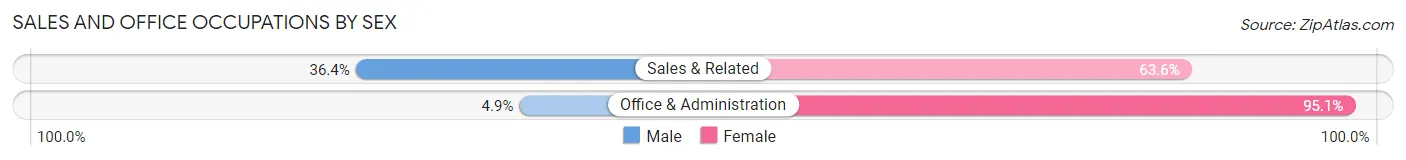
Sales and Office Occupations by Sex
| Occupation | Male | Female |
| Sales & Related | 4 (36.4%) | 7 (63.6%) |
| Office & Administration | 2 (4.9%) | 39 (95.1%) |
| Total (Category) | 6 (11.5%) | 46 (88.5%) |
| Total (Overall) | 75 (40.8%) | 109 (59.2%) |
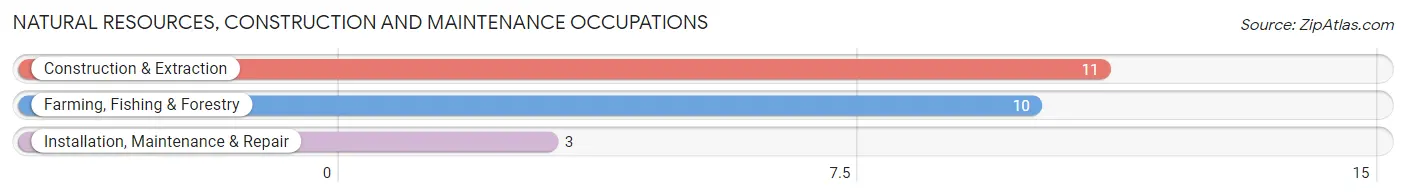
Natural Resources, Construction and Maintenance Occupations
The most common Natural Resources, Construction and Maintenance occupations in Kake are Construction & Extraction (11 | 6.0%), Farming, Fishing & Forestry (10 | 5.4%), and Installation, Maintenance & Repair (3 | 1.6%).
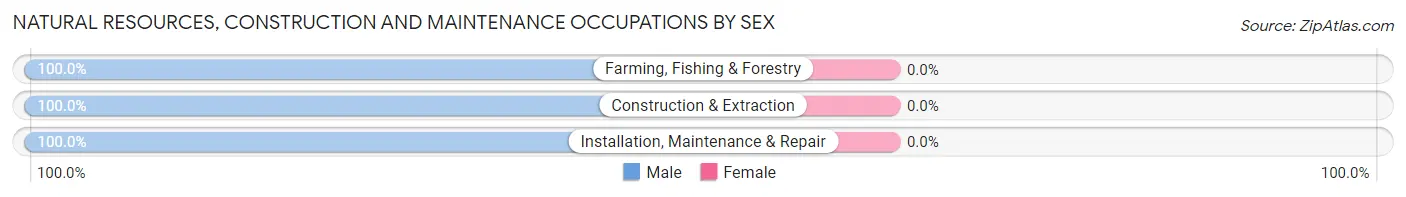
Natural Resources, Construction and Maintenance Occupations by Sex
| Occupation | Male | Female |
| Farming, Fishing & Forestry | 10 (100.0%) | 0 (0.0%) |
| Construction & Extraction | 11 (100.0%) | 0 (0.0%) |
| Installation, Maintenance & Repair | 3 (100.0%) | 0 (0.0%) |
| Total (Category) | 24 (100.0%) | 0 (0.0%) |
| Total (Overall) | 75 (40.8%) | 109 (59.2%) |
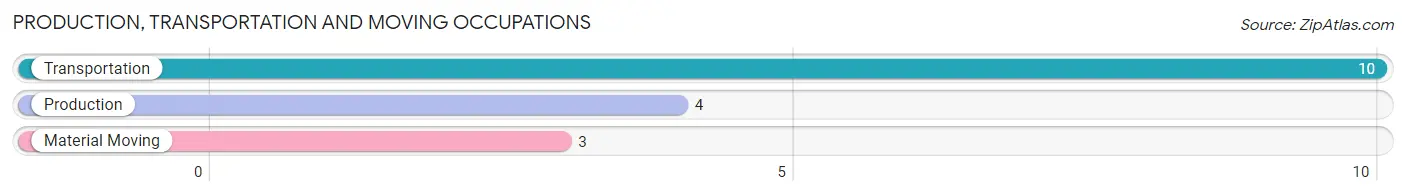
Production, Transportation and Moving Occupations
The most common Production, Transportation and Moving occupations in Kake are Transportation (10 | 5.4%), Production (4 | 2.2%), and Material Moving (3 | 1.6%).
Production, Transportation and Moving Occupations by Sex
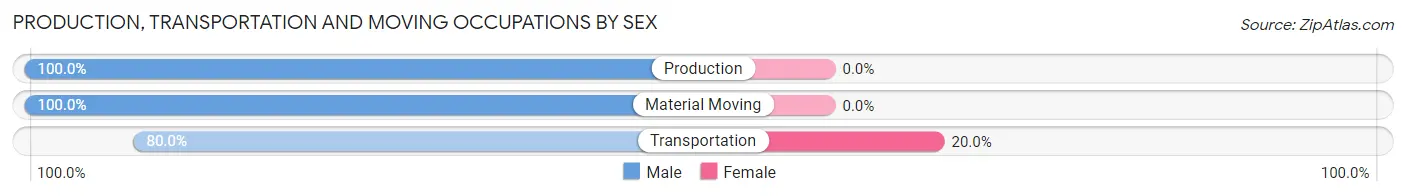
| Occupation | Male | Female |
| Production | 4 (100.0%) | 0 (0.0%) |
| Transportation | 8 (80.0%) | 2 (20.0%) |
| Material Moving | 3 (100.0%) | 0 (0.0%) |
| Total (Category) | 15 (88.2%) | 2 (11.8%) |
| Total (Overall) | 75 (40.8%) | 109 (59.2%) |
Employment Industries by Sex in Kake
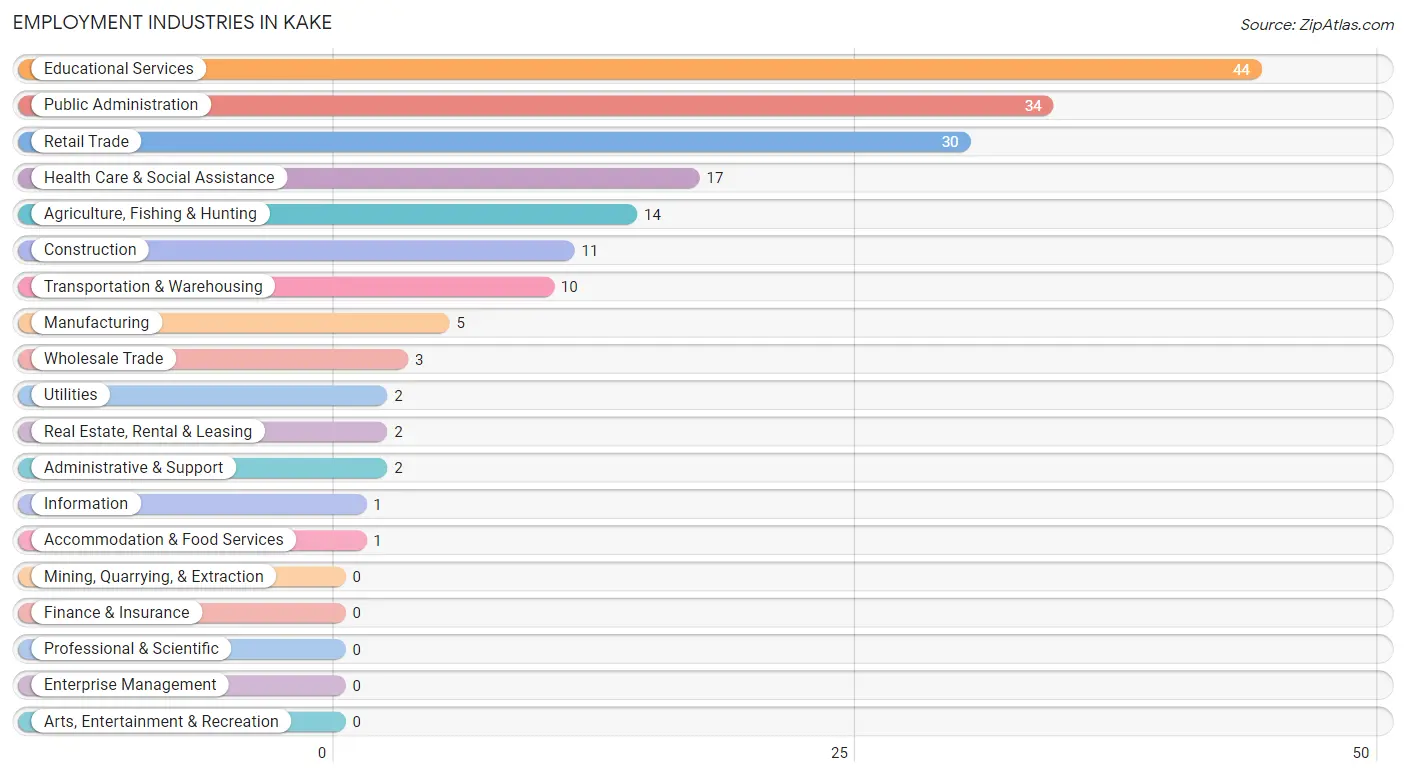
Employment Industries in Kake
The major employment industries in Kake include Educational Services (44 | 23.9%), Public Administration (34 | 18.5%), Retail Trade (30 | 16.3%), Health Care & Social Assistance (17 | 9.2%), and Agriculture, Fishing & Hunting (14 | 7.6%).
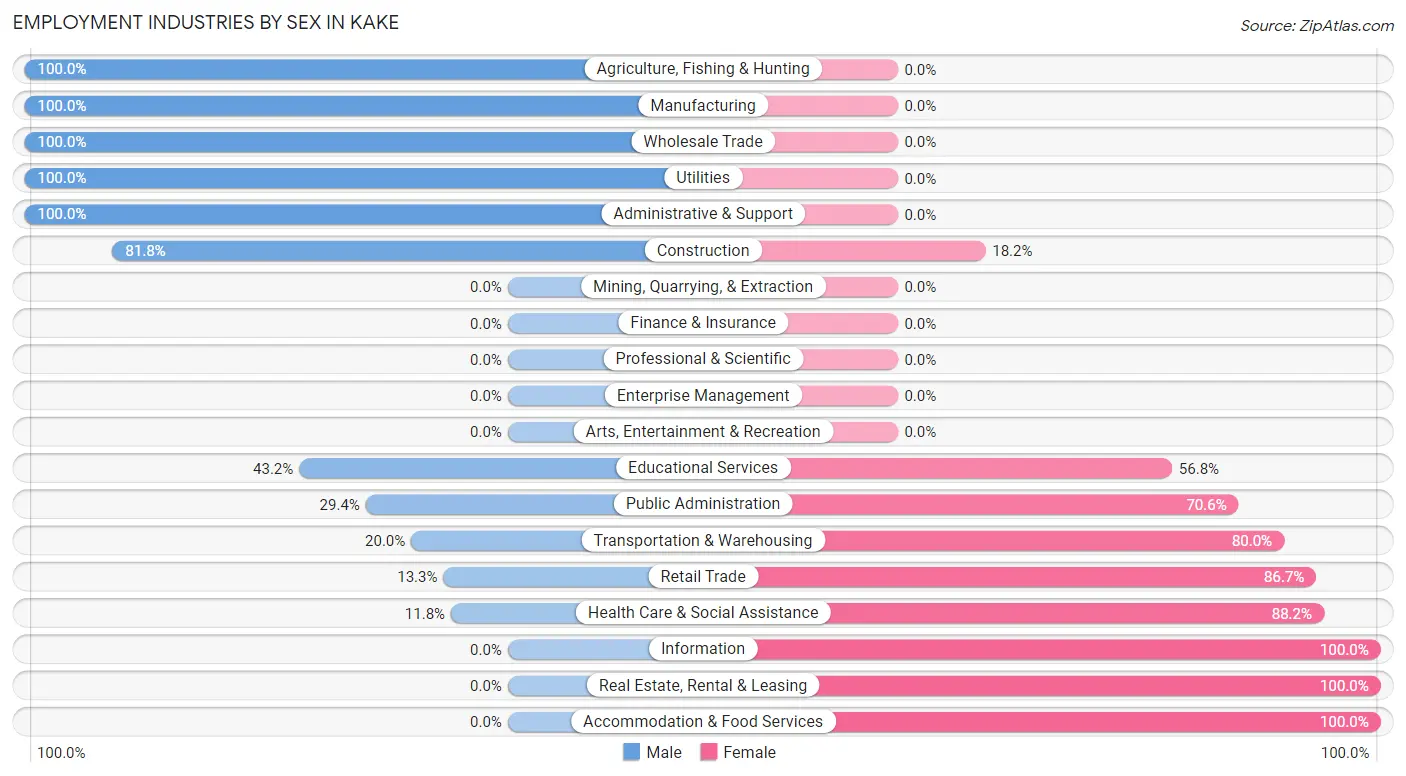
Employment Industries by Sex in Kake
The Kake industries that see more men than women are Agriculture, Fishing & Hunting (100.0%), Manufacturing (100.0%), and Wholesale Trade (100.0%), whereas the industries that tend to have a higher number of women are Information (100.0%), Real Estate, Rental & Leasing (100.0%), and Accommodation & Food Services (100.0%).
| Industry | Male | Female |
| Agriculture, Fishing & Hunting | 14 (100.0%) | 0 (0.0%) |
| Mining, Quarrying, & Extraction | 0 (0.0%) | 0 (0.0%) |
| Construction | 9 (81.8%) | 2 (18.2%) |
| Manufacturing | 5 (100.0%) | 0 (0.0%) |
| Wholesale Trade | 3 (100.0%) | 0 (0.0%) |
| Retail Trade | 4 (13.3%) | 26 (86.7%) |
| Transportation & Warehousing | 2 (20.0%) | 8 (80.0%) |
| Utilities | 2 (100.0%) | 0 (0.0%) |
| Information | 0 (0.0%) | 1 (100.0%) |
| Finance & Insurance | 0 (0.0%) | 0 (0.0%) |
| Real Estate, Rental & Leasing | 0 (0.0%) | 2 (100.0%) |
| Professional & Scientific | 0 (0.0%) | 0 (0.0%) |
| Enterprise Management | 0 (0.0%) | 0 (0.0%) |
| Administrative & Support | 2 (100.0%) | 0 (0.0%) |
| Educational Services | 19 (43.2%) | 25 (56.8%) |
| Health Care & Social Assistance | 2 (11.8%) | 15 (88.2%) |
| Arts, Entertainment & Recreation | 0 (0.0%) | 0 (0.0%) |
| Accommodation & Food Services | 0 (0.0%) | 1 (100.0%) |
| Public Administration | 10 (29.4%) | 24 (70.6%) |
| Total | 75 (40.8%) | 109 (59.2%) |
Education in Kake
School Enrollment in Kake
The most common levels of schooling among the 126 students in Kake are high school (33 | 26.2%), elementary school (32 | 25.4%), and middle school (24 | 19.1%).
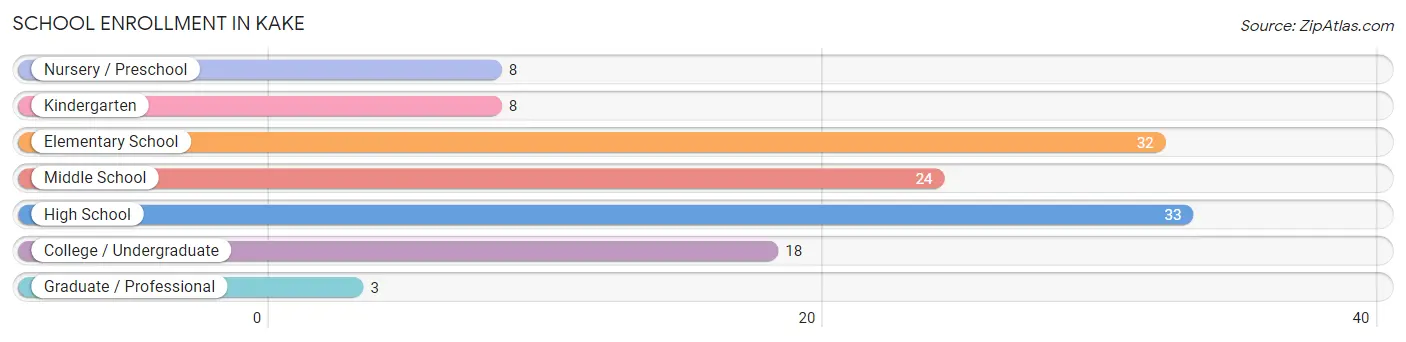
| School Level | # Students | % Students |
| Nursery / Preschool | 8 | 6.4% |
| Kindergarten | 8 | 6.4% |
| Elementary School | 32 | 25.4% |
| Middle School | 24 | 19.1% |
| High School | 33 | 26.2% |
| College / Undergraduate | 18 | 14.3% |
| Graduate / Professional | 3 | 2.4% |
| Total | 126 | 100.0% |
School Enrollment by Age by Funding Source in Kake
Out of a total of 126 students who are enrolled in schools in Kake, 1 (0.8%) attend a private institution, while the remaining 125 (99.2%) are enrolled in public schools. The age group of 35 years and over has the highest likelihood of being enrolled in private schools, with 1 (12.5% in the age bracket) enrolled. Conversely, the age group of 3 to 4 year olds has the lowest likelihood of being enrolled in a private school, with 8 (100.0% in the age bracket) attending a public institution.
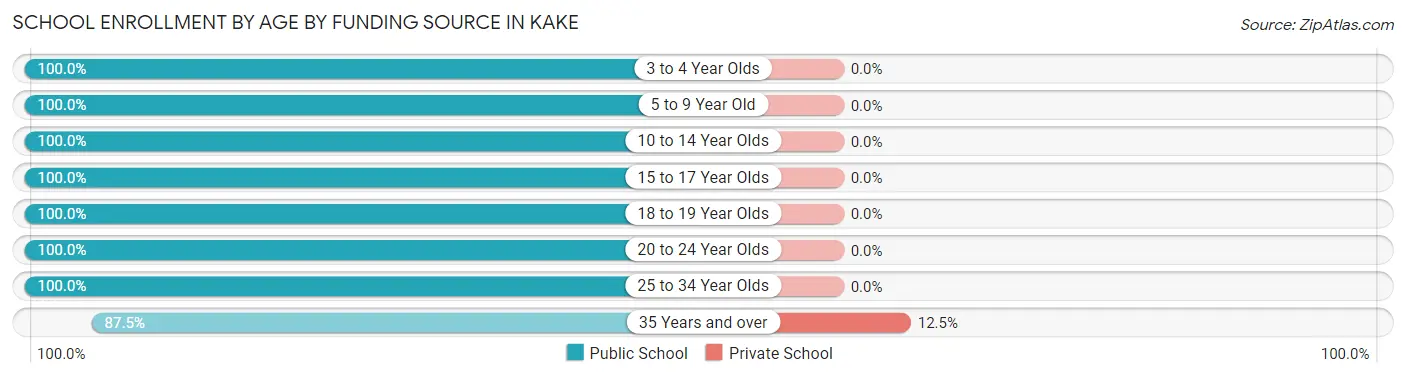
| Age Bracket | Public School | Private School |
| 3 to 4 Year Olds | 8 (100.0%) | 0 (0.0%) |
| 5 to 9 Year Old | 40 (100.0%) | 0 (0.0%) |
| 10 to 14 Year Olds | 26 (100.0%) | 0 (0.0%) |
| 15 to 17 Year Olds | 22 (100.0%) | 0 (0.0%) |
| 18 to 19 Year Olds | 9 (100.0%) | 0 (0.0%) |
| 20 to 24 Year Olds | 6 (100.0%) | 0 (0.0%) |
| 25 to 34 Year Olds | 7 (100.0%) | 0 (0.0%) |
| 35 Years and over | 7 (87.5%) | 1 (12.5%) |
| Total | 125 (99.2%) | 1 (0.8%) |
Educational Attainment by Field of Study in Kake
Education (23 | 39.0%), business (12 | 20.3%), science & technology (8 | 13.6%), computers & mathematics (5 | 8.5%), and liberal arts & history (5 | 8.5%) are the most common fields of study among 59 individuals in Kake who have obtained a bachelor's degree or higher.
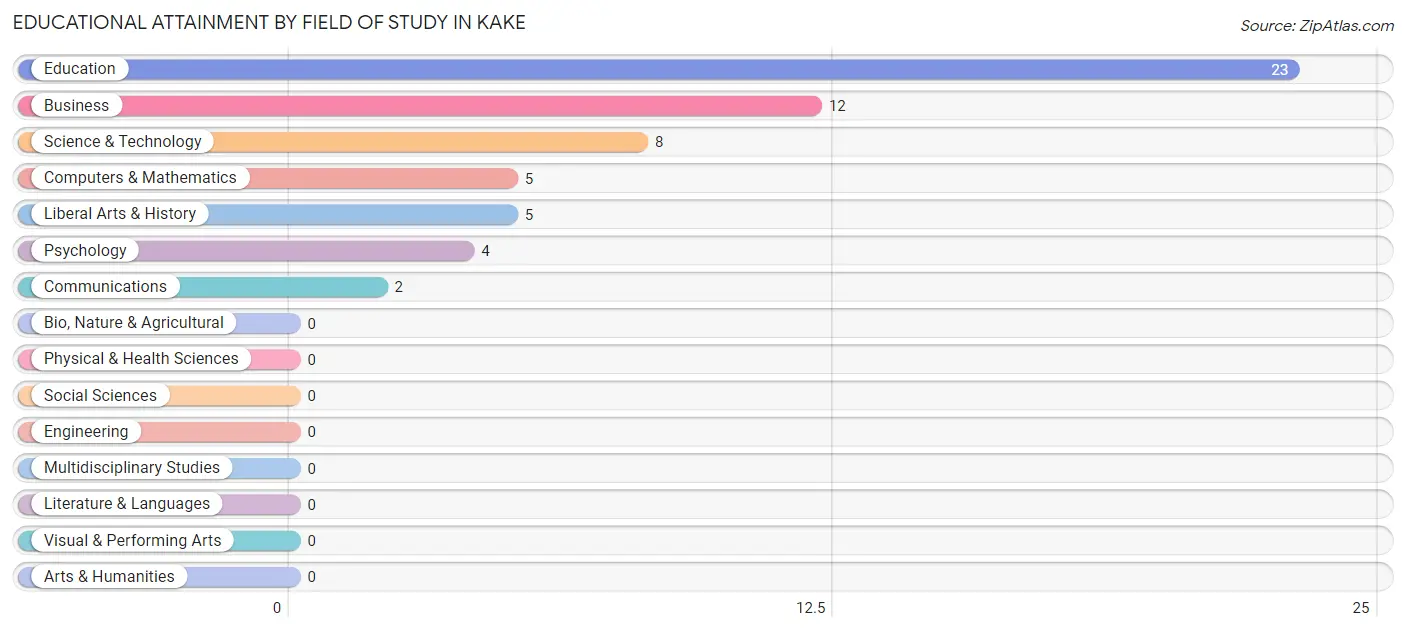
| Field of Study | # Graduates | % Graduates |
| Computers & Mathematics | 5 | 8.5% |
| Bio, Nature & Agricultural | 0 | 0.0% |
| Physical & Health Sciences | 0 | 0.0% |
| Psychology | 4 | 6.8% |
| Social Sciences | 0 | 0.0% |
| Engineering | 0 | 0.0% |
| Multidisciplinary Studies | 0 | 0.0% |
| Science & Technology | 8 | 13.6% |
| Business | 12 | 20.3% |
| Education | 23 | 39.0% |
| Literature & Languages | 0 | 0.0% |
| Liberal Arts & History | 5 | 8.5% |
| Visual & Performing Arts | 0 | 0.0% |
| Communications | 2 | 3.4% |
| Arts & Humanities | 0 | 0.0% |
| Total | 59 | 100.0% |
Transportation & Commute in Kake
Vehicle Availability by Sex in Kake
The most prevalent vehicle ownership categories in Kake are males with 2 vehicles (35, accounting for 47.3%) and females with 2 vehicles (37, making up 33.7%).
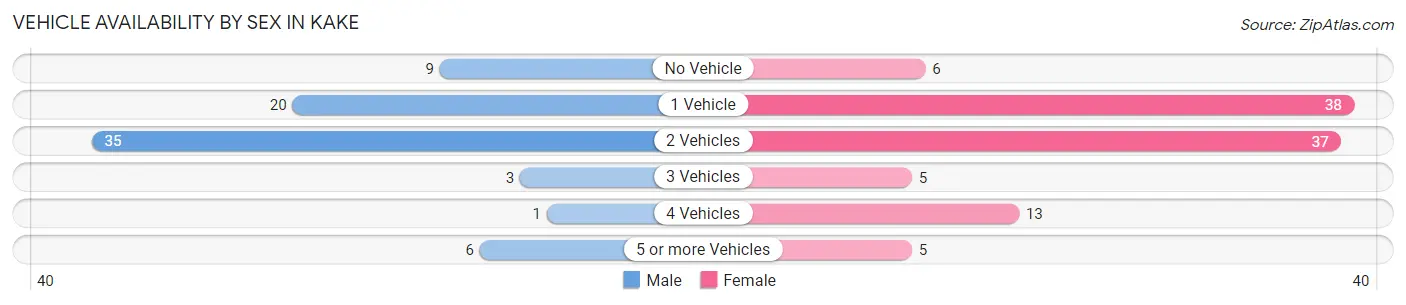
| Vehicles Available | Male | Female |
| No Vehicle | 9 (12.2%) | 6 (5.8%) |
| 1 Vehicle | 20 (27.0%) | 38 (36.5%) |
| 2 Vehicles | 35 (47.3%) | 37 (35.6%) |
| 3 Vehicles | 3 (4.1%) | 5 (4.8%) |
| 4 Vehicles | 1 (1.3%) | 13 (12.5%) |
| 5 or more Vehicles | 6 (8.1%) | 5 (4.8%) |
| Total | 74 (100.0%) | 104 (100.0%) |
Commute Time in Kake
The most frequently occuring commute durations in Kake are 5 to 9 minutes (100 commuters, 57.1%), less than 5 minutes (61 commuters, 34.9%), and 10 to 14 minutes (9 commuters, 5.1%).
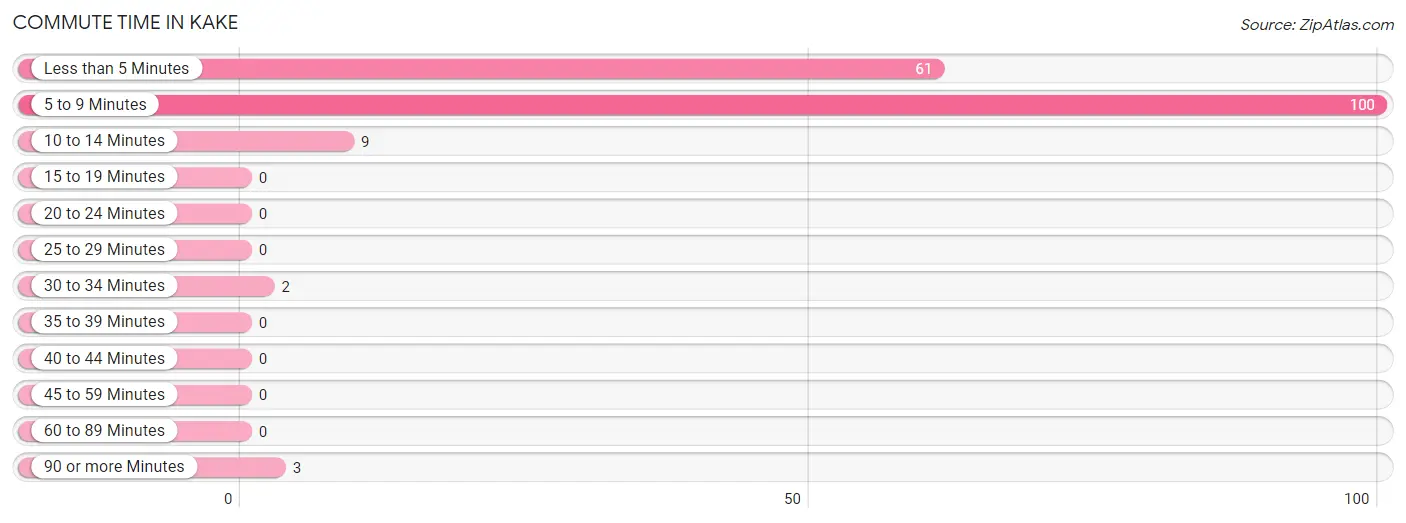
| Commute Time | # Commuters | % Commuters |
| Less than 5 Minutes | 61 | 34.9% |
| 5 to 9 Minutes | 100 | 57.1% |
| 10 to 14 Minutes | 9 | 5.1% |
| 15 to 19 Minutes | 0 | 0.0% |
| 20 to 24 Minutes | 0 | 0.0% |
| 25 to 29 Minutes | 0 | 0.0% |
| 30 to 34 Minutes | 2 | 1.1% |
| 35 to 39 Minutes | 0 | 0.0% |
| 40 to 44 Minutes | 0 | 0.0% |
| 45 to 59 Minutes | 0 | 0.0% |
| 60 to 89 Minutes | 0 | 0.0% |
| 90 or more Minutes | 3 | 1.7% |
Commute Time by Sex in Kake
The most common commute times in Kake are 5 to 9 minutes (35 commuters, 47.3%) for males and 5 to 9 minutes (65 commuters, 64.4%) for females.
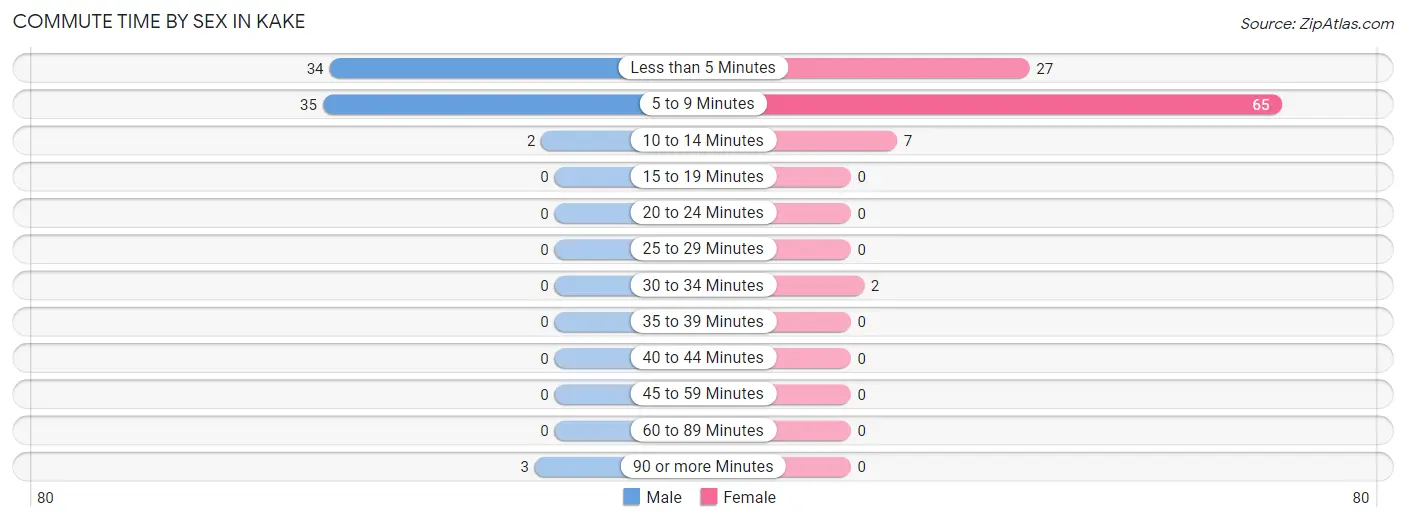
| Commute Time | Male | Female |
| Less than 5 Minutes | 34 (46.0%) | 27 (26.7%) |
| 5 to 9 Minutes | 35 (47.3%) | 65 (64.4%) |
| 10 to 14 Minutes | 2 (2.7%) | 7 (6.9%) |
| 15 to 19 Minutes | 0 (0.0%) | 0 (0.0%) |
| 20 to 24 Minutes | 0 (0.0%) | 0 (0.0%) |
| 25 to 29 Minutes | 0 (0.0%) | 0 (0.0%) |
| 30 to 34 Minutes | 0 (0.0%) | 2 (2.0%) |
| 35 to 39 Minutes | 0 (0.0%) | 0 (0.0%) |
| 40 to 44 Minutes | 0 (0.0%) | 0 (0.0%) |
| 45 to 59 Minutes | 0 (0.0%) | 0 (0.0%) |
| 60 to 89 Minutes | 0 (0.0%) | 0 (0.0%) |
| 90 or more Minutes | 3 (4.1%) | 0 (0.0%) |
Time of Departure to Work by Sex in Kake
The most frequent times of departure to work in Kake are 7:30 AM to 7:59 AM (36, 48.6%) for males and 7:30 AM to 7:59 AM (43, 42.6%) for females.
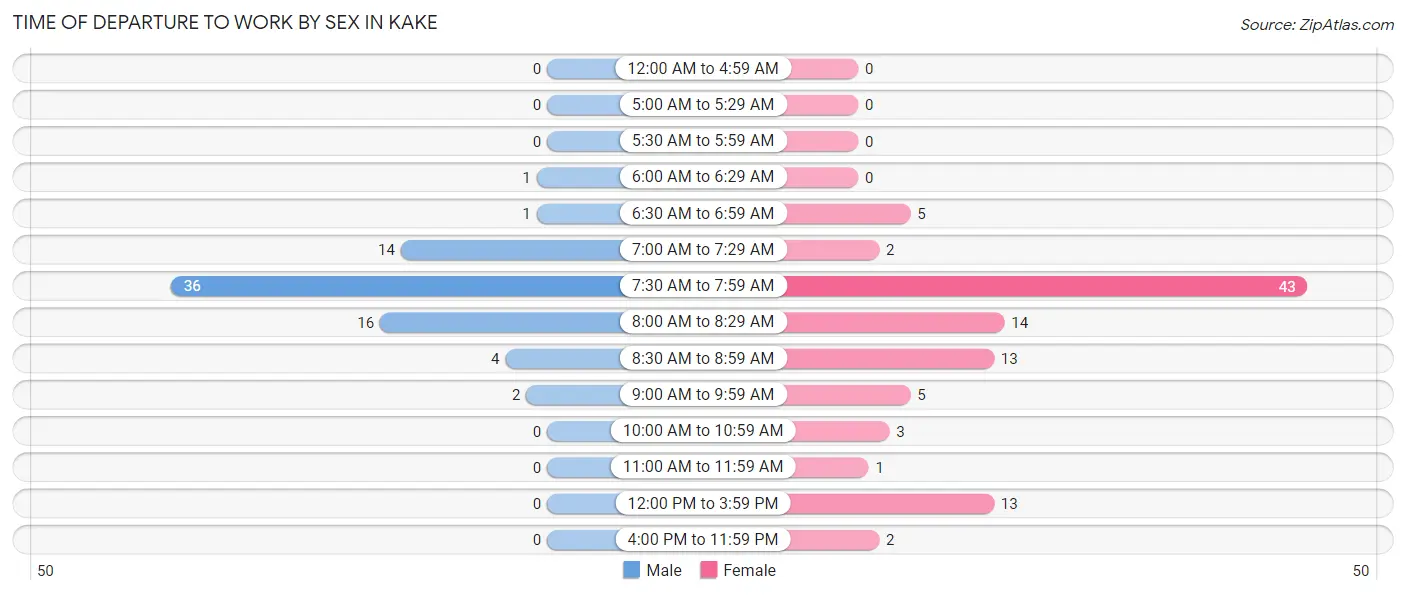
| Time of Departure | Male | Female |
| 12:00 AM to 4:59 AM | 0 (0.0%) | 0 (0.0%) |
| 5:00 AM to 5:29 AM | 0 (0.0%) | 0 (0.0%) |
| 5:30 AM to 5:59 AM | 0 (0.0%) | 0 (0.0%) |
| 6:00 AM to 6:29 AM | 1 (1.3%) | 0 (0.0%) |
| 6:30 AM to 6:59 AM | 1 (1.3%) | 5 (5.0%) |
| 7:00 AM to 7:29 AM | 14 (18.9%) | 2 (2.0%) |
| 7:30 AM to 7:59 AM | 36 (48.6%) | 43 (42.6%) |
| 8:00 AM to 8:29 AM | 16 (21.6%) | 14 (13.9%) |
| 8:30 AM to 8:59 AM | 4 (5.4%) | 13 (12.9%) |
| 9:00 AM to 9:59 AM | 2 (2.7%) | 5 (5.0%) |
| 10:00 AM to 10:59 AM | 0 (0.0%) | 3 (3.0%) |
| 11:00 AM to 11:59 AM | 0 (0.0%) | 1 (1.0%) |
| 12:00 PM to 3:59 PM | 0 (0.0%) | 13 (12.9%) |
| 4:00 PM to 11:59 PM | 0 (0.0%) | 2 (2.0%) |
| Total | 74 (100.0%) | 101 (100.0%) |
Housing Occupancy in Kake
Occupancy by Ownership in Kake
Of the total 172 dwellings in Kake, owner-occupied units account for 121 (70.4%), while renter-occupied units make up 51 (29.6%).
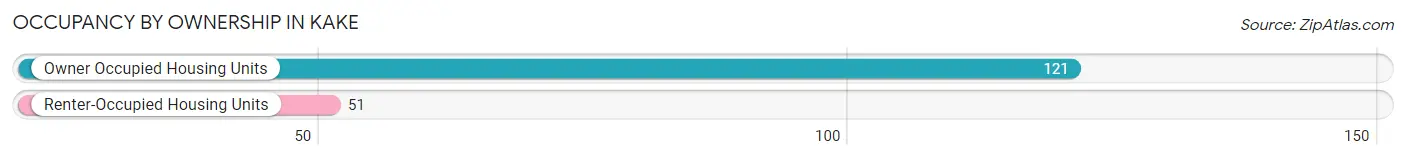
| Occupancy | # Housing Units | % Housing Units |
| Owner Occupied Housing Units | 121 | 70.4% |
| Renter-Occupied Housing Units | 51 | 29.6% |
| Total Occupied Housing Units | 172 | 100.0% |
Occupancy by Household Size in Kake
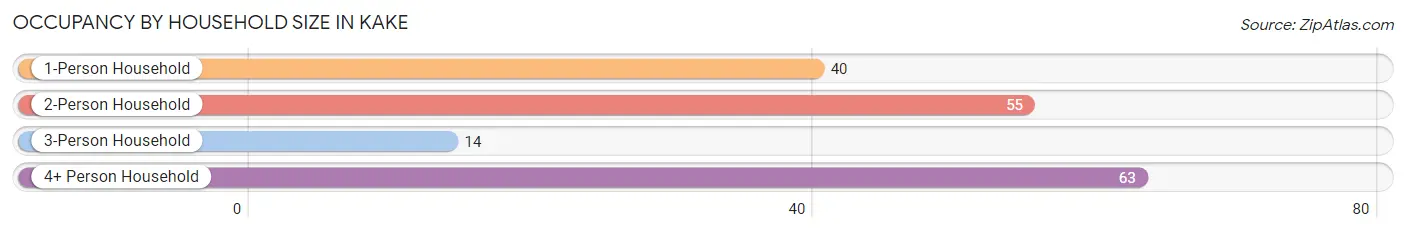
| Household Size | # Housing Units | % Housing Units |
| 1-Person Household | 40 | 23.3% |
| 2-Person Household | 55 | 32.0% |
| 3-Person Household | 14 | 8.1% |
| 4+ Person Household | 63 | 36.6% |
| Total Housing Units | 172 | 100.0% |
Occupancy by Ownership by Household Size in Kake
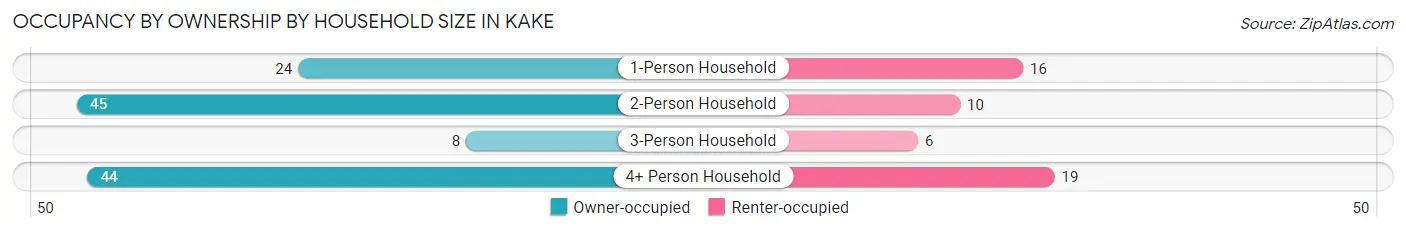
| Household Size | Owner-occupied | Renter-occupied |
| 1-Person Household | 24 (60.0%) | 16 (40.0%) |
| 2-Person Household | 45 (81.8%) | 10 (18.2%) |
| 3-Person Household | 8 (57.1%) | 6 (42.9%) |
| 4+ Person Household | 44 (69.8%) | 19 (30.2%) |
| Total Housing Units | 121 (70.4%) | 51 (29.6%) |
Occupancy by Educational Attainment in Kake
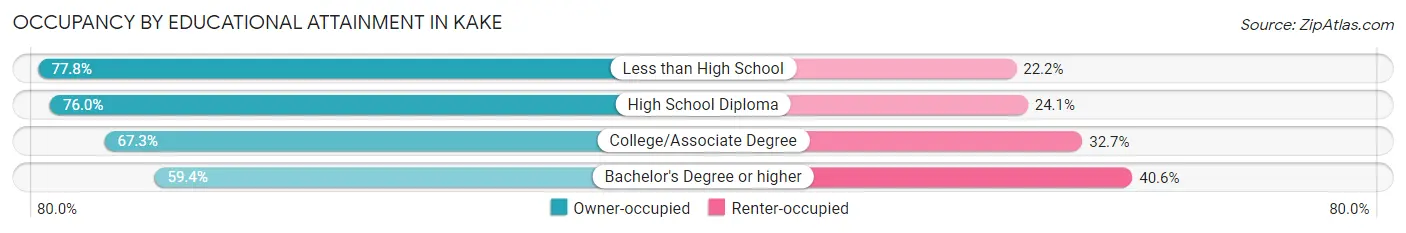
| Household Size | Owner-occupied | Renter-occupied |
| Less than High School | 7 (77.8%) | 2 (22.2%) |
| High School Diploma | 60 (75.9%) | 19 (24.0%) |
| College/Associate Degree | 35 (67.3%) | 17 (32.7%) |
| Bachelor's Degree or higher | 19 (59.4%) | 13 (40.6%) |
Occupancy by Age of Householder in Kake
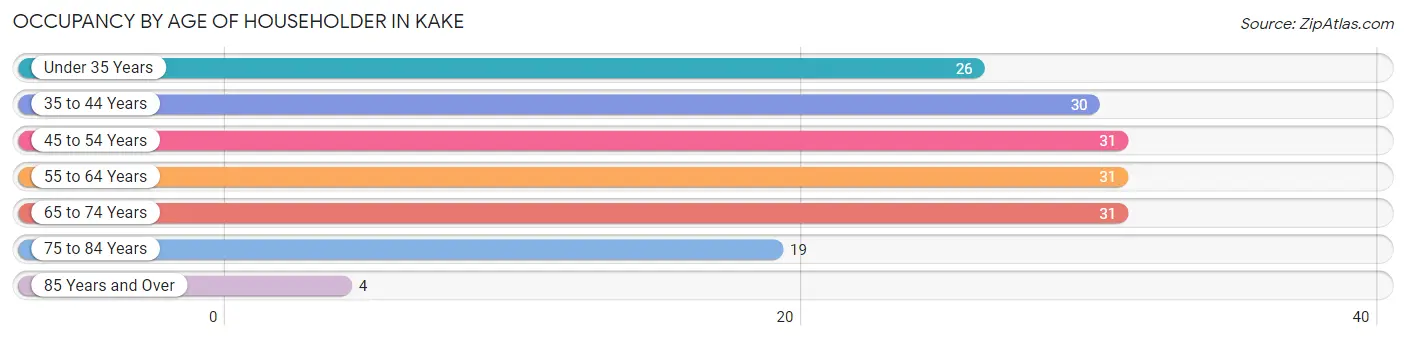
| Age Bracket | # Households | % Households |
| Under 35 Years | 26 | 15.1% |
| 35 to 44 Years | 30 | 17.4% |
| 45 to 54 Years | 31 | 18.0% |
| 55 to 64 Years | 31 | 18.0% |
| 65 to 74 Years | 31 | 18.0% |
| 75 to 84 Years | 19 | 11.1% |
| 85 Years and Over | 4 | 2.3% |
| Total | 172 | 100.0% |
Housing Finances in Kake
Median Income by Occupancy in Kake
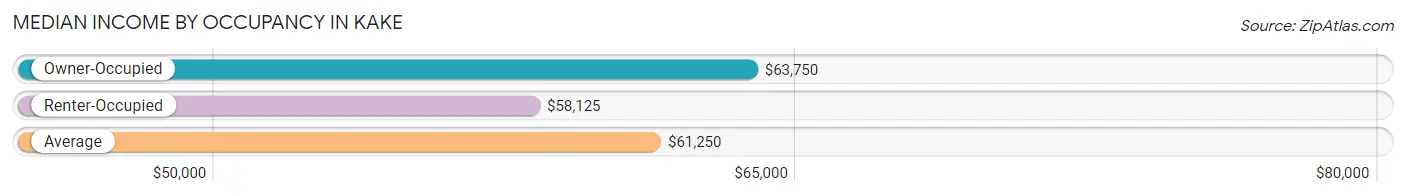
| Occupancy Type | # Households | Median Income |
| Owner-Occupied | 121 (70.4%) | $63,750 |
| Renter-Occupied | 51 (29.6%) | $58,125 |
| Average | 172 (100.0%) | $61,250 |
Occupancy by Householder Income Bracket in Kake
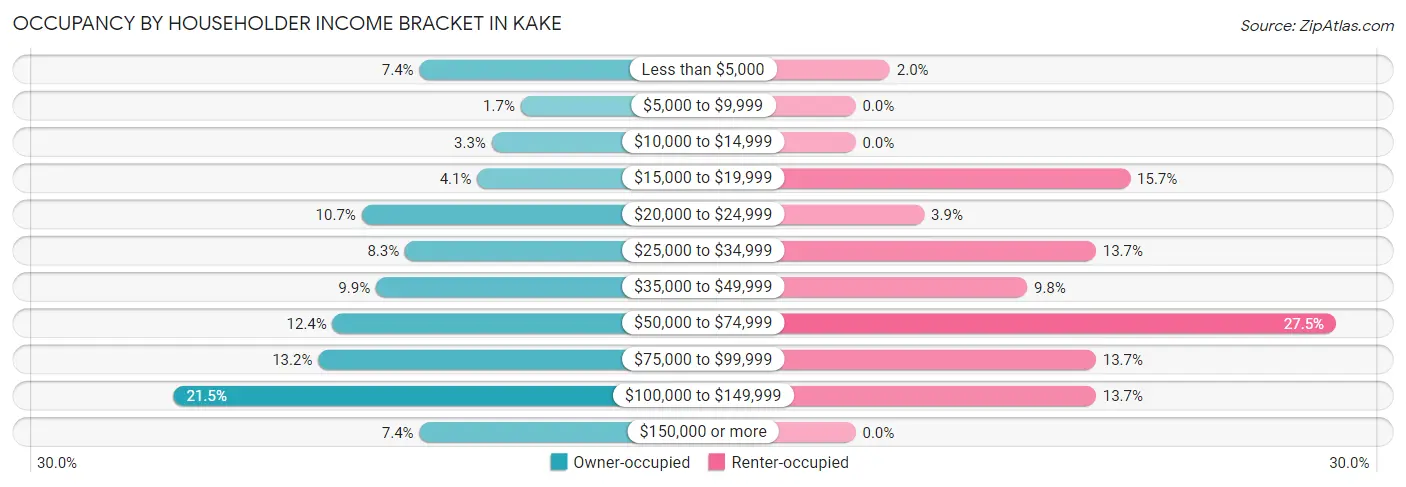
| Income Bracket | Owner-occupied | Renter-occupied |
| Less than $5,000 | 9 (7.4%) | 1 (2.0%) |
| $5,000 to $9,999 | 2 (1.7%) | 0 (0.0%) |
| $10,000 to $14,999 | 4 (3.3%) | 0 (0.0%) |
| $15,000 to $19,999 | 5 (4.1%) | 8 (15.7%) |
| $20,000 to $24,999 | 13 (10.7%) | 2 (3.9%) |
| $25,000 to $34,999 | 10 (8.3%) | 7 (13.7%) |
| $35,000 to $49,999 | 12 (9.9%) | 5 (9.8%) |
| $50,000 to $74,999 | 15 (12.4%) | 14 (27.5%) |
| $75,000 to $99,999 | 16 (13.2%) | 7 (13.7%) |
| $100,000 to $149,999 | 26 (21.5%) | 7 (13.7%) |
| $150,000 or more | 9 (7.4%) | 0 (0.0%) |
| Total | 121 (100.0%) | 51 (100.0%) |
Monthly Housing Cost Tiers in Kake
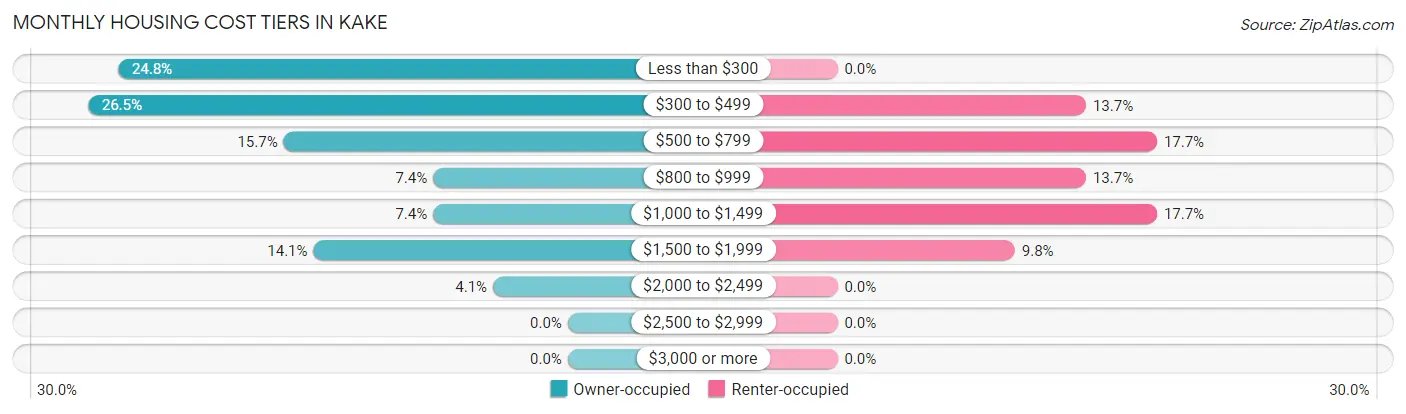
| Monthly Cost | Owner-occupied | Renter-occupied |
| Less than $300 | 30 (24.8%) | 0 (0.0%) |
| $300 to $499 | 32 (26.5%) | 7 (13.7%) |
| $500 to $799 | 19 (15.7%) | 9 (17.6%) |
| $800 to $999 | 9 (7.4%) | 7 (13.7%) |
| $1,000 to $1,499 | 9 (7.4%) | 9 (17.6%) |
| $1,500 to $1,999 | 17 (14.1%) | 5 (9.8%) |
| $2,000 to $2,499 | 5 (4.1%) | 0 (0.0%) |
| $2,500 to $2,999 | 0 (0.0%) | 0 (0.0%) |
| $3,000 or more | 0 (0.0%) | 0 (0.0%) |
| Total | 121 (100.0%) | 51 (100.0%) |
Physical Housing Characteristics in Kake
Housing Structures in Kake
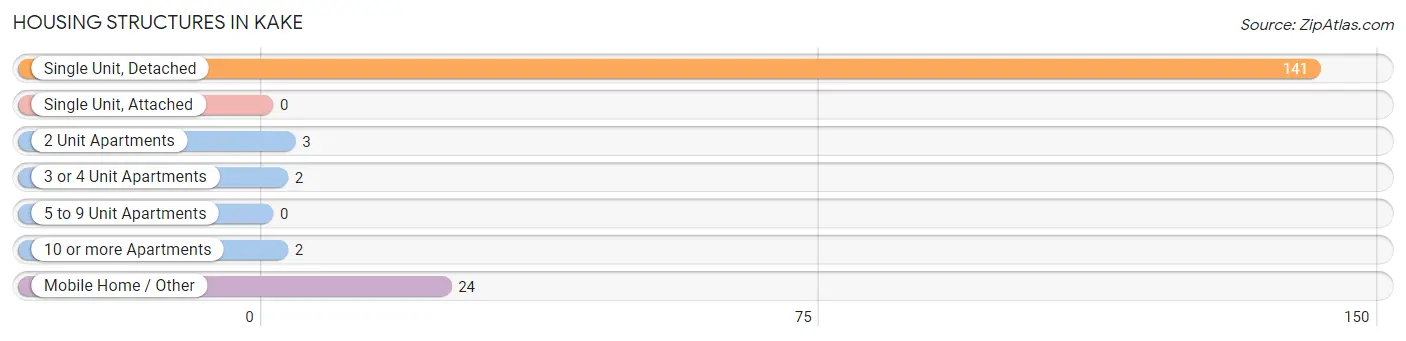
| Structure Type | # Housing Units | % Housing Units |
| Single Unit, Detached | 141 | 82.0% |
| Single Unit, Attached | 0 | 0.0% |
| 2 Unit Apartments | 3 | 1.7% |
| 3 or 4 Unit Apartments | 2 | 1.2% |
| 5 to 9 Unit Apartments | 0 | 0.0% |
| 10 or more Apartments | 2 | 1.2% |
| Mobile Home / Other | 24 | 14.0% |
| Total | 172 | 100.0% |
Housing Structures by Occupancy in Kake
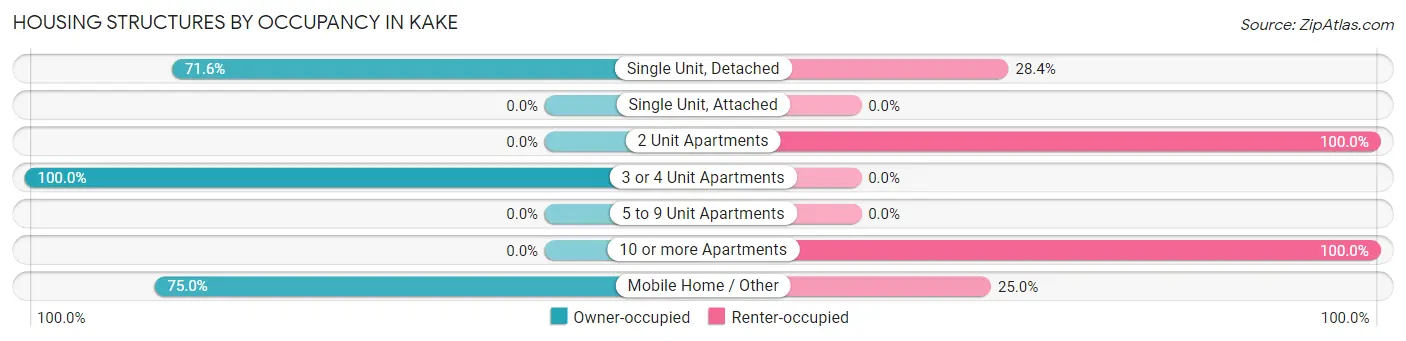
| Structure Type | Owner-occupied | Renter-occupied |
| Single Unit, Detached | 101 (71.6%) | 40 (28.4%) |
| Single Unit, Attached | 0 (0.0%) | 0 (0.0%) |
| 2 Unit Apartments | 0 (0.0%) | 3 (100.0%) |
| 3 or 4 Unit Apartments | 2 (100.0%) | 0 (0.0%) |
| 5 to 9 Unit Apartments | 0 (0.0%) | 0 (0.0%) |
| 10 or more Apartments | 0 (0.0%) | 2 (100.0%) |
| Mobile Home / Other | 18 (75.0%) | 6 (25.0%) |
| Total | 121 (70.4%) | 51 (29.6%) |
Housing Structures by Number of Rooms in Kake
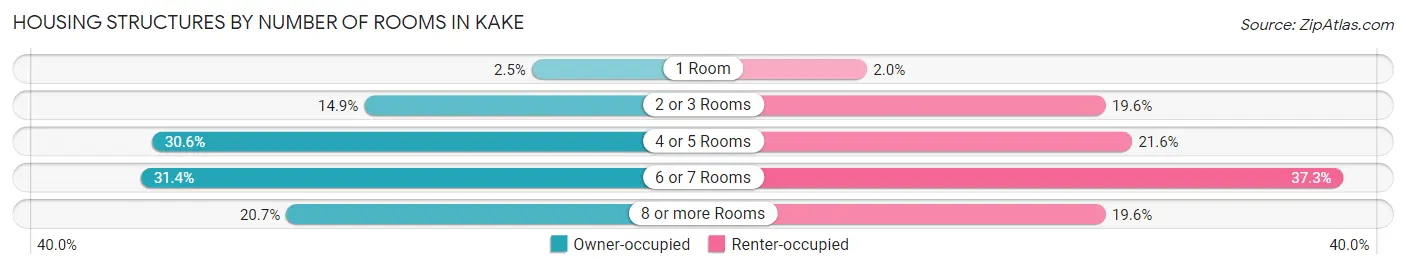
| Number of Rooms | Owner-occupied | Renter-occupied |
| 1 Room | 3 (2.5%) | 1 (2.0%) |
| 2 or 3 Rooms | 18 (14.9%) | 10 (19.6%) |
| 4 or 5 Rooms | 37 (30.6%) | 11 (21.6%) |
| 6 or 7 Rooms | 38 (31.4%) | 19 (37.2%) |
| 8 or more Rooms | 25 (20.7%) | 10 (19.6%) |
| Total | 121 (100.0%) | 51 (100.0%) |
Housing Structure by Heating Type in Kake
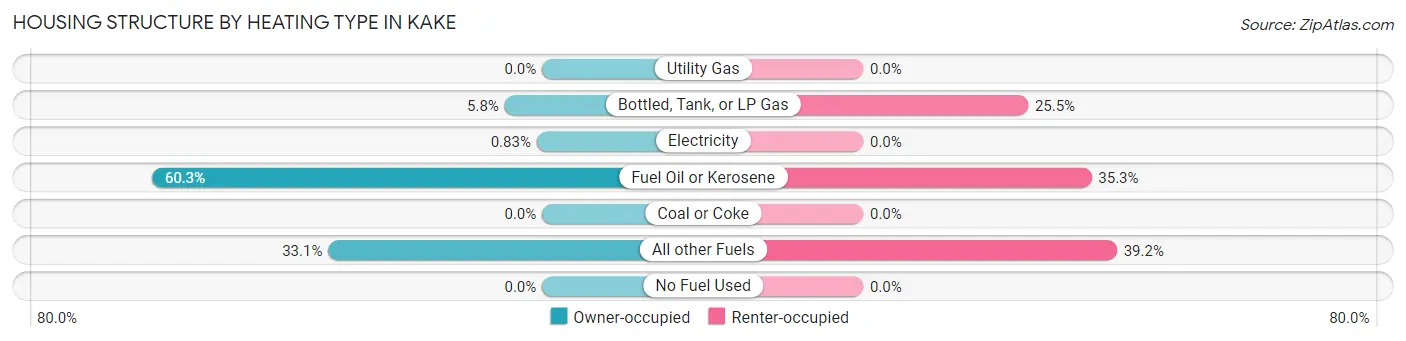
| Heating Type | Owner-occupied | Renter-occupied |
| Utility Gas | 0 (0.0%) | 0 (0.0%) |
| Bottled, Tank, or LP Gas | 7 (5.8%) | 13 (25.5%) |
| Electricity | 1 (0.8%) | 0 (0.0%) |
| Fuel Oil or Kerosene | 73 (60.3%) | 18 (35.3%) |
| Coal or Coke | 0 (0.0%) | 0 (0.0%) |
| All other Fuels | 40 (33.1%) | 20 (39.2%) |
| No Fuel Used | 0 (0.0%) | 0 (0.0%) |
| Total | 121 (100.0%) | 51 (100.0%) |
Household Vehicle Usage in Kake
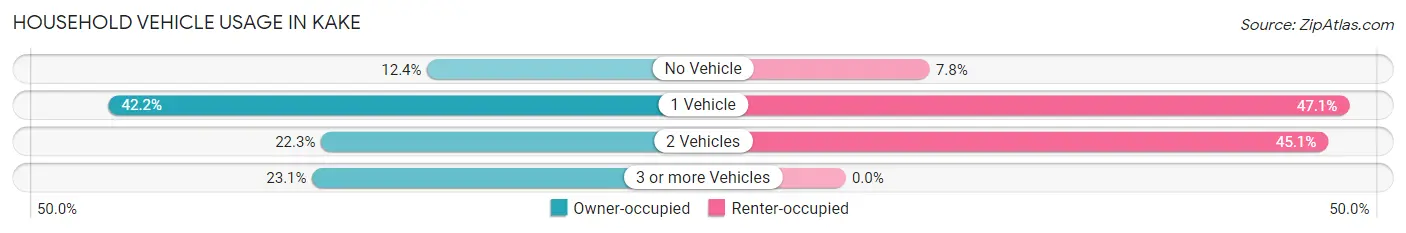
| Vehicles per Household | Owner-occupied | Renter-occupied |
| No Vehicle | 15 (12.4%) | 4 (7.8%) |
| 1 Vehicle | 51 (42.1%) | 24 (47.1%) |
| 2 Vehicles | 27 (22.3%) | 23 (45.1%) |
| 3 or more Vehicles | 28 (23.1%) | 0 (0.0%) |
| Total | 121 (100.0%) | 51 (100.0%) |
Real Estate & Mortgages in Kake
Real Estate and Mortgage Overview in Kake
| Characteristic | Without Mortgage | With Mortgage |
| Housing Units | 93 | 28 |
| Median Property Value | $146,900 | $330,800 |
| Median Household Income | $41,875 | $0 |
| Monthly Housing Costs | $430 | $0 |
| Real Estate Taxes | - | - |
Property Value by Mortgage Status in Kake
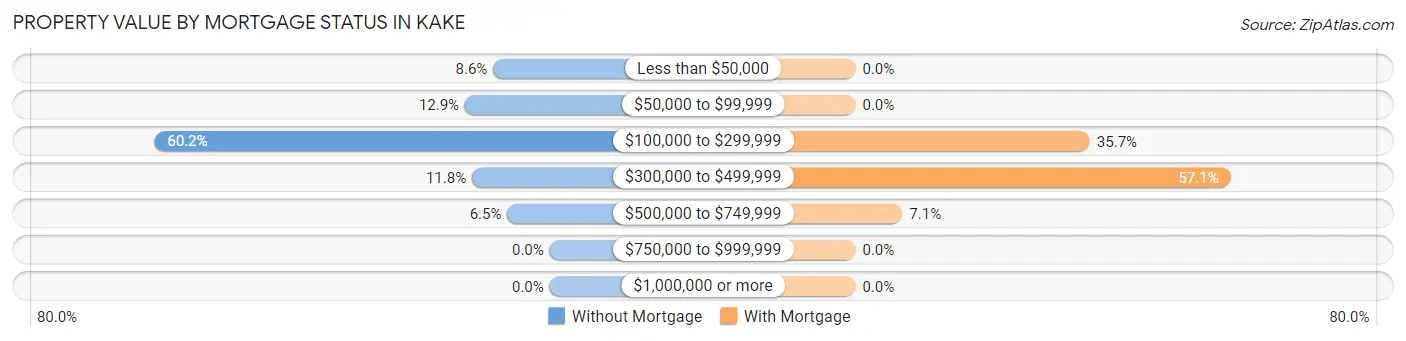
| Property Value | Without Mortgage | With Mortgage |
| Less than $50,000 | 8 (8.6%) | 0 (0.0%) |
| $50,000 to $99,999 | 12 (12.9%) | 0 (0.0%) |
| $100,000 to $299,999 | 56 (60.2%) | 10 (35.7%) |
| $300,000 to $499,999 | 11 (11.8%) | 16 (57.1%) |
| $500,000 to $749,999 | 6 (6.5%) | 2 (7.1%) |
| $750,000 to $999,999 | 0 (0.0%) | 0 (0.0%) |
| $1,000,000 or more | 0 (0.0%) | 0 (0.0%) |
| Total | 93 (100.0%) | 28 (100.0%) |
Household Income by Mortgage Status in Kake
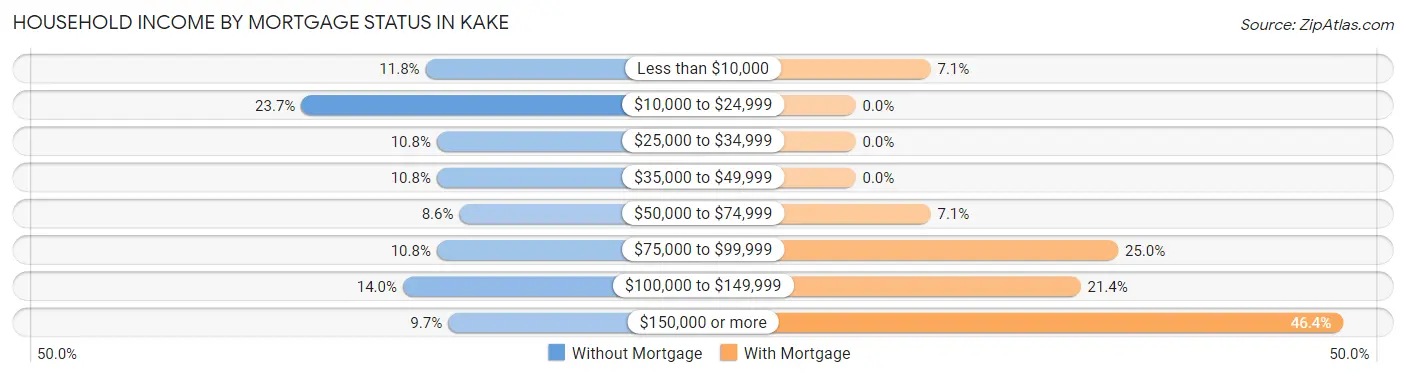
| Household Income | Without Mortgage | With Mortgage |
| Less than $10,000 | 11 (11.8%) | 2 (7.1%) |
| $10,000 to $24,999 | 22 (23.7%) | 0 (0.0%) |
| $25,000 to $34,999 | 10 (10.7%) | 0 (0.0%) |
| $35,000 to $49,999 | 10 (10.7%) | 0 (0.0%) |
| $50,000 to $74,999 | 8 (8.6%) | 2 (7.1%) |
| $75,000 to $99,999 | 10 (10.7%) | 7 (25.0%) |
| $100,000 to $149,999 | 13 (14.0%) | 6 (21.4%) |
| $150,000 or more | 9 (9.7%) | 13 (46.4%) |
| Total | 93 (100.0%) | 28 (100.0%) |
Property Value to Household Income Ratio in Kake
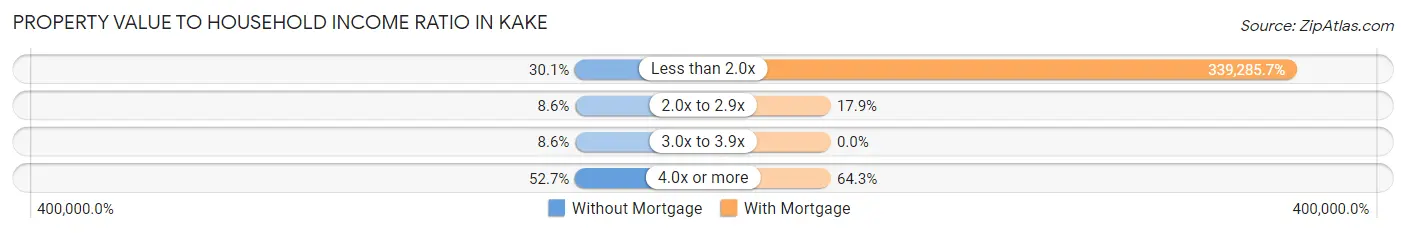
| Value-to-Income Ratio | Without Mortgage | With Mortgage |
| Less than 2.0x | 28 (30.1%) | 95,000 (339,285.7%) |
| 2.0x to 2.9x | 8 (8.6%) | 5 (17.9%) |
| 3.0x to 3.9x | 8 (8.6%) | 0 (0.0%) |
| 4.0x or more | 49 (52.7%) | 18 (64.3%) |
| Total | 93 (100.0%) | 28 (100.0%) |
Real Estate Taxes by Mortgage Status in Kake
| Property Taxes | Without Mortgage | With Mortgage |
| Less than $800 | 0 (0.0%) | 0 (0.0%) |
| $800 to $1,499 | 0 (0.0%) | 0 (0.0%) |
| $800 to $1,499 | 0 (0.0%) | 0 (0.0%) |
| Total | 93 (100.0%) | 28 (100.0%) |
Health & Disability in Kake
Health Insurance Coverage by Age in Kake
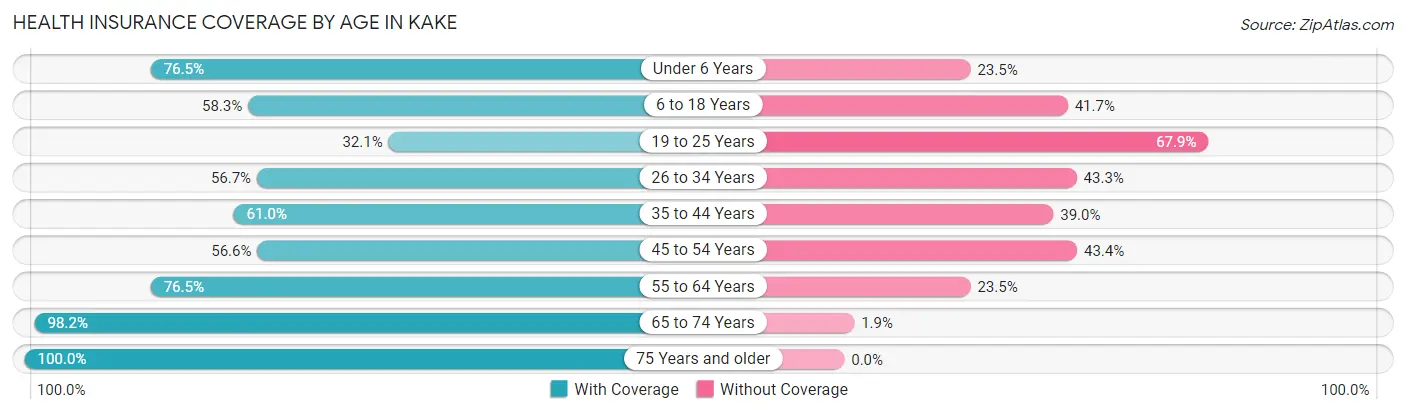
| Age Bracket | With Coverage | Without Coverage |
| Under 6 Years | 39 (76.5%) | 12 (23.5%) |
| 6 to 18 Years | 49 (58.3%) | 35 (41.7%) |
| 19 to 25 Years | 9 (32.1%) | 19 (67.9%) |
| 26 to 34 Years | 34 (56.7%) | 26 (43.3%) |
| 35 to 44 Years | 36 (61.0%) | 23 (39.0%) |
| 45 to 54 Years | 30 (56.6%) | 23 (43.4%) |
| 55 to 64 Years | 39 (76.5%) | 12 (23.5%) |
| 65 to 74 Years | 53 (98.2%) | 1 (1.8%) |
| 75 Years and older | 33 (100.0%) | 0 (0.0%) |
| Total | 322 (68.1%) | 151 (31.9%) |
Health Insurance Coverage by Citizenship Status in Kake
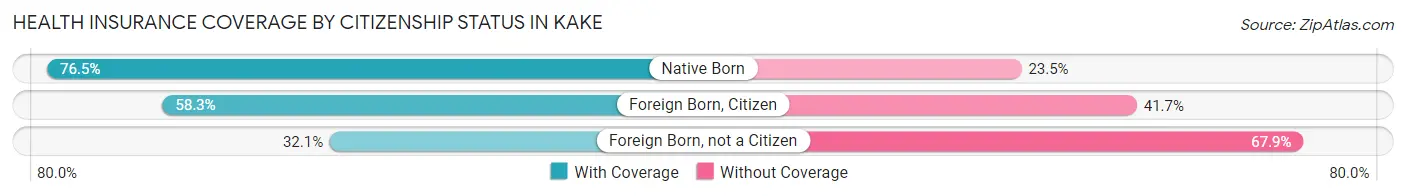
| Citizenship Status | With Coverage | Without Coverage |
| Native Born | 39 (76.5%) | 12 (23.5%) |
| Foreign Born, Citizen | 49 (58.3%) | 35 (41.7%) |
| Foreign Born, not a Citizen | 9 (32.1%) | 19 (67.9%) |
Health Insurance Coverage by Household Income in Kake
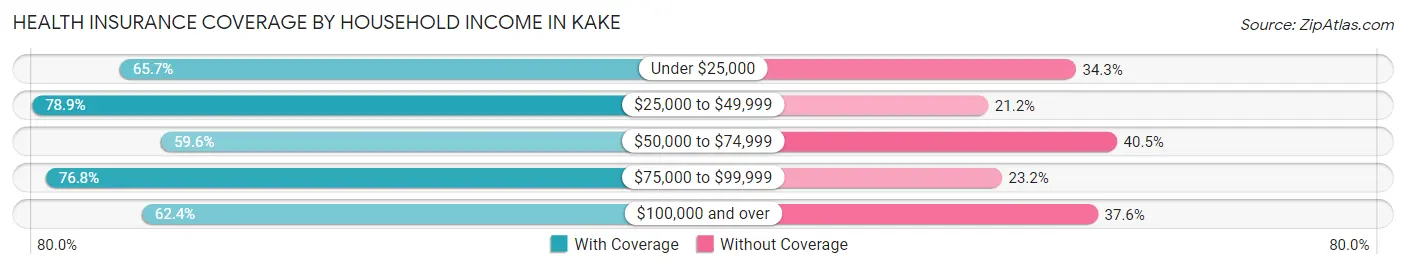
| Household Income | With Coverage | Without Coverage |
| Under $25,000 | 46 (65.7%) | 24 (34.3%) |
| $25,000 to $49,999 | 82 (78.8%) | 22 (21.1%) |
| $50,000 to $74,999 | 53 (59.6%) | 36 (40.5%) |
| $75,000 to $99,999 | 53 (76.8%) | 16 (23.2%) |
| $100,000 and over | 88 (62.4%) | 53 (37.6%) |
Public vs Private Health Insurance Coverage by Age in Kake
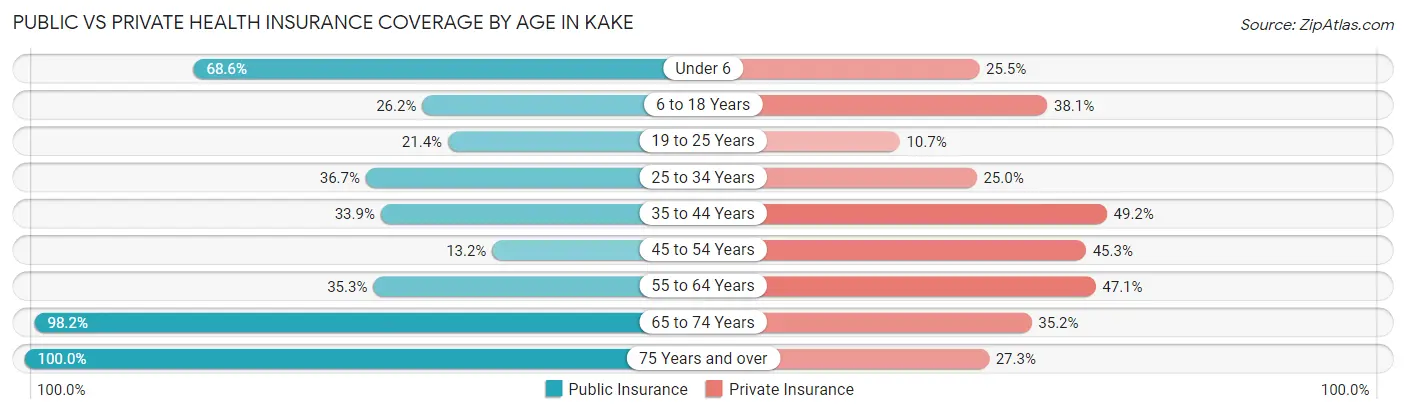
| Age Bracket | Public Insurance | Private Insurance |
| Under 6 | 35 (68.6%) | 13 (25.5%) |
| 6 to 18 Years | 22 (26.2%) | 32 (38.1%) |
| 19 to 25 Years | 6 (21.4%) | 3 (10.7%) |
| 25 to 34 Years | 22 (36.7%) | 15 (25.0%) |
| 35 to 44 Years | 20 (33.9%) | 29 (49.1%) |
| 45 to 54 Years | 7 (13.2%) | 24 (45.3%) |
| 55 to 64 Years | 18 (35.3%) | 24 (47.1%) |
| 65 to 74 Years | 53 (98.2%) | 19 (35.2%) |
| 75 Years and over | 33 (100.0%) | 9 (27.3%) |
| Total | 216 (45.7%) | 168 (35.5%) |
Disability Status by Sex by Age in Kake
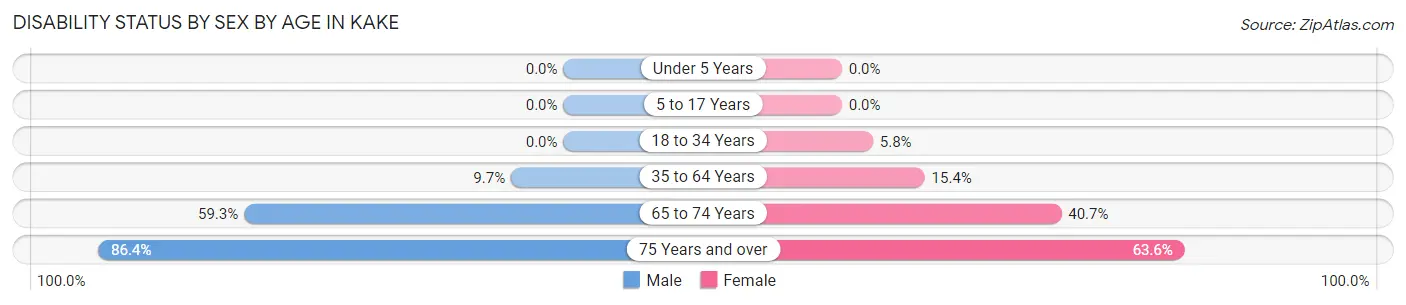
| Age Bracket | Male | Female |
| Under 5 Years | 0 (0.0%) | 0 (0.0%) |
| 5 to 17 Years | 0 (0.0%) | 0 (0.0%) |
| 18 to 34 Years | 0 (0.0%) | 3 (5.8%) |
| 35 to 64 Years | 7 (9.7%) | 14 (15.4%) |
| 65 to 74 Years | 16 (59.3%) | 11 (40.7%) |
| 75 Years and over | 19 (86.4%) | 7 (63.6%) |
Disability Class by Sex by Age in Kake
Disability Class: Hearing Difficulty
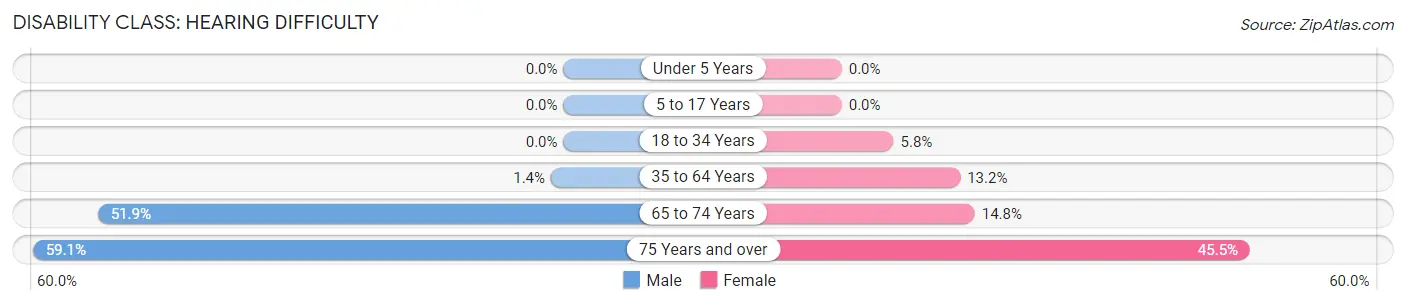
| Age Bracket | Male | Female |
| Under 5 Years | 0 (0.0%) | 0 (0.0%) |
| 5 to 17 Years | 0 (0.0%) | 0 (0.0%) |
| 18 to 34 Years | 0 (0.0%) | 3 (5.8%) |
| 35 to 64 Years | 1 (1.4%) | 12 (13.2%) |
| 65 to 74 Years | 14 (51.8%) | 4 (14.8%) |
| 75 Years and over | 13 (59.1%) | 5 (45.5%) |
Disability Class: Vision Difficulty
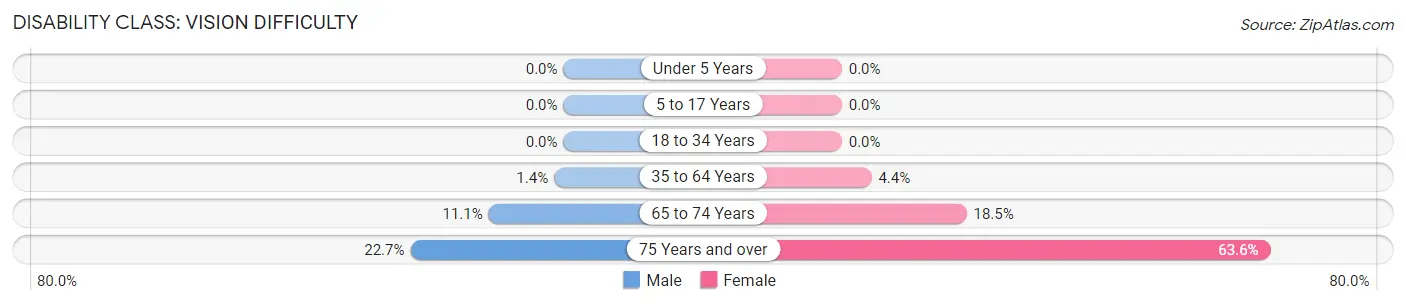
| Age Bracket | Male | Female |
| Under 5 Years | 0 (0.0%) | 0 (0.0%) |
| 5 to 17 Years | 0 (0.0%) | 0 (0.0%) |
| 18 to 34 Years | 0 (0.0%) | 0 (0.0%) |
| 35 to 64 Years | 1 (1.4%) | 4 (4.4%) |
| 65 to 74 Years | 3 (11.1%) | 5 (18.5%) |
| 75 Years and over | 5 (22.7%) | 7 (63.6%) |
Disability Class: Cognitive Difficulty
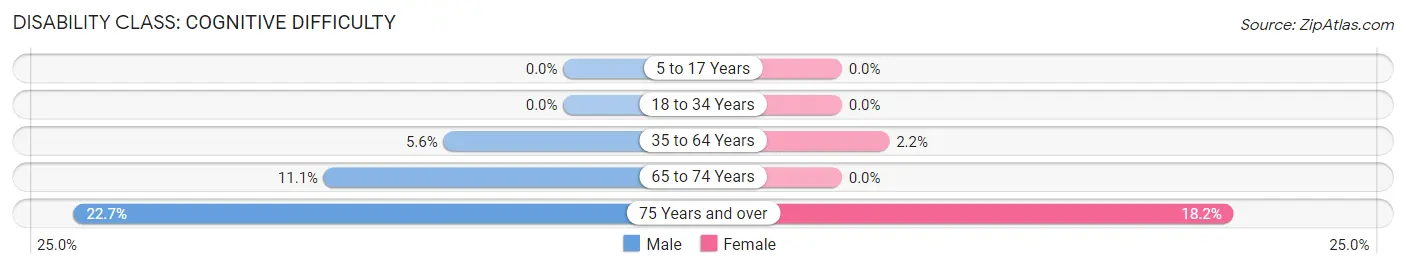
| Age Bracket | Male | Female |
| 5 to 17 Years | 0 (0.0%) | 0 (0.0%) |
| 18 to 34 Years | 0 (0.0%) | 0 (0.0%) |
| 35 to 64 Years | 4 (5.6%) | 2 (2.2%) |
| 65 to 74 Years | 3 (11.1%) | 0 (0.0%) |
| 75 Years and over | 5 (22.7%) | 2 (18.2%) |
Disability Class: Ambulatory Difficulty
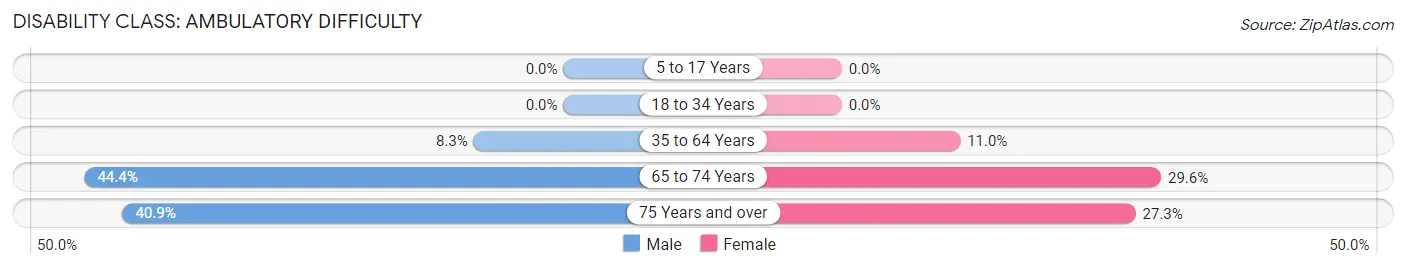
| Age Bracket | Male | Female |
| 5 to 17 Years | 0 (0.0%) | 0 (0.0%) |
| 18 to 34 Years | 0 (0.0%) | 0 (0.0%) |
| 35 to 64 Years | 6 (8.3%) | 10 (11.0%) |
| 65 to 74 Years | 12 (44.4%) | 8 (29.6%) |
| 75 Years and over | 9 (40.9%) | 3 (27.3%) |
Disability Class: Self-Care Difficulty
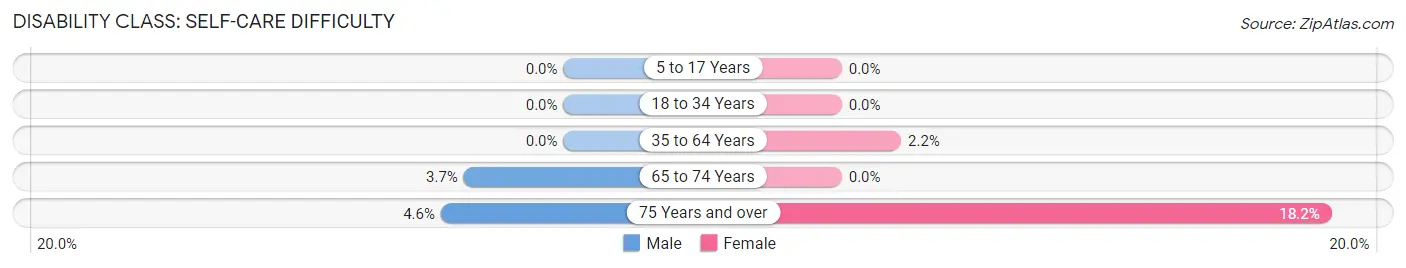
| Age Bracket | Male | Female |
| 5 to 17 Years | 0 (0.0%) | 0 (0.0%) |
| 18 to 34 Years | 0 (0.0%) | 0 (0.0%) |
| 35 to 64 Years | 0 (0.0%) | 2 (2.2%) |
| 65 to 74 Years | 1 (3.7%) | 0 (0.0%) |
| 75 Years and over | 1 (4.5%) | 2 (18.2%) |
Technology Access in Kake
Computing Device Access in Kake
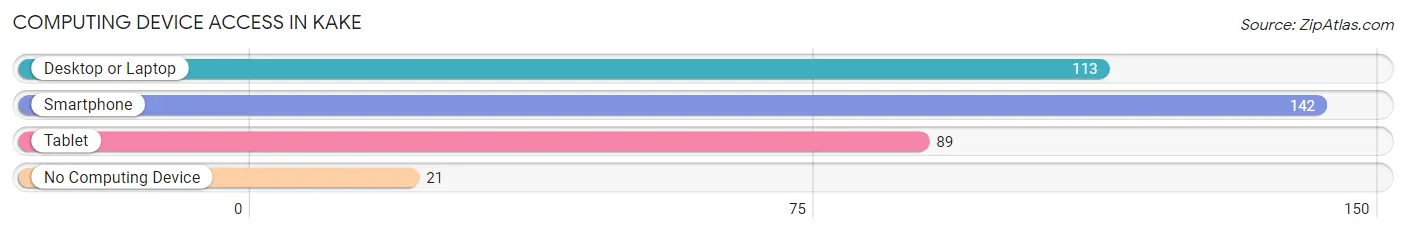
| Device Type | # Households | % Households |
| Desktop or Laptop | 113 | 65.7% |
| Smartphone | 142 | 82.6% |
| Tablet | 89 | 51.7% |
| No Computing Device | 21 | 12.2% |
| Total | 172 | 100.0% |
Internet Access in Kake
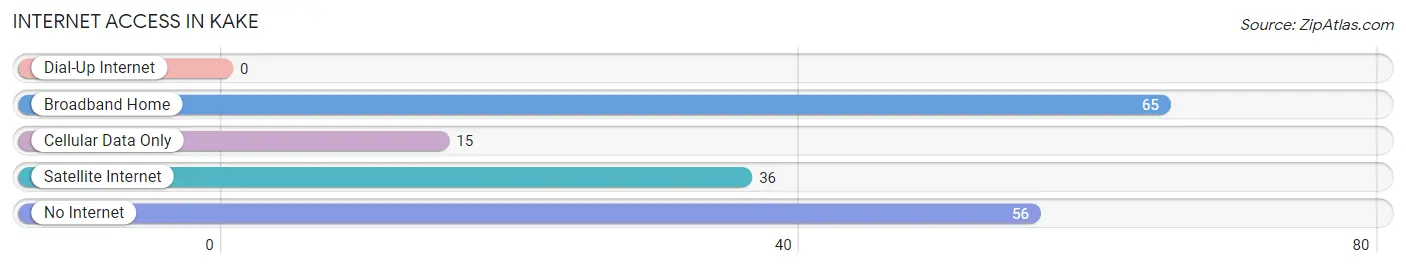
| Internet Type | # Households | % Households |
| Dial-Up Internet | 0 | 0.0% |
| Broadband Home | 65 | 37.8% |
| Cellular Data Only | 15 | 8.7% |
| Satellite Internet | 36 | 20.9% |
| No Internet | 56 | 32.6% |
| Total | 172 | 100.0% |
Kake Summary
Kake is a small city located on the southeastern coast of Alaska, in the United States. It is part of the Ketchikan Gateway Borough and is situated on the northern end of Kupreanof Island, approximately 40 miles (64 km) southwest of the city of Ketchikan. The population of Kake was 545 at the 2010 census, down from 602 in 2000.
History
Kake was first settled by the Tlingit people, who called the area “K’aak’w”, meaning “place of the brown bear”. The first European settlers arrived in the late 19th century, and the town was officially incorporated in 1910. Kake was a major center for the salmon canning industry, and the town’s economy was heavily dependent on the fishing industry until the mid-20th century.
Geography
Kake is located at 56°59′N 133°59′W (56.983, -133.983). It is situated on the northern end of Kupreanof Island, approximately 40 miles (64 km) southwest of the city of Ketchikan. The city is surrounded by the Tongass National Forest, and is located near the mouth of the Kupreanof River.
Climate
Kake has a maritime climate, with mild temperatures year-round. The average high temperature in July is 63°F (17°C), and the average low temperature in January is 33°F (1°C). The area receives an average of 80 inches (203 cm) of precipitation annually, with most of it falling between October and April.
Economy
Kake’s economy is largely based on fishing and tourism. The town is home to several seafood processing plants, and the local fishing fleet is one of the largest in the region. The town also has a small tourism industry, with visitors coming to fish, hunt, and explore the nearby Tongass National Forest.
Demographics
As of the 2010 census, there were 545 people living in Kake. The racial makeup of the town was 57.3% White, 0.2% African American, 33.2% Native American, 0.2% Asian, 0.2% Pacific Islander, 0.4% from other races, and 8.5% from two or more races. Hispanic or Latino of any race were 1.3% of the population.
The median income for a household in Kake was $37,500, and the median income for a family was $41,250. The per capita income for the town was $17,845. About 15.2% of families and 17.2% of the population were below the poverty line, including 22.2% of those under age 18 and none of those age 65 or over.
Common Questions
What is Per Capita Income in Kake?
Per Capita income in Kake is $28,748.
What is the Median Family Income in Kake?
Median Family Income in Kake is $69,375.
What is the Median Household income in Kake?
Median Household Income in Kake is $61,250.
What is Income or Wage Gap in Kake?
Income or Wage Gap in Kake is 28.3%.
Women in Kake earn 71.7 cents for every dollar earned by a man.
What is Inequality or Gini Index in Kake?
Inequality or Gini Index in Kake is 0.49.
What is the Total Population of Kake?
Total Population of Kake is 473.
What is the Total Male Population of Kake?
Total Male Population of Kake is 229.
What is the Total Female Population of Kake?
Total Female Population of Kake is 244.
What is the Ratio of Males per 100 Females in Kake?
There are 93.85 Males per 100 Females in Kake.
What is the Ratio of Females per 100 Males in Kake?
There are 106.55 Females per 100 Males in Kake.
What is the Median Population Age in Kake?
Median Population Age in Kake is 37.3 Years.
What is the Average Family Size in Kake
Average Family Size in Kake is 3.2 People.
What is the Average Household Size in Kake
Average Household Size in Kake is 2.8 People.
How Large is the Labor Force in Kake?
There are 203 People in the Labor Forcein in Kake.
What is the Percentage of People in the Labor Force in Kake?
56.1% of People are in the Labor Force in Kake.
What is the Unemployment Rate in Kake?
Unemployment Rate in Kake is 9.4%.