Hydaburg, AK Map & Demographics
Hydaburg Map
Hydaburg Overview
$24,781
PER CAPITA INCOME
$54,500
AVG FAMILY INCOME
$53,125
AVG HOUSEHOLD INCOME
56.0%
WAGE / INCOME GAP [ % ]
44.0¢/ $1
WAGE / INCOME GAP [ $ ]
0.42
INEQUALITY / GINI INDEX
328
TOTAL POPULATION
170
MALE POPULATION
158
FEMALE POPULATION
107.59
MALES / 100 FEMALES
92.94
FEMALES / 100 MALES
39.0
MEDIAN AGE
3.2
AVG FAMILY SIZE
2.6
AVG HOUSEHOLD SIZE
150
LABOR FORCE [ PEOPLE ]
56.0%
PERCENT IN LABOR FORCE
10.0%
UNEMPLOYMENT RATE
Hydaburg Zip Codes
Hydaburg Area Codes
Income in Hydaburg
Income Overview in Hydaburg
Per Capita Income in Hydaburg is $24,781, while median incomes of families and households are $54,500 and $53,125 respectively.
| Characteristic | Number | Measure |
| Per Capita Income | 328 | $24,781 |
| Median Family Income | 88 | $54,500 |
| Mean Family Income | 88 | $73,515 |
| Median Household Income | 125 | $53,125 |
| Mean Household Income | 125 | $67,044 |
| Income Deficit | 88 | $0 |
| Wage / Income Gap (%) | 328 | 55.99% |
| Wage / Income Gap ($) | 328 | 44.01¢ per $1 |
| Gini / Inequality Index | 328 | 0.42 |
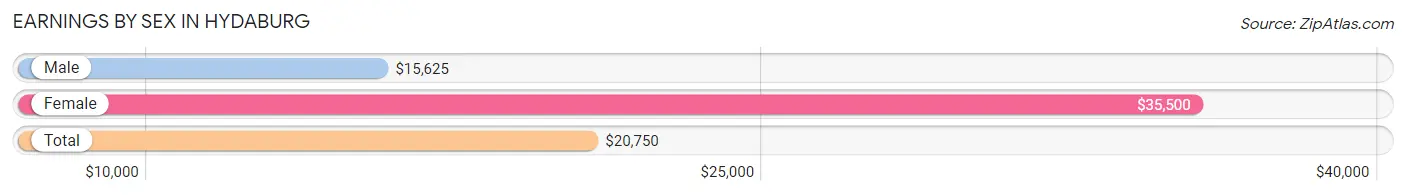
Earnings by Sex in Hydaburg
Average Earnings in Hydaburg are $20,750, $15,625 for men and $35,500 for women, a difference of 56.0%.
| Sex | Number | Average Earnings |
| Male | 101 (59.1%) | $15,625 |
| Female | 70 (40.9%) | $35,500 |
| Total | 171 (100.0%) | $20,750 |
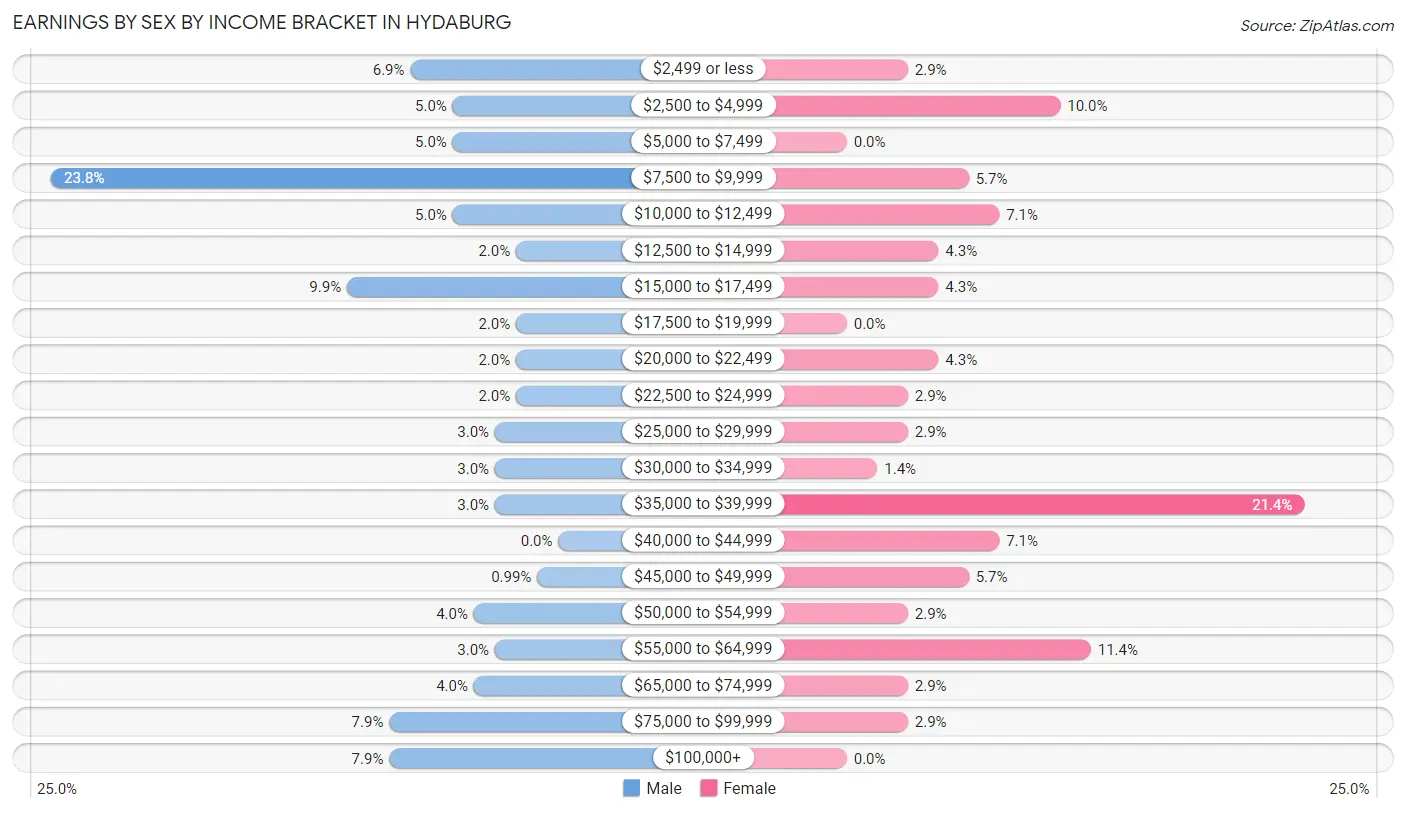
Earnings by Sex by Income Bracket in Hydaburg
The most common earnings brackets in Hydaburg are $7,500 to $9,999 for men (24 | 23.8%) and $35,000 to $39,999 for women (15 | 21.4%).
| Income | Male | Female |
| $2,499 or less | 7 (6.9%) | 2 (2.9%) |
| $2,500 to $4,999 | 5 (5.0%) | 7 (10.0%) |
| $5,000 to $7,499 | 5 (5.0%) | 0 (0.0%) |
| $7,500 to $9,999 | 24 (23.8%) | 4 (5.7%) |
| $10,000 to $12,499 | 5 (5.0%) | 5 (7.1%) |
| $12,500 to $14,999 | 2 (2.0%) | 3 (4.3%) |
| $15,000 to $17,499 | 10 (9.9%) | 3 (4.3%) |
| $17,500 to $19,999 | 2 (2.0%) | 0 (0.0%) |
| $20,000 to $22,499 | 2 (2.0%) | 3 (4.3%) |
| $22,500 to $24,999 | 2 (2.0%) | 2 (2.9%) |
| $25,000 to $29,999 | 3 (3.0%) | 2 (2.9%) |
| $30,000 to $34,999 | 3 (3.0%) | 1 (1.4%) |
| $35,000 to $39,999 | 3 (3.0%) | 15 (21.4%) |
| $40,000 to $44,999 | 0 (0.0%) | 5 (7.1%) |
| $45,000 to $49,999 | 1 (1.0%) | 4 (5.7%) |
| $50,000 to $54,999 | 4 (4.0%) | 2 (2.9%) |
| $55,000 to $64,999 | 3 (3.0%) | 8 (11.4%) |
| $65,000 to $74,999 | 4 (4.0%) | 2 (2.9%) |
| $75,000 to $99,999 | 8 (7.9%) | 2 (2.9%) |
| $100,000+ | 8 (7.9%) | 0 (0.0%) |
| Total | 101 (100.0%) | 70 (100.0%) |
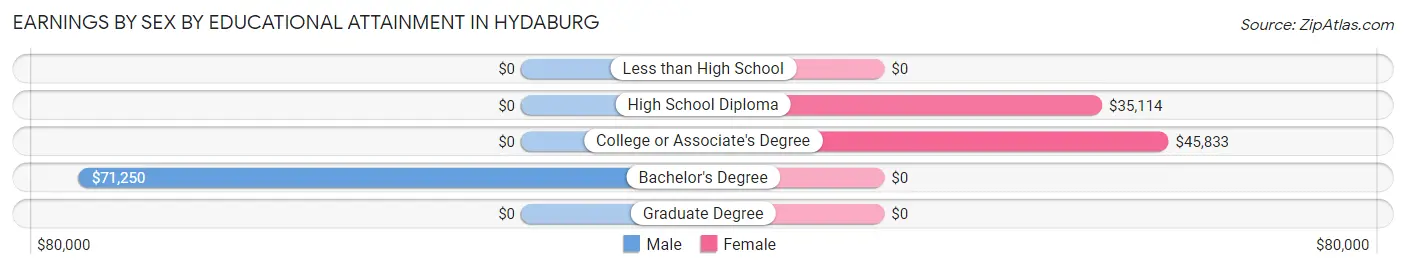
Earnings by Sex by Educational Attainment in Hydaburg
| Educational Attainment | Male Income | Female Income |
| Less than High School | - | - |
| High School Diploma | - | - |
| College or Associate's Degree | - | - |
| Bachelor's Degree | $71,250 | $0 |
| Graduate Degree | - | - |
| Total | - | - |
Family Income in Hydaburg
Family Income Brackets in Hydaburg
According to the Hydaburg family income data, there are 15 families falling into the $50,000 to $74,999 income range, which is the most common income bracket and makes up 17.1% of all families. Conversely, the less than $10,000 income bracket is the least frequent group with only 1 families (1.1%) belonging to this category.
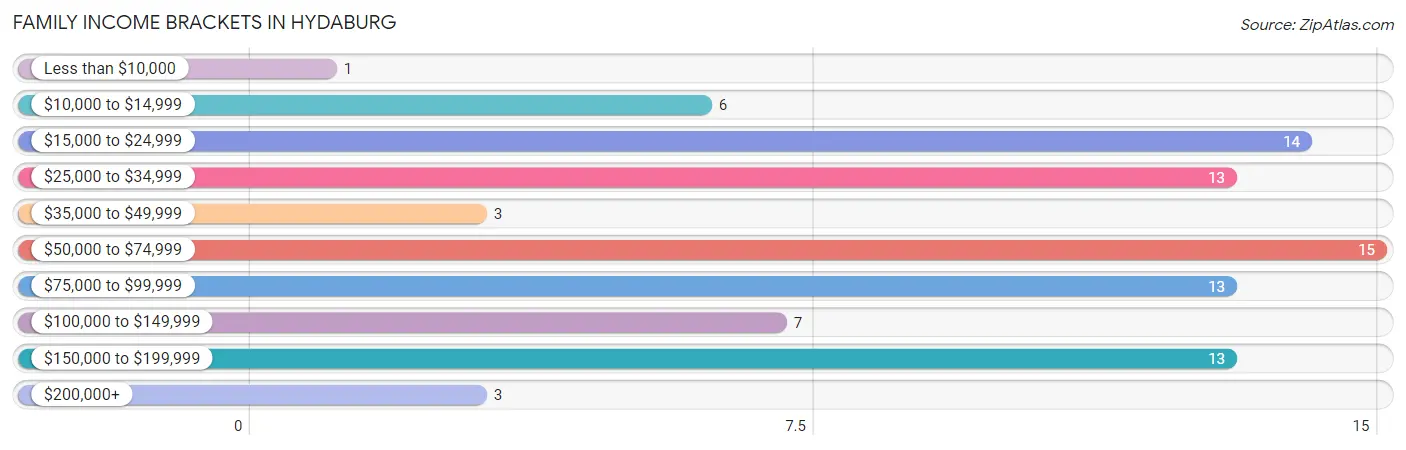
| Income Bracket | # Families | % Families |
| Less than $10,000 | 1 | 1.1% |
| $10,000 to $14,999 | 6 | 6.8% |
| $15,000 to $24,999 | 14 | 15.9% |
| $25,000 to $34,999 | 13 | 14.8% |
| $35,000 to $49,999 | 3 | 3.4% |
| $50,000 to $74,999 | 15 | 17.0% |
| $75,000 to $99,999 | 13 | 14.8% |
| $100,000 to $149,999 | 7 | 8.0% |
| $150,000 to $199,999 | 13 | 14.8% |
| $200,000+ | 3 | 3.4% |
Family Income by Famaliy Size in Hydaburg
3-person families (20 | 22.7%) account for the highest median family income in Hydaburg with $86,250 per family, while 3-person families (20 | 22.7%) have the highest median income of $28,750 per family member.
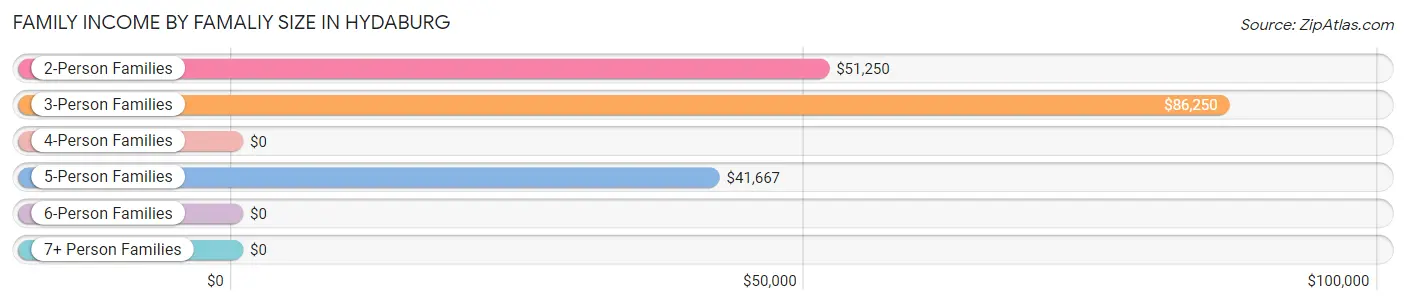
| Income Bracket | # Families | Median Income |
| 2-Person Families | 46 (52.3%) | $51,250 |
| 3-Person Families | 20 (22.7%) | $86,250 |
| 4-Person Families | 4 (4.5%) | $0 |
| 5-Person Families | 8 (9.1%) | $41,667 |
| 6-Person Families | 2 (2.3%) | $0 |
| 7+ Person Families | 8 (9.1%) | $0 |
| Total | 88 (100.0%) | $54,500 |
Family Income by Number of Earners in Hydaburg
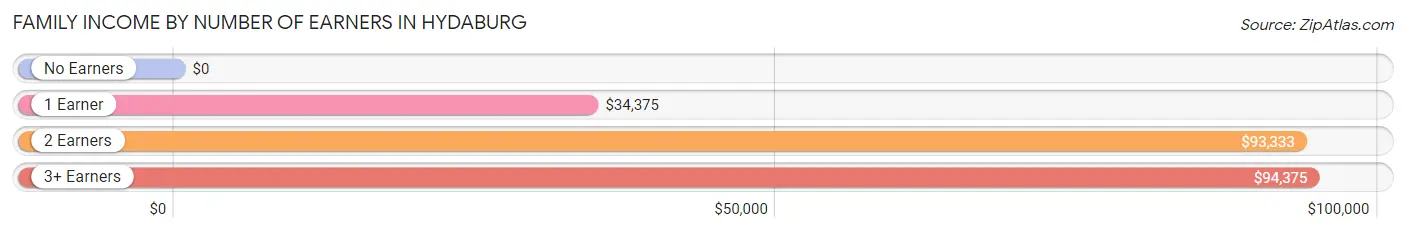
| Number of Earners | # Families | Median Income |
| No Earners | 8 (9.1%) | $0 |
| 1 Earner | 41 (46.6%) | $34,375 |
| 2 Earners | 30 (34.1%) | $93,333 |
| 3+ Earners | 9 (10.2%) | $94,375 |
| Total | 88 (100.0%) | $54,500 |
Household Income in Hydaburg
Household Income Brackets in Hydaburg
With 20 households falling in the category, the $50,000 to $74,999 income range is the most frequent in Hydaburg, accounting for 16.0% of all households. In contrast, only 3 households (2.4%) fall into the $200,000+ income bracket, making it the least populous group.
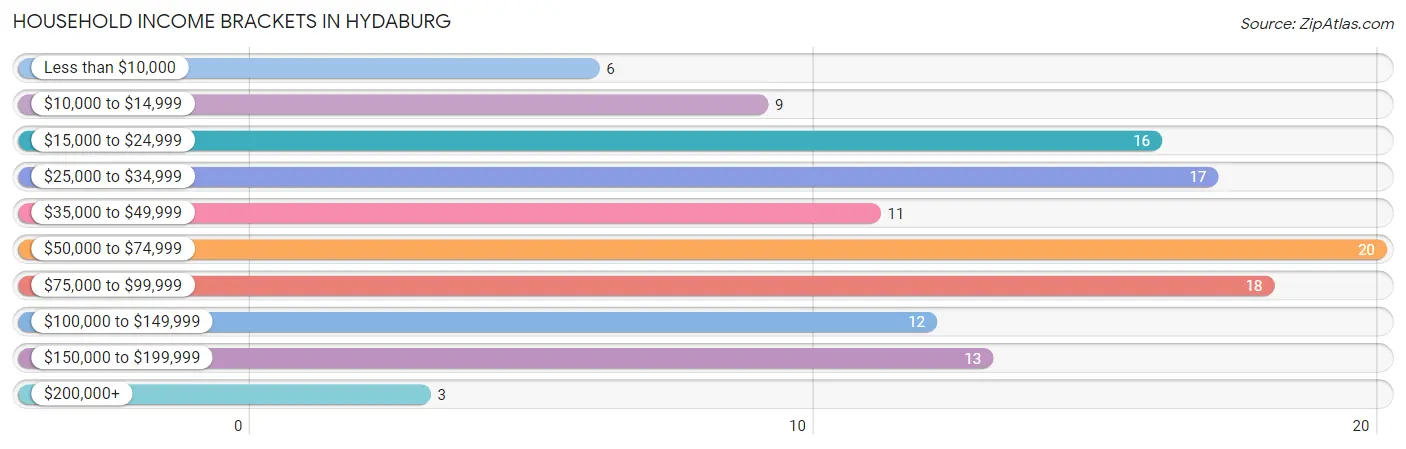
| Income Bracket | # Households | % Households |
| Less than $10,000 | 6 | 4.8% |
| $10,000 to $14,999 | 9 | 7.2% |
| $15,000 to $24,999 | 16 | 12.8% |
| $25,000 to $34,999 | 17 | 13.6% |
| $35,000 to $49,999 | 11 | 8.8% |
| $50,000 to $74,999 | 20 | 16.0% |
| $75,000 to $99,999 | 18 | 14.4% |
| $100,000 to $149,999 | 12 | 9.6% |
| $150,000 to $199,999 | 13 | 10.4% |
| $200,000+ | 3 | 2.4% |
Household Income by Householder Age in Hydaburg
The median household income in Hydaburg is $53,125, with the highest median household income of $71,250 found in the 45 to 64 years age bracket for the primary householder. A total of 50 households (40.0%) fall into this category.
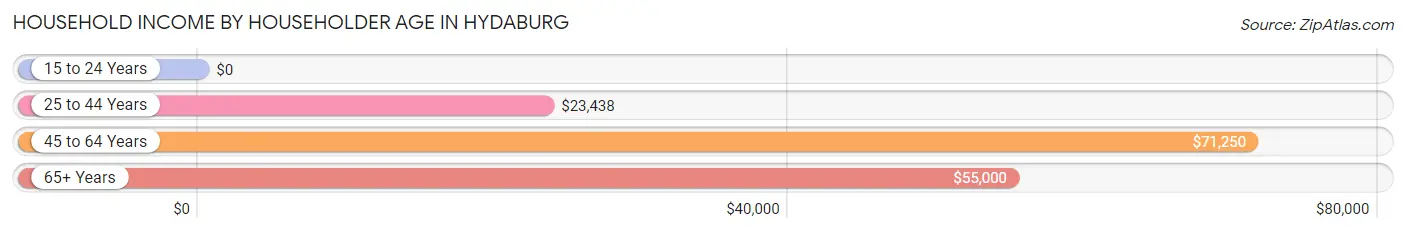
| Income Bracket | # Households | Median Income |
| 15 to 24 Years | 0 (0.0%) | $0 |
| 25 to 44 Years | 27 (21.6%) | $23,438 |
| 45 to 64 Years | 50 (40.0%) | $71,250 |
| 65+ Years | 48 (38.4%) | $55,000 |
| Total | 125 (100.0%) | $53,125 |
Poverty in Hydaburg
Income Below Poverty by Sex and Age in Hydaburg
With 21.8% poverty level for males and 27.9% for females among the residents of Hydaburg, 5 year old males and 5 year old females are the most vulnerable to poverty, with 2 males (100.0%) and 3 females (100.0%) in their respective age groups living below the poverty level.
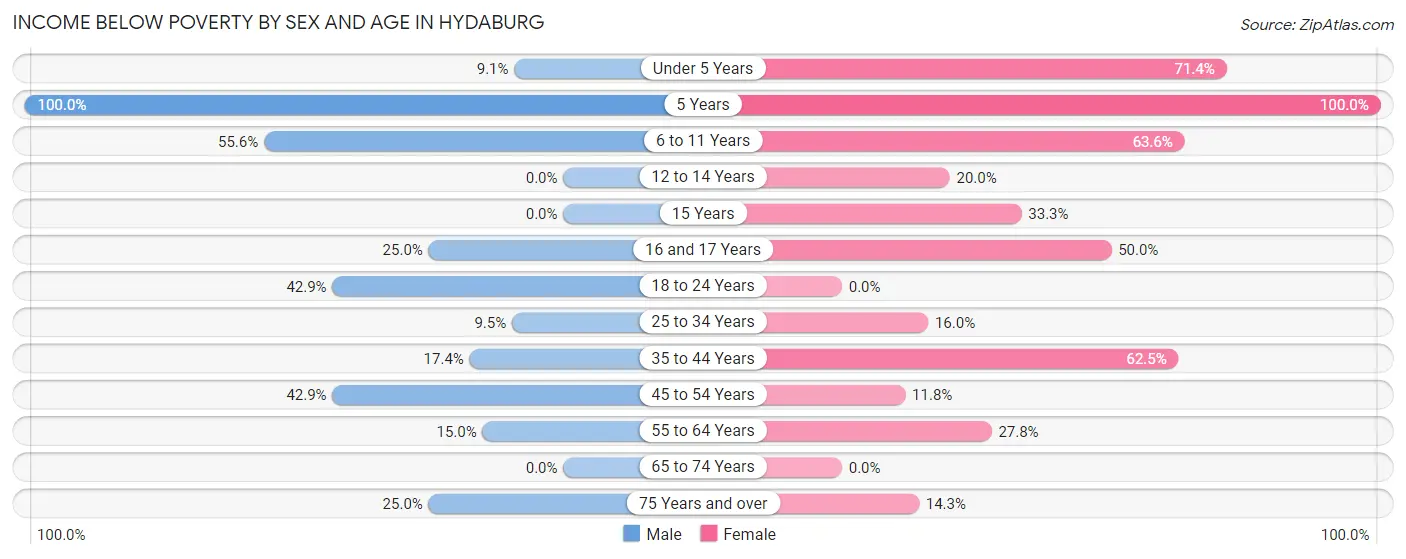
| Age Bracket | Male | Female |
| Under 5 Years | 1 (9.1%) | 5 (71.4%) |
| 5 Years | 2 (100.0%) | 3 (100.0%) |
| 6 to 11 Years | 5 (55.6%) | 7 (63.6%) |
| 12 to 14 Years | 0 (0.0%) | 1 (20.0%) |
| 15 Years | 0 (0.0%) | 4 (33.3%) |
| 16 and 17 Years | 3 (25.0%) | 1 (50.0%) |
| 18 to 24 Years | 6 (42.9%) | 0 (0.0%) |
| 25 to 34 Years | 2 (9.5%) | 4 (16.0%) |
| 35 to 44 Years | 4 (17.4%) | 10 (62.5%) |
| 45 to 54 Years | 9 (42.9%) | 2 (11.8%) |
| 55 to 64 Years | 3 (15.0%) | 5 (27.8%) |
| 65 to 74 Years | 0 (0.0%) | 0 (0.0%) |
| 75 Years and over | 2 (25.0%) | 2 (14.3%) |
| Total | 37 (21.8%) | 44 (27.9%) |
Income Above Poverty by Sex and Age in Hydaburg
According to the poverty statistics in Hydaburg, males aged 65 to 74 years and females aged 18 to 24 years are the age groups that are most secure financially, with 100.0% of males and 100.0% of females in these age groups living above the poverty line.
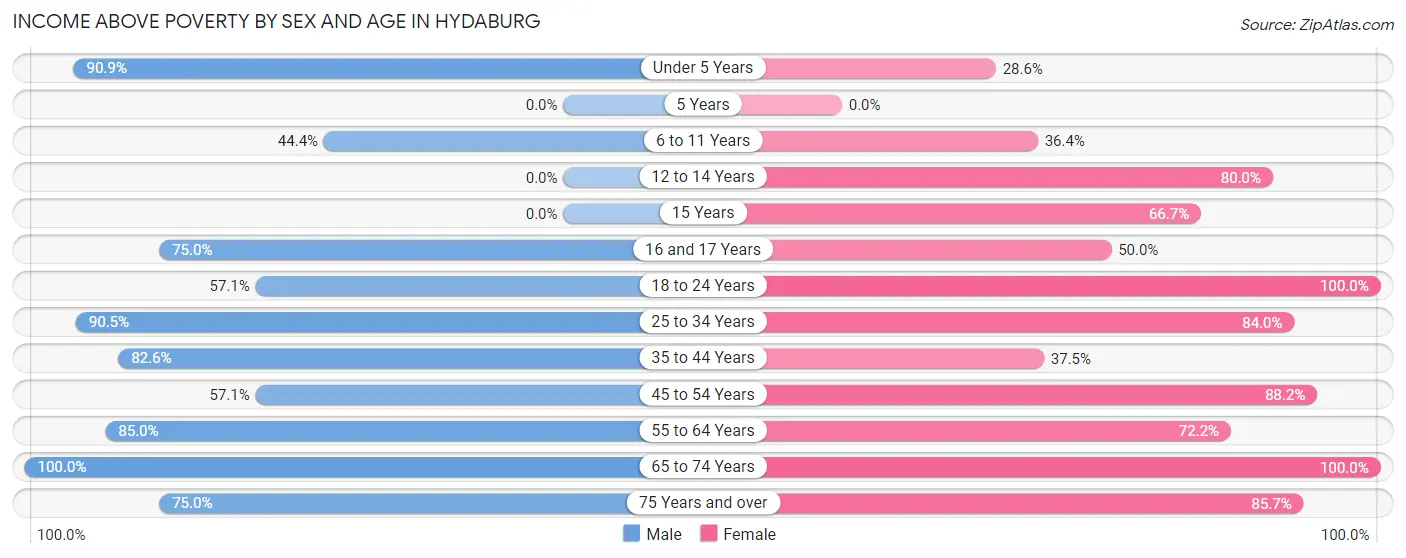
| Age Bracket | Male | Female |
| Under 5 Years | 10 (90.9%) | 2 (28.6%) |
| 5 Years | 0 (0.0%) | 0 (0.0%) |
| 6 to 11 Years | 4 (44.4%) | 4 (36.4%) |
| 12 to 14 Years | 0 (0.0%) | 4 (80.0%) |
| 15 Years | 0 (0.0%) | 8 (66.7%) |
| 16 and 17 Years | 9 (75.0%) | 1 (50.0%) |
| 18 to 24 Years | 8 (57.1%) | 9 (100.0%) |
| 25 to 34 Years | 19 (90.5%) | 21 (84.0%) |
| 35 to 44 Years | 19 (82.6%) | 6 (37.5%) |
| 45 to 54 Years | 12 (57.1%) | 15 (88.2%) |
| 55 to 64 Years | 17 (85.0%) | 13 (72.2%) |
| 65 to 74 Years | 29 (100.0%) | 19 (100.0%) |
| 75 Years and over | 6 (75.0%) | 12 (85.7%) |
| Total | 133 (78.2%) | 114 (72.2%) |
Income Below Poverty Among Married-Couple Families in Hydaburg
The poverty statistics for married-couple families in Hydaburg show that 16.0% or 8 of the total 50 families live below the poverty line. Families with 5 or more children have the highest poverty rate of 100.0%, comprising of 4 families. On the other hand, families with 1 or 2 children have the lowest poverty rate of 0.0%, which includes 0 families.
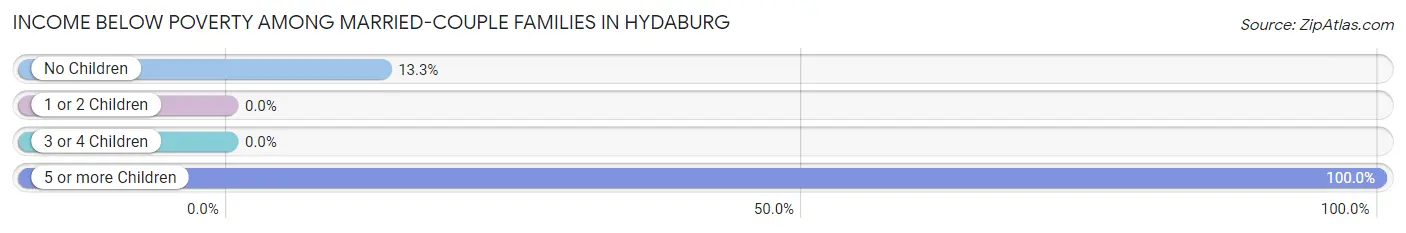
| Children | Above Poverty | Below Poverty |
| No Children | 26 (86.7%) | 4 (13.3%) |
| 1 or 2 Children | 11 (100.0%) | 0 (0.0%) |
| 3 or 4 Children | 5 (100.0%) | 0 (0.0%) |
| 5 or more Children | 0 (0.0%) | 4 (100.0%) |
| Total | 42 (84.0%) | 8 (16.0%) |
Income Below Poverty Among Single-Parent Households in Hydaburg
According to the poverty data in Hydaburg, 33.3% or 4 single-father households and 30.8% or 8 single-mother households are living below the poverty line. Among single-father households, those with 1 or 2 children have the highest poverty rate, with 4 households (40.0%) experiencing poverty. Likewise, among single-mother households, those with 3 or 4 children have the highest poverty rate, with 2 households (100.0%) falling below the poverty line.
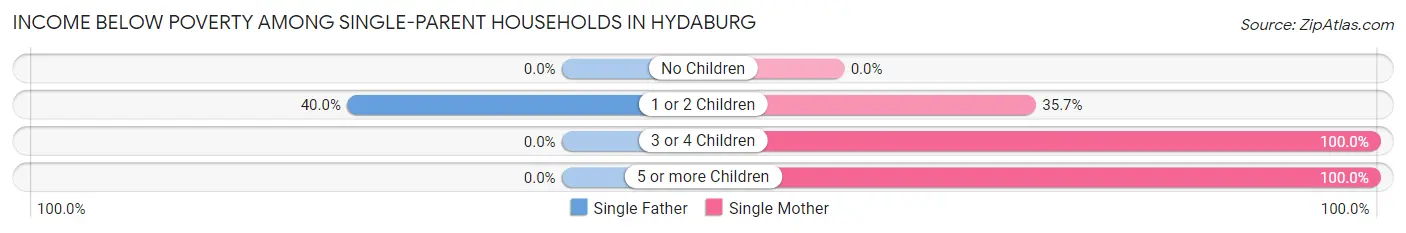
| Children | Single Father | Single Mother |
| No Children | 0 (0.0%) | 0 (0.0%) |
| 1 or 2 Children | 4 (40.0%) | 5 (35.7%) |
| 3 or 4 Children | 0 (0.0%) | 2 (100.0%) |
| 5 or more Children | 0 (0.0%) | 1 (100.0%) |
| Total | 4 (33.3%) | 8 (30.8%) |
Income Below Poverty Among Married-Couple vs Single-Parent Households in Hydaburg
The poverty data for Hydaburg shows that 8 of the married-couple family households (16.0%) and 12 of the single-parent households (31.6%) are living below the poverty level. Within the married-couple family households, those with 5 or more children have the highest poverty rate, with 4 households (100.0%) falling below the poverty line. Among the single-parent households, those with 3 or 4 children have the highest poverty rate, with 2 household (100.0%) living below poverty.
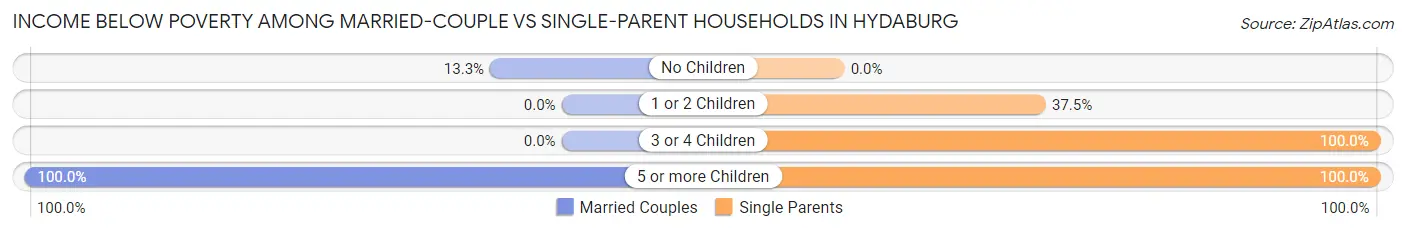
| Children | Married-Couple Families | Single-Parent Households |
| No Children | 4 (13.3%) | 0 (0.0%) |
| 1 or 2 Children | 0 (0.0%) | 9 (37.5%) |
| 3 or 4 Children | 0 (0.0%) | 2 (100.0%) |
| 5 or more Children | 4 (100.0%) | 1 (100.0%) |
| Total | 8 (16.0%) | 12 (31.6%) |
Race in Hydaburg
The most populous races in Hydaburg are Native / Alaskan (217 | 66.2%), White / Caucasian (49 | 14.9%), and Two or more Races (46 | 14.0%).
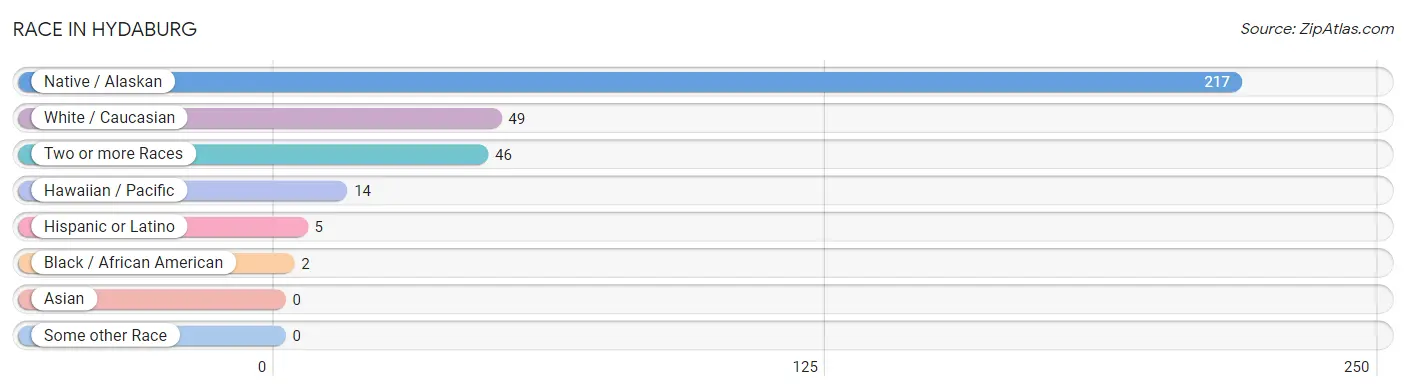
| Race | # Population | % Population |
| Asian | 0 | 0.0% |
| Black / African American | 2 | 0.6% |
| Hawaiian / Pacific | 14 | 4.3% |
| Hispanic or Latino | 5 | 1.5% |
| Native / Alaskan | 217 | 66.2% |
| White / Caucasian | 49 | 14.9% |
| Two or more Races | 46 | 14.0% |
| Some other Race | 0 | 0.0% |
| Total | 328 | 100.0% |
Ancestry in Hydaburg
The most populous ancestries reported in Hydaburg are Tlingit-Haida (228 | 69.5%), Irish (37 | 11.3%), German (31 | 9.5%), Tsimshian (17 | 5.2%), and French Canadian (14 | 4.3%), together accounting for 99.7% of all Hydaburg residents.
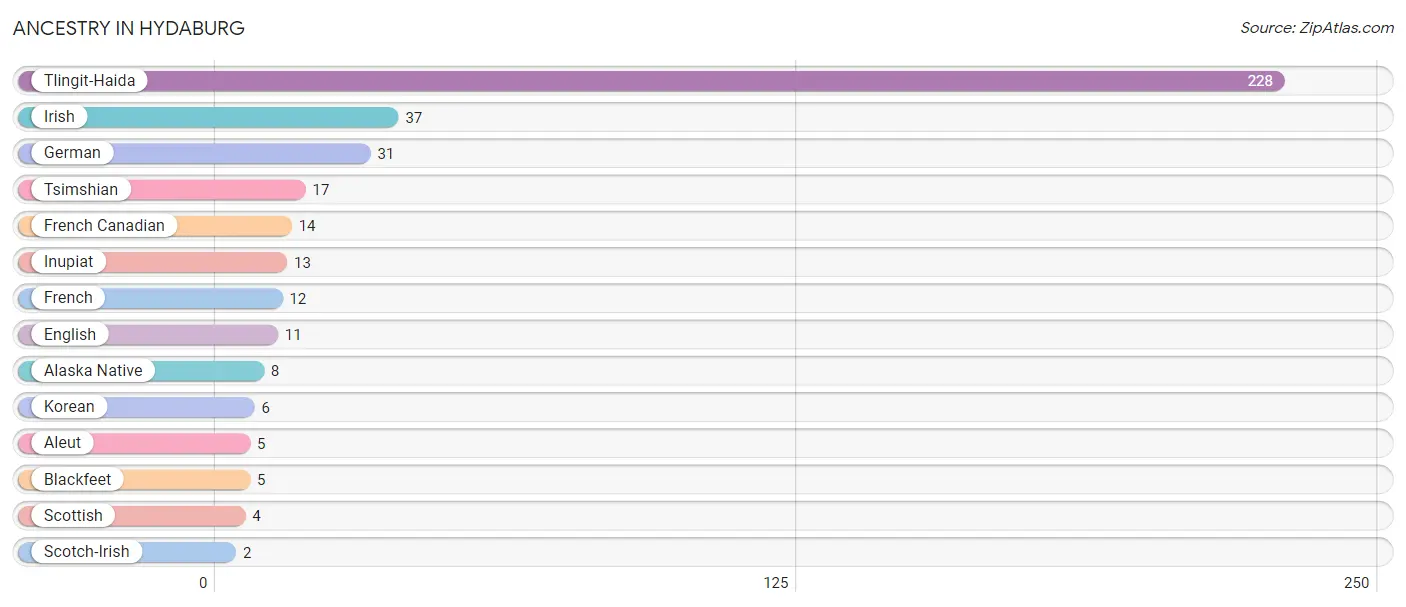
| Ancestry | # Population | % Population |
| Alaska Native | 8 | 2.4% |
| Aleut | 5 | 1.5% |
| Blackfeet | 5 | 1.5% |
| English | 11 | 3.4% |
| French | 12 | 3.7% |
| French Canadian | 14 | 4.3% |
| German | 31 | 9.5% |
| Inupiat | 13 | 4.0% |
| Irish | 37 | 11.3% |
| Korean | 6 | 1.8% |
| Scotch-Irish | 2 | 0.6% |
| Scottish | 4 | 1.2% |
| Tlingit-Haida | 228 | 69.5% |
| Tsimshian | 17 | 5.2% | View All 14 Rows |
Immigrants in Hydaburg
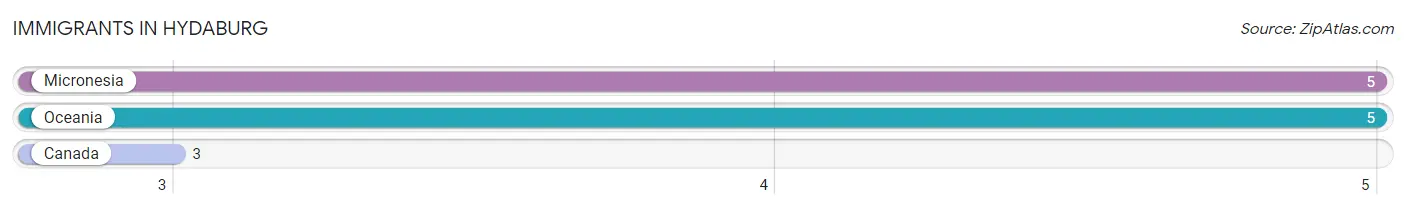
The most numerous immigrant groups reported in Hydaburg came from Micronesia (5 | 1.5%), Oceania (5 | 1.5%), and Canada (3 | 0.9%), together accounting for 4.0% of all Hydaburg residents.
| Immigration Origin | # Population | % Population |
| Canada | 3 | 0.9% |
| Micronesia | 5 | 1.5% |
| Oceania | 5 | 1.5% | View All 3 Rows |
Sex and Age in Hydaburg
Sex and Age in Hydaburg
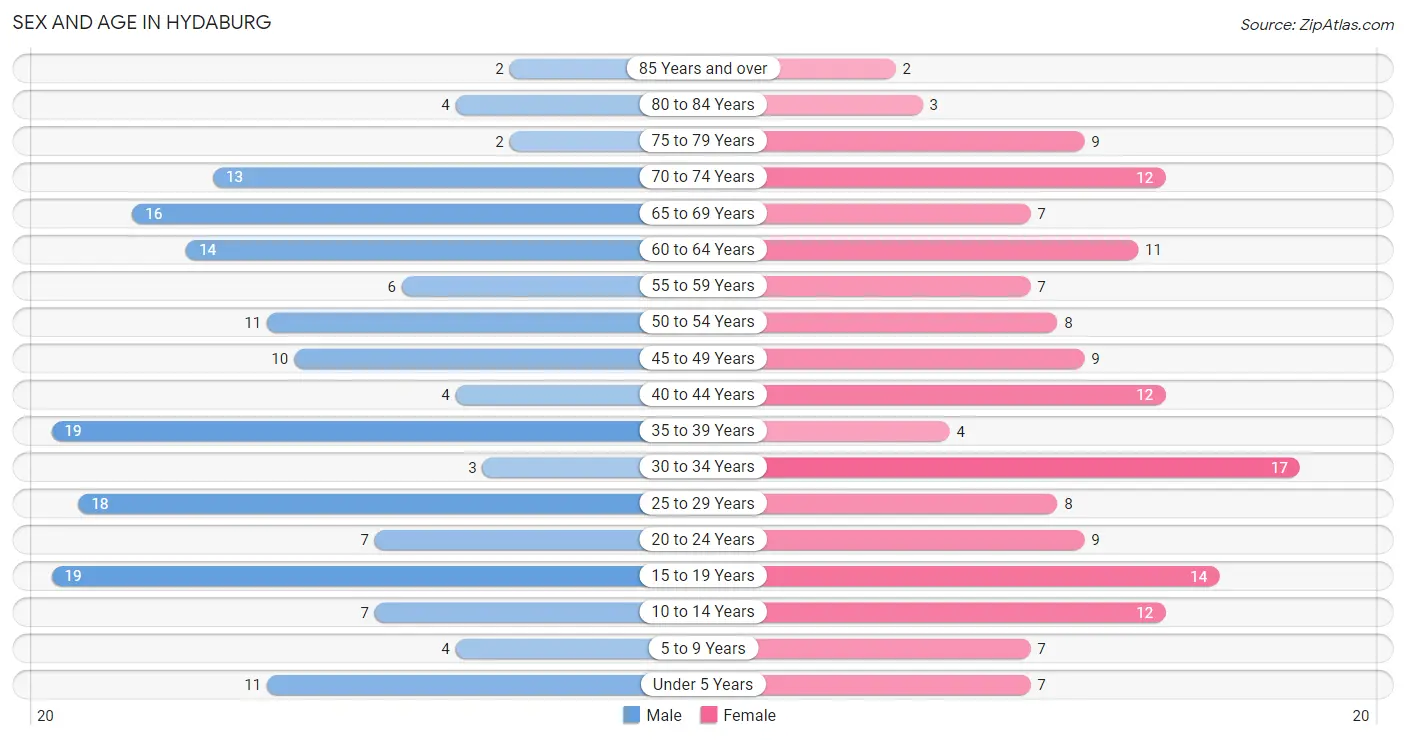
The most populous age groups in Hydaburg are 15 to 19 Years (19 | 11.2%) for men and 30 to 34 Years (17 | 10.8%) for women.
| Age Bracket | Male | Female |
| Under 5 Years | 11 (6.5%) | 7 (4.4%) |
| 5 to 9 Years | 4 (2.4%) | 7 (4.4%) |
| 10 to 14 Years | 7 (4.1%) | 12 (7.6%) |
| 15 to 19 Years | 19 (11.2%) | 14 (8.9%) |
| 20 to 24 Years | 7 (4.1%) | 9 (5.7%) |
| 25 to 29 Years | 18 (10.6%) | 8 (5.1%) |
| 30 to 34 Years | 3 (1.8%) | 17 (10.8%) |
| 35 to 39 Years | 19 (11.2%) | 4 (2.5%) |
| 40 to 44 Years | 4 (2.4%) | 12 (7.6%) |
| 45 to 49 Years | 10 (5.9%) | 9 (5.7%) |
| 50 to 54 Years | 11 (6.5%) | 8 (5.1%) |
| 55 to 59 Years | 6 (3.5%) | 7 (4.4%) |
| 60 to 64 Years | 14 (8.2%) | 11 (7.0%) |
| 65 to 69 Years | 16 (9.4%) | 7 (4.4%) |
| 70 to 74 Years | 13 (7.6%) | 12 (7.6%) |
| 75 to 79 Years | 2 (1.2%) | 9 (5.7%) |
| 80 to 84 Years | 4 (2.4%) | 3 (1.9%) |
| 85 Years and over | 2 (1.2%) | 2 (1.3%) |
| Total | 170 (100.0%) | 158 (100.0%) |
Families and Households in Hydaburg
Median Family Size in Hydaburg
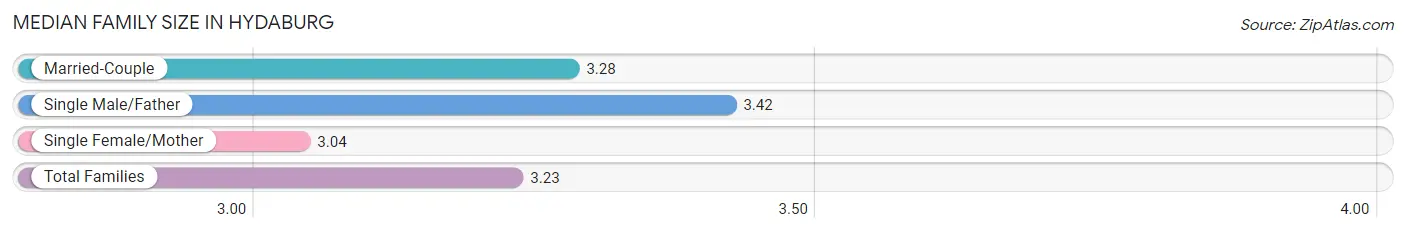
The median family size in Hydaburg is 3.23 persons per family, with single male/father families (12 | 13.6%) accounting for the largest median family size of 3.42 persons per family. On the other hand, single female/mother families (26 | 29.5%) represent the smallest median family size with 3.04 persons per family.
| Family Type | # Families | Family Size |
| Married-Couple | 50 (56.8%) | 3.28 |
| Single Male/Father | 12 (13.6%) | 3.42 |
| Single Female/Mother | 26 (29.5%) | 3.04 |
| Total Families | 88 (100.0%) | 3.23 |
Median Household Size in Hydaburg
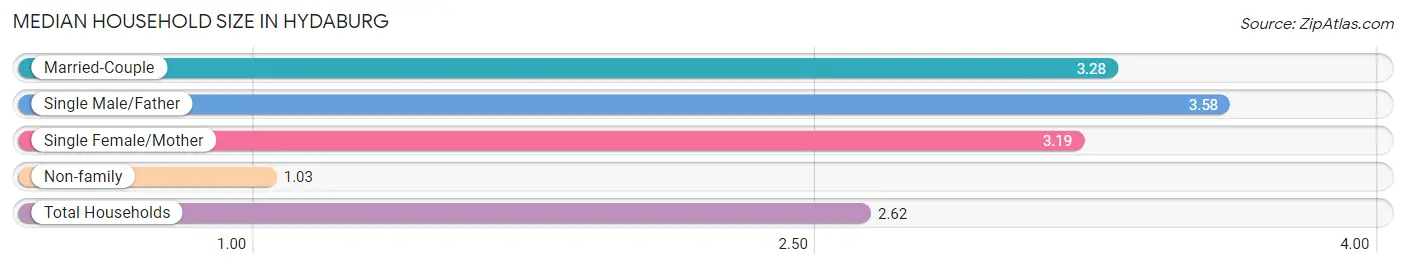
The median household size in Hydaburg is 2.62 persons per household, with single male/father households (12 | 9.6%) accounting for the largest median household size of 3.58 persons per household. non-family households (37 | 29.6%) represent the smallest median household size with 1.03 persons per household.
| Household Type | # Households | Household Size |
| Married-Couple | 50 (40.0%) | 3.28 |
| Single Male/Father | 12 (9.6%) | 3.58 |
| Single Female/Mother | 26 (20.8%) | 3.19 |
| Non-family | 37 (29.6%) | 1.03 |
| Total Households | 125 (100.0%) | 2.62 |
Household Size by Marriage Status in Hydaburg
Out of a total of 125 households in Hydaburg, 88 (70.4%) are family households, while 37 (29.6%) are nonfamily households. The most numerous type of family households are 2-person households, comprising 43, and the most common type of nonfamily households are 1-person households, comprising 35.
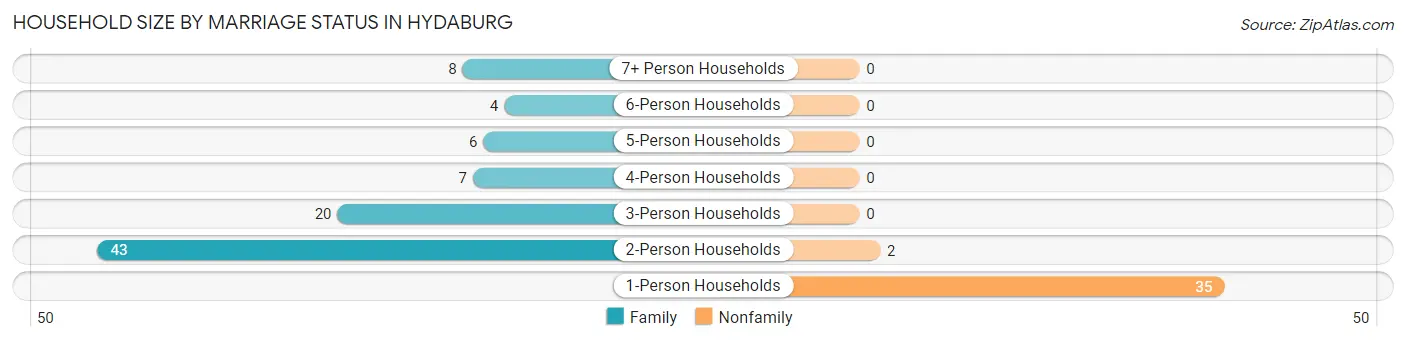
| Household Size | Family Households | Nonfamily Households |
| 1-Person Households | - | 35 (28.0%) |
| 2-Person Households | 43 (34.4%) | 2 (1.6%) |
| 3-Person Households | 20 (16.0%) | 0 (0.0%) |
| 4-Person Households | 7 (5.6%) | 0 (0.0%) |
| 5-Person Households | 6 (4.8%) | 0 (0.0%) |
| 6-Person Households | 4 (3.2%) | 0 (0.0%) |
| 7+ Person Households | 8 (6.4%) | 0 (0.0%) |
| Total | 88 (70.4%) | 37 (29.6%) |
Female Fertility in Hydaburg
Fertility by Age in Hydaburg
Average fertility rate in Hydaburg is 41.0 births per 1,000 women. Women in the age bracket of 20 to 34 years have the highest fertility rate with 88.0 births per 1,000 women. Women in the age bracket of 20 to 34 years acount for 100.0% of all women with births.
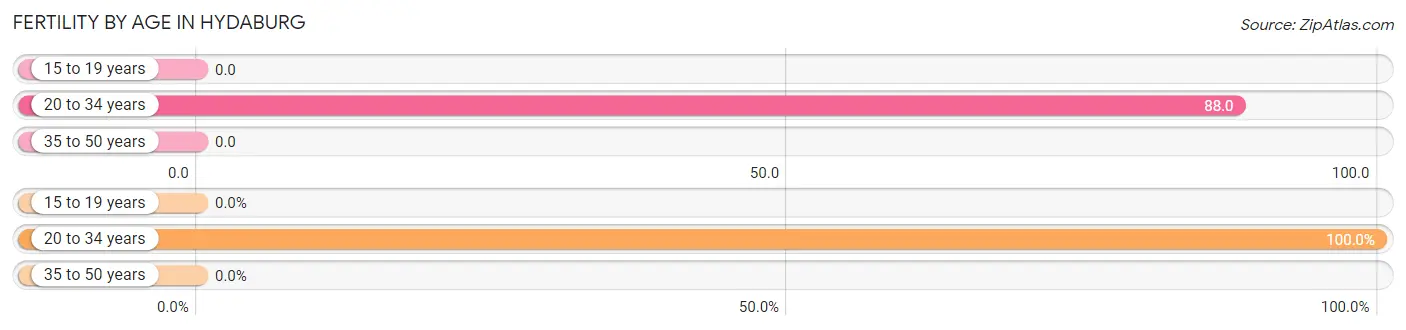
| Age Bracket | Women with Births | Births / 1,000 Women |
| 15 to 19 years | 0 (0.0%) | 0.0 |
| 20 to 34 years | 3 (100.0%) | 88.0 |
| 35 to 50 years | 0 (0.0%) | 0.0 |
| Total | 3 (100.0%) | 41.0 |
Fertility by Age by Marriage Status in Hydaburg
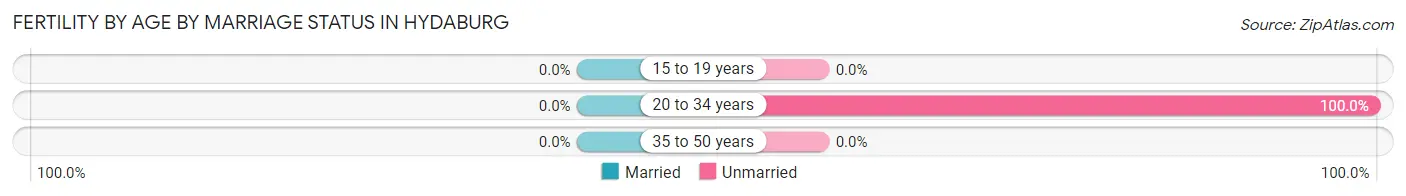
| Age Bracket | Married | Unmarried |
| 15 to 19 years | 0 (0.0%) | 0 (0.0%) |
| 20 to 34 years | 0 (0.0%) | 3 (100.0%) |
| 35 to 50 years | 0 (0.0%) | 0 (0.0%) |
| Total | 0 (0.0%) | 3 (100.0%) |
Fertility by Education in Hydaburg
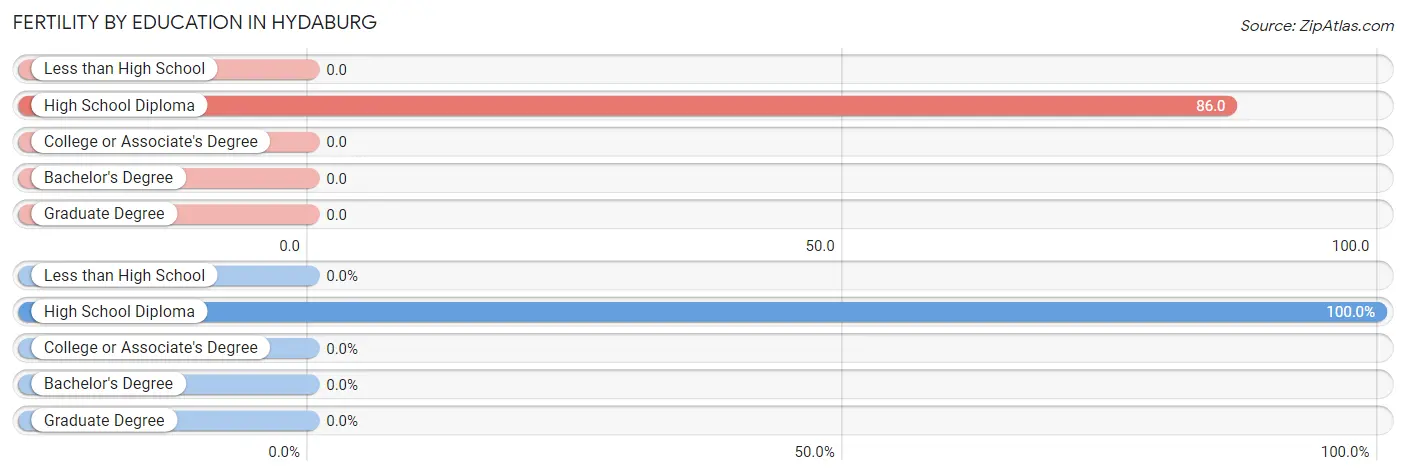
| Educational Attainment | Women with Births | Births / 1,000 Women |
| Less than High School | 0 (0.0%) | 0.0 |
| High School Diploma | 3 (100.0%) | 86.0 |
| College or Associate's Degree | 0 (0.0%) | 0.0 |
| Bachelor's Degree | 0 (0.0%) | 0.0 |
| Graduate Degree | 0 (0.0%) | 0.0 |
| Total | 3 (100.0%) | 41.0 |
Fertility by Education by Marriage Status in Hydaburg
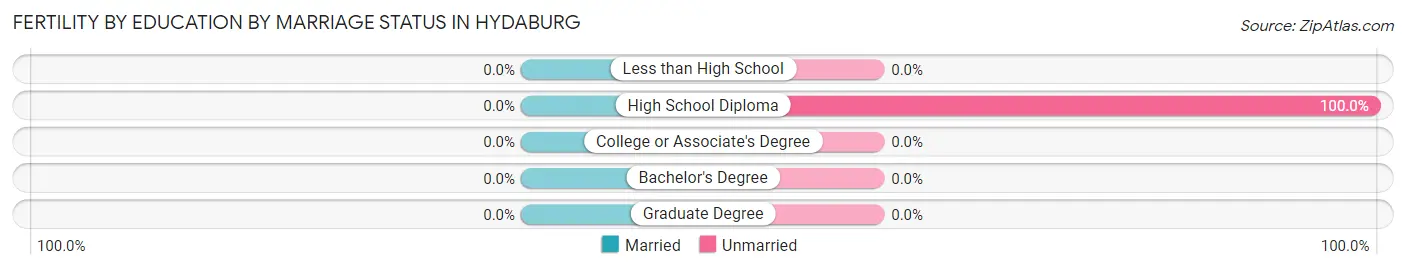
| Educational Attainment | Married | Unmarried |
| Less than High School | 0 (0.0%) | 0 (0.0%) |
| High School Diploma | 0 (0.0%) | 3 (100.0%) |
| College or Associate's Degree | 0 (0.0%) | 0 (0.0%) |
| Bachelor's Degree | 0 (0.0%) | 0 (0.0%) |
| Graduate Degree | 0 (0.0%) | 0 (0.0%) |
| Total | 0 (0.0%) | 3 (100.0%) |
Employment Characteristics in Hydaburg
Employment by Class of Employer in Hydaburg
Among the 133 employed individuals in Hydaburg, local government employees (62 | 46.6%), private company employees (26 | 19.6%), and self-employed (not incorporated) (17 | 12.8%) make up the most common classes of employment.
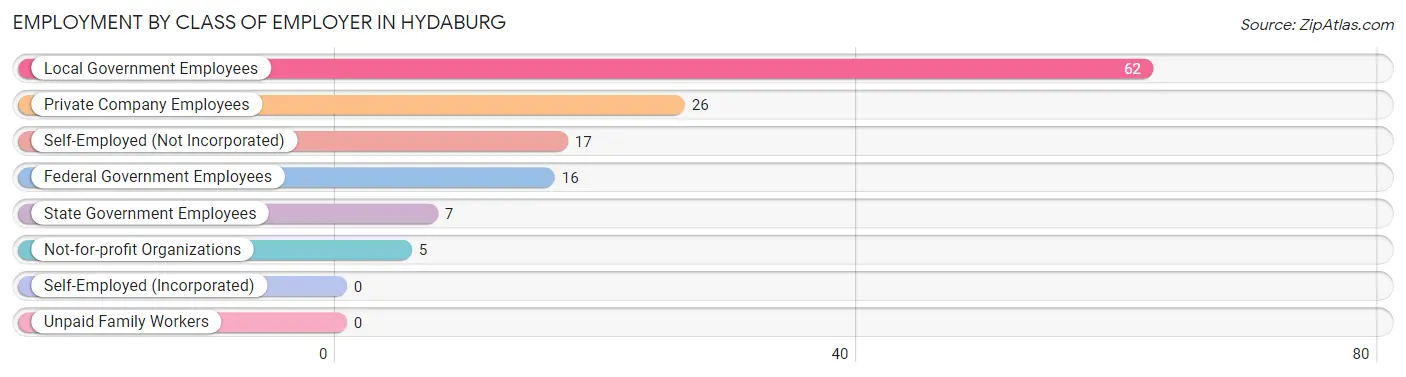
| Employer Class | # Employees | % Employees |
| Private Company Employees | 26 | 19.6% |
| Self-Employed (Incorporated) | 0 | 0.0% |
| Self-Employed (Not Incorporated) | 17 | 12.8% |
| Not-for-profit Organizations | 5 | 3.8% |
| Local Government Employees | 62 | 46.6% |
| State Government Employees | 7 | 5.3% |
| Federal Government Employees | 16 | 12.0% |
| Unpaid Family Workers | 0 | 0.0% |
| Total | 133 | 100.0% |
Employment Status by Age in Hydaburg
According to the labor force statistics for Hydaburg, out of the total population over 16 years of age (268), 56.0% or 150 individuals are in the labor force, with 10.0% or 15 of them unemployed. The age group with the highest labor force participation rate is 35 to 44 years, with 100.0% or 39 individuals in the labor force. Within the labor force, the 16 to 19 years age range has the highest percentage of unemployed individuals, with 100.0% or 2 of them being unemployed.
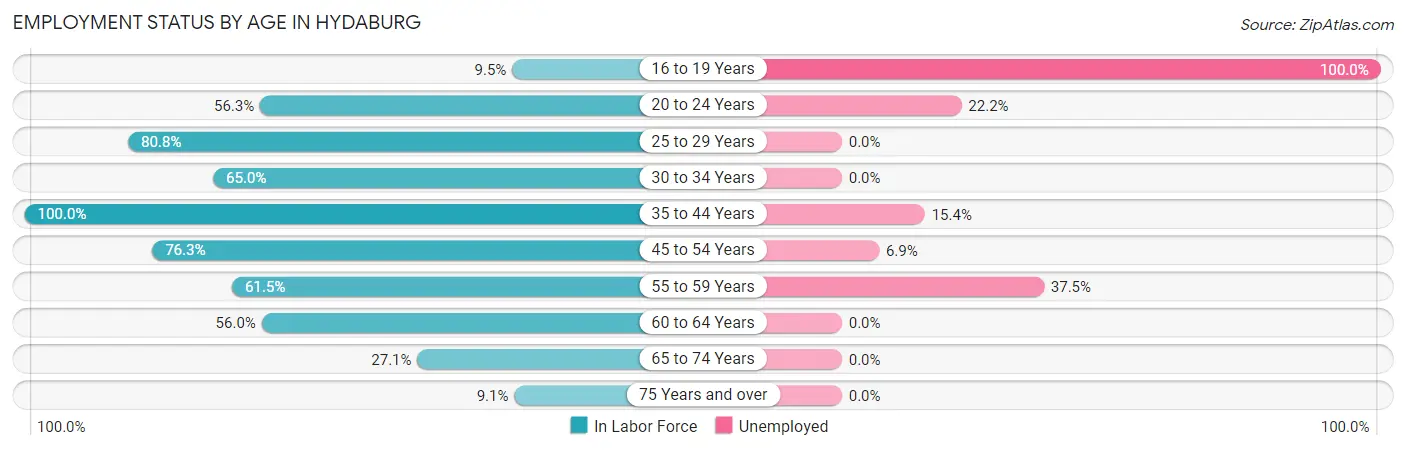
| Age Bracket | In Labor Force | Unemployed |
| 16 to 19 Years | 2 (9.5%) | 2 (100.0%) |
| 20 to 24 Years | 9 (56.3%) | 2 (22.2%) |
| 25 to 29 Years | 21 (80.8%) | 0 (0.0%) |
| 30 to 34 Years | 13 (65.0%) | 0 (0.0%) |
| 35 to 44 Years | 39 (100.0%) | 6 (15.4%) |
| 45 to 54 Years | 29 (76.3%) | 2 (6.9%) |
| 55 to 59 Years | 8 (61.5%) | 3 (37.5%) |
| 60 to 64 Years | 14 (56.0%) | 0 (0.0%) |
| 65 to 74 Years | 13 (27.1%) | 0 (0.0%) |
| 75 Years and over | 2 (9.1%) | 0 (0.0%) |
| Total | 150 (56.0%) | 15 (10.0%) |
Employment Status by Educational Attainment in Hydaburg
According to labor force statistics for Hydaburg, 77.0% of individuals (124) out of the total population between 25 and 64 years of age (161) are in the labor force, with 8.9% or 11 of them being unemployed. The group with the highest labor force participation rate are those with the educational attainment of bachelor's degree or higher, with 88.9% or 16 individuals in the labor force. Within the labor force, individuals with college / associate degree education have the highest percentage of unemployment, with 11.6% or 5 of them being unemployed.
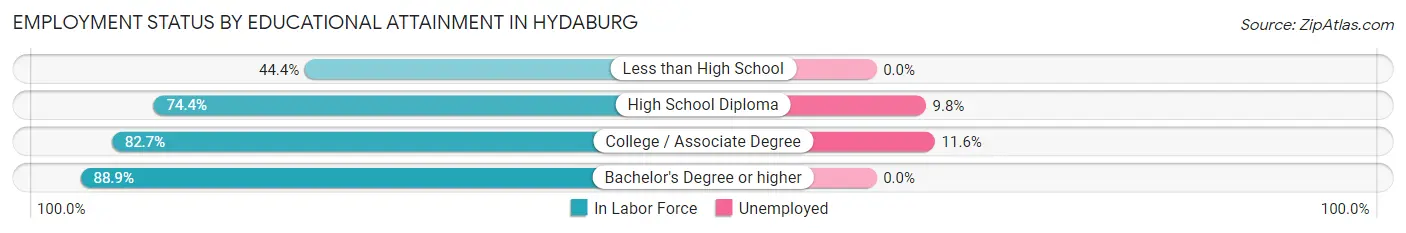
| Educational Attainment | In Labor Force | Unemployed |
| Less than High School | 4 (44.4%) | 0 (0.0%) |
| High School Diploma | 61 (74.4%) | 8 (9.8%) |
| College / Associate Degree | 43 (82.7%) | 6 (11.6%) |
| Bachelor's Degree or higher | 16 (88.9%) | 0 (0.0%) |
| Total | 124 (77.0%) | 14 (8.9%) |
Employment Occupations by Sex in Hydaburg
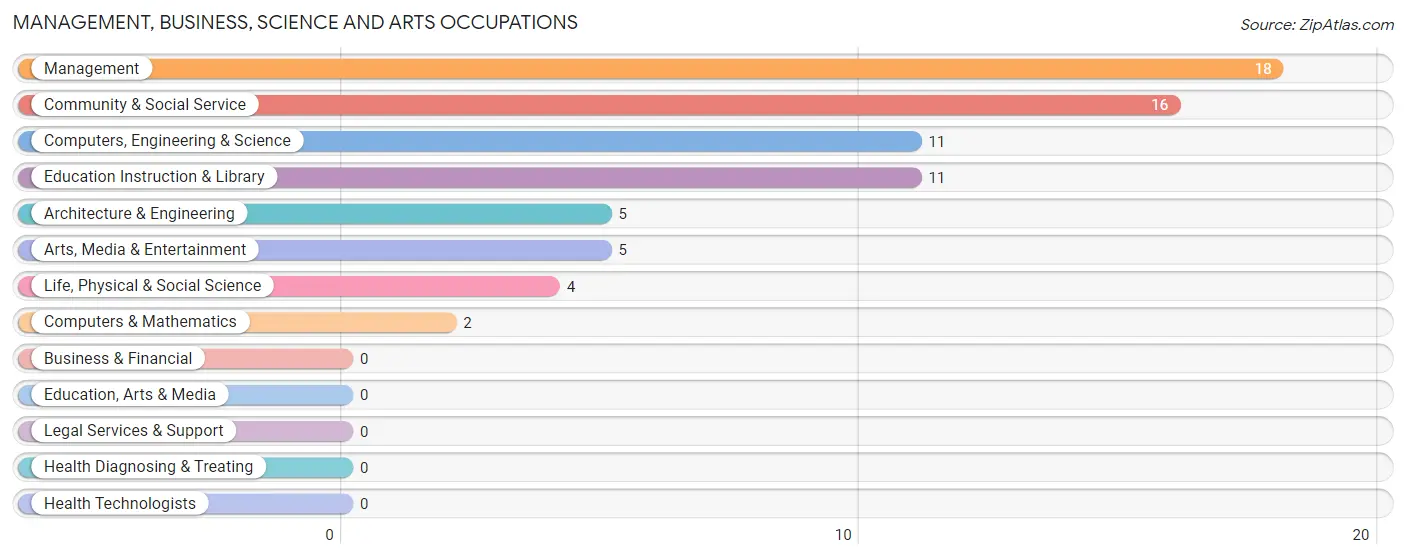
Management, Business, Science and Arts Occupations
The most common Management, Business, Science and Arts occupations in Hydaburg are Management (18 | 13.3%), Community & Social Service (16 | 11.8%), Computers, Engineering & Science (11 | 8.2%), Education Instruction & Library (11 | 8.2%), and Architecture & Engineering (5 | 3.7%).
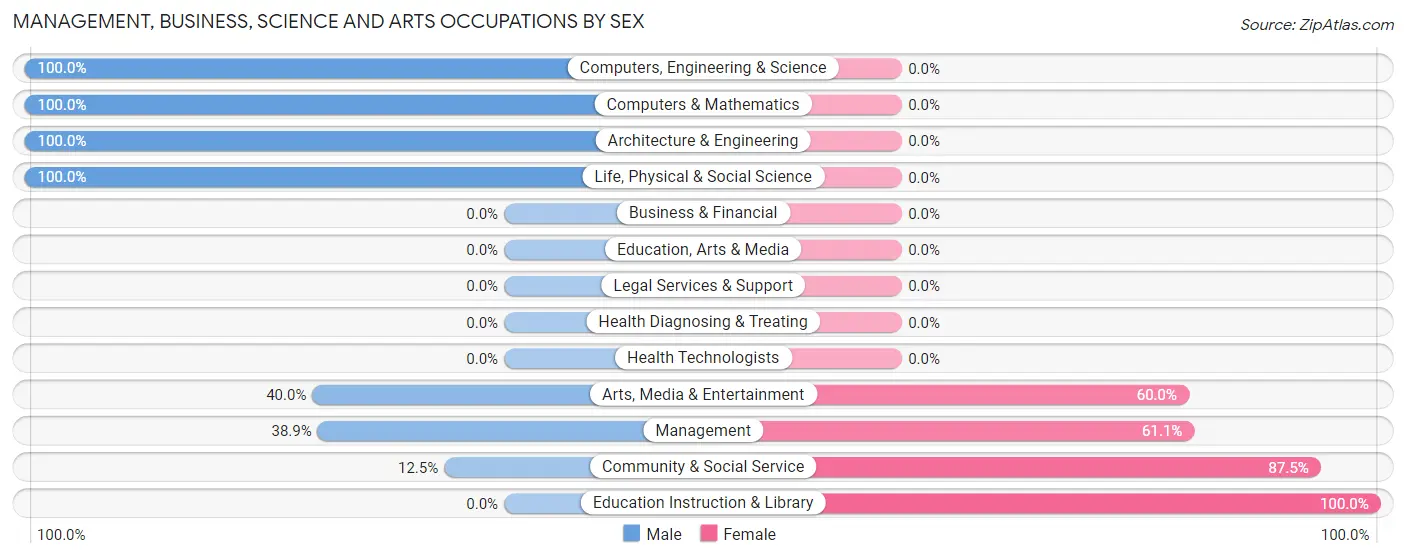
Management, Business, Science and Arts Occupations by Sex
Within the Management, Business, Science and Arts occupations in Hydaburg, the most male-oriented occupations are Computers, Engineering & Science (100.0%), Computers & Mathematics (100.0%), and Architecture & Engineering (100.0%), while the most female-oriented occupations are Education Instruction & Library (100.0%), Community & Social Service (87.5%), and Management (61.1%).
| Occupation | Male | Female |
| Management | 7 (38.9%) | 11 (61.1%) |
| Business & Financial | 0 (0.0%) | 0 (0.0%) |
| Computers, Engineering & Science | 11 (100.0%) | 0 (0.0%) |
| Computers & Mathematics | 2 (100.0%) | 0 (0.0%) |
| Architecture & Engineering | 5 (100.0%) | 0 (0.0%) |
| Life, Physical & Social Science | 4 (100.0%) | 0 (0.0%) |
| Community & Social Service | 2 (12.5%) | 14 (87.5%) |
| Education, Arts & Media | 0 (0.0%) | 0 (0.0%) |
| Legal Services & Support | 0 (0.0%) | 0 (0.0%) |
| Education Instruction & Library | 0 (0.0%) | 11 (100.0%) |
| Arts, Media & Entertainment | 2 (40.0%) | 3 (60.0%) |
| Health Diagnosing & Treating | 0 (0.0%) | 0 (0.0%) |
| Health Technologists | 0 (0.0%) | 0 (0.0%) |
| Total (Category) | 20 (44.4%) | 25 (55.6%) |
| Total (Overall) | 75 (55.6%) | 60 (44.4%) |
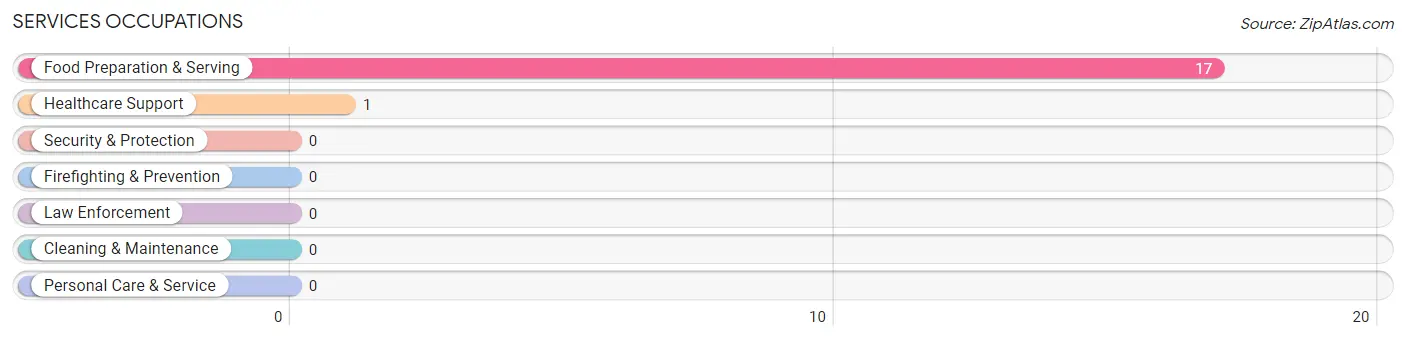
Services Occupations
The most common Services occupations in Hydaburg are Food Preparation & Serving (17 | 12.6%), and Healthcare Support (1 | 0.7%).
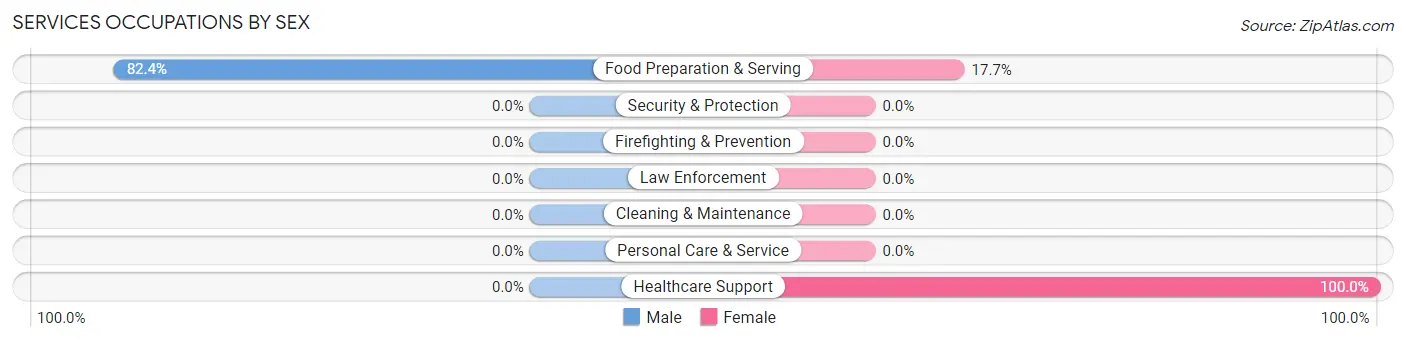
Services Occupations by Sex
| Occupation | Male | Female |
| Healthcare Support | 0 (0.0%) | 1 (100.0%) |
| Security & Protection | 0 (0.0%) | 0 (0.0%) |
| Firefighting & Prevention | 0 (0.0%) | 0 (0.0%) |
| Law Enforcement | 0 (0.0%) | 0 (0.0%) |
| Food Preparation & Serving | 14 (82.4%) | 3 (17.6%) |
| Cleaning & Maintenance | 0 (0.0%) | 0 (0.0%) |
| Personal Care & Service | 0 (0.0%) | 0 (0.0%) |
| Total (Category) | 14 (77.8%) | 4 (22.2%) |
| Total (Overall) | 75 (55.6%) | 60 (44.4%) |
Sales and Office Occupations
The most common Sales and Office occupations in Hydaburg are Office & Administration (31 | 23.0%), and Sales & Related (2 | 1.5%).
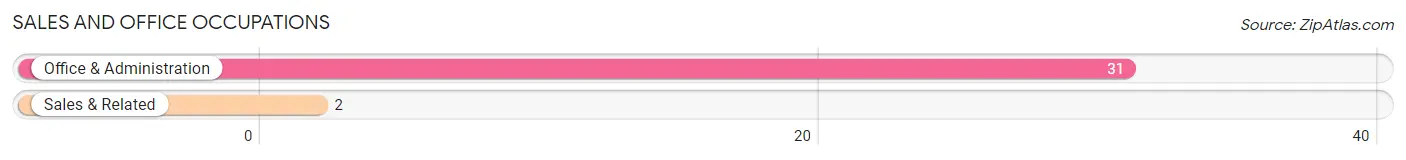
Sales and Office Occupations by Sex

| Occupation | Male | Female |
| Sales & Related | 2 (100.0%) | 0 (0.0%) |
| Office & Administration | 3 (9.7%) | 28 (90.3%) |
| Total (Category) | 5 (15.1%) | 28 (84.9%) |
| Total (Overall) | 75 (55.6%) | 60 (44.4%) |
Natural Resources, Construction and Maintenance Occupations
The most common Natural Resources, Construction and Maintenance occupations in Hydaburg are Construction & Extraction (16 | 11.8%), and Installation, Maintenance & Repair (6 | 4.4%).
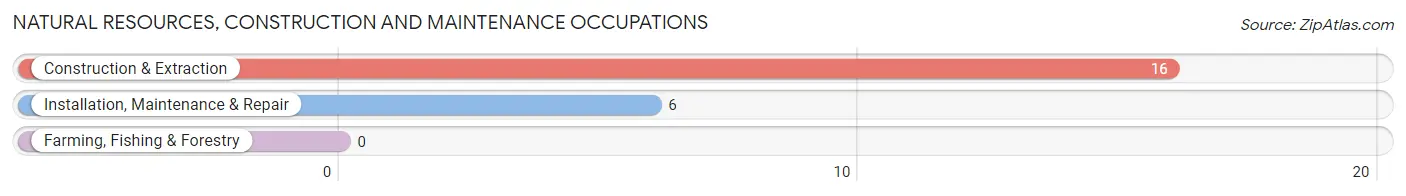
Natural Resources, Construction and Maintenance Occupations by Sex
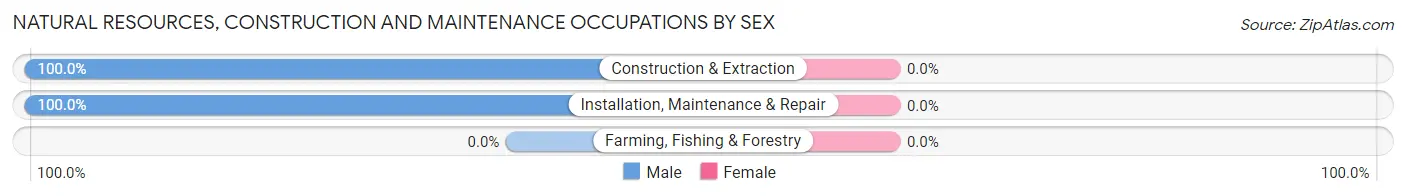
| Occupation | Male | Female |
| Farming, Fishing & Forestry | 0 (0.0%) | 0 (0.0%) |
| Construction & Extraction | 16 (100.0%) | 0 (0.0%) |
| Installation, Maintenance & Repair | 6 (100.0%) | 0 (0.0%) |
| Total (Category) | 22 (100.0%) | 0 (0.0%) |
| Total (Overall) | 75 (55.6%) | 60 (44.4%) |
Production, Transportation and Moving Occupations
The most common Production, Transportation and Moving occupations in Hydaburg are Production (7 | 5.2%), Transportation (5 | 3.7%), and Material Moving (5 | 3.7%).
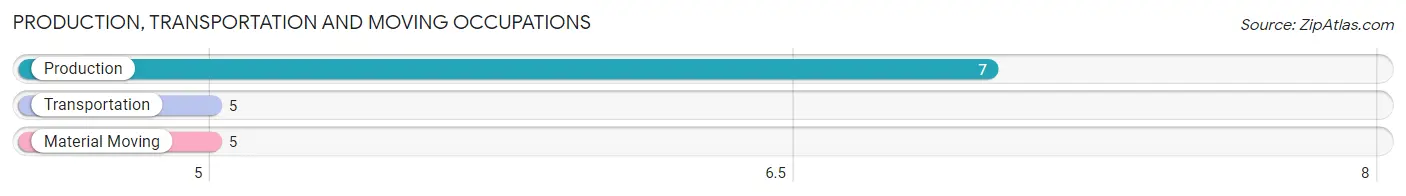
Production, Transportation and Moving Occupations by Sex
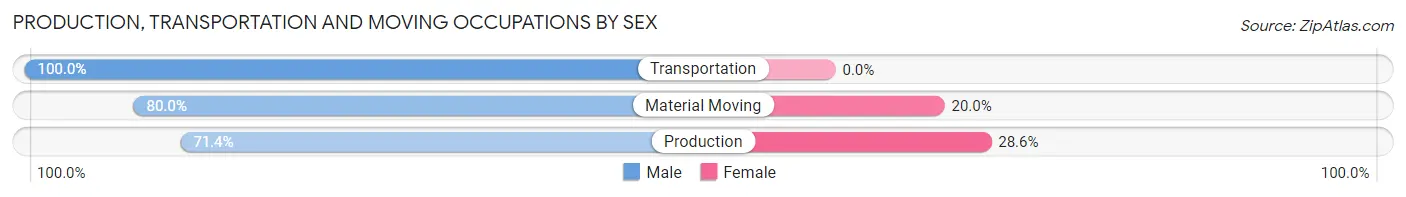
| Occupation | Male | Female |
| Production | 5 (71.4%) | 2 (28.6%) |
| Transportation | 5 (100.0%) | 0 (0.0%) |
| Material Moving | 4 (80.0%) | 1 (20.0%) |
| Total (Category) | 14 (82.4%) | 3 (17.6%) |
| Total (Overall) | 75 (55.6%) | 60 (44.4%) |
Employment Industries by Sex in Hydaburg
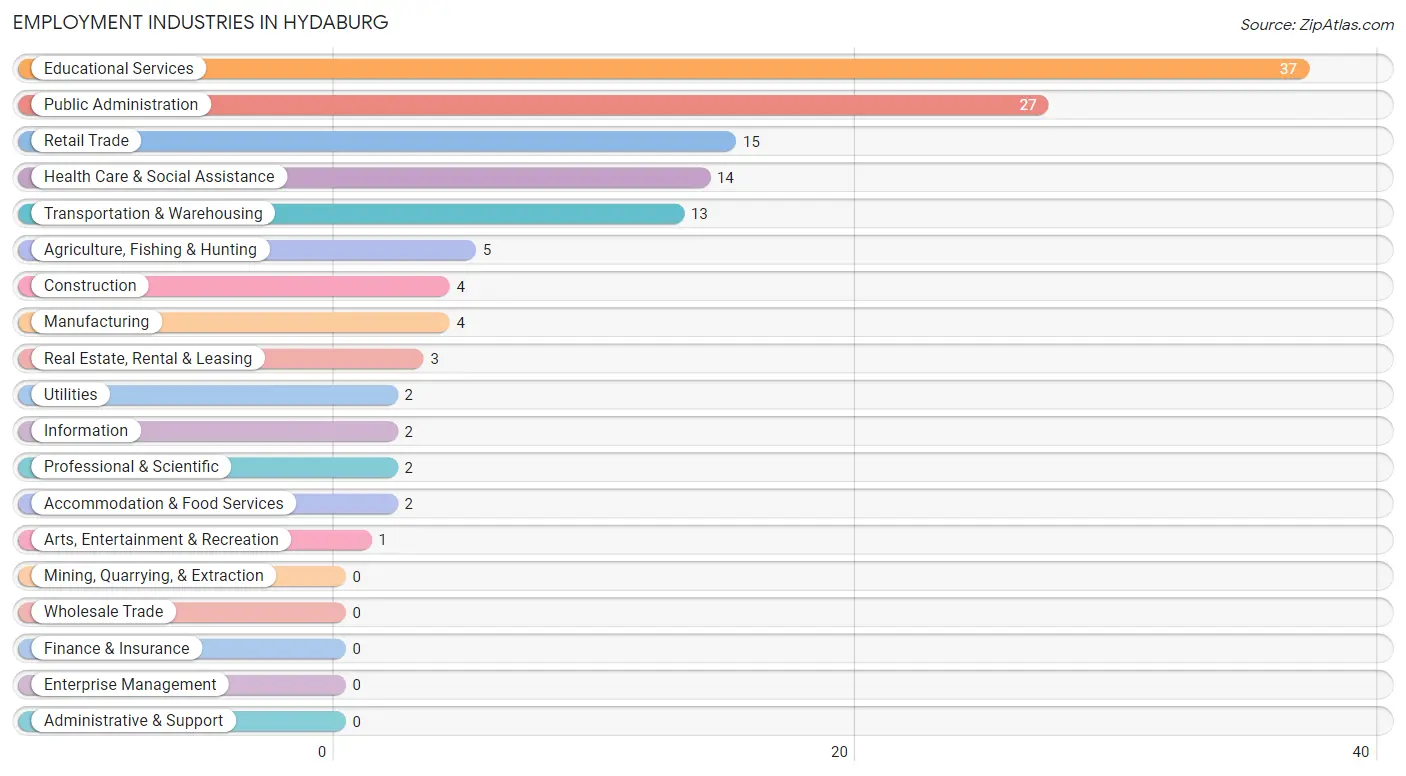
Employment Industries in Hydaburg
The major employment industries in Hydaburg include Educational Services (37 | 27.4%), Public Administration (27 | 20.0%), Retail Trade (15 | 11.1%), Health Care & Social Assistance (14 | 10.4%), and Transportation & Warehousing (13 | 9.6%).
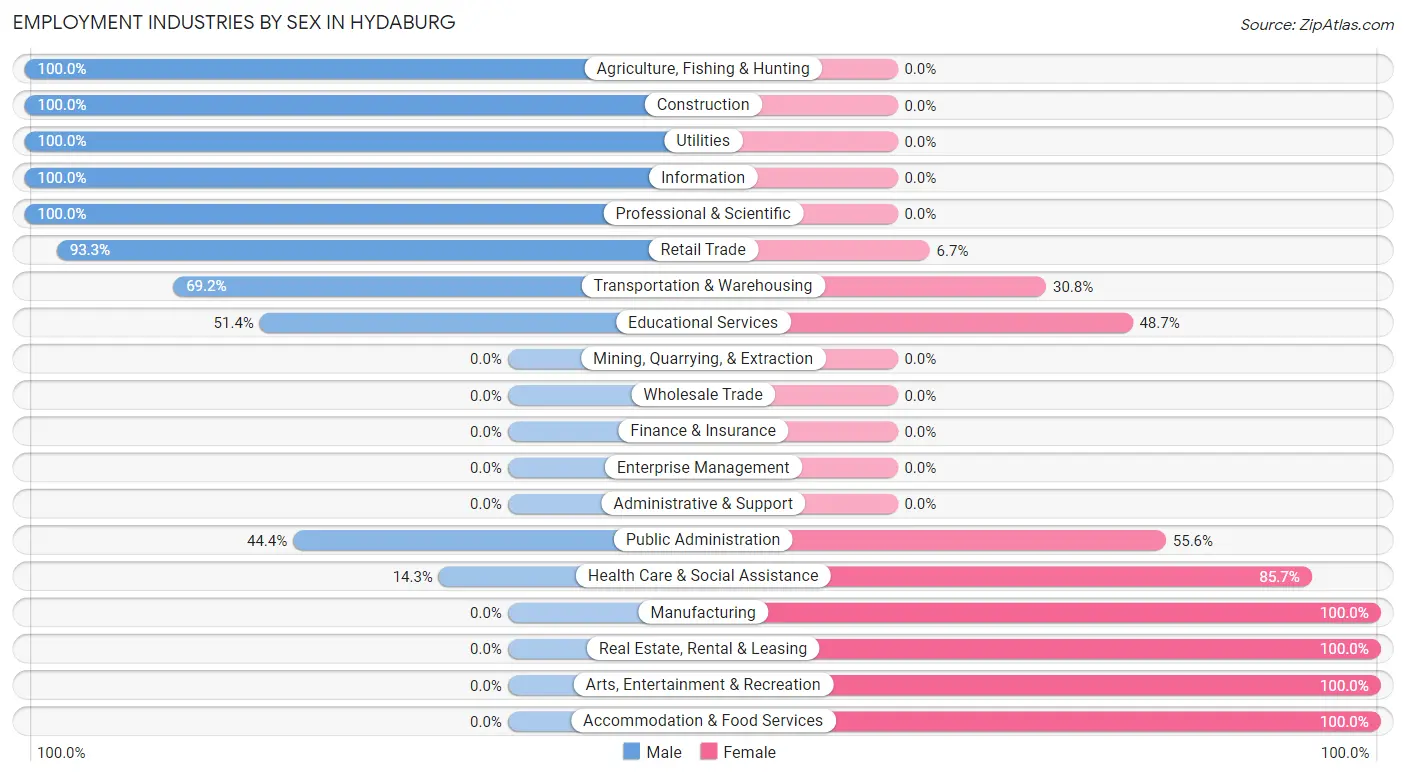
Employment Industries by Sex in Hydaburg
The Hydaburg industries that see more men than women are Agriculture, Fishing & Hunting (100.0%), Construction (100.0%), and Utilities (100.0%), whereas the industries that tend to have a higher number of women are Manufacturing (100.0%), Real Estate, Rental & Leasing (100.0%), and Arts, Entertainment & Recreation (100.0%).
| Industry | Male | Female |
| Agriculture, Fishing & Hunting | 5 (100.0%) | 0 (0.0%) |
| Mining, Quarrying, & Extraction | 0 (0.0%) | 0 (0.0%) |
| Construction | 4 (100.0%) | 0 (0.0%) |
| Manufacturing | 0 (0.0%) | 4 (100.0%) |
| Wholesale Trade | 0 (0.0%) | 0 (0.0%) |
| Retail Trade | 14 (93.3%) | 1 (6.7%) |
| Transportation & Warehousing | 9 (69.2%) | 4 (30.8%) |
| Utilities | 2 (100.0%) | 0 (0.0%) |
| Information | 2 (100.0%) | 0 (0.0%) |
| Finance & Insurance | 0 (0.0%) | 0 (0.0%) |
| Real Estate, Rental & Leasing | 0 (0.0%) | 3 (100.0%) |
| Professional & Scientific | 2 (100.0%) | 0 (0.0%) |
| Enterprise Management | 0 (0.0%) | 0 (0.0%) |
| Administrative & Support | 0 (0.0%) | 0 (0.0%) |
| Educational Services | 19 (51.3%) | 18 (48.6%) |
| Health Care & Social Assistance | 2 (14.3%) | 12 (85.7%) |
| Arts, Entertainment & Recreation | 0 (0.0%) | 1 (100.0%) |
| Accommodation & Food Services | 0 (0.0%) | 2 (100.0%) |
| Public Administration | 12 (44.4%) | 15 (55.6%) |
| Total | 75 (55.6%) | 60 (44.4%) |
Education in Hydaburg
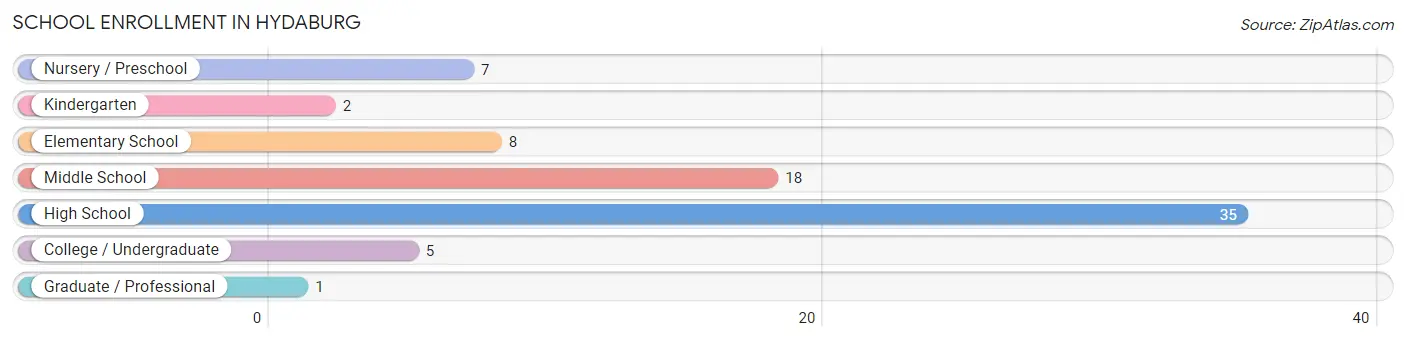
School Enrollment in Hydaburg
The most common levels of schooling among the 76 students in Hydaburg are high school (35 | 46.1%), middle school (18 | 23.7%), and elementary school (8 | 10.5%).
| School Level | # Students | % Students |
| Nursery / Preschool | 7 | 9.2% |
| Kindergarten | 2 | 2.6% |
| Elementary School | 8 | 10.5% |
| Middle School | 18 | 23.7% |
| High School | 35 | 46.1% |
| College / Undergraduate | 5 | 6.6% |
| Graduate / Professional | 1 | 1.3% |
| Total | 76 | 100.0% |
School Enrollment by Age by Funding Source in Hydaburg
Out of a total of 76 students who are enrolled in schools in Hydaburg, 1 (1.3%) attend a private institution, while the remaining 75 (98.7%) are enrolled in public schools. The age group of 25 to 34 year olds has the highest likelihood of being enrolled in private schools, with 1 (100.0% in the age bracket) enrolled. Conversely, the age group of 3 to 4 year olds has the lowest likelihood of being enrolled in a private school, with 5 (100.0% in the age bracket) attending a public institution.
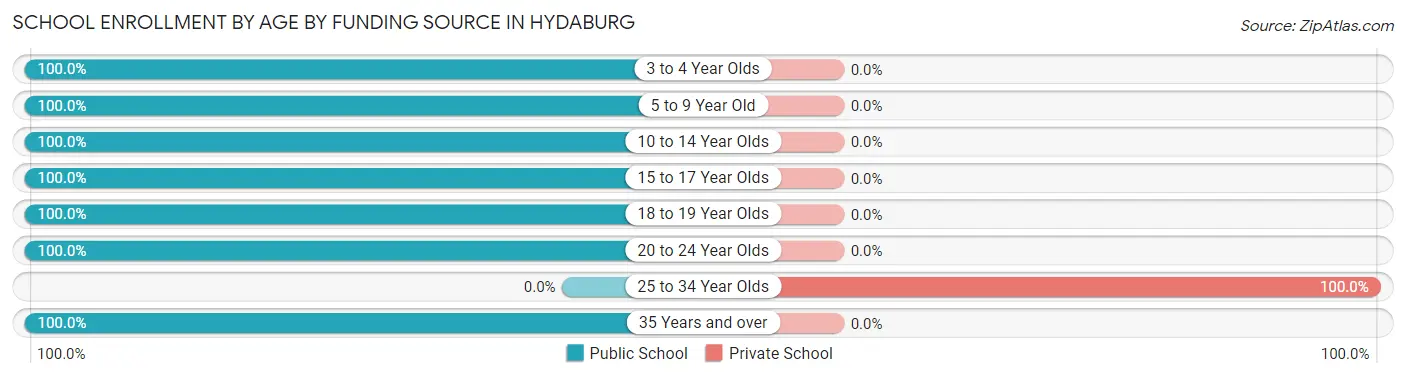
| Age Bracket | Public School | Private School |
| 3 to 4 Year Olds | 5 (100.0%) | 0 (0.0%) |
| 5 to 9 Year Old | 11 (100.0%) | 0 (0.0%) |
| 10 to 14 Year Olds | 19 (100.0%) | 0 (0.0%) |
| 15 to 17 Year Olds | 26 (100.0%) | 0 (0.0%) |
| 18 to 19 Year Olds | 7 (100.0%) | 0 (0.0%) |
| 20 to 24 Year Olds | 5 (100.0%) | 0 (0.0%) |
| 25 to 34 Year Olds | 0 (0.0%) | 1 (100.0%) |
| 35 Years and over | 2 (100.0%) | 0 (0.0%) |
| Total | 75 (98.7%) | 1 (1.3%) |
Educational Attainment by Field of Study in Hydaburg
Education (18 | 47.4%), bio, nature & agricultural (6 | 15.8%), social sciences (5 | 13.2%), visual & performing arts (4 | 10.5%), and science & technology (3 | 7.9%) are the most common fields of study among 38 individuals in Hydaburg who have obtained a bachelor's degree or higher.
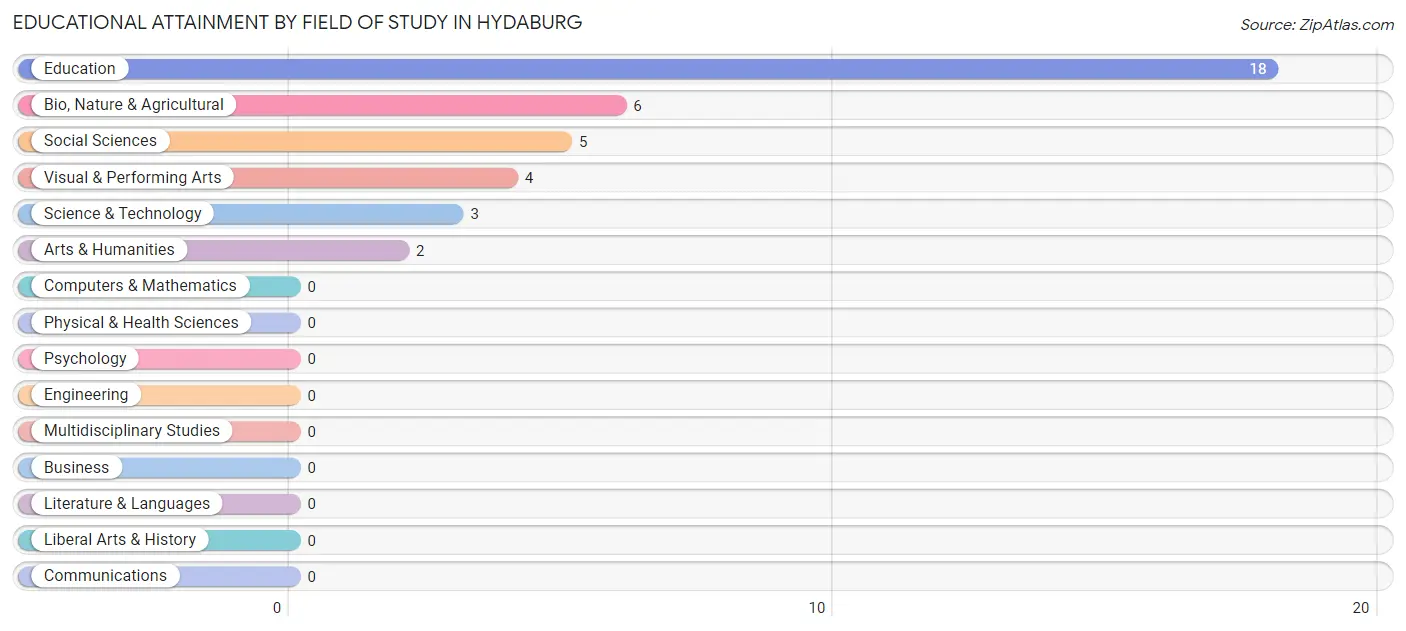
| Field of Study | # Graduates | % Graduates |
| Computers & Mathematics | 0 | 0.0% |
| Bio, Nature & Agricultural | 6 | 15.8% |
| Physical & Health Sciences | 0 | 0.0% |
| Psychology | 0 | 0.0% |
| Social Sciences | 5 | 13.2% |
| Engineering | 0 | 0.0% |
| Multidisciplinary Studies | 0 | 0.0% |
| Science & Technology | 3 | 7.9% |
| Business | 0 | 0.0% |
| Education | 18 | 47.4% |
| Literature & Languages | 0 | 0.0% |
| Liberal Arts & History | 0 | 0.0% |
| Visual & Performing Arts | 4 | 10.5% |
| Communications | 0 | 0.0% |
| Arts & Humanities | 2 | 5.3% |
| Total | 38 | 100.0% |
Transportation & Commute in Hydaburg
Vehicle Availability by Sex in Hydaburg
The most prevalent vehicle ownership categories in Hydaburg are males with 2 vehicles (35, accounting for 47.9%) and females with 2 vehicles (31, making up 58.3%).
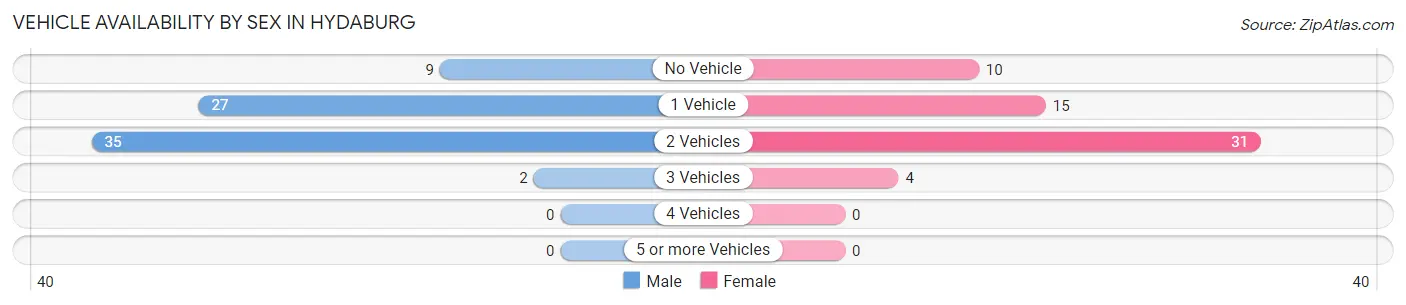
| Vehicles Available | Male | Female |
| No Vehicle | 9 (12.3%) | 10 (16.7%) |
| 1 Vehicle | 27 (37.0%) | 15 (25.0%) |
| 2 Vehicles | 35 (47.9%) | 31 (51.7%) |
| 3 Vehicles | 2 (2.7%) | 4 (6.7%) |
| 4 Vehicles | 0 (0.0%) | 0 (0.0%) |
| 5 or more Vehicles | 0 (0.0%) | 0 (0.0%) |
| Total | 73 (100.0%) | 60 (100.0%) |
Commute Time in Hydaburg
The most frequently occuring commute durations in Hydaburg are less than 5 minutes (65 commuters, 49.6%), 5 to 9 minutes (30 commuters, 22.9%), and 60 to 89 minutes (12 commuters, 9.2%).
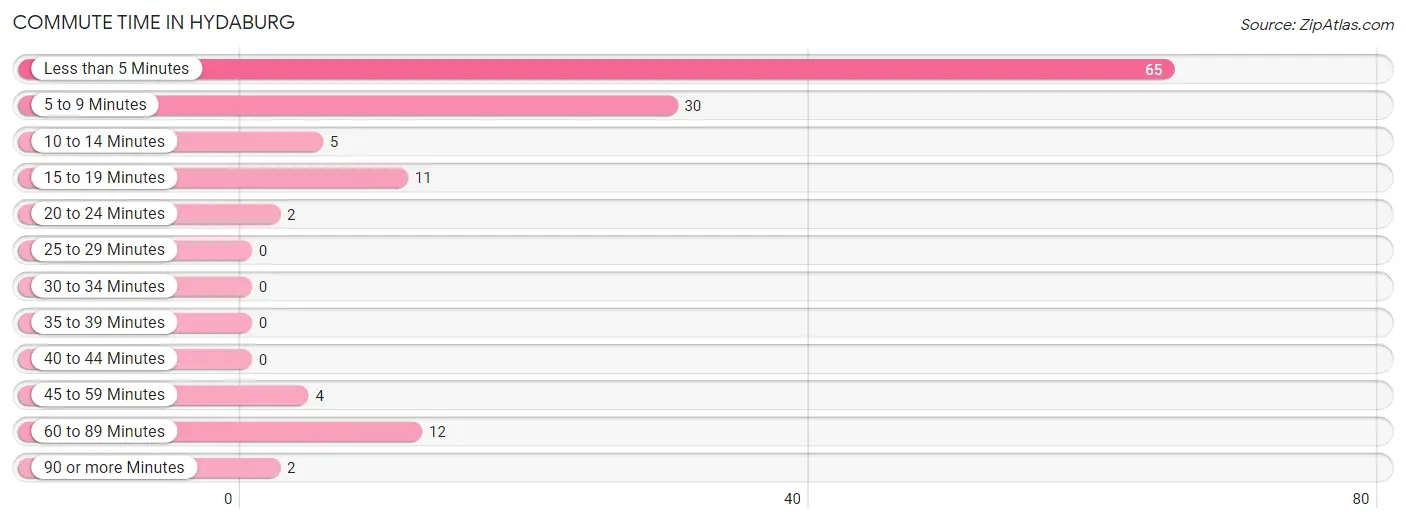
| Commute Time | # Commuters | % Commuters |
| Less than 5 Minutes | 65 | 49.6% |
| 5 to 9 Minutes | 30 | 22.9% |
| 10 to 14 Minutes | 5 | 3.8% |
| 15 to 19 Minutes | 11 | 8.4% |
| 20 to 24 Minutes | 2 | 1.5% |
| 25 to 29 Minutes | 0 | 0.0% |
| 30 to 34 Minutes | 0 | 0.0% |
| 35 to 39 Minutes | 0 | 0.0% |
| 40 to 44 Minutes | 0 | 0.0% |
| 45 to 59 Minutes | 4 | 3.0% |
| 60 to 89 Minutes | 12 | 9.2% |
| 90 or more Minutes | 2 | 1.5% |
Commute Time by Sex in Hydaburg
The most common commute times in Hydaburg are less than 5 minutes (33 commuters, 45.2%) for males and less than 5 minutes (32 commuters, 55.2%) for females.
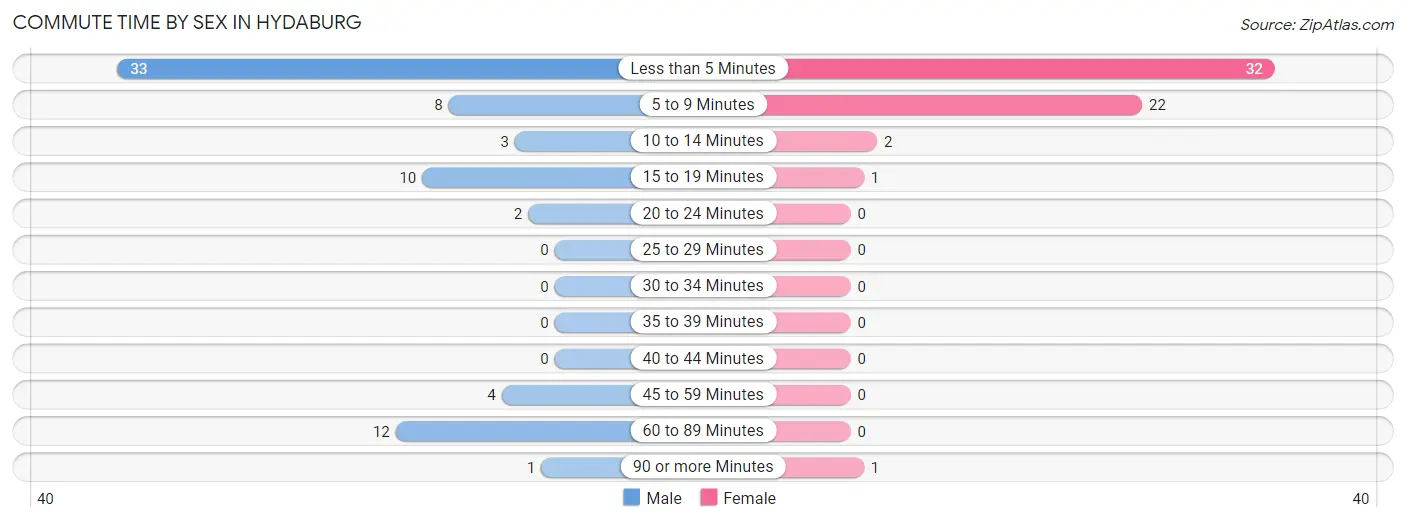
| Commute Time | Male | Female |
| Less than 5 Minutes | 33 (45.2%) | 32 (55.2%) |
| 5 to 9 Minutes | 8 (11.0%) | 22 (37.9%) |
| 10 to 14 Minutes | 3 (4.1%) | 2 (3.5%) |
| 15 to 19 Minutes | 10 (13.7%) | 1 (1.7%) |
| 20 to 24 Minutes | 2 (2.7%) | 0 (0.0%) |
| 25 to 29 Minutes | 0 (0.0%) | 0 (0.0%) |
| 30 to 34 Minutes | 0 (0.0%) | 0 (0.0%) |
| 35 to 39 Minutes | 0 (0.0%) | 0 (0.0%) |
| 40 to 44 Minutes | 0 (0.0%) | 0 (0.0%) |
| 45 to 59 Minutes | 4 (5.5%) | 0 (0.0%) |
| 60 to 89 Minutes | 12 (16.4%) | 0 (0.0%) |
| 90 or more Minutes | 1 (1.4%) | 1 (1.7%) |
Time of Departure to Work by Sex in Hydaburg
The most frequent times of departure to work in Hydaburg are 8:00 AM to 8:29 AM (22, 30.1%) for males and 7:30 AM to 7:59 AM (28, 48.3%) for females.
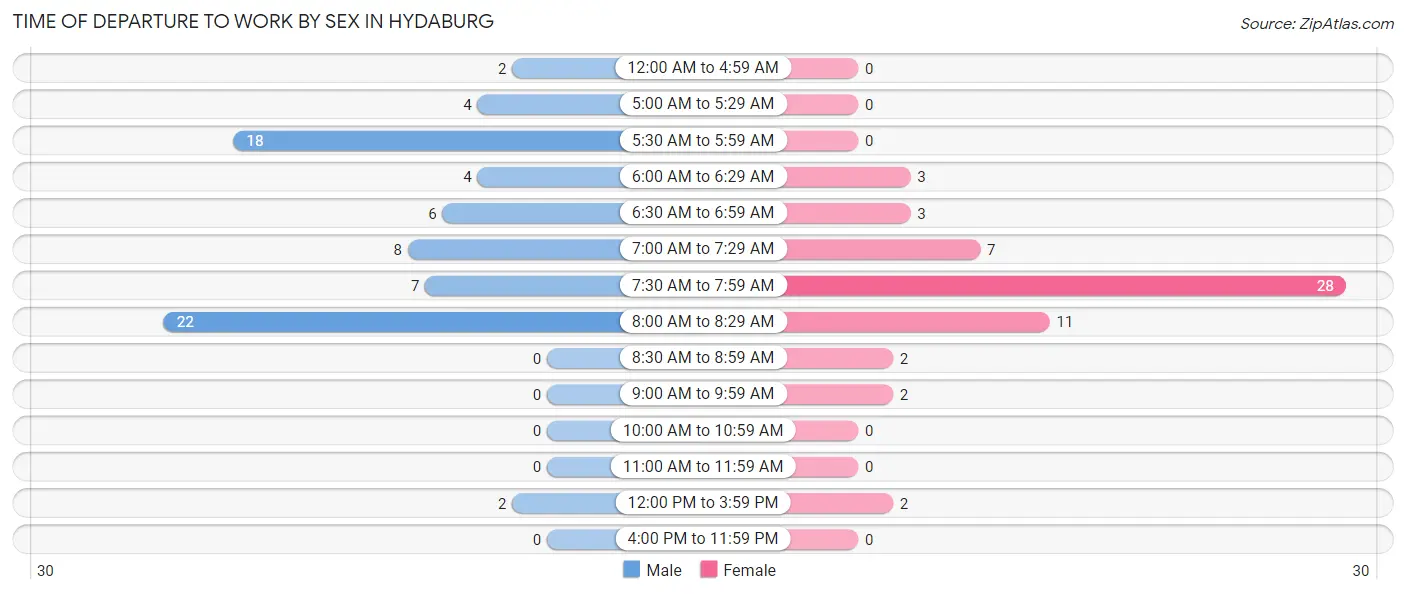
| Time of Departure | Male | Female |
| 12:00 AM to 4:59 AM | 2 (2.7%) | 0 (0.0%) |
| 5:00 AM to 5:29 AM | 4 (5.5%) | 0 (0.0%) |
| 5:30 AM to 5:59 AM | 18 (24.7%) | 0 (0.0%) |
| 6:00 AM to 6:29 AM | 4 (5.5%) | 3 (5.2%) |
| 6:30 AM to 6:59 AM | 6 (8.2%) | 3 (5.2%) |
| 7:00 AM to 7:29 AM | 8 (11.0%) | 7 (12.1%) |
| 7:30 AM to 7:59 AM | 7 (9.6%) | 28 (48.3%) |
| 8:00 AM to 8:29 AM | 22 (30.1%) | 11 (19.0%) |
| 8:30 AM to 8:59 AM | 0 (0.0%) | 2 (3.5%) |
| 9:00 AM to 9:59 AM | 0 (0.0%) | 2 (3.5%) |
| 10:00 AM to 10:59 AM | 0 (0.0%) | 0 (0.0%) |
| 11:00 AM to 11:59 AM | 0 (0.0%) | 0 (0.0%) |
| 12:00 PM to 3:59 PM | 2 (2.7%) | 2 (3.5%) |
| 4:00 PM to 11:59 PM | 0 (0.0%) | 0 (0.0%) |
| Total | 73 (100.0%) | 58 (100.0%) |
Housing Occupancy in Hydaburg
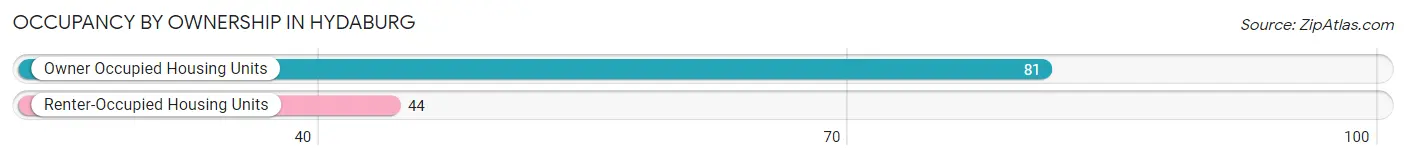
Occupancy by Ownership in Hydaburg
Of the total 125 dwellings in Hydaburg, owner-occupied units account for 81 (64.8%), while renter-occupied units make up 44 (35.2%).
| Occupancy | # Housing Units | % Housing Units |
| Owner Occupied Housing Units | 81 | 64.8% |
| Renter-Occupied Housing Units | 44 | 35.2% |
| Total Occupied Housing Units | 125 | 100.0% |
Occupancy by Household Size in Hydaburg
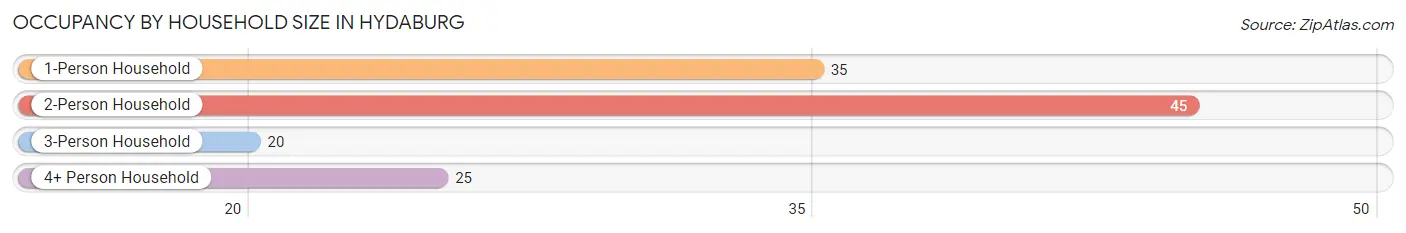
| Household Size | # Housing Units | % Housing Units |
| 1-Person Household | 35 | 28.0% |
| 2-Person Household | 45 | 36.0% |
| 3-Person Household | 20 | 16.0% |
| 4+ Person Household | 25 | 20.0% |
| Total Housing Units | 125 | 100.0% |
Occupancy by Ownership by Household Size in Hydaburg
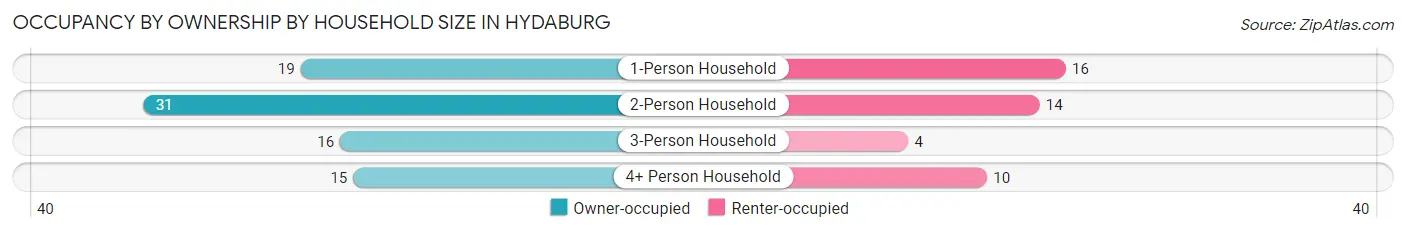
| Household Size | Owner-occupied | Renter-occupied |
| 1-Person Household | 19 (54.3%) | 16 (45.7%) |
| 2-Person Household | 31 (68.9%) | 14 (31.1%) |
| 3-Person Household | 16 (80.0%) | 4 (20.0%) |
| 4+ Person Household | 15 (60.0%) | 10 (40.0%) |
| Total Housing Units | 81 (64.8%) | 44 (35.2%) |
Occupancy by Educational Attainment in Hydaburg
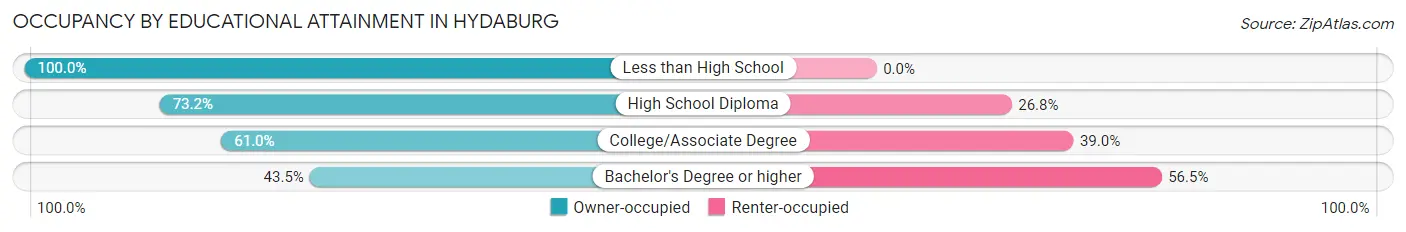
| Household Size | Owner-occupied | Renter-occupied |
| Less than High School | 5 (100.0%) | 0 (0.0%) |
| High School Diploma | 41 (73.2%) | 15 (26.8%) |
| College/Associate Degree | 25 (61.0%) | 16 (39.0%) |
| Bachelor's Degree or higher | 10 (43.5%) | 13 (56.5%) |
Occupancy by Age of Householder in Hydaburg
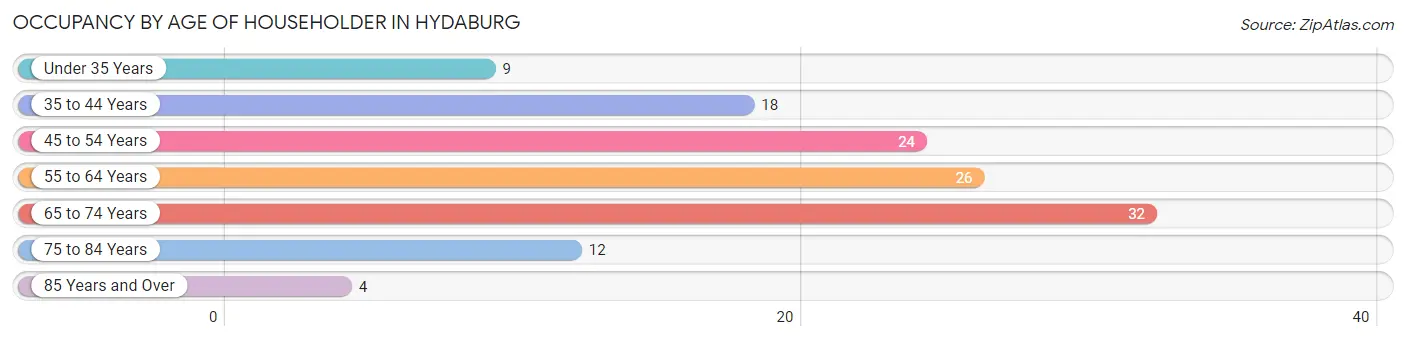
| Age Bracket | # Households | % Households |
| Under 35 Years | 9 | 7.2% |
| 35 to 44 Years | 18 | 14.4% |
| 45 to 54 Years | 24 | 19.2% |
| 55 to 64 Years | 26 | 20.8% |
| 65 to 74 Years | 32 | 25.6% |
| 75 to 84 Years | 12 | 9.6% |
| 85 Years and Over | 4 | 3.2% |
| Total | 125 | 100.0% |
Housing Finances in Hydaburg
Median Income by Occupancy in Hydaburg
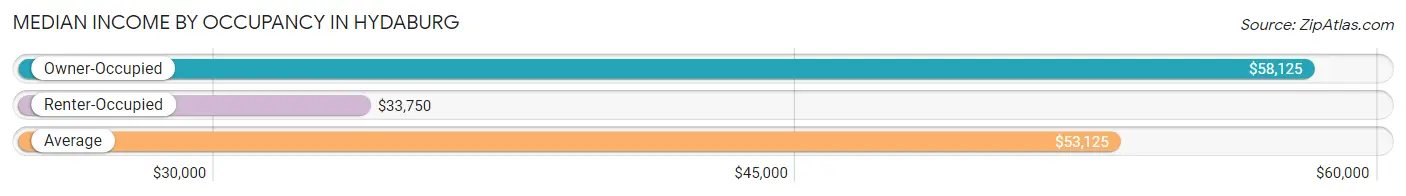
| Occupancy Type | # Households | Median Income |
| Owner-Occupied | 81 (64.8%) | $58,125 |
| Renter-Occupied | 44 (35.2%) | $33,750 |
| Average | 125 (100.0%) | $53,125 |
Occupancy by Householder Income Bracket in Hydaburg
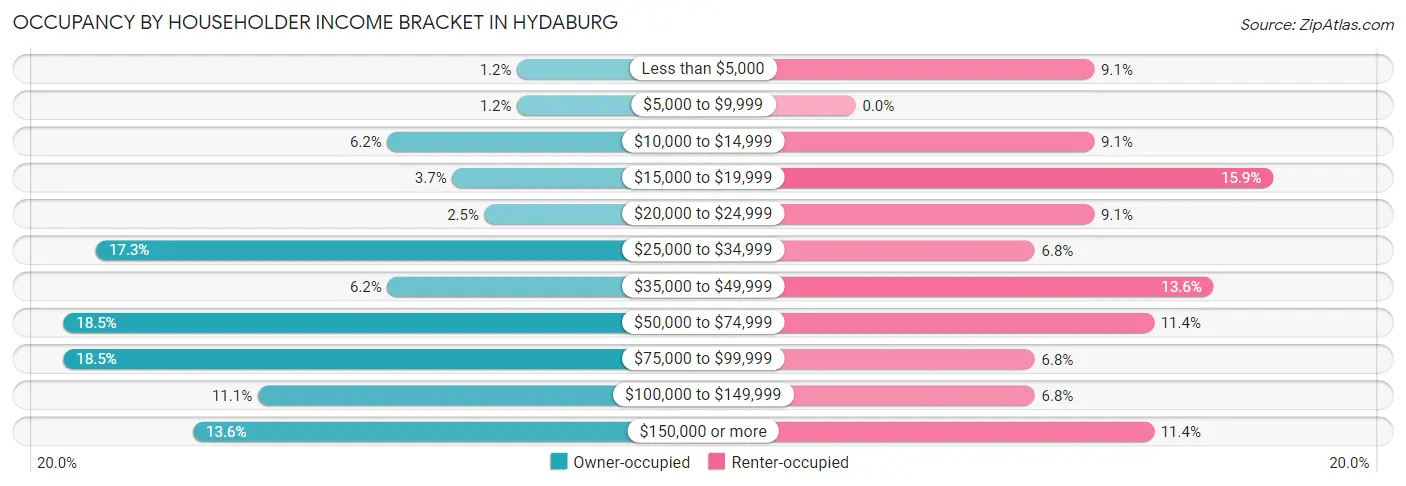
| Income Bracket | Owner-occupied | Renter-occupied |
| Less than $5,000 | 1 (1.2%) | 4 (9.1%) |
| $5,000 to $9,999 | 1 (1.2%) | 0 (0.0%) |
| $10,000 to $14,999 | 5 (6.2%) | 4 (9.1%) |
| $15,000 to $19,999 | 3 (3.7%) | 7 (15.9%) |
| $20,000 to $24,999 | 2 (2.5%) | 4 (9.1%) |
| $25,000 to $34,999 | 14 (17.3%) | 3 (6.8%) |
| $35,000 to $49,999 | 5 (6.2%) | 6 (13.6%) |
| $50,000 to $74,999 | 15 (18.5%) | 5 (11.4%) |
| $75,000 to $99,999 | 15 (18.5%) | 3 (6.8%) |
| $100,000 to $149,999 | 9 (11.1%) | 3 (6.8%) |
| $150,000 or more | 11 (13.6%) | 5 (11.4%) |
| Total | 81 (100.0%) | 44 (100.0%) |
Monthly Housing Cost Tiers in Hydaburg
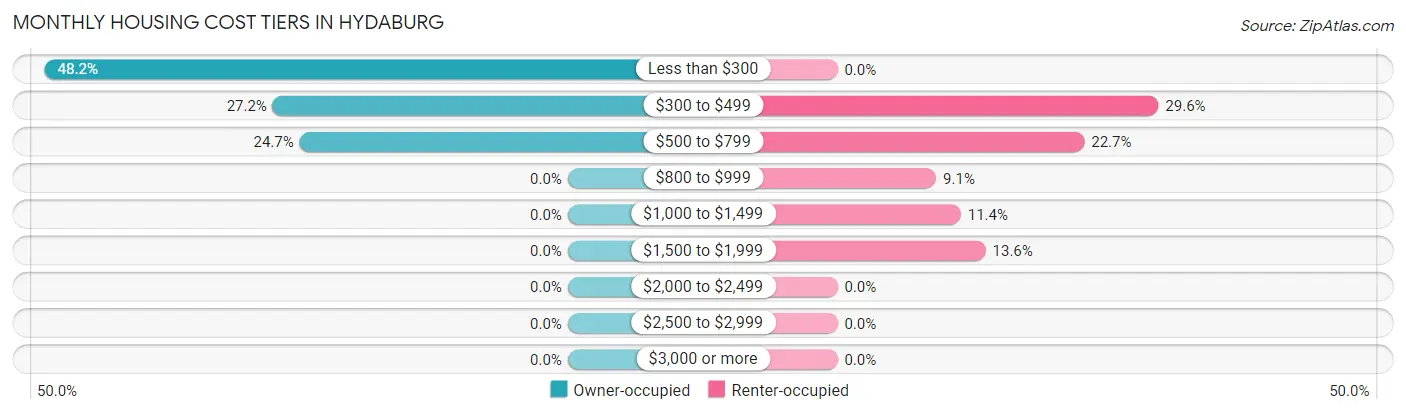
| Monthly Cost | Owner-occupied | Renter-occupied |
| Less than $300 | 39 (48.1%) | 0 (0.0%) |
| $300 to $499 | 22 (27.2%) | 13 (29.5%) |
| $500 to $799 | 20 (24.7%) | 10 (22.7%) |
| $800 to $999 | 0 (0.0%) | 4 (9.1%) |
| $1,000 to $1,499 | 0 (0.0%) | 5 (11.4%) |
| $1,500 to $1,999 | 0 (0.0%) | 6 (13.6%) |
| $2,000 to $2,499 | 0 (0.0%) | 0 (0.0%) |
| $2,500 to $2,999 | 0 (0.0%) | 0 (0.0%) |
| $3,000 or more | 0 (0.0%) | 0 (0.0%) |
| Total | 81 (100.0%) | 44 (100.0%) |
Physical Housing Characteristics in Hydaburg
Housing Structures in Hydaburg
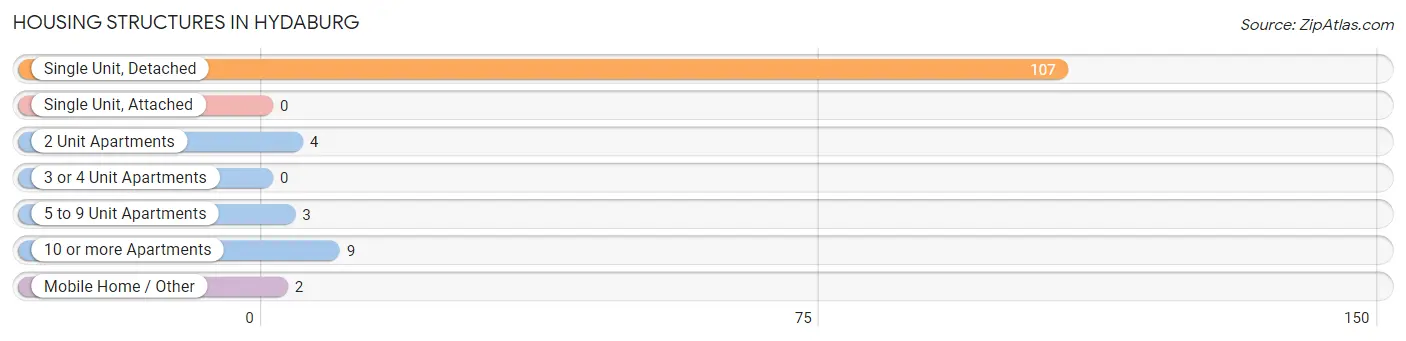
| Structure Type | # Housing Units | % Housing Units |
| Single Unit, Detached | 107 | 85.6% |
| Single Unit, Attached | 0 | 0.0% |
| 2 Unit Apartments | 4 | 3.2% |
| 3 or 4 Unit Apartments | 0 | 0.0% |
| 5 to 9 Unit Apartments | 3 | 2.4% |
| 10 or more Apartments | 9 | 7.2% |
| Mobile Home / Other | 2 | 1.6% |
| Total | 125 | 100.0% |
Housing Structures by Occupancy in Hydaburg
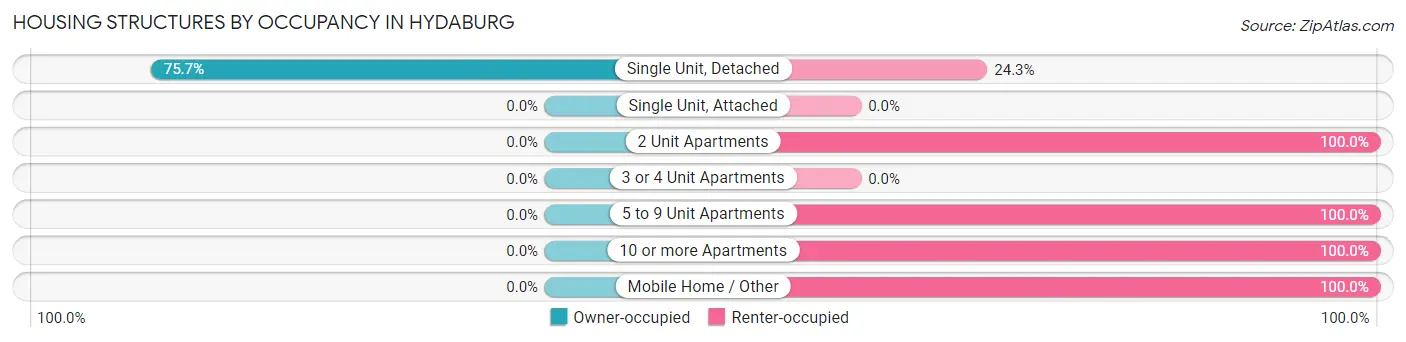
| Structure Type | Owner-occupied | Renter-occupied |
| Single Unit, Detached | 81 (75.7%) | 26 (24.3%) |
| Single Unit, Attached | 0 (0.0%) | 0 (0.0%) |
| 2 Unit Apartments | 0 (0.0%) | 4 (100.0%) |
| 3 or 4 Unit Apartments | 0 (0.0%) | 0 (0.0%) |
| 5 to 9 Unit Apartments | 0 (0.0%) | 3 (100.0%) |
| 10 or more Apartments | 0 (0.0%) | 9 (100.0%) |
| Mobile Home / Other | 0 (0.0%) | 2 (100.0%) |
| Total | 81 (64.8%) | 44 (35.2%) |
Housing Structures by Number of Rooms in Hydaburg
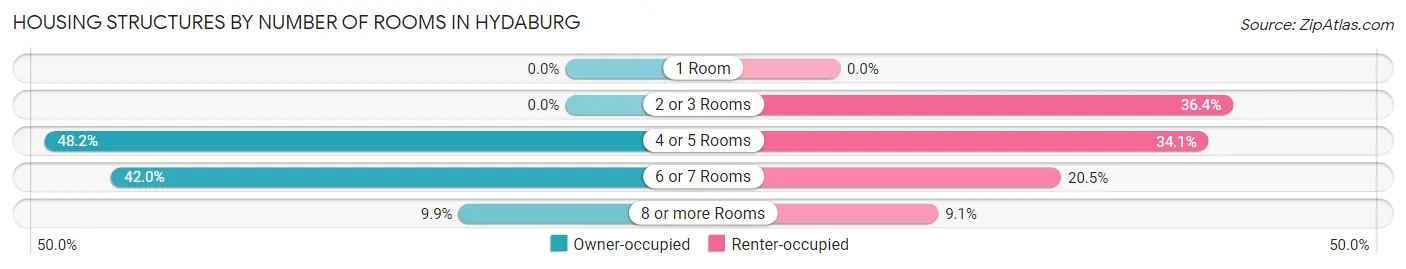
| Number of Rooms | Owner-occupied | Renter-occupied |
| 1 Room | 0 (0.0%) | 0 (0.0%) |
| 2 or 3 Rooms | 0 (0.0%) | 16 (36.4%) |
| 4 or 5 Rooms | 39 (48.1%) | 15 (34.1%) |
| 6 or 7 Rooms | 34 (42.0%) | 9 (20.4%) |
| 8 or more Rooms | 8 (9.9%) | 4 (9.1%) |
| Total | 81 (100.0%) | 44 (100.0%) |
Housing Structure by Heating Type in Hydaburg
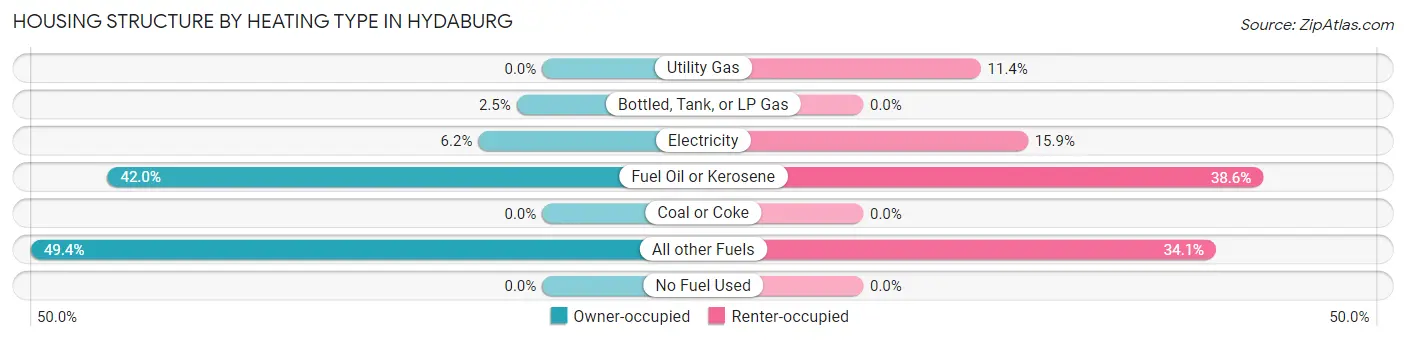
| Heating Type | Owner-occupied | Renter-occupied |
| Utility Gas | 0 (0.0%) | 5 (11.4%) |
| Bottled, Tank, or LP Gas | 2 (2.5%) | 0 (0.0%) |
| Electricity | 5 (6.2%) | 7 (15.9%) |
| Fuel Oil or Kerosene | 34 (42.0%) | 17 (38.6%) |
| Coal or Coke | 0 (0.0%) | 0 (0.0%) |
| All other Fuels | 40 (49.4%) | 15 (34.1%) |
| No Fuel Used | 0 (0.0%) | 0 (0.0%) |
| Total | 81 (100.0%) | 44 (100.0%) |
Household Vehicle Usage in Hydaburg
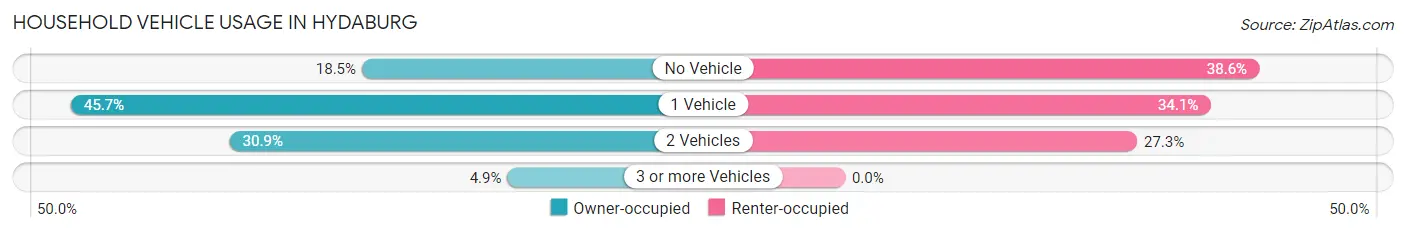
| Vehicles per Household | Owner-occupied | Renter-occupied |
| No Vehicle | 15 (18.5%) | 17 (38.6%) |
| 1 Vehicle | 37 (45.7%) | 15 (34.1%) |
| 2 Vehicles | 25 (30.9%) | 12 (27.3%) |
| 3 or more Vehicles | 4 (4.9%) | 0 (0.0%) |
| Total | 81 (100.0%) | 44 (100.0%) |
Real Estate & Mortgages in Hydaburg
Real Estate and Mortgage Overview in Hydaburg
| Characteristic | Without Mortgage | With Mortgage |
| Housing Units | 81 | 0 |
| Median Property Value | $128,800 | $0 |
| Median Household Income | $58,125 | $0 |
| Monthly Housing Costs | $311 | $0 |
| Real Estate Taxes | - | - |
Property Value by Mortgage Status in Hydaburg
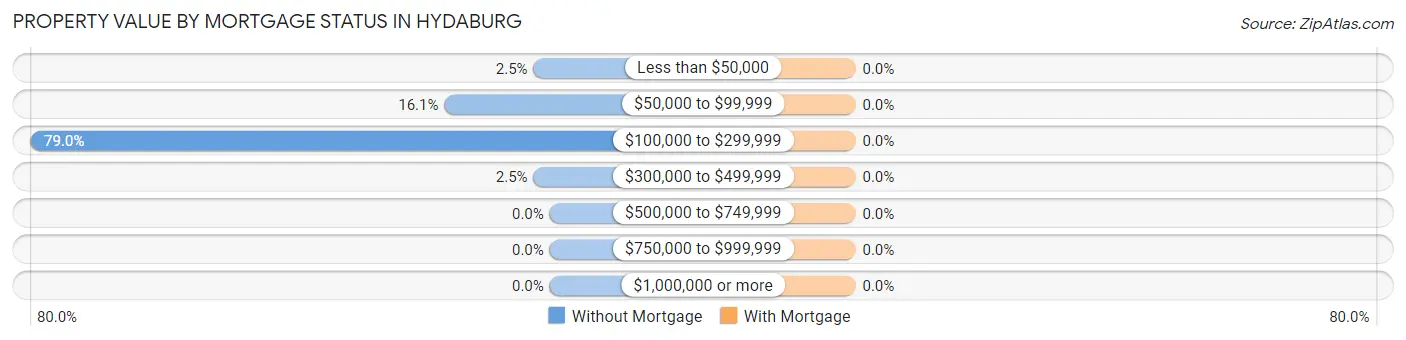
| Property Value | Without Mortgage | With Mortgage |
| Less than $50,000 | 2 (2.5%) | 0 (0.0%) |
| $50,000 to $99,999 | 13 (16.1%) | 0 (0.0%) |
| $100,000 to $299,999 | 64 (79.0%) | 0 (0.0%) |
| $300,000 to $499,999 | 2 (2.5%) | 0 (0.0%) |
| $500,000 to $749,999 | 0 (0.0%) | 0 (0.0%) |
| $750,000 to $999,999 | 0 (0.0%) | 0 (0.0%) |
| $1,000,000 or more | 0 (0.0%) | 0 (0.0%) |
| Total | 81 (100.0%) | 0 (0.0%) |
Household Income by Mortgage Status in Hydaburg
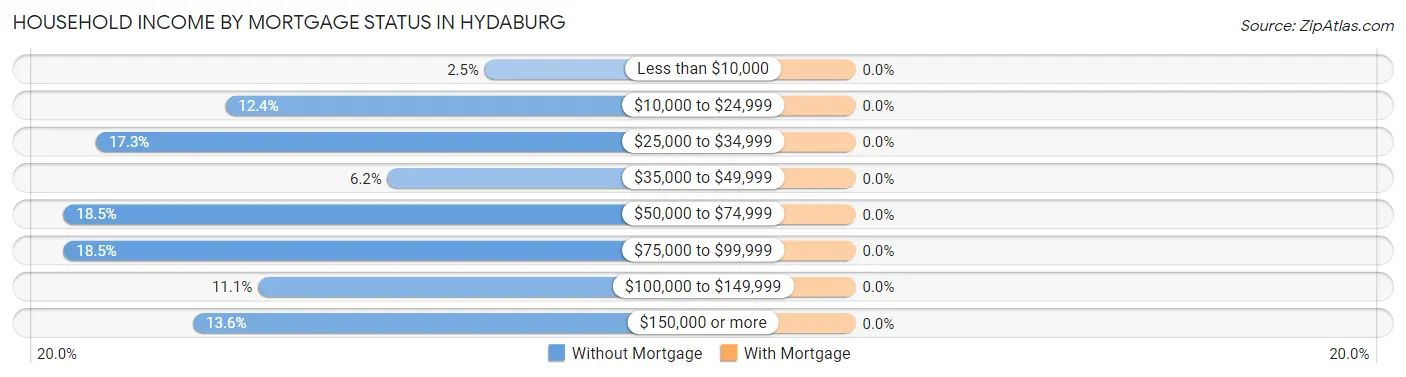
| Household Income | Without Mortgage | With Mortgage |
| Less than $10,000 | 2 (2.5%) | 0 (0.0%) |
| $10,000 to $24,999 | 10 (12.3%) | 0 (0.0%) |
| $25,000 to $34,999 | 14 (17.3%) | 0 (0.0%) |
| $35,000 to $49,999 | 5 (6.2%) | 0 (0.0%) |
| $50,000 to $74,999 | 15 (18.5%) | 0 (0.0%) |
| $75,000 to $99,999 | 15 (18.5%) | 0 (0.0%) |
| $100,000 to $149,999 | 9 (11.1%) | 0 (0.0%) |
| $150,000 or more | 11 (13.6%) | 0 (0.0%) |
| Total | 81 (100.0%) | 0 (0.0%) |
Property Value to Household Income Ratio in Hydaburg
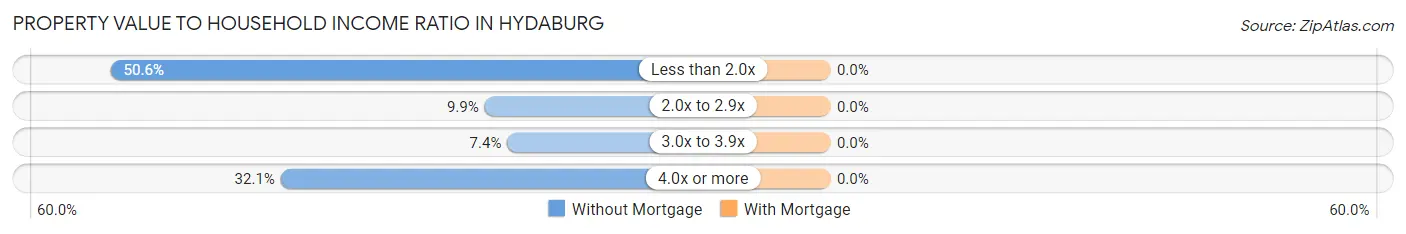
| Value-to-Income Ratio | Without Mortgage | With Mortgage |
| Less than 2.0x | 41 (50.6%) | 0 (0.0%) |
| 2.0x to 2.9x | 8 (9.9%) | 0 (0.0%) |
| 3.0x to 3.9x | 6 (7.4%) | 0 (0.0%) |
| 4.0x or more | 26 (32.1%) | 0 (0.0%) |
| Total | 81 (100.0%) | 0 (0.0%) |
Real Estate Taxes by Mortgage Status in Hydaburg
| Property Taxes | Without Mortgage | With Mortgage |
| Less than $800 | 0 (0.0%) | 0 (0.0%) |
| $800 to $1,499 | 0 (0.0%) | 0 (0.0%) |
| $800 to $1,499 | 0 (0.0%) | 0 (0.0%) |
| Total | 81 (100.0%) | 0 (0.0%) |
Health & Disability in Hydaburg
Health Insurance Coverage by Age in Hydaburg
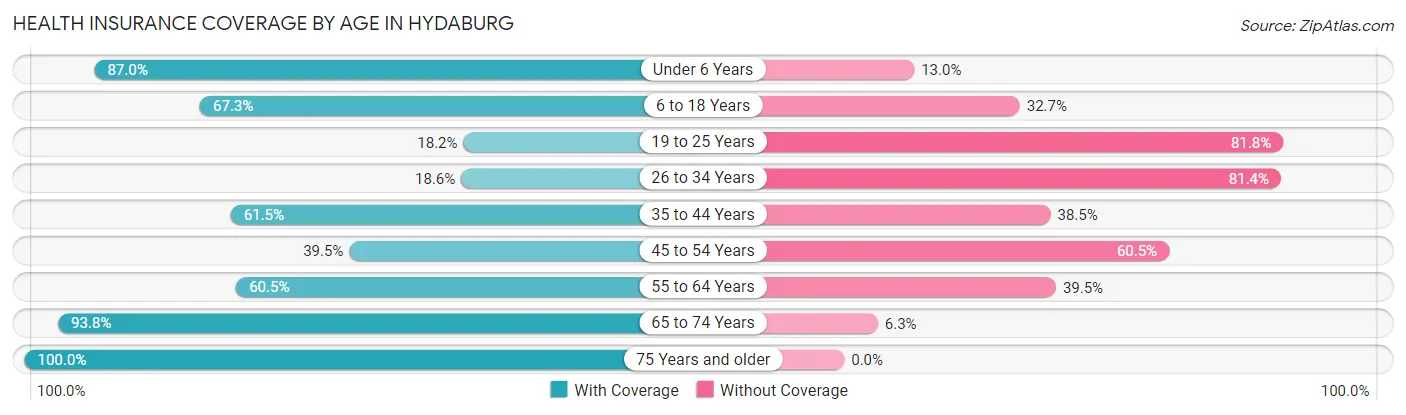
| Age Bracket | With Coverage | Without Coverage |
| Under 6 Years | 20 (87.0%) | 3 (13.0%) |
| 6 to 18 Years | 37 (67.3%) | 18 (32.7%) |
| 19 to 25 Years | 4 (18.2%) | 18 (81.8%) |
| 26 to 34 Years | 8 (18.6%) | 35 (81.4%) |
| 35 to 44 Years | 24 (61.5%) | 15 (38.5%) |
| 45 to 54 Years | 15 (39.5%) | 23 (60.5%) |
| 55 to 64 Years | 23 (60.5%) | 15 (39.5%) |
| 65 to 74 Years | 45 (93.8%) | 3 (6.2%) |
| 75 Years and older | 22 (100.0%) | 0 (0.0%) |
| Total | 198 (60.4%) | 130 (39.6%) |
Health Insurance Coverage by Citizenship Status in Hydaburg
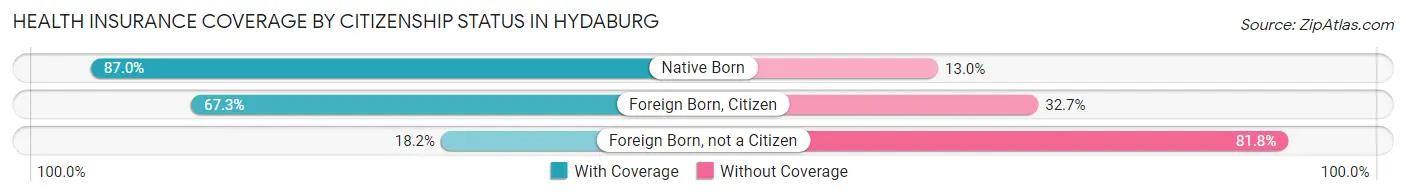
| Citizenship Status | With Coverage | Without Coverage |
| Native Born | 20 (87.0%) | 3 (13.0%) |
| Foreign Born, Citizen | 37 (67.3%) | 18 (32.7%) |
| Foreign Born, not a Citizen | 4 (18.2%) | 18 (81.8%) |
Health Insurance Coverage by Household Income in Hydaburg
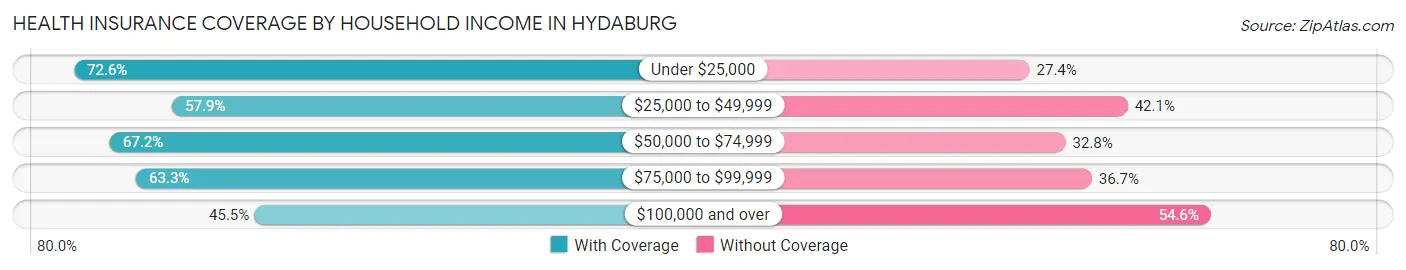
| Household Income | With Coverage | Without Coverage |
| Under $25,000 | 53 (72.6%) | 20 (27.4%) |
| $25,000 to $49,999 | 33 (57.9%) | 24 (42.1%) |
| $50,000 to $74,999 | 41 (67.2%) | 20 (32.8%) |
| $75,000 to $99,999 | 31 (63.3%) | 18 (36.7%) |
| $100,000 and over | 40 (45.5%) | 48 (54.5%) |
Public vs Private Health Insurance Coverage by Age in Hydaburg
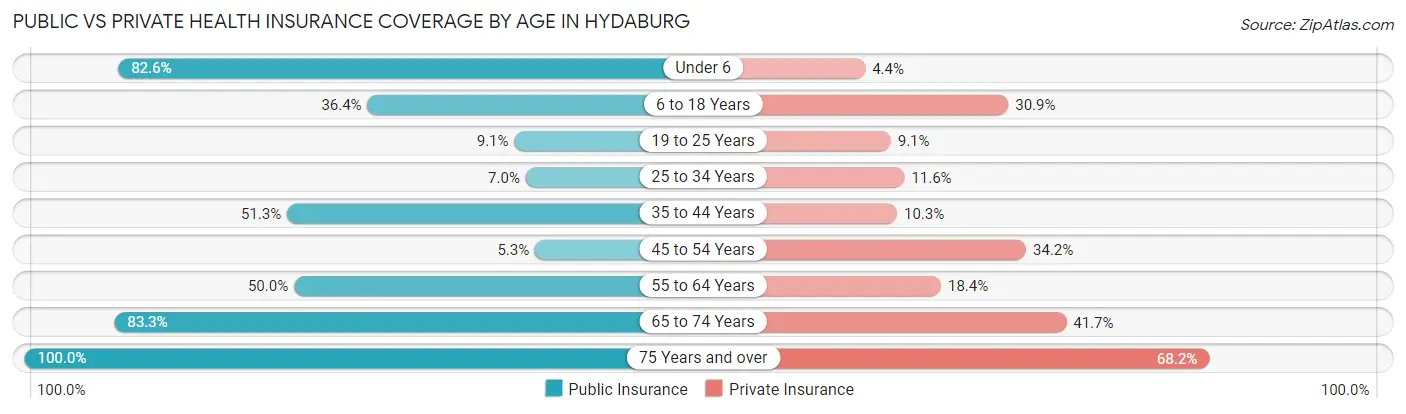
| Age Bracket | Public Insurance | Private Insurance |
| Under 6 | 19 (82.6%) | 1 (4.3%) |
| 6 to 18 Years | 20 (36.4%) | 17 (30.9%) |
| 19 to 25 Years | 2 (9.1%) | 2 (9.1%) |
| 25 to 34 Years | 3 (7.0%) | 5 (11.6%) |
| 35 to 44 Years | 20 (51.3%) | 4 (10.3%) |
| 45 to 54 Years | 2 (5.3%) | 13 (34.2%) |
| 55 to 64 Years | 19 (50.0%) | 7 (18.4%) |
| 65 to 74 Years | 40 (83.3%) | 20 (41.7%) |
| 75 Years and over | 22 (100.0%) | 15 (68.2%) |
| Total | 147 (44.8%) | 84 (25.6%) |
Disability Status by Sex by Age in Hydaburg
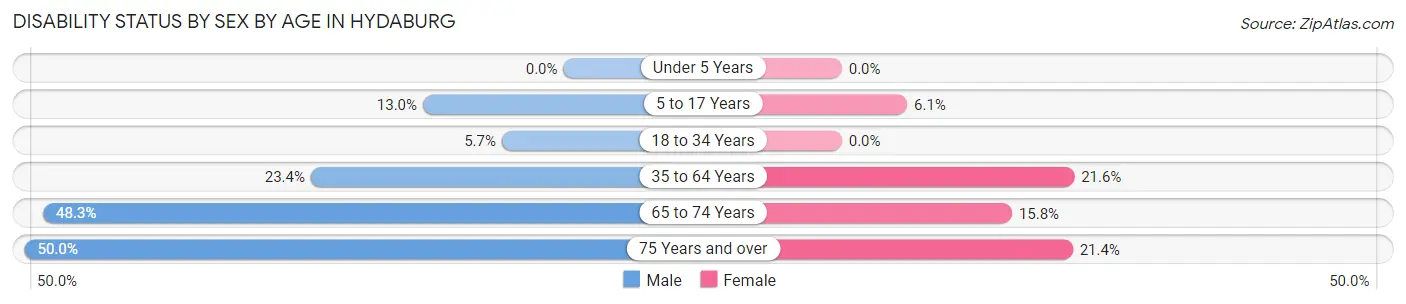
| Age Bracket | Male | Female |
| Under 5 Years | 0 (0.0%) | 0 (0.0%) |
| 5 to 17 Years | 3 (13.0%) | 2 (6.1%) |
| 18 to 34 Years | 2 (5.7%) | 0 (0.0%) |
| 35 to 64 Years | 15 (23.4%) | 11 (21.6%) |
| 65 to 74 Years | 14 (48.3%) | 3 (15.8%) |
| 75 Years and over | 4 (50.0%) | 3 (21.4%) |
Disability Class by Sex by Age in Hydaburg
Disability Class: Hearing Difficulty
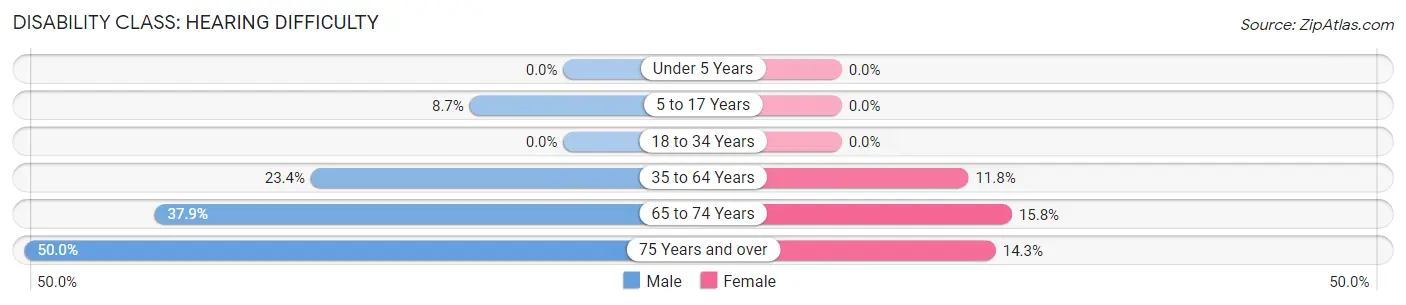
| Age Bracket | Male | Female |
| Under 5 Years | 0 (0.0%) | 0 (0.0%) |
| 5 to 17 Years | 2 (8.7%) | 0 (0.0%) |
| 18 to 34 Years | 0 (0.0%) | 0 (0.0%) |
| 35 to 64 Years | 15 (23.4%) | 6 (11.8%) |
| 65 to 74 Years | 11 (37.9%) | 3 (15.8%) |
| 75 Years and over | 4 (50.0%) | 2 (14.3%) |
Disability Class: Vision Difficulty
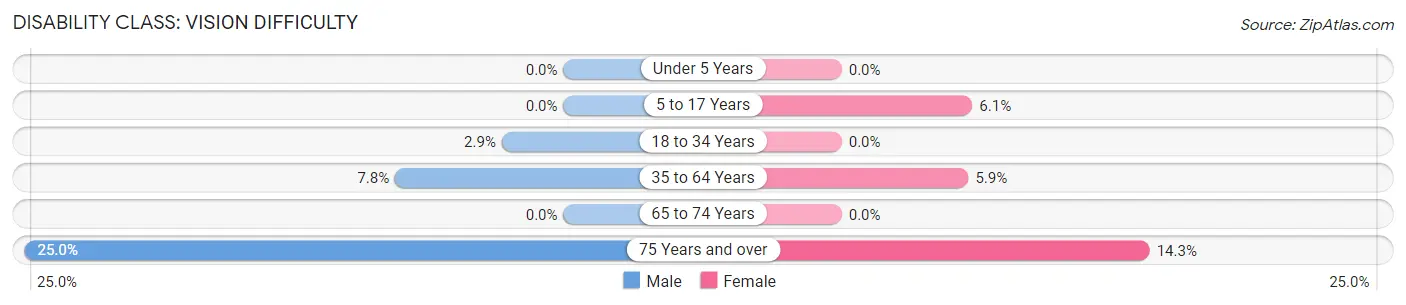
| Age Bracket | Male | Female |
| Under 5 Years | 0 (0.0%) | 0 (0.0%) |
| 5 to 17 Years | 0 (0.0%) | 2 (6.1%) |
| 18 to 34 Years | 1 (2.9%) | 0 (0.0%) |
| 35 to 64 Years | 5 (7.8%) | 3 (5.9%) |
| 65 to 74 Years | 0 (0.0%) | 0 (0.0%) |
| 75 Years and over | 2 (25.0%) | 2 (14.3%) |
Disability Class: Cognitive Difficulty
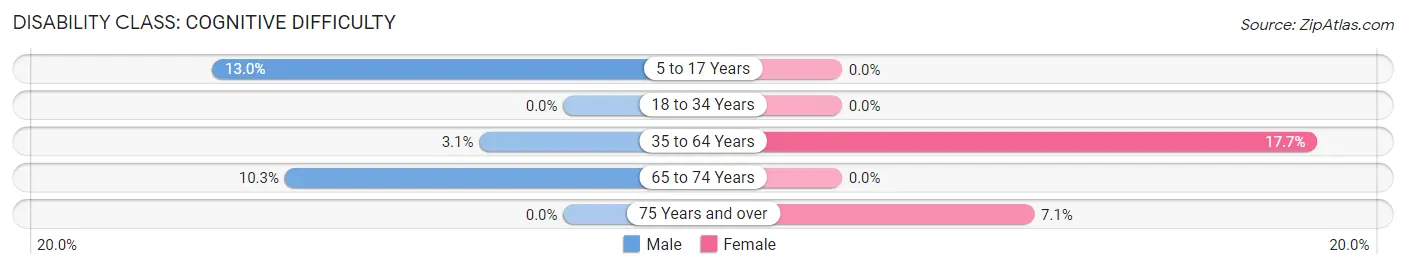
| Age Bracket | Male | Female |
| 5 to 17 Years | 3 (13.0%) | 0 (0.0%) |
| 18 to 34 Years | 0 (0.0%) | 0 (0.0%) |
| 35 to 64 Years | 2 (3.1%) | 9 (17.6%) |
| 65 to 74 Years | 3 (10.3%) | 0 (0.0%) |
| 75 Years and over | 0 (0.0%) | 1 (7.1%) |
Disability Class: Ambulatory Difficulty
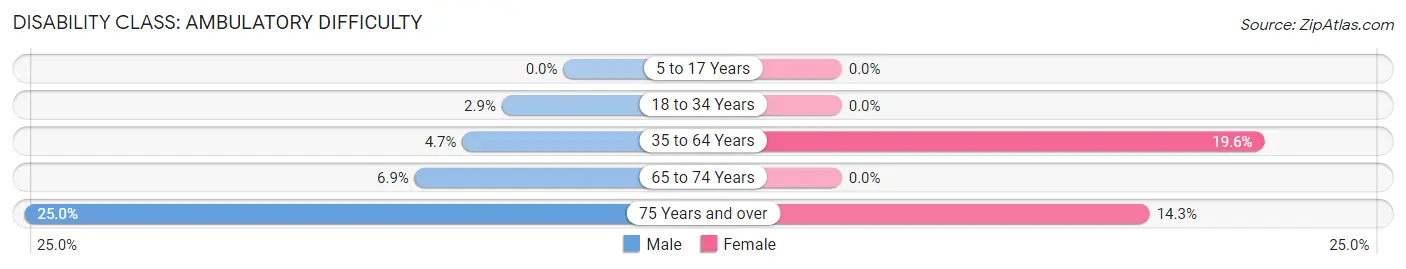
| Age Bracket | Male | Female |
| 5 to 17 Years | 0 (0.0%) | 0 (0.0%) |
| 18 to 34 Years | 1 (2.9%) | 0 (0.0%) |
| 35 to 64 Years | 3 (4.7%) | 10 (19.6%) |
| 65 to 74 Years | 2 (6.9%) | 0 (0.0%) |
| 75 Years and over | 2 (25.0%) | 2 (14.3%) |
Disability Class: Self-Care Difficulty
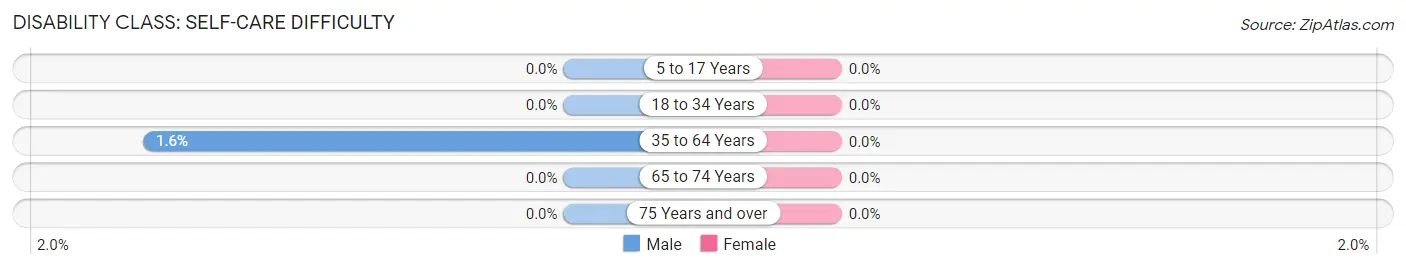
| Age Bracket | Male | Female |
| 5 to 17 Years | 0 (0.0%) | 0 (0.0%) |
| 18 to 34 Years | 0 (0.0%) | 0 (0.0%) |
| 35 to 64 Years | 1 (1.6%) | 0 (0.0%) |
| 65 to 74 Years | 0 (0.0%) | 0 (0.0%) |
| 75 Years and over | 0 (0.0%) | 0 (0.0%) |
Technology Access in Hydaburg
Computing Device Access in Hydaburg
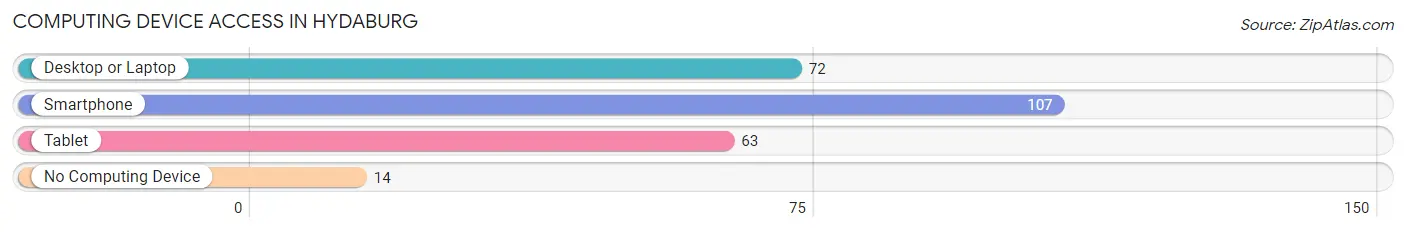
| Device Type | # Households | % Households |
| Desktop or Laptop | 72 | 57.6% |
| Smartphone | 107 | 85.6% |
| Tablet | 63 | 50.4% |
| No Computing Device | 14 | 11.2% |
| Total | 125 | 100.0% |
Internet Access in Hydaburg
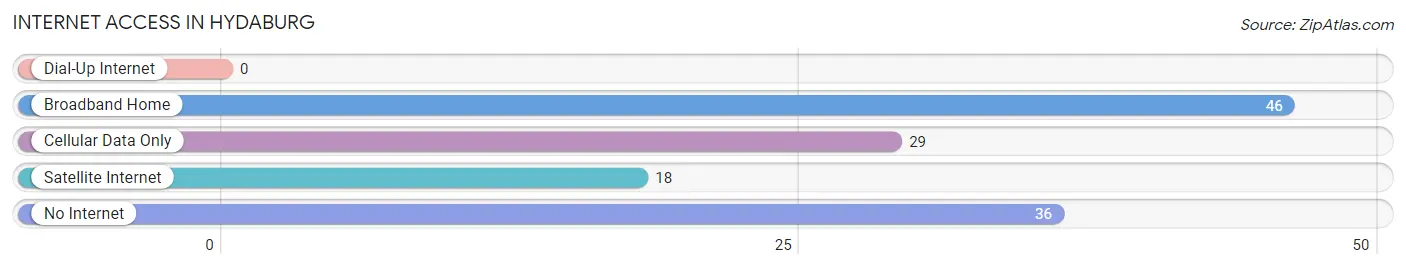
| Internet Type | # Households | % Households |
| Dial-Up Internet | 0 | 0.0% |
| Broadband Home | 46 | 36.8% |
| Cellular Data Only | 29 | 23.2% |
| Satellite Internet | 18 | 14.4% |
| No Internet | 36 | 28.8% |
| Total | 125 | 100.0% |
Hydaburg Summary
Introduction
Hydaburg, Alaska is a small city located on the east coast of Prince of Wales Island in the Alexander Archipelago of Southeast Alaska. It is the only incorporated city on the island and is home to the Haida people, who have lived in the area for centuries. The city has a population of about 300 people and is known for its rich cultural heritage and stunning natural beauty.
History
The Haida people have lived in the area for centuries, and the city of Hydaburg was established in the early 1900s. The city was named after Chief Hydaburg, who was a leader of the Haida people in the area. The city was incorporated in 1912 and has been a part of the Alaska Native Claims Settlement Act since 1971.
The city has a long history of fishing and logging, and it was once a major hub for the salmon canning industry. In the 1950s, the city was home to a large sawmill, which provided jobs for many of the residents. The sawmill closed in the 1970s, and the city has since become more reliant on fishing and tourism.
Geography
Hydaburg is located on the east coast of Prince of Wales Island in the Alexander Archipelago of Southeast Alaska. The city is situated on a small bay, which is surrounded by mountains and lush forests. The city is located about 40 miles from Ketchikan, the nearest major city.
The climate in Hydaburg is mild and wet, with temperatures rarely dropping below freezing. The city receives an average of over 100 inches of rain per year, making it one of the wettest cities in Alaska.
Economy
The economy of Hydaburg is largely based on fishing and tourism. The city is home to a number of commercial fishing boats, and the local seafood industry provides jobs for many of the residents. The city also has a small tourism industry, with visitors coming to experience the city’s rich cultural heritage and stunning natural beauty.
The city also has a small retail sector, with a few stores and restaurants. The city is home to a small sawmill, which provides jobs for some of the residents.
Demographics
The population of Hydaburg is about 300 people, with the majority of the population being of Native American descent. The city is home to the Haida people, who have lived in the area for centuries. The city also has a small population of non-Native Americans, mostly from the United States.
The median household income in Hydaburg is about $30,000, which is lower than the national average. The city has a high poverty rate, with about 25% of the population living below the poverty line.
Conclusion
Hydaburg, Alaska is a small city located on the east coast of Prince of Wales Island in the Alexander Archipelago of Southeast Alaska. The city has a population of about 300 people and is home to the Haida people, who have lived in the area for centuries. The city has a long history of fishing and logging, and it is now more reliant on fishing and tourism. The economy of Hydaburg is largely based on fishing and tourism, and the city has a small retail sector. The population of Hydaburg is mostly of Native American descent, and the median household income is lower than the national average.
Common Questions
What is Per Capita Income in Hydaburg?
Per Capita income in Hydaburg is $24,781.
What is the Median Family Income in Hydaburg?
Median Family Income in Hydaburg is $54,500.
What is the Median Household income in Hydaburg?
Median Household Income in Hydaburg is $53,125.
What is Income or Wage Gap in Hydaburg?
Income or Wage Gap in Hydaburg is 56.0%.
Women in Hydaburg earn 44.0 cents for every dollar earned by a man.
What is Inequality or Gini Index in Hydaburg?
Inequality or Gini Index in Hydaburg is 0.42.
What is the Total Population of Hydaburg?
Total Population of Hydaburg is 328.
What is the Total Male Population of Hydaburg?
Total Male Population of Hydaburg is 170.
What is the Total Female Population of Hydaburg?
Total Female Population of Hydaburg is 158.
What is the Ratio of Males per 100 Females in Hydaburg?
There are 107.59 Males per 100 Females in Hydaburg.
What is the Ratio of Females per 100 Males in Hydaburg?
There are 92.94 Females per 100 Males in Hydaburg.
What is the Median Population Age in Hydaburg?
Median Population Age in Hydaburg is 39.0 Years.
What is the Average Family Size in Hydaburg
Average Family Size in Hydaburg is 3.2 People.
What is the Average Household Size in Hydaburg
Average Household Size in Hydaburg is 2.6 People.
How Large is the Labor Force in Hydaburg?
There are 150 People in the Labor Forcein in Hydaburg.
What is the Percentage of People in the Labor Force in Hydaburg?
56.0% of People are in the Labor Force in Hydaburg.
What is the Unemployment Rate in Hydaburg?
Unemployment Rate in Hydaburg is 10.0%.