Huslia, AK Map & Demographics
Huslia Map
Huslia Overview
$20,677
PER CAPITA INCOME
$70,938
AVG FAMILY INCOME
$49,792
AVG HOUSEHOLD INCOME
21.7%
WAGE / INCOME GAP [ % ]
78.3¢/ $1
WAGE / INCOME GAP [ $ ]
0.41
INEQUALITY / GINI INDEX
182
TOTAL POPULATION
85
MALE POPULATION
97
FEMALE POPULATION
87.63
MALES / 100 FEMALES
114.12
FEMALES / 100 MALES
20.8
MEDIAN AGE
4.1
AVG FAMILY SIZE
2.9
AVG HOUSEHOLD SIZE
72
LABOR FORCE [ PEOPLE ]
61.0%
PERCENT IN LABOR FORCE
19.4%
UNEMPLOYMENT RATE
Huslia Zip Codes
Huslia Area Codes
Income in Huslia
Income Overview in Huslia
Per Capita Income in Huslia is $20,677, while median incomes of families and households are $70,938 and $49,792 respectively.
| Characteristic | Number | Measure |
| Per Capita Income | 182 | $20,677 |
| Median Family Income | 35 | $70,938 |
| Mean Family Income | 35 | $93,971 |
| Median Household Income | 63 | $49,792 |
| Mean Household Income | 63 | $71,816 |
| Income Deficit | 35 | $0 |
| Wage / Income Gap (%) | 182 | 21.72% |
| Wage / Income Gap ($) | 182 | 78.28¢ per $1 |
| Gini / Inequality Index | 182 | 0.41 |
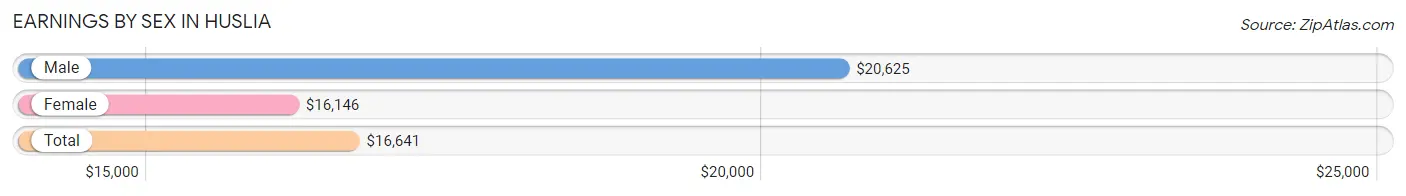
Earnings by Sex in Huslia
Average Earnings in Huslia are $16,641, $20,625 for men and $16,146 for women, a difference of 21.7%.
| Sex | Number | Average Earnings |
| Male | 46 (47.4%) | $20,625 |
| Female | 51 (52.6%) | $16,146 |
| Total | 97 (100.0%) | $16,641 |
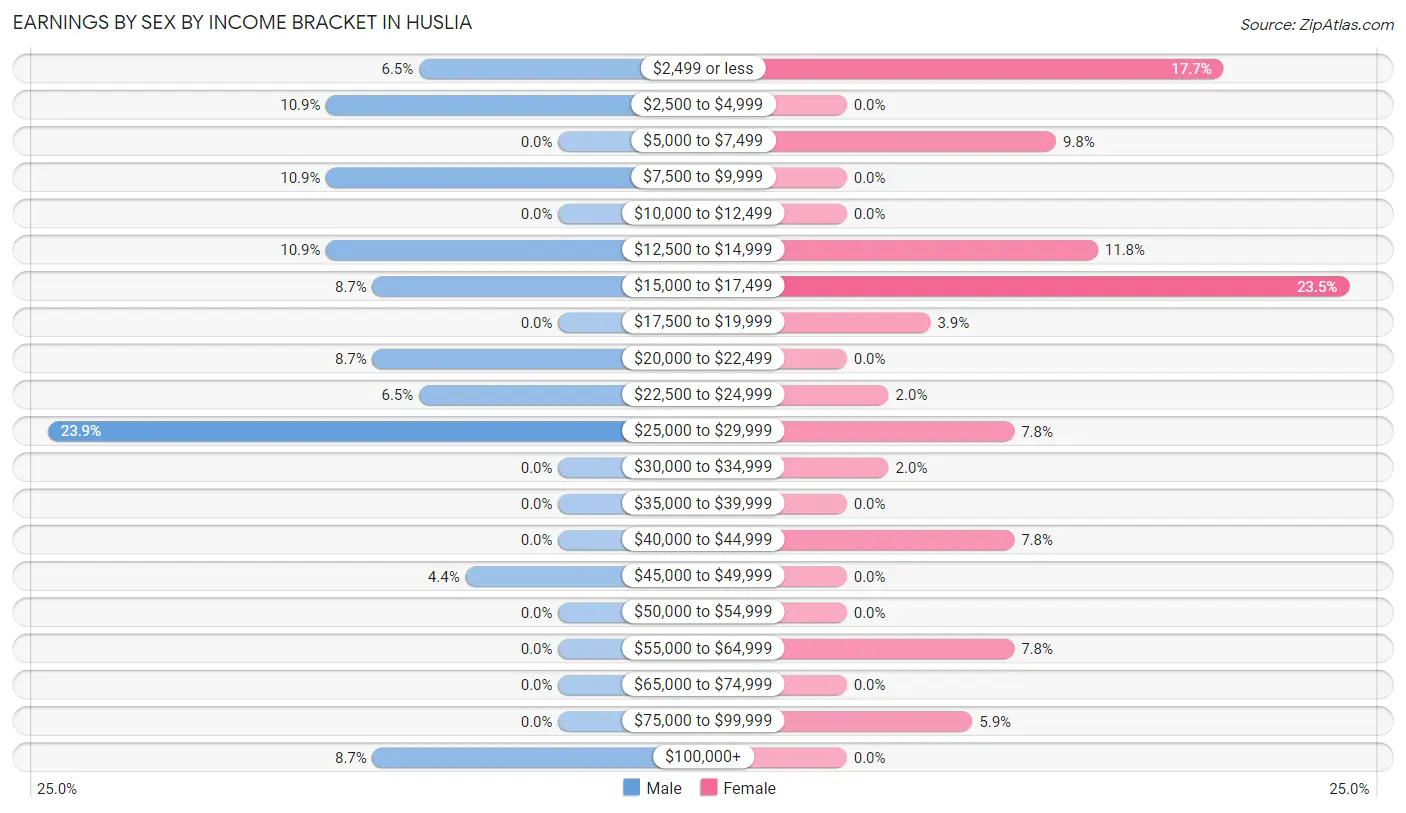
Earnings by Sex by Income Bracket in Huslia
The most common earnings brackets in Huslia are $25,000 to $29,999 for men (11 | 23.9%) and $15,000 to $17,499 for women (12 | 23.5%).
| Income | Male | Female |
| $2,499 or less | 3 (6.5%) | 9 (17.6%) |
| $2,500 to $4,999 | 5 (10.9%) | 0 (0.0%) |
| $5,000 to $7,499 | 0 (0.0%) | 5 (9.8%) |
| $7,500 to $9,999 | 5 (10.9%) | 0 (0.0%) |
| $10,000 to $12,499 | 0 (0.0%) | 0 (0.0%) |
| $12,500 to $14,999 | 5 (10.9%) | 6 (11.8%) |
| $15,000 to $17,499 | 4 (8.7%) | 12 (23.5%) |
| $17,500 to $19,999 | 0 (0.0%) | 2 (3.9%) |
| $20,000 to $22,499 | 4 (8.7%) | 0 (0.0%) |
| $22,500 to $24,999 | 3 (6.5%) | 1 (2.0%) |
| $25,000 to $29,999 | 11 (23.9%) | 4 (7.8%) |
| $30,000 to $34,999 | 0 (0.0%) | 1 (2.0%) |
| $35,000 to $39,999 | 0 (0.0%) | 0 (0.0%) |
| $40,000 to $44,999 | 0 (0.0%) | 4 (7.8%) |
| $45,000 to $49,999 | 2 (4.3%) | 0 (0.0%) |
| $50,000 to $54,999 | 0 (0.0%) | 0 (0.0%) |
| $55,000 to $64,999 | 0 (0.0%) | 4 (7.8%) |
| $65,000 to $74,999 | 0 (0.0%) | 0 (0.0%) |
| $75,000 to $99,999 | 0 (0.0%) | 3 (5.9%) |
| $100,000+ | 4 (8.7%) | 0 (0.0%) |
| Total | 46 (100.0%) | 51 (100.0%) |
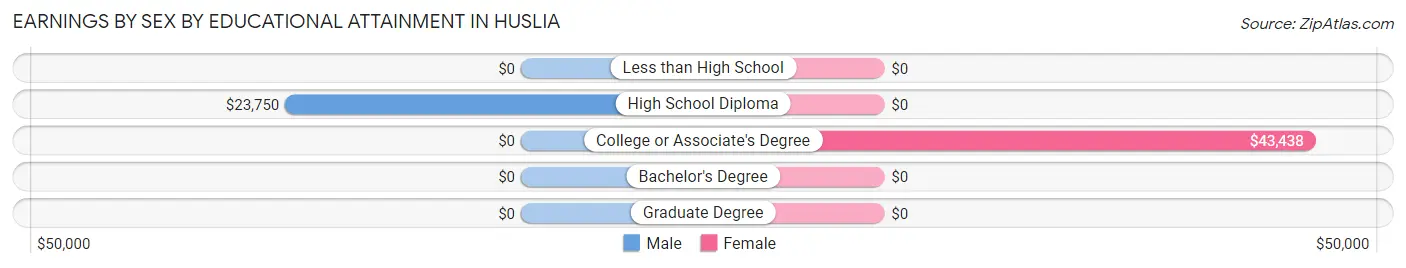
Earnings by Sex by Educational Attainment in Huslia
Average earnings in Huslia are $25,000 for men and $27,813 for women, a difference of 10.1%. Men with an educational attainment of high school diploma enjoy the highest average annual earnings of $23,750, while those with high school diploma education earn the least with $23,750. Women with an educational attainment of college or associate's degree earn the most with the average annual earnings of $43,438, while those with college or associate's degree education have the smallest earnings of $43,438.
| Educational Attainment | Male Income | Female Income |
| Less than High School | - | - |
| High School Diploma | $23,750 | $0 |
| College or Associate's Degree | - | - |
| Bachelor's Degree | - | - |
| Graduate Degree | - | - |
| Total | $25,000 | $27,813 |
Family Income in Huslia
Family Income Brackets in Huslia
According to the Huslia family income data, there are 8 families falling into the $50,000 to $74,999 income range, which is the most common income bracket and makes up 22.9% of all families.
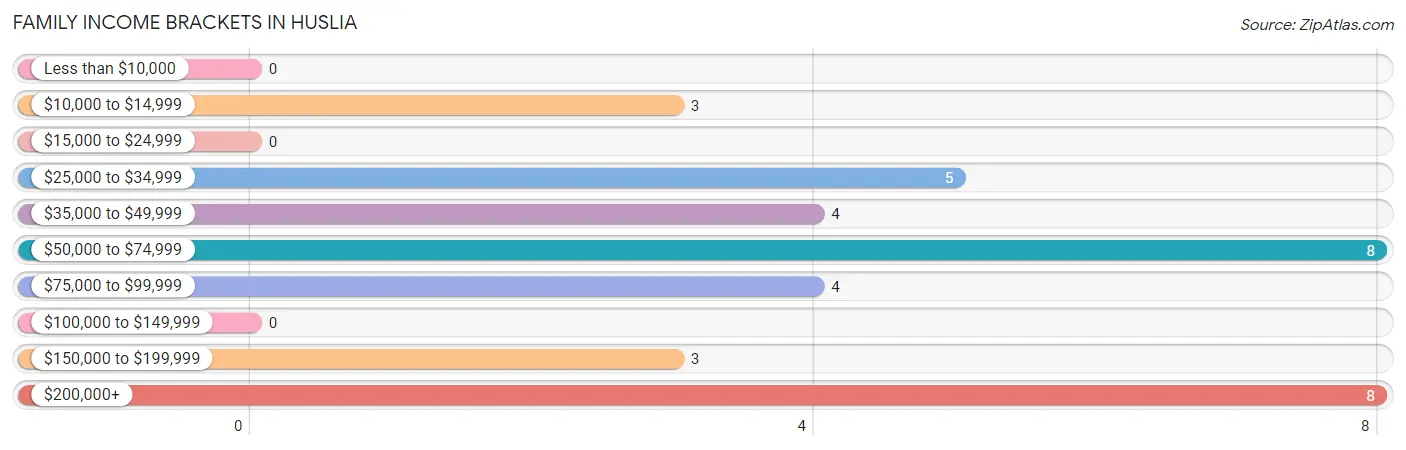
| Income Bracket | # Families | % Families |
| Less than $10,000 | 0 | 0.0% |
| $10,000 to $14,999 | 3 | 8.6% |
| $15,000 to $24,999 | 0 | 0.0% |
| $25,000 to $34,999 | 5 | 14.3% |
| $35,000 to $49,999 | 4 | 11.4% |
| $50,000 to $74,999 | 8 | 22.9% |
| $75,000 to $99,999 | 4 | 11.4% |
| $100,000 to $149,999 | 0 | 0.0% |
| $150,000 to $199,999 | 3 | 8.6% |
| $200,000+ | 8 | 22.9% |
Family Income by Famaliy Size in Huslia
3-person families (16 | 45.7%) account for the highest median family income in Huslia with $50,000 per family, while 3-person families (16 | 45.7%) have the highest median income of $16,667 per family member.
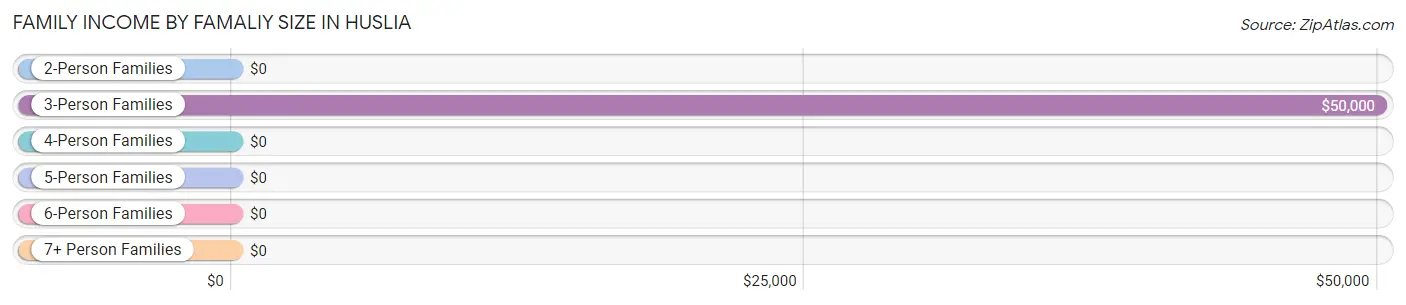
| Income Bracket | # Families | Median Income |
| 2-Person Families | 4 (11.4%) | $0 |
| 3-Person Families | 16 (45.7%) | $50,000 |
| 4-Person Families | 3 (8.6%) | $0 |
| 5-Person Families | 0 (0.0%) | $0 |
| 6-Person Families | 0 (0.0%) | $0 |
| 7+ Person Families | 12 (34.3%) | $0 |
| Total | 35 (100.0%) | $70,938 |
Family Income by Number of Earners in Huslia
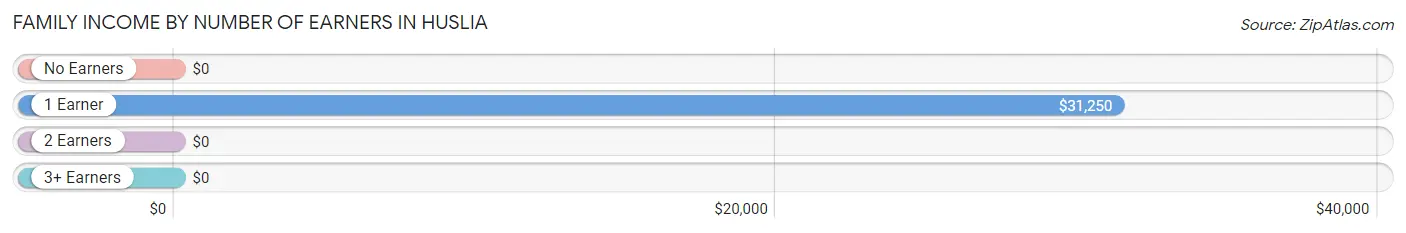
| Number of Earners | # Families | Median Income |
| No Earners | 0 (0.0%) | $0 |
| 1 Earner | 12 (34.3%) | $31,250 |
| 2 Earners | 7 (20.0%) | $0 |
| 3+ Earners | 16 (45.7%) | $0 |
| Total | 35 (100.0%) | $70,938 |
Household Income in Huslia
Household Income Brackets in Huslia
With 16 households falling in the category, the $50,000 to $74,999 income range is the most frequent in Huslia, accounting for 25.4% of all households.
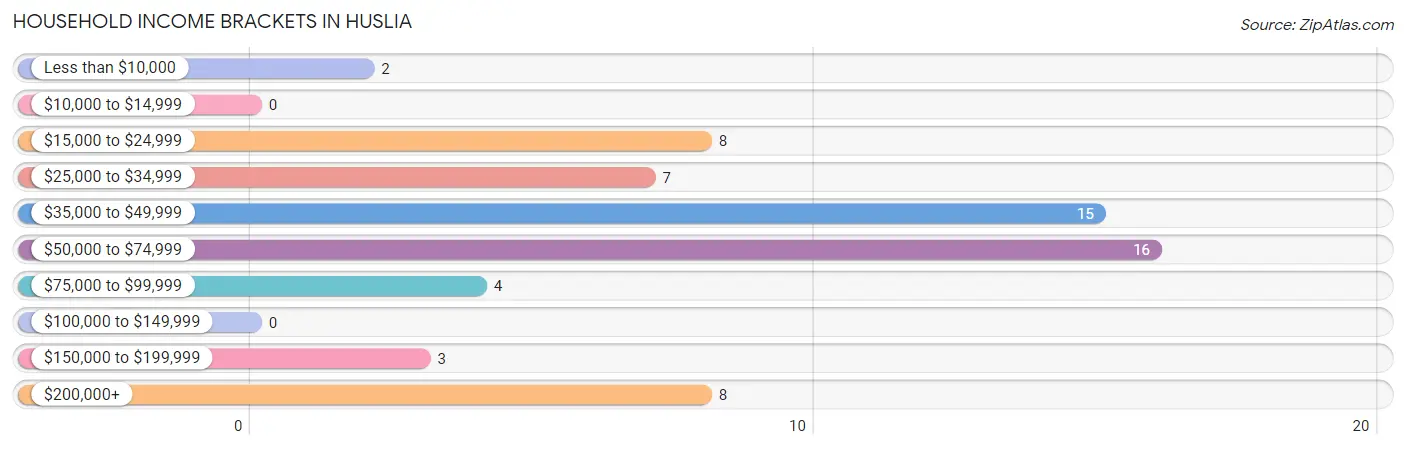
| Income Bracket | # Households | % Households |
| Less than $10,000 | 2 | 3.2% |
| $10,000 to $14,999 | 0 | 0.0% |
| $15,000 to $24,999 | 8 | 12.7% |
| $25,000 to $34,999 | 7 | 11.1% |
| $35,000 to $49,999 | 15 | 23.8% |
| $50,000 to $74,999 | 16 | 25.4% |
| $75,000 to $99,999 | 4 | 6.3% |
| $100,000 to $149,999 | 0 | 0.0% |
| $150,000 to $199,999 | 3 | 4.8% |
| $200,000+ | 8 | 12.7% |
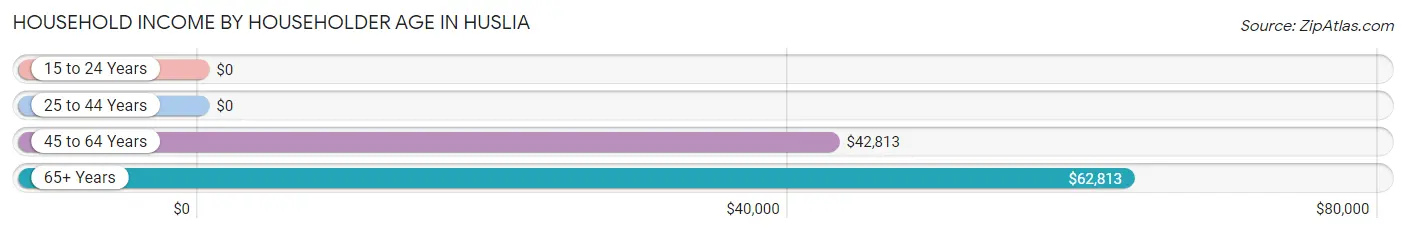
Household Income by Householder Age in Huslia
The median household income in Huslia is $49,792, with the highest median household income of $62,813 found in the 65+ years age bracket for the primary householder. A total of 17 households (27.0%) fall into this category.
| Income Bracket | # Households | Median Income |
| 15 to 24 Years | 0 (0.0%) | $0 |
| 25 to 44 Years | 17 (27.0%) | $0 |
| 45 to 64 Years | 29 (46.0%) | $42,813 |
| 65+ Years | 17 (27.0%) | $62,813 |
| Total | 63 (100.0%) | $49,792 |
Poverty in Huslia
Income Below Poverty by Sex and Age in Huslia
With 15.3% poverty level for males and 6.2% for females among the residents of Huslia, 25 to 34 year old males and 45 to 54 year old females are the most vulnerable to poverty, with 3 males (100.0%) and 2 females (33.3%) in their respective age groups living below the poverty level.
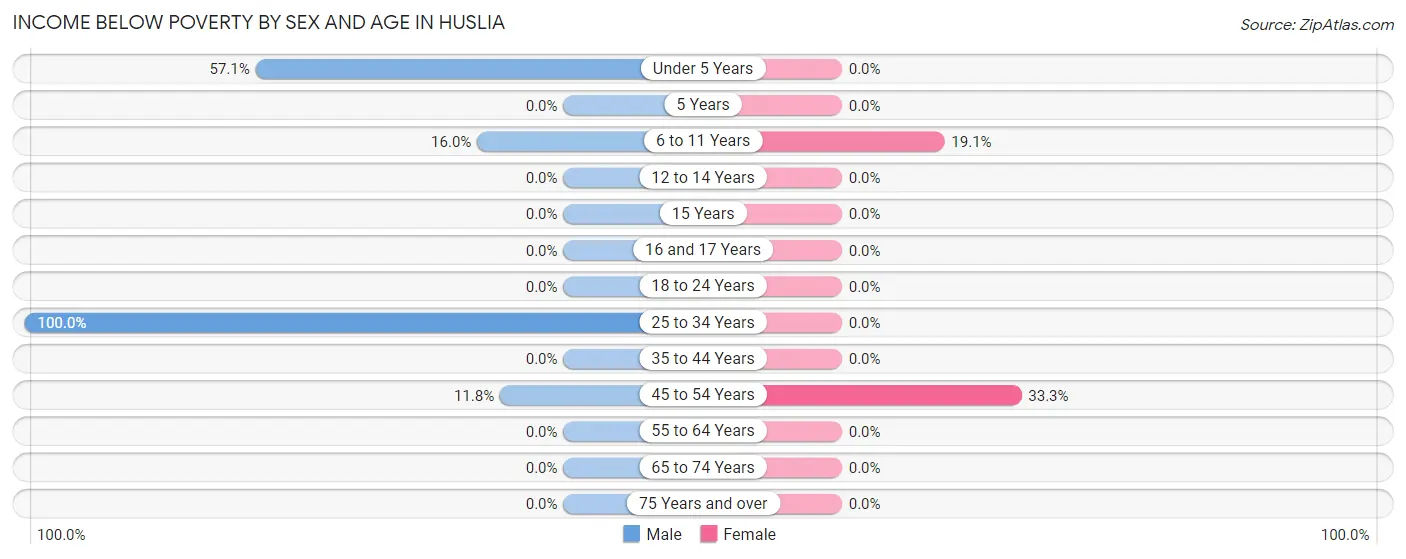
| Age Bracket | Male | Female |
| Under 5 Years | 4 (57.1%) | 0 (0.0%) |
| 5 Years | 0 (0.0%) | 0 (0.0%) |
| 6 to 11 Years | 4 (16.0%) | 4 (19.1%) |
| 12 to 14 Years | 0 (0.0%) | 0 (0.0%) |
| 15 Years | 0 (0.0%) | 0 (0.0%) |
| 16 and 17 Years | 0 (0.0%) | 0 (0.0%) |
| 18 to 24 Years | 0 (0.0%) | 0 (0.0%) |
| 25 to 34 Years | 3 (100.0%) | 0 (0.0%) |
| 35 to 44 Years | 0 (0.0%) | 0 (0.0%) |
| 45 to 54 Years | 2 (11.8%) | 2 (33.3%) |
| 55 to 64 Years | 0 (0.0%) | 0 (0.0%) |
| 65 to 74 Years | 0 (0.0%) | 0 (0.0%) |
| 75 Years and over | 0 (0.0%) | 0 (0.0%) |
| Total | 13 (15.3%) | 6 (6.2%) |
Income Above Poverty by Sex and Age in Huslia
According to the poverty statistics in Huslia, males aged 5 years and females aged 15 years are the age groups that are most secure financially, with 100.0% of males and 100.0% of females in these age groups living above the poverty line.
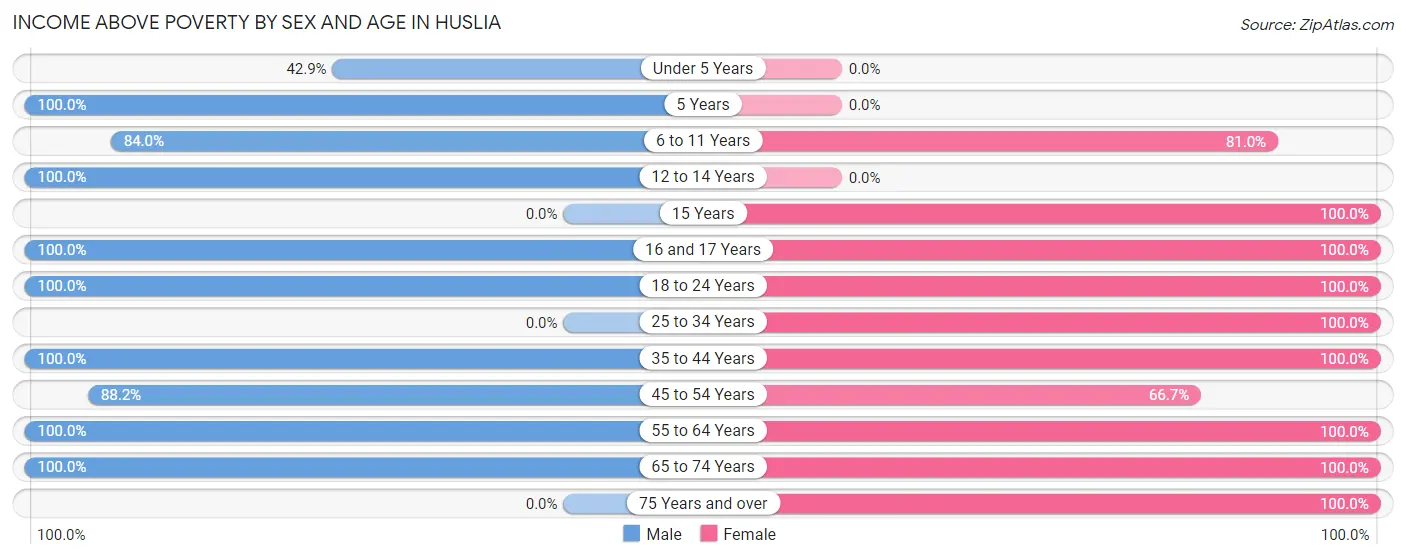
| Age Bracket | Male | Female |
| Under 5 Years | 3 (42.9%) | 0 (0.0%) |
| 5 Years | 3 (100.0%) | 0 (0.0%) |
| 6 to 11 Years | 21 (84.0%) | 17 (80.9%) |
| 12 to 14 Years | 4 (100.0%) | 0 (0.0%) |
| 15 Years | 0 (0.0%) | 4 (100.0%) |
| 16 and 17 Years | 3 (100.0%) | 9 (100.0%) |
| 18 to 24 Years | 9 (100.0%) | 11 (100.0%) |
| 25 to 34 Years | 0 (0.0%) | 9 (100.0%) |
| 35 to 44 Years | 7 (100.0%) | 8 (100.0%) |
| 45 to 54 Years | 15 (88.2%) | 4 (66.7%) |
| 55 to 64 Years | 6 (100.0%) | 13 (100.0%) |
| 65 to 74 Years | 1 (100.0%) | 11 (100.0%) |
| 75 Years and over | 0 (0.0%) | 5 (100.0%) |
| Total | 72 (84.7%) | 91 (93.8%) |
Income Below Poverty Among Married-Couple Families in Huslia
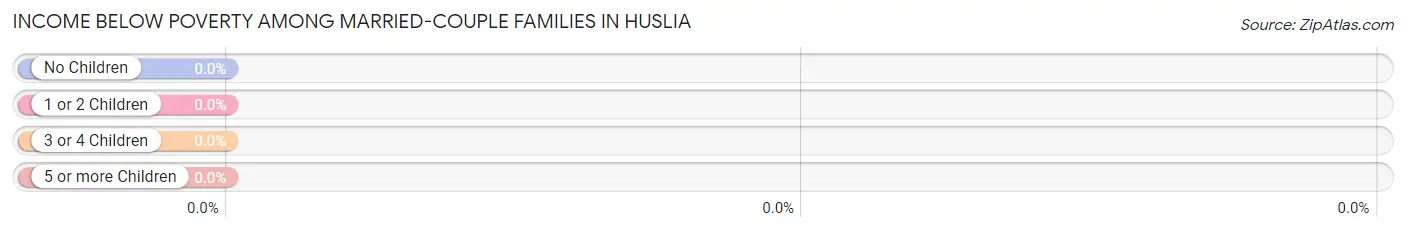
| Children | Above Poverty | Below Poverty |
| No Children | 4 (100.0%) | 0 (0.0%) |
| 1 or 2 Children | 4 (100.0%) | 0 (0.0%) |
| 3 or 4 Children | 8 (100.0%) | 0 (0.0%) |
| 5 or more Children | 4 (100.0%) | 0 (0.0%) |
| Total | 20 (100.0%) | 0 (0.0%) |
Income Below Poverty Among Single-Parent Households in Huslia
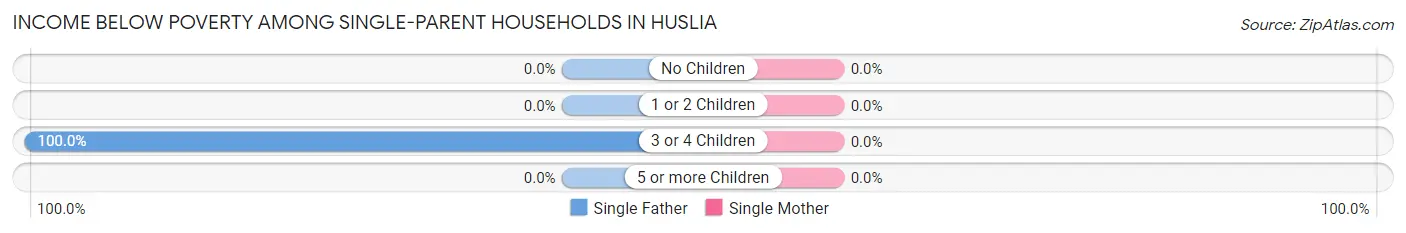
| Children | Single Father | Single Mother |
| No Children | 0 (0.0%) | 0 (0.0%) |
| 1 or 2 Children | 0 (0.0%) | 0 (0.0%) |
| 3 or 4 Children | 3 (100.0%) | 0 (0.0%) |
| 5 or more Children | 0 (0.0%) | 0 (0.0%) |
| Total | 3 (42.9%) | 0 (0.0%) |
Income Below Poverty Among Married-Couple vs Single-Parent Households in Huslia
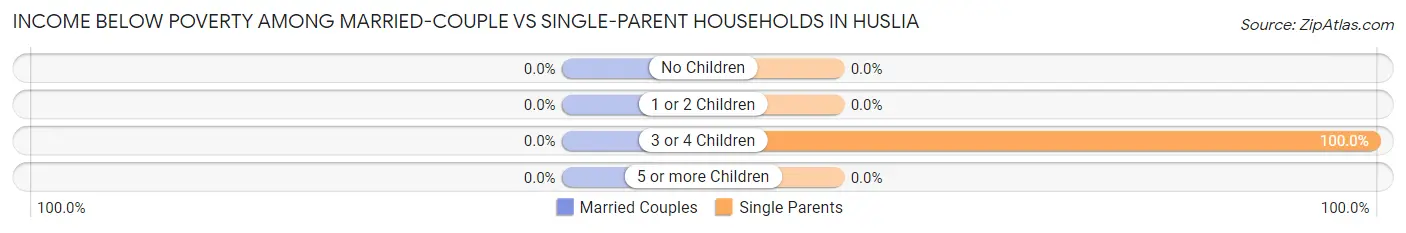
| Children | Married-Couple Families | Single-Parent Households |
| No Children | 0 (0.0%) | 0 (0.0%) |
| 1 or 2 Children | 0 (0.0%) | 0 (0.0%) |
| 3 or 4 Children | 0 (0.0%) | 3 (100.0%) |
| 5 or more Children | 0 (0.0%) | 0 (0.0%) |
| Total | 0 (0.0%) | 3 (20.0%) |
Race in Huslia
The most populous races in Huslia are Native / Alaskan (146 | 80.2%), Two or more Races (25 | 13.7%), and Hispanic or Latino (18 | 9.9%).
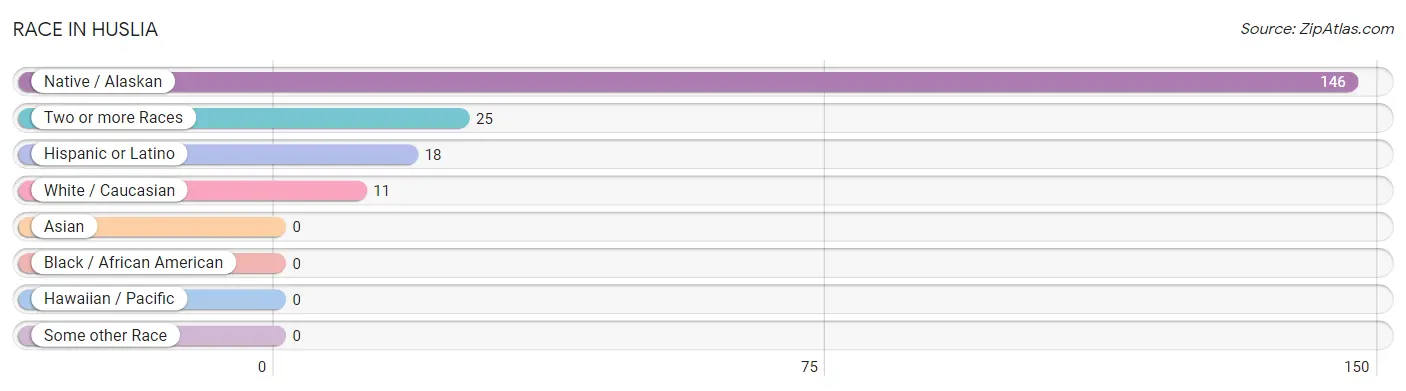
| Race | # Population | % Population |
| Asian | 0 | 0.0% |
| Black / African American | 0 | 0.0% |
| Hawaiian / Pacific | 0 | 0.0% |
| Hispanic or Latino | 18 | 9.9% |
| Native / Alaskan | 146 | 80.2% |
| White / Caucasian | 11 | 6.0% |
| Two or more Races | 25 | 13.7% |
| Some other Race | 0 | 0.0% |
| Total | 182 | 100.0% |
Ancestry in Huslia
The most populous ancestries reported in Huslia are Alaskan Athabascan (157 | 86.3%), German (29 | 15.9%), Puerto Rican (18 | 9.9%), Alaska Native (14 | 7.7%), and Scottish (4 | 2.2%), together accounting for 122.0% of all Huslia residents.
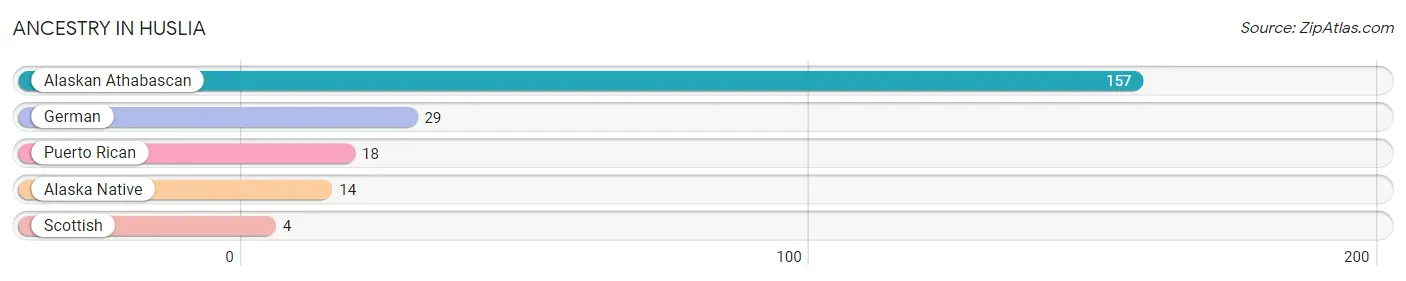
| Ancestry | # Population | % Population |
| Alaska Native | 14 | 7.7% |
| Alaskan Athabascan | 157 | 86.3% |
| German | 29 | 15.9% |
| Puerto Rican | 18 | 9.9% |
| Scottish | 4 | 2.2% | View All 5 Rows |
Immigrants in Huslia

| Immigration Origin | # Population | % Population | View All 0 Rows |
Sex and Age in Huslia
Sex and Age in Huslia
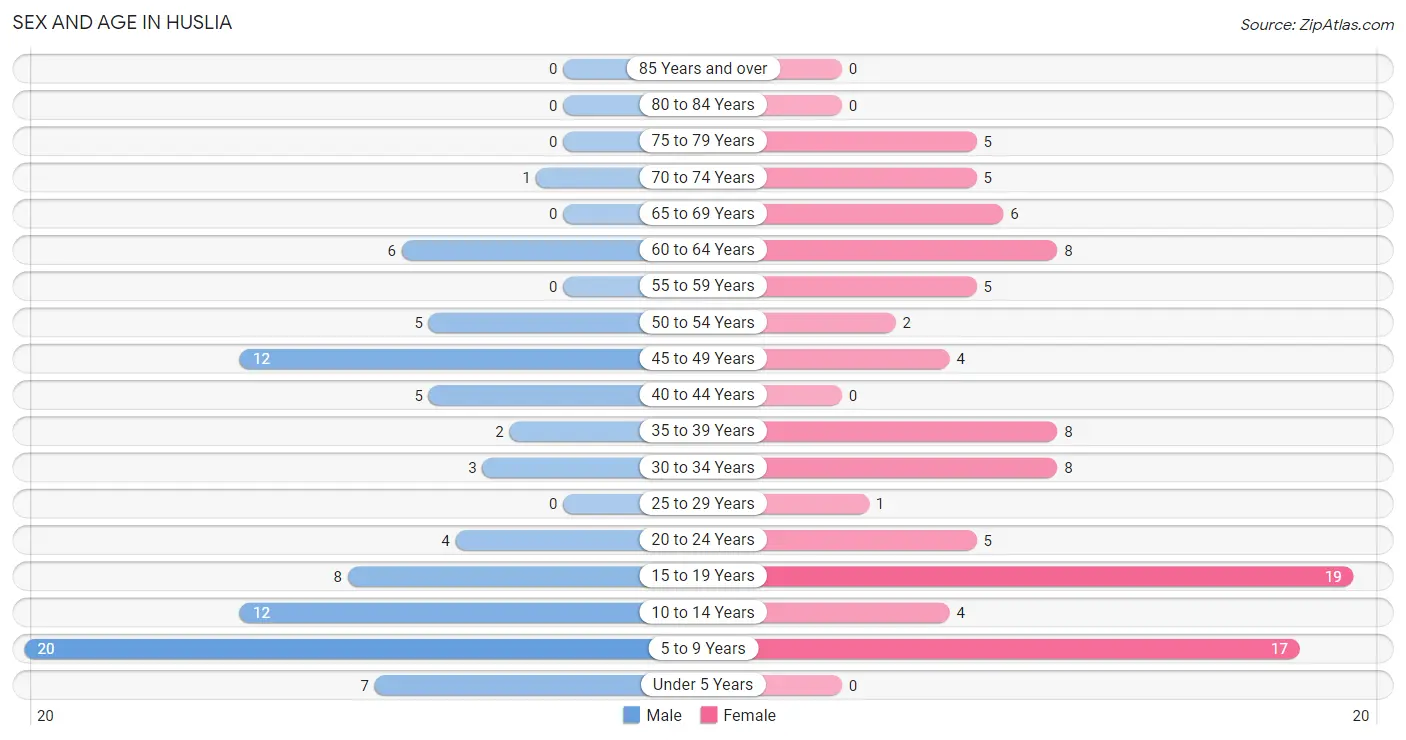
The most populous age groups in Huslia are 5 to 9 Years (20 | 23.5%) for men and 15 to 19 Years (19 | 19.6%) for women.
| Age Bracket | Male | Female |
| Under 5 Years | 7 (8.2%) | 0 (0.0%) |
| 5 to 9 Years | 20 (23.5%) | 17 (17.5%) |
| 10 to 14 Years | 12 (14.1%) | 4 (4.1%) |
| 15 to 19 Years | 8 (9.4%) | 19 (19.6%) |
| 20 to 24 Years | 4 (4.7%) | 5 (5.1%) |
| 25 to 29 Years | 0 (0.0%) | 1 (1.0%) |
| 30 to 34 Years | 3 (3.5%) | 8 (8.3%) |
| 35 to 39 Years | 2 (2.4%) | 8 (8.3%) |
| 40 to 44 Years | 5 (5.9%) | 0 (0.0%) |
| 45 to 49 Years | 12 (14.1%) | 4 (4.1%) |
| 50 to 54 Years | 5 (5.9%) | 2 (2.1%) |
| 55 to 59 Years | 0 (0.0%) | 5 (5.1%) |
| 60 to 64 Years | 6 (7.1%) | 8 (8.3%) |
| 65 to 69 Years | 0 (0.0%) | 6 (6.2%) |
| 70 to 74 Years | 1 (1.2%) | 5 (5.1%) |
| 75 to 79 Years | 0 (0.0%) | 5 (5.1%) |
| 80 to 84 Years | 0 (0.0%) | 0 (0.0%) |
| 85 Years and over | 0 (0.0%) | 0 (0.0%) |
| Total | 85 (100.0%) | 97 (100.0%) |
Families and Households in Huslia
Median Family Size in Huslia
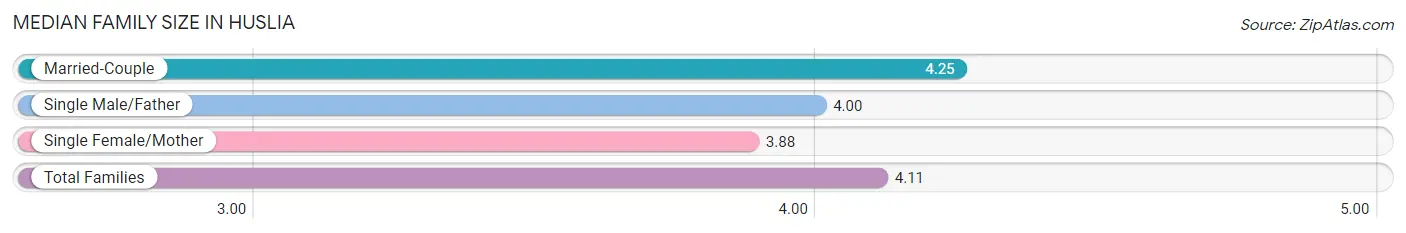
The median family size in Huslia is 4.11 persons per family, with married-couple families (20 | 57.1%) accounting for the largest median family size of 4.25 persons per family. On the other hand, single female/mother families (8 | 22.9%) represent the smallest median family size with 3.88 persons per family.
| Family Type | # Families | Family Size |
| Married-Couple | 20 (57.1%) | 4.25 |
| Single Male/Father | 7 (20.0%) | 4.00 |
| Single Female/Mother | 8 (22.9%) | 3.88 |
| Total Families | 35 (100.0%) | 4.11 |
Median Household Size in Huslia
| Household Type | # Households | Household Size |
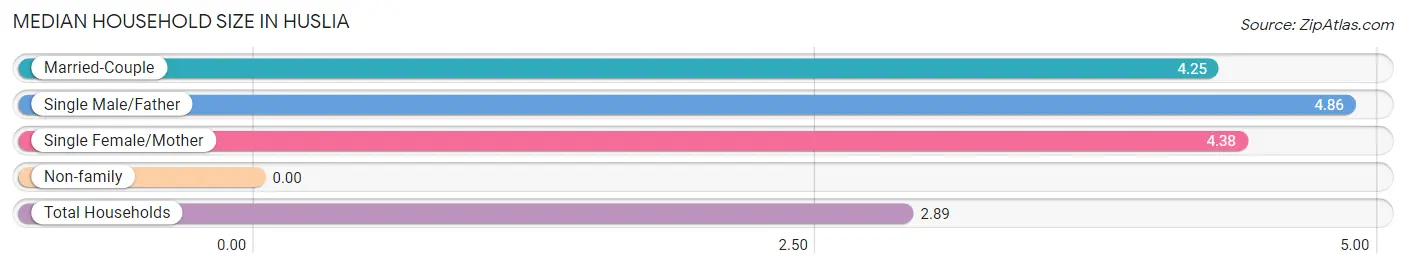
| Married-Couple | 20 (31.8%) | 4.25 |
| Single Male/Father | 7 (11.1%) | 4.86 |
| Single Female/Mother | 8 (12.7%) | 4.38 |
| Non-family | 28 (44.4%) | - |
| Total Households | 63 (100.0%) | 2.89 |
Household Size by Marriage Status in Huslia
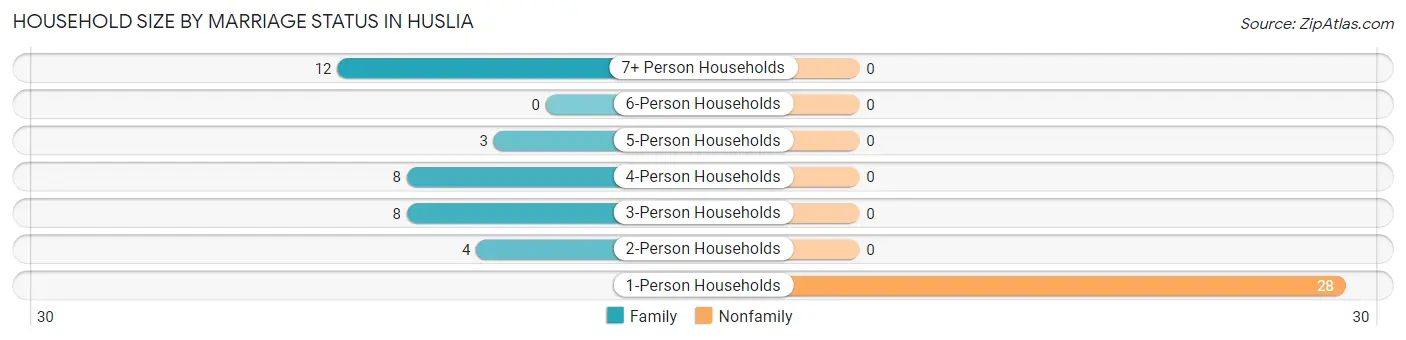
Out of a total of 63 households in Huslia, 35 (55.6%) are family households, while 28 (44.4%) are nonfamily households. The most numerous type of family households are 7+ person households, comprising 12, and the most common type of nonfamily households are 1-person households, comprising 28.
| Household Size | Family Households | Nonfamily Households |
| 1-Person Households | - | 28 (44.4%) |
| 2-Person Households | 4 (6.4%) | 0 (0.0%) |
| 3-Person Households | 8 (12.7%) | 0 (0.0%) |
| 4-Person Households | 8 (12.7%) | 0 (0.0%) |
| 5-Person Households | 3 (4.8%) | 0 (0.0%) |
| 6-Person Households | 0 (0.0%) | 0 (0.0%) |
| 7+ Person Households | 12 (19.1%) | 0 (0.0%) |
| Total | 35 (55.6%) | 28 (44.4%) |
Female Fertility in Huslia
Fertility by Age in Huslia
| Age Bracket | Women with Births | Births / 1,000 Women |
| 15 to 19 years | 0 (0.0%) | 0.0 |
| 20 to 34 years | 0 (0.0%) | 0.0 |
| 35 to 50 years | 0 (0.0%) | 0.0 |
| Total | 0 (0.0%) | 0.0 |
Fertility by Age by Marriage Status in Huslia
| Age Bracket | Married | Unmarried |
| 15 to 19 years | 0 (0.0%) | 0 (0.0%) |
| 20 to 34 years | 0 (0.0%) | 0 (0.0%) |
| 35 to 50 years | 0 (0.0%) | 0 (0.0%) |
| Total | 0 (0.0%) | 0 (0.0%) |
Fertility by Education in Huslia
| Educational Attainment | Women with Births | Births / 1,000 Women |
| Less than High School | 0 (0.0%) | 0.0 |
| High School Diploma | 0 (0.0%) | 0.0 |
| College or Associate's Degree | 0 (0.0%) | 0.0 |
| Bachelor's Degree | 0 (0.0%) | 0.0 |
| Graduate Degree | 0 (0.0%) | 0.0 |
| Total | 0 (0.0%) | 0.0 |
Fertility by Education by Marriage Status in Huslia
| Educational Attainment | Married | Unmarried |
| Less than High School | 0 (0.0%) | 0 (0.0%) |
| High School Diploma | 0 (0.0%) | 0 (0.0%) |
| College or Associate's Degree | 0 (0.0%) | 0 (0.0%) |
| Bachelor's Degree | 0 (0.0%) | 0 (0.0%) |
| Graduate Degree | 0 (0.0%) | 0 (0.0%) |
| Total | 0 (0.0%) | 0 (0.0%) |
Employment Characteristics in Huslia
Employment by Class of Employer in Huslia
Among the 57 employed individuals in Huslia, local government employees (23 | 40.4%), state government employees (10 | 17.5%), and self-employed (not incorporated) (8 | 14.0%) make up the most common classes of employment.
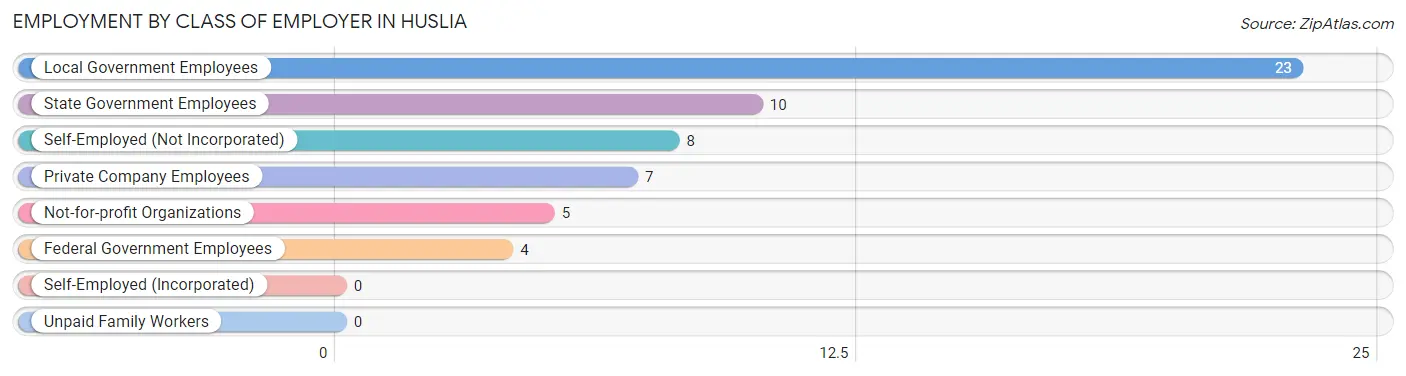
| Employer Class | # Employees | % Employees |
| Private Company Employees | 7 | 12.3% |
| Self-Employed (Incorporated) | 0 | 0.0% |
| Self-Employed (Not Incorporated) | 8 | 14.0% |
| Not-for-profit Organizations | 5 | 8.8% |
| Local Government Employees | 23 | 40.4% |
| State Government Employees | 10 | 17.5% |
| Federal Government Employees | 4 | 7.0% |
| Unpaid Family Workers | 0 | 0.0% |
| Total | 57 | 100.0% |
Employment Status by Age in Huslia
According to the labor force statistics for Huslia, out of the total population over 16 years of age (118), 61.0% or 72 individuals are in the labor force, with 19.4% or 14 of them unemployed. The age group with the highest labor force participation rate is 20 to 24 years, with 100.0% or 9 individuals in the labor force. Within the labor force, the 65 to 74 years age range has the highest percentage of unemployed individuals, with 80.0% or 4 of them being unemployed.
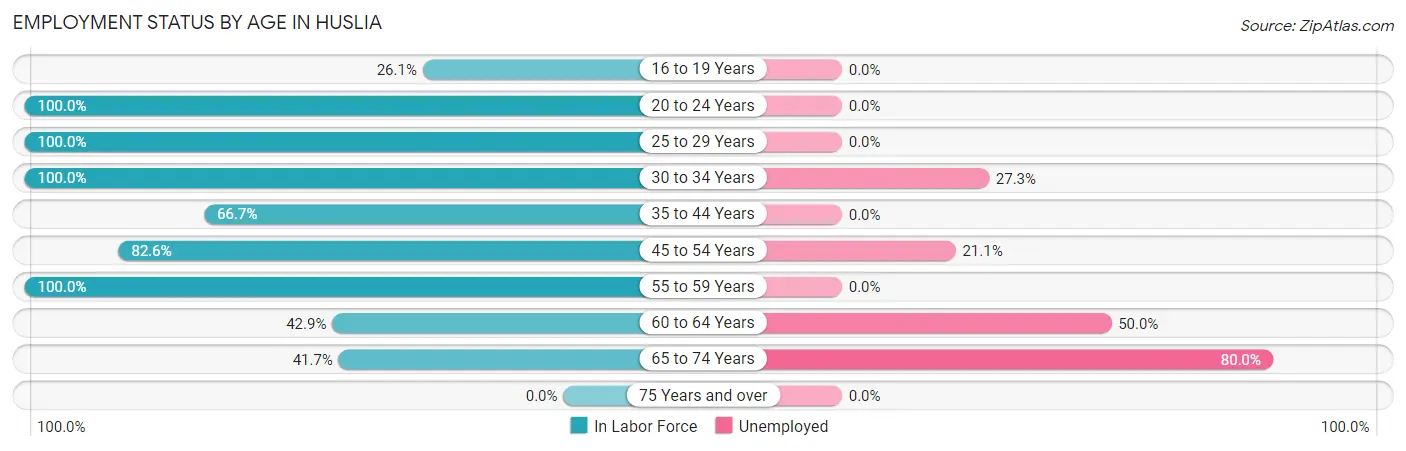
| Age Bracket | In Labor Force | Unemployed |
| 16 to 19 Years | 6 (26.1%) | 0 (0.0%) |
| 20 to 24 Years | 9 (100.0%) | 0 (0.0%) |
| 25 to 29 Years | 1 (100.0%) | 0 (0.0%) |
| 30 to 34 Years | 11 (100.0%) | 3 (27.3%) |
| 35 to 44 Years | 10 (66.7%) | 0 (0.0%) |
| 45 to 54 Years | 19 (82.6%) | 4 (21.1%) |
| 55 to 59 Years | 5 (100.0%) | 0 (0.0%) |
| 60 to 64 Years | 6 (42.9%) | 3 (50.0%) |
| 65 to 74 Years | 5 (41.7%) | 4 (80.0%) |
| 75 Years and over | 0 (0.0%) | 0 (0.0%) |
| Total | 72 (61.0%) | 14 (19.4%) |
Employment Status by Educational Attainment in Huslia
According to labor force statistics for Huslia, 75.4% of individuals (52) out of the total population between 25 and 64 years of age (69) are in the labor force, with 19.2% or 10 of them being unemployed. The group with the highest labor force participation rate are those with the educational attainment of bachelor's degree or higher, with 100.0% or 6 individuals in the labor force. Within the labor force, individuals with high school diploma education have the highest percentage of unemployment, with 29.6% or 8 of them being unemployed.
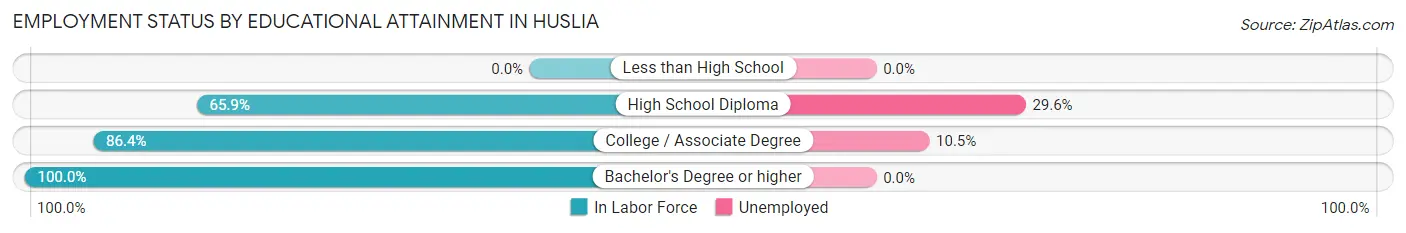
| Educational Attainment | In Labor Force | Unemployed |
| Less than High School | 0 (0.0%) | 0 (0.0%) |
| High School Diploma | 27 (65.9%) | 12 (29.6%) |
| College / Associate Degree | 19 (86.4%) | 2 (10.5%) |
| Bachelor's Degree or higher | 6 (100.0%) | 0 (0.0%) |
| Total | 52 (75.4%) | 13 (19.2%) |
Employment Occupations by Sex in Huslia
Management, Business, Science and Arts Occupations
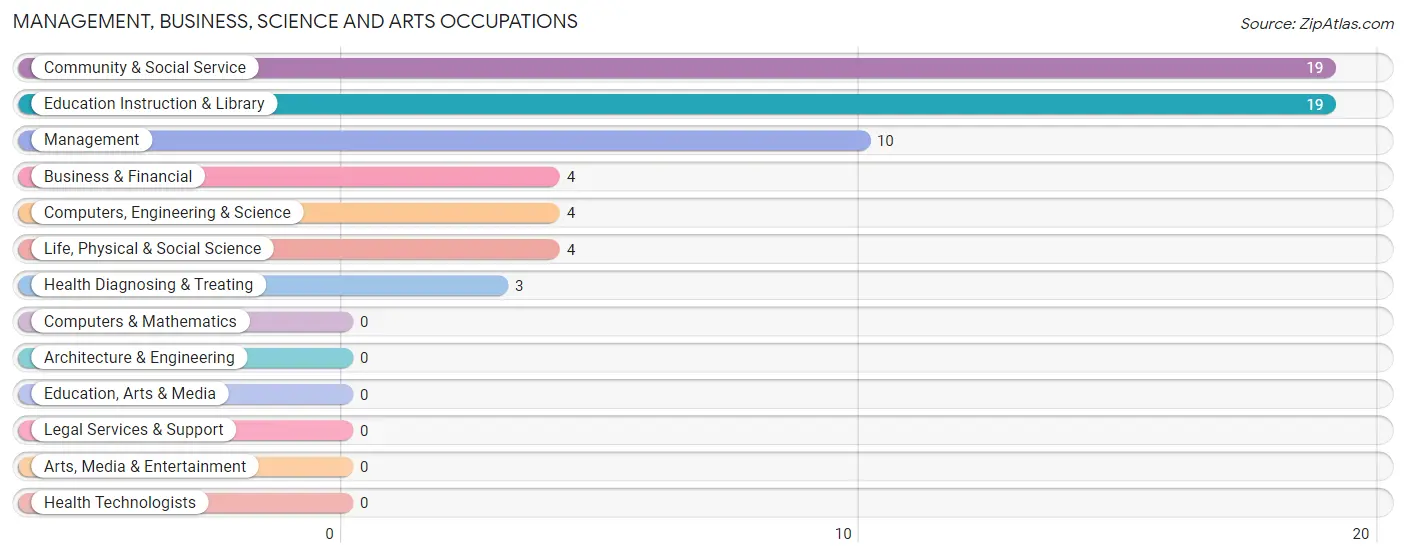
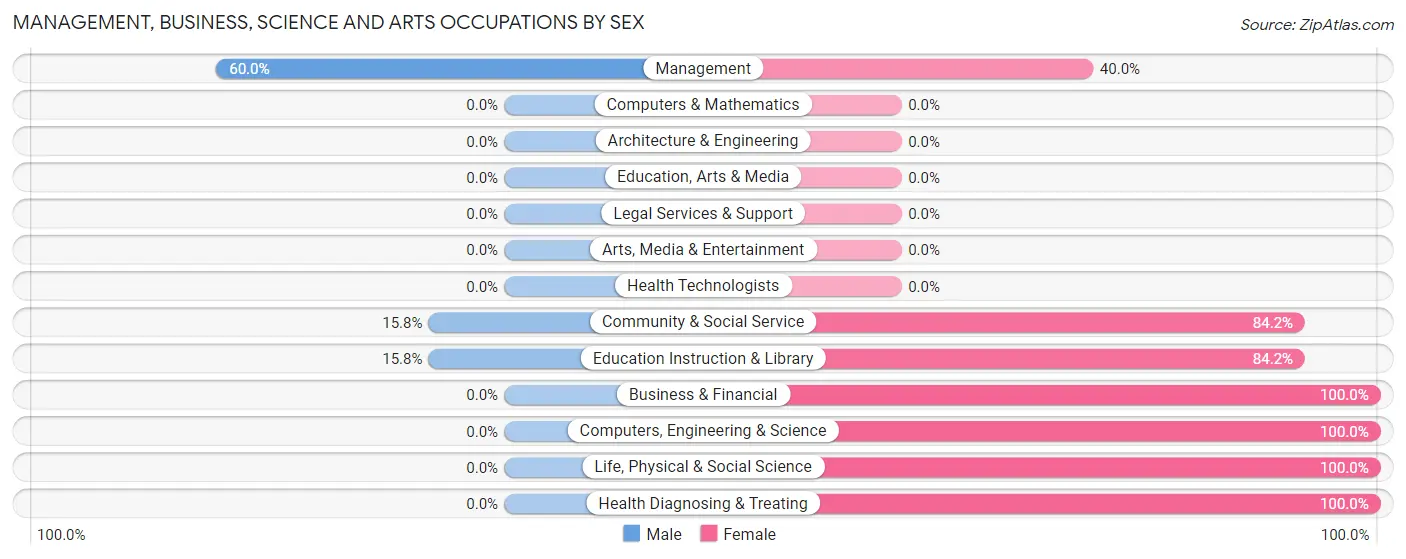
The most common Management, Business, Science and Arts occupations in Huslia are Community & Social Service (19 | 32.8%), Education Instruction & Library (19 | 32.8%), Management (10 | 17.2%), Business & Financial (4 | 6.9%), and Computers, Engineering & Science (4 | 6.9%).
Management, Business, Science and Arts Occupations by Sex
Within the Management, Business, Science and Arts occupations in Huslia, the most male-oriented occupations are Management (60.0%), Community & Social Service (15.8%), and Education Instruction & Library (15.8%), while the most female-oriented occupations are Business & Financial (100.0%), Computers, Engineering & Science (100.0%), and Life, Physical & Social Science (100.0%).
| Occupation | Male | Female |
| Management | 6 (60.0%) | 4 (40.0%) |
| Business & Financial | 0 (0.0%) | 4 (100.0%) |
| Computers, Engineering & Science | 0 (0.0%) | 4 (100.0%) |
| Computers & Mathematics | 0 (0.0%) | 0 (0.0%) |
| Architecture & Engineering | 0 (0.0%) | 0 (0.0%) |
| Life, Physical & Social Science | 0 (0.0%) | 4 (100.0%) |
| Community & Social Service | 3 (15.8%) | 16 (84.2%) |
| Education, Arts & Media | 0 (0.0%) | 0 (0.0%) |
| Legal Services & Support | 0 (0.0%) | 0 (0.0%) |
| Education Instruction & Library | 3 (15.8%) | 16 (84.2%) |
| Arts, Media & Entertainment | 0 (0.0%) | 0 (0.0%) |
| Health Diagnosing & Treating | 0 (0.0%) | 3 (100.0%) |
| Health Technologists | 0 (0.0%) | 0 (0.0%) |
| Total (Category) | 9 (22.5%) | 31 (77.5%) |
| Total (Overall) | 18 (31.0%) | 40 (69.0%) |
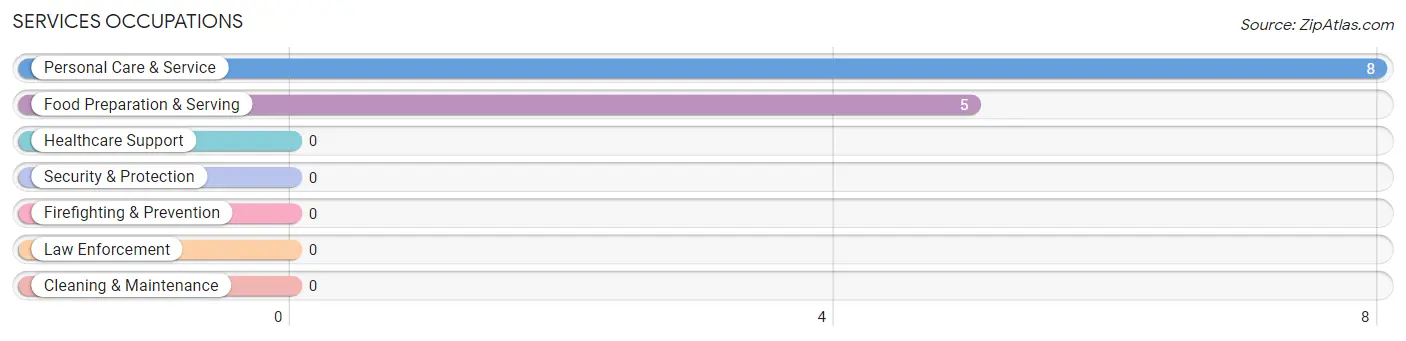
Services Occupations
The most common Services occupations in Huslia are Personal Care & Service (8 | 13.8%), and Food Preparation & Serving (5 | 8.6%).
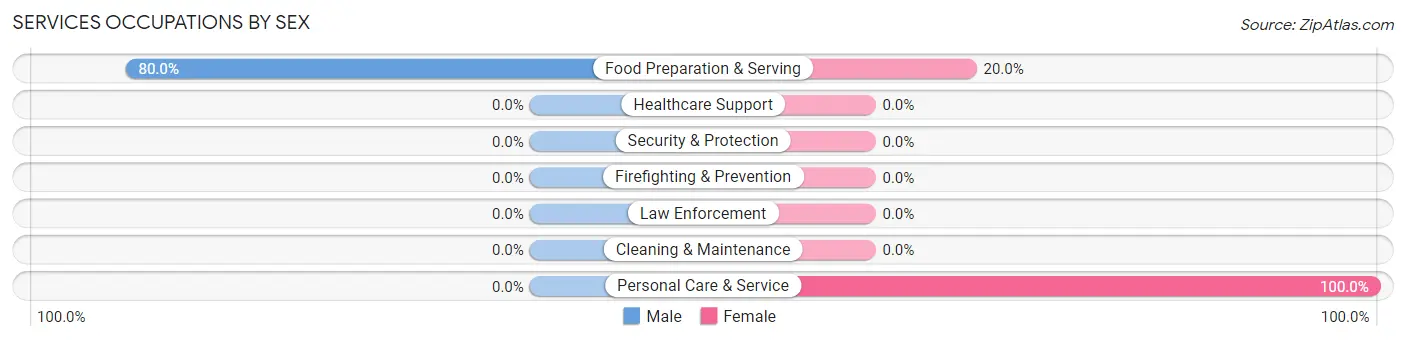
Services Occupations by Sex
| Occupation | Male | Female |
| Healthcare Support | 0 (0.0%) | 0 (0.0%) |
| Security & Protection | 0 (0.0%) | 0 (0.0%) |
| Firefighting & Prevention | 0 (0.0%) | 0 (0.0%) |
| Law Enforcement | 0 (0.0%) | 0 (0.0%) |
| Food Preparation & Serving | 4 (80.0%) | 1 (20.0%) |
| Cleaning & Maintenance | 0 (0.0%) | 0 (0.0%) |
| Personal Care & Service | 0 (0.0%) | 8 (100.0%) |
| Total (Category) | 4 (30.8%) | 9 (69.2%) |
| Total (Overall) | 18 (31.0%) | 40 (69.0%) |
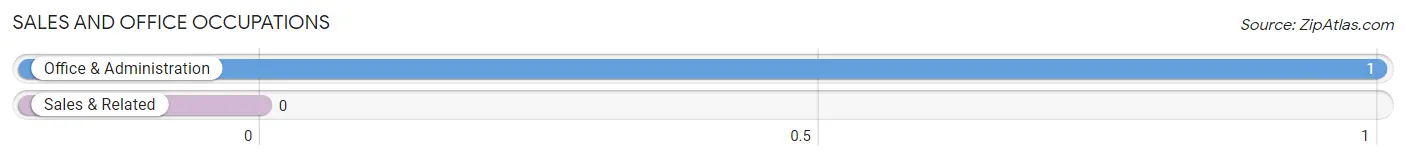
Sales and Office Occupations
The most common Sales and Office occupations in Huslia are , and Office & Administration (1 | 1.7%).
Sales and Office Occupations by Sex
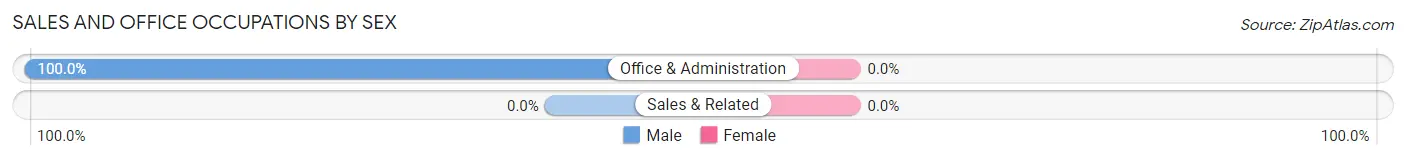
| Occupation | Male | Female |
| Sales & Related | 0 (0.0%) | 0 (0.0%) |
| Office & Administration | 1 (100.0%) | 0 (0.0%) |
| Total (Category) | 1 (100.0%) | 0 (0.0%) |
| Total (Overall) | 18 (31.0%) | 40 (69.0%) |
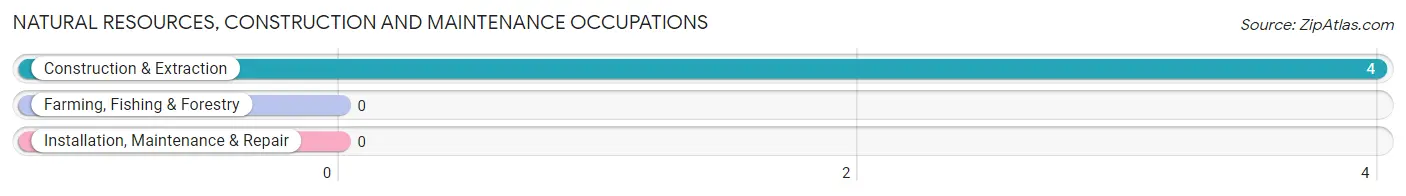
Natural Resources, Construction and Maintenance Occupations
The most common Natural Resources, Construction and Maintenance occupations in Huslia are , and Construction & Extraction (4 | 6.9%).
Natural Resources, Construction and Maintenance Occupations by Sex
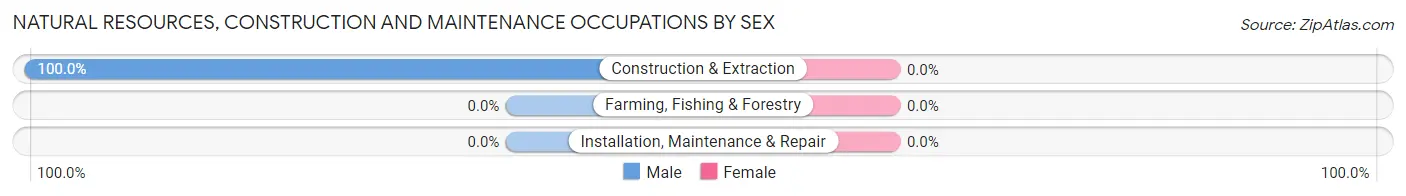
| Occupation | Male | Female |
| Farming, Fishing & Forestry | 0 (0.0%) | 0 (0.0%) |
| Construction & Extraction | 4 (100.0%) | 0 (0.0%) |
| Installation, Maintenance & Repair | 0 (0.0%) | 0 (0.0%) |
| Total (Category) | 4 (100.0%) | 0 (0.0%) |
| Total (Overall) | 18 (31.0%) | 40 (69.0%) |
Production, Transportation and Moving Occupations
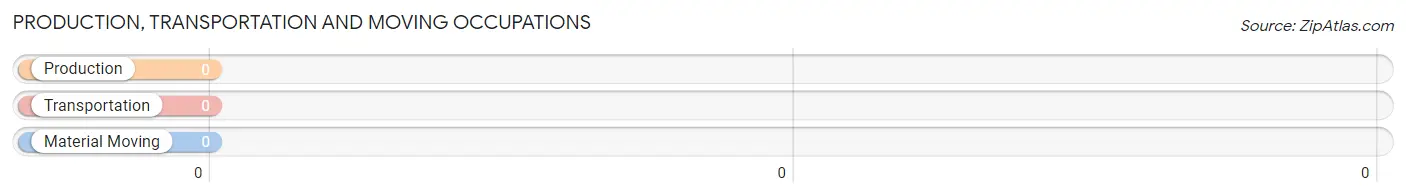
Production, Transportation and Moving Occupations by Sex
| Occupation | Male | Female |
| Production | 0 (0.0%) | 0 (0.0%) |
| Transportation | 0 (0.0%) | 0 (0.0%) |
| Material Moving | 0 (0.0%) | 0 (0.0%) |
| Total (Category) | 0 (0.0%) | 0 (0.0%) |
| Total (Overall) | 18 (31.0%) | 40 (69.0%) |
Employment Industries by Sex in Huslia
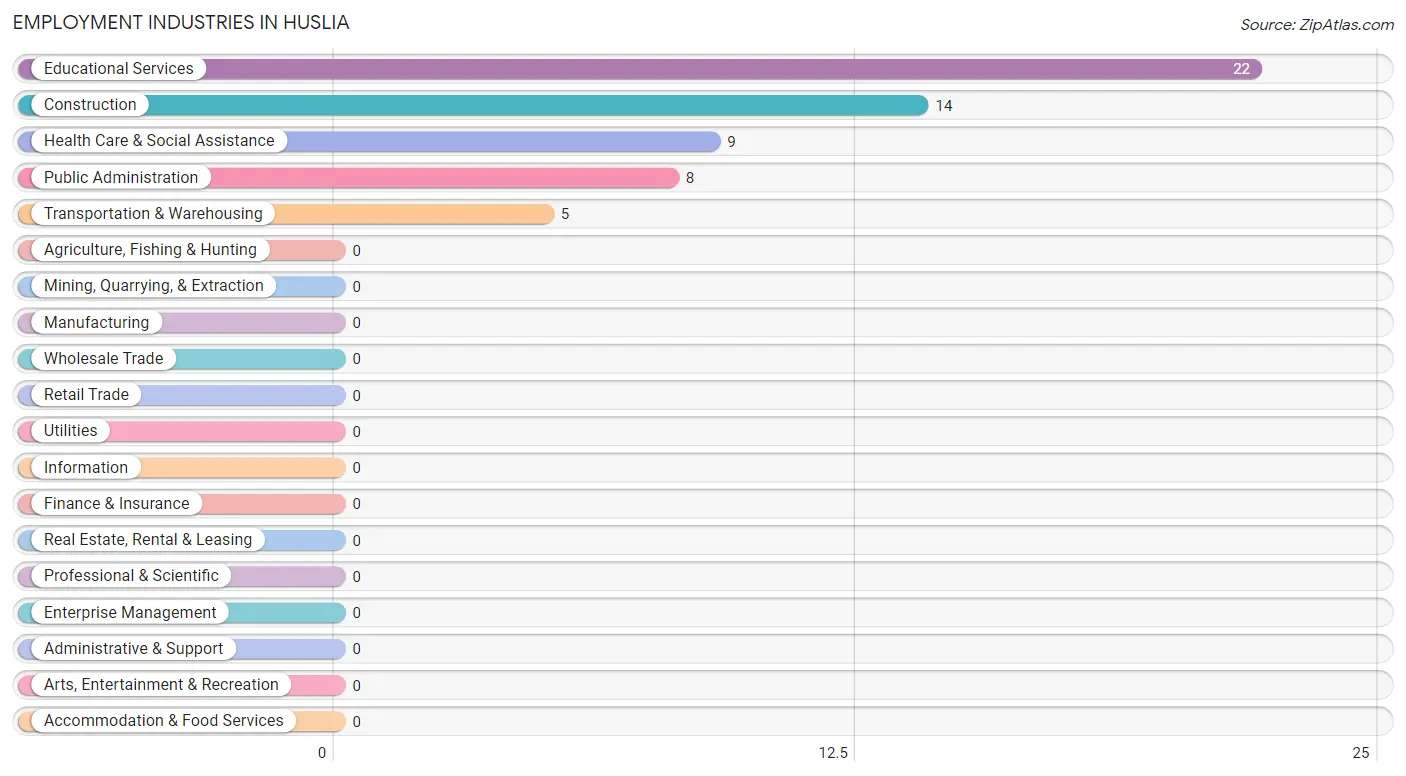
Employment Industries in Huslia
The major employment industries in Huslia include Educational Services (22 | 37.9%), Construction (14 | 24.1%), Health Care & Social Assistance (9 | 15.5%), Public Administration (8 | 13.8%), and Transportation & Warehousing (5 | 8.6%).
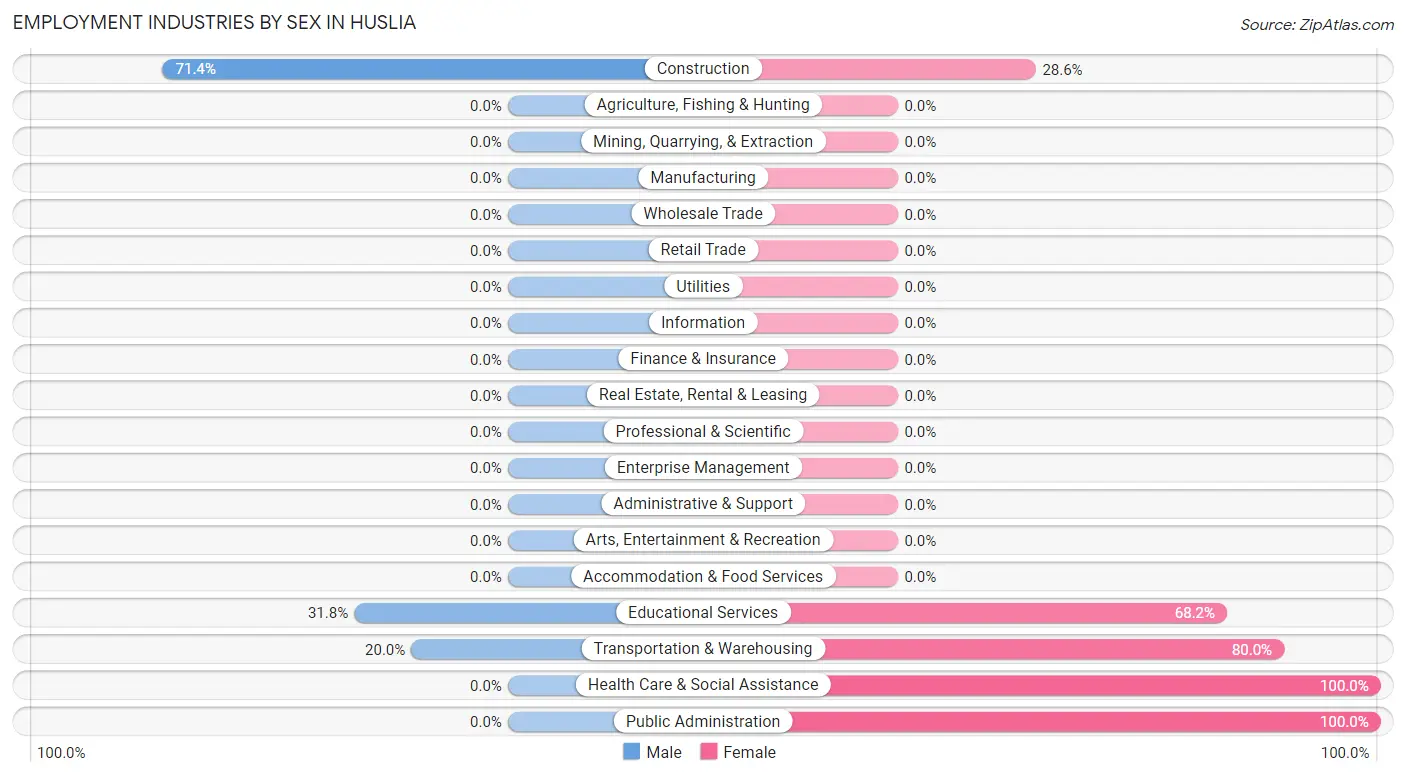
Employment Industries by Sex in Huslia
The Huslia industries that see more men than women are Construction (71.4%), Educational Services (31.8%), and Transportation & Warehousing (20.0%), whereas the industries that tend to have a higher number of women are Health Care & Social Assistance (100.0%), Public Administration (100.0%), and Transportation & Warehousing (80.0%).
| Industry | Male | Female |
| Agriculture, Fishing & Hunting | 0 (0.0%) | 0 (0.0%) |
| Mining, Quarrying, & Extraction | 0 (0.0%) | 0 (0.0%) |
| Construction | 10 (71.4%) | 4 (28.6%) |
| Manufacturing | 0 (0.0%) | 0 (0.0%) |
| Wholesale Trade | 0 (0.0%) | 0 (0.0%) |
| Retail Trade | 0 (0.0%) | 0 (0.0%) |
| Transportation & Warehousing | 1 (20.0%) | 4 (80.0%) |
| Utilities | 0 (0.0%) | 0 (0.0%) |
| Information | 0 (0.0%) | 0 (0.0%) |
| Finance & Insurance | 0 (0.0%) | 0 (0.0%) |
| Real Estate, Rental & Leasing | 0 (0.0%) | 0 (0.0%) |
| Professional & Scientific | 0 (0.0%) | 0 (0.0%) |
| Enterprise Management | 0 (0.0%) | 0 (0.0%) |
| Administrative & Support | 0 (0.0%) | 0 (0.0%) |
| Educational Services | 7 (31.8%) | 15 (68.2%) |
| Health Care & Social Assistance | 0 (0.0%) | 9 (100.0%) |
| Arts, Entertainment & Recreation | 0 (0.0%) | 0 (0.0%) |
| Accommodation & Food Services | 0 (0.0%) | 0 (0.0%) |
| Public Administration | 0 (0.0%) | 8 (100.0%) |
| Total | 18 (31.0%) | 40 (69.0%) |
Education in Huslia
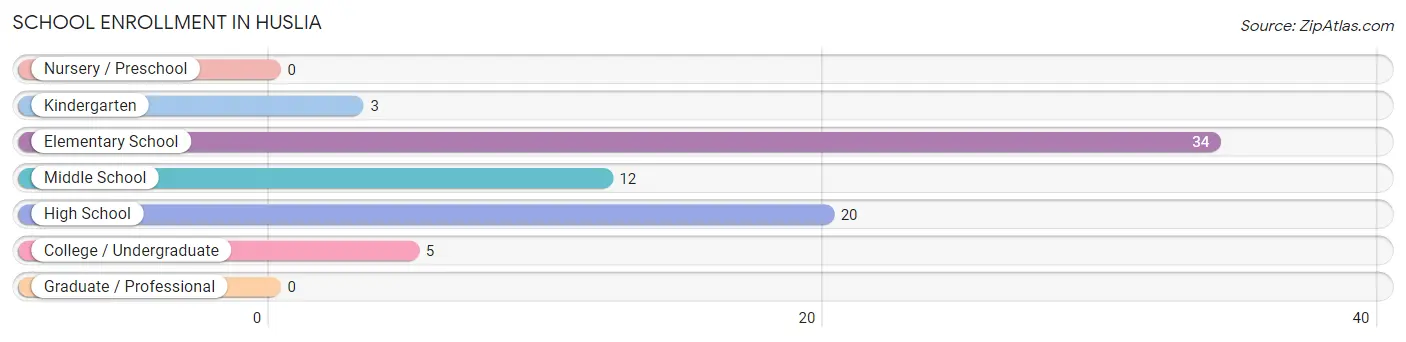
School Enrollment in Huslia
The most common levels of schooling among the 74 students in Huslia are elementary school (34 | 46.0%), high school (20 | 27.0%), and middle school (12 | 16.2%).
| School Level | # Students | % Students |
| Nursery / Preschool | 0 | 0.0% |
| Kindergarten | 3 | 4.1% |
| Elementary School | 34 | 46.0% |
| Middle School | 12 | 16.2% |
| High School | 20 | 27.0% |
| College / Undergraduate | 5 | 6.8% |
| Graduate / Professional | 0 | 0.0% |
| Total | 74 | 100.0% |
School Enrollment by Age by Funding Source in Huslia
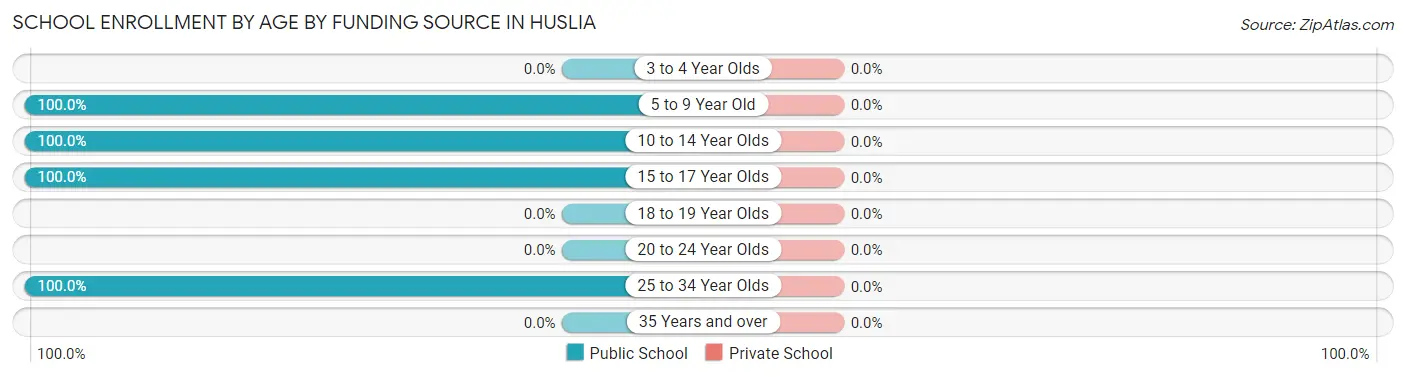
| Age Bracket | Public School | Private School |
| 3 to 4 Year Olds | 0 (0.0%) | 0 (0.0%) |
| 5 to 9 Year Old | 37 (100.0%) | 0 (0.0%) |
| 10 to 14 Year Olds | 16 (100.0%) | 0 (0.0%) |
| 15 to 17 Year Olds | 16 (100.0%) | 0 (0.0%) |
| 18 to 19 Year Olds | 0 (0.0%) | 0 (0.0%) |
| 20 to 24 Year Olds | 0 (0.0%) | 0 (0.0%) |
| 25 to 34 Year Olds | 5 (100.0%) | 0 (0.0%) |
| 35 Years and over | 0 (0.0%) | 0 (0.0%) |
| Total | 74 (100.0%) | 0 (0.0%) |
Educational Attainment by Field of Study in Huslia
Education (9 | 60.0%), science & technology (4 | 26.7%), and business (2 | 13.3%) are the most common fields of study among 15 individuals in Huslia who have obtained a bachelor's degree or higher.
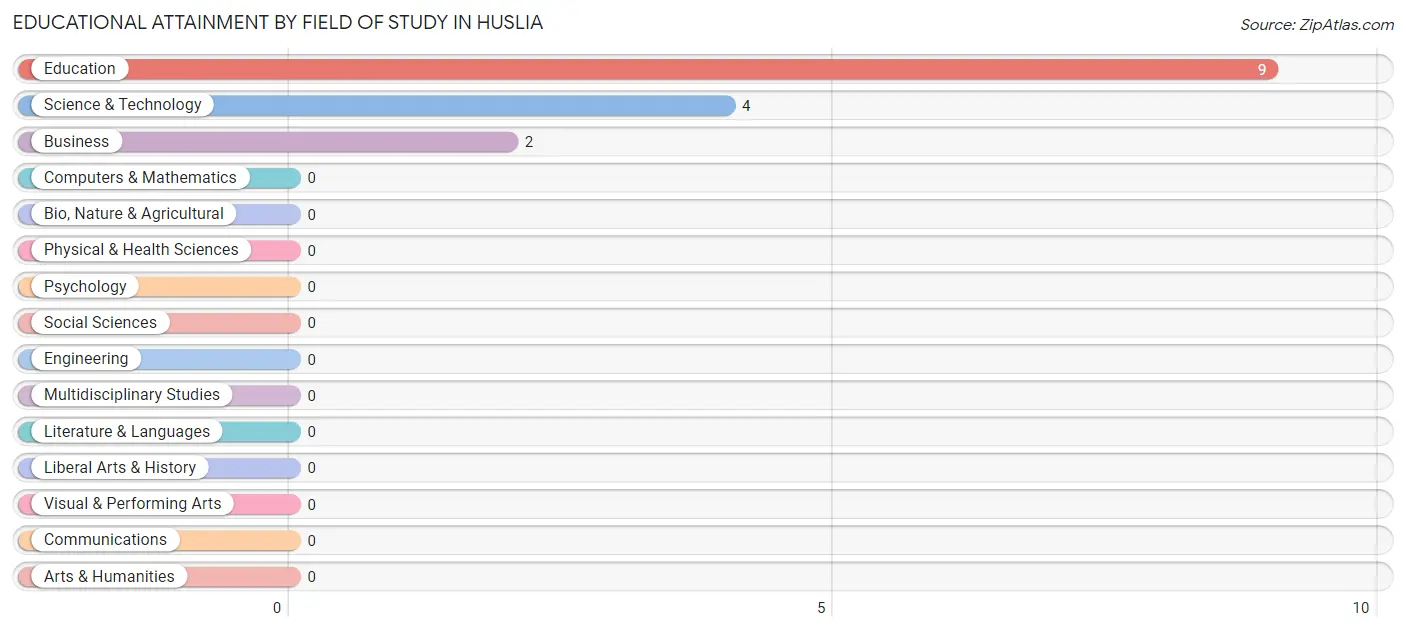
| Field of Study | # Graduates | % Graduates |
| Computers & Mathematics | 0 | 0.0% |
| Bio, Nature & Agricultural | 0 | 0.0% |
| Physical & Health Sciences | 0 | 0.0% |
| Psychology | 0 | 0.0% |
| Social Sciences | 0 | 0.0% |
| Engineering | 0 | 0.0% |
| Multidisciplinary Studies | 0 | 0.0% |
| Science & Technology | 4 | 26.7% |
| Business | 2 | 13.3% |
| Education | 9 | 60.0% |
| Literature & Languages | 0 | 0.0% |
| Liberal Arts & History | 0 | 0.0% |
| Visual & Performing Arts | 0 | 0.0% |
| Communications | 0 | 0.0% |
| Arts & Humanities | 0 | 0.0% |
| Total | 15 | 100.0% |
Transportation & Commute in Huslia
Vehicle Availability by Sex in Huslia
The most prevalent vehicle ownership categories in Huslia are males with no vehicle (7, accounting for 38.9%) and females with no vehicle (19, making up 17.9%).
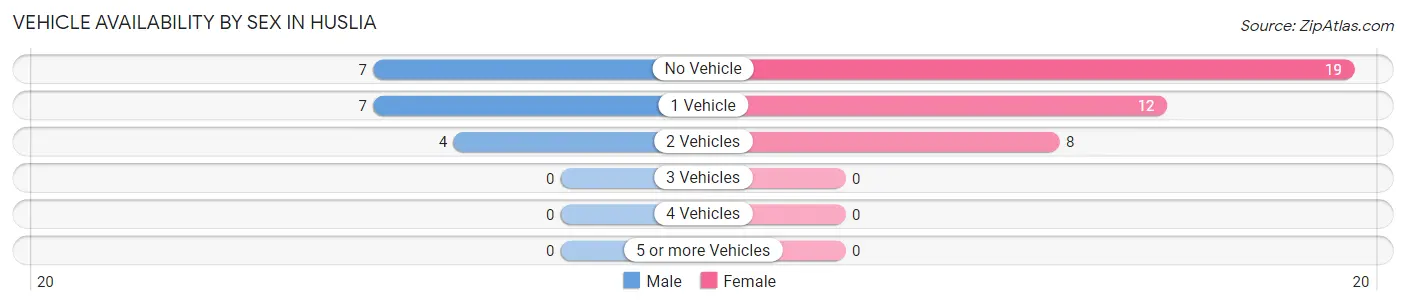
| Vehicles Available | Male | Female |
| No Vehicle | 7 (38.9%) | 19 (48.7%) |
| 1 Vehicle | 7 (38.9%) | 12 (30.8%) |
| 2 Vehicles | 4 (22.2%) | 8 (20.5%) |
| 3 Vehicles | 0 (0.0%) | 0 (0.0%) |
| 4 Vehicles | 0 (0.0%) | 0 (0.0%) |
| 5 or more Vehicles | 0 (0.0%) | 0 (0.0%) |
| Total | 18 (100.0%) | 39 (100.0%) |
Commute Time in Huslia
The most frequently occuring commute durations in Huslia are less than 5 minutes (22 commuters, 44.9%), 5 to 9 minutes (14 commuters, 28.6%), and 10 to 14 minutes (9 commuters, 18.4%).
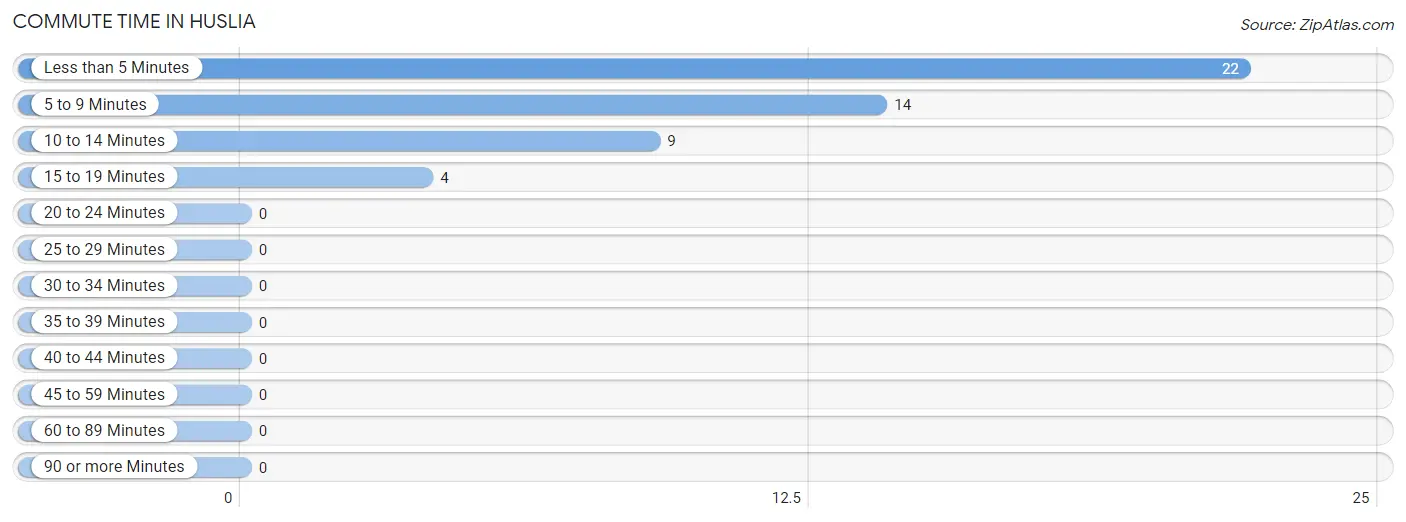
| Commute Time | # Commuters | % Commuters |
| Less than 5 Minutes | 22 | 44.9% |
| 5 to 9 Minutes | 14 | 28.6% |
| 10 to 14 Minutes | 9 | 18.4% |
| 15 to 19 Minutes | 4 | 8.2% |
| 20 to 24 Minutes | 0 | 0.0% |
| 25 to 29 Minutes | 0 | 0.0% |
| 30 to 34 Minutes | 0 | 0.0% |
| 35 to 39 Minutes | 0 | 0.0% |
| 40 to 44 Minutes | 0 | 0.0% |
| 45 to 59 Minutes | 0 | 0.0% |
| 60 to 89 Minutes | 0 | 0.0% |
| 90 or more Minutes | 0 | 0.0% |
Commute Time by Sex in Huslia
The most common commute times in Huslia are less than 5 minutes (9 commuters, 50.0%) for males and less than 5 minutes (13 commuters, 41.9%) for females.
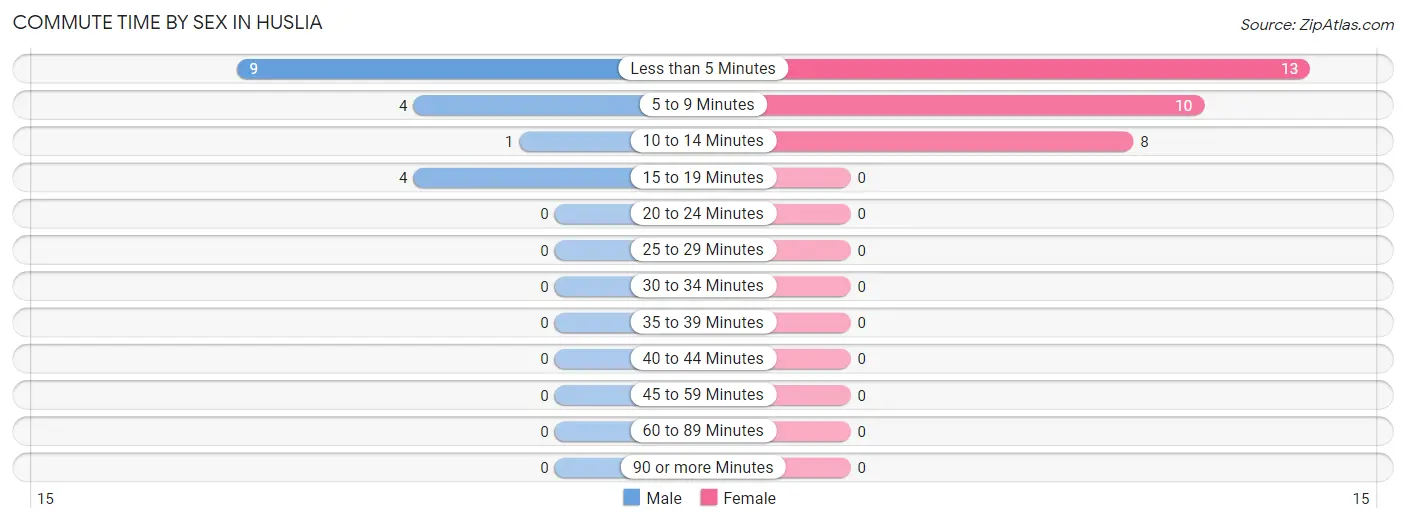
| Commute Time | Male | Female |
| Less than 5 Minutes | 9 (50.0%) | 13 (41.9%) |
| 5 to 9 Minutes | 4 (22.2%) | 10 (32.3%) |
| 10 to 14 Minutes | 1 (5.6%) | 8 (25.8%) |
| 15 to 19 Minutes | 4 (22.2%) | 0 (0.0%) |
| 20 to 24 Minutes | 0 (0.0%) | 0 (0.0%) |
| 25 to 29 Minutes | 0 (0.0%) | 0 (0.0%) |
| 30 to 34 Minutes | 0 (0.0%) | 0 (0.0%) |
| 35 to 39 Minutes | 0 (0.0%) | 0 (0.0%) |
| 40 to 44 Minutes | 0 (0.0%) | 0 (0.0%) |
| 45 to 59 Minutes | 0 (0.0%) | 0 (0.0%) |
| 60 to 89 Minutes | 0 (0.0%) | 0 (0.0%) |
| 90 or more Minutes | 0 (0.0%) | 0 (0.0%) |
Time of Departure to Work by Sex in Huslia
The most frequent times of departure to work in Huslia are 8:30 AM to 8:59 AM (5, 27.8%) for males and 8:30 AM to 8:59 AM (9, 29.0%) for females.
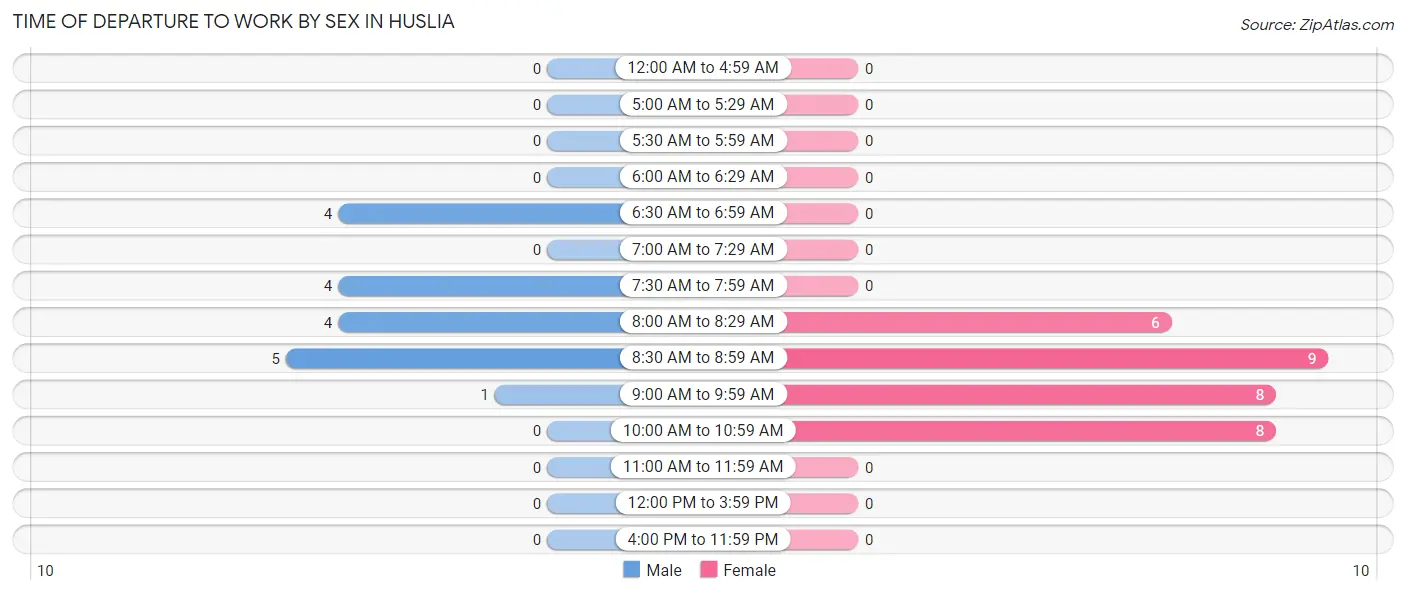
| Time of Departure | Male | Female |
| 12:00 AM to 4:59 AM | 0 (0.0%) | 0 (0.0%) |
| 5:00 AM to 5:29 AM | 0 (0.0%) | 0 (0.0%) |
| 5:30 AM to 5:59 AM | 0 (0.0%) | 0 (0.0%) |
| 6:00 AM to 6:29 AM | 0 (0.0%) | 0 (0.0%) |
| 6:30 AM to 6:59 AM | 4 (22.2%) | 0 (0.0%) |
| 7:00 AM to 7:29 AM | 0 (0.0%) | 0 (0.0%) |
| 7:30 AM to 7:59 AM | 4 (22.2%) | 0 (0.0%) |
| 8:00 AM to 8:29 AM | 4 (22.2%) | 6 (19.4%) |
| 8:30 AM to 8:59 AM | 5 (27.8%) | 9 (29.0%) |
| 9:00 AM to 9:59 AM | 1 (5.6%) | 8 (25.8%) |
| 10:00 AM to 10:59 AM | 0 (0.0%) | 8 (25.8%) |
| 11:00 AM to 11:59 AM | 0 (0.0%) | 0 (0.0%) |
| 12:00 PM to 3:59 PM | 0 (0.0%) | 0 (0.0%) |
| 4:00 PM to 11:59 PM | 0 (0.0%) | 0 (0.0%) |
| Total | 18 (100.0%) | 31 (100.0%) |
Housing Occupancy in Huslia
Occupancy by Ownership in Huslia
Of the total 63 dwellings in Huslia, owner-occupied units account for 53 (84.1%), while renter-occupied units make up 10 (15.9%).
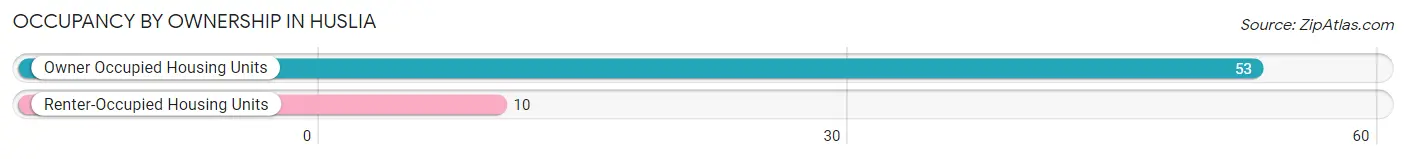
| Occupancy | # Housing Units | % Housing Units |
| Owner Occupied Housing Units | 53 | 84.1% |
| Renter-Occupied Housing Units | 10 | 15.9% |
| Total Occupied Housing Units | 63 | 100.0% |
Occupancy by Household Size in Huslia
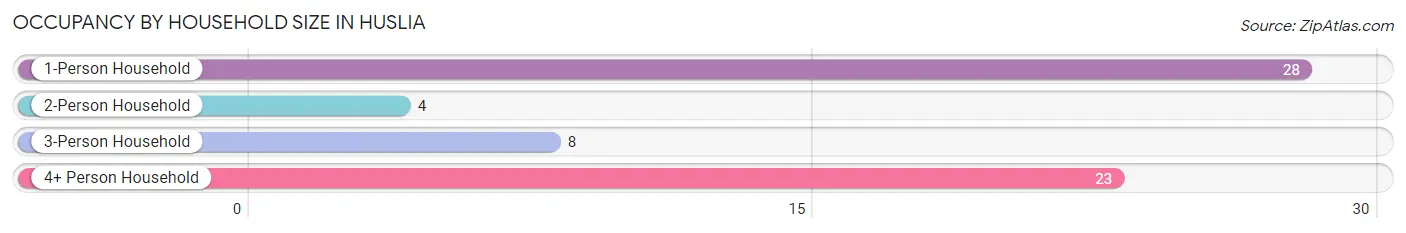
| Household Size | # Housing Units | % Housing Units |
| 1-Person Household | 28 | 44.4% |
| 2-Person Household | 4 | 6.4% |
| 3-Person Household | 8 | 12.7% |
| 4+ Person Household | 23 | 36.5% |
| Total Housing Units | 63 | 100.0% |
Occupancy by Ownership by Household Size in Huslia

| Household Size | Owner-occupied | Renter-occupied |
| 1-Person Household | 22 (78.6%) | 6 (21.4%) |
| 2-Person Household | 4 (100.0%) | 0 (0.0%) |
| 3-Person Household | 8 (100.0%) | 0 (0.0%) |
| 4+ Person Household | 19 (82.6%) | 4 (17.4%) |
| Total Housing Units | 53 (84.1%) | 10 (15.9%) |
Occupancy by Educational Attainment in Huslia
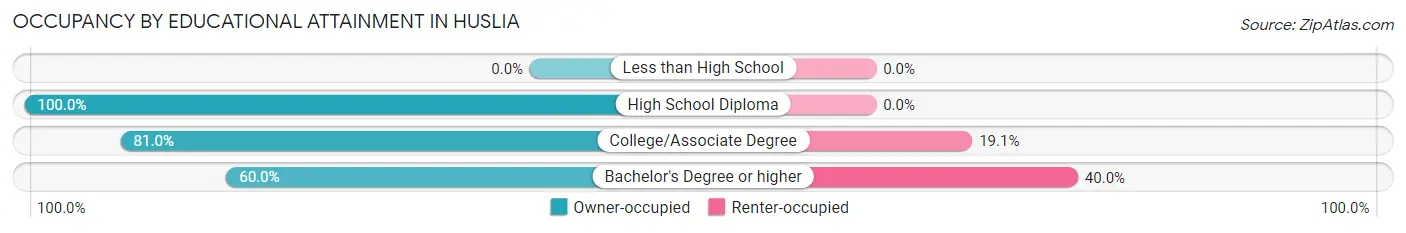
| Household Size | Owner-occupied | Renter-occupied |
| Less than High School | 0 (0.0%) | 0 (0.0%) |
| High School Diploma | 27 (100.0%) | 0 (0.0%) |
| College/Associate Degree | 17 (80.9%) | 4 (19.1%) |
| Bachelor's Degree or higher | 9 (60.0%) | 6 (40.0%) |
Occupancy by Age of Householder in Huslia
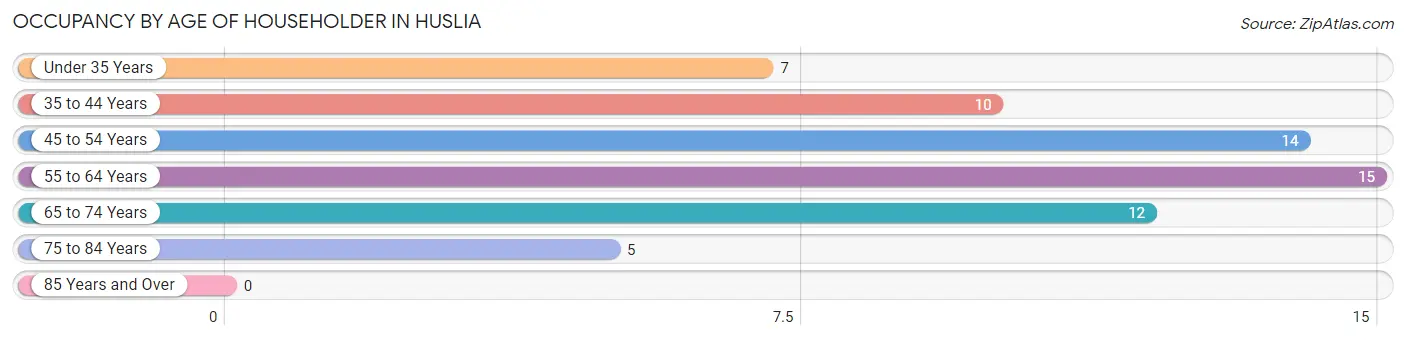
| Age Bracket | # Households | % Households |
| Under 35 Years | 7 | 11.1% |
| 35 to 44 Years | 10 | 15.9% |
| 45 to 54 Years | 14 | 22.2% |
| 55 to 64 Years | 15 | 23.8% |
| 65 to 74 Years | 12 | 19.1% |
| 75 to 84 Years | 5 | 7.9% |
| 85 Years and Over | 0 | 0.0% |
| Total | 63 | 100.0% |
Housing Finances in Huslia
Median Income by Occupancy in Huslia
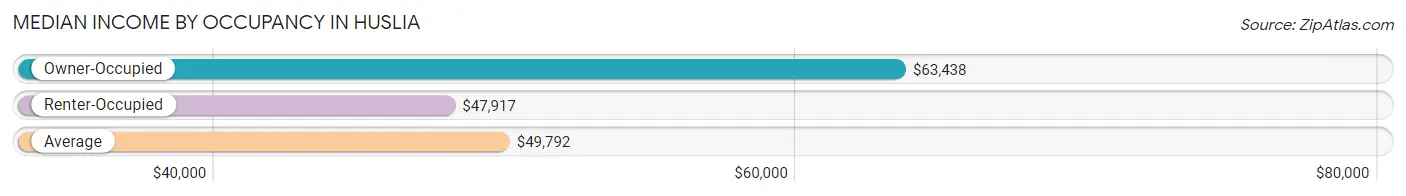
| Occupancy Type | # Households | Median Income |
| Owner-Occupied | 53 (84.1%) | $63,438 |
| Renter-Occupied | 10 (15.9%) | $47,917 |
| Average | 63 (100.0%) | $49,792 |
Occupancy by Householder Income Bracket in Huslia
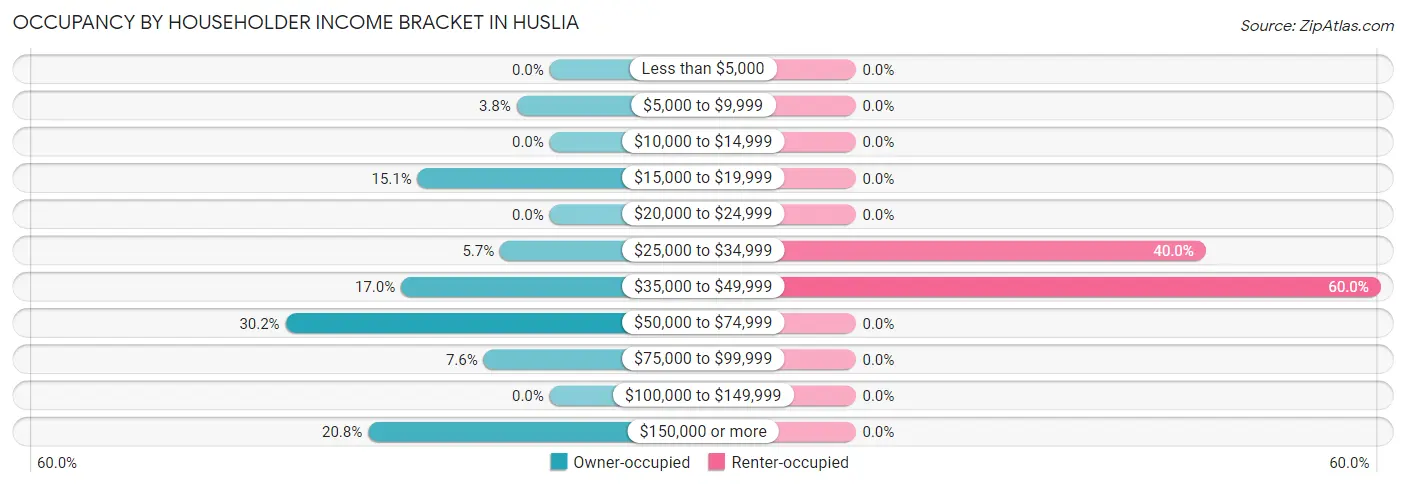
| Income Bracket | Owner-occupied | Renter-occupied |
| Less than $5,000 | 0 (0.0%) | 0 (0.0%) |
| $5,000 to $9,999 | 2 (3.8%) | 0 (0.0%) |
| $10,000 to $14,999 | 0 (0.0%) | 0 (0.0%) |
| $15,000 to $19,999 | 8 (15.1%) | 0 (0.0%) |
| $20,000 to $24,999 | 0 (0.0%) | 0 (0.0%) |
| $25,000 to $34,999 | 3 (5.7%) | 4 (40.0%) |
| $35,000 to $49,999 | 9 (17.0%) | 6 (60.0%) |
| $50,000 to $74,999 | 16 (30.2%) | 0 (0.0%) |
| $75,000 to $99,999 | 4 (7.5%) | 0 (0.0%) |
| $100,000 to $149,999 | 0 (0.0%) | 0 (0.0%) |
| $150,000 or more | 11 (20.7%) | 0 (0.0%) |
| Total | 53 (100.0%) | 10 (100.0%) |
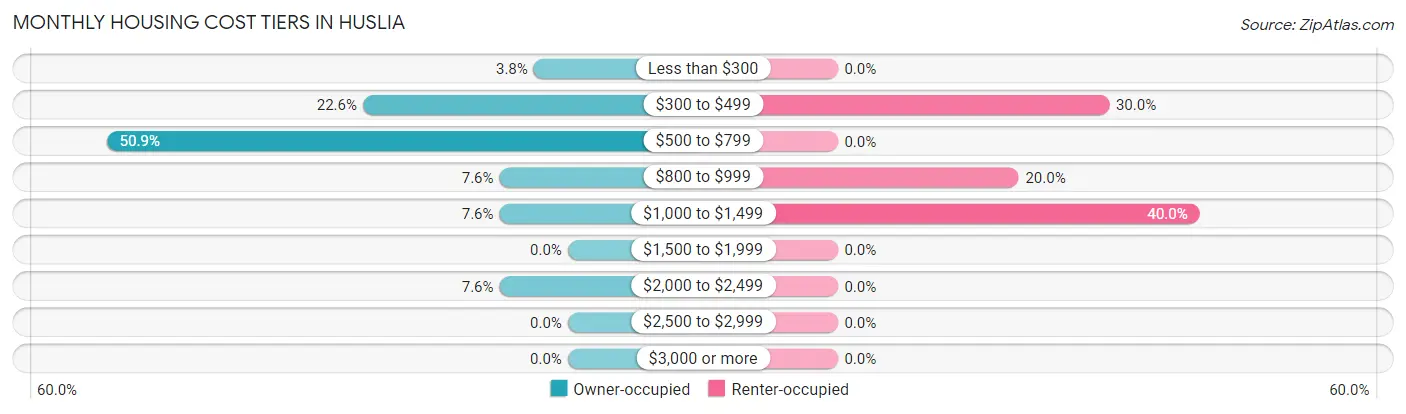
Monthly Housing Cost Tiers in Huslia
| Monthly Cost | Owner-occupied | Renter-occupied |
| Less than $300 | 2 (3.8%) | 0 (0.0%) |
| $300 to $499 | 12 (22.6%) | 3 (30.0%) |
| $500 to $799 | 27 (50.9%) | 0 (0.0%) |
| $800 to $999 | 4 (7.5%) | 2 (20.0%) |
| $1,000 to $1,499 | 4 (7.5%) | 4 (40.0%) |
| $1,500 to $1,999 | 0 (0.0%) | 0 (0.0%) |
| $2,000 to $2,499 | 4 (7.5%) | 0 (0.0%) |
| $2,500 to $2,999 | 0 (0.0%) | 0 (0.0%) |
| $3,000 or more | 0 (0.0%) | 0 (0.0%) |
| Total | 53 (100.0%) | 10 (100.0%) |
Physical Housing Characteristics in Huslia
Housing Structures in Huslia
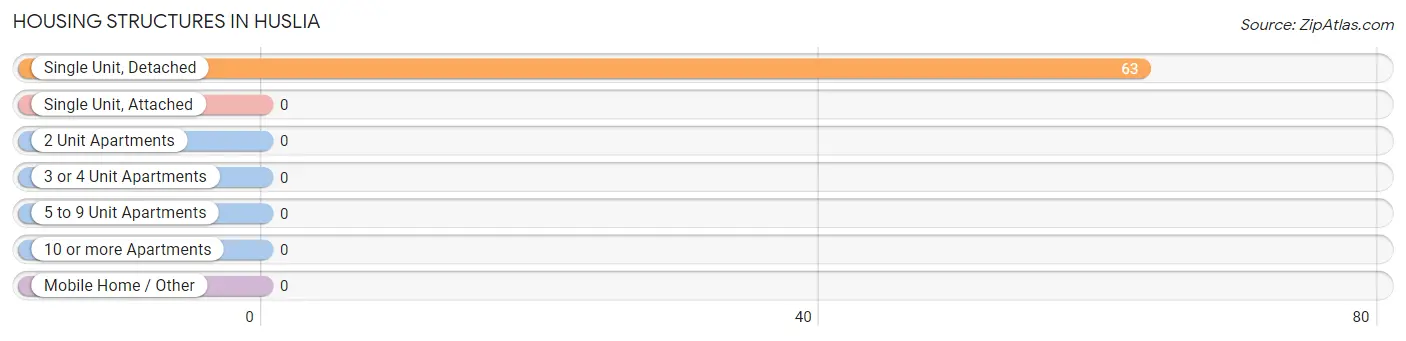
| Structure Type | # Housing Units | % Housing Units |
| Single Unit, Detached | 63 | 100.0% |
| Single Unit, Attached | 0 | 0.0% |
| 2 Unit Apartments | 0 | 0.0% |
| 3 or 4 Unit Apartments | 0 | 0.0% |
| 5 to 9 Unit Apartments | 0 | 0.0% |
| 10 or more Apartments | 0 | 0.0% |
| Mobile Home / Other | 0 | 0.0% |
| Total | 63 | 100.0% |
Housing Structures by Occupancy in Huslia
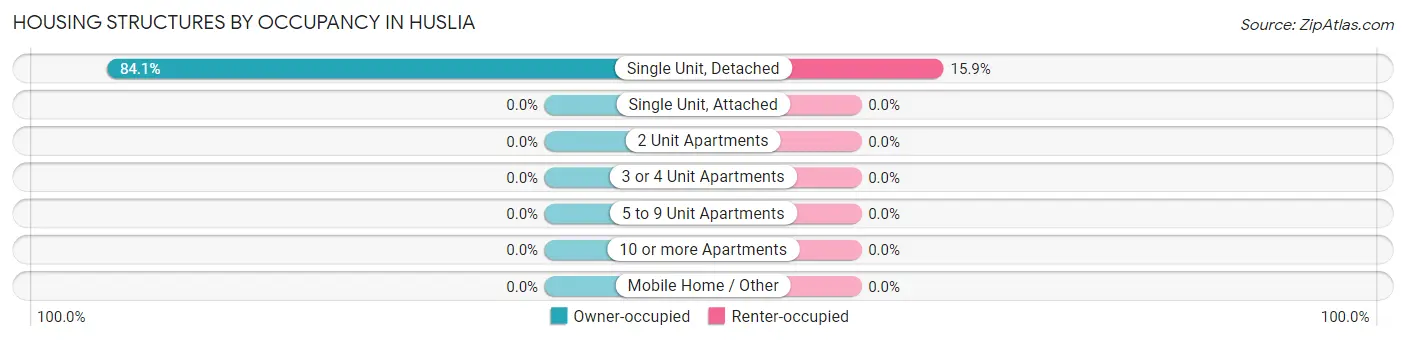
| Structure Type | Owner-occupied | Renter-occupied |
| Single Unit, Detached | 53 (84.1%) | 10 (15.9%) |
| Single Unit, Attached | 0 (0.0%) | 0 (0.0%) |
| 2 Unit Apartments | 0 (0.0%) | 0 (0.0%) |
| 3 or 4 Unit Apartments | 0 (0.0%) | 0 (0.0%) |
| 5 to 9 Unit Apartments | 0 (0.0%) | 0 (0.0%) |
| 10 or more Apartments | 0 (0.0%) | 0 (0.0%) |
| Mobile Home / Other | 0 (0.0%) | 0 (0.0%) |
| Total | 53 (84.1%) | 10 (15.9%) |
Housing Structures by Number of Rooms in Huslia
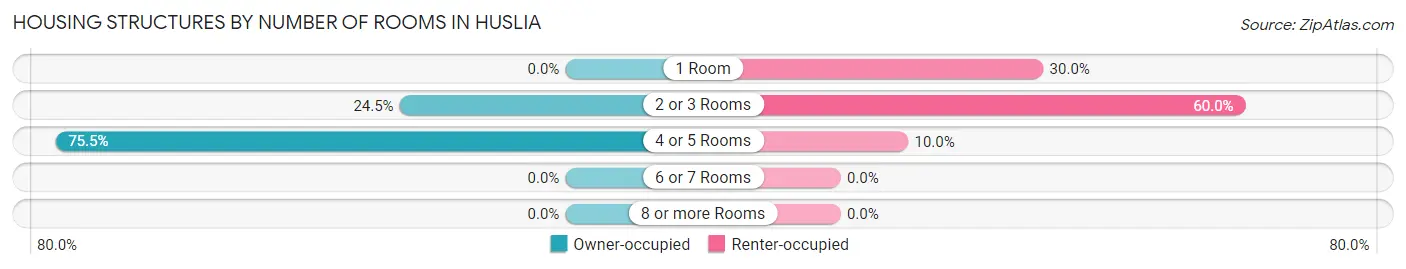
| Number of Rooms | Owner-occupied | Renter-occupied |
| 1 Room | 0 (0.0%) | 3 (30.0%) |
| 2 or 3 Rooms | 13 (24.5%) | 6 (60.0%) |
| 4 or 5 Rooms | 40 (75.5%) | 1 (10.0%) |
| 6 or 7 Rooms | 0 (0.0%) | 0 (0.0%) |
| 8 or more Rooms | 0 (0.0%) | 0 (0.0%) |
| Total | 53 (100.0%) | 10 (100.0%) |
Housing Structure by Heating Type in Huslia
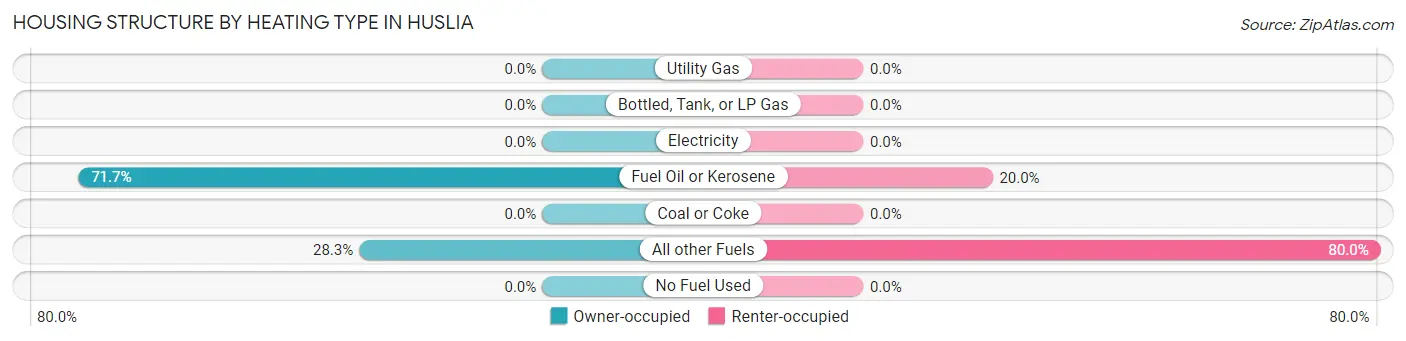
| Heating Type | Owner-occupied | Renter-occupied |
| Utility Gas | 0 (0.0%) | 0 (0.0%) |
| Bottled, Tank, or LP Gas | 0 (0.0%) | 0 (0.0%) |
| Electricity | 0 (0.0%) | 0 (0.0%) |
| Fuel Oil or Kerosene | 38 (71.7%) | 2 (20.0%) |
| Coal or Coke | 0 (0.0%) | 0 (0.0%) |
| All other Fuels | 15 (28.3%) | 8 (80.0%) |
| No Fuel Used | 0 (0.0%) | 0 (0.0%) |
| Total | 53 (100.0%) | 10 (100.0%) |
Household Vehicle Usage in Huslia
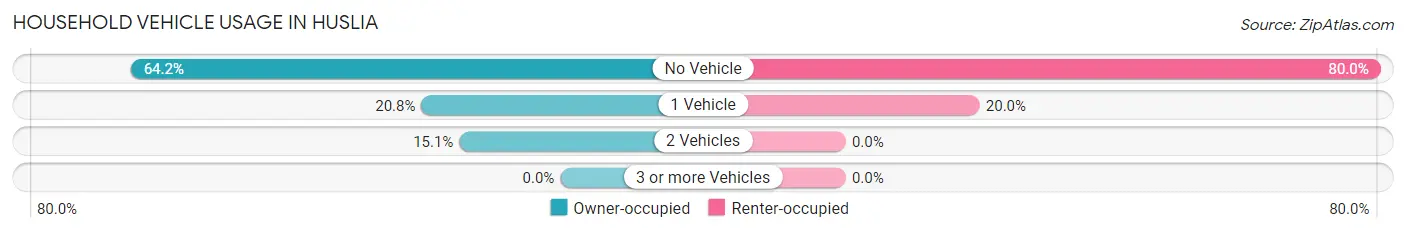
| Vehicles per Household | Owner-occupied | Renter-occupied |
| No Vehicle | 34 (64.1%) | 8 (80.0%) |
| 1 Vehicle | 11 (20.7%) | 2 (20.0%) |
| 2 Vehicles | 8 (15.1%) | 0 (0.0%) |
| 3 or more Vehicles | 0 (0.0%) | 0 (0.0%) |
| Total | 53 (100.0%) | 10 (100.0%) |
Real Estate & Mortgages in Huslia
Real Estate and Mortgage Overview in Huslia
| Characteristic | Without Mortgage | With Mortgage |
| Housing Units | 45 | 8 |
| Median Property Value | - | - |
| Median Household Income | $63,438 | $0 |
| Monthly Housing Costs | $547 | $0 |
| Real Estate Taxes | - | - |
Property Value by Mortgage Status in Huslia
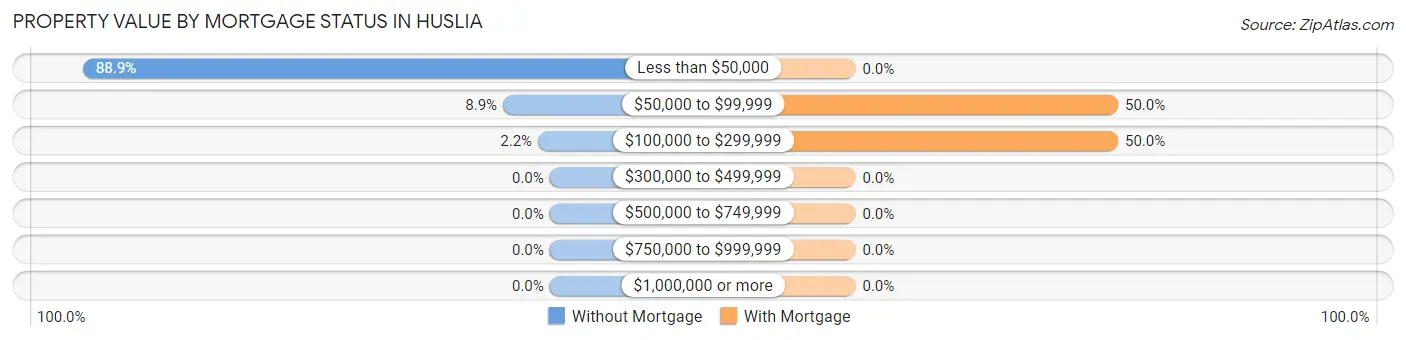
| Property Value | Without Mortgage | With Mortgage |
| Less than $50,000 | 40 (88.9%) | 0 (0.0%) |
| $50,000 to $99,999 | 4 (8.9%) | 4 (50.0%) |
| $100,000 to $299,999 | 1 (2.2%) | 4 (50.0%) |
| $300,000 to $499,999 | 0 (0.0%) | 0 (0.0%) |
| $500,000 to $749,999 | 0 (0.0%) | 0 (0.0%) |
| $750,000 to $999,999 | 0 (0.0%) | 0 (0.0%) |
| $1,000,000 or more | 0 (0.0%) | 0 (0.0%) |
| Total | 45 (100.0%) | 8 (100.0%) |
Household Income by Mortgage Status in Huslia
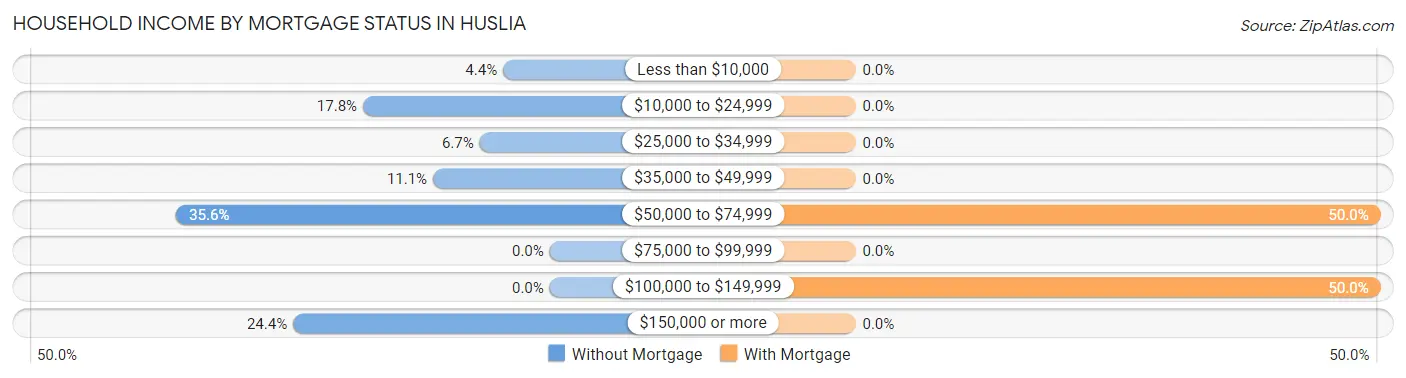
| Household Income | Without Mortgage | With Mortgage |
| Less than $10,000 | 2 (4.4%) | 0 (0.0%) |
| $10,000 to $24,999 | 8 (17.8%) | 0 (0.0%) |
| $25,000 to $34,999 | 3 (6.7%) | 0 (0.0%) |
| $35,000 to $49,999 | 5 (11.1%) | 0 (0.0%) |
| $50,000 to $74,999 | 16 (35.6%) | 4 (50.0%) |
| $75,000 to $99,999 | 0 (0.0%) | 0 (0.0%) |
| $100,000 to $149,999 | 0 (0.0%) | 4 (50.0%) |
| $150,000 or more | 11 (24.4%) | 0 (0.0%) |
| Total | 45 (100.0%) | 8 (100.0%) |
Property Value to Household Income Ratio in Huslia
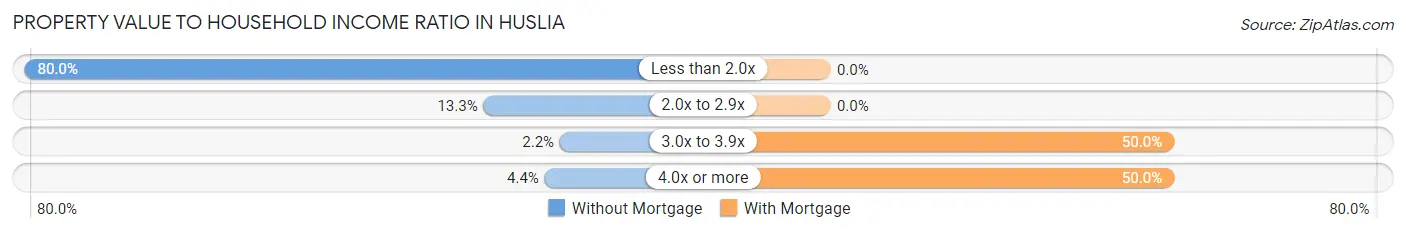
| Value-to-Income Ratio | Without Mortgage | With Mortgage |
| Less than 2.0x | 36 (80.0%) | 0 (0.0%) |
| 2.0x to 2.9x | 6 (13.3%) | 0 (0.0%) |
| 3.0x to 3.9x | 1 (2.2%) | 4 (50.0%) |
| 4.0x or more | 2 (4.4%) | 4 (50.0%) |
| Total | 45 (100.0%) | 8 (100.0%) |
Real Estate Taxes by Mortgage Status in Huslia
| Property Taxes | Without Mortgage | With Mortgage |
| Less than $800 | 0 (0.0%) | 0 (0.0%) |
| $800 to $1,499 | 0 (0.0%) | 0 (0.0%) |
| $800 to $1,499 | 0 (0.0%) | 0 (0.0%) |
| Total | 45 (100.0%) | 8 (100.0%) |
Health & Disability in Huslia
Health Insurance Coverage by Age in Huslia
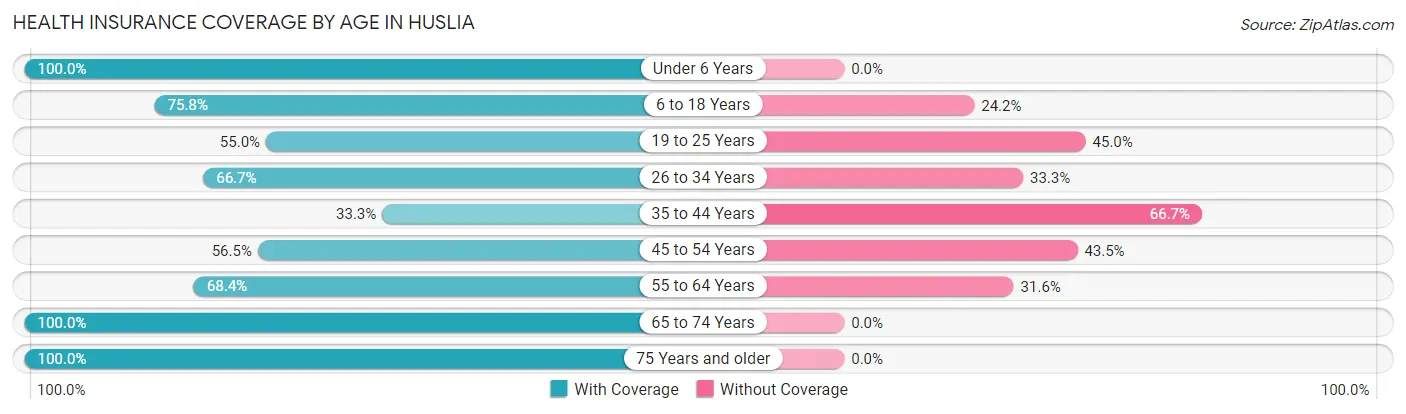
| Age Bracket | With Coverage | Without Coverage |
| Under 6 Years | 10 (100.0%) | 0 (0.0%) |
| 6 to 18 Years | 50 (75.8%) | 16 (24.2%) |
| 19 to 25 Years | 11 (55.0%) | 9 (45.0%) |
| 26 to 34 Years | 8 (66.7%) | 4 (33.3%) |
| 35 to 44 Years | 5 (33.3%) | 10 (66.7%) |
| 45 to 54 Years | 13 (56.5%) | 10 (43.5%) |
| 55 to 64 Years | 13 (68.4%) | 6 (31.6%) |
| 65 to 74 Years | 12 (100.0%) | 0 (0.0%) |
| 75 Years and older | 5 (100.0%) | 0 (0.0%) |
| Total | 127 (69.8%) | 55 (30.2%) |
Health Insurance Coverage by Citizenship Status in Huslia
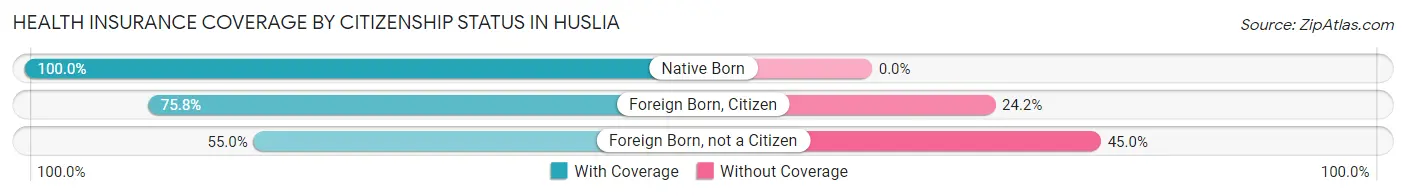
| Citizenship Status | With Coverage | Without Coverage |
| Native Born | 10 (100.0%) | 0 (0.0%) |
| Foreign Born, Citizen | 50 (75.8%) | 16 (24.2%) |
| Foreign Born, not a Citizen | 11 (55.0%) | 9 (45.0%) |
Health Insurance Coverage by Household Income in Huslia
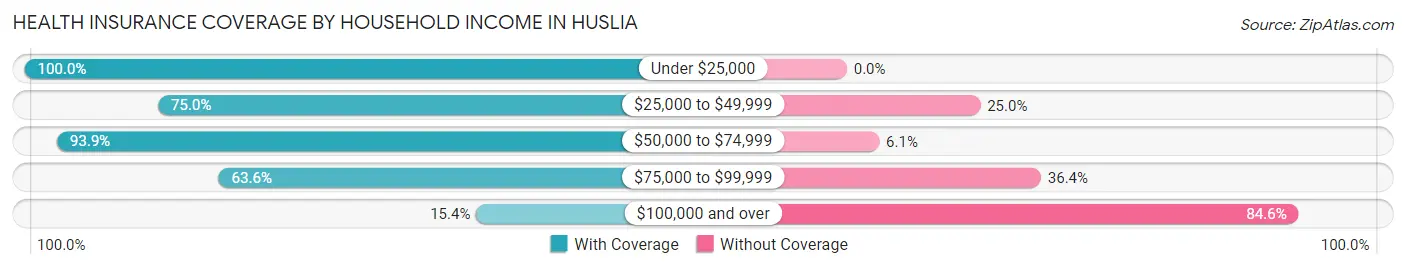
| Household Income | With Coverage | Without Coverage |
| Under $25,000 | 10 (100.0%) | 0 (0.0%) |
| $25,000 to $49,999 | 42 (75.0%) | 14 (25.0%) |
| $50,000 to $74,999 | 62 (93.9%) | 4 (6.1%) |
| $75,000 to $99,999 | 7 (63.6%) | 4 (36.4%) |
| $100,000 and over | 6 (15.4%) | 33 (84.6%) |
Public vs Private Health Insurance Coverage by Age in Huslia
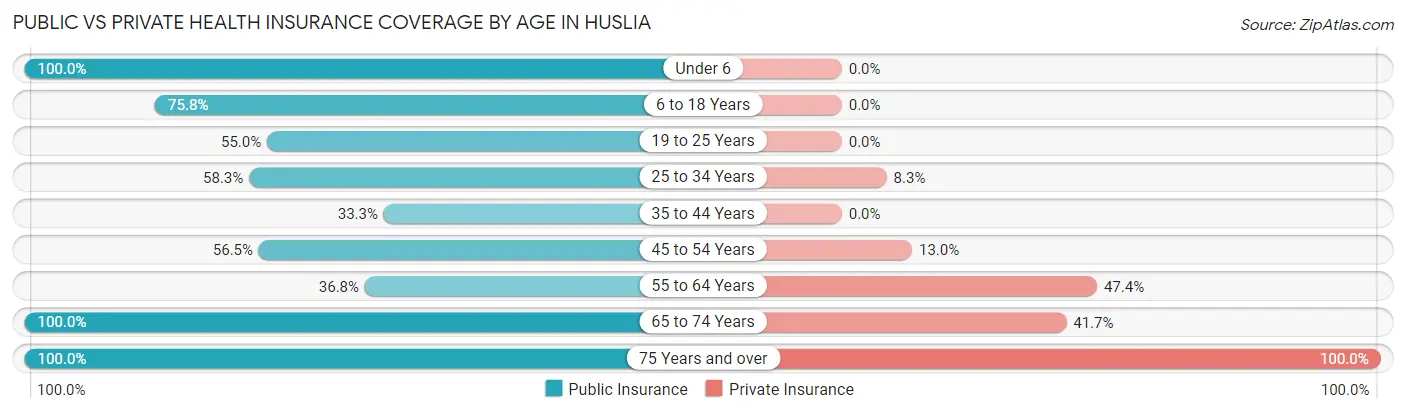
| Age Bracket | Public Insurance | Private Insurance |
| Under 6 | 10 (100.0%) | 0 (0.0%) |
| 6 to 18 Years | 50 (75.8%) | 0 (0.0%) |
| 19 to 25 Years | 11 (55.0%) | 0 (0.0%) |
| 25 to 34 Years | 7 (58.3%) | 1 (8.3%) |
| 35 to 44 Years | 5 (33.3%) | 0 (0.0%) |
| 45 to 54 Years | 13 (56.5%) | 3 (13.0%) |
| 55 to 64 Years | 7 (36.8%) | 9 (47.4%) |
| 65 to 74 Years | 12 (100.0%) | 5 (41.7%) |
| 75 Years and over | 5 (100.0%) | 5 (100.0%) |
| Total | 120 (65.9%) | 23 (12.6%) |
Disability Status by Sex by Age in Huslia
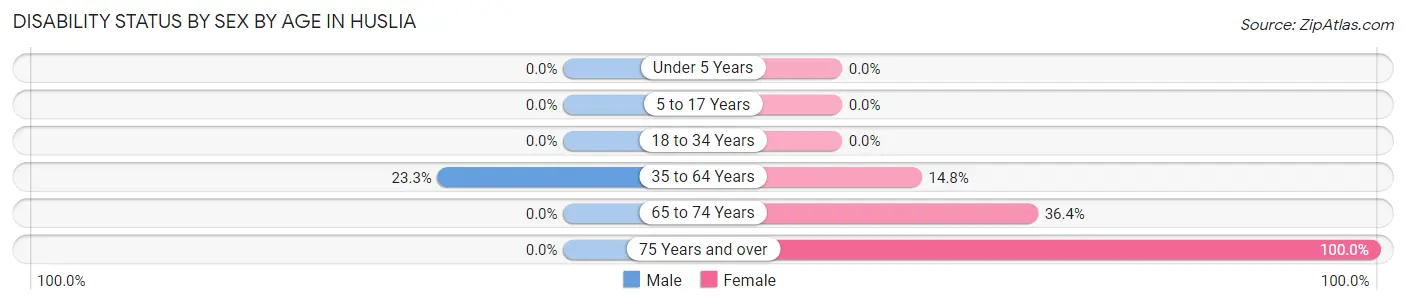
| Age Bracket | Male | Female |
| Under 5 Years | 0 (0.0%) | 0 (0.0%) |
| 5 to 17 Years | 0 (0.0%) | 0 (0.0%) |
| 18 to 34 Years | 0 (0.0%) | 0 (0.0%) |
| 35 to 64 Years | 7 (23.3%) | 4 (14.8%) |
| 65 to 74 Years | 0 (0.0%) | 4 (36.4%) |
| 75 Years and over | 0 (0.0%) | 5 (100.0%) |
Disability Class by Sex by Age in Huslia
Disability Class: Hearing Difficulty
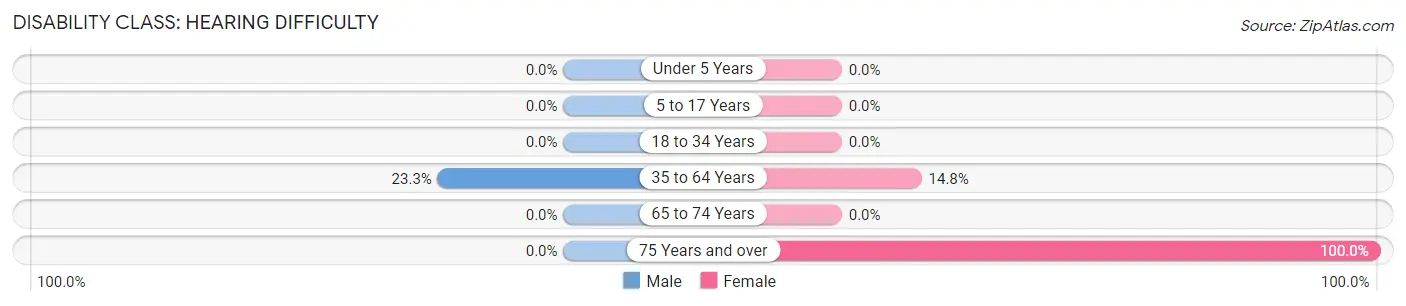
| Age Bracket | Male | Female |
| Under 5 Years | 0 (0.0%) | 0 (0.0%) |
| 5 to 17 Years | 0 (0.0%) | 0 (0.0%) |
| 18 to 34 Years | 0 (0.0%) | 0 (0.0%) |
| 35 to 64 Years | 7 (23.3%) | 4 (14.8%) |
| 65 to 74 Years | 0 (0.0%) | 0 (0.0%) |
| 75 Years and over | 0 (0.0%) | 5 (100.0%) |
Disability Class: Vision Difficulty
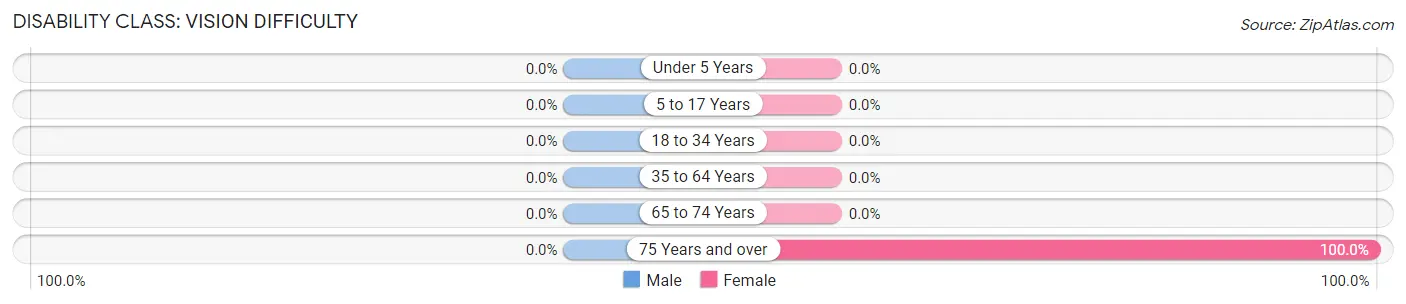
| Age Bracket | Male | Female |
| Under 5 Years | 0 (0.0%) | 0 (0.0%) |
| 5 to 17 Years | 0 (0.0%) | 0 (0.0%) |
| 18 to 34 Years | 0 (0.0%) | 0 (0.0%) |
| 35 to 64 Years | 0 (0.0%) | 0 (0.0%) |
| 65 to 74 Years | 0 (0.0%) | 0 (0.0%) |
| 75 Years and over | 0 (0.0%) | 5 (100.0%) |
Disability Class: Cognitive Difficulty
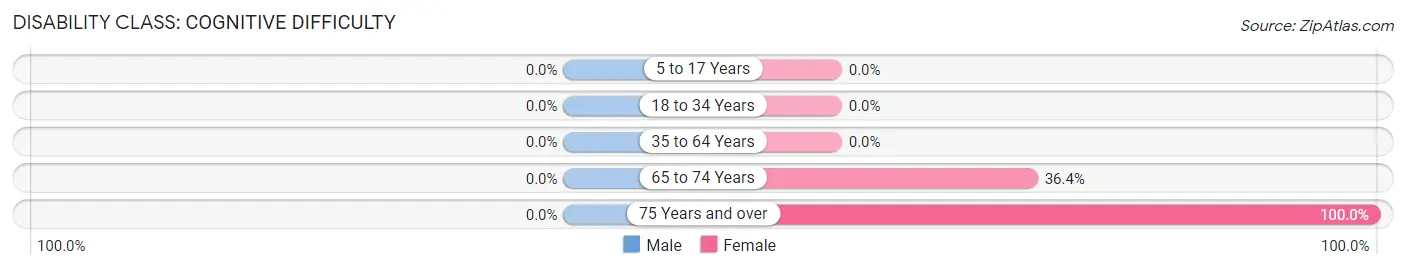
| Age Bracket | Male | Female |
| 5 to 17 Years | 0 (0.0%) | 0 (0.0%) |
| 18 to 34 Years | 0 (0.0%) | 0 (0.0%) |
| 35 to 64 Years | 0 (0.0%) | 0 (0.0%) |
| 65 to 74 Years | 0 (0.0%) | 4 (36.4%) |
| 75 Years and over | 0 (0.0%) | 5 (100.0%) |
Disability Class: Ambulatory Difficulty
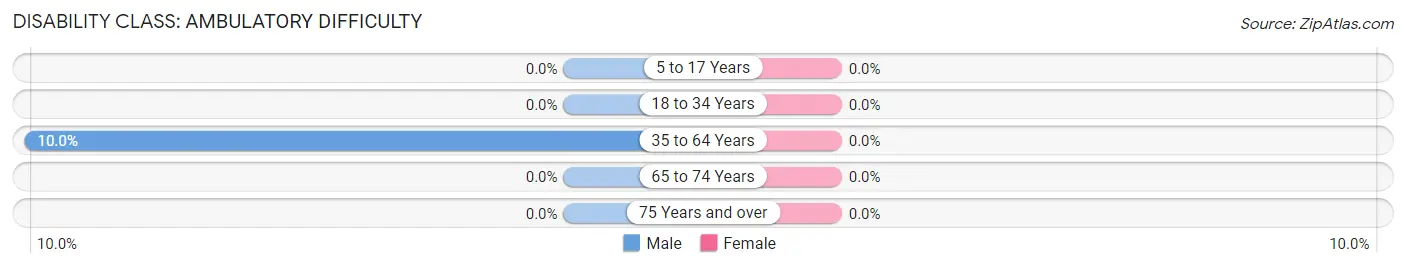
| Age Bracket | Male | Female |
| 5 to 17 Years | 0 (0.0%) | 0 (0.0%) |
| 18 to 34 Years | 0 (0.0%) | 0 (0.0%) |
| 35 to 64 Years | 3 (10.0%) | 0 (0.0%) |
| 65 to 74 Years | 0 (0.0%) | 0 (0.0%) |
| 75 Years and over | 0 (0.0%) | 0 (0.0%) |
Disability Class: Self-Care Difficulty
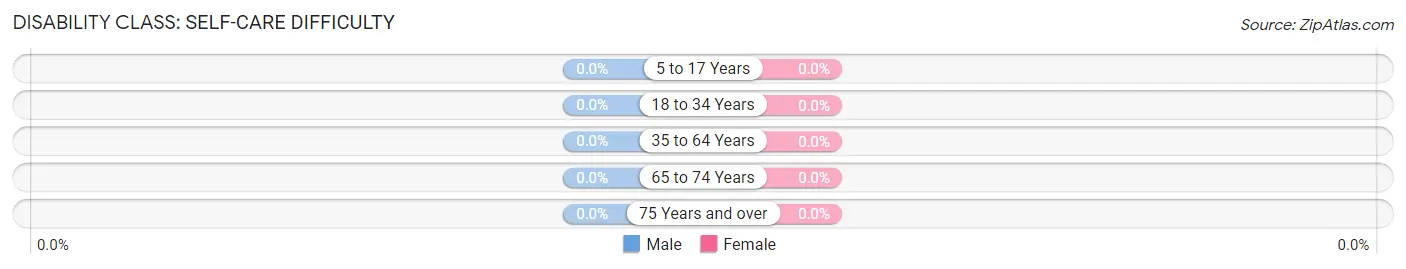
| Age Bracket | Male | Female |
| 5 to 17 Years | 0 (0.0%) | 0 (0.0%) |
| 18 to 34 Years | 0 (0.0%) | 0 (0.0%) |
| 35 to 64 Years | 0 (0.0%) | 0 (0.0%) |
| 65 to 74 Years | 0 (0.0%) | 0 (0.0%) |
| 75 Years and over | 0 (0.0%) | 0 (0.0%) |
Technology Access in Huslia
Computing Device Access in Huslia
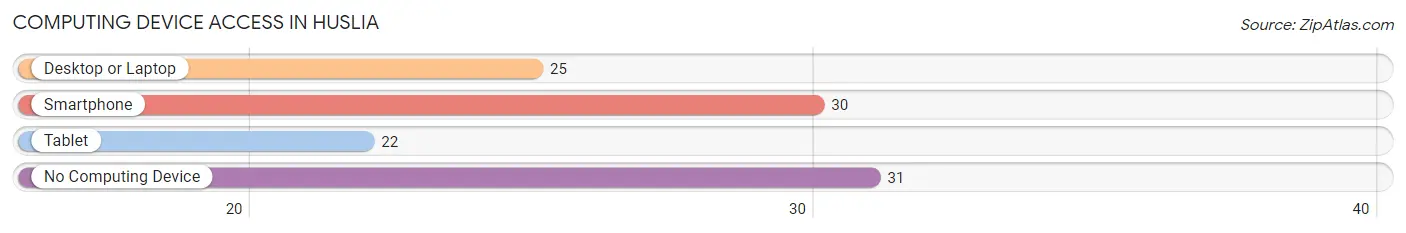
| Device Type | # Households | % Households |
| Desktop or Laptop | 25 | 39.7% |
| Smartphone | 30 | 47.6% |
| Tablet | 22 | 34.9% |
| No Computing Device | 31 | 49.2% |
| Total | 63 | 100.0% |
Internet Access in Huslia
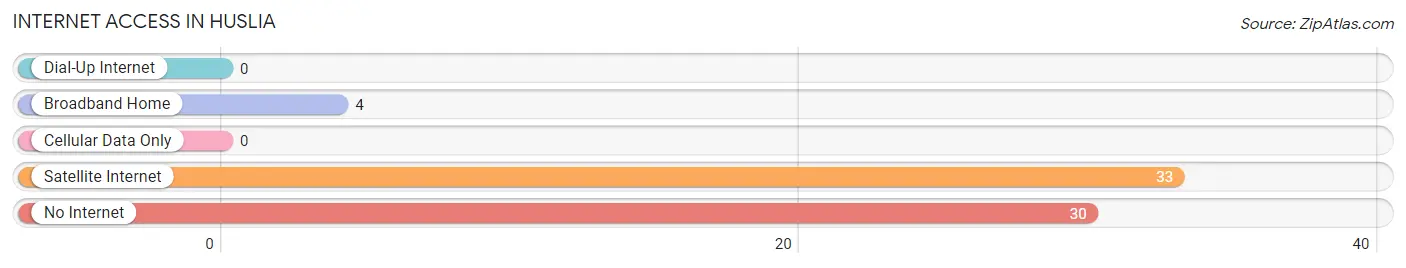
| Internet Type | # Households | % Households |
| Dial-Up Internet | 0 | 0.0% |
| Broadband Home | 4 | 6.4% |
| Cellular Data Only | 0 | 0.0% |
| Satellite Internet | 33 | 52.4% |
| No Internet | 30 | 47.6% |
| Total | 63 | 100.0% |
Huslia Summary
Huslia is a small village located in the interior of Alaska, approximately 200 miles northwest of Fairbanks. It is situated on the banks of the Koyukuk River, and is home to a population of approximately 300 people. The village is part of the Koyukuk Census Area, and is the only settlement in the area.
History
Huslia was first settled by the Koyukon Athabascan people in the late 1800s. The village was originally known as “Koyukuk”, and was a seasonal fishing camp. In the early 1900s, the village was renamed “Huslia”, after a local chief. The village was officially incorporated in 1961.
In the early 1900s, Huslia was a trading post for the Koyukon people. The village was also a stop on the mail route between Fairbanks and Nulato. In the 1950s, the Alaska Native Claims Settlement Act (ANCSA) was passed, which allowed the Koyukon people to receive land allotments in the area. This allowed the village to become more permanent, and the population began to grow.
Geography
Huslia is located in the interior of Alaska, approximately 200 miles northwest of Fairbanks. The village is situated on the banks of the Koyukuk River, and is surrounded by the Koyukuk National Wildlife Refuge. The area is mostly flat, with rolling hills and low mountains in the distance. The climate is subarctic, with cold winters and short, mild summers.
Economy
The economy of Huslia is largely based on subsistence activities, such as fishing, hunting, and trapping. The village also has a small tourism industry, with visitors coming to experience the traditional Koyukon lifestyle. The village also receives funding from the federal government, as well as from the Alaska Native Claims Settlement Act (ANCSA).
Demographics
As of the 2010 census, the population of Huslia was 294. The majority of the population is Native American, with the majority being Koyukon Athabascan. The median age of the population is 33.7 years, and the median household income is $25,000. The village is served by the Huslia School, which is part of the Yukon-Koyukuk School District.
Huslia is a small, remote village in the interior of Alaska. It is home to a population of approximately 300 people, mostly Koyukon Athabascan. The village is largely dependent on subsistence activities, as well as tourism and government funding. The population is young, with a median age of 33.7 years, and the median household income is $25,000. Huslia is a unique and interesting place, and is a great place to experience the traditional Koyukon lifestyle.
Common Questions
What is Per Capita Income in Huslia?
Per Capita income in Huslia is $20,677.
What is the Median Family Income in Huslia?
Median Family Income in Huslia is $70,938.
What is the Median Household income in Huslia?
Median Household Income in Huslia is $49,792.
What is Income or Wage Gap in Huslia?
Income or Wage Gap in Huslia is 21.7%.
Women in Huslia earn 78.3 cents for every dollar earned by a man.
What is Inequality or Gini Index in Huslia?
Inequality or Gini Index in Huslia is 0.41.
What is the Total Population of Huslia?
Total Population of Huslia is 182.
What is the Total Male Population of Huslia?
Total Male Population of Huslia is 85.
What is the Total Female Population of Huslia?
Total Female Population of Huslia is 97.
What is the Ratio of Males per 100 Females in Huslia?
There are 87.63 Males per 100 Females in Huslia.
What is the Ratio of Females per 100 Males in Huslia?
There are 114.12 Females per 100 Males in Huslia.
What is the Median Population Age in Huslia?
Median Population Age in Huslia is 20.8 Years.
What is the Average Family Size in Huslia
Average Family Size in Huslia is 4.1 People.
What is the Average Household Size in Huslia
Average Household Size in Huslia is 2.9 People.
How Large is the Labor Force in Huslia?
There are 72 People in the Labor Forcein in Huslia.
What is the Percentage of People in the Labor Force in Huslia?
61.0% of People are in the Labor Force in Huslia.
What is the Unemployment Rate in Huslia?
Unemployment Rate in Huslia is 19.4%.