Glennallen, AK Map & Demographics
Glennallen Map
Glennallen Overview
$40,134
PER CAPITA INCOME
$106,750
AVG FAMILY INCOME
$78,173
AVG HOUSEHOLD INCOME
48.1%
WAGE / INCOME GAP [ % ]
51.9¢/ $1
WAGE / INCOME GAP [ $ ]
0.31
INEQUALITY / GINI INDEX
522
TOTAL POPULATION
267
MALE POPULATION
255
FEMALE POPULATION
104.71
MALES / 100 FEMALES
95.51
FEMALES / 100 MALES
33.6
MEDIAN AGE
2.9
AVG FAMILY SIZE
2.1
AVG HOUSEHOLD SIZE
332
LABOR FORCE [ PEOPLE ]
84.1%
PERCENT IN LABOR FORCE
5.4%
UNEMPLOYMENT RATE
Glennallen Zip Codes
Glennallen Area Codes
Income in Glennallen
Income Overview in Glennallen
Per Capita Income in Glennallen is $40,134, while median incomes of families and households are $106,750 and $78,173 respectively.
| Characteristic | Number | Measure |
| Per Capita Income | 522 | $40,134 |
| Median Family Income | 117 | $106,750 |
| Mean Family Income | 117 | $119,574 |
| Median Household Income | 238 | $78,173 |
| Mean Household Income | 238 | $90,848 |
| Income Deficit | 117 | $0 |
| Wage / Income Gap (%) | 522 | 48.13% |
| Wage / Income Gap ($) | 522 | 51.87¢ per $1 |
| Gini / Inequality Index | 522 | 0.31 |
Earnings by Sex in Glennallen
Average Earnings in Glennallen are $59,911, $62,281 for men and $32,308 for women, a difference of 48.1%.
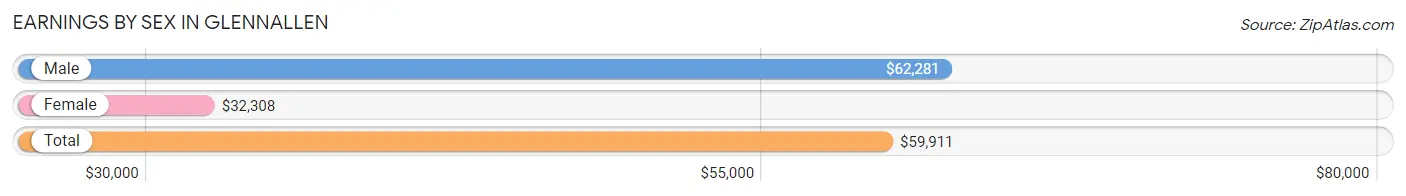
| Sex | Number | Average Earnings |
| Male | 173 (54.9%) | $62,281 |
| Female | 142 (45.1%) | $32,308 |
| Total | 315 (100.0%) | $59,911 |
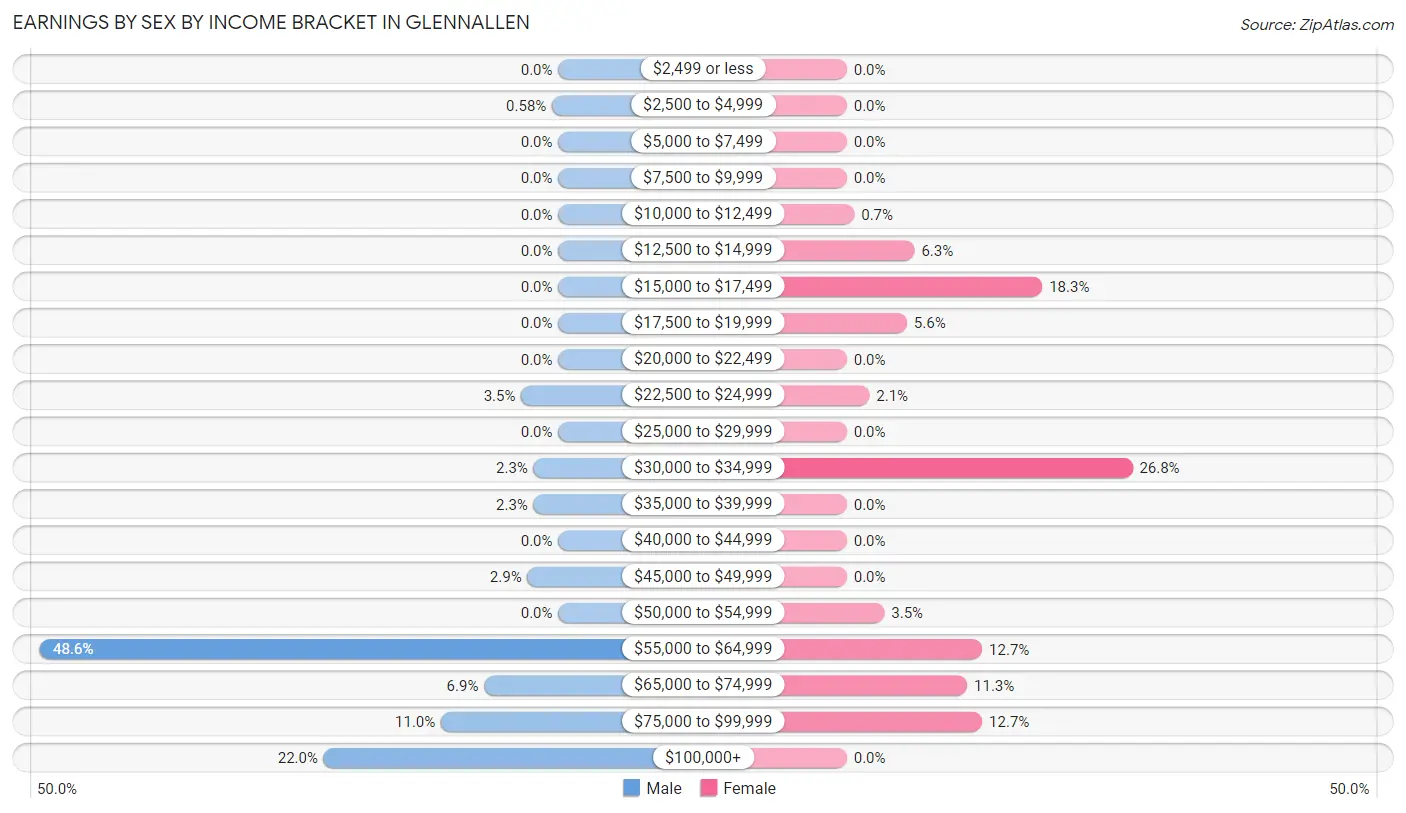
Earnings by Sex by Income Bracket in Glennallen
The most common earnings brackets in Glennallen are $55,000 to $64,999 for men (84 | 48.5%) and $30,000 to $34,999 for women (38 | 26.8%).
| Income | Male | Female |
| $2,499 or less | 0 (0.0%) | 0 (0.0%) |
| $2,500 to $4,999 | 1 (0.6%) | 0 (0.0%) |
| $5,000 to $7,499 | 0 (0.0%) | 0 (0.0%) |
| $7,500 to $9,999 | 0 (0.0%) | 0 (0.0%) |
| $10,000 to $12,499 | 0 (0.0%) | 1 (0.7%) |
| $12,500 to $14,999 | 0 (0.0%) | 9 (6.3%) |
| $15,000 to $17,499 | 0 (0.0%) | 26 (18.3%) |
| $17,500 to $19,999 | 0 (0.0%) | 8 (5.6%) |
| $20,000 to $22,499 | 0 (0.0%) | 0 (0.0%) |
| $22,500 to $24,999 | 6 (3.5%) | 3 (2.1%) |
| $25,000 to $29,999 | 0 (0.0%) | 0 (0.0%) |
| $30,000 to $34,999 | 4 (2.3%) | 38 (26.8%) |
| $35,000 to $39,999 | 4 (2.3%) | 0 (0.0%) |
| $40,000 to $44,999 | 0 (0.0%) | 0 (0.0%) |
| $45,000 to $49,999 | 5 (2.9%) | 0 (0.0%) |
| $50,000 to $54,999 | 0 (0.0%) | 5 (3.5%) |
| $55,000 to $64,999 | 84 (48.5%) | 18 (12.7%) |
| $65,000 to $74,999 | 12 (6.9%) | 16 (11.3%) |
| $75,000 to $99,999 | 19 (11.0%) | 18 (12.7%) |
| $100,000+ | 38 (22.0%) | 0 (0.0%) |
| Total | 173 (100.0%) | 142 (100.0%) |
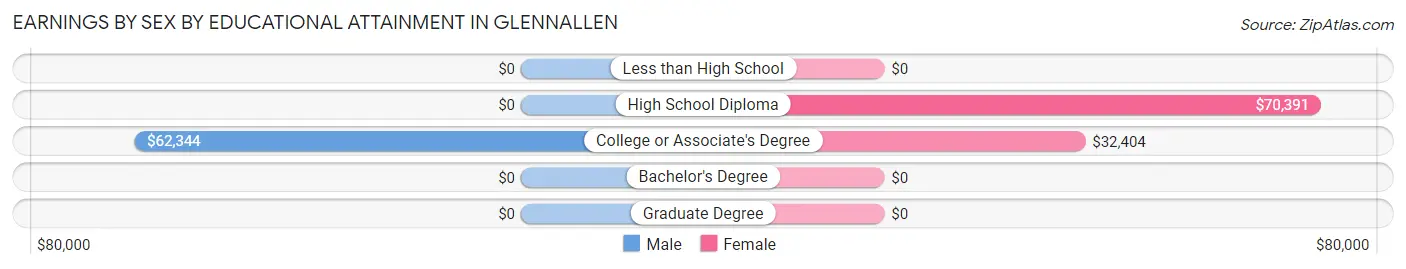
Earnings by Sex by Educational Attainment in Glennallen
Average earnings in Glennallen are $62,219 for men and $31,923 for women, a difference of 48.7%. Men with an educational attainment of college or associate's degree enjoy the highest average annual earnings of $62,344, while those with college or associate's degree education earn the least with $62,344. Women with an educational attainment of high school diploma earn the most with the average annual earnings of $70,391, while those with college or associate's degree education have the smallest earnings of $32,404.
| Educational Attainment | Male Income | Female Income |
| Less than High School | - | - |
| High School Diploma | - | - |
| College or Associate's Degree | $62,344 | $32,404 |
| Bachelor's Degree | - | - |
| Graduate Degree | - | - |
| Total | $62,219 | $31,923 |
Family Income in Glennallen
Family Income Brackets in Glennallen
According to the Glennallen family income data, there are 47 families falling into the $100,000 to $149,999 income range, which is the most common income bracket and makes up 40.2% of all families.
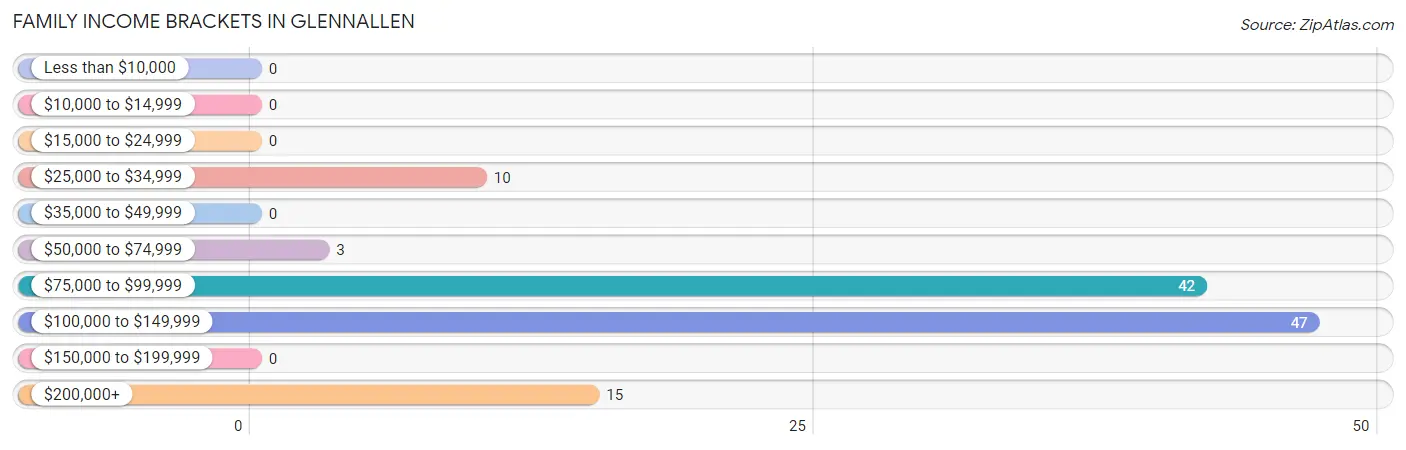
| Income Bracket | # Families | % Families |
| Less than $10,000 | 0 | 0.0% |
| $10,000 to $14,999 | 0 | 0.0% |
| $15,000 to $24,999 | 0 | 0.0% |
| $25,000 to $34,999 | 10 | 8.5% |
| $35,000 to $49,999 | 0 | 0.0% |
| $50,000 to $74,999 | 3 | 2.6% |
| $75,000 to $99,999 | 42 | 35.9% |
| $100,000 to $149,999 | 47 | 40.2% |
| $150,000 to $199,999 | 0 | 0.0% |
| $200,000+ | 15 | 12.8% |
Family Income by Famaliy Size in Glennallen
2-person families (60 | 51.3%) account for the highest median family income in Glennallen with $105,500 per family, while 2-person families (60 | 51.3%) have the highest median income of $52,750 per family member.
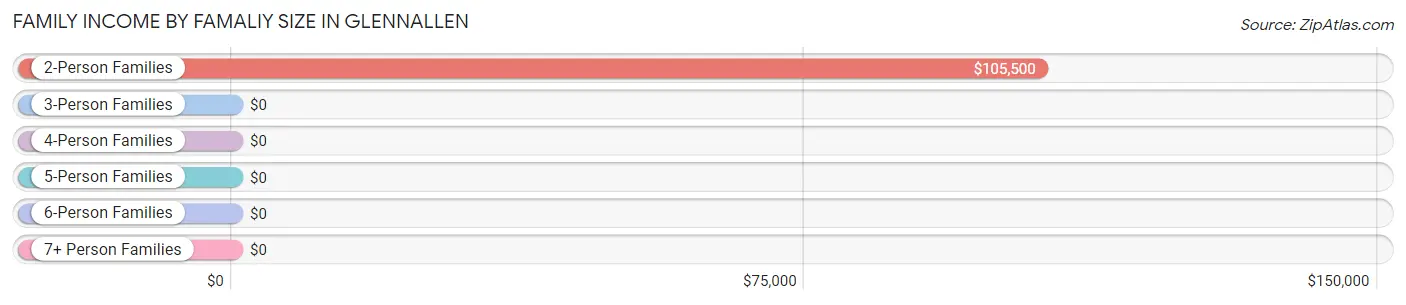
| Income Bracket | # Families | Median Income |
| 2-Person Families | 60 (51.3%) | $105,500 |
| 3-Person Families | 5 (4.3%) | $0 |
| 4-Person Families | 26 (22.2%) | $0 |
| 5-Person Families | 26 (22.2%) | $0 |
| 6-Person Families | 0 (0.0%) | $0 |
| 7+ Person Families | 0 (0.0%) | $0 |
| Total | 117 (100.0%) | $106,750 |
Family Income by Number of Earners in Glennallen
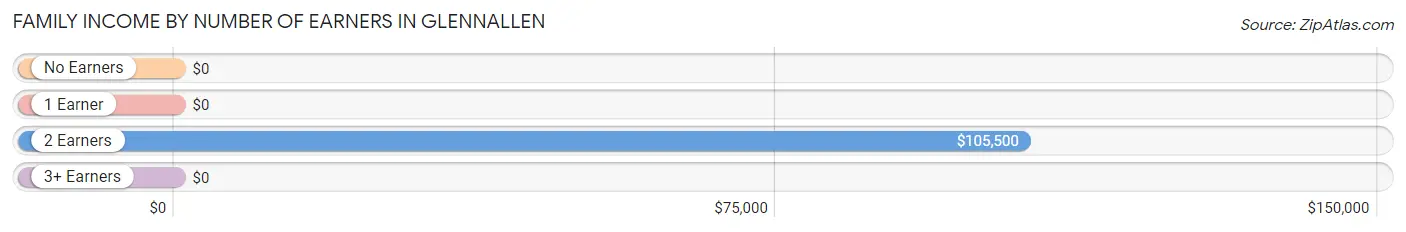
| Number of Earners | # Families | Median Income |
| No Earners | 10 (8.6%) | $0 |
| 1 Earner | 0 (0.0%) | $0 |
| 2 Earners | 92 (78.6%) | $105,500 |
| 3+ Earners | 15 (12.8%) | $0 |
| Total | 117 (100.0%) | $106,750 |
Household Income in Glennallen
Household Income Brackets in Glennallen
With 72 households falling in the category, the $50,000 to $74,999 income range is the most frequent in Glennallen, accounting for 30.2% of all households.
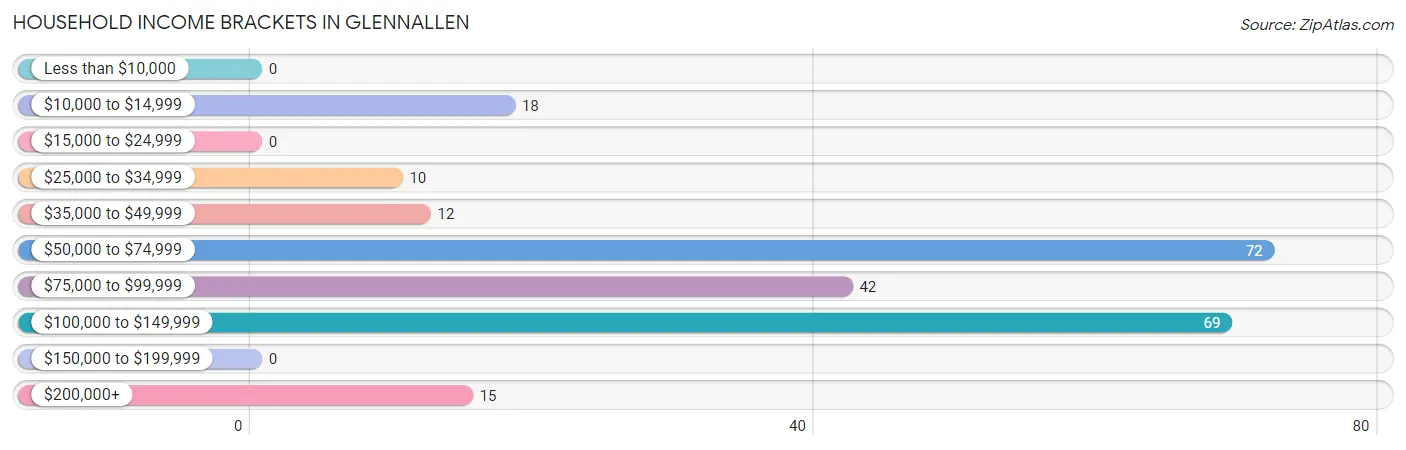
| Income Bracket | # Households | % Households |
| Less than $10,000 | 0 | 0.0% |
| $10,000 to $14,999 | 18 | 7.6% |
| $15,000 to $24,999 | 0 | 0.0% |
| $25,000 to $34,999 | 10 | 4.2% |
| $35,000 to $49,999 | 12 | 5.0% |
| $50,000 to $74,999 | 72 | 30.3% |
| $75,000 to $99,999 | 42 | 17.6% |
| $100,000 to $149,999 | 69 | 29.0% |
| $150,000 to $199,999 | 0 | 0.0% |
| $200,000+ | 15 | 6.3% |
Household Income by Householder Age in Glennallen
The median household income in Glennallen is $78,173, with the highest median household income of $136,298 found in the 45 to 64 years age bracket for the primary householder. A total of 87 households (36.5%) fall into this category. Meanwhile, the 15 to 24 years age bracket for the primary householder has the lowest median household income of $0, with 27 households (11.3%) in this group.
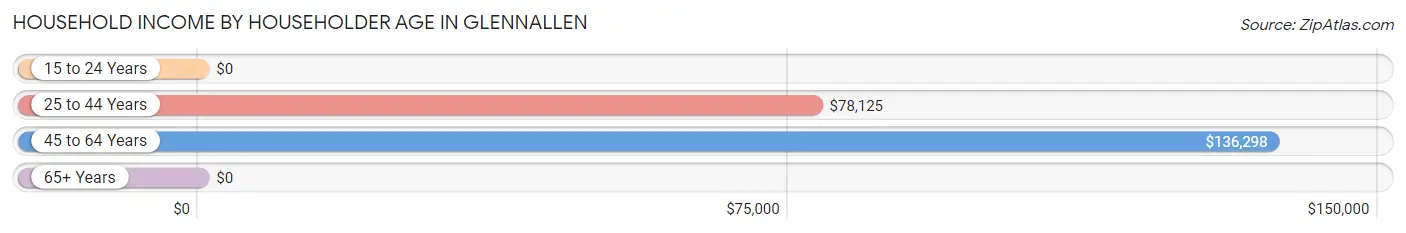
| Income Bracket | # Households | Median Income |
| 15 to 24 Years | 27 (11.3%) | $0 |
| 25 to 44 Years | 93 (39.1%) | $78,125 |
| 45 to 64 Years | 87 (36.5%) | $136,298 |
| 65+ Years | 31 (13.0%) | $0 |
| Total | 238 (100.0%) | $78,173 |
Poverty in Glennallen
Income Below Poverty by Sex and Age in Glennallen
With 3.4% poverty level for males and 10.9% for females among the residents of Glennallen, 75 year old and over males and 55 to 64 year old females are the most vulnerable to poverty, with 9 males (42.9%) and 15 females (42.9%) in their respective age groups living below the poverty level.
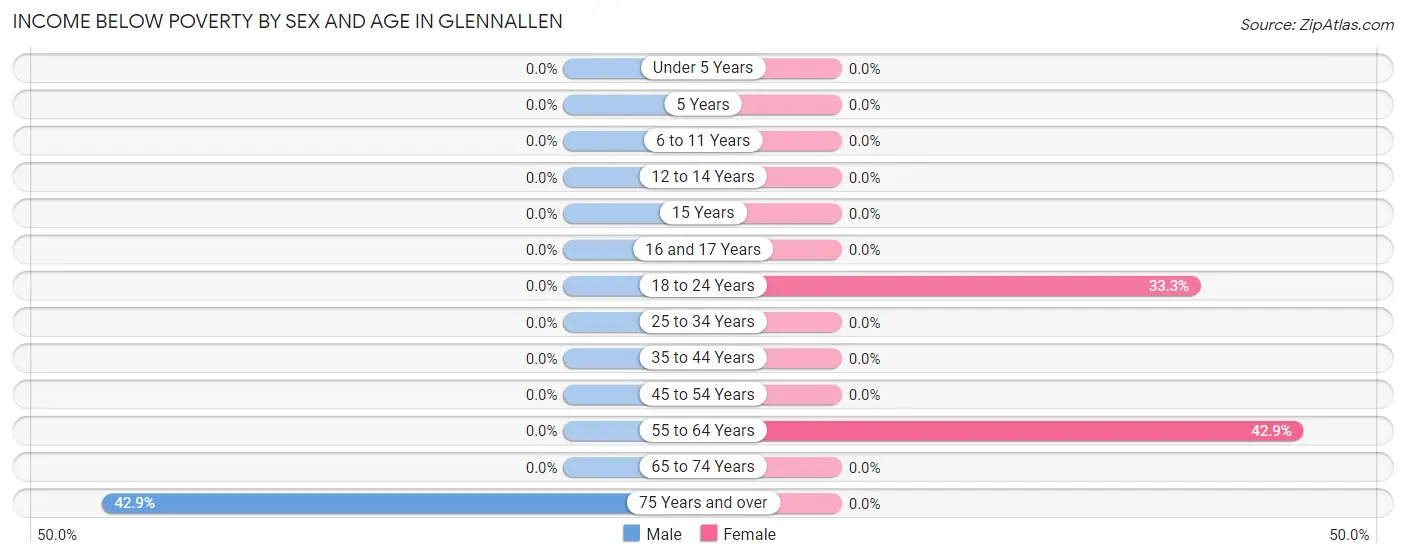
| Age Bracket | Male | Female |
| Under 5 Years | 0 (0.0%) | 0 (0.0%) |
| 5 Years | 0 (0.0%) | 0 (0.0%) |
| 6 to 11 Years | 0 (0.0%) | 0 (0.0%) |
| 12 to 14 Years | 0 (0.0%) | 0 (0.0%) |
| 15 Years | 0 (0.0%) | 0 (0.0%) |
| 16 and 17 Years | 0 (0.0%) | 0 (0.0%) |
| 18 to 24 Years | 0 (0.0%) | 9 (33.3%) |
| 25 to 34 Years | 0 (0.0%) | 0 (0.0%) |
| 35 to 44 Years | 0 (0.0%) | 0 (0.0%) |
| 45 to 54 Years | 0 (0.0%) | 0 (0.0%) |
| 55 to 64 Years | 0 (0.0%) | 15 (42.9%) |
| 65 to 74 Years | 0 (0.0%) | 0 (0.0%) |
| 75 Years and over | 9 (42.9%) | 0 (0.0%) |
| Total | 9 (3.4%) | 24 (10.9%) |
Income Above Poverty by Sex and Age in Glennallen
According to the poverty statistics in Glennallen, males aged 6 to 11 years and females aged under 5 years are the age groups that are most secure financially, with 100.0% of males and 100.0% of females in these age groups living above the poverty line.
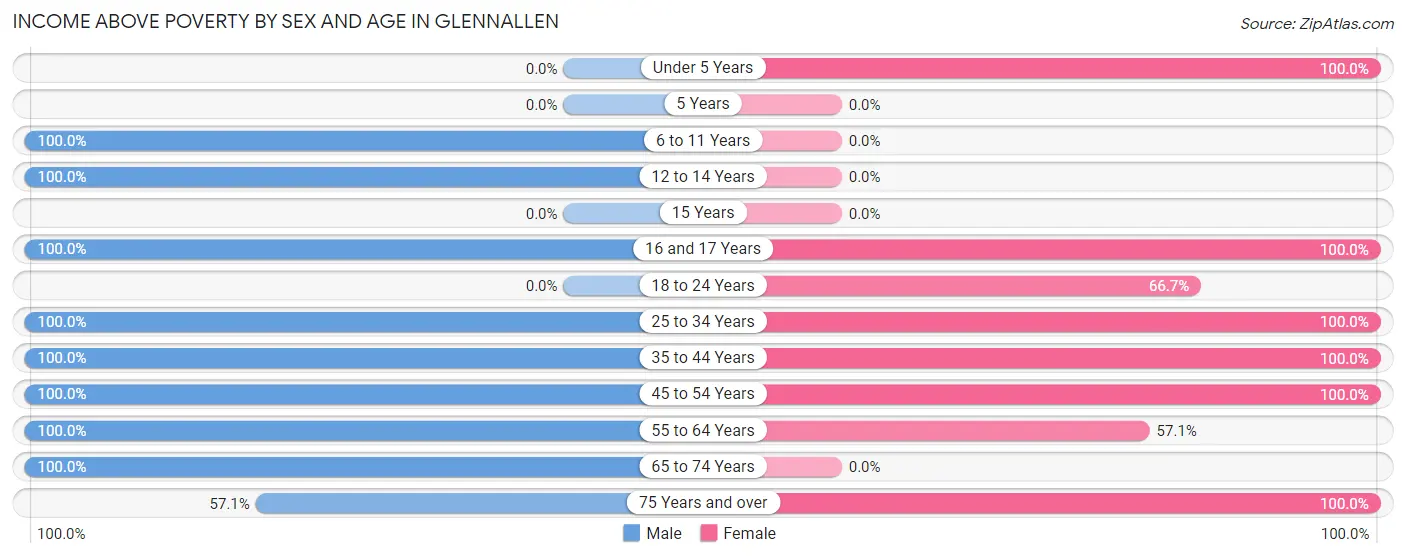
| Age Bracket | Male | Female |
| Under 5 Years | 0 (0.0%) | 51 (100.0%) |
| 5 Years | 0 (0.0%) | 0 (0.0%) |
| 6 to 11 Years | 13 (100.0%) | 0 (0.0%) |
| 12 to 14 Years | 35 (100.0%) | 0 (0.0%) |
| 15 Years | 0 (0.0%) | 0 (0.0%) |
| 16 and 17 Years | 15 (100.0%) | 6 (100.0%) |
| 18 to 24 Years | 0 (0.0%) | 18 (66.7%) |
| 25 to 34 Years | 78 (100.0%) | 31 (100.0%) |
| 35 to 44 Years | 14 (100.0%) | 19 (100.0%) |
| 45 to 54 Years | 25 (100.0%) | 44 (100.0%) |
| 55 to 64 Years | 52 (100.0%) | 20 (57.1%) |
| 65 to 74 Years | 10 (100.0%) | 0 (0.0%) |
| 75 Years and over | 12 (57.1%) | 8 (100.0%) |
| Total | 254 (96.6%) | 197 (89.1%) |
Income Below Poverty Among Married-Couple Families in Glennallen
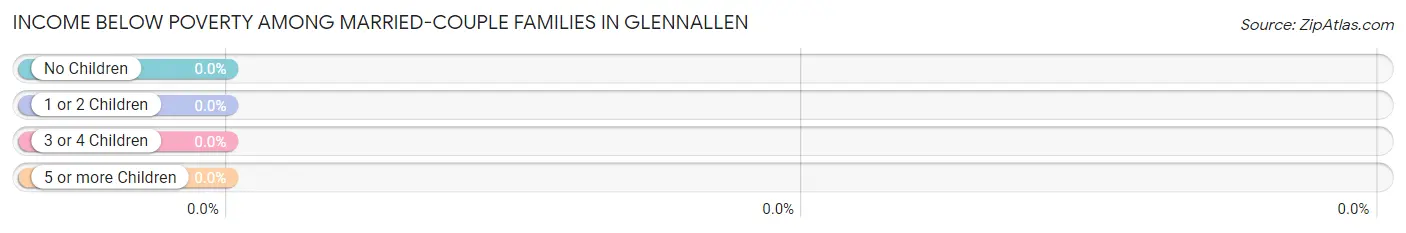
| Children | Above Poverty | Below Poverty |
| No Children | 57 (100.0%) | 0 (0.0%) |
| 1 or 2 Children | 46 (100.0%) | 0 (0.0%) |
| 3 or 4 Children | 11 (100.0%) | 0 (0.0%) |
| 5 or more Children | 0 (0.0%) | 0 (0.0%) |
| Total | 114 (100.0%) | 0 (0.0%) |
Income Below Poverty Among Single-Parent Households in Glennallen
| Children | Single Father | Single Mother |
| No Children | 0 (0.0%) | 0 (0.0%) |
| 1 or 2 Children | 0 (0.0%) | 0 (0.0%) |
| 3 or 4 Children | 0 (0.0%) | 0 (0.0%) |
| 5 or more Children | 0 (0.0%) | 0 (0.0%) |
| Total | 0 (0.0%) | 0 (0.0%) |
Income Below Poverty Among Married-Couple vs Single-Parent Households in Glennallen
| Children | Married-Couple Families | Single-Parent Households |
| No Children | 0 (0.0%) | 0 (0.0%) |
| 1 or 2 Children | 0 (0.0%) | 0 (0.0%) |
| 3 or 4 Children | 0 (0.0%) | 0 (0.0%) |
| 5 or more Children | 0 (0.0%) | 0 (0.0%) |
| Total | 0 (0.0%) | 0 (0.0%) |
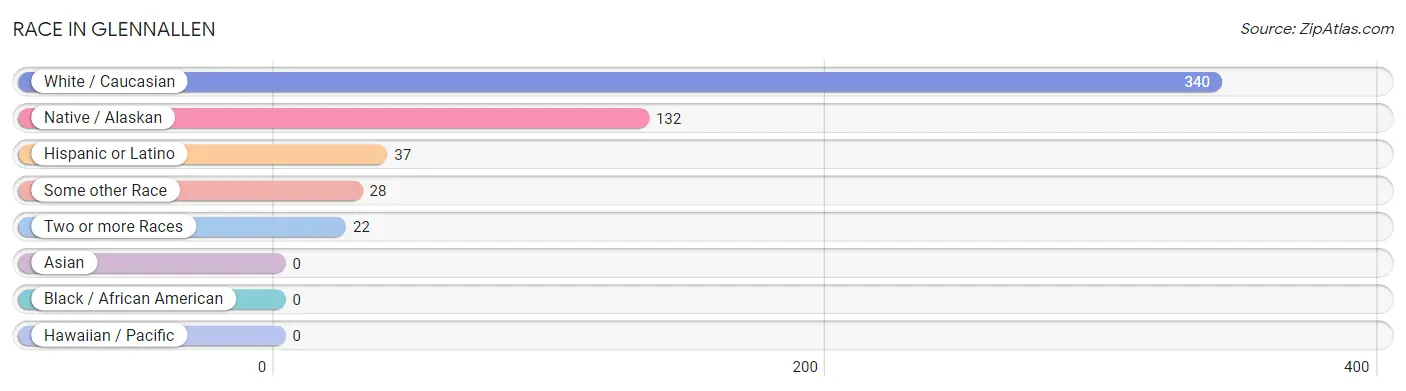
Race in Glennallen
The most populous races in Glennallen are White / Caucasian (340 | 65.1%), Native / Alaskan (132 | 25.3%), and Hispanic or Latino (37 | 7.1%).
| Race | # Population | % Population |
| Asian | 0 | 0.0% |
| Black / African American | 0 | 0.0% |
| Hawaiian / Pacific | 0 | 0.0% |
| Hispanic or Latino | 37 | 7.1% |
| Native / Alaskan | 132 | 25.3% |
| White / Caucasian | 340 | 65.1% |
| Two or more Races | 22 | 4.2% |
| Some other Race | 28 | 5.4% |
| Total | 522 | 100.0% |
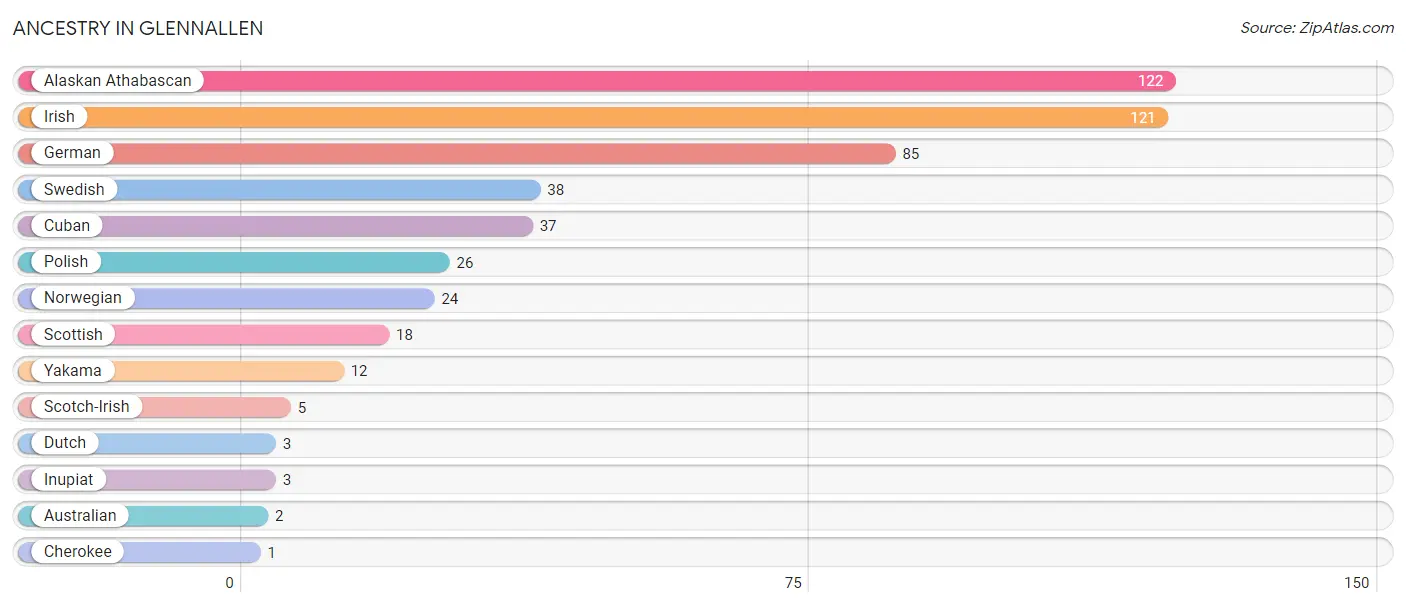
Ancestry in Glennallen
The most populous ancestries reported in Glennallen are Alaskan Athabascan (122 | 23.4%), Irish (121 | 23.2%), German (85 | 16.3%), Swedish (38 | 7.3%), and Cuban (37 | 7.1%), together accounting for 77.2% of all Glennallen residents.
| Ancestry | # Population | % Population |
| Alaskan Athabascan | 122 | 23.4% |
| Australian | 2 | 0.4% |
| Cherokee | 1 | 0.2% |
| Cuban | 37 | 7.1% |
| Dutch | 3 | 0.6% |
| German | 85 | 16.3% |
| Inupiat | 3 | 0.6% |
| Irish | 121 | 23.2% |
| Norwegian | 24 | 4.6% |
| Polish | 26 | 5.0% |
| Scotch-Irish | 5 | 1.0% |
| Scottish | 18 | 3.5% |
| Swedish | 38 | 7.3% |
| Yakama | 12 | 2.3% | View All 14 Rows |
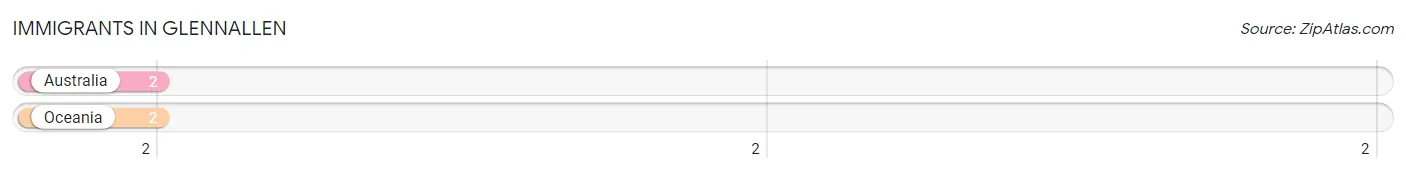
Immigrants in Glennallen
The most numerous immigrant groups reported in Glennallen came from Australia (2 | 0.4%), and Oceania (2 | 0.4%), together accounting for 0.8% of all Glennallen residents.
| Immigration Origin | # Population | % Population |
| Australia | 2 | 0.4% |
| Oceania | 2 | 0.4% | View All 2 Rows |
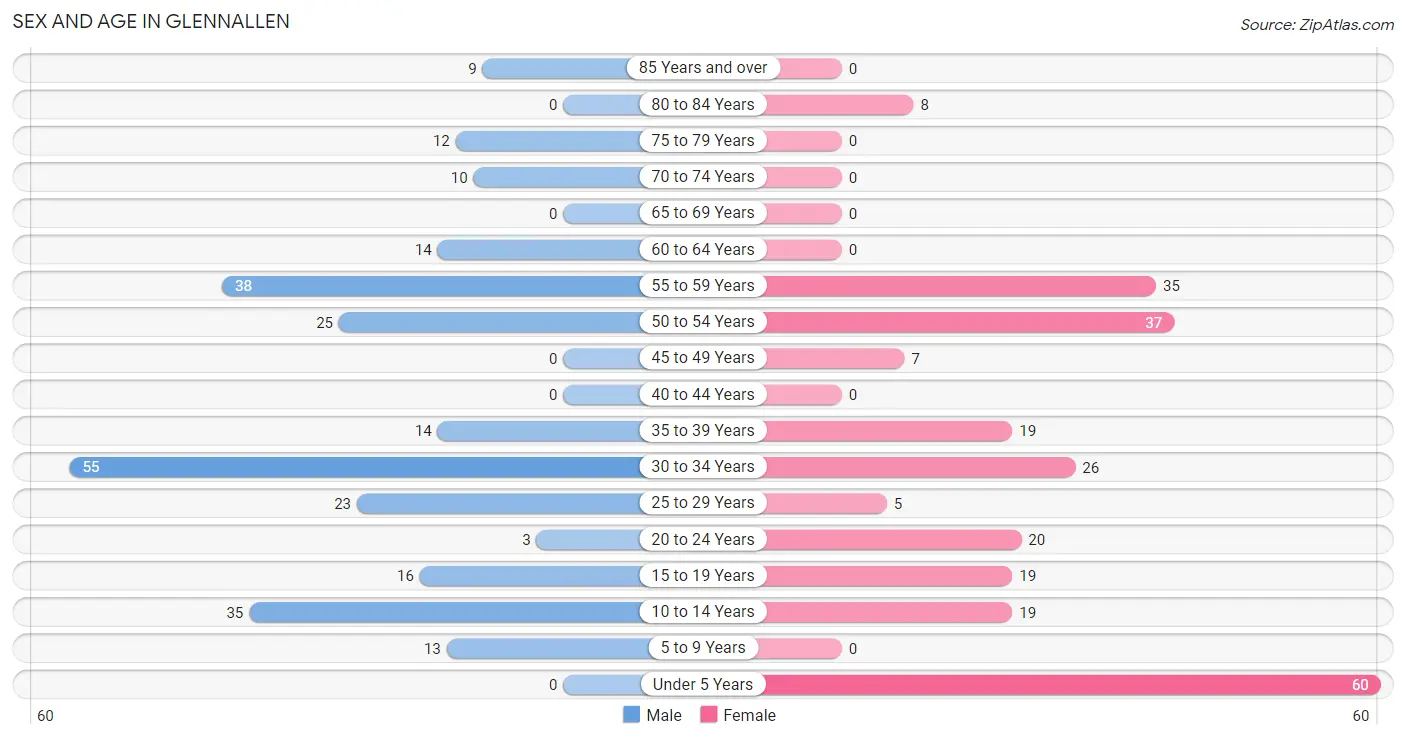
Sex and Age in Glennallen
Sex and Age in Glennallen
The most populous age groups in Glennallen are 30 to 34 Years (55 | 20.6%) for men and Under 5 Years (60 | 23.5%) for women.
| Age Bracket | Male | Female |
| Under 5 Years | 0 (0.0%) | 60 (23.5%) |
| 5 to 9 Years | 13 (4.9%) | 0 (0.0%) |
| 10 to 14 Years | 35 (13.1%) | 19 (7.4%) |
| 15 to 19 Years | 16 (6.0%) | 19 (7.4%) |
| 20 to 24 Years | 3 (1.1%) | 20 (7.8%) |
| 25 to 29 Years | 23 (8.6%) | 5 (2.0%) |
| 30 to 34 Years | 55 (20.6%) | 26 (10.2%) |
| 35 to 39 Years | 14 (5.2%) | 19 (7.4%) |
| 40 to 44 Years | 0 (0.0%) | 0 (0.0%) |
| 45 to 49 Years | 0 (0.0%) | 7 (2.8%) |
| 50 to 54 Years | 25 (9.4%) | 37 (14.5%) |
| 55 to 59 Years | 38 (14.2%) | 35 (13.7%) |
| 60 to 64 Years | 14 (5.2%) | 0 (0.0%) |
| 65 to 69 Years | 0 (0.0%) | 0 (0.0%) |
| 70 to 74 Years | 10 (3.7%) | 0 (0.0%) |
| 75 to 79 Years | 12 (4.5%) | 0 (0.0%) |
| 80 to 84 Years | 0 (0.0%) | 8 (3.1%) |
| 85 Years and over | 9 (3.4%) | 0 (0.0%) |
| Total | 267 (100.0%) | 255 (100.0%) |
Families and Households in Glennallen
Median Family Size in Glennallen
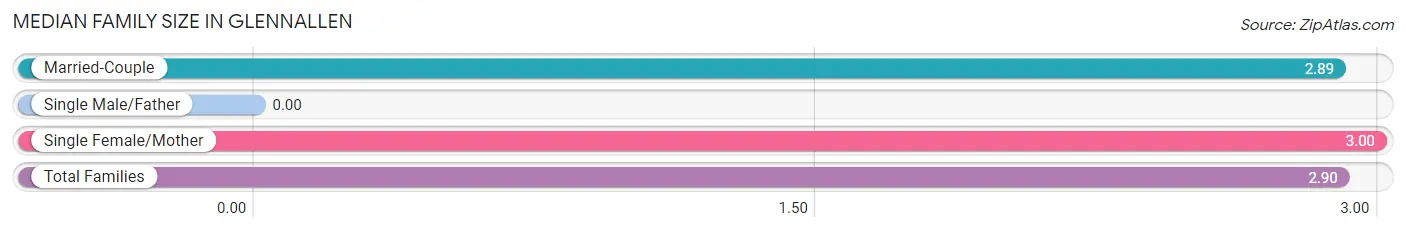
| Family Type | # Families | Family Size |
| Married-Couple | 114 (97.4%) | 2.89 |
| Single Male/Father | 0 (0.0%) | - |
| Single Female/Mother | 3 (2.6%) | 3.00 |
| Total Families | 117 (100.0%) | 2.90 |
Median Household Size in Glennallen
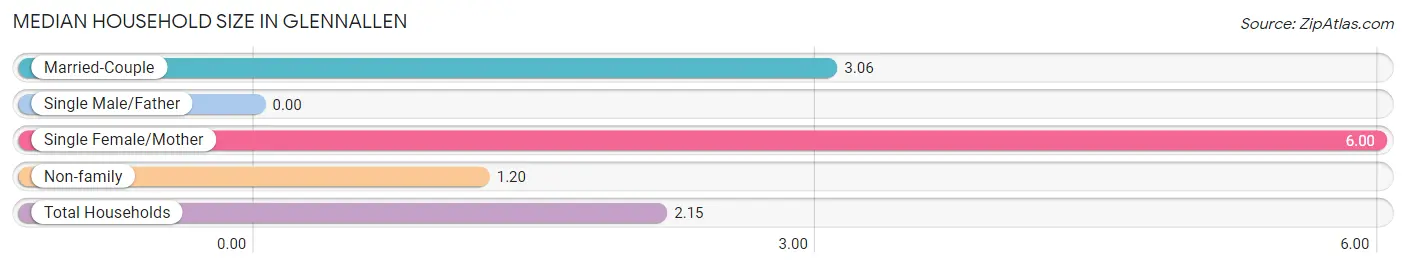
| Household Type | # Households | Household Size |
| Married-Couple | 114 (47.9%) | 3.06 |
| Single Male/Father | 0 (0.0%) | - |
| Single Female/Mother | 3 (1.3%) | 6.00 |
| Non-family | 121 (50.8%) | 1.20 |
| Total Households | 238 (100.0%) | 2.15 |
Household Size by Marriage Status in Glennallen
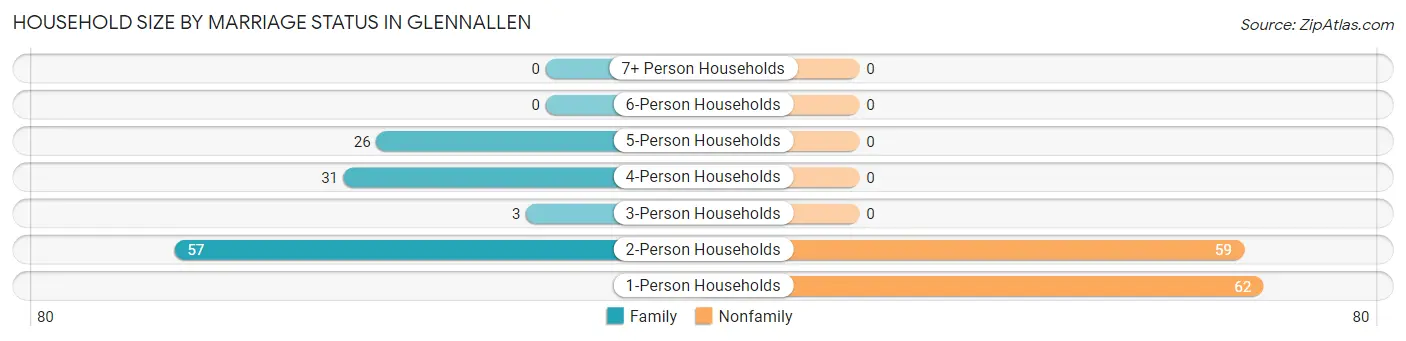
Out of a total of 238 households in Glennallen, 117 (49.2%) are family households, while 121 (50.8%) are nonfamily households. The most numerous type of family households are 2-person households, comprising 57, and the most common type of nonfamily households are 1-person households, comprising 62.
| Household Size | Family Households | Nonfamily Households |
| 1-Person Households | - | 62 (26.1%) |
| 2-Person Households | 57 (23.9%) | 59 (24.8%) |
| 3-Person Households | 3 (1.3%) | 0 (0.0%) |
| 4-Person Households | 31 (13.0%) | 0 (0.0%) |
| 5-Person Households | 26 (10.9%) | 0 (0.0%) |
| 6-Person Households | 0 (0.0%) | 0 (0.0%) |
| 7+ Person Households | 0 (0.0%) | 0 (0.0%) |
| Total | 117 (49.2%) | 121 (50.8%) |
Female Fertility in Glennallen
Fertility by Age in Glennallen
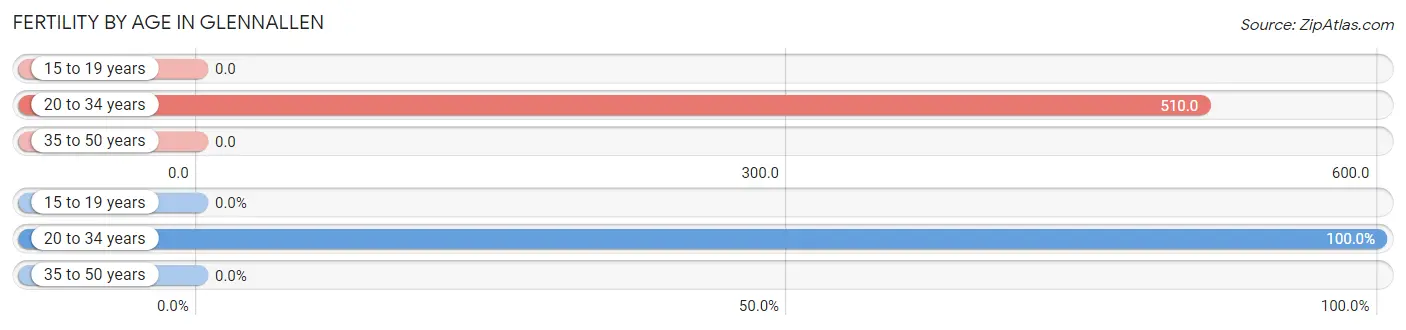
Average fertility rate in Glennallen is 271.0 births per 1,000 women. Women in the age bracket of 20 to 34 years have the highest fertility rate with 510.0 births per 1,000 women. Women in the age bracket of 20 to 34 years acount for 100.0% of all women with births.
| Age Bracket | Women with Births | Births / 1,000 Women |
| 15 to 19 years | 0 (0.0%) | 0.0 |
| 20 to 34 years | 26 (100.0%) | 510.0 |
| 35 to 50 years | 0 (0.0%) | 0.0 |
| Total | 26 (100.0%) | 271.0 |
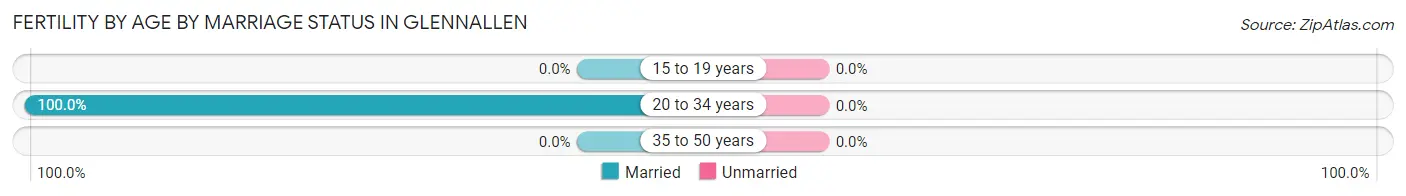
Fertility by Age by Marriage Status in Glennallen
| Age Bracket | Married | Unmarried |
| 15 to 19 years | 0 (0.0%) | 0 (0.0%) |
| 20 to 34 years | 26 (100.0%) | 0 (0.0%) |
| 35 to 50 years | 0 (0.0%) | 0 (0.0%) |
| Total | 26 (100.0%) | 0 (0.0%) |
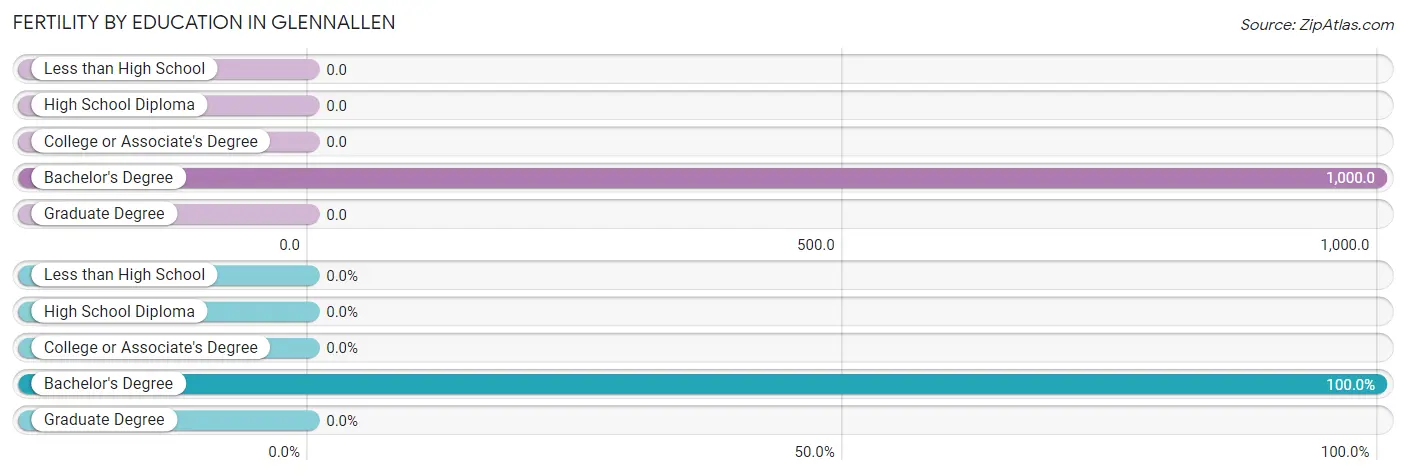
Fertility by Education in Glennallen
| Educational Attainment | Women with Births | Births / 1,000 Women |
| Less than High School | 0 (0.0%) | 0.0 |
| High School Diploma | 0 (0.0%) | 0.0 |
| College or Associate's Degree | 0 (0.0%) | 0.0 |
| Bachelor's Degree | 26 (100.0%) | 1,000.0 |
| Graduate Degree | 0 (0.0%) | 0.0 |
| Total | 26 (100.0%) | 271.0 |
Fertility by Education by Marriage Status in Glennallen
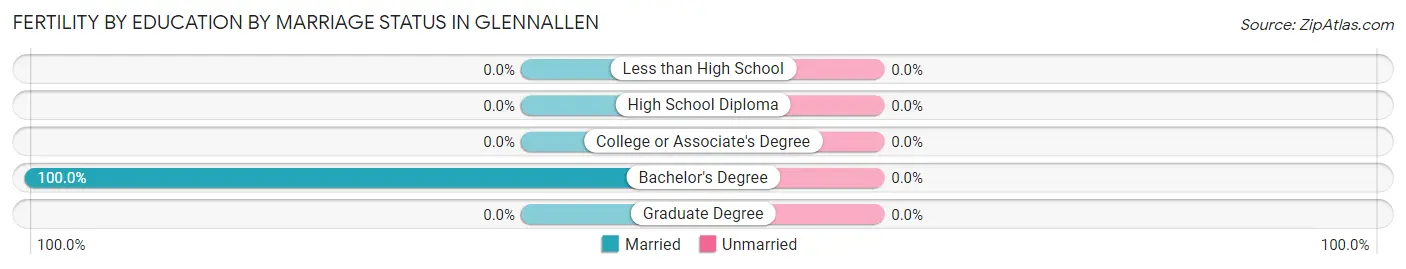
| Educational Attainment | Married | Unmarried |
| Less than High School | 0 (0.0%) | 0 (0.0%) |
| High School Diploma | 0 (0.0%) | 0 (0.0%) |
| College or Associate's Degree | 0 (0.0%) | 0 (0.0%) |
| Bachelor's Degree | 26 (100.0%) | 0 (0.0%) |
| Graduate Degree | 0 (0.0%) | 0 (0.0%) |
| Total | 26 (100.0%) | 0 (0.0%) |
Employment Characteristics in Glennallen
Employment by Class of Employer in Glennallen
Among the 311 employed individuals in Glennallen, private company employees (94 | 30.2%), state government employees (80 | 25.7%), and federal government employees (41 | 13.2%) make up the most common classes of employment.
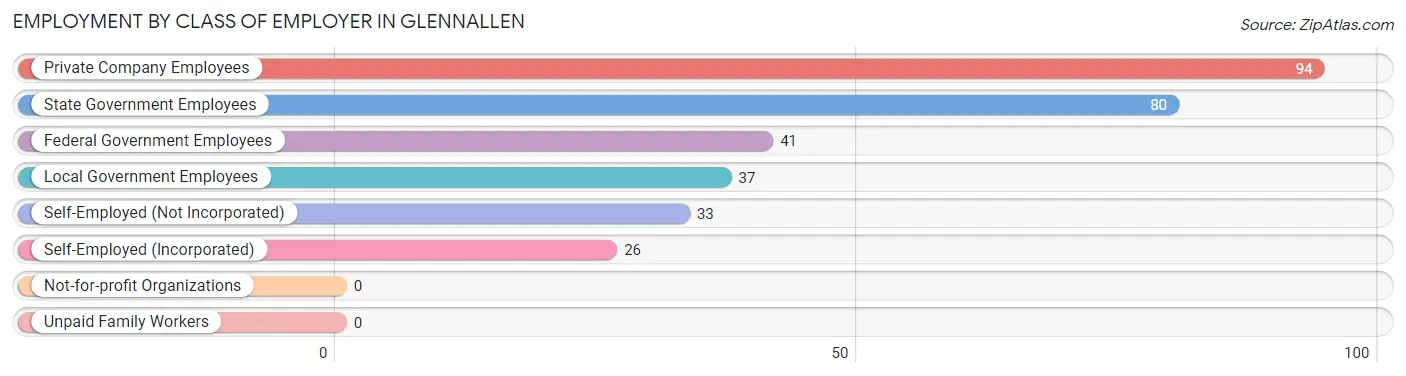
| Employer Class | # Employees | % Employees |
| Private Company Employees | 94 | 30.2% |
| Self-Employed (Incorporated) | 26 | 8.4% |
| Self-Employed (Not Incorporated) | 33 | 10.6% |
| Not-for-profit Organizations | 0 | 0.0% |
| Local Government Employees | 37 | 11.9% |
| State Government Employees | 80 | 25.7% |
| Federal Government Employees | 41 | 13.2% |
| Unpaid Family Workers | 0 | 0.0% |
| Total | 311 | 100.0% |
Employment Status by Age in Glennallen
According to the labor force statistics for Glennallen, out of the total population over 16 years of age (395), 84.1% or 332 individuals are in the labor force, with 5.4% or 18 of them unemployed. The age group with the highest labor force participation rate is 25 to 29 years, with 100.0% or 28 individuals in the labor force. Within the labor force, the 16 to 19 years age range has the highest percentage of unemployed individuals, with 23.1% or 3 of them being unemployed.
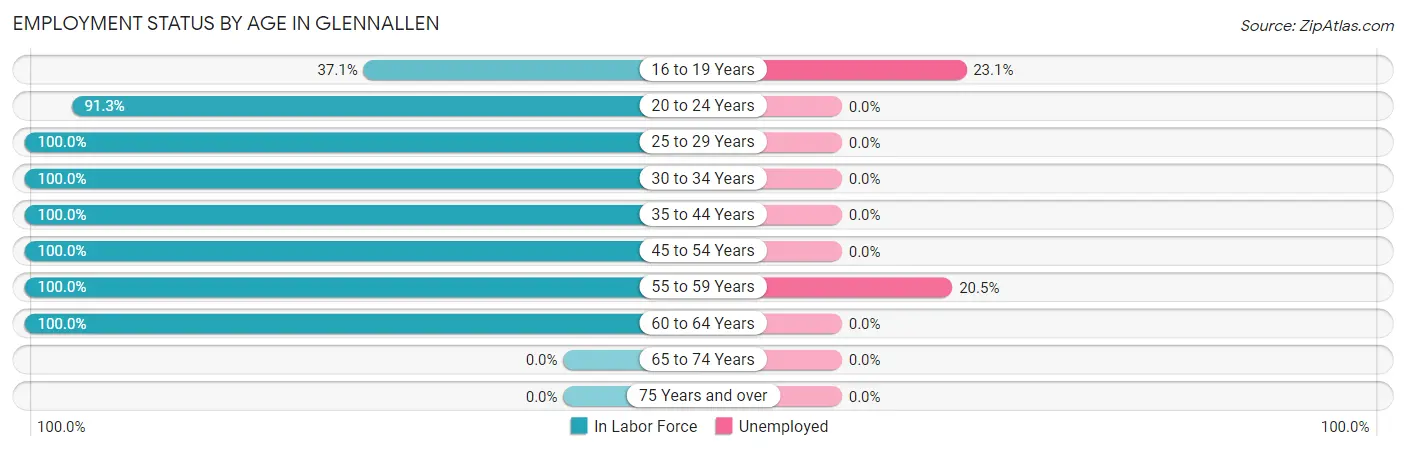
| Age Bracket | In Labor Force | Unemployed |
| 16 to 19 Years | 13 (37.1%) | 3 (23.1%) |
| 20 to 24 Years | 21 (91.3%) | 0 (0.0%) |
| 25 to 29 Years | 28 (100.0%) | 0 (0.0%) |
| 30 to 34 Years | 81 (100.0%) | 0 (0.0%) |
| 35 to 44 Years | 33 (100.0%) | 0 (0.0%) |
| 45 to 54 Years | 69 (100.0%) | 0 (0.0%) |
| 55 to 59 Years | 73 (100.0%) | 15 (20.5%) |
| 60 to 64 Years | 14 (100.0%) | 0 (0.0%) |
| 65 to 74 Years | 0 (0.0%) | 0 (0.0%) |
| 75 Years and over | 0 (0.0%) | 0 (0.0%) |
| Total | 332 (84.1%) | 18 (5.4%) |
Employment Status by Educational Attainment in Glennallen
According to labor force statistics for Glennallen, 100.0% of individuals (298) out of the total population between 25 and 64 years of age (298) are in the labor force, with 5.0% or 15 of them being unemployed. The group with the highest labor force participation rate are those with the educational attainment of less than high school, with 100.0% or 20 individuals in the labor force. Within the labor force, individuals with high school diploma education have the highest percentage of unemployment, with 31.9% or 15 of them being unemployed.
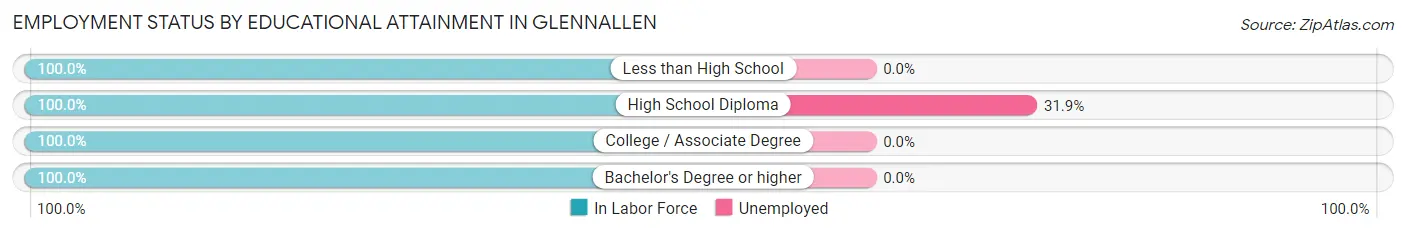
| Educational Attainment | In Labor Force | Unemployed |
| Less than High School | 20 (100.0%) | 0 (0.0%) |
| High School Diploma | 47 (100.0%) | 15 (31.9%) |
| College / Associate Degree | 141 (100.0%) | 0 (0.0%) |
| Bachelor's Degree or higher | 90 (100.0%) | 0 (0.0%) |
| Total | 298 (100.0%) | 15 (5.0%) |
Employment Occupations by Sex in Glennallen
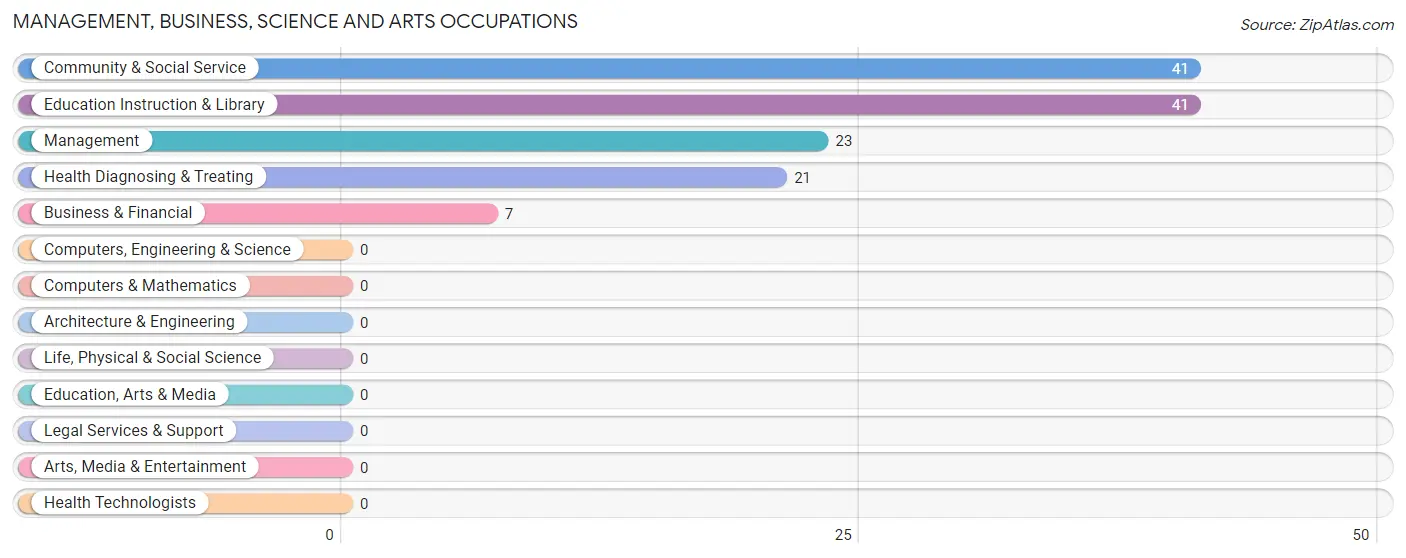
Management, Business, Science and Arts Occupations
The most common Management, Business, Science and Arts occupations in Glennallen are Community & Social Service (41 | 13.1%), Education Instruction & Library (41 | 13.1%), Management (23 | 7.3%), Health Diagnosing & Treating (21 | 6.7%), and Business & Financial (7 | 2.2%).
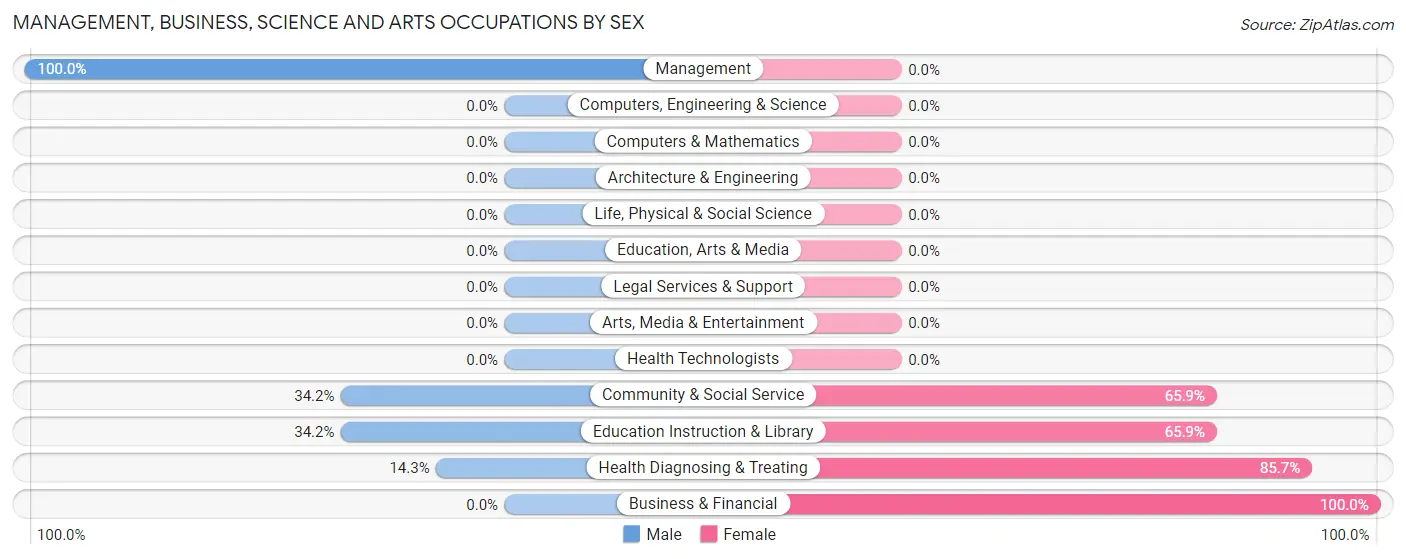
Management, Business, Science and Arts Occupations by Sex
Within the Management, Business, Science and Arts occupations in Glennallen, the most male-oriented occupations are Management (100.0%), Community & Social Service (34.2%), and Education Instruction & Library (34.2%), while the most female-oriented occupations are Business & Financial (100.0%), Health Diagnosing & Treating (85.7%), and Community & Social Service (65.8%).
| Occupation | Male | Female |
| Management | 23 (100.0%) | 0 (0.0%) |
| Business & Financial | 0 (0.0%) | 7 (100.0%) |
| Computers, Engineering & Science | 0 (0.0%) | 0 (0.0%) |
| Computers & Mathematics | 0 (0.0%) | 0 (0.0%) |
| Architecture & Engineering | 0 (0.0%) | 0 (0.0%) |
| Life, Physical & Social Science | 0 (0.0%) | 0 (0.0%) |
| Community & Social Service | 14 (34.2%) | 27 (65.8%) |
| Education, Arts & Media | 0 (0.0%) | 0 (0.0%) |
| Legal Services & Support | 0 (0.0%) | 0 (0.0%) |
| Education Instruction & Library | 14 (34.2%) | 27 (65.8%) |
| Arts, Media & Entertainment | 0 (0.0%) | 0 (0.0%) |
| Health Diagnosing & Treating | 3 (14.3%) | 18 (85.7%) |
| Health Technologists | 0 (0.0%) | 0 (0.0%) |
| Total (Category) | 40 (43.5%) | 52 (56.5%) |
| Total (Overall) | 173 (55.1%) | 141 (44.9%) |
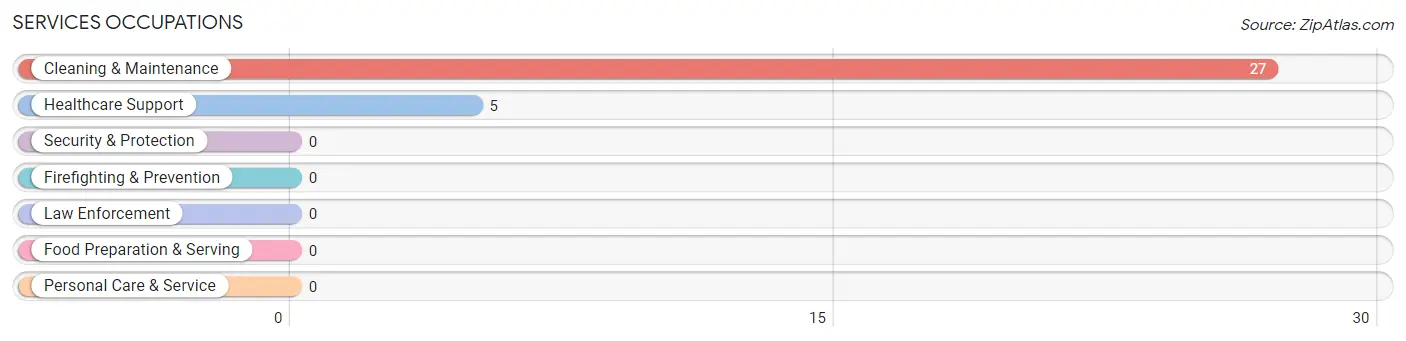
Services Occupations
The most common Services occupations in Glennallen are Cleaning & Maintenance (27 | 8.6%), and Healthcare Support (5 | 1.6%).
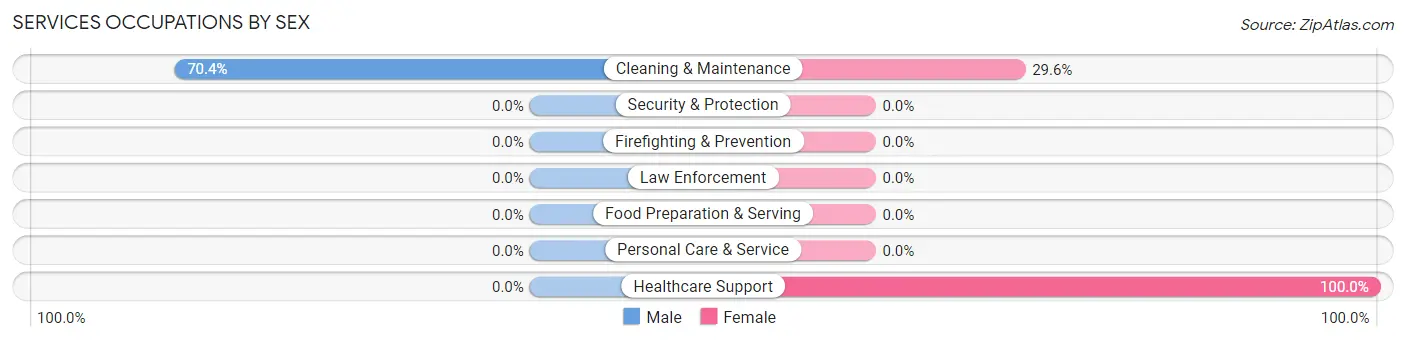
Services Occupations by Sex
| Occupation | Male | Female |
| Healthcare Support | 0 (0.0%) | 5 (100.0%) |
| Security & Protection | 0 (0.0%) | 0 (0.0%) |
| Firefighting & Prevention | 0 (0.0%) | 0 (0.0%) |
| Law Enforcement | 0 (0.0%) | 0 (0.0%) |
| Food Preparation & Serving | 0 (0.0%) | 0 (0.0%) |
| Cleaning & Maintenance | 19 (70.4%) | 8 (29.6%) |
| Personal Care & Service | 0 (0.0%) | 0 (0.0%) |
| Total (Category) | 19 (59.4%) | 13 (40.6%) |
| Total (Overall) | 173 (55.1%) | 141 (44.9%) |
Sales and Office Occupations
The most common Sales and Office occupations in Glennallen are Sales & Related (98 | 31.2%), and Office & Administration (14 | 4.5%).
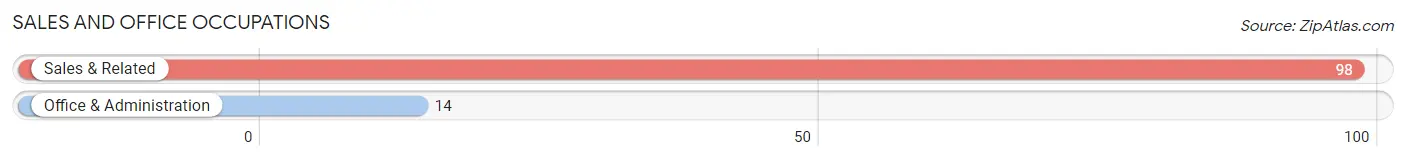
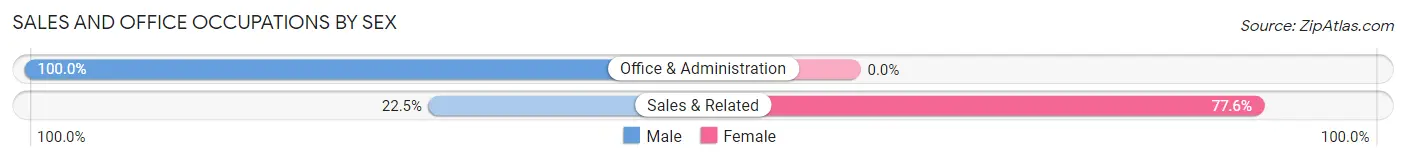
Sales and Office Occupations by Sex
| Occupation | Male | Female |
| Sales & Related | 22 (22.5%) | 76 (77.5%) |
| Office & Administration | 14 (100.0%) | 0 (0.0%) |
| Total (Category) | 36 (32.1%) | 76 (67.9%) |
| Total (Overall) | 173 (55.1%) | 141 (44.9%) |
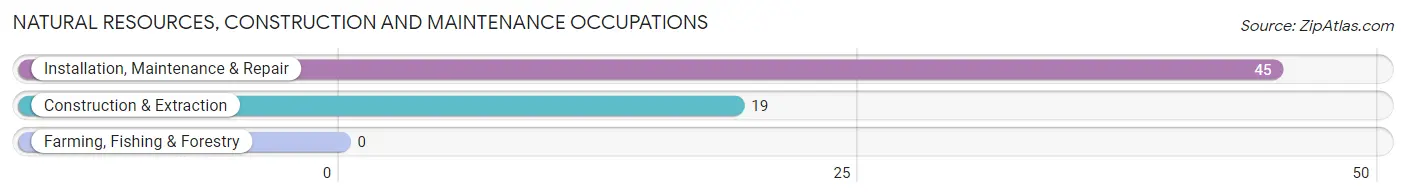
Natural Resources, Construction and Maintenance Occupations
The most common Natural Resources, Construction and Maintenance occupations in Glennallen are Installation, Maintenance & Repair (45 | 14.3%), and Construction & Extraction (19 | 6.0%).
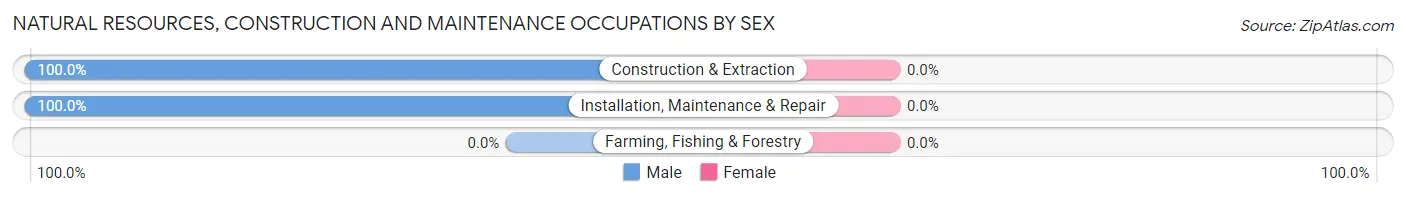
Natural Resources, Construction and Maintenance Occupations by Sex
| Occupation | Male | Female |
| Farming, Fishing & Forestry | 0 (0.0%) | 0 (0.0%) |
| Construction & Extraction | 19 (100.0%) | 0 (0.0%) |
| Installation, Maintenance & Repair | 45 (100.0%) | 0 (0.0%) |
| Total (Category) | 64 (100.0%) | 0 (0.0%) |
| Total (Overall) | 173 (55.1%) | 141 (44.9%) |
Production, Transportation and Moving Occupations
The most common Production, Transportation and Moving occupations in Glennallen are , and Transportation (14 | 4.5%).
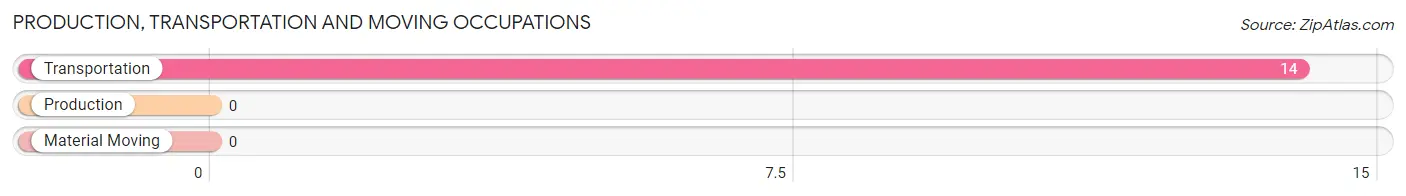
Production, Transportation and Moving Occupations by Sex
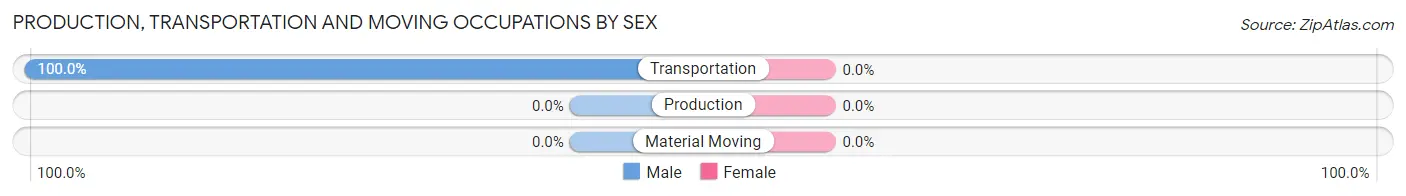
| Occupation | Male | Female |
| Production | 0 (0.0%) | 0 (0.0%) |
| Transportation | 14 (100.0%) | 0 (0.0%) |
| Material Moving | 0 (0.0%) | 0 (0.0%) |
| Total (Category) | 14 (100.0%) | 0 (0.0%) |
| Total (Overall) | 173 (55.1%) | 141 (44.9%) |
Employment Industries by Sex in Glennallen
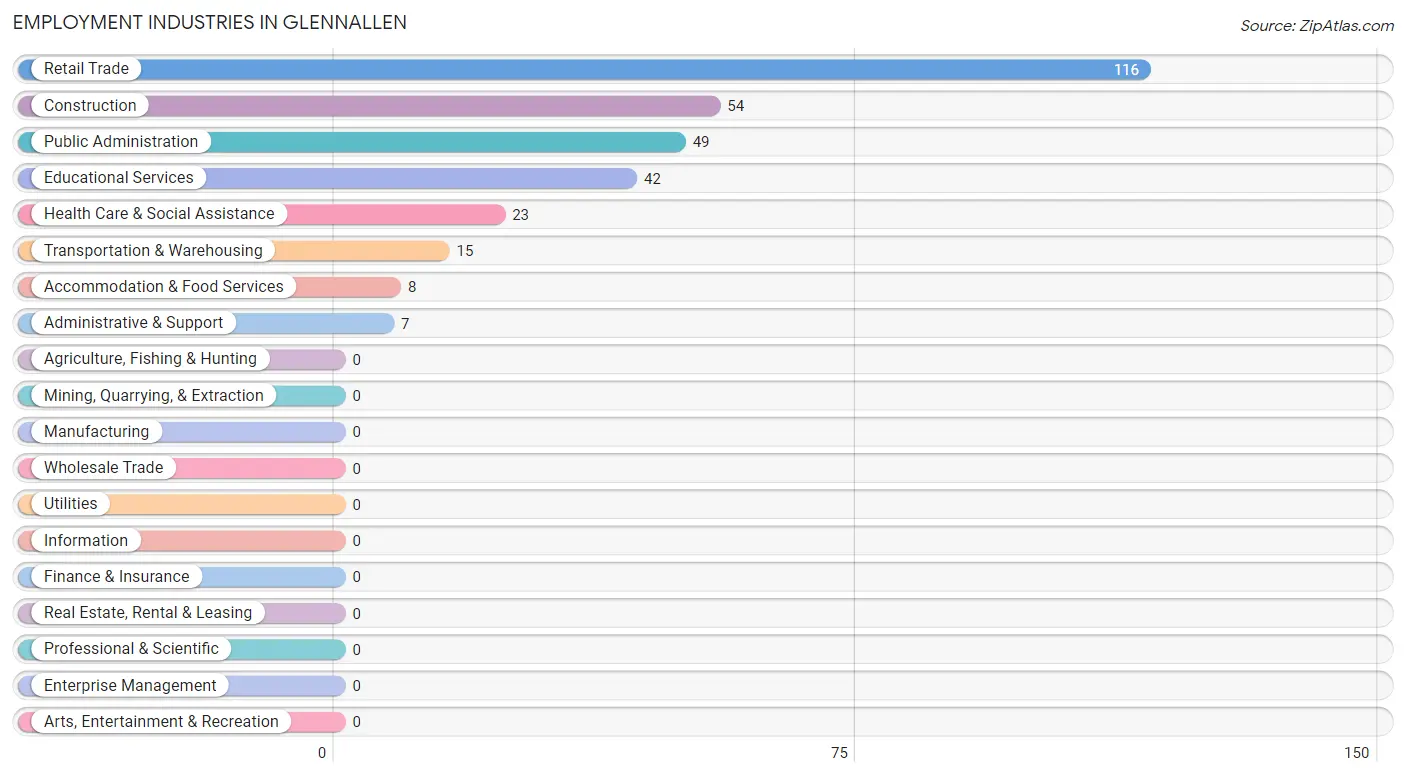
Employment Industries in Glennallen
The major employment industries in Glennallen include Retail Trade (116 | 36.9%), Construction (54 | 17.2%), Public Administration (49 | 15.6%), Educational Services (42 | 13.4%), and Health Care & Social Assistance (23 | 7.3%).
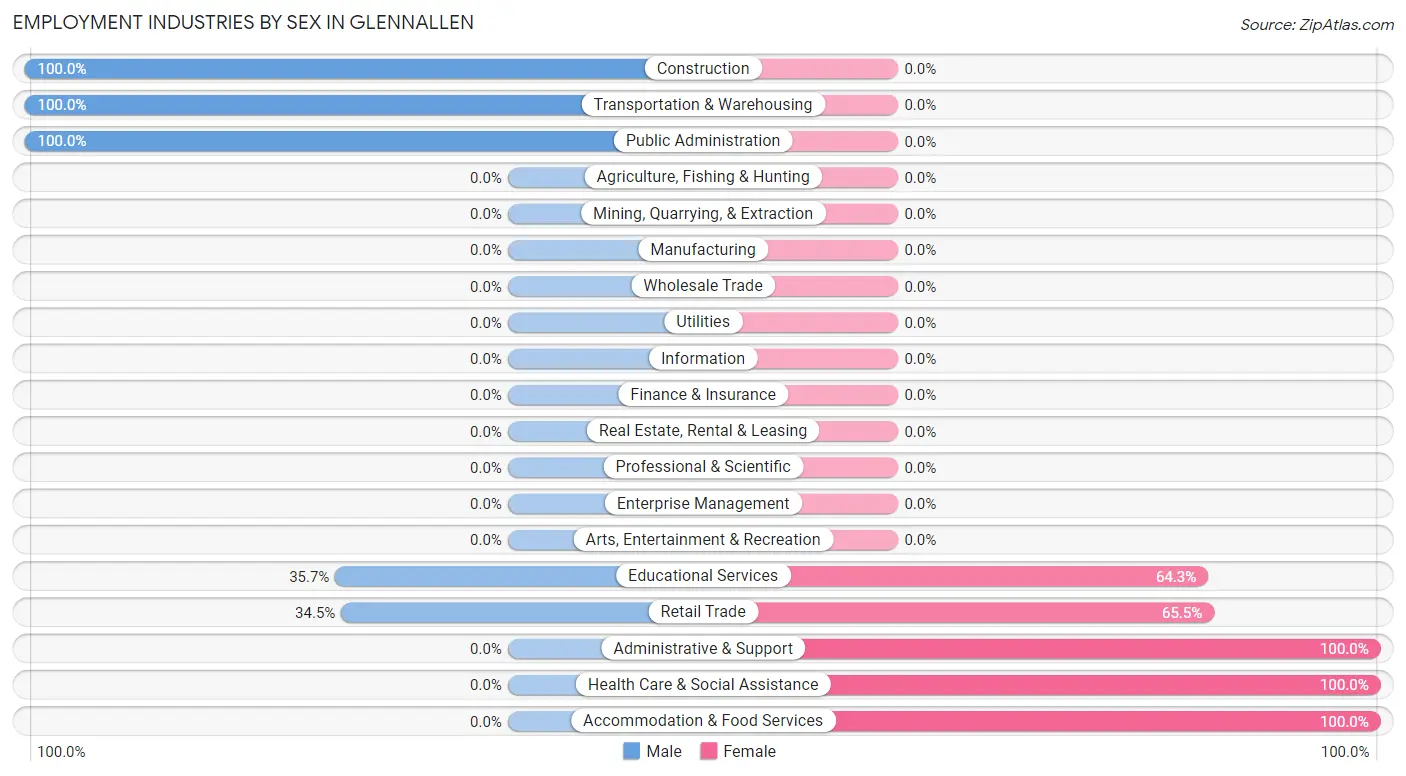
Employment Industries by Sex in Glennallen
The Glennallen industries that see more men than women are Construction (100.0%), Transportation & Warehousing (100.0%), and Public Administration (100.0%), whereas the industries that tend to have a higher number of women are Administrative & Support (100.0%), Health Care & Social Assistance (100.0%), and Accommodation & Food Services (100.0%).
| Industry | Male | Female |
| Agriculture, Fishing & Hunting | 0 (0.0%) | 0 (0.0%) |
| Mining, Quarrying, & Extraction | 0 (0.0%) | 0 (0.0%) |
| Construction | 54 (100.0%) | 0 (0.0%) |
| Manufacturing | 0 (0.0%) | 0 (0.0%) |
| Wholesale Trade | 0 (0.0%) | 0 (0.0%) |
| Retail Trade | 40 (34.5%) | 76 (65.5%) |
| Transportation & Warehousing | 15 (100.0%) | 0 (0.0%) |
| Utilities | 0 (0.0%) | 0 (0.0%) |
| Information | 0 (0.0%) | 0 (0.0%) |
| Finance & Insurance | 0 (0.0%) | 0 (0.0%) |
| Real Estate, Rental & Leasing | 0 (0.0%) | 0 (0.0%) |
| Professional & Scientific | 0 (0.0%) | 0 (0.0%) |
| Enterprise Management | 0 (0.0%) | 0 (0.0%) |
| Administrative & Support | 0 (0.0%) | 7 (100.0%) |
| Educational Services | 15 (35.7%) | 27 (64.3%) |
| Health Care & Social Assistance | 0 (0.0%) | 23 (100.0%) |
| Arts, Entertainment & Recreation | 0 (0.0%) | 0 (0.0%) |
| Accommodation & Food Services | 0 (0.0%) | 8 (100.0%) |
| Public Administration | 49 (100.0%) | 0 (0.0%) |
| Total | 173 (55.1%) | 141 (44.9%) |
Education in Glennallen
School Enrollment in Glennallen
The most common levels of schooling among the 110 students in Glennallen are middle school (47 | 42.7%), high school (28 | 25.5%), and college / undergraduate (22 | 20.0%).
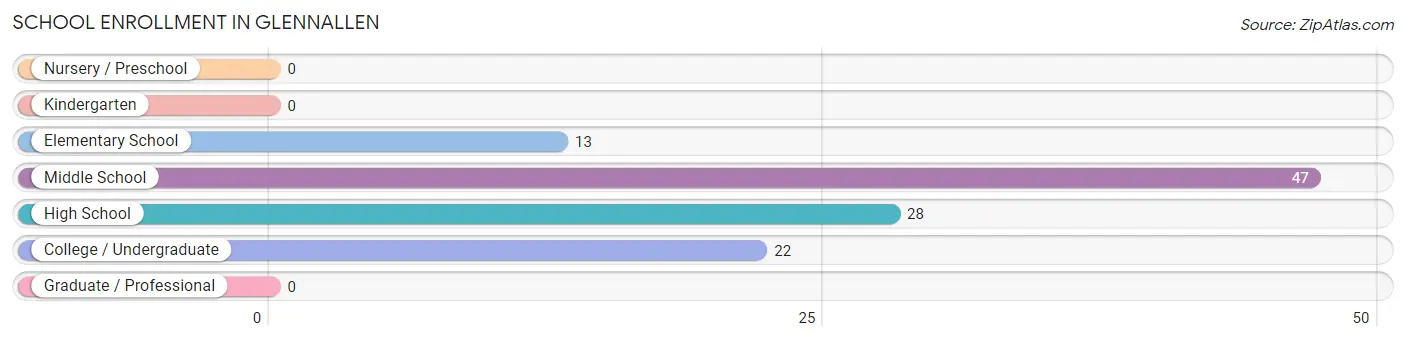
| School Level | # Students | % Students |
| Nursery / Preschool | 0 | 0.0% |
| Kindergarten | 0 | 0.0% |
| Elementary School | 13 | 11.8% |
| Middle School | 47 | 42.7% |
| High School | 28 | 25.5% |
| College / Undergraduate | 22 | 20.0% |
| Graduate / Professional | 0 | 0.0% |
| Total | 110 | 100.0% |
School Enrollment by Age by Funding Source in Glennallen
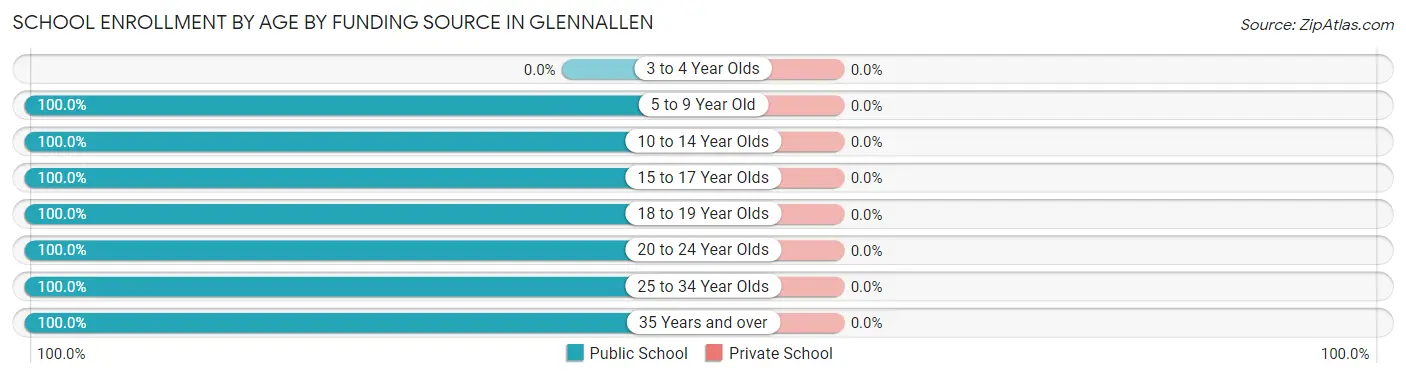
| Age Bracket | Public School | Private School |
| 3 to 4 Year Olds | 0 (0.0%) | 0 (0.0%) |
| 5 to 9 Year Old | 13 (100.0%) | 0 (0.0%) |
| 10 to 14 Year Olds | 54 (100.0%) | 0 (0.0%) |
| 15 to 17 Year Olds | 21 (100.0%) | 0 (0.0%) |
| 18 to 19 Year Olds | 5 (100.0%) | 0 (0.0%) |
| 20 to 24 Year Olds | 5 (100.0%) | 0 (0.0%) |
| 25 to 34 Year Olds | 5 (100.0%) | 0 (0.0%) |
| 35 Years and over | 7 (100.0%) | 0 (0.0%) |
| Total | 110 (100.0%) | 0 (0.0%) |
Educational Attainment by Field of Study in Glennallen
Education (51 | 51.5%), social sciences (23 | 23.2%), arts & humanities (16 | 16.2%), and bio, nature & agricultural (9 | 9.1%) are the most common fields of study among 99 individuals in Glennallen who have obtained a bachelor's degree or higher.
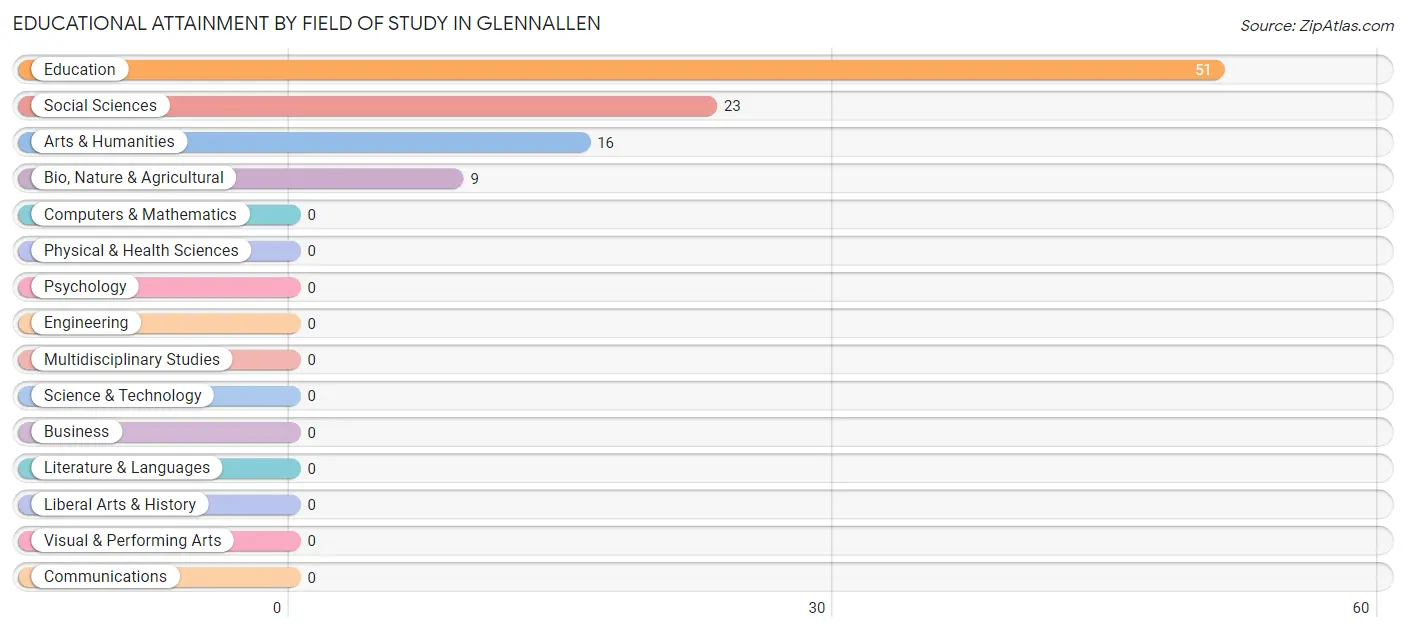
| Field of Study | # Graduates | % Graduates |
| Computers & Mathematics | 0 | 0.0% |
| Bio, Nature & Agricultural | 9 | 9.1% |
| Physical & Health Sciences | 0 | 0.0% |
| Psychology | 0 | 0.0% |
| Social Sciences | 23 | 23.2% |
| Engineering | 0 | 0.0% |
| Multidisciplinary Studies | 0 | 0.0% |
| Science & Technology | 0 | 0.0% |
| Business | 0 | 0.0% |
| Education | 51 | 51.5% |
| Literature & Languages | 0 | 0.0% |
| Liberal Arts & History | 0 | 0.0% |
| Visual & Performing Arts | 0 | 0.0% |
| Communications | 0 | 0.0% |
| Arts & Humanities | 16 | 16.2% |
| Total | 99 | 100.0% |
Transportation & Commute in Glennallen
Vehicle Availability by Sex in Glennallen
The most prevalent vehicle ownership categories in Glennallen are males with 2 vehicles (87, accounting for 51.5%) and females with 2 vehicles (40, making up 61.7%).
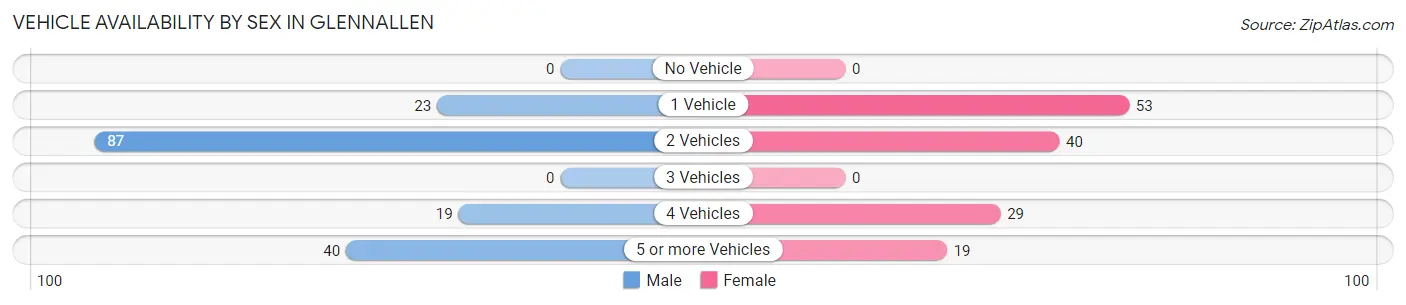
| Vehicles Available | Male | Female |
| No Vehicle | 0 (0.0%) | 0 (0.0%) |
| 1 Vehicle | 23 (13.6%) | 53 (37.6%) |
| 2 Vehicles | 87 (51.5%) | 40 (28.4%) |
| 3 Vehicles | 0 (0.0%) | 0 (0.0%) |
| 4 Vehicles | 19 (11.2%) | 29 (20.6%) |
| 5 or more Vehicles | 40 (23.7%) | 19 (13.5%) |
| Total | 169 (100.0%) | 141 (100.0%) |
Commute Time in Glennallen
The most frequently occuring commute durations in Glennallen are less than 5 minutes (85 commuters, 29.8%), 10 to 14 minutes (47 commuters, 16.5%), and 5 to 9 minutes (44 commuters, 15.4%).
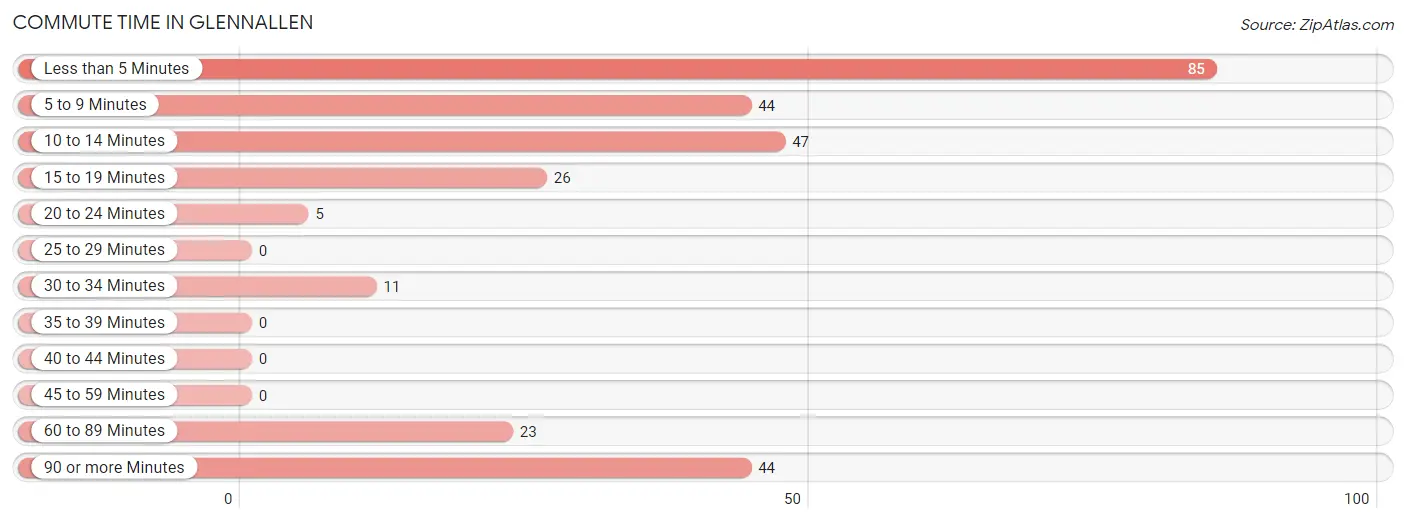
| Commute Time | # Commuters | % Commuters |
| Less than 5 Minutes | 85 | 29.8% |
| 5 to 9 Minutes | 44 | 15.4% |
| 10 to 14 Minutes | 47 | 16.5% |
| 15 to 19 Minutes | 26 | 9.1% |
| 20 to 24 Minutes | 5 | 1.8% |
| 25 to 29 Minutes | 0 | 0.0% |
| 30 to 34 Minutes | 11 | 3.9% |
| 35 to 39 Minutes | 0 | 0.0% |
| 40 to 44 Minutes | 0 | 0.0% |
| 45 to 59 Minutes | 0 | 0.0% |
| 60 to 89 Minutes | 23 | 8.1% |
| 90 or more Minutes | 44 | 15.4% |
Commute Time by Sex in Glennallen
The most common commute times in Glennallen are less than 5 minutes (59 commuters, 34.7%) for males and 5 to 9 minutes (29 commuters, 25.2%) for females.
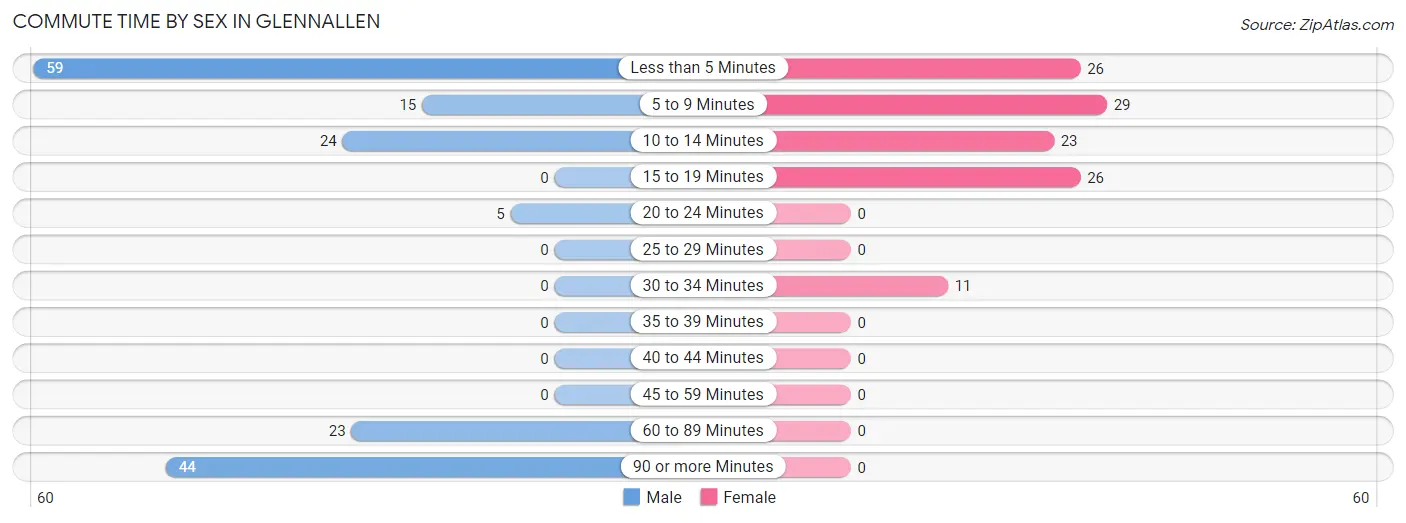
| Commute Time | Male | Female |
| Less than 5 Minutes | 59 (34.7%) | 26 (22.6%) |
| 5 to 9 Minutes | 15 (8.8%) | 29 (25.2%) |
| 10 to 14 Minutes | 24 (14.1%) | 23 (20.0%) |
| 15 to 19 Minutes | 0 (0.0%) | 26 (22.6%) |
| 20 to 24 Minutes | 5 (2.9%) | 0 (0.0%) |
| 25 to 29 Minutes | 0 (0.0%) | 0 (0.0%) |
| 30 to 34 Minutes | 0 (0.0%) | 11 (9.6%) |
| 35 to 39 Minutes | 0 (0.0%) | 0 (0.0%) |
| 40 to 44 Minutes | 0 (0.0%) | 0 (0.0%) |
| 45 to 59 Minutes | 0 (0.0%) | 0 (0.0%) |
| 60 to 89 Minutes | 23 (13.5%) | 0 (0.0%) |
| 90 or more Minutes | 44 (25.9%) | 0 (0.0%) |
Time of Departure to Work by Sex in Glennallen
The most frequent times of departure to work in Glennallen are 4:00 PM to 11:59 PM (50, 29.4%) for males and 7:30 AM to 7:59 AM (63, 54.8%) for females.
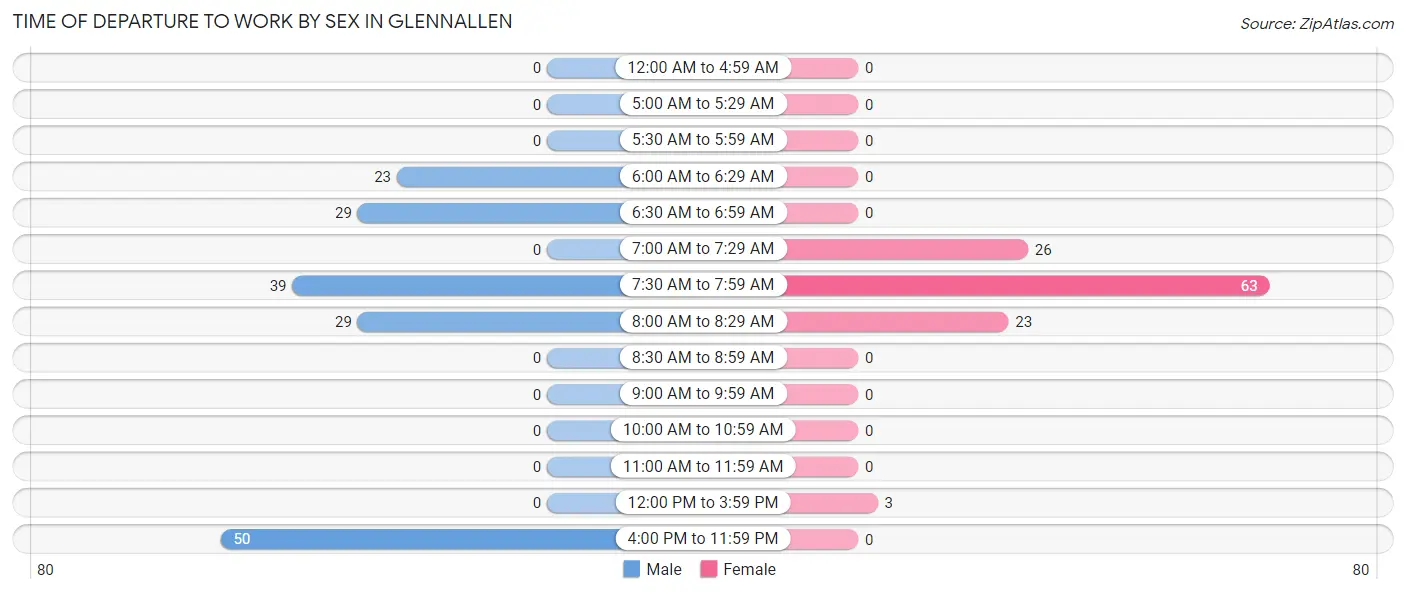
| Time of Departure | Male | Female |
| 12:00 AM to 4:59 AM | 0 (0.0%) | 0 (0.0%) |
| 5:00 AM to 5:29 AM | 0 (0.0%) | 0 (0.0%) |
| 5:30 AM to 5:59 AM | 0 (0.0%) | 0 (0.0%) |
| 6:00 AM to 6:29 AM | 23 (13.5%) | 0 (0.0%) |
| 6:30 AM to 6:59 AM | 29 (17.1%) | 0 (0.0%) |
| 7:00 AM to 7:29 AM | 0 (0.0%) | 26 (22.6%) |
| 7:30 AM to 7:59 AM | 39 (22.9%) | 63 (54.8%) |
| 8:00 AM to 8:29 AM | 29 (17.1%) | 23 (20.0%) |
| 8:30 AM to 8:59 AM | 0 (0.0%) | 0 (0.0%) |
| 9:00 AM to 9:59 AM | 0 (0.0%) | 0 (0.0%) |
| 10:00 AM to 10:59 AM | 0 (0.0%) | 0 (0.0%) |
| 11:00 AM to 11:59 AM | 0 (0.0%) | 0 (0.0%) |
| 12:00 PM to 3:59 PM | 0 (0.0%) | 3 (2.6%) |
| 4:00 PM to 11:59 PM | 50 (29.4%) | 0 (0.0%) |
| Total | 170 (100.0%) | 115 (100.0%) |
Housing Occupancy in Glennallen
Occupancy by Ownership in Glennallen
Of the total 238 dwellings in Glennallen, owner-occupied units account for 116 (48.7%), while renter-occupied units make up 122 (51.3%).
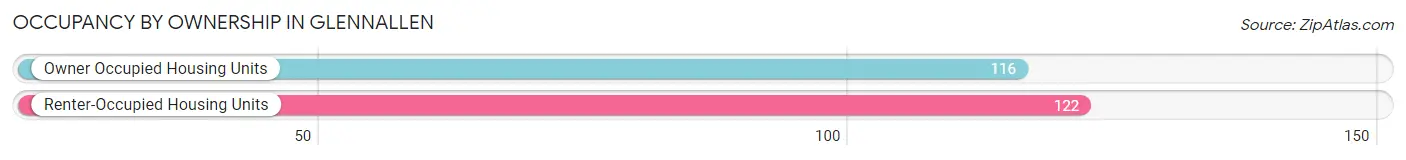
| Occupancy | # Housing Units | % Housing Units |
| Owner Occupied Housing Units | 116 | 48.7% |
| Renter-Occupied Housing Units | 122 | 51.3% |
| Total Occupied Housing Units | 238 | 100.0% |
Occupancy by Household Size in Glennallen
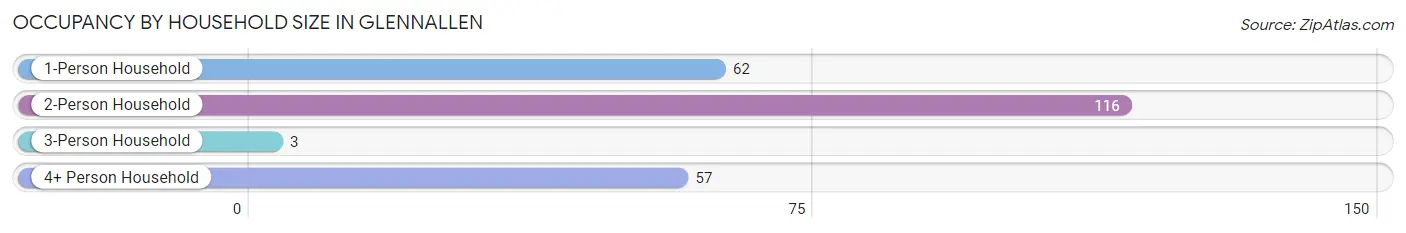
| Household Size | # Housing Units | % Housing Units |
| 1-Person Household | 62 | 26.1% |
| 2-Person Household | 116 | 48.7% |
| 3-Person Household | 3 | 1.3% |
| 4+ Person Household | 57 | 23.9% |
| Total Housing Units | 238 | 100.0% |
Occupancy by Ownership by Household Size in Glennallen
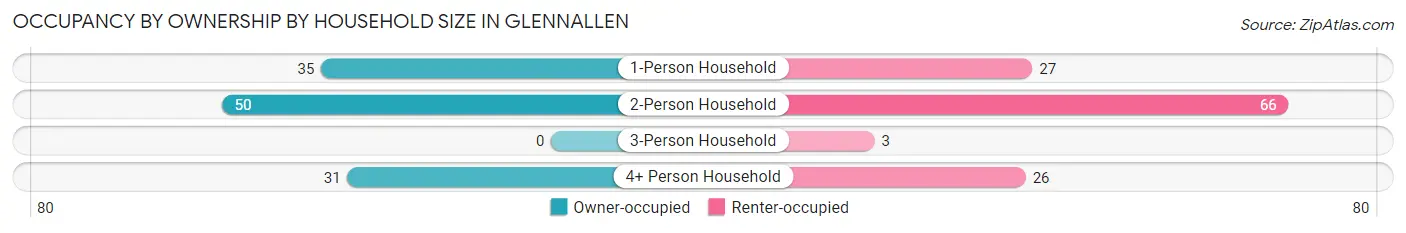
| Household Size | Owner-occupied | Renter-occupied |
| 1-Person Household | 35 (56.5%) | 27 (43.5%) |
| 2-Person Household | 50 (43.1%) | 66 (56.9%) |
| 3-Person Household | 0 (0.0%) | 3 (100.0%) |
| 4+ Person Household | 31 (54.4%) | 26 (45.6%) |
| Total Housing Units | 116 (48.7%) | 122 (51.3%) |
Occupancy by Educational Attainment in Glennallen
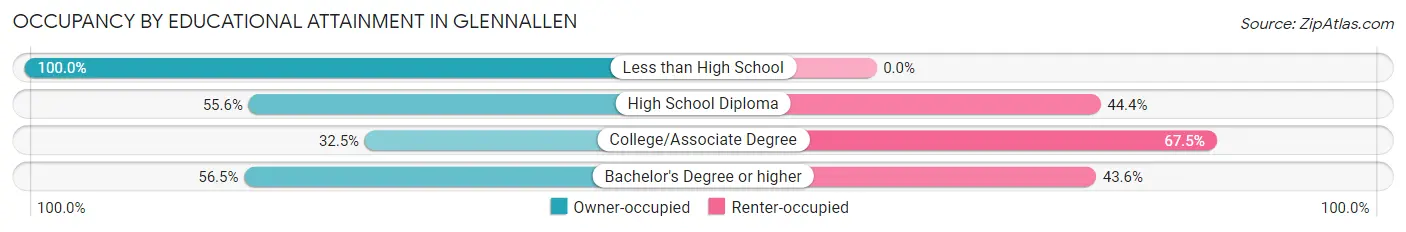
| Household Size | Owner-occupied | Renter-occupied |
| Less than High School | 26 (100.0%) | 0 (0.0%) |
| High School Diploma | 15 (55.6%) | 12 (44.4%) |
| College/Associate Degree | 40 (32.5%) | 83 (67.5%) |
| Bachelor's Degree or higher | 35 (56.5%) | 27 (43.5%) |
Occupancy by Age of Householder in Glennallen
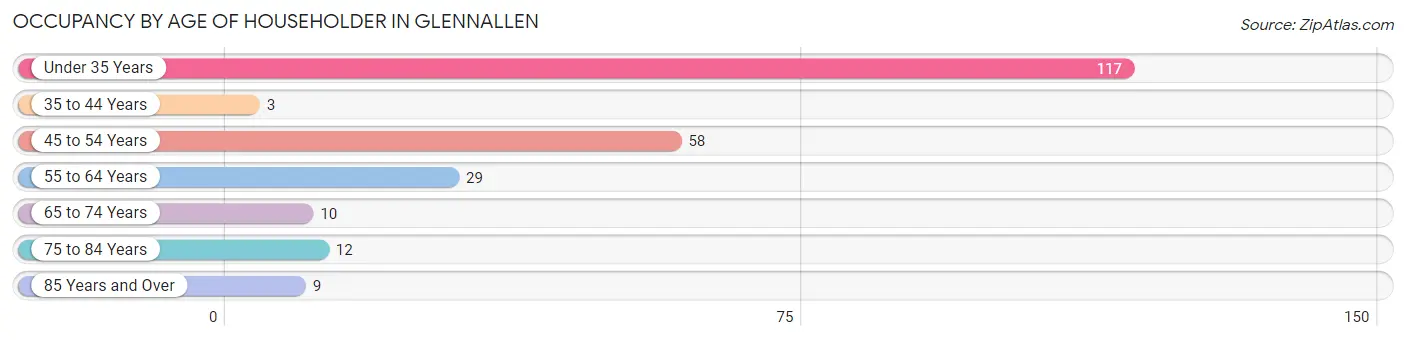
| Age Bracket | # Households | % Households |
| Under 35 Years | 117 | 49.2% |
| 35 to 44 Years | 3 | 1.3% |
| 45 to 54 Years | 58 | 24.4% |
| 55 to 64 Years | 29 | 12.2% |
| 65 to 74 Years | 10 | 4.2% |
| 75 to 84 Years | 12 | 5.0% |
| 85 Years and Over | 9 | 3.8% |
| Total | 238 | 100.0% |
Housing Finances in Glennallen
Median Income by Occupancy in Glennallen
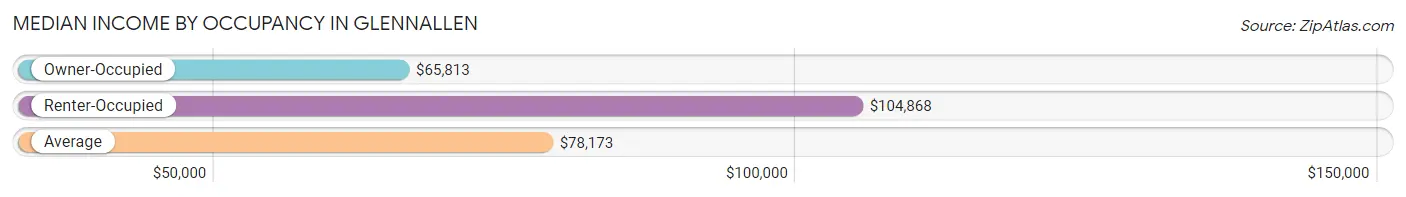
| Occupancy Type | # Households | Median Income |
| Owner-Occupied | 116 (48.7%) | $65,813 |
| Renter-Occupied | 122 (51.3%) | $104,868 |
| Average | 238 (100.0%) | $78,173 |
Occupancy by Householder Income Bracket in Glennallen
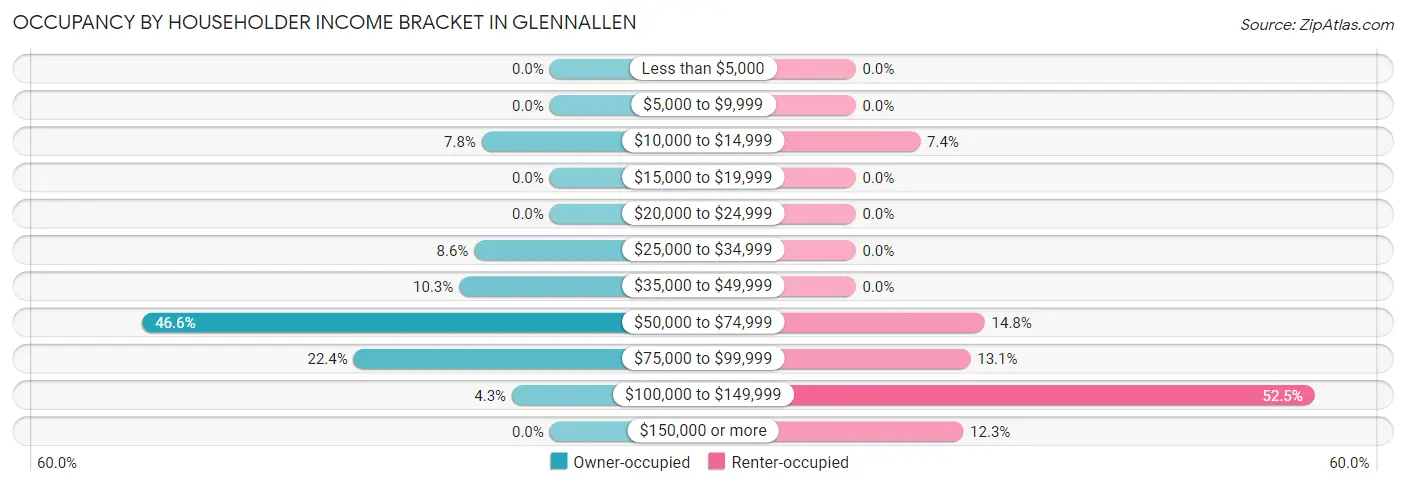
| Income Bracket | Owner-occupied | Renter-occupied |
| Less than $5,000 | 0 (0.0%) | 0 (0.0%) |
| $5,000 to $9,999 | 0 (0.0%) | 0 (0.0%) |
| $10,000 to $14,999 | 9 (7.8%) | 9 (7.4%) |
| $15,000 to $19,999 | 0 (0.0%) | 0 (0.0%) |
| $20,000 to $24,999 | 0 (0.0%) | 0 (0.0%) |
| $25,000 to $34,999 | 10 (8.6%) | 0 (0.0%) |
| $35,000 to $49,999 | 12 (10.3%) | 0 (0.0%) |
| $50,000 to $74,999 | 54 (46.6%) | 18 (14.7%) |
| $75,000 to $99,999 | 26 (22.4%) | 16 (13.1%) |
| $100,000 to $149,999 | 5 (4.3%) | 64 (52.5%) |
| $150,000 or more | 0 (0.0%) | 15 (12.3%) |
| Total | 116 (100.0%) | 122 (100.0%) |
Monthly Housing Cost Tiers in Glennallen
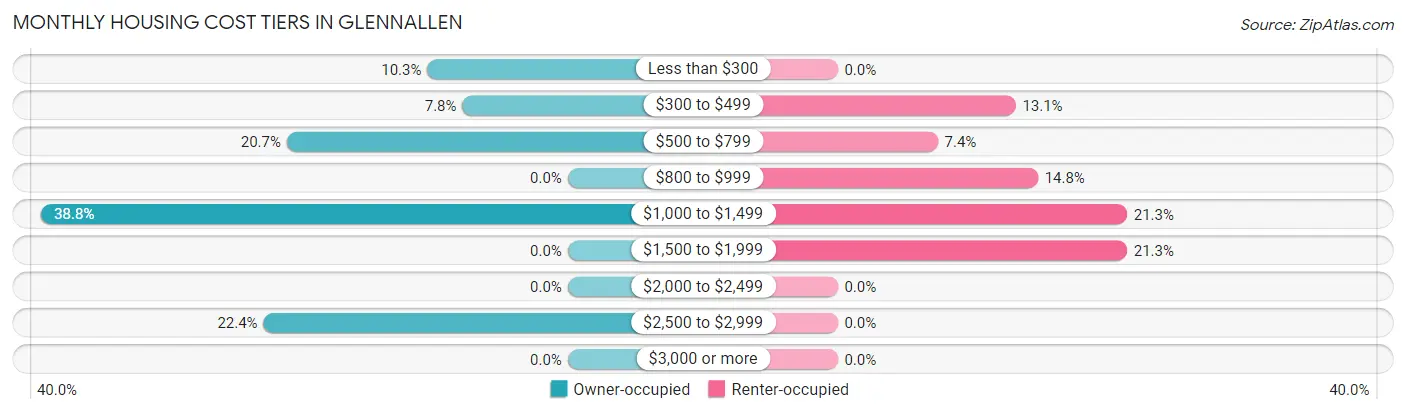
| Monthly Cost | Owner-occupied | Renter-occupied |
| Less than $300 | 12 (10.3%) | 0 (0.0%) |
| $300 to $499 | 9 (7.8%) | 16 (13.1%) |
| $500 to $799 | 24 (20.7%) | 9 (7.4%) |
| $800 to $999 | 0 (0.0%) | 18 (14.7%) |
| $1,000 to $1,499 | 45 (38.8%) | 26 (21.3%) |
| $1,500 to $1,999 | 0 (0.0%) | 26 (21.3%) |
| $2,000 to $2,499 | 0 (0.0%) | 0 (0.0%) |
| $2,500 to $2,999 | 26 (22.4%) | 0 (0.0%) |
| $3,000 or more | 0 (0.0%) | 0 (0.0%) |
| Total | 116 (100.0%) | 122 (100.0%) |
Physical Housing Characteristics in Glennallen
Housing Structures in Glennallen
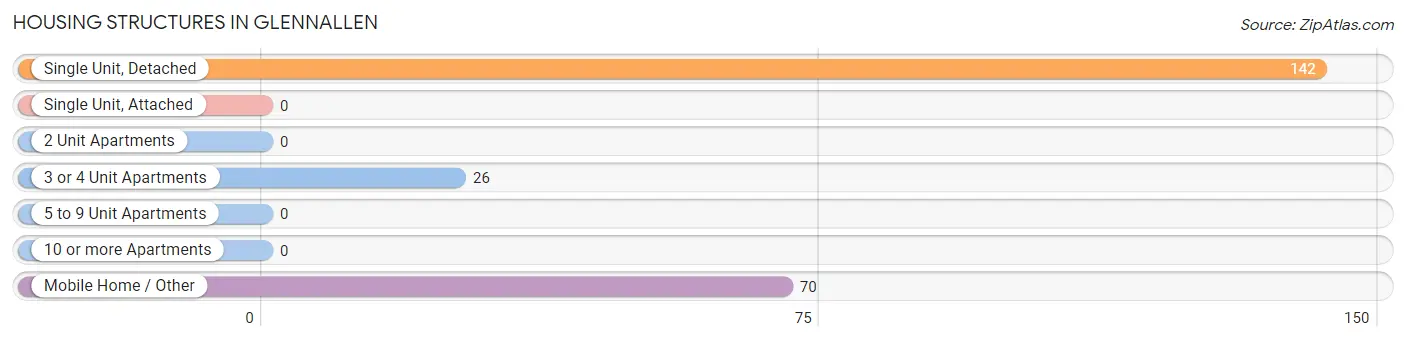
| Structure Type | # Housing Units | % Housing Units |
| Single Unit, Detached | 142 | 59.7% |
| Single Unit, Attached | 0 | 0.0% |
| 2 Unit Apartments | 0 | 0.0% |
| 3 or 4 Unit Apartments | 26 | 10.9% |
| 5 to 9 Unit Apartments | 0 | 0.0% |
| 10 or more Apartments | 0 | 0.0% |
| Mobile Home / Other | 70 | 29.4% |
| Total | 238 | 100.0% |
Housing Structures by Occupancy in Glennallen
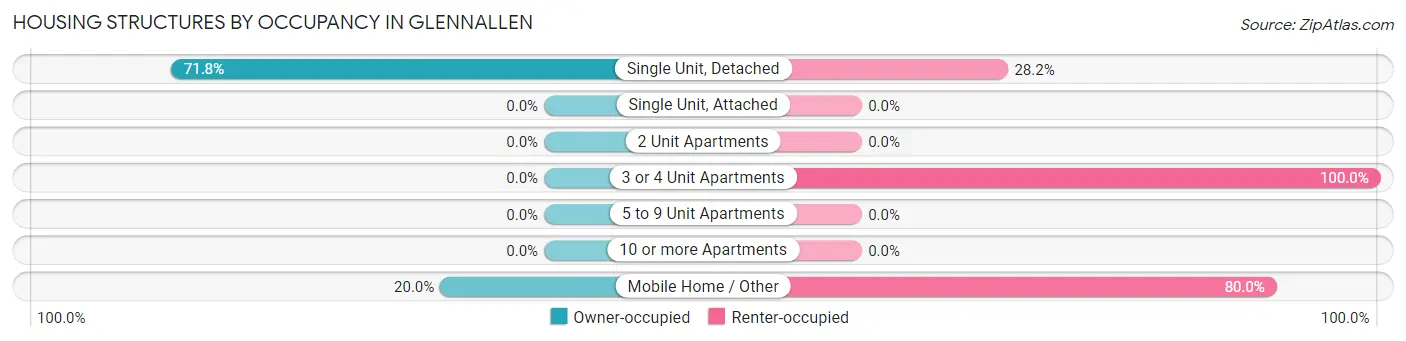
| Structure Type | Owner-occupied | Renter-occupied |
| Single Unit, Detached | 102 (71.8%) | 40 (28.2%) |
| Single Unit, Attached | 0 (0.0%) | 0 (0.0%) |
| 2 Unit Apartments | 0 (0.0%) | 0 (0.0%) |
| 3 or 4 Unit Apartments | 0 (0.0%) | 26 (100.0%) |
| 5 to 9 Unit Apartments | 0 (0.0%) | 0 (0.0%) |
| 10 or more Apartments | 0 (0.0%) | 0 (0.0%) |
| Mobile Home / Other | 14 (20.0%) | 56 (80.0%) |
| Total | 116 (48.7%) | 122 (51.3%) |
Housing Structures by Number of Rooms in Glennallen
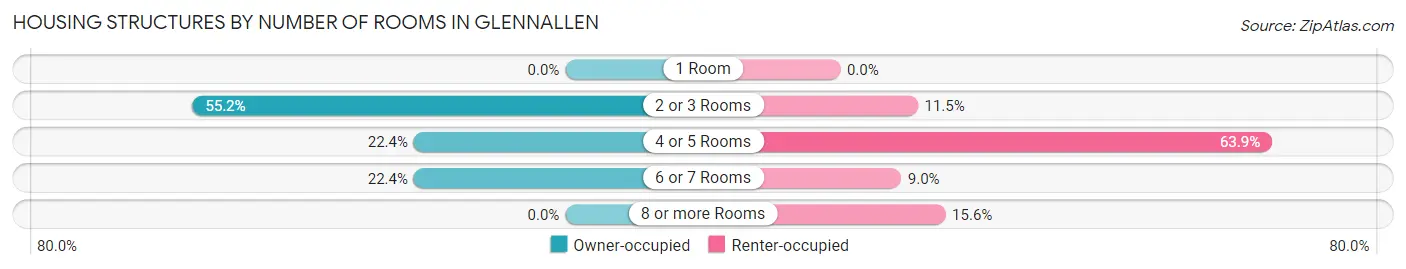
| Number of Rooms | Owner-occupied | Renter-occupied |
| 1 Room | 0 (0.0%) | 0 (0.0%) |
| 2 or 3 Rooms | 64 (55.2%) | 14 (11.5%) |
| 4 or 5 Rooms | 26 (22.4%) | 78 (63.9%) |
| 6 or 7 Rooms | 26 (22.4%) | 11 (9.0%) |
| 8 or more Rooms | 0 (0.0%) | 19 (15.6%) |
| Total | 116 (100.0%) | 122 (100.0%) |
Housing Structure by Heating Type in Glennallen
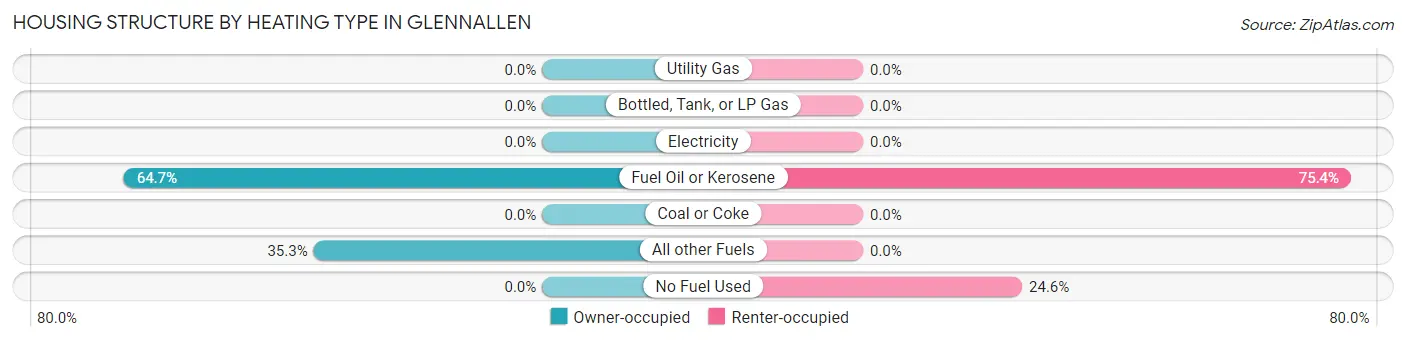
| Heating Type | Owner-occupied | Renter-occupied |
| Utility Gas | 0 (0.0%) | 0 (0.0%) |
| Bottled, Tank, or LP Gas | 0 (0.0%) | 0 (0.0%) |
| Electricity | 0 (0.0%) | 0 (0.0%) |
| Fuel Oil or Kerosene | 75 (64.7%) | 92 (75.4%) |
| Coal or Coke | 0 (0.0%) | 0 (0.0%) |
| All other Fuels | 41 (35.3%) | 0 (0.0%) |
| No Fuel Used | 0 (0.0%) | 30 (24.6%) |
| Total | 116 (100.0%) | 122 (100.0%) |
Household Vehicle Usage in Glennallen
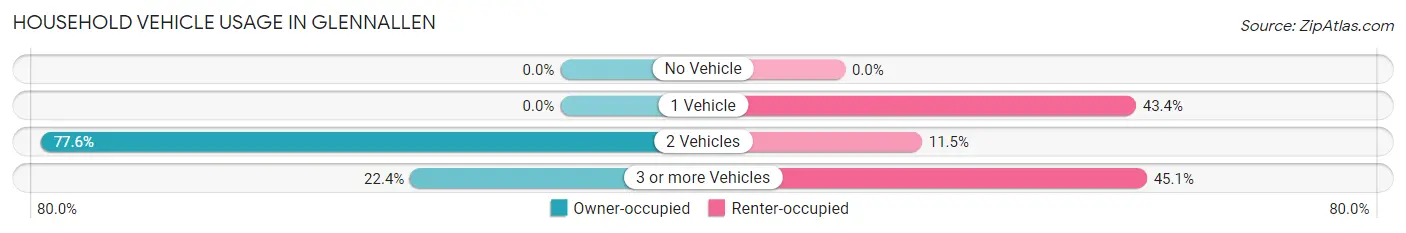
| Vehicles per Household | Owner-occupied | Renter-occupied |
| No Vehicle | 0 (0.0%) | 0 (0.0%) |
| 1 Vehicle | 0 (0.0%) | 53 (43.4%) |
| 2 Vehicles | 90 (77.6%) | 14 (11.5%) |
| 3 or more Vehicles | 26 (22.4%) | 55 (45.1%) |
| Total | 116 (100.0%) | 122 (100.0%) |
Real Estate & Mortgages in Glennallen
Real Estate and Mortgage Overview in Glennallen
| Characteristic | Without Mortgage | With Mortgage |
| Housing Units | 40 | 76 |
| Median Property Value | $233,300 | $0 |
| Median Household Income | $49,792 | $0 |
| Monthly Housing Costs | $489 | $0 |
| Real Estate Taxes | - | - |
Property Value by Mortgage Status in Glennallen
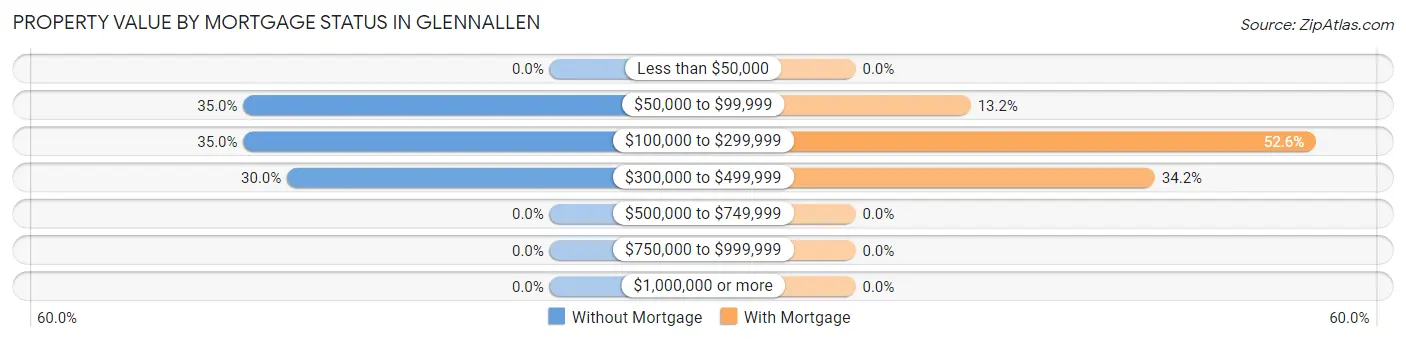
| Property Value | Without Mortgage | With Mortgage |
| Less than $50,000 | 0 (0.0%) | 0 (0.0%) |
| $50,000 to $99,999 | 14 (35.0%) | 10 (13.2%) |
| $100,000 to $299,999 | 14 (35.0%) | 40 (52.6%) |
| $300,000 to $499,999 | 12 (30.0%) | 26 (34.2%) |
| $500,000 to $749,999 | 0 (0.0%) | 0 (0.0%) |
| $750,000 to $999,999 | 0 (0.0%) | 0 (0.0%) |
| $1,000,000 or more | 0 (0.0%) | 0 (0.0%) |
| Total | 40 (100.0%) | 76 (100.0%) |
Household Income by Mortgage Status in Glennallen
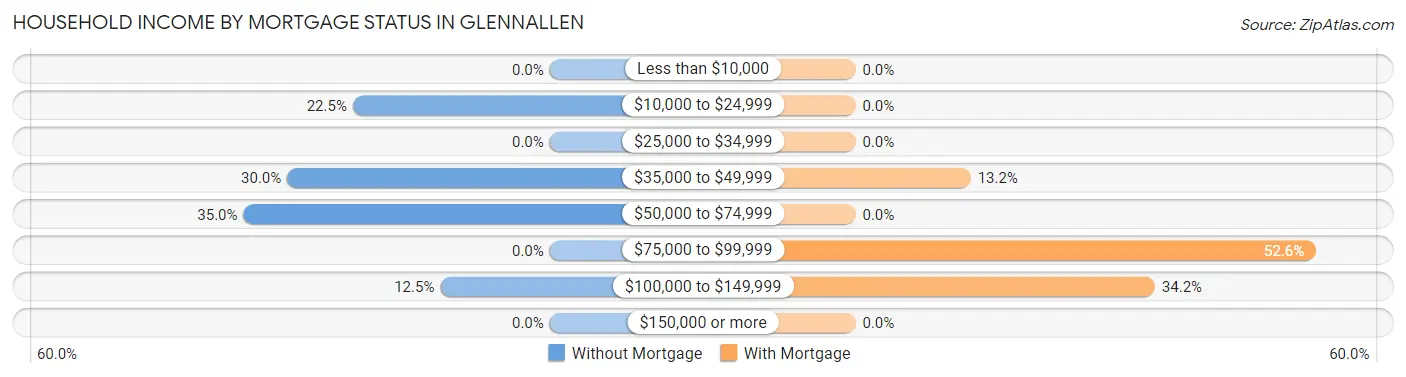
| Household Income | Without Mortgage | With Mortgage |
| Less than $10,000 | 0 (0.0%) | 0 (0.0%) |
| $10,000 to $24,999 | 9 (22.5%) | 0 (0.0%) |
| $25,000 to $34,999 | 0 (0.0%) | 0 (0.0%) |
| $35,000 to $49,999 | 12 (30.0%) | 10 (13.2%) |
| $50,000 to $74,999 | 14 (35.0%) | 0 (0.0%) |
| $75,000 to $99,999 | 0 (0.0%) | 40 (52.6%) |
| $100,000 to $149,999 | 5 (12.5%) | 26 (34.2%) |
| $150,000 or more | 0 (0.0%) | 0 (0.0%) |
| Total | 40 (100.0%) | 76 (100.0%) |
Property Value to Household Income Ratio in Glennallen
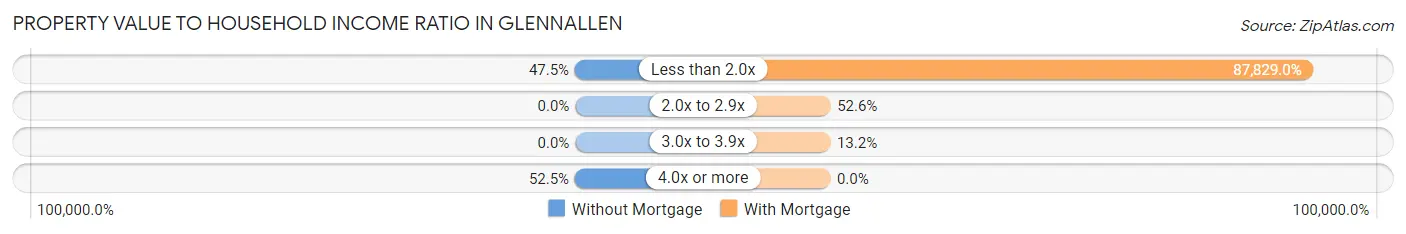
| Value-to-Income Ratio | Without Mortgage | With Mortgage |
| Less than 2.0x | 19 (47.5%) | 66,750 (87,828.9%) |
| 2.0x to 2.9x | 0 (0.0%) | 40 (52.6%) |
| 3.0x to 3.9x | 0 (0.0%) | 10 (13.2%) |
| 4.0x or more | 21 (52.5%) | 0 (0.0%) |
| Total | 40 (100.0%) | 76 (100.0%) |
Real Estate Taxes by Mortgage Status in Glennallen
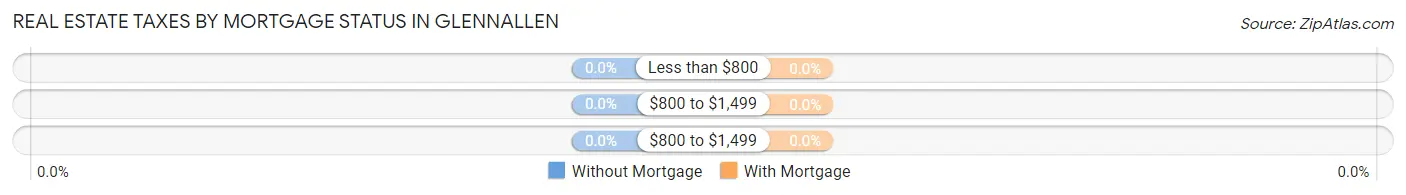
| Property Taxes | Without Mortgage | With Mortgage |
| Less than $800 | 0 (0.0%) | 0 (0.0%) |
| $800 to $1,499 | 0 (0.0%) | 0 (0.0%) |
| $800 to $1,499 | 0 (0.0%) | 0 (0.0%) |
| Total | 40 (100.0%) | 76 (100.0%) |
Health & Disability in Glennallen
Health Insurance Coverage by Age in Glennallen
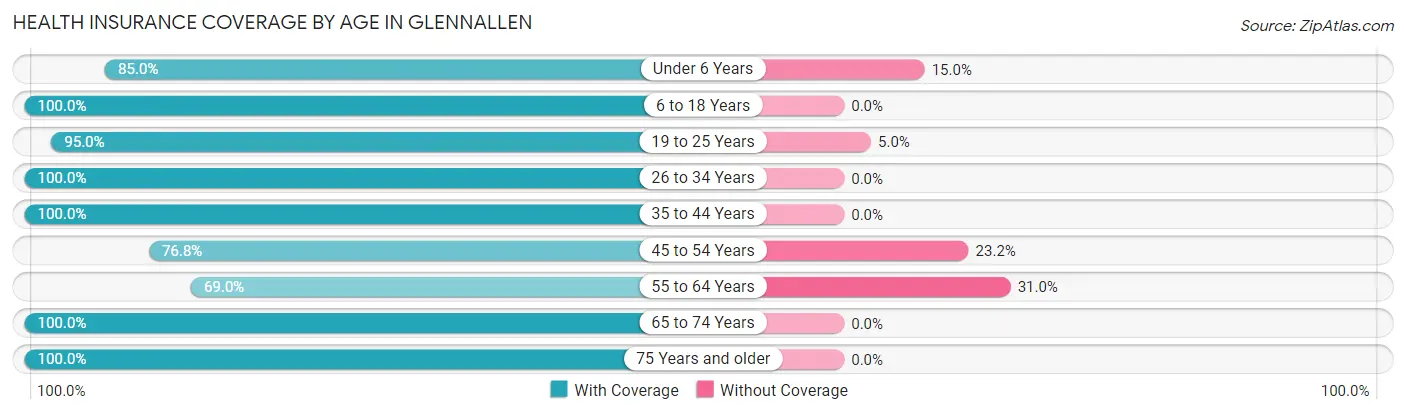
| Age Bracket | With Coverage | Without Coverage |
| Under 6 Years | 51 (85.0%) | 9 (15.0%) |
| 6 to 18 Years | 89 (100.0%) | 0 (0.0%) |
| 19 to 25 Years | 57 (95.0%) | 3 (5.0%) |
| 26 to 34 Years | 85 (100.0%) | 0 (0.0%) |
| 35 to 44 Years | 33 (100.0%) | 0 (0.0%) |
| 45 to 54 Years | 53 (76.8%) | 16 (23.2%) |
| 55 to 64 Years | 60 (69.0%) | 27 (31.0%) |
| 65 to 74 Years | 10 (100.0%) | 0 (0.0%) |
| 75 Years and older | 29 (100.0%) | 0 (0.0%) |
| Total | 467 (89.5%) | 55 (10.5%) |
Health Insurance Coverage by Citizenship Status in Glennallen
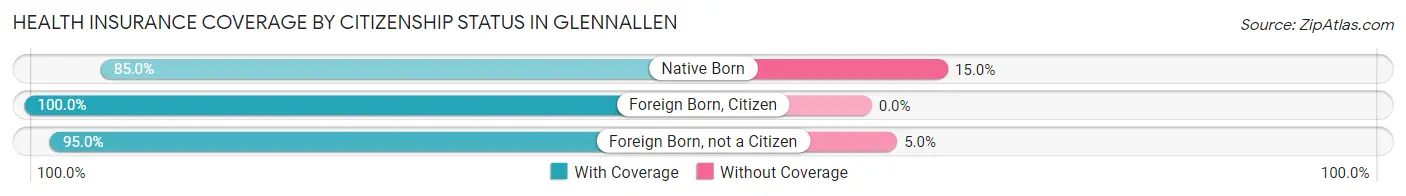
| Citizenship Status | With Coverage | Without Coverage |
| Native Born | 51 (85.0%) | 9 (15.0%) |
| Foreign Born, Citizen | 89 (100.0%) | 0 (0.0%) |
| Foreign Born, not a Citizen | 57 (95.0%) | 3 (5.0%) |
Health Insurance Coverage by Household Income in Glennallen
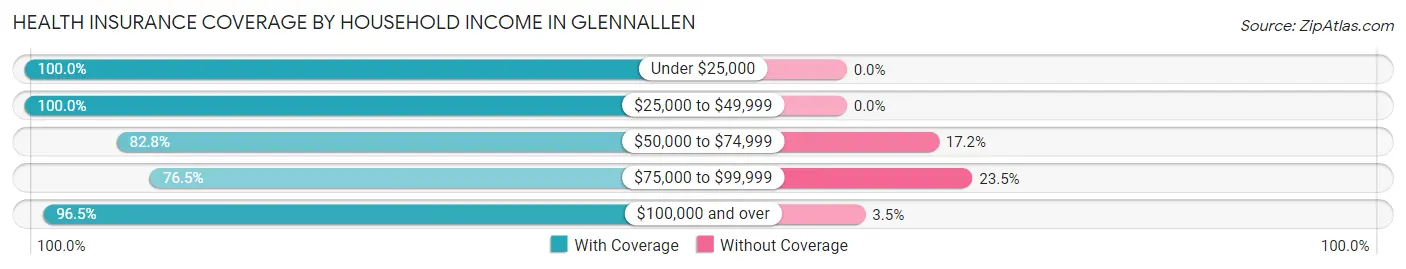
| Household Income | With Coverage | Without Coverage |
| Under $25,000 | 18 (100.0%) | 0 (0.0%) |
| $25,000 to $49,999 | 30 (100.0%) | 0 (0.0%) |
| $50,000 to $74,999 | 72 (82.8%) | 15 (17.2%) |
| $75,000 to $99,999 | 91 (76.5%) | 28 (23.5%) |
| $100,000 and over | 249 (96.5%) | 9 (3.5%) |
Public vs Private Health Insurance Coverage by Age in Glennallen
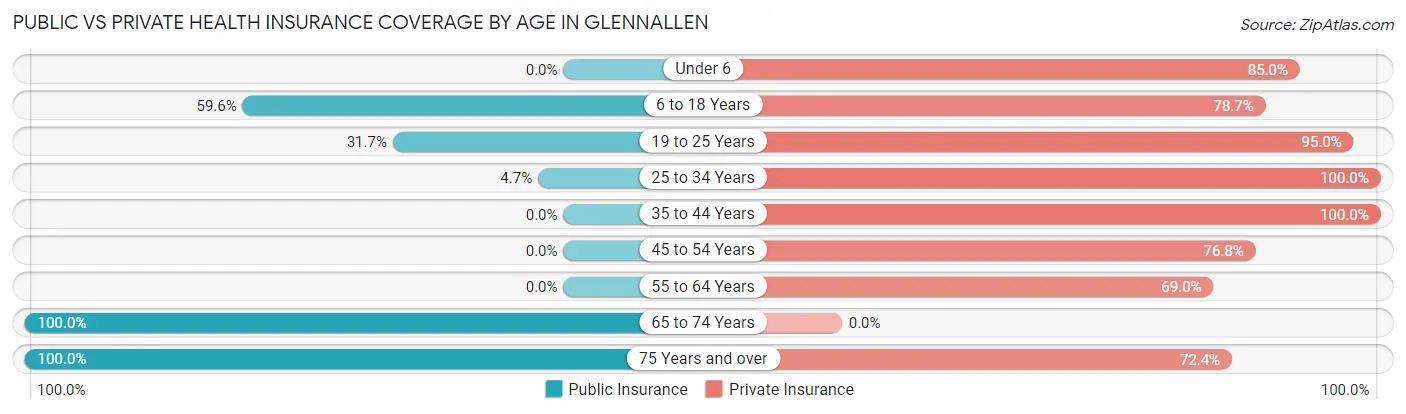
| Age Bracket | Public Insurance | Private Insurance |
| Under 6 | 0 (0.0%) | 51 (85.0%) |
| 6 to 18 Years | 53 (59.6%) | 70 (78.6%) |
| 19 to 25 Years | 19 (31.7%) | 57 (95.0%) |
| 25 to 34 Years | 4 (4.7%) | 85 (100.0%) |
| 35 to 44 Years | 0 (0.0%) | 33 (100.0%) |
| 45 to 54 Years | 0 (0.0%) | 53 (76.8%) |
| 55 to 64 Years | 0 (0.0%) | 60 (69.0%) |
| 65 to 74 Years | 10 (100.0%) | 0 (0.0%) |
| 75 Years and over | 29 (100.0%) | 21 (72.4%) |
| Total | 115 (22.0%) | 430 (82.4%) |
Disability Status by Sex by Age in Glennallen
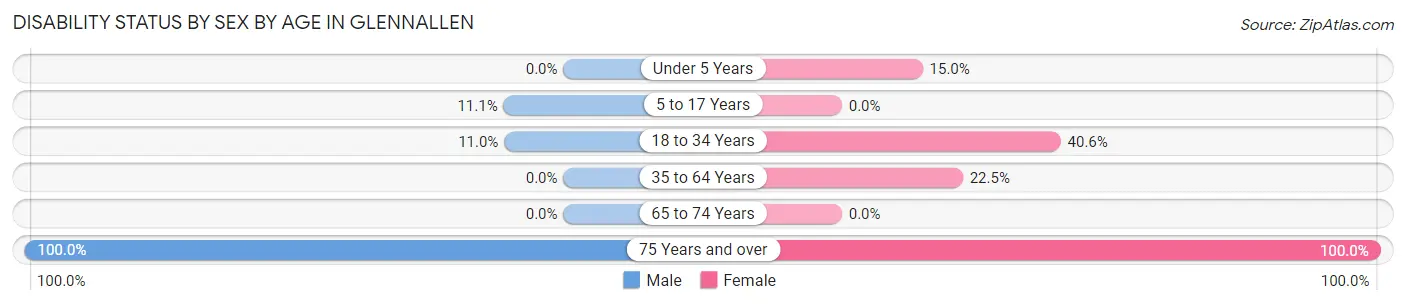
| Age Bracket | Male | Female |
| Under 5 Years | 0 (0.0%) | 9 (15.0%) |
| 5 to 17 Years | 7 (11.1%) | 0 (0.0%) |
| 18 to 34 Years | 9 (11.0%) | 26 (40.6%) |
| 35 to 64 Years | 0 (0.0%) | 22 (22.5%) |
| 65 to 74 Years | 0 (0.0%) | 0 (0.0%) |
| 75 Years and over | 21 (100.0%) | 8 (100.0%) |
Disability Class by Sex by Age in Glennallen
Disability Class: Hearing Difficulty
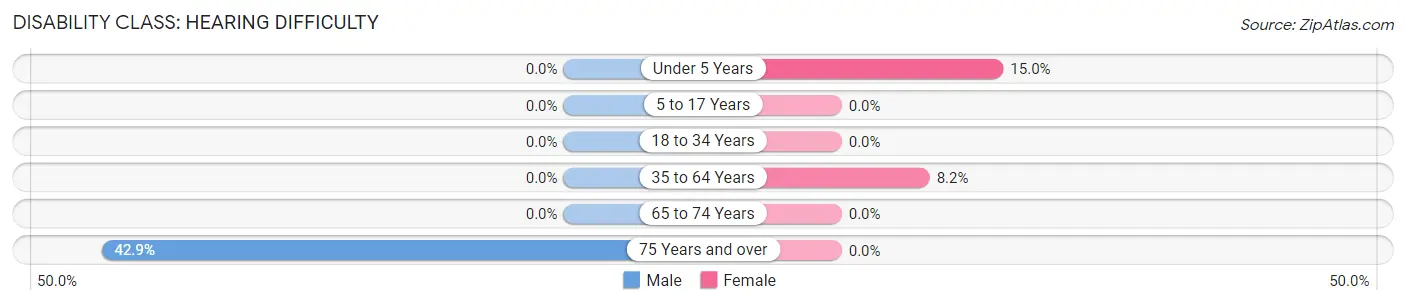
| Age Bracket | Male | Female |
| Under 5 Years | 0 (0.0%) | 9 (15.0%) |
| 5 to 17 Years | 0 (0.0%) | 0 (0.0%) |
| 18 to 34 Years | 0 (0.0%) | 0 (0.0%) |
| 35 to 64 Years | 0 (0.0%) | 8 (8.2%) |
| 65 to 74 Years | 0 (0.0%) | 0 (0.0%) |
| 75 Years and over | 9 (42.9%) | 0 (0.0%) |
Disability Class: Vision Difficulty
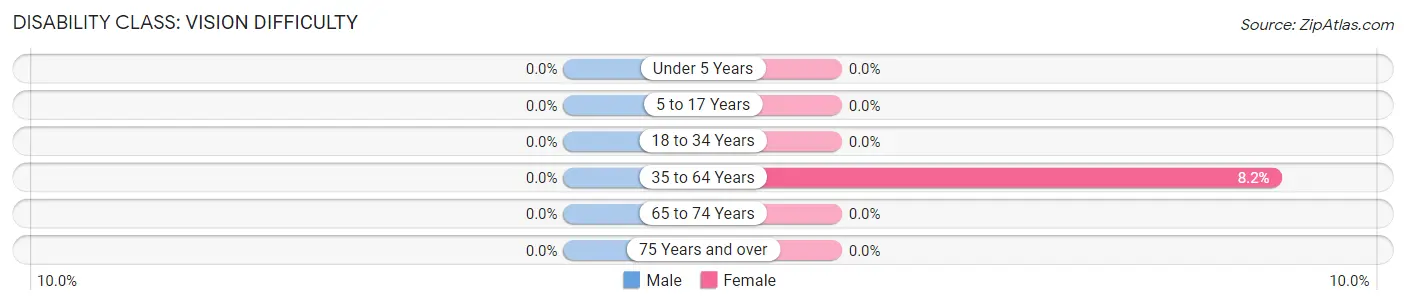
| Age Bracket | Male | Female |
| Under 5 Years | 0 (0.0%) | 0 (0.0%) |
| 5 to 17 Years | 0 (0.0%) | 0 (0.0%) |
| 18 to 34 Years | 0 (0.0%) | 0 (0.0%) |
| 35 to 64 Years | 0 (0.0%) | 8 (8.2%) |
| 65 to 74 Years | 0 (0.0%) | 0 (0.0%) |
| 75 Years and over | 0 (0.0%) | 0 (0.0%) |
Disability Class: Cognitive Difficulty
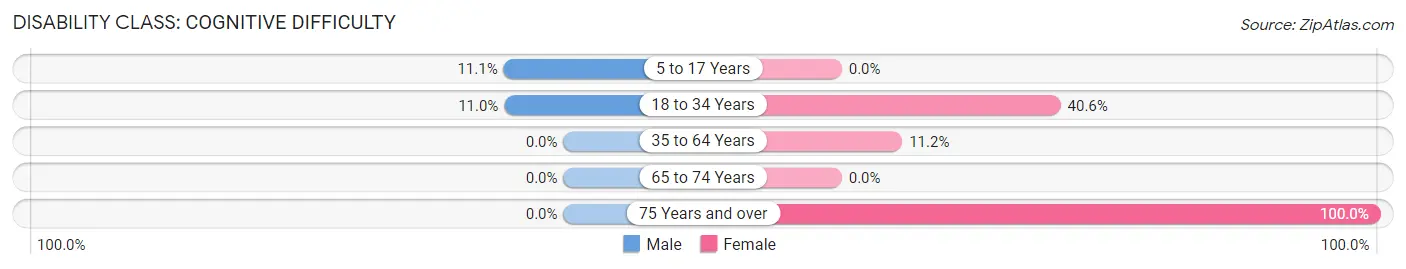
| Age Bracket | Male | Female |
| 5 to 17 Years | 7 (11.1%) | 0 (0.0%) |
| 18 to 34 Years | 9 (11.0%) | 26 (40.6%) |
| 35 to 64 Years | 0 (0.0%) | 11 (11.2%) |
| 65 to 74 Years | 0 (0.0%) | 0 (0.0%) |
| 75 Years and over | 0 (0.0%) | 8 (100.0%) |
Disability Class: Ambulatory Difficulty
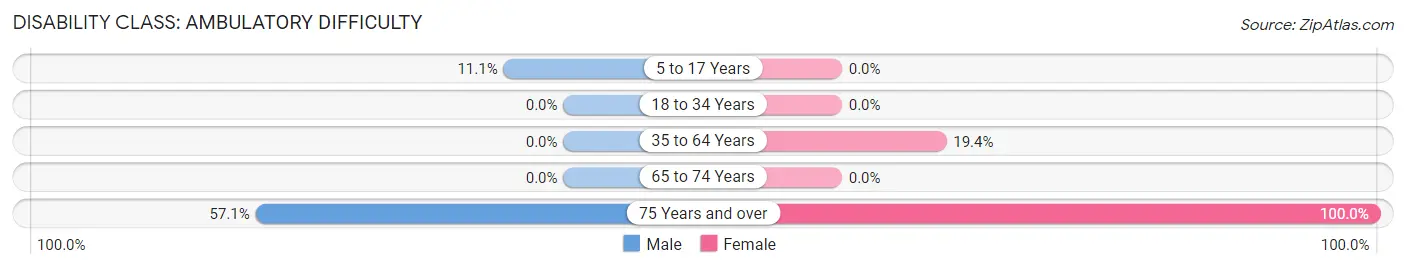
| Age Bracket | Male | Female |
| 5 to 17 Years | 7 (11.1%) | 0 (0.0%) |
| 18 to 34 Years | 0 (0.0%) | 0 (0.0%) |
| 35 to 64 Years | 0 (0.0%) | 19 (19.4%) |
| 65 to 74 Years | 0 (0.0%) | 0 (0.0%) |
| 75 Years and over | 12 (57.1%) | 8 (100.0%) |
Disability Class: Self-Care Difficulty
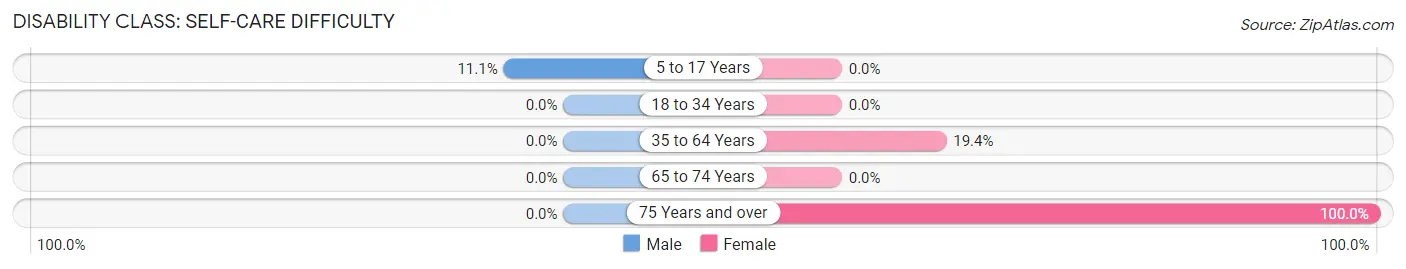
| Age Bracket | Male | Female |
| 5 to 17 Years | 7 (11.1%) | 0 (0.0%) |
| 18 to 34 Years | 0 (0.0%) | 0 (0.0%) |
| 35 to 64 Years | 0 (0.0%) | 19 (19.4%) |
| 65 to 74 Years | 0 (0.0%) | 0 (0.0%) |
| 75 Years and over | 0 (0.0%) | 8 (100.0%) |
Technology Access in Glennallen
Computing Device Access in Glennallen
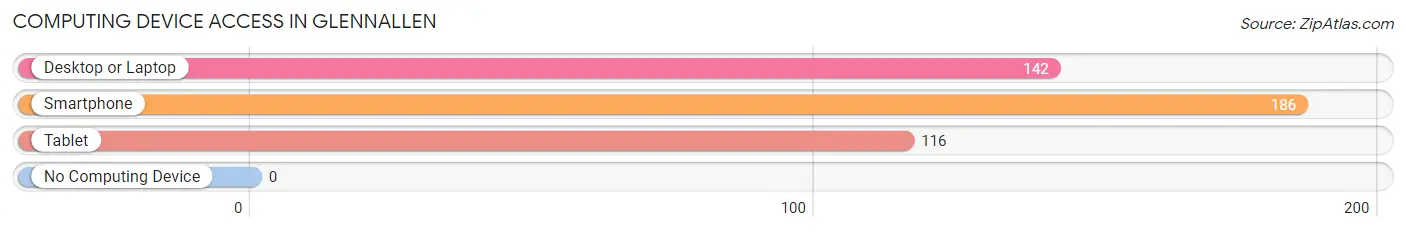
| Device Type | # Households | % Households |
| Desktop or Laptop | 142 | 59.7% |
| Smartphone | 186 | 78.1% |
| Tablet | 116 | 48.7% |
| No Computing Device | 0 | 0.0% |
| Total | 238 | 100.0% |
Internet Access in Glennallen
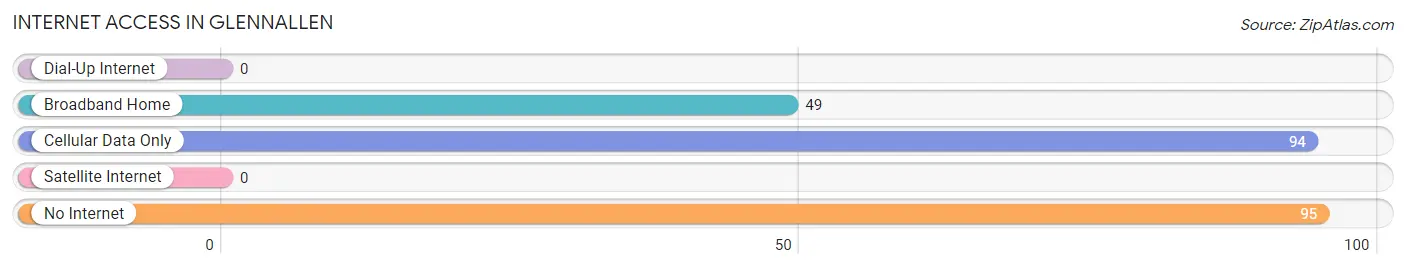
| Internet Type | # Households | % Households |
| Dial-Up Internet | 0 | 0.0% |
| Broadband Home | 49 | 20.6% |
| Cellular Data Only | 94 | 39.5% |
| Satellite Internet | 0 | 0.0% |
| No Internet | 95 | 39.9% |
| Total | 238 | 100.0% |
Glennallen Summary
Glennallen is a small town located in the Copper River Valley of the Chugach Mountains in south-central Alaska. It is the largest community in the Copper River Valley and is the gateway to the Wrangell-St. Elias National Park and Preserve. The town is located on the Richardson Highway, which is the main highway connecting the interior of Alaska to the coastal communities of Valdez and Cordova. The population of Glennallen was 602 in the 2010 census.
History
The area around Glennallen has been inhabited by the Ahtna Athabascan people for thousands of years. The first Europeans to explore the area were Russian fur traders in the early 19th century. The town of Glennallen was founded in the early 1900s as a trading post for the Alaska Railroad. The town was named after a railroad engineer, Glenn Allen, who surveyed the area in the early 1900s.
The town grew slowly over the years, but the population increased significantly in the 1950s and 1960s with the construction of the Trans-Alaska Pipeline. The pipeline brought an influx of workers to the area, and the population of Glennallen increased to over 1,000 people.
Geography
Glennallen is located in the Copper River Valley of the Chugach Mountains in south-central Alaska. The town is situated at the confluence of the Copper and Gulkana Rivers, and is surrounded by mountains and glaciers. The climate in Glennallen is mild and wet, with an average annual temperature of 37°F (3°C).
The town is located on the Richardson Highway, which is the main highway connecting the interior of Alaska to the coastal communities of Valdez and Cordova. The town is also served by the Glennallen Airport, which is located just outside of town.
Economy
The economy of Glennallen is largely based on tourism and the oil and gas industry. The town is a popular destination for tourists visiting the Wrangell-St. Elias National Park and Preserve, and the nearby Copper River Valley is a popular destination for fishing, hunting, and other outdoor activities.
The oil and gas industry is also an important part of the local economy. The Trans-Alaska Pipeline passes through the town, and there are several oil and gas fields in the area. The oil and gas industry provides jobs for many of the residents of Glennallen.
Demographics
The population of Glennallen was 602 in the 2010 census. The population is predominantly white (90.2%), with a small Native American population (4.3%). The median age of the population is 44.7 years, and the median household income is $50,000.
Conclusion
Glennallen is a small town located in the Copper River Valley of the Chugach Mountains in south-central Alaska. The town is the gateway to the Wrangell-St. Elias National Park and Preserve, and is a popular destination for tourists visiting the area. The economy of Glennallen is largely based on tourism and the oil and gas industry. The population of Glennallen was 602 in the 2010 census, and is predominantly white (90.2%). The median age of the population is 44.7 years, and the median household income is $50,000.
Common Questions
What is Per Capita Income in Glennallen?
Per Capita income in Glennallen is $40,134.
What is the Median Family Income in Glennallen?
Median Family Income in Glennallen is $106,750.
What is the Median Household income in Glennallen?
Median Household Income in Glennallen is $78,173.
What is Income or Wage Gap in Glennallen?
Income or Wage Gap in Glennallen is 48.1%.
Women in Glennallen earn 51.9 cents for every dollar earned by a man.
What is Inequality or Gini Index in Glennallen?
Inequality or Gini Index in Glennallen is 0.31.
What is the Total Population of Glennallen?
Total Population of Glennallen is 522.
What is the Total Male Population of Glennallen?
Total Male Population of Glennallen is 267.
What is the Total Female Population of Glennallen?
Total Female Population of Glennallen is 255.
What is the Ratio of Males per 100 Females in Glennallen?
There are 104.71 Males per 100 Females in Glennallen.
What is the Ratio of Females per 100 Males in Glennallen?
There are 95.51 Females per 100 Males in Glennallen.
What is the Median Population Age in Glennallen?
Median Population Age in Glennallen is 33.6 Years.
What is the Average Family Size in Glennallen
Average Family Size in Glennallen is 2.9 People.
What is the Average Household Size in Glennallen
Average Household Size in Glennallen is 2.1 People.
How Large is the Labor Force in Glennallen?
There are 332 People in the Labor Forcein in Glennallen.
What is the Percentage of People in the Labor Force in Glennallen?
84.1% of People are in the Labor Force in Glennallen.
What is the Unemployment Rate in Glennallen?
Unemployment Rate in Glennallen is 5.4%.