Galena, AK Map & Demographics
Galena Map
Galena Overview
$42,687
PER CAPITA INCOME
$86,806
AVG FAMILY INCOME
$77,813
AVG HOUSEHOLD INCOME
30.7%
WAGE / INCOME GAP [ % ]
69.3¢/ $1
WAGE / INCOME GAP [ $ ]
0.37
INEQUALITY / GINI INDEX
627
TOTAL POPULATION
280
MALE POPULATION
347
FEMALE POPULATION
80.69
MALES / 100 FEMALES
123.93
FEMALES / 100 MALES
32.1
MEDIAN AGE
2.7
AVG FAMILY SIZE
2.3
AVG HOUSEHOLD SIZE
361
LABOR FORCE [ PEOPLE ]
76.2%
PERCENT IN LABOR FORCE
6.9%
UNEMPLOYMENT RATE
Galena Zip Codes
Galena Area Codes
Income in Galena
Income Overview in Galena
Per Capita Income in Galena is $42,687, while median incomes of families and households are $86,806 and $77,813 respectively.
| Characteristic | Number | Measure |
| Per Capita Income | 627 | $42,687 |
| Median Family Income | 159 | $86,806 |
| Mean Family Income | 159 | $113,433 |
| Median Household Income | 266 | $77,813 |
| Mean Household Income | 266 | $99,187 |
| Income Deficit | 159 | $0 |
| Wage / Income Gap (%) | 627 | 30.71% |
| Wage / Income Gap ($) | 627 | 69.29¢ per $1 |
| Gini / Inequality Index | 627 | 0.37 |
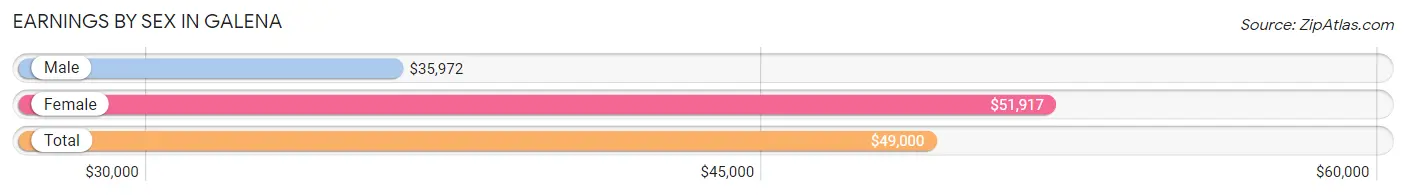
Earnings by Sex in Galena
Average Earnings in Galena are $49,000, $35,972 for men and $51,917 for women, a difference of 30.7%.
| Sex | Number | Average Earnings |
| Male | 161 (41.7%) | $35,972 |
| Female | 225 (58.3%) | $51,917 |
| Total | 386 (100.0%) | $49,000 |
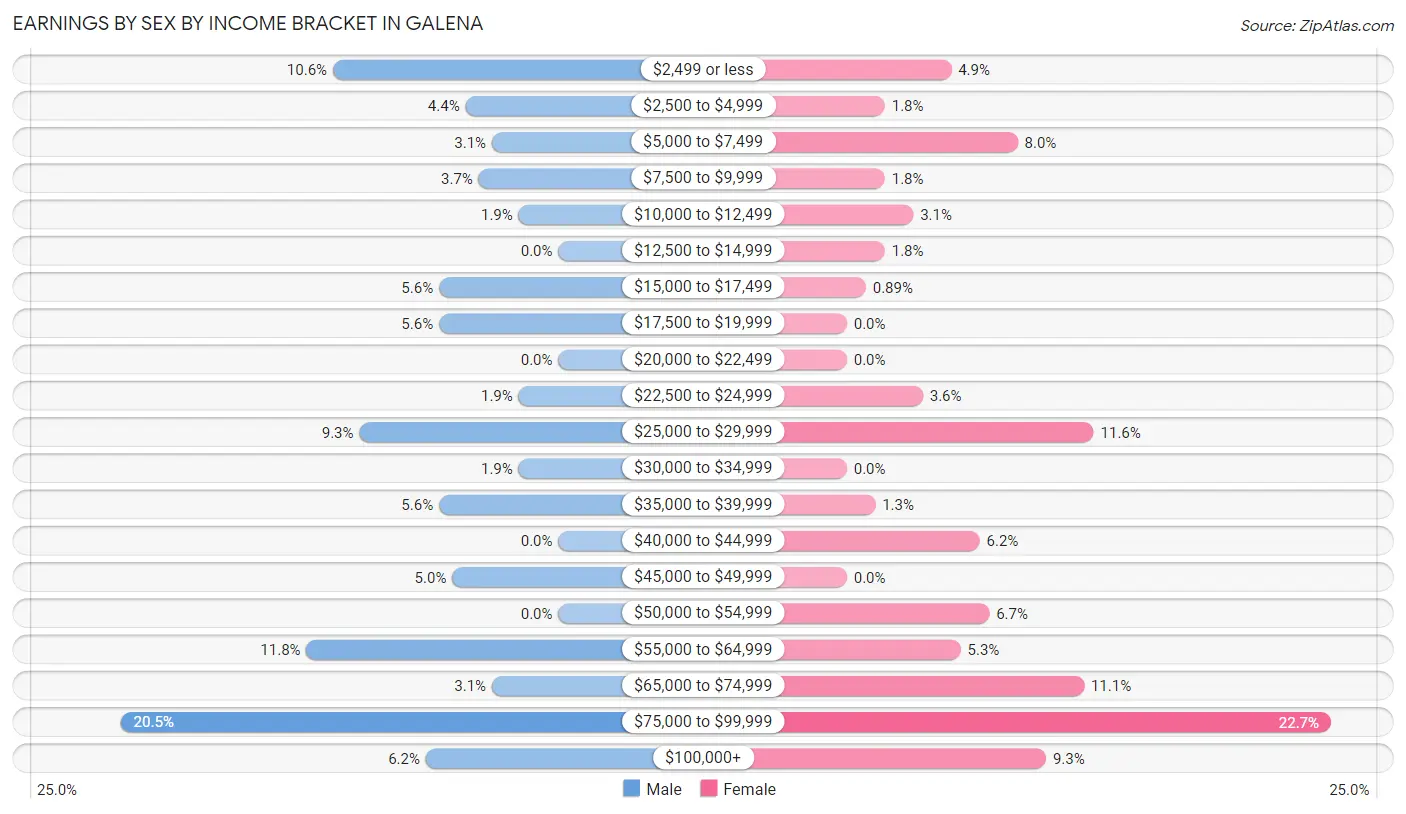
Earnings by Sex by Income Bracket in Galena
The most common earnings brackets in Galena are $75,000 to $99,999 for men (33 | 20.5%) and $75,000 to $99,999 for women (51 | 22.7%).
| Income | Male | Female |
| $2,499 or less | 17 (10.6%) | 11 (4.9%) |
| $2,500 to $4,999 | 7 (4.3%) | 4 (1.8%) |
| $5,000 to $7,499 | 5 (3.1%) | 18 (8.0%) |
| $7,500 to $9,999 | 6 (3.7%) | 4 (1.8%) |
| $10,000 to $12,499 | 3 (1.9%) | 7 (3.1%) |
| $12,500 to $14,999 | 0 (0.0%) | 4 (1.8%) |
| $15,000 to $17,499 | 9 (5.6%) | 2 (0.9%) |
| $17,500 to $19,999 | 9 (5.6%) | 0 (0.0%) |
| $20,000 to $22,499 | 0 (0.0%) | 0 (0.0%) |
| $22,500 to $24,999 | 3 (1.9%) | 8 (3.6%) |
| $25,000 to $29,999 | 15 (9.3%) | 26 (11.6%) |
| $30,000 to $34,999 | 3 (1.9%) | 0 (0.0%) |
| $35,000 to $39,999 | 9 (5.6%) | 3 (1.3%) |
| $40,000 to $44,999 | 0 (0.0%) | 14 (6.2%) |
| $45,000 to $49,999 | 8 (5.0%) | 0 (0.0%) |
| $50,000 to $54,999 | 0 (0.0%) | 15 (6.7%) |
| $55,000 to $64,999 | 19 (11.8%) | 12 (5.3%) |
| $65,000 to $74,999 | 5 (3.1%) | 25 (11.1%) |
| $75,000 to $99,999 | 33 (20.5%) | 51 (22.7%) |
| $100,000+ | 10 (6.2%) | 21 (9.3%) |
| Total | 161 (100.0%) | 225 (100.0%) |
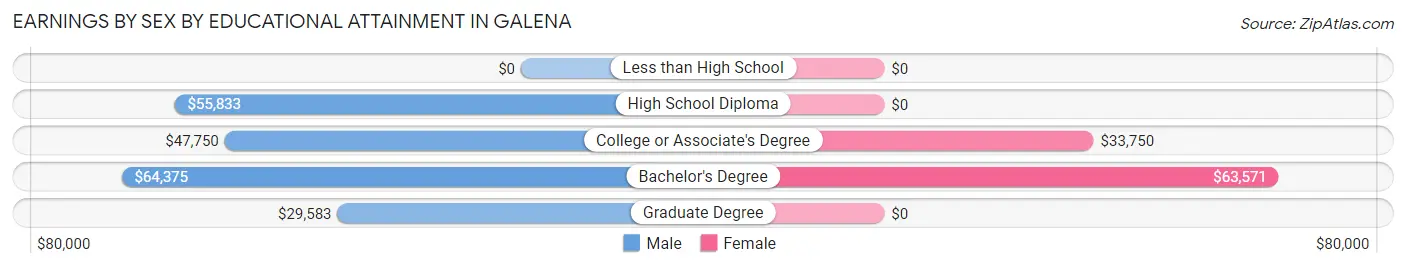
Earnings by Sex by Educational Attainment in Galena
Average earnings in Galena are $47,083 for men and $64,821 for women, a difference of 27.4%. Men with an educational attainment of bachelor's degree enjoy the highest average annual earnings of $64,375, while those with graduate degree education earn the least with $29,583. Women with an educational attainment of bachelor's degree earn the most with the average annual earnings of $63,571, while those with college or associate's degree education have the smallest earnings of $33,750.
| Educational Attainment | Male Income | Female Income |
| Less than High School | - | - |
| High School Diploma | $55,833 | $0 |
| College or Associate's Degree | $47,750 | $33,750 |
| Bachelor's Degree | $64,375 | $63,571 |
| Graduate Degree | $29,583 | $0 |
| Total | $47,083 | $64,821 |
Family Income in Galena
Family Income Brackets in Galena
According to the Galena family income data, there are 37 families falling into the $50,000 to $74,999 income range, which is the most common income bracket and makes up 23.3% of all families.
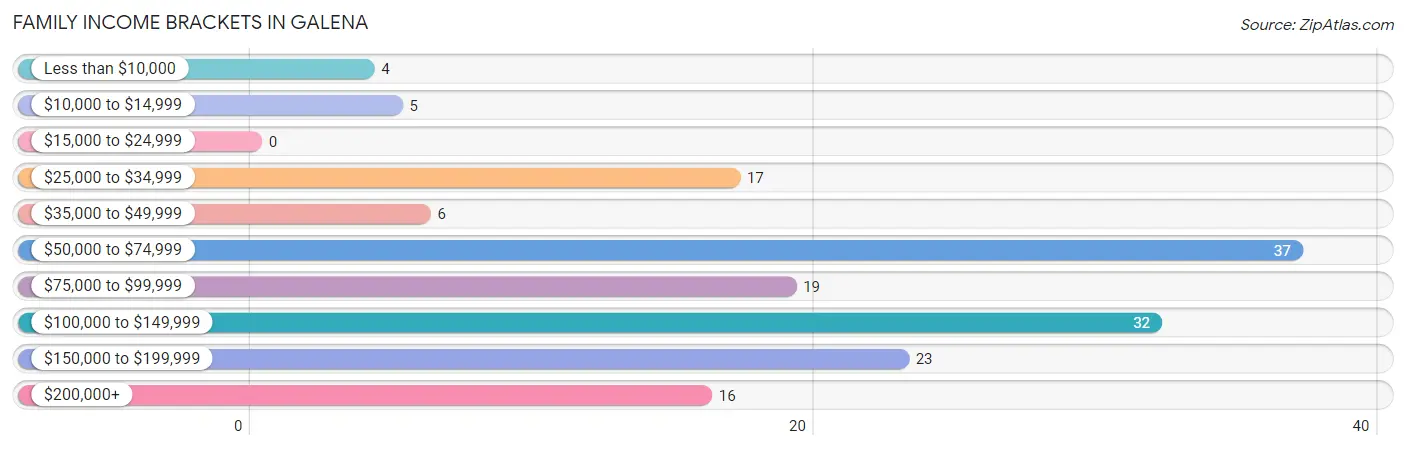
| Income Bracket | # Families | % Families |
| Less than $10,000 | 4 | 2.5% |
| $10,000 to $14,999 | 5 | 3.1% |
| $15,000 to $24,999 | 0 | 0.0% |
| $25,000 to $34,999 | 17 | 10.7% |
| $35,000 to $49,999 | 6 | 3.8% |
| $50,000 to $74,999 | 37 | 23.3% |
| $75,000 to $99,999 | 19 | 11.9% |
| $100,000 to $149,999 | 32 | 20.1% |
| $150,000 to $199,999 | 23 | 14.5% |
| $200,000+ | 16 | 10.1% |
Family Income by Famaliy Size in Galena
3-person families (35 | 22.0%) account for the highest median family income in Galena with $85,694 per family, while 2-person families (88 | 55.3%) have the highest median income of $37,084 per family member.
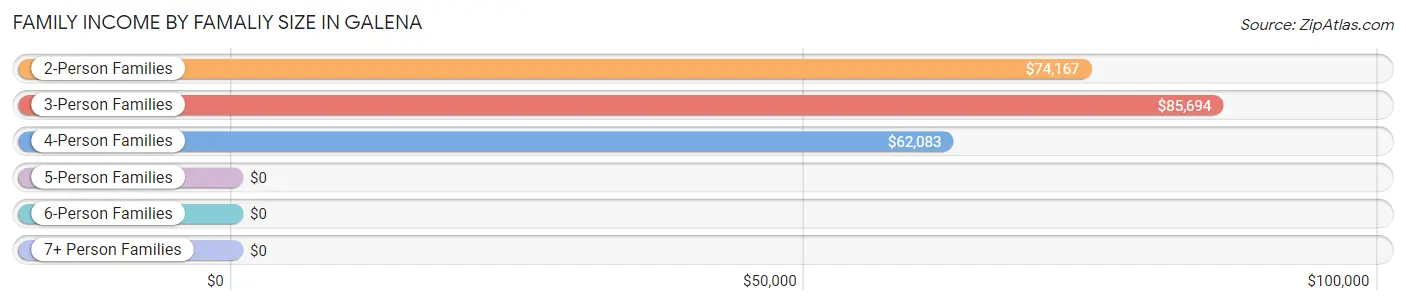
| Income Bracket | # Families | Median Income |
| 2-Person Families | 88 (55.3%) | $74,167 |
| 3-Person Families | 35 (22.0%) | $85,694 |
| 4-Person Families | 10 (6.3%) | $62,083 |
| 5-Person Families | 20 (12.6%) | $0 |
| 6-Person Families | 3 (1.9%) | $0 |
| 7+ Person Families | 3 (1.9%) | $0 |
| Total | 159 (100.0%) | $86,806 |
Family Income by Number of Earners in Galena
The median family income in Galena is $86,806, with families comprising 3+ earners (24) having the highest median family income of $250,001, while families with 1 earner (59) have the lowest median family income of $59,063, accounting for 15.1% and 37.1% of families, respectively.
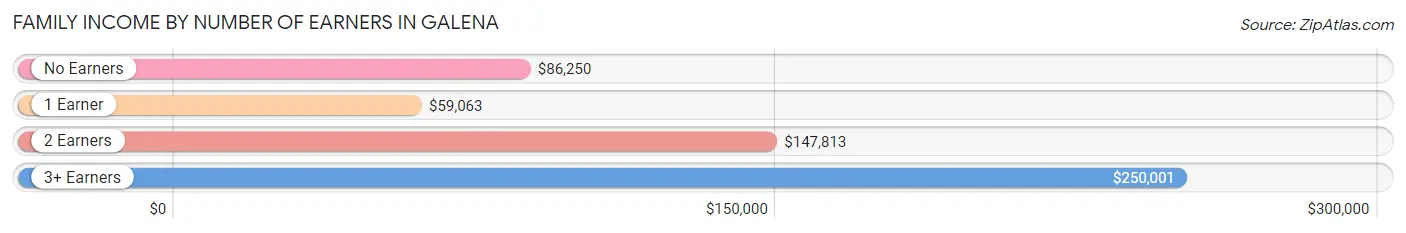
| Number of Earners | # Families | Median Income |
| No Earners | 20 (12.6%) | $86,250 |
| 1 Earner | 59 (37.1%) | $59,063 |
| 2 Earners | 56 (35.2%) | $147,813 |
| 3+ Earners | 24 (15.1%) | $250,001 |
| Total | 159 (100.0%) | $86,806 |
Household Income in Galena
Household Income Brackets in Galena
With 81 households falling in the category, the $50,000 to $74,999 income range is the most frequent in Galena, accounting for 30.4% of all households. In contrast, only 1 households (0.4%) fall into the $10,000 to $14,999 income bracket, making it the least populous group.
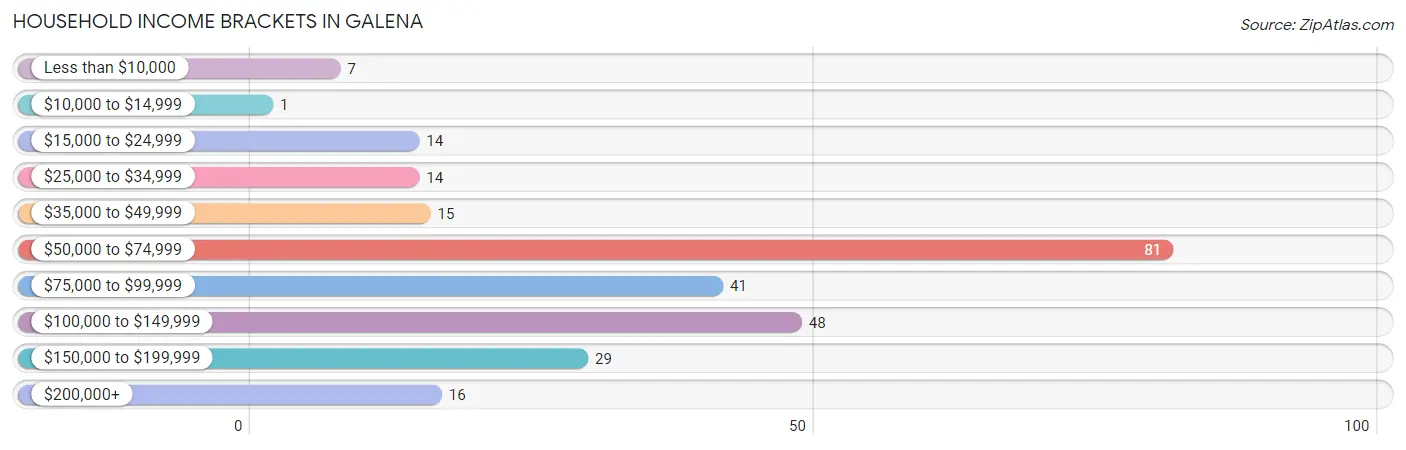
| Income Bracket | # Households | % Households |
| Less than $10,000 | 7 | 2.6% |
| $10,000 to $14,999 | 1 | 0.4% |
| $15,000 to $24,999 | 14 | 5.3% |
| $25,000 to $34,999 | 14 | 5.3% |
| $35,000 to $49,999 | 15 | 5.6% |
| $50,000 to $74,999 | 81 | 30.5% |
| $75,000 to $99,999 | 41 | 15.4% |
| $100,000 to $149,999 | 48 | 18.0% |
| $150,000 to $199,999 | 29 | 10.9% |
| $200,000+ | 16 | 6.0% |
Household Income by Householder Age in Galena
The median household income in Galena is $77,813, with the highest median household income of $84,643 found in the 25 to 44 years age bracket for the primary householder. A total of 114 households (42.9%) fall into this category. Meanwhile, the 65+ years age bracket for the primary householder has the lowest median household income of $66,563, with 39 households (14.7%) in this group.
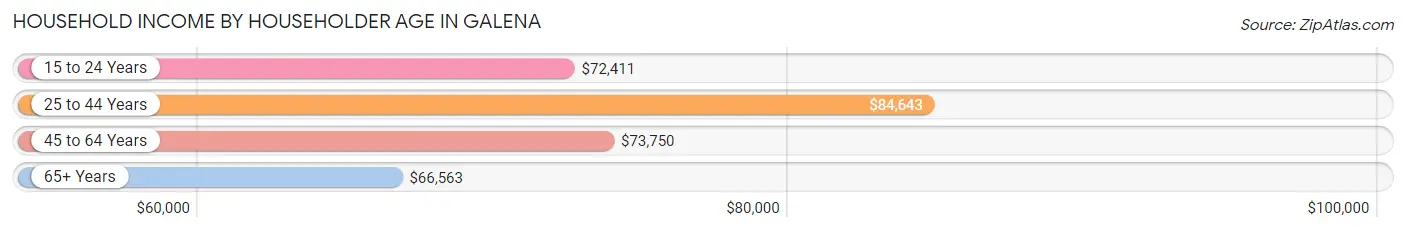
| Income Bracket | # Households | Median Income |
| 15 to 24 Years | 27 (10.2%) | $72,411 |
| 25 to 44 Years | 114 (42.9%) | $84,643 |
| 45 to 64 Years | 86 (32.3%) | $73,750 |
| 65+ Years | 39 (14.7%) | $66,563 |
| Total | 266 (100.0%) | $77,813 |
Poverty in Galena
Income Below Poverty by Sex and Age in Galena
With 7.0% poverty level for males and 15.9% for females among the residents of Galena, under 5 year old males and 16 and 17 year old females are the most vulnerable to poverty, with 3 males (20.0%) and 4 females (66.7%) in their respective age groups living below the poverty level.
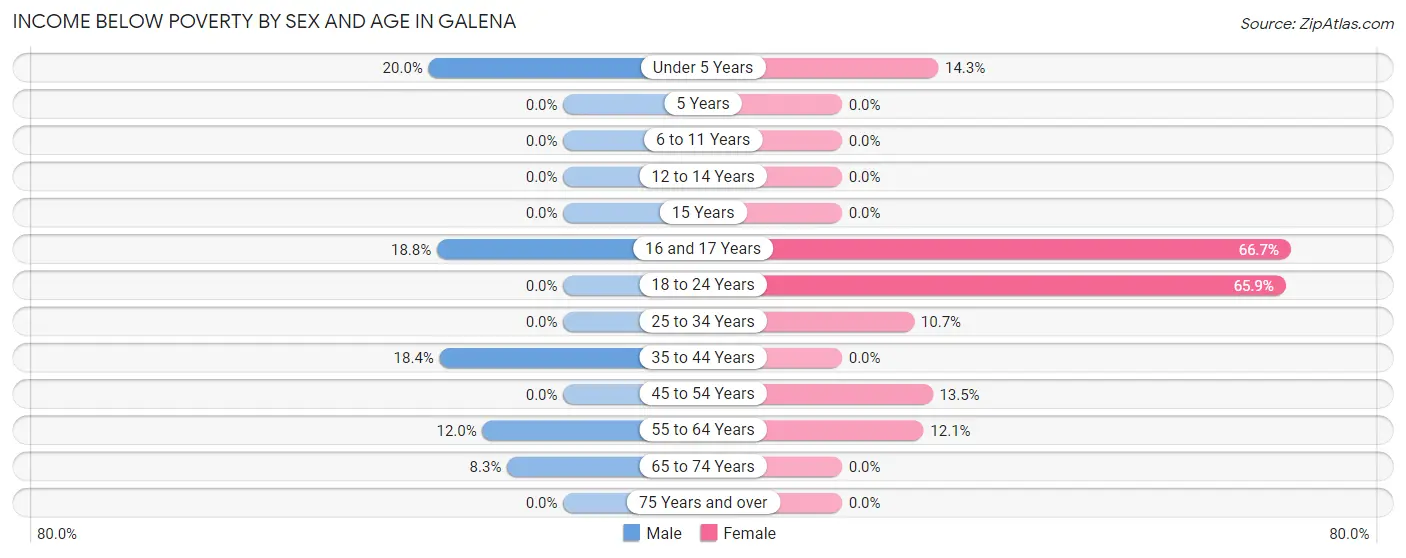
| Age Bracket | Male | Female |
| Under 5 Years | 3 (20.0%) | 5 (14.3%) |
| 5 Years | 0 (0.0%) | 0 (0.0%) |
| 6 to 11 Years | 0 (0.0%) | 0 (0.0%) |
| 12 to 14 Years | 0 (0.0%) | 0 (0.0%) |
| 15 Years | 0 (0.0%) | 0 (0.0%) |
| 16 and 17 Years | 3 (18.8%) | 4 (66.7%) |
| 18 to 24 Years | 0 (0.0%) | 29 (65.9%) |
| 25 to 34 Years | 0 (0.0%) | 6 (10.7%) |
| 35 to 44 Years | 9 (18.4%) | 0 (0.0%) |
| 45 to 54 Years | 0 (0.0%) | 7 (13.5%) |
| 55 to 64 Years | 3 (12.0%) | 4 (12.1%) |
| 65 to 74 Years | 1 (8.3%) | 0 (0.0%) |
| 75 Years and over | 0 (0.0%) | 0 (0.0%) |
| Total | 19 (7.0%) | 55 (15.9%) |
Income Above Poverty by Sex and Age in Galena
According to the poverty statistics in Galena, males aged 5 years and females aged 5 years are the age groups that are most secure financially, with 100.0% of males and 100.0% of females in these age groups living above the poverty line.
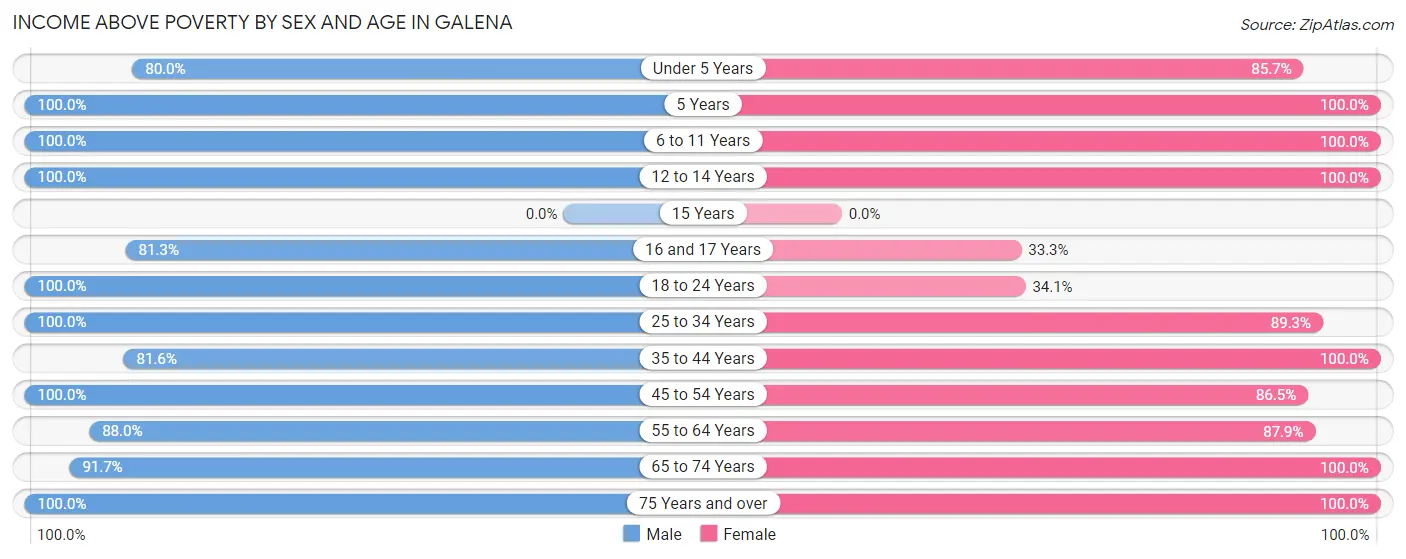
| Age Bracket | Male | Female |
| Under 5 Years | 12 (80.0%) | 30 (85.7%) |
| 5 Years | 3 (100.0%) | 7 (100.0%) |
| 6 to 11 Years | 36 (100.0%) | 21 (100.0%) |
| 12 to 14 Years | 16 (100.0%) | 12 (100.0%) |
| 15 Years | 0 (0.0%) | 0 (0.0%) |
| 16 and 17 Years | 13 (81.2%) | 2 (33.3%) |
| 18 to 24 Years | 16 (100.0%) | 15 (34.1%) |
| 25 to 34 Years | 50 (100.0%) | 50 (89.3%) |
| 35 to 44 Years | 40 (81.6%) | 44 (100.0%) |
| 45 to 54 Years | 24 (100.0%) | 45 (86.5%) |
| 55 to 64 Years | 22 (88.0%) | 29 (87.9%) |
| 65 to 74 Years | 11 (91.7%) | 20 (100.0%) |
| 75 Years and over | 10 (100.0%) | 16 (100.0%) |
| Total | 253 (93.0%) | 291 (84.1%) |
Income Below Poverty Among Married-Couple Families in Galena
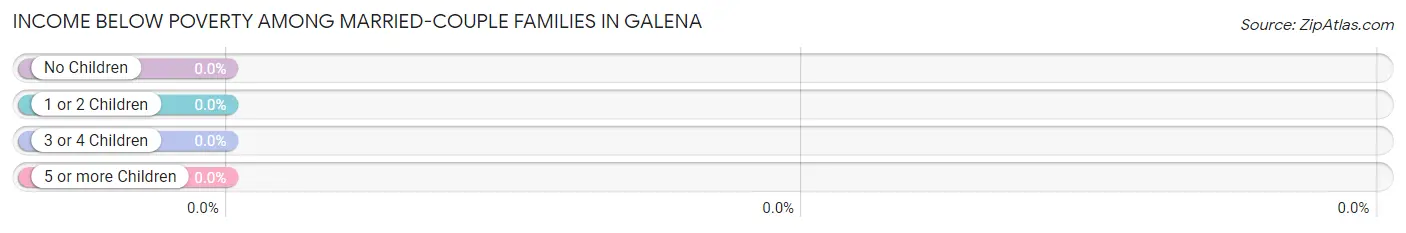
| Children | Above Poverty | Below Poverty |
| No Children | 44 (100.0%) | 0 (0.0%) |
| 1 or 2 Children | 15 (100.0%) | 0 (0.0%) |
| 3 or 4 Children | 26 (100.0%) | 0 (0.0%) |
| 5 or more Children | 0 (0.0%) | 0 (0.0%) |
| Total | 85 (100.0%) | 0 (0.0%) |
Income Below Poverty Among Single-Parent Households in Galena
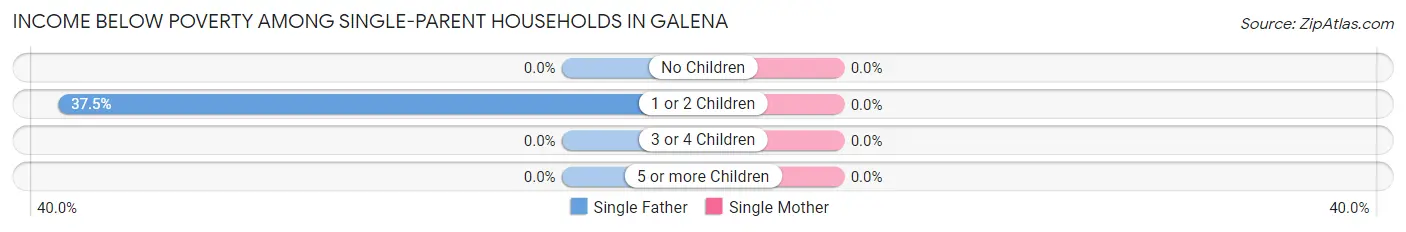
| Children | Single Father | Single Mother |
| No Children | 0 (0.0%) | 0 (0.0%) |
| 1 or 2 Children | 9 (37.5%) | 0 (0.0%) |
| 3 or 4 Children | 0 (0.0%) | 0 (0.0%) |
| 5 or more Children | 0 (0.0%) | 0 (0.0%) |
| Total | 9 (32.1%) | 0 (0.0%) |
Income Below Poverty Among Married-Couple vs Single-Parent Households in Galena
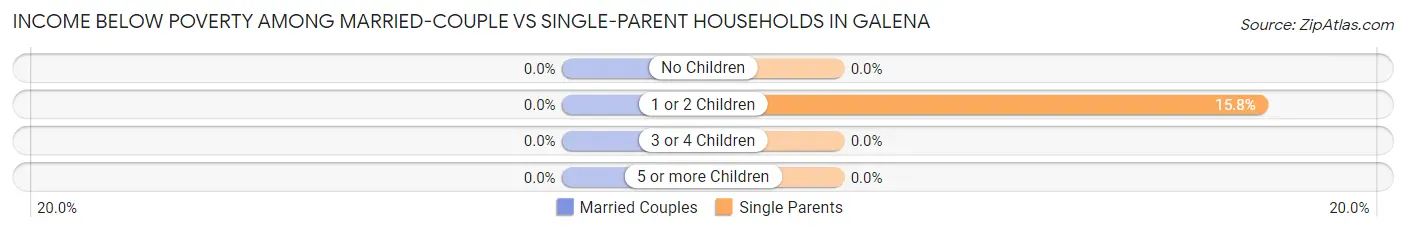
| Children | Married-Couple Families | Single-Parent Households |
| No Children | 0 (0.0%) | 0 (0.0%) |
| 1 or 2 Children | 0 (0.0%) | 9 (15.8%) |
| 3 or 4 Children | 0 (0.0%) | 0 (0.0%) |
| 5 or more Children | 0 (0.0%) | 0 (0.0%) |
| Total | 0 (0.0%) | 9 (12.2%) |
Race in Galena
The most populous races in Galena are Native / Alaskan (409 | 65.2%), White / Caucasian (171 | 27.3%), and Two or more Races (40 | 6.4%).
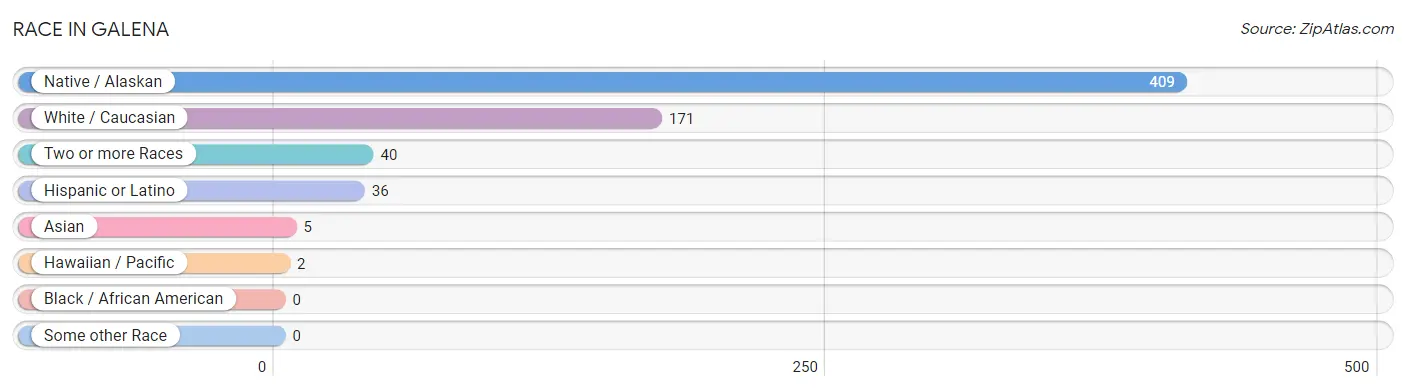
| Race | # Population | % Population |
| Asian | 5 | 0.8% |
| Black / African American | 0 | 0.0% |
| Hawaiian / Pacific | 2 | 0.3% |
| Hispanic or Latino | 36 | 5.7% |
| Native / Alaskan | 409 | 65.2% |
| White / Caucasian | 171 | 27.3% |
| Two or more Races | 40 | 6.4% |
| Some other Race | 0 | 0.0% |
| Total | 627 | 100.0% |
Ancestry in Galena
The most populous ancestries reported in Galena are Alaskan Athabascan (362 | 57.7%), German (98 | 15.6%), Norwegian (26 | 4.2%), Inupiat (23 | 3.7%), and Irish (23 | 3.7%), together accounting for 84.9% of all Galena residents.
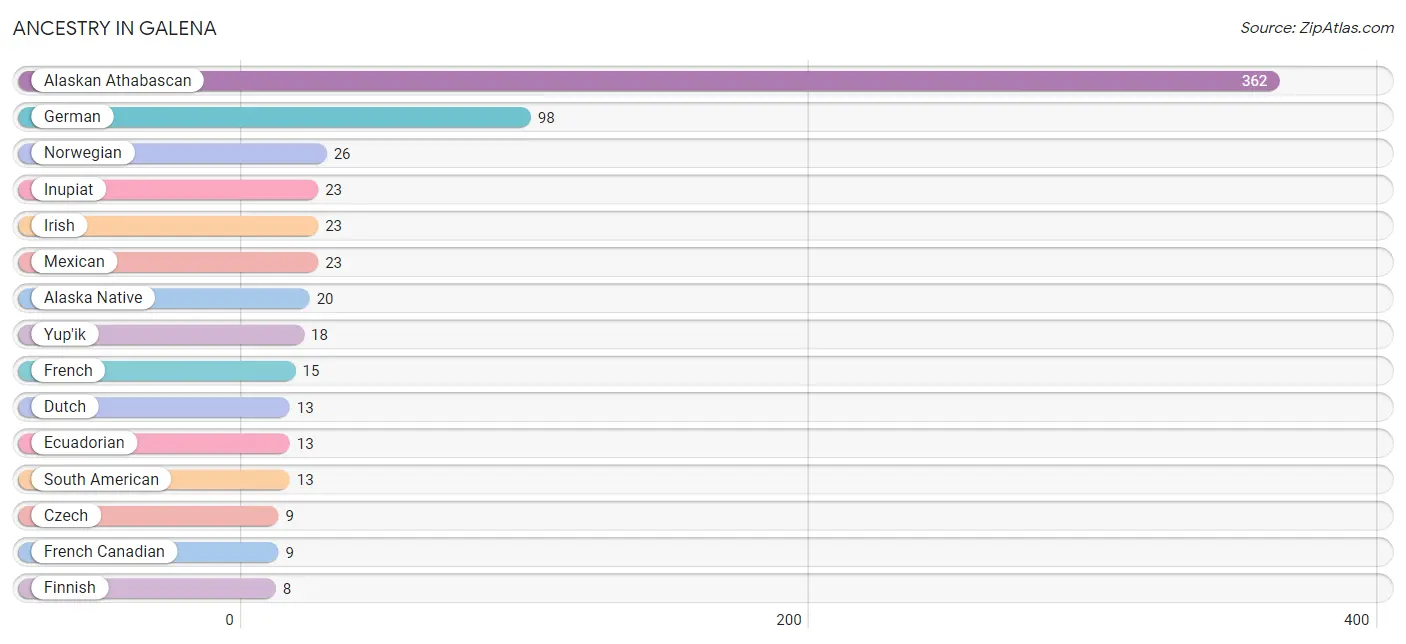
| Ancestry | # Population | % Population |
| Alaska Native | 20 | 3.2% |
| Alaskan Athabascan | 362 | 57.7% |
| Bhutanese | 4 | 0.6% |
| Canadian | 5 | 0.8% |
| Chippewa | 4 | 0.6% |
| Czech | 9 | 1.4% |
| Danish | 7 | 1.1% |
| Dutch | 13 | 2.1% |
| Ecuadorian | 13 | 2.1% |
| English | 2 | 0.3% |
| European | 5 | 0.8% |
| Finnish | 8 | 1.3% |
| French | 15 | 2.4% |
| French Canadian | 9 | 1.4% |
| German | 98 | 15.6% |
| Inupiat | 23 | 3.7% |
| Irish | 23 | 3.7% |
| Italian | 2 | 0.3% |
| Korean | 1 | 0.2% |
| Mexican | 23 | 3.7% |
| Norwegian | 26 | 4.2% |
| Polish | 2 | 0.3% |
| Romanian | 6 | 1.0% |
| Sioux | 1 | 0.2% |
| South American | 13 | 2.1% |
| South American Indian | 4 | 0.6% |
| Swedish | 3 | 0.5% |
| Tongan | 5 | 0.8% |
| Yup'ik | 18 | 2.9% | View All 29 Rows |
Immigrants in Galena
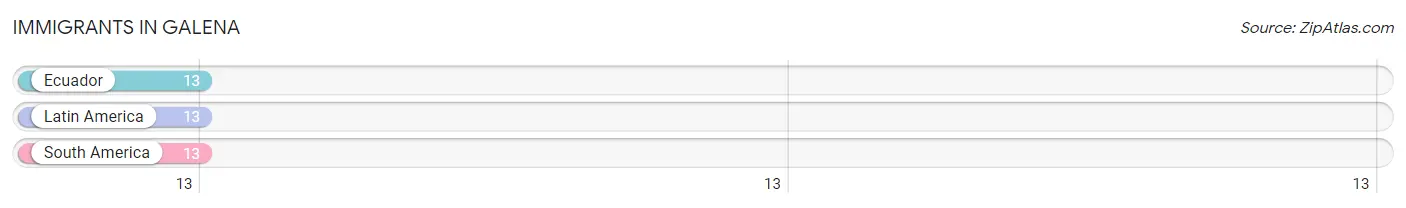
The most numerous immigrant groups reported in Galena came from Ecuador (13 | 2.1%), Latin America (13 | 2.1%), and South America (13 | 2.1%), together accounting for 6.2% of all Galena residents.
| Immigration Origin | # Population | % Population |
| Ecuador | 13 | 2.1% |
| Latin America | 13 | 2.1% |
| South America | 13 | 2.1% | View All 3 Rows |
Sex and Age in Galena
Sex and Age in Galena
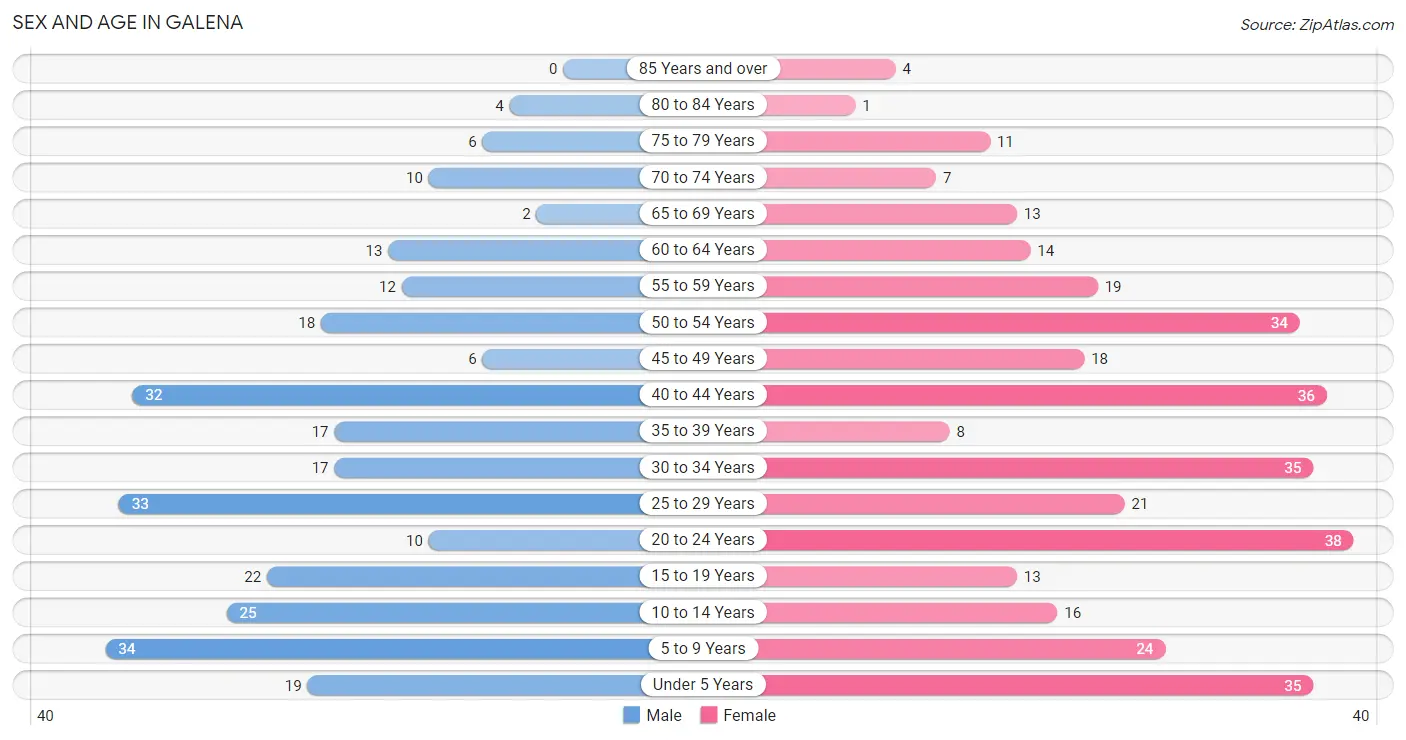
The most populous age groups in Galena are 5 to 9 Years (34 | 12.1%) for men and 20 to 24 Years (38 | 11.0%) for women.
| Age Bracket | Male | Female |
| Under 5 Years | 19 (6.8%) | 35 (10.1%) |
| 5 to 9 Years | 34 (12.1%) | 24 (6.9%) |
| 10 to 14 Years | 25 (8.9%) | 16 (4.6%) |
| 15 to 19 Years | 22 (7.9%) | 13 (3.7%) |
| 20 to 24 Years | 10 (3.6%) | 38 (11.0%) |
| 25 to 29 Years | 33 (11.8%) | 21 (6.0%) |
| 30 to 34 Years | 17 (6.1%) | 35 (10.1%) |
| 35 to 39 Years | 17 (6.1%) | 8 (2.3%) |
| 40 to 44 Years | 32 (11.4%) | 36 (10.4%) |
| 45 to 49 Years | 6 (2.1%) | 18 (5.2%) |
| 50 to 54 Years | 18 (6.4%) | 34 (9.8%) |
| 55 to 59 Years | 12 (4.3%) | 19 (5.5%) |
| 60 to 64 Years | 13 (4.6%) | 14 (4.0%) |
| 65 to 69 Years | 2 (0.7%) | 13 (3.7%) |
| 70 to 74 Years | 10 (3.6%) | 7 (2.0%) |
| 75 to 79 Years | 6 (2.1%) | 11 (3.2%) |
| 80 to 84 Years | 4 (1.4%) | 1 (0.3%) |
| 85 Years and over | 0 (0.0%) | 4 (1.1%) |
| Total | 280 (100.0%) | 347 (100.0%) |
Families and Households in Galena
Median Family Size in Galena
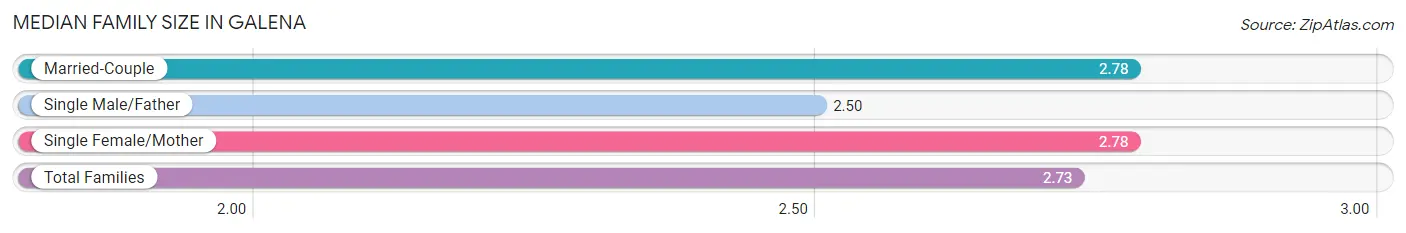
The median family size in Galena is 2.73 persons per family, with married-couple families (85 | 53.5%) accounting for the largest median family size of 2.78 persons per family. On the other hand, single male/father families (28 | 17.6%) represent the smallest median family size with 2.50 persons per family.
| Family Type | # Families | Family Size |
| Married-Couple | 85 (53.5%) | 2.78 |
| Single Male/Father | 28 (17.6%) | 2.50 |
| Single Female/Mother | 46 (28.9%) | 2.78 |
| Total Families | 159 (100.0%) | 2.73 |
Median Household Size in Galena
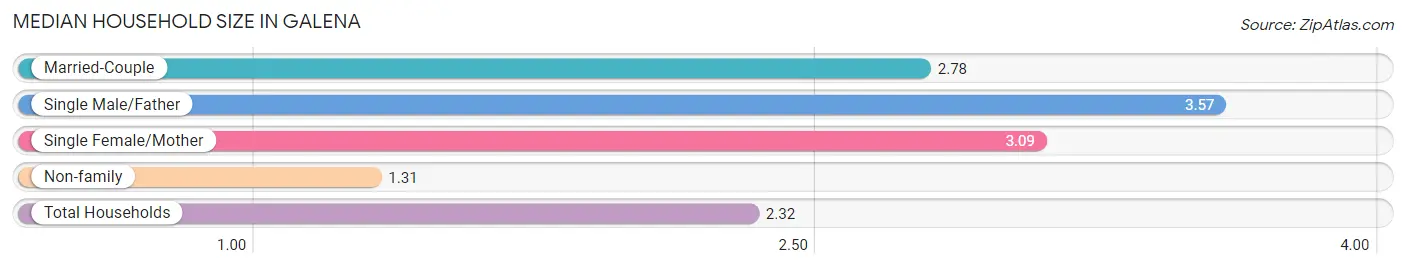
The median household size in Galena is 2.32 persons per household, with single male/father households (28 | 10.5%) accounting for the largest median household size of 3.57 persons per household. non-family households (107 | 40.2%) represent the smallest median household size with 1.31 persons per household.
| Household Type | # Households | Household Size |
| Married-Couple | 85 (32.0%) | 2.78 |
| Single Male/Father | 28 (10.5%) | 3.57 |
| Single Female/Mother | 46 (17.3%) | 3.09 |
| Non-family | 107 (40.2%) | 1.31 |
| Total Households | 266 (100.0%) | 2.32 |
Household Size by Marriage Status in Galena
Out of a total of 266 households in Galena, 159 (59.8%) are family households, while 107 (40.2%) are nonfamily households. The most numerous type of family households are 2-person households, comprising 64, and the most common type of nonfamily households are 1-person households, comprising 70.
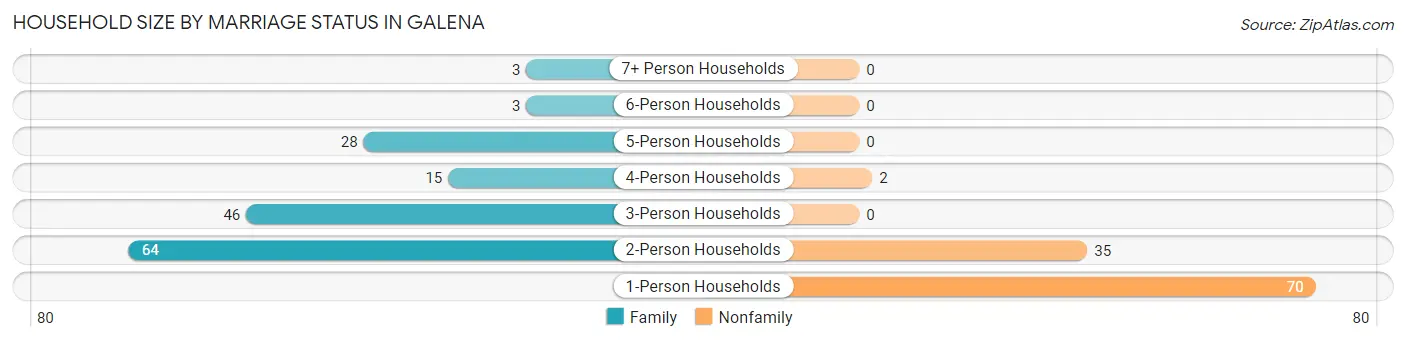
| Household Size | Family Households | Nonfamily Households |
| 1-Person Households | - | 70 (26.3%) |
| 2-Person Households | 64 (24.1%) | 35 (13.2%) |
| 3-Person Households | 46 (17.3%) | 0 (0.0%) |
| 4-Person Households | 15 (5.6%) | 2 (0.7%) |
| 5-Person Households | 28 (10.5%) | 0 (0.0%) |
| 6-Person Households | 3 (1.1%) | 0 (0.0%) |
| 7+ Person Households | 3 (1.1%) | 0 (0.0%) |
| Total | 159 (59.8%) | 107 (40.2%) |
Female Fertility in Galena
Fertility by Age in Galena
Average fertility rate in Galena is 80.0 births per 1,000 women. Women in the age bracket of 20 to 34 years have the highest fertility rate with 160.0 births per 1,000 women. Women in the age bracket of 20 to 34 years acount for 100.0% of all women with births.
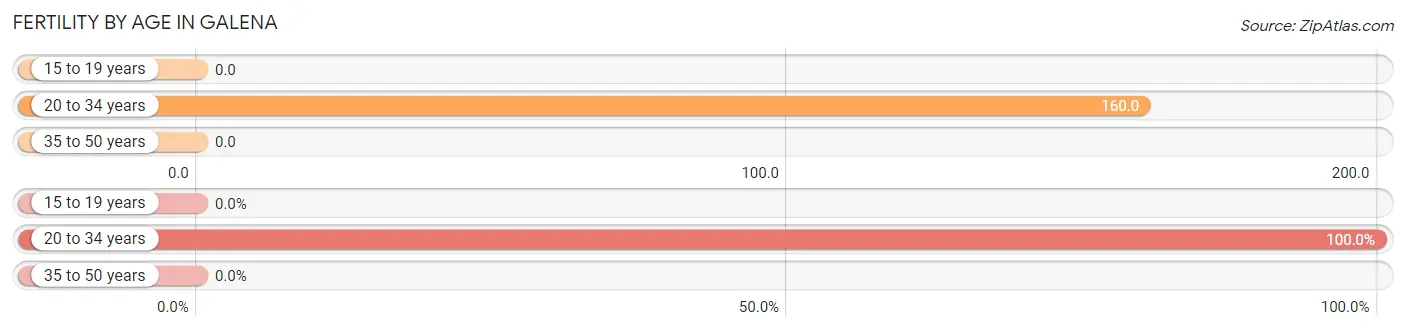
| Age Bracket | Women with Births | Births / 1,000 Women |
| 15 to 19 years | 0 (0.0%) | 0.0 |
| 20 to 34 years | 15 (100.0%) | 160.0 |
| 35 to 50 years | 0 (0.0%) | 0.0 |
| Total | 15 (100.0%) | 80.0 |
Fertility by Age by Marriage Status in Galena
13.3% of women with births (15) in Galena are married. The highest percentage of unmarried women with births falls into 20 to 34 years age bracket with 86.7% of them unmarried at the time of birth, while the lowest percentage of unmarried women with births belong to 20 to 34 years age bracket with 86.7% of them unmarried.
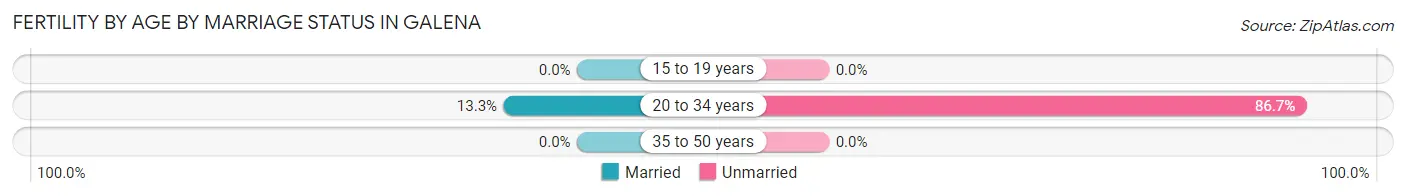
| Age Bracket | Married | Unmarried |
| 15 to 19 years | 0 (0.0%) | 0 (0.0%) |
| 20 to 34 years | 2 (13.3%) | 13 (86.7%) |
| 35 to 50 years | 0 (0.0%) | 0 (0.0%) |
| Total | 2 (13.3%) | 13 (86.7%) |
Fertility by Education in Galena
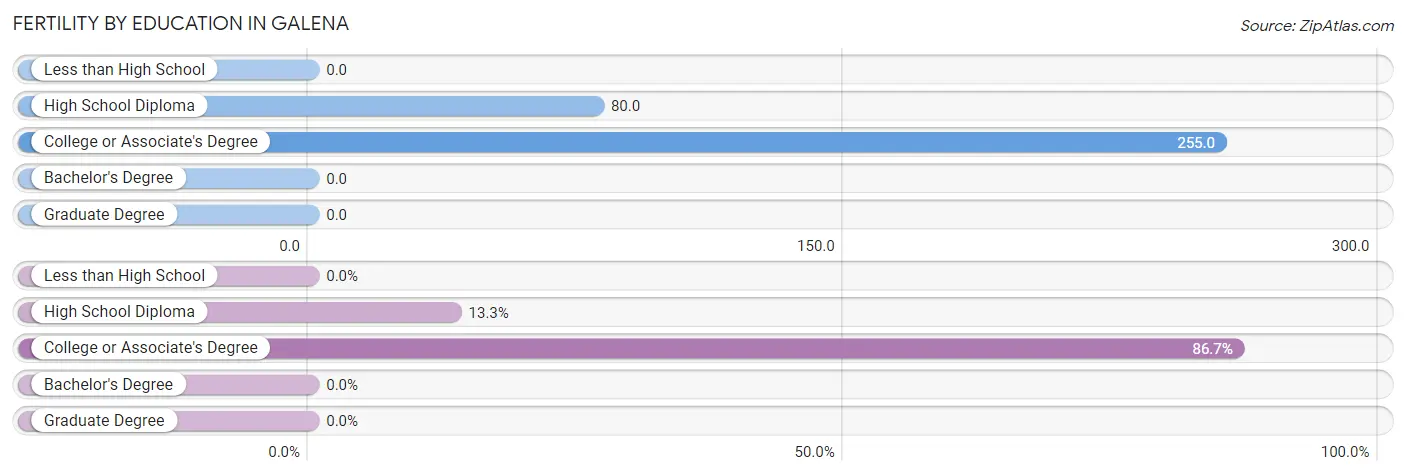
| Educational Attainment | Women with Births | Births / 1,000 Women |
| Less than High School | 0 (0.0%) | 0.0 |
| High School Diploma | 2 (13.3%) | 80.0 |
| College or Associate's Degree | 13 (86.7%) | 255.0 |
| Bachelor's Degree | 0 (0.0%) | 0.0 |
| Graduate Degree | 0 (0.0%) | 0.0 |
| Total | 15 (100.0%) | 80.0 |
Fertility by Education by Marriage Status in Galena
86.7% of women with births in Galena are unmarried. Women with the educational attainment of high school diploma are most likely to be married with 100.0% of them married at childbirth, while women with the educational attainment of college or associate's degree are least likely to be married with 100.0% of them unmarried at childbirth.
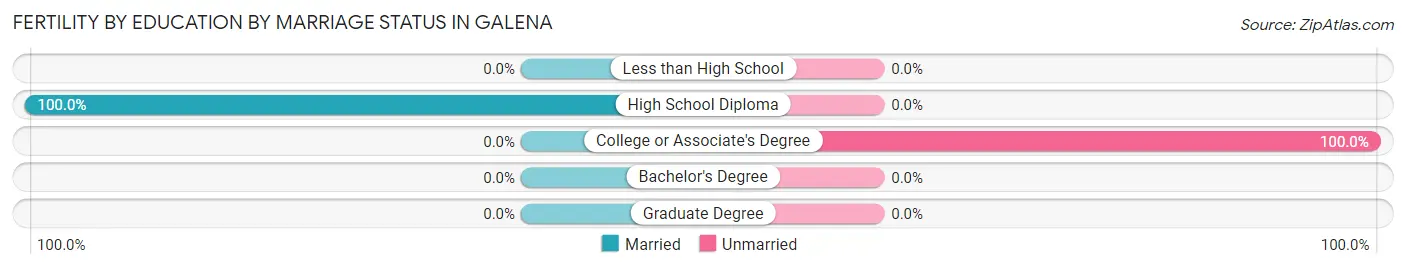
| Educational Attainment | Married | Unmarried |
| Less than High School | 0 (0.0%) | 0 (0.0%) |
| High School Diploma | 2 (100.0%) | 0 (0.0%) |
| College or Associate's Degree | 0 (0.0%) | 13 (100.0%) |
| Bachelor's Degree | 0 (0.0%) | 0 (0.0%) |
| Graduate Degree | 0 (0.0%) | 0 (0.0%) |
| Total | 2 (13.3%) | 13 (86.7%) |
Employment Characteristics in Galena
Employment by Class of Employer in Galena
Among the 335 employed individuals in Galena, local government employees (76 | 22.7%), private company employees (72 | 21.5%), and federal government employees (65 | 19.4%) make up the most common classes of employment.
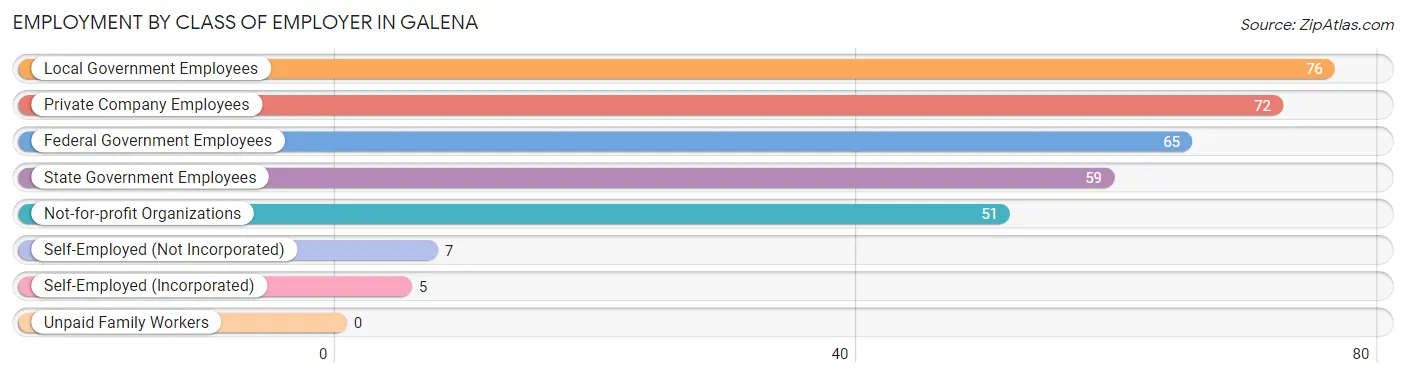
| Employer Class | # Employees | % Employees |
| Private Company Employees | 72 | 21.5% |
| Self-Employed (Incorporated) | 5 | 1.5% |
| Self-Employed (Not Incorporated) | 7 | 2.1% |
| Not-for-profit Organizations | 51 | 15.2% |
| Local Government Employees | 76 | 22.7% |
| State Government Employees | 59 | 17.6% |
| Federal Government Employees | 65 | 19.4% |
| Unpaid Family Workers | 0 | 0.0% |
| Total | 335 | 100.0% |
Employment Status by Age in Galena
According to the labor force statistics for Galena, out of the total population over 16 years of age (474), 76.2% or 361 individuals are in the labor force, with 6.9% or 25 of them unemployed. The age group with the highest labor force participation rate is 55 to 59 years, with 100.0% or 31 individuals in the labor force. Within the labor force, the 16 to 19 years age range has the highest percentage of unemployed individuals, with 56.0% or 14 of them being unemployed.
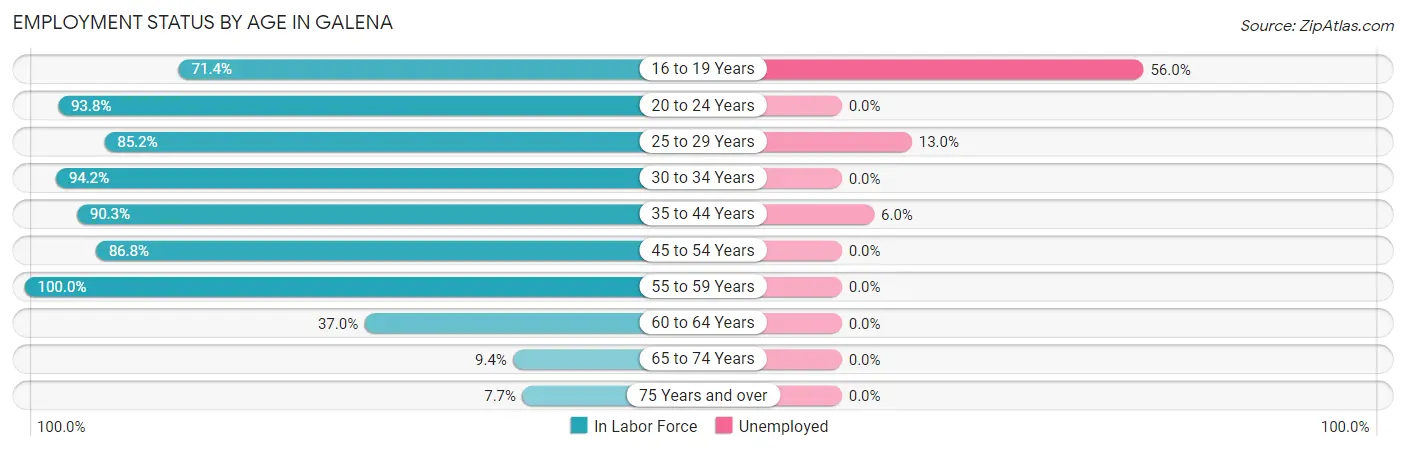
| Age Bracket | In Labor Force | Unemployed |
| 16 to 19 Years | 25 (71.4%) | 14 (56.0%) |
| 20 to 24 Years | 45 (93.8%) | 0 (0.0%) |
| 25 to 29 Years | 46 (85.2%) | 6 (13.0%) |
| 30 to 34 Years | 49 (94.2%) | 0 (0.0%) |
| 35 to 44 Years | 84 (90.3%) | 5 (6.0%) |
| 45 to 54 Years | 66 (86.8%) | 0 (0.0%) |
| 55 to 59 Years | 31 (100.0%) | 0 (0.0%) |
| 60 to 64 Years | 10 (37.0%) | 0 (0.0%) |
| 65 to 74 Years | 3 (9.4%) | 0 (0.0%) |
| 75 Years and over | 2 (7.7%) | 0 (0.0%) |
| Total | 361 (76.2%) | 25 (6.9%) |
Employment Status by Educational Attainment in Galena
According to labor force statistics for Galena, 85.9% of individuals (286) out of the total population between 25 and 64 years of age (333) are in the labor force, with 3.8% or 11 of them being unemployed. The group with the highest labor force participation rate are those with the educational attainment of bachelor's degree or higher, with 97.5% or 117 individuals in the labor force. Within the labor force, individuals with high school diploma education have the highest percentage of unemployment, with 9.9% or 9 of them being unemployed.
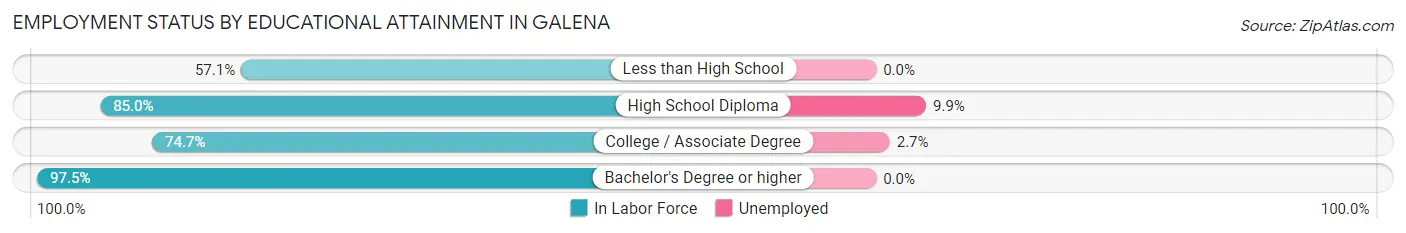
| Educational Attainment | In Labor Force | Unemployed |
| Less than High School | 4 (57.1%) | 0 (0.0%) |
| High School Diploma | 91 (85.0%) | 11 (9.9%) |
| College / Associate Degree | 74 (74.7%) | 3 (2.7%) |
| Bachelor's Degree or higher | 117 (97.5%) | 0 (0.0%) |
| Total | 286 (85.9%) | 13 (3.8%) |
Employment Occupations by Sex in Galena
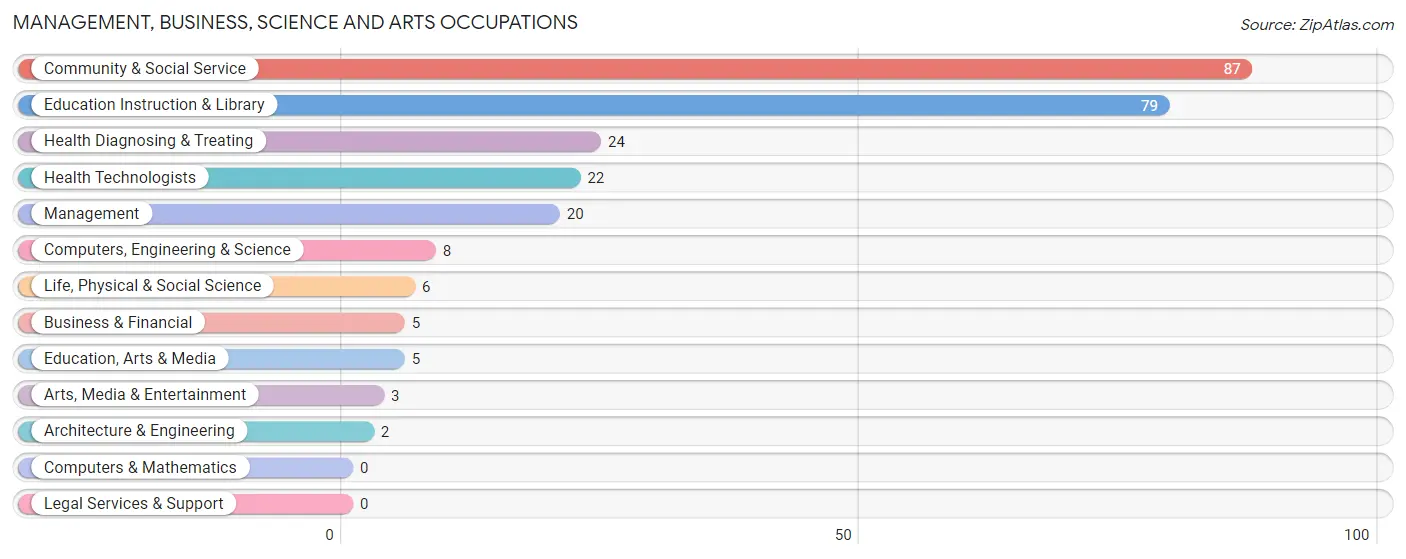
Management, Business, Science and Arts Occupations
The most common Management, Business, Science and Arts occupations in Galena are Community & Social Service (87 | 25.9%), Education Instruction & Library (79 | 23.5%), Health Diagnosing & Treating (24 | 7.1%), Health Technologists (22 | 6.6%), and Management (20 | 5.9%).
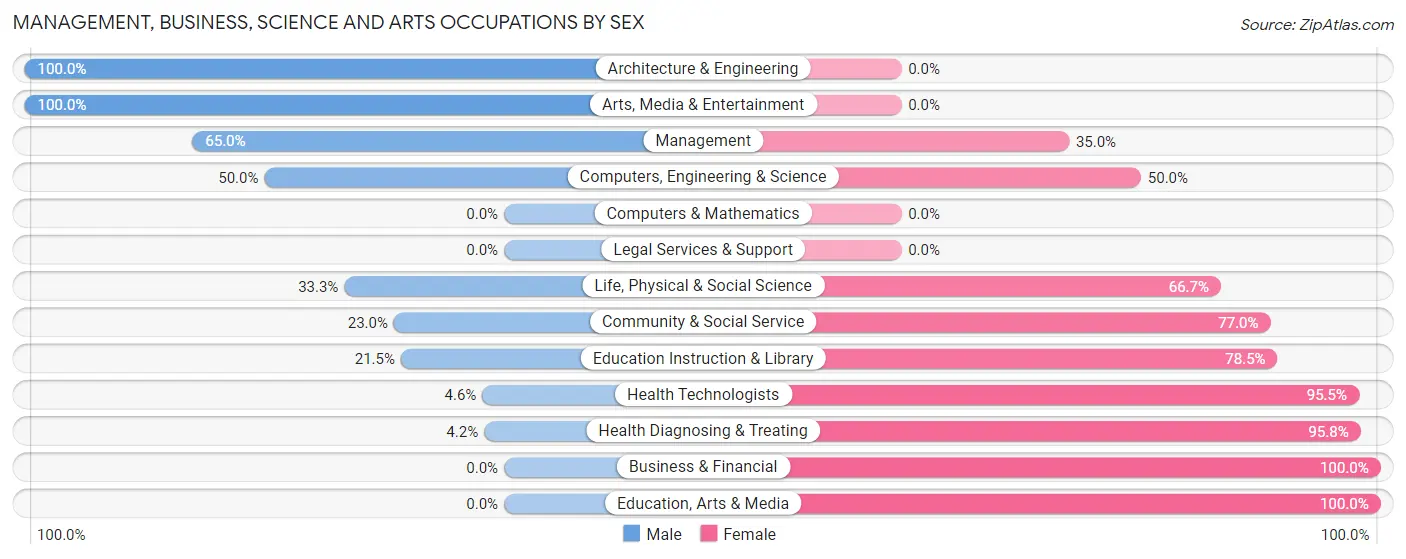
Management, Business, Science and Arts Occupations by Sex
Within the Management, Business, Science and Arts occupations in Galena, the most male-oriented occupations are Architecture & Engineering (100.0%), Arts, Media & Entertainment (100.0%), and Management (65.0%), while the most female-oriented occupations are Business & Financial (100.0%), Education, Arts & Media (100.0%), and Health Diagnosing & Treating (95.8%).
| Occupation | Male | Female |
| Management | 13 (65.0%) | 7 (35.0%) |
| Business & Financial | 0 (0.0%) | 5 (100.0%) |
| Computers, Engineering & Science | 4 (50.0%) | 4 (50.0%) |
| Computers & Mathematics | 0 (0.0%) | 0 (0.0%) |
| Architecture & Engineering | 2 (100.0%) | 0 (0.0%) |
| Life, Physical & Social Science | 2 (33.3%) | 4 (66.7%) |
| Community & Social Service | 20 (23.0%) | 67 (77.0%) |
| Education, Arts & Media | 0 (0.0%) | 5 (100.0%) |
| Legal Services & Support | 0 (0.0%) | 0 (0.0%) |
| Education Instruction & Library | 17 (21.5%) | 62 (78.5%) |
| Arts, Media & Entertainment | 3 (100.0%) | 0 (0.0%) |
| Health Diagnosing & Treating | 1 (4.2%) | 23 (95.8%) |
| Health Technologists | 1 (4.5%) | 21 (95.5%) |
| Total (Category) | 38 (26.4%) | 106 (73.6%) |
| Total (Overall) | 125 (37.2%) | 211 (62.8%) |
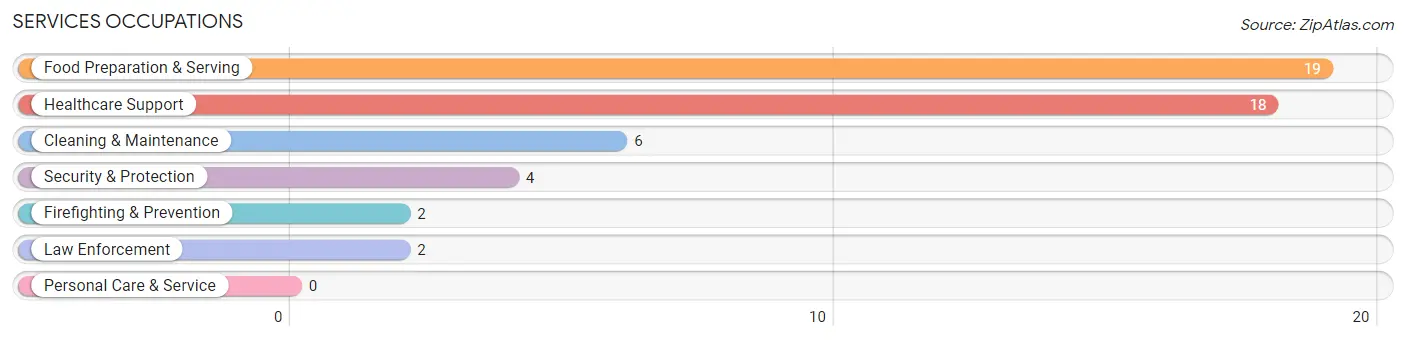
Services Occupations
The most common Services occupations in Galena are Food Preparation & Serving (19 | 5.7%), Healthcare Support (18 | 5.4%), Cleaning & Maintenance (6 | 1.8%), Security & Protection (4 | 1.2%), and Firefighting & Prevention (2 | 0.6%).
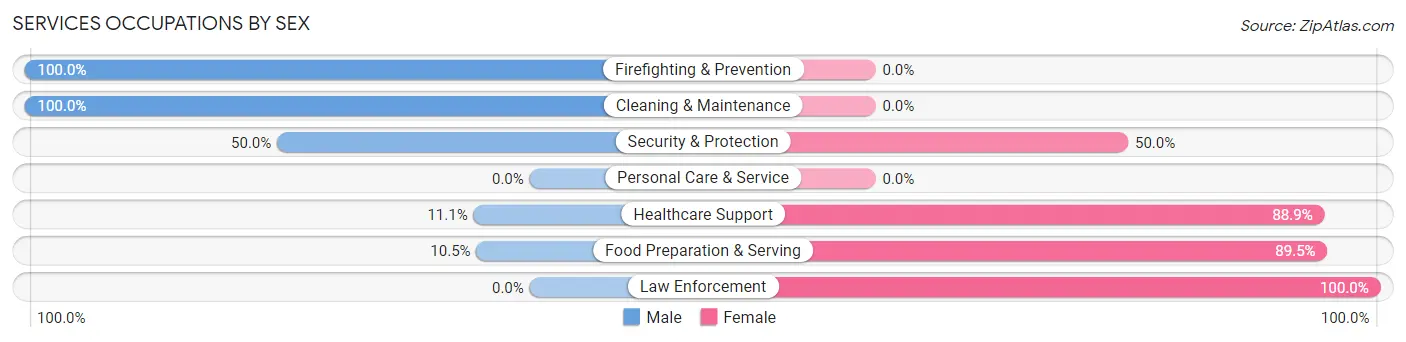
Services Occupations by Sex
Within the Services occupations in Galena, the most male-oriented occupations are Firefighting & Prevention (100.0%), Cleaning & Maintenance (100.0%), and Security & Protection (50.0%), while the most female-oriented occupations are Law Enforcement (100.0%), Food Preparation & Serving (89.5%), and Healthcare Support (88.9%).
| Occupation | Male | Female |
| Healthcare Support | 2 (11.1%) | 16 (88.9%) |
| Security & Protection | 2 (50.0%) | 2 (50.0%) |
| Firefighting & Prevention | 2 (100.0%) | 0 (0.0%) |
| Law Enforcement | 0 (0.0%) | 2 (100.0%) |
| Food Preparation & Serving | 2 (10.5%) | 17 (89.5%) |
| Cleaning & Maintenance | 6 (100.0%) | 0 (0.0%) |
| Personal Care & Service | 0 (0.0%) | 0 (0.0%) |
| Total (Category) | 12 (25.5%) | 35 (74.5%) |
| Total (Overall) | 125 (37.2%) | 211 (62.8%) |
Sales and Office Occupations
The most common Sales and Office occupations in Galena are Office & Administration (56 | 16.7%), and Sales & Related (17 | 5.1%).
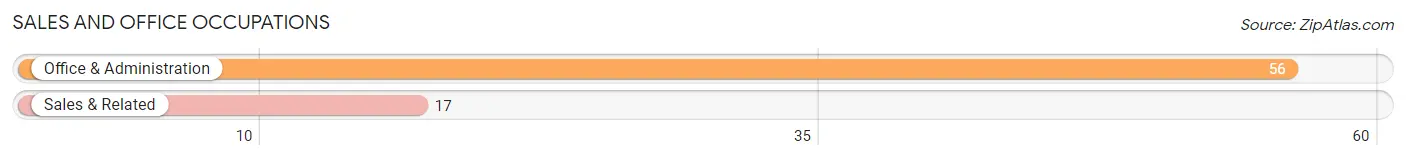
Sales and Office Occupations by Sex
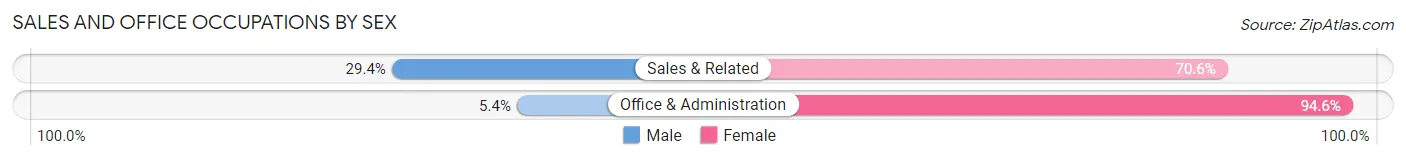
| Occupation | Male | Female |
| Sales & Related | 5 (29.4%) | 12 (70.6%) |
| Office & Administration | 3 (5.4%) | 53 (94.6%) |
| Total (Category) | 8 (11.0%) | 65 (89.0%) |
| Total (Overall) | 125 (37.2%) | 211 (62.8%) |
Natural Resources, Construction and Maintenance Occupations
The most common Natural Resources, Construction and Maintenance occupations in Galena are Construction & Extraction (27 | 8.0%), and Farming, Fishing & Forestry (4 | 1.2%).
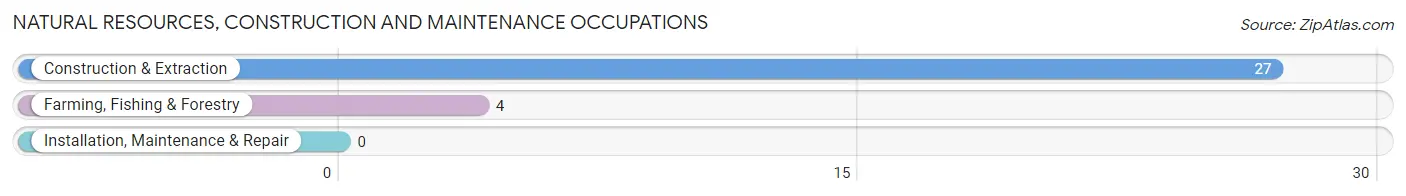
Natural Resources, Construction and Maintenance Occupations by Sex
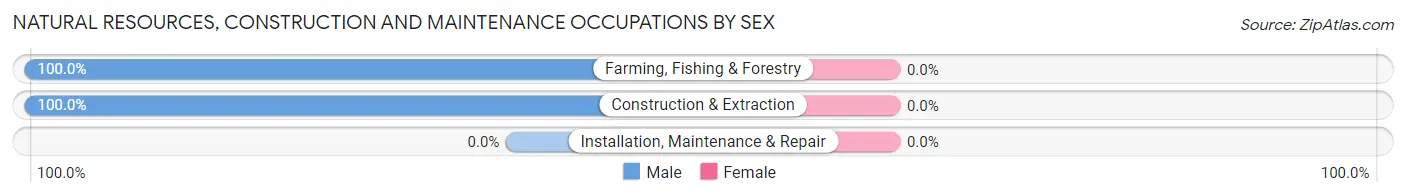
| Occupation | Male | Female |
| Farming, Fishing & Forestry | 4 (100.0%) | 0 (0.0%) |
| Construction & Extraction | 27 (100.0%) | 0 (0.0%) |
| Installation, Maintenance & Repair | 0 (0.0%) | 0 (0.0%) |
| Total (Category) | 31 (100.0%) | 0 (0.0%) |
| Total (Overall) | 125 (37.2%) | 211 (62.8%) |
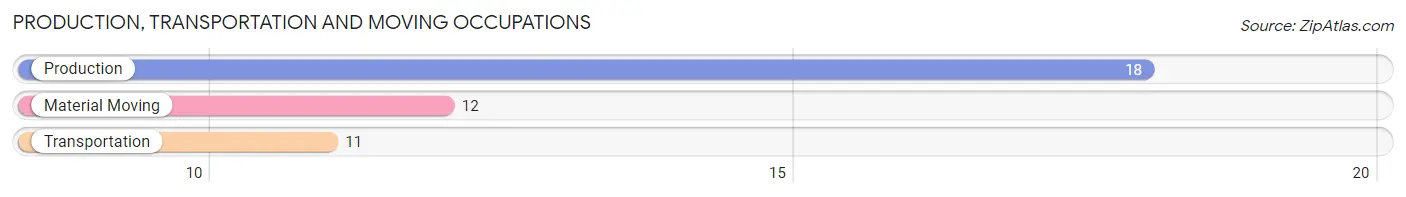
Production, Transportation and Moving Occupations
The most common Production, Transportation and Moving occupations in Galena are Production (18 | 5.4%), Material Moving (12 | 3.6%), and Transportation (11 | 3.3%).
Production, Transportation and Moving Occupations by Sex
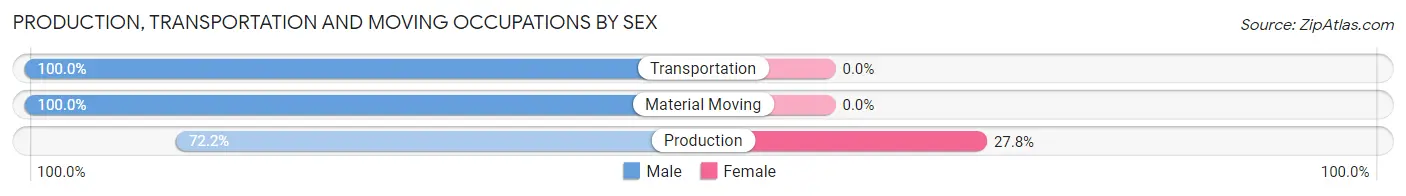
| Occupation | Male | Female |
| Production | 13 (72.2%) | 5 (27.8%) |
| Transportation | 11 (100.0%) | 0 (0.0%) |
| Material Moving | 12 (100.0%) | 0 (0.0%) |
| Total (Category) | 36 (87.8%) | 5 (12.2%) |
| Total (Overall) | 125 (37.2%) | 211 (62.8%) |
Employment Industries by Sex in Galena
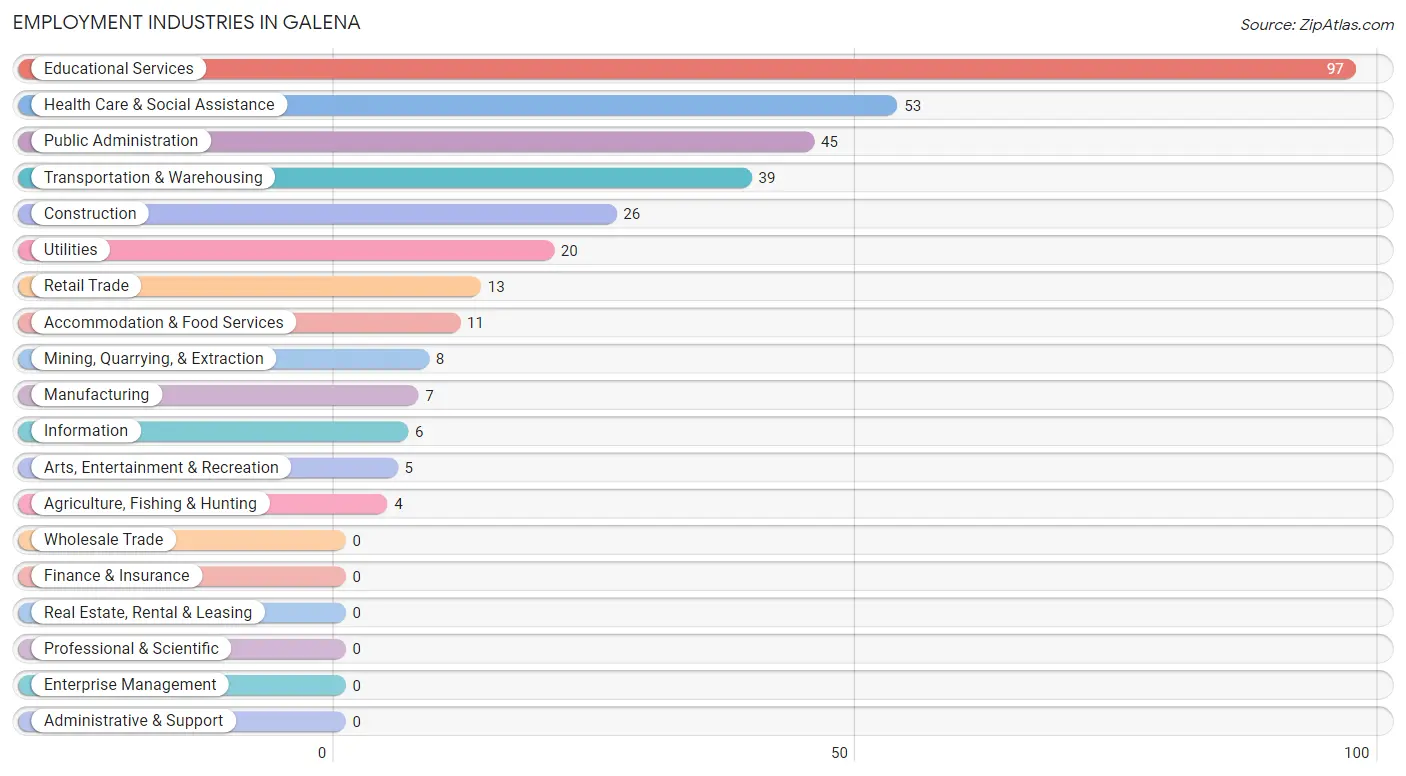
Employment Industries in Galena
The major employment industries in Galena include Educational Services (97 | 28.9%), Health Care & Social Assistance (53 | 15.8%), Public Administration (45 | 13.4%), Transportation & Warehousing (39 | 11.6%), and Construction (26 | 7.7%).
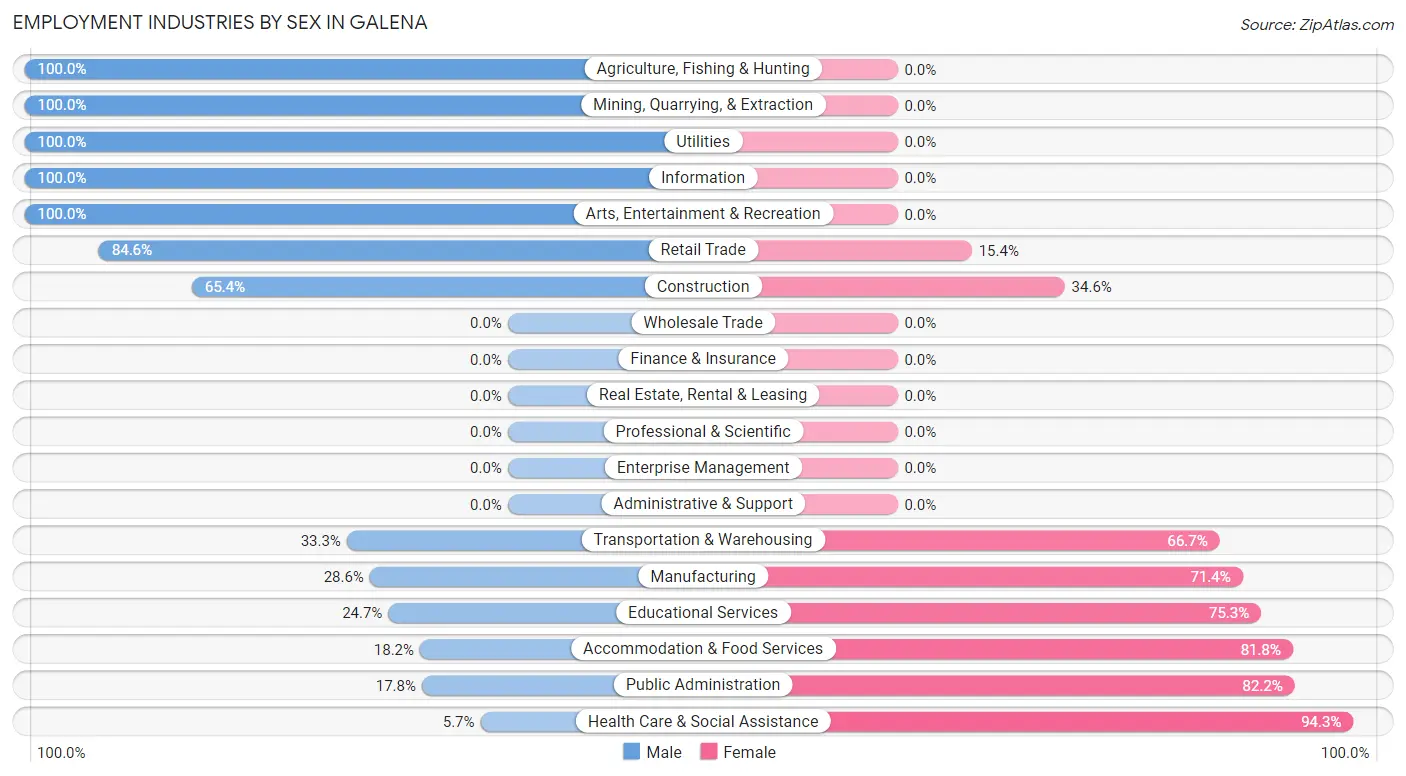
Employment Industries by Sex in Galena
The Galena industries that see more men than women are Agriculture, Fishing & Hunting (100.0%), Mining, Quarrying, & Extraction (100.0%), and Utilities (100.0%), whereas the industries that tend to have a higher number of women are Health Care & Social Assistance (94.3%), Public Administration (82.2%), and Accommodation & Food Services (81.8%).
| Industry | Male | Female |
| Agriculture, Fishing & Hunting | 4 (100.0%) | 0 (0.0%) |
| Mining, Quarrying, & Extraction | 8 (100.0%) | 0 (0.0%) |
| Construction | 17 (65.4%) | 9 (34.6%) |
| Manufacturing | 2 (28.6%) | 5 (71.4%) |
| Wholesale Trade | 0 (0.0%) | 0 (0.0%) |
| Retail Trade | 11 (84.6%) | 2 (15.4%) |
| Transportation & Warehousing | 13 (33.3%) | 26 (66.7%) |
| Utilities | 20 (100.0%) | 0 (0.0%) |
| Information | 6 (100.0%) | 0 (0.0%) |
| Finance & Insurance | 0 (0.0%) | 0 (0.0%) |
| Real Estate, Rental & Leasing | 0 (0.0%) | 0 (0.0%) |
| Professional & Scientific | 0 (0.0%) | 0 (0.0%) |
| Enterprise Management | 0 (0.0%) | 0 (0.0%) |
| Administrative & Support | 0 (0.0%) | 0 (0.0%) |
| Educational Services | 24 (24.7%) | 73 (75.3%) |
| Health Care & Social Assistance | 3 (5.7%) | 50 (94.3%) |
| Arts, Entertainment & Recreation | 5 (100.0%) | 0 (0.0%) |
| Accommodation & Food Services | 2 (18.2%) | 9 (81.8%) |
| Public Administration | 8 (17.8%) | 37 (82.2%) |
| Total | 125 (37.2%) | 211 (62.8%) |
Education in Galena
School Enrollment in Galena
The most common levels of schooling among the 178 students in Galena are elementary school (44 | 24.7%), middle school (42 | 23.6%), and high school (31 | 17.4%).
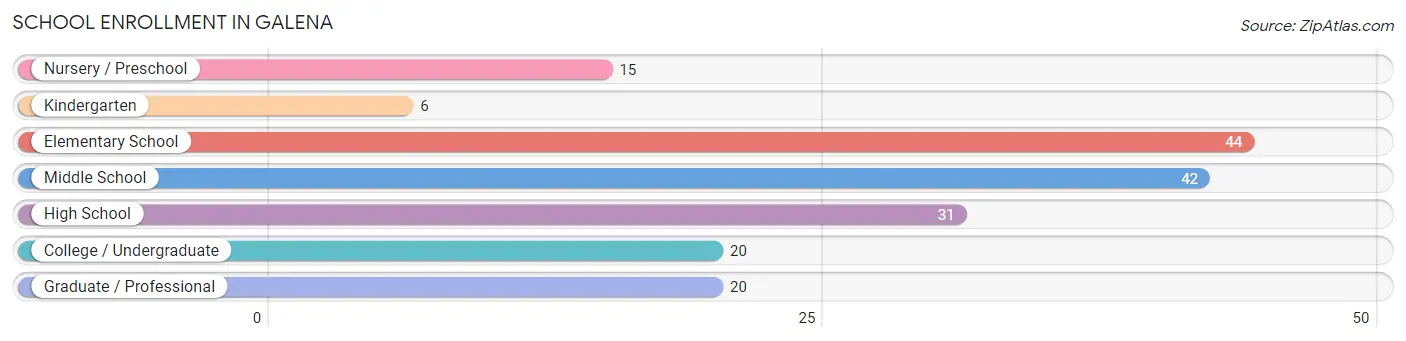
| School Level | # Students | % Students |
| Nursery / Preschool | 15 | 8.4% |
| Kindergarten | 6 | 3.4% |
| Elementary School | 44 | 24.7% |
| Middle School | 42 | 23.6% |
| High School | 31 | 17.4% |
| College / Undergraduate | 20 | 11.2% |
| Graduate / Professional | 20 | 11.2% |
| Total | 178 | 100.0% |
School Enrollment by Age by Funding Source in Galena
Out of a total of 178 students who are enrolled in schools in Galena, 9 (5.1%) attend a private institution, while the remaining 169 (94.9%) are enrolled in public schools. The age group of 5 to 9 year old has the highest likelihood of being enrolled in private schools, with 9 (15.5% in the age bracket) enrolled. Conversely, the age group of 3 to 4 year olds has the lowest likelihood of being enrolled in a private school, with 11 (100.0% in the age bracket) attending a public institution.
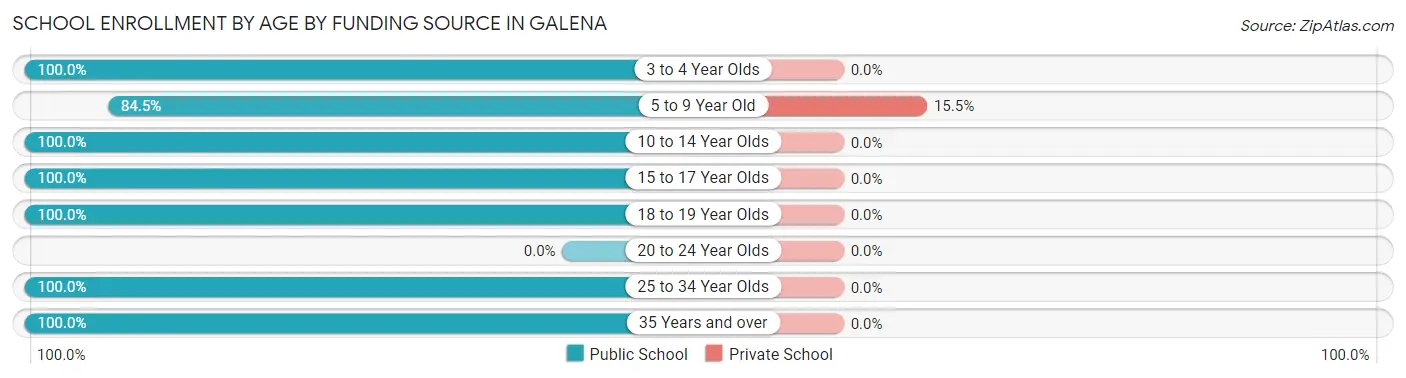
| Age Bracket | Public School | Private School |
| 3 to 4 Year Olds | 11 (100.0%) | 0 (0.0%) |
| 5 to 9 Year Old | 49 (84.5%) | 9 (15.5%) |
| 10 to 14 Year Olds | 41 (100.0%) | 0 (0.0%) |
| 15 to 17 Year Olds | 22 (100.0%) | 0 (0.0%) |
| 18 to 19 Year Olds | 7 (100.0%) | 0 (0.0%) |
| 20 to 24 Year Olds | 0 (0.0%) | 0 (0.0%) |
| 25 to 34 Year Olds | 10 (100.0%) | 0 (0.0%) |
| 35 Years and over | 29 (100.0%) | 0 (0.0%) |
| Total | 169 (94.9%) | 9 (5.1%) |
Educational Attainment by Field of Study in Galena
Education (65 | 46.8%), bio, nature & agricultural (39 | 28.1%), literature & languages (11 | 7.9%), visual & performing arts (8 | 5.8%), and business (7 | 5.0%) are the most common fields of study among 139 individuals in Galena who have obtained a bachelor's degree or higher.
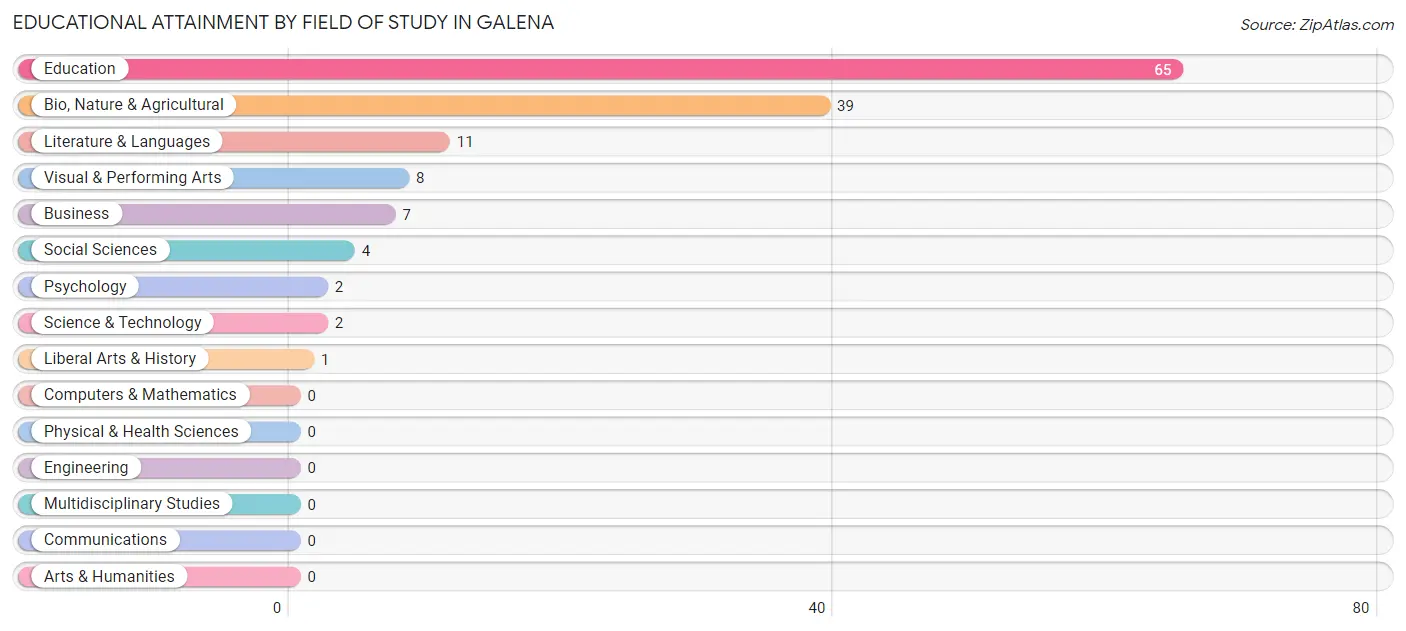
| Field of Study | # Graduates | % Graduates |
| Computers & Mathematics | 0 | 0.0% |
| Bio, Nature & Agricultural | 39 | 28.1% |
| Physical & Health Sciences | 0 | 0.0% |
| Psychology | 2 | 1.4% |
| Social Sciences | 4 | 2.9% |
| Engineering | 0 | 0.0% |
| Multidisciplinary Studies | 0 | 0.0% |
| Science & Technology | 2 | 1.4% |
| Business | 7 | 5.0% |
| Education | 65 | 46.8% |
| Literature & Languages | 11 | 7.9% |
| Liberal Arts & History | 1 | 0.7% |
| Visual & Performing Arts | 8 | 5.8% |
| Communications | 0 | 0.0% |
| Arts & Humanities | 0 | 0.0% |
| Total | 139 | 100.0% |
Transportation & Commute in Galena
Vehicle Availability by Sex in Galena
The most prevalent vehicle ownership categories in Galena are males with 1 vehicle (51, accounting for 44.0%) and females with 1 vehicle (101, making up 24.2%).
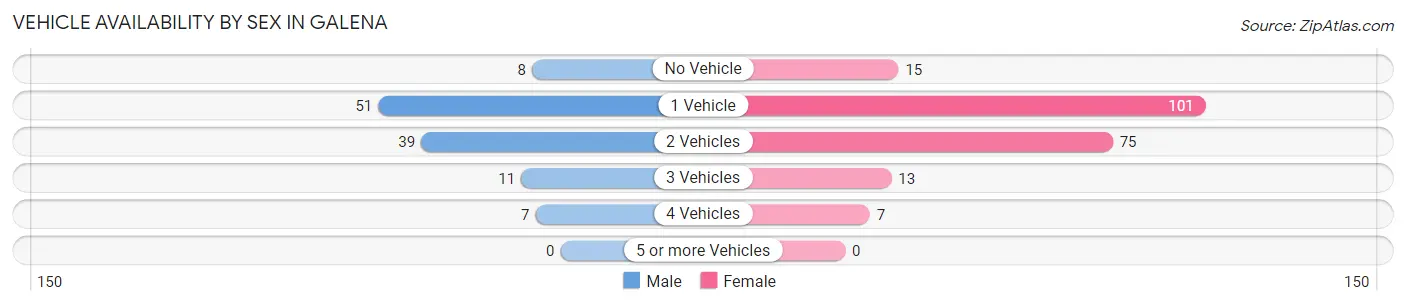
| Vehicles Available | Male | Female |
| No Vehicle | 8 (6.9%) | 15 (7.1%) |
| 1 Vehicle | 51 (44.0%) | 101 (47.9%) |
| 2 Vehicles | 39 (33.6%) | 75 (35.5%) |
| 3 Vehicles | 11 (9.5%) | 13 (6.2%) |
| 4 Vehicles | 7 (6.0%) | 7 (3.3%) |
| 5 or more Vehicles | 0 (0.0%) | 0 (0.0%) |
| Total | 116 (100.0%) | 211 (100.0%) |
Commute Time in Galena
The most frequently occuring commute durations in Galena are 5 to 9 minutes (104 commuters, 32.0%), 10 to 14 minutes (97 commuters, 29.8%), and less than 5 minutes (68 commuters, 20.9%).
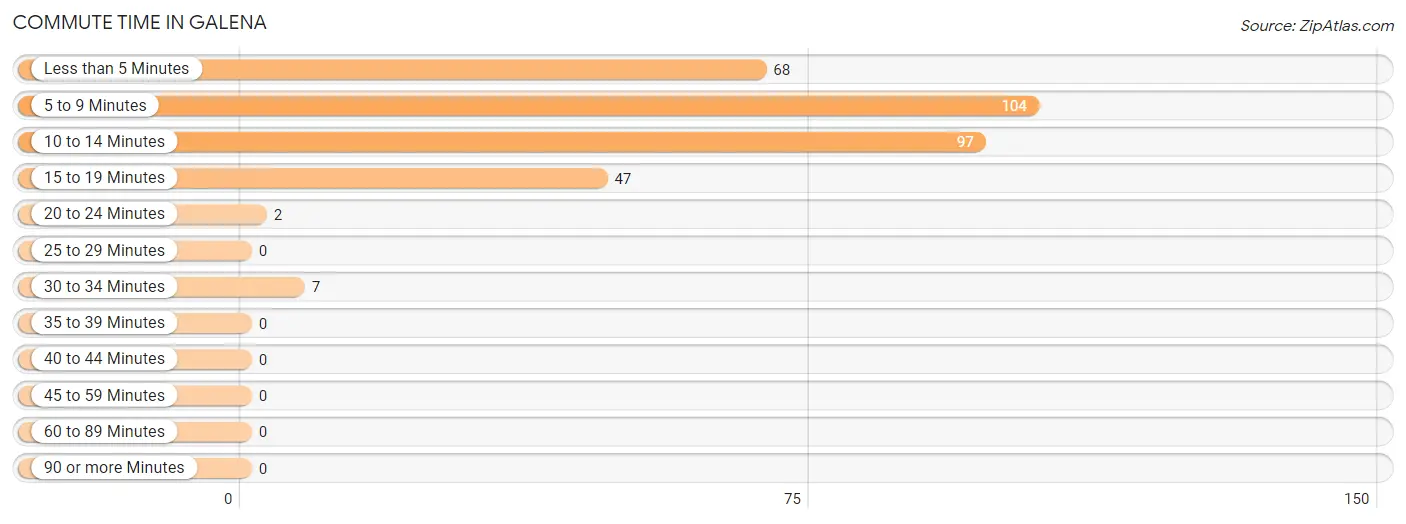
| Commute Time | # Commuters | % Commuters |
| Less than 5 Minutes | 68 | 20.9% |
| 5 to 9 Minutes | 104 | 32.0% |
| 10 to 14 Minutes | 97 | 29.8% |
| 15 to 19 Minutes | 47 | 14.5% |
| 20 to 24 Minutes | 2 | 0.6% |
| 25 to 29 Minutes | 0 | 0.0% |
| 30 to 34 Minutes | 7 | 2.1% |
| 35 to 39 Minutes | 0 | 0.0% |
| 40 to 44 Minutes | 0 | 0.0% |
| 45 to 59 Minutes | 0 | 0.0% |
| 60 to 89 Minutes | 0 | 0.0% |
| 90 or more Minutes | 0 | 0.0% |
Commute Time by Sex in Galena
The most common commute times in Galena are 10 to 14 minutes (42 commuters, 35.3%) for males and 5 to 9 minutes (84 commuters, 40.8%) for females.
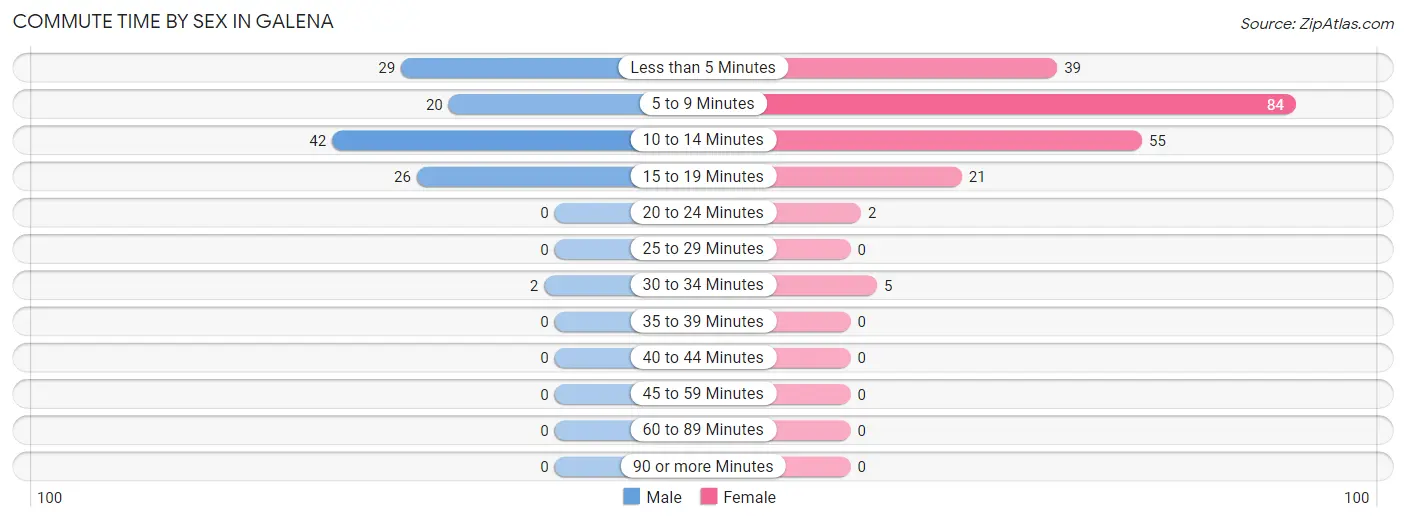
| Commute Time | Male | Female |
| Less than 5 Minutes | 29 (24.4%) | 39 (18.9%) |
| 5 to 9 Minutes | 20 (16.8%) | 84 (40.8%) |
| 10 to 14 Minutes | 42 (35.3%) | 55 (26.7%) |
| 15 to 19 Minutes | 26 (21.8%) | 21 (10.2%) |
| 20 to 24 Minutes | 0 (0.0%) | 2 (1.0%) |
| 25 to 29 Minutes | 0 (0.0%) | 0 (0.0%) |
| 30 to 34 Minutes | 2 (1.7%) | 5 (2.4%) |
| 35 to 39 Minutes | 0 (0.0%) | 0 (0.0%) |
| 40 to 44 Minutes | 0 (0.0%) | 0 (0.0%) |
| 45 to 59 Minutes | 0 (0.0%) | 0 (0.0%) |
| 60 to 89 Minutes | 0 (0.0%) | 0 (0.0%) |
| 90 or more Minutes | 0 (0.0%) | 0 (0.0%) |
Time of Departure to Work by Sex in Galena
The most frequent times of departure to work in Galena are 7:30 AM to 7:59 AM (53, 44.5%) for males and 7:30 AM to 7:59 AM (147, 71.4%) for females.
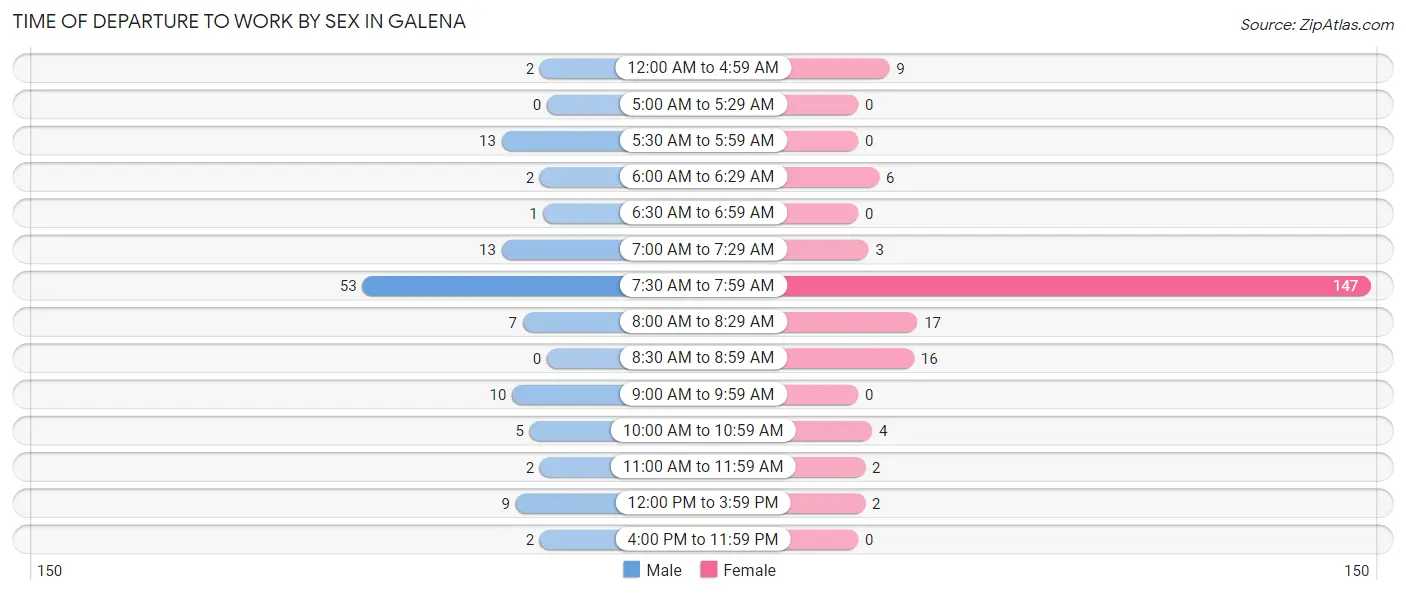
| Time of Departure | Male | Female |
| 12:00 AM to 4:59 AM | 2 (1.7%) | 9 (4.4%) |
| 5:00 AM to 5:29 AM | 0 (0.0%) | 0 (0.0%) |
| 5:30 AM to 5:59 AM | 13 (10.9%) | 0 (0.0%) |
| 6:00 AM to 6:29 AM | 2 (1.7%) | 6 (2.9%) |
| 6:30 AM to 6:59 AM | 1 (0.8%) | 0 (0.0%) |
| 7:00 AM to 7:29 AM | 13 (10.9%) | 3 (1.5%) |
| 7:30 AM to 7:59 AM | 53 (44.5%) | 147 (71.4%) |
| 8:00 AM to 8:29 AM | 7 (5.9%) | 17 (8.3%) |
| 8:30 AM to 8:59 AM | 0 (0.0%) | 16 (7.8%) |
| 9:00 AM to 9:59 AM | 10 (8.4%) | 0 (0.0%) |
| 10:00 AM to 10:59 AM | 5 (4.2%) | 4 (1.9%) |
| 11:00 AM to 11:59 AM | 2 (1.7%) | 2 (1.0%) |
| 12:00 PM to 3:59 PM | 9 (7.6%) | 2 (1.0%) |
| 4:00 PM to 11:59 PM | 2 (1.7%) | 0 (0.0%) |
| Total | 119 (100.0%) | 206 (100.0%) |
Housing Occupancy in Galena
Occupancy by Ownership in Galena
Of the total 266 dwellings in Galena, owner-occupied units account for 166 (62.4%), while renter-occupied units make up 100 (37.6%).
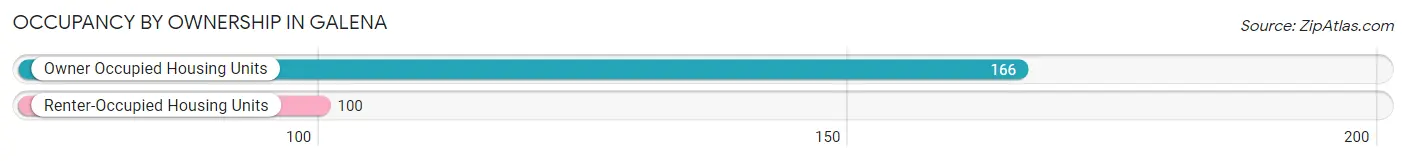
| Occupancy | # Housing Units | % Housing Units |
| Owner Occupied Housing Units | 166 | 62.4% |
| Renter-Occupied Housing Units | 100 | 37.6% |
| Total Occupied Housing Units | 266 | 100.0% |
Occupancy by Household Size in Galena
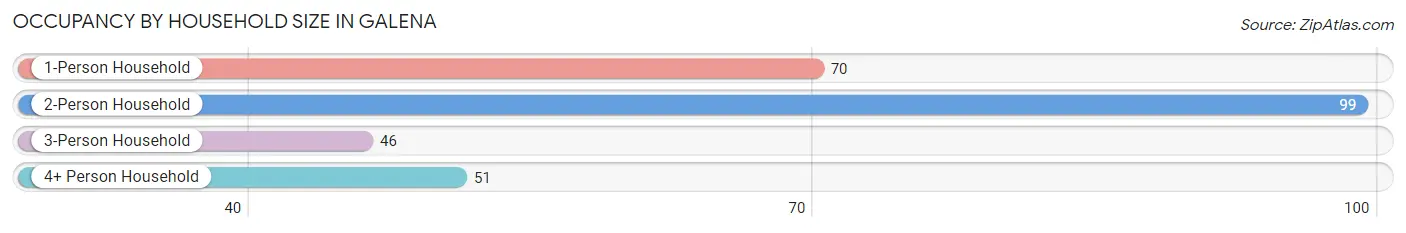
| Household Size | # Housing Units | % Housing Units |
| 1-Person Household | 70 | 26.3% |
| 2-Person Household | 99 | 37.2% |
| 3-Person Household | 46 | 17.3% |
| 4+ Person Household | 51 | 19.2% |
| Total Housing Units | 266 | 100.0% |
Occupancy by Ownership by Household Size in Galena
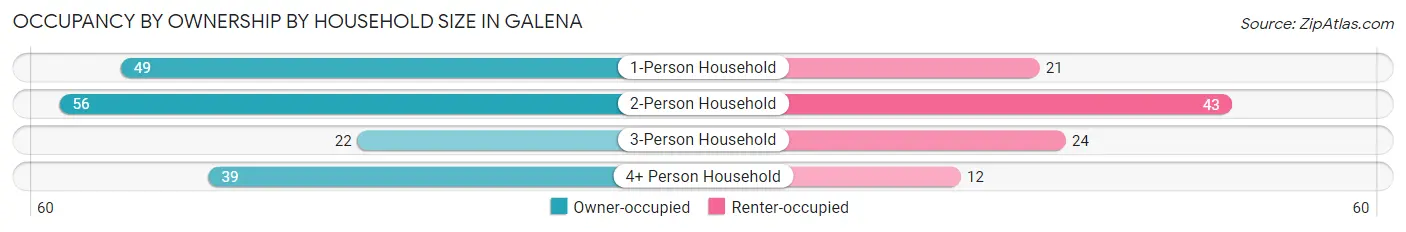
| Household Size | Owner-occupied | Renter-occupied |
| 1-Person Household | 49 (70.0%) | 21 (30.0%) |
| 2-Person Household | 56 (56.6%) | 43 (43.4%) |
| 3-Person Household | 22 (47.8%) | 24 (52.2%) |
| 4+ Person Household | 39 (76.5%) | 12 (23.5%) |
| Total Housing Units | 166 (62.4%) | 100 (37.6%) |
Occupancy by Educational Attainment in Galena
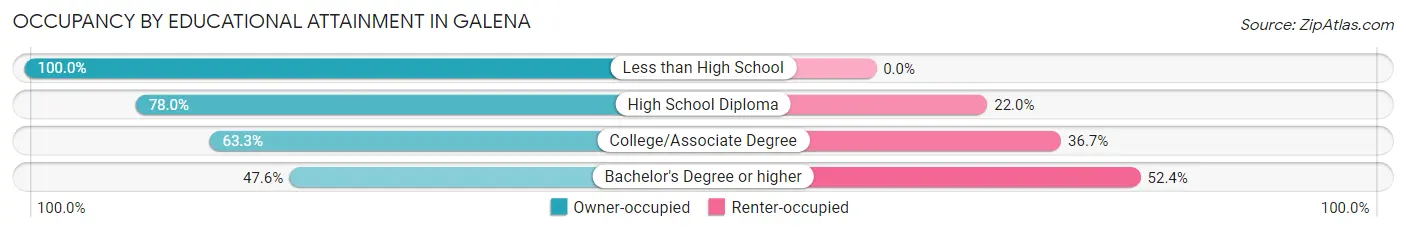
| Household Size | Owner-occupied | Renter-occupied |
| Less than High School | 14 (100.0%) | 0 (0.0%) |
| High School Diploma | 46 (78.0%) | 13 (22.0%) |
| College/Associate Degree | 57 (63.3%) | 33 (36.7%) |
| Bachelor's Degree or higher | 49 (47.6%) | 54 (52.4%) |
Occupancy by Age of Householder in Galena
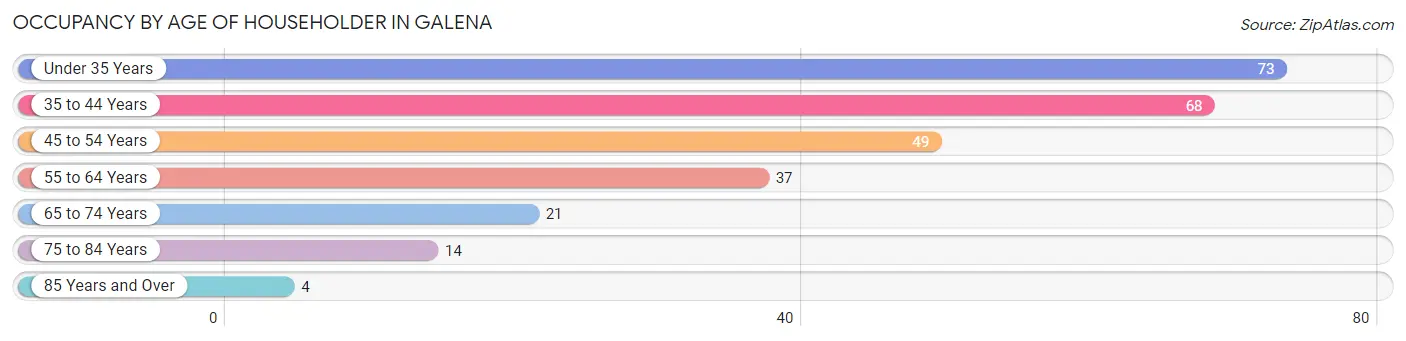
| Age Bracket | # Households | % Households |
| Under 35 Years | 73 | 27.4% |
| 35 to 44 Years | 68 | 25.6% |
| 45 to 54 Years | 49 | 18.4% |
| 55 to 64 Years | 37 | 13.9% |
| 65 to 74 Years | 21 | 7.9% |
| 75 to 84 Years | 14 | 5.3% |
| 85 Years and Over | 4 | 1.5% |
| Total | 266 | 100.0% |
Housing Finances in Galena
Median Income by Occupancy in Galena
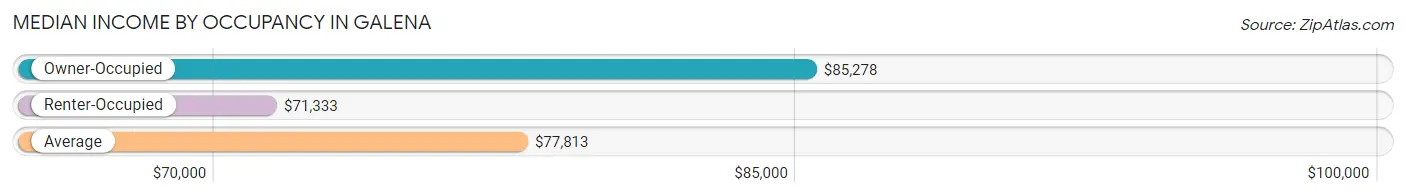
| Occupancy Type | # Households | Median Income |
| Owner-Occupied | 166 (62.4%) | $85,278 |
| Renter-Occupied | 100 (37.6%) | $71,333 |
| Average | 266 (100.0%) | $77,813 |
Occupancy by Householder Income Bracket in Galena
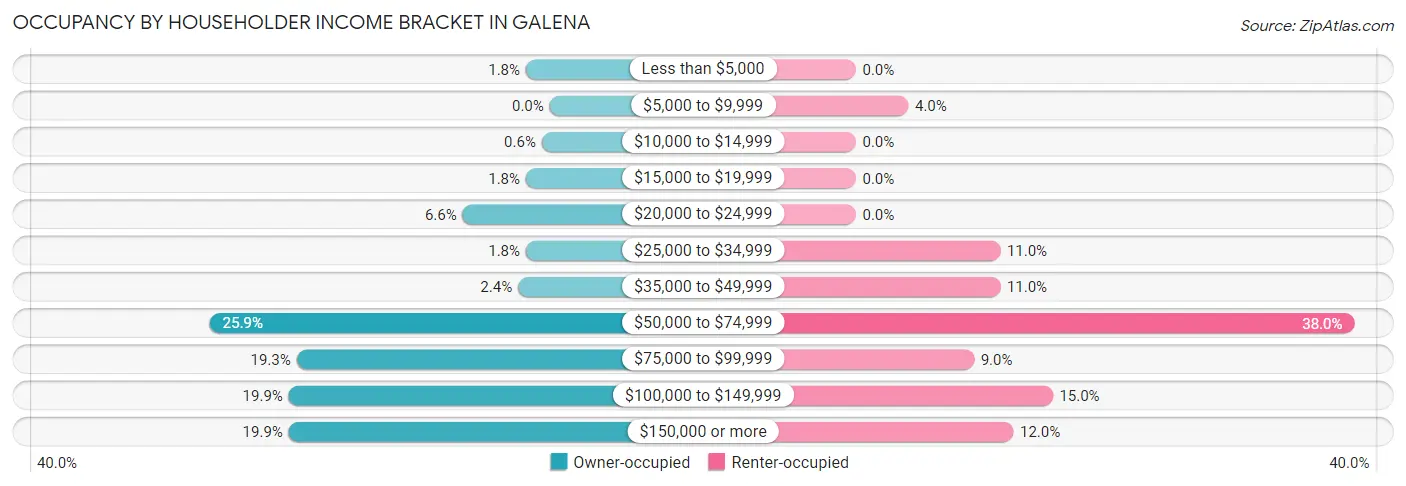
| Income Bracket | Owner-occupied | Renter-occupied |
| Less than $5,000 | 3 (1.8%) | 0 (0.0%) |
| $5,000 to $9,999 | 0 (0.0%) | 4 (4.0%) |
| $10,000 to $14,999 | 1 (0.6%) | 0 (0.0%) |
| $15,000 to $19,999 | 3 (1.8%) | 0 (0.0%) |
| $20,000 to $24,999 | 11 (6.6%) | 0 (0.0%) |
| $25,000 to $34,999 | 3 (1.8%) | 11 (11.0%) |
| $35,000 to $49,999 | 4 (2.4%) | 11 (11.0%) |
| $50,000 to $74,999 | 43 (25.9%) | 38 (38.0%) |
| $75,000 to $99,999 | 32 (19.3%) | 9 (9.0%) |
| $100,000 to $149,999 | 33 (19.9%) | 15 (15.0%) |
| $150,000 or more | 33 (19.9%) | 12 (12.0%) |
| Total | 166 (100.0%) | 100 (100.0%) |
Monthly Housing Cost Tiers in Galena
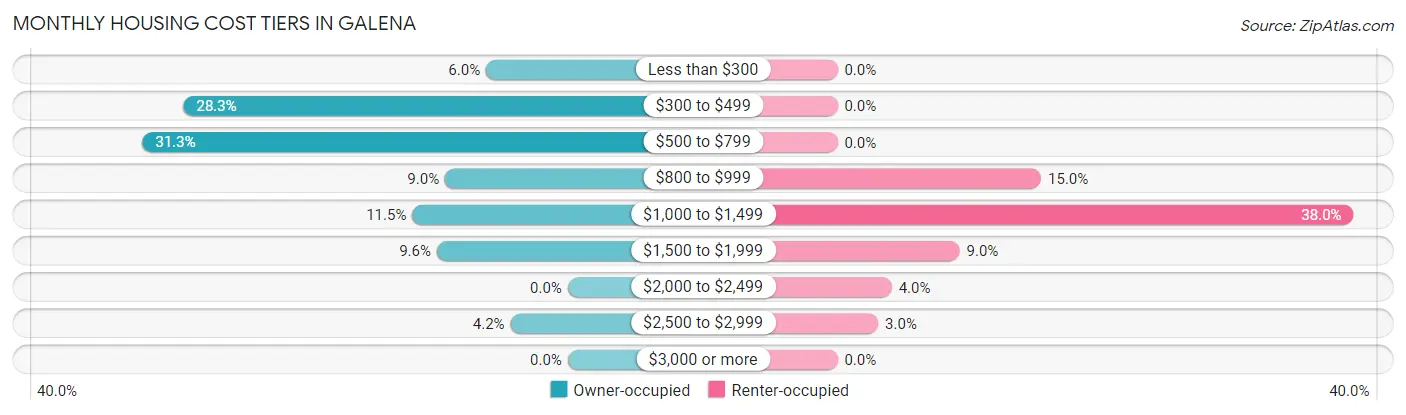
| Monthly Cost | Owner-occupied | Renter-occupied |
| Less than $300 | 10 (6.0%) | 0 (0.0%) |
| $300 to $499 | 47 (28.3%) | 0 (0.0%) |
| $500 to $799 | 52 (31.3%) | 0 (0.0%) |
| $800 to $999 | 15 (9.0%) | 15 (15.0%) |
| $1,000 to $1,499 | 19 (11.5%) | 38 (38.0%) |
| $1,500 to $1,999 | 16 (9.6%) | 9 (9.0%) |
| $2,000 to $2,499 | 0 (0.0%) | 4 (4.0%) |
| $2,500 to $2,999 | 7 (4.2%) | 3 (3.0%) |
| $3,000 or more | 0 (0.0%) | 0 (0.0%) |
| Total | 166 (100.0%) | 100 (100.0%) |
Physical Housing Characteristics in Galena
Housing Structures in Galena
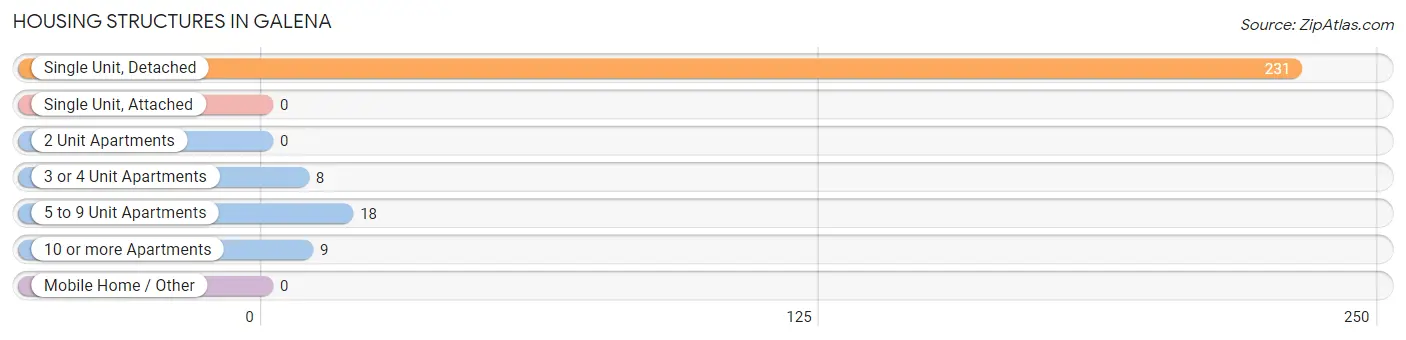
| Structure Type | # Housing Units | % Housing Units |
| Single Unit, Detached | 231 | 86.8% |
| Single Unit, Attached | 0 | 0.0% |
| 2 Unit Apartments | 0 | 0.0% |
| 3 or 4 Unit Apartments | 8 | 3.0% |
| 5 to 9 Unit Apartments | 18 | 6.8% |
| 10 or more Apartments | 9 | 3.4% |
| Mobile Home / Other | 0 | 0.0% |
| Total | 266 | 100.0% |
Housing Structures by Occupancy in Galena
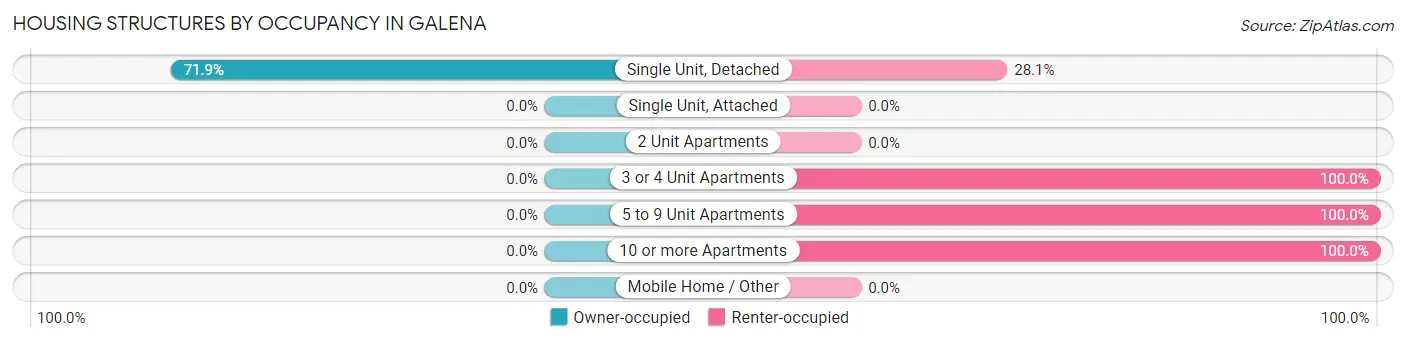
| Structure Type | Owner-occupied | Renter-occupied |
| Single Unit, Detached | 166 (71.9%) | 65 (28.1%) |
| Single Unit, Attached | 0 (0.0%) | 0 (0.0%) |
| 2 Unit Apartments | 0 (0.0%) | 0 (0.0%) |
| 3 or 4 Unit Apartments | 0 (0.0%) | 8 (100.0%) |
| 5 to 9 Unit Apartments | 0 (0.0%) | 18 (100.0%) |
| 10 or more Apartments | 0 (0.0%) | 9 (100.0%) |
| Mobile Home / Other | 0 (0.0%) | 0 (0.0%) |
| Total | 166 (62.4%) | 100 (37.6%) |
Housing Structures by Number of Rooms in Galena
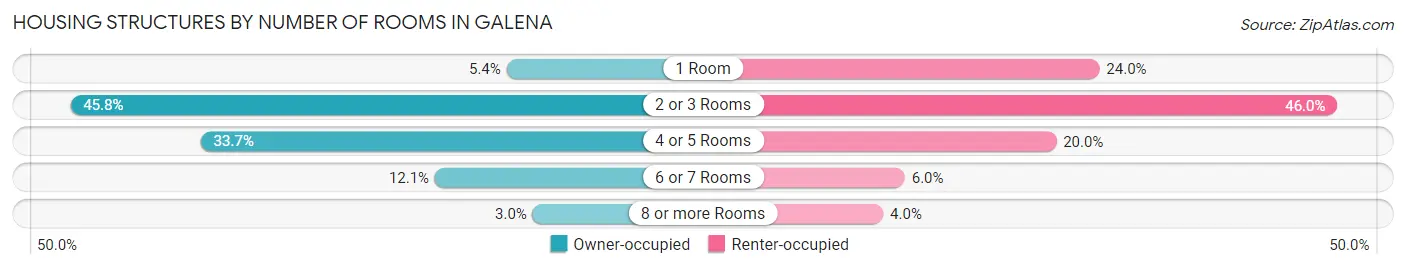
| Number of Rooms | Owner-occupied | Renter-occupied |
| 1 Room | 9 (5.4%) | 24 (24.0%) |
| 2 or 3 Rooms | 76 (45.8%) | 46 (46.0%) |
| 4 or 5 Rooms | 56 (33.7%) | 20 (20.0%) |
| 6 or 7 Rooms | 20 (12.0%) | 6 (6.0%) |
| 8 or more Rooms | 5 (3.0%) | 4 (4.0%) |
| Total | 166 (100.0%) | 100 (100.0%) |
Housing Structure by Heating Type in Galena
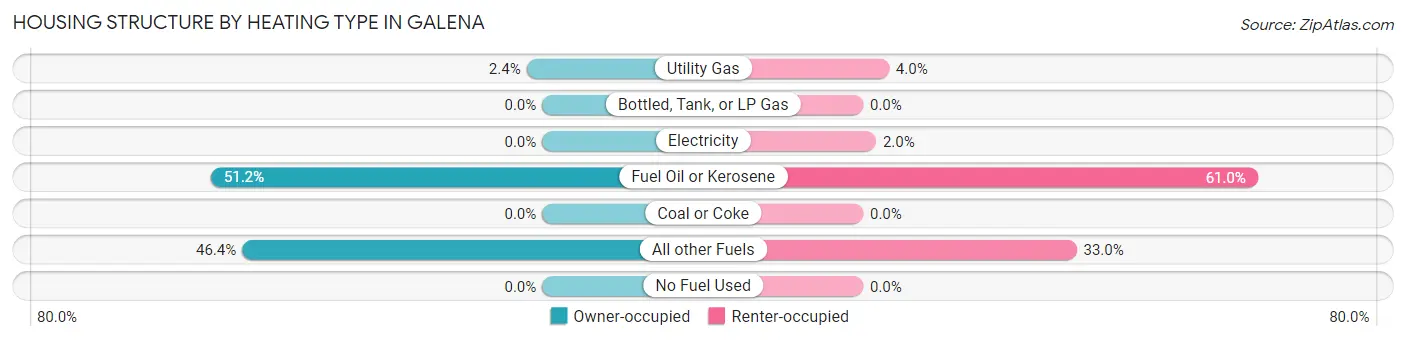
| Heating Type | Owner-occupied | Renter-occupied |
| Utility Gas | 4 (2.4%) | 4 (4.0%) |
| Bottled, Tank, or LP Gas | 0 (0.0%) | 0 (0.0%) |
| Electricity | 0 (0.0%) | 2 (2.0%) |
| Fuel Oil or Kerosene | 85 (51.2%) | 61 (61.0%) |
| Coal or Coke | 0 (0.0%) | 0 (0.0%) |
| All other Fuels | 77 (46.4%) | 33 (33.0%) |
| No Fuel Used | 0 (0.0%) | 0 (0.0%) |
| Total | 166 (100.0%) | 100 (100.0%) |
Household Vehicle Usage in Galena
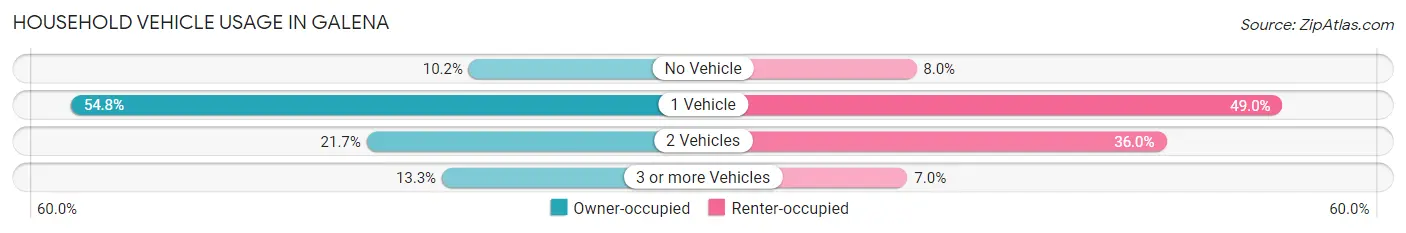
| Vehicles per Household | Owner-occupied | Renter-occupied |
| No Vehicle | 17 (10.2%) | 8 (8.0%) |
| 1 Vehicle | 91 (54.8%) | 49 (49.0%) |
| 2 Vehicles | 36 (21.7%) | 36 (36.0%) |
| 3 or more Vehicles | 22 (13.3%) | 7 (7.0%) |
| Total | 166 (100.0%) | 100 (100.0%) |
Real Estate & Mortgages in Galena
Real Estate and Mortgage Overview in Galena
| Characteristic | Without Mortgage | With Mortgage |
| Housing Units | 134 | 32 |
| Median Property Value | $98,200 | $139,600 |
| Median Household Income | $74,773 | $11 |
| Monthly Housing Costs | $591 | $0 |
| Real Estate Taxes | - | - |
Property Value by Mortgage Status in Galena
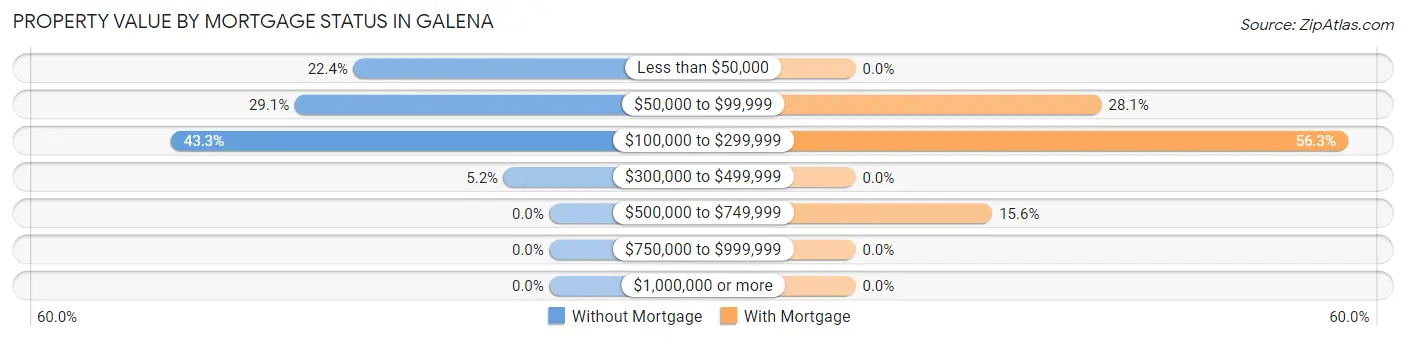
| Property Value | Without Mortgage | With Mortgage |
| Less than $50,000 | 30 (22.4%) | 0 (0.0%) |
| $50,000 to $99,999 | 39 (29.1%) | 9 (28.1%) |
| $100,000 to $299,999 | 58 (43.3%) | 18 (56.2%) |
| $300,000 to $499,999 | 7 (5.2%) | 0 (0.0%) |
| $500,000 to $749,999 | 0 (0.0%) | 5 (15.6%) |
| $750,000 to $999,999 | 0 (0.0%) | 0 (0.0%) |
| $1,000,000 or more | 0 (0.0%) | 0 (0.0%) |
| Total | 134 (100.0%) | 32 (100.0%) |
Household Income by Mortgage Status in Galena
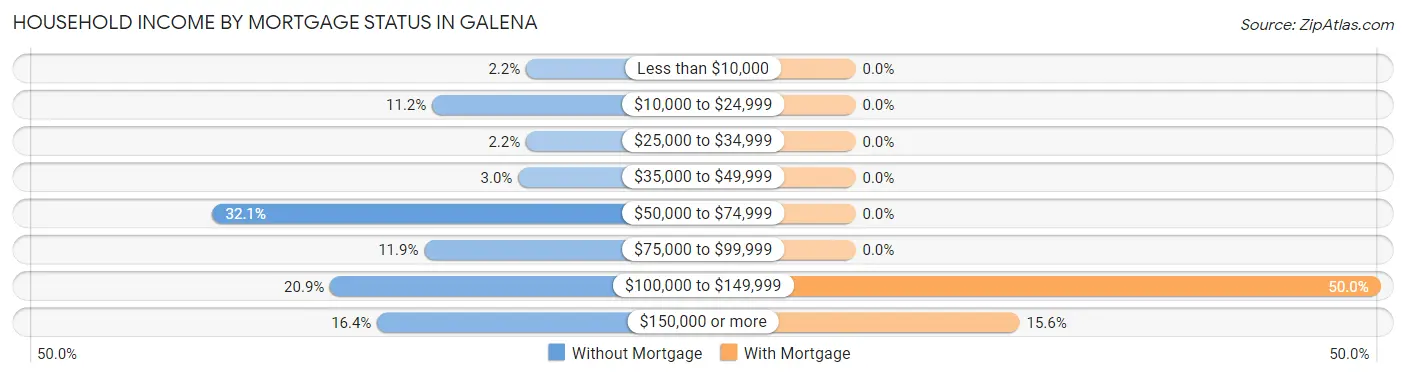
| Household Income | Without Mortgage | With Mortgage |
| Less than $10,000 | 3 (2.2%) | 0 (0.0%) |
| $10,000 to $24,999 | 15 (11.2%) | 0 (0.0%) |
| $25,000 to $34,999 | 3 (2.2%) | 0 (0.0%) |
| $35,000 to $49,999 | 4 (3.0%) | 0 (0.0%) |
| $50,000 to $74,999 | 43 (32.1%) | 0 (0.0%) |
| $75,000 to $99,999 | 16 (11.9%) | 0 (0.0%) |
| $100,000 to $149,999 | 28 (20.9%) | 16 (50.0%) |
| $150,000 or more | 22 (16.4%) | 5 (15.6%) |
| Total | 134 (100.0%) | 32 (100.0%) |
Property Value to Household Income Ratio in Galena
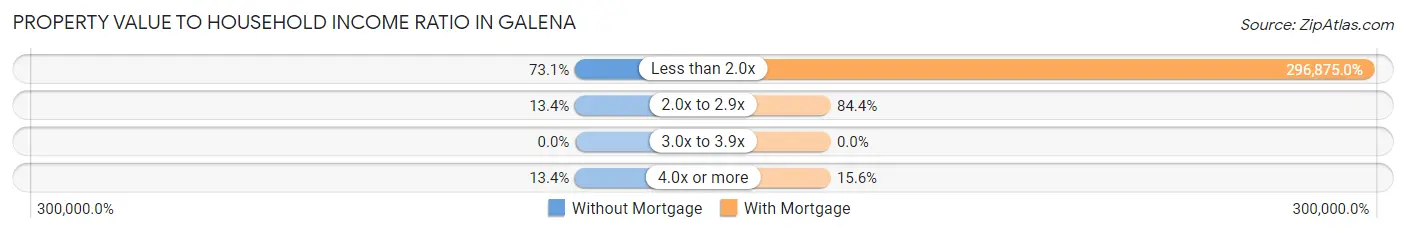
| Value-to-Income Ratio | Without Mortgage | With Mortgage |
| Less than 2.0x | 98 (73.1%) | 95,000 (296,875.0%) |
| 2.0x to 2.9x | 18 (13.4%) | 27 (84.4%) |
| 3.0x to 3.9x | 0 (0.0%) | 0 (0.0%) |
| 4.0x or more | 18 (13.4%) | 5 (15.6%) |
| Total | 134 (100.0%) | 32 (100.0%) |
Real Estate Taxes by Mortgage Status in Galena
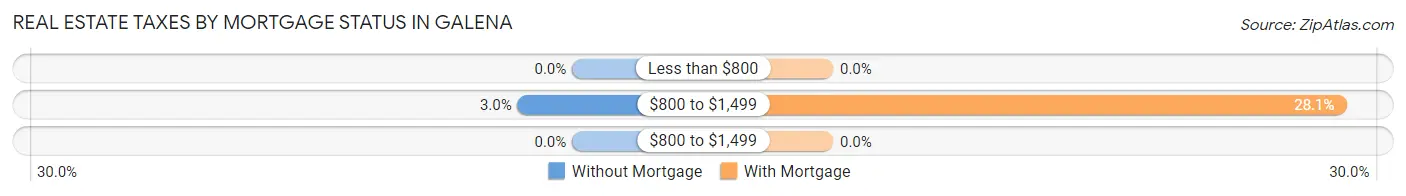
| Property Taxes | Without Mortgage | With Mortgage |
| Less than $800 | 0 (0.0%) | 0 (0.0%) |
| $800 to $1,499 | 4 (3.0%) | 9 (28.1%) |
| $800 to $1,499 | 0 (0.0%) | 0 (0.0%) |
| Total | 134 (100.0%) | 32 (100.0%) |
Health & Disability in Galena
Health Insurance Coverage by Age in Galena
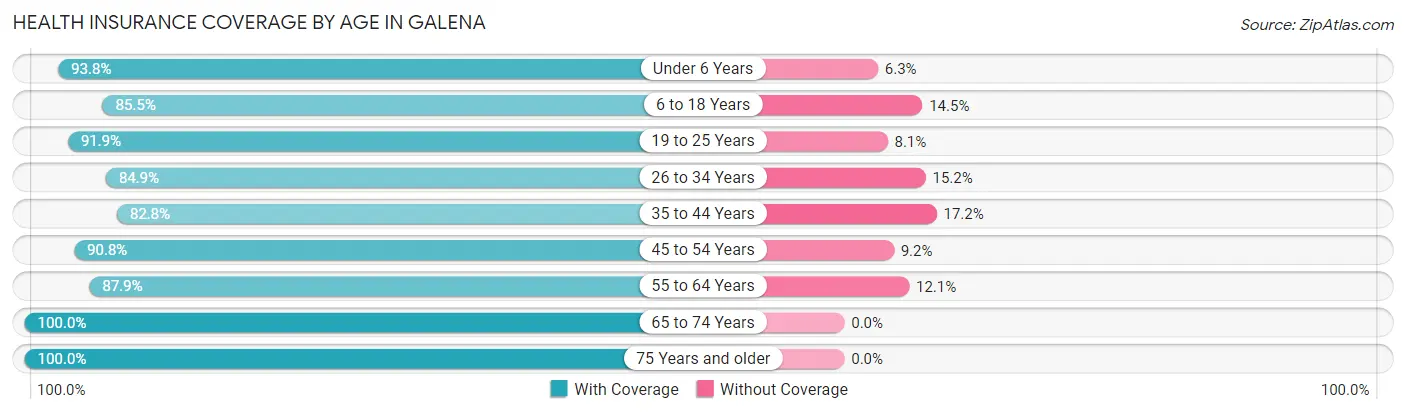
| Age Bracket | With Coverage | Without Coverage |
| Under 6 Years | 60 (93.8%) | 4 (6.2%) |
| 6 to 18 Years | 100 (85.5%) | 17 (14.5%) |
| 19 to 25 Years | 57 (91.9%) | 5 (8.1%) |
| 26 to 34 Years | 84 (84.9%) | 15 (15.1%) |
| 35 to 44 Years | 77 (82.8%) | 16 (17.2%) |
| 45 to 54 Years | 69 (90.8%) | 7 (9.2%) |
| 55 to 64 Years | 51 (87.9%) | 7 (12.1%) |
| 65 to 74 Years | 32 (100.0%) | 0 (0.0%) |
| 75 Years and older | 26 (100.0%) | 0 (0.0%) |
| Total | 556 (88.7%) | 71 (11.3%) |
Health Insurance Coverage by Citizenship Status in Galena
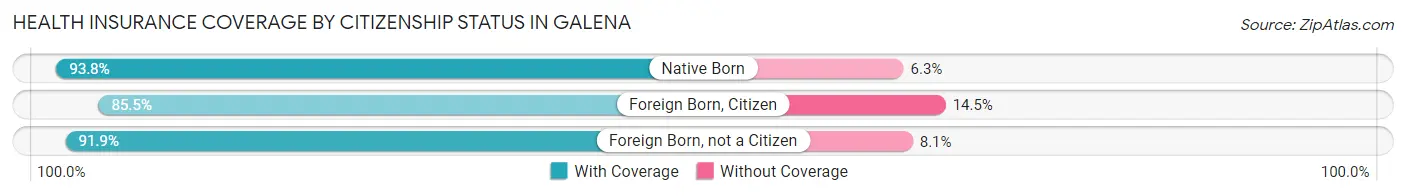
| Citizenship Status | With Coverage | Without Coverage |
| Native Born | 60 (93.8%) | 4 (6.2%) |
| Foreign Born, Citizen | 100 (85.5%) | 17 (14.5%) |
| Foreign Born, not a Citizen | 57 (91.9%) | 5 (8.1%) |
Health Insurance Coverage by Household Income in Galena
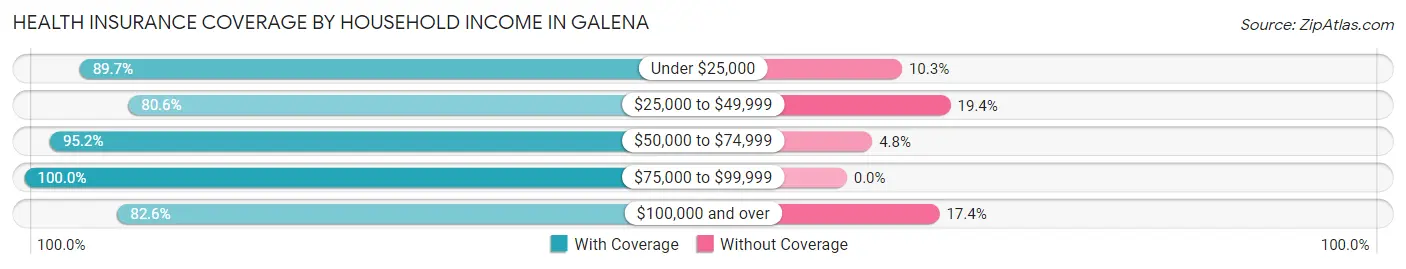
| Household Income | With Coverage | Without Coverage |
| Under $25,000 | 26 (89.7%) | 3 (10.3%) |
| $25,000 to $49,999 | 58 (80.6%) | 14 (19.4%) |
| $50,000 to $74,999 | 180 (95.2%) | 9 (4.8%) |
| $75,000 to $99,999 | 69 (100.0%) | 0 (0.0%) |
| $100,000 and over | 214 (82.6%) | 45 (17.4%) |
Public vs Private Health Insurance Coverage by Age in Galena
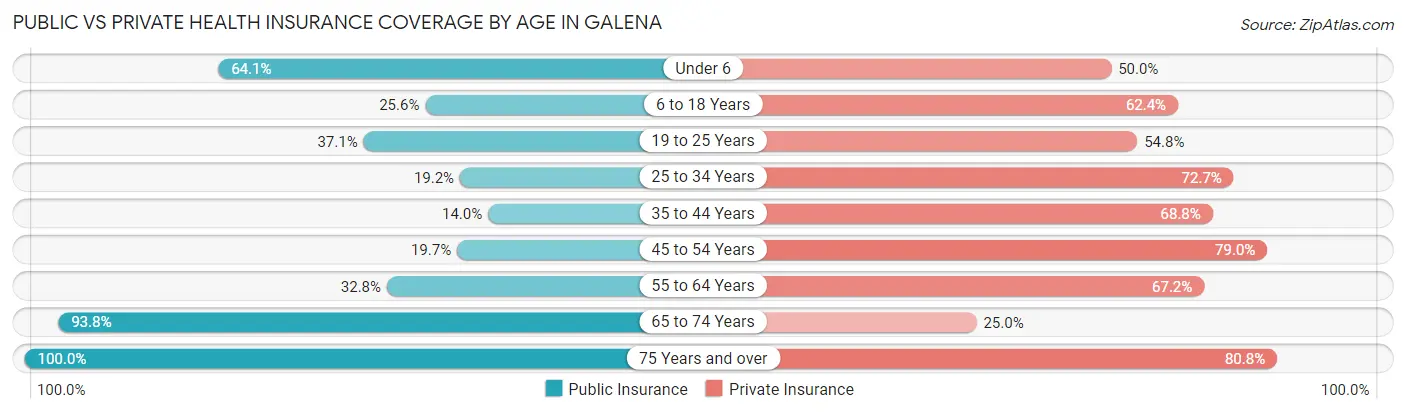
| Age Bracket | Public Insurance | Private Insurance |
| Under 6 | 41 (64.1%) | 32 (50.0%) |
| 6 to 18 Years | 30 (25.6%) | 73 (62.4%) |
| 19 to 25 Years | 23 (37.1%) | 34 (54.8%) |
| 25 to 34 Years | 19 (19.2%) | 72 (72.7%) |
| 35 to 44 Years | 13 (14.0%) | 64 (68.8%) |
| 45 to 54 Years | 15 (19.7%) | 60 (78.9%) |
| 55 to 64 Years | 19 (32.8%) | 39 (67.2%) |
| 65 to 74 Years | 30 (93.8%) | 8 (25.0%) |
| 75 Years and over | 26 (100.0%) | 21 (80.8%) |
| Total | 216 (34.4%) | 403 (64.3%) |
Disability Status by Sex by Age in Galena
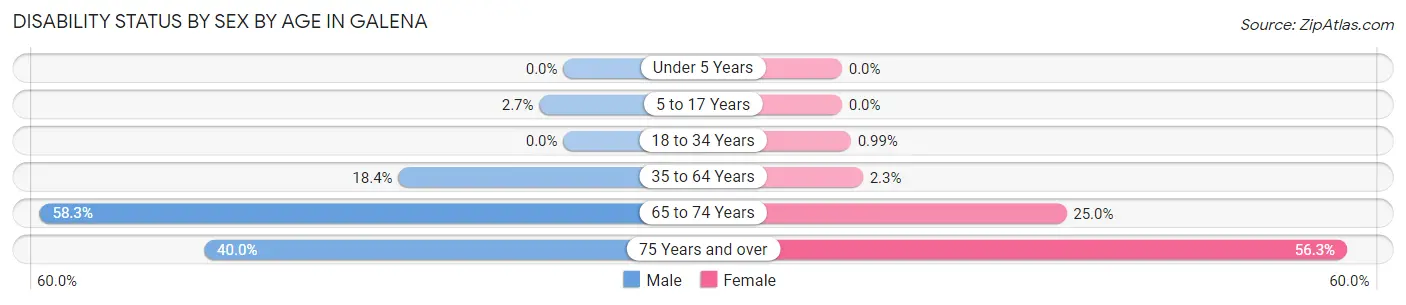
| Age Bracket | Male | Female |
| Under 5 Years | 0 (0.0%) | 0 (0.0%) |
| 5 to 17 Years | 2 (2.7%) | 0 (0.0%) |
| 18 to 34 Years | 0 (0.0%) | 1 (1.0%) |
| 35 to 64 Years | 18 (18.4%) | 3 (2.3%) |
| 65 to 74 Years | 7 (58.3%) | 5 (25.0%) |
| 75 Years and over | 4 (40.0%) | 9 (56.2%) |
Disability Class by Sex by Age in Galena
Disability Class: Hearing Difficulty
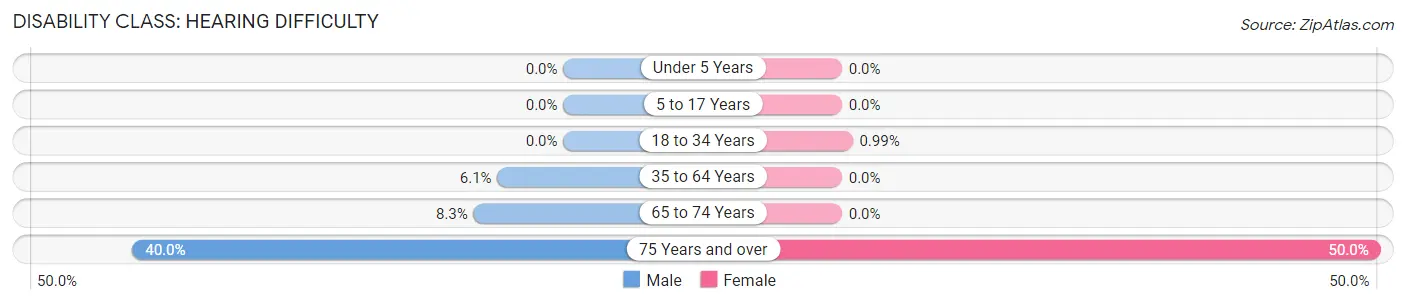
| Age Bracket | Male | Female |
| Under 5 Years | 0 (0.0%) | 0 (0.0%) |
| 5 to 17 Years | 0 (0.0%) | 0 (0.0%) |
| 18 to 34 Years | 0 (0.0%) | 1 (1.0%) |
| 35 to 64 Years | 6 (6.1%) | 0 (0.0%) |
| 65 to 74 Years | 1 (8.3%) | 0 (0.0%) |
| 75 Years and over | 4 (40.0%) | 8 (50.0%) |
Disability Class: Vision Difficulty
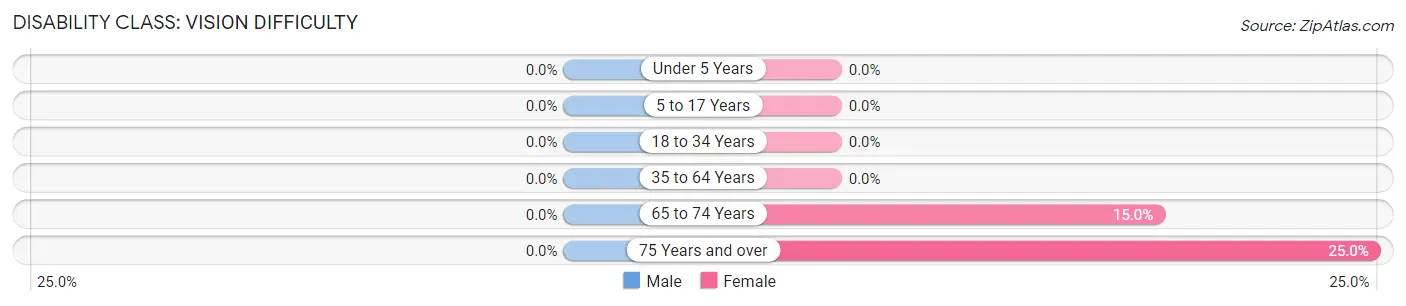
| Age Bracket | Male | Female |
| Under 5 Years | 0 (0.0%) | 0 (0.0%) |
| 5 to 17 Years | 0 (0.0%) | 0 (0.0%) |
| 18 to 34 Years | 0 (0.0%) | 0 (0.0%) |
| 35 to 64 Years | 0 (0.0%) | 0 (0.0%) |
| 65 to 74 Years | 0 (0.0%) | 3 (15.0%) |
| 75 Years and over | 0 (0.0%) | 4 (25.0%) |
Disability Class: Cognitive Difficulty
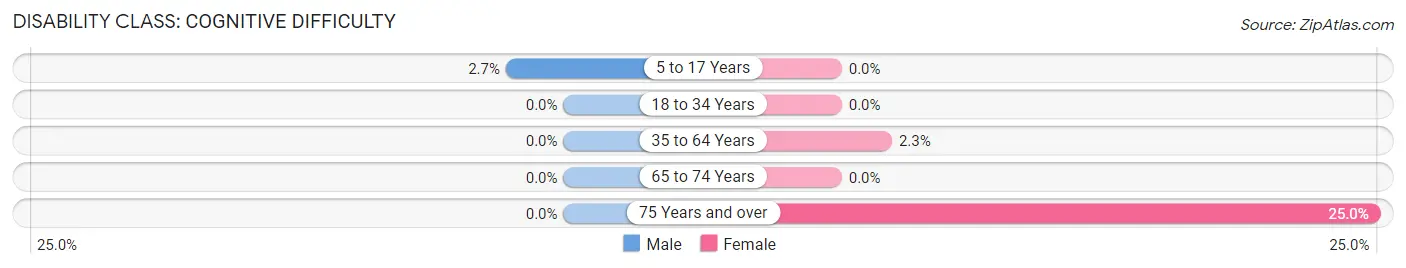
| Age Bracket | Male | Female |
| 5 to 17 Years | 2 (2.7%) | 0 (0.0%) |
| 18 to 34 Years | 0 (0.0%) | 0 (0.0%) |
| 35 to 64 Years | 0 (0.0%) | 3 (2.3%) |
| 65 to 74 Years | 0 (0.0%) | 0 (0.0%) |
| 75 Years and over | 0 (0.0%) | 4 (25.0%) |
Disability Class: Ambulatory Difficulty
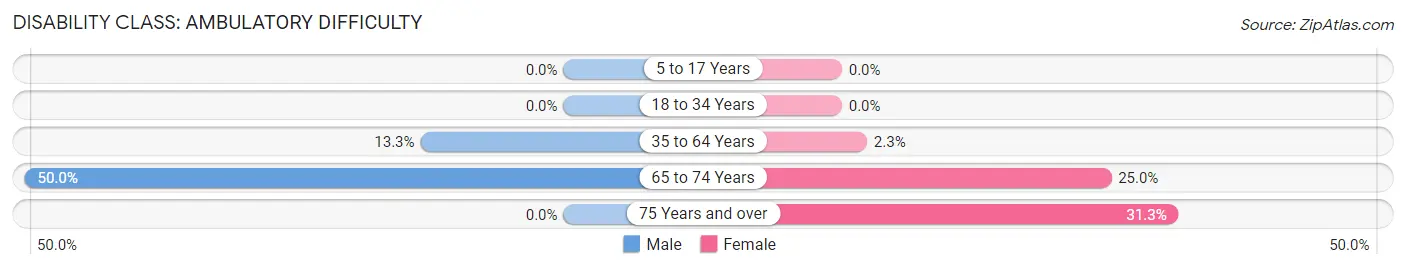
| Age Bracket | Male | Female |
| 5 to 17 Years | 0 (0.0%) | 0 (0.0%) |
| 18 to 34 Years | 0 (0.0%) | 0 (0.0%) |
| 35 to 64 Years | 13 (13.3%) | 3 (2.3%) |
| 65 to 74 Years | 6 (50.0%) | 5 (25.0%) |
| 75 Years and over | 0 (0.0%) | 5 (31.2%) |
Disability Class: Self-Care Difficulty
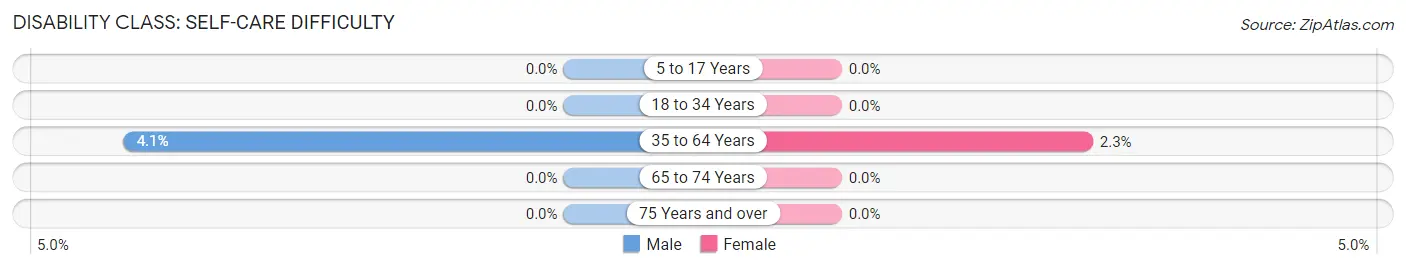
| Age Bracket | Male | Female |
| 5 to 17 Years | 0 (0.0%) | 0 (0.0%) |
| 18 to 34 Years | 0 (0.0%) | 0 (0.0%) |
| 35 to 64 Years | 4 (4.1%) | 3 (2.3%) |
| 65 to 74 Years | 0 (0.0%) | 0 (0.0%) |
| 75 Years and over | 0 (0.0%) | 0 (0.0%) |
Technology Access in Galena
Computing Device Access in Galena
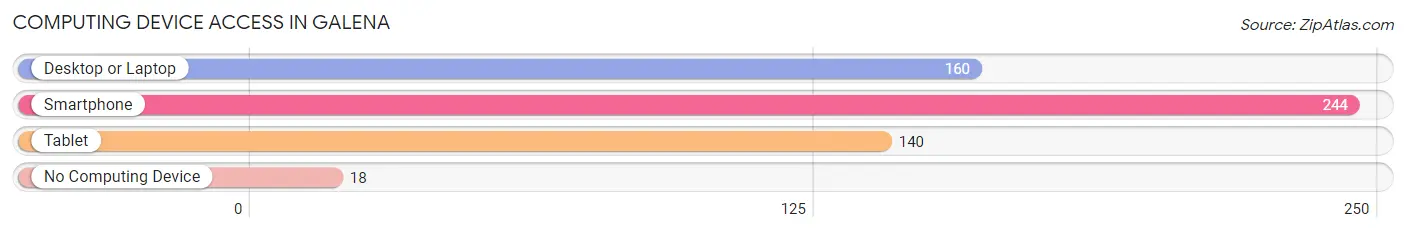
| Device Type | # Households | % Households |
| Desktop or Laptop | 160 | 60.2% |
| Smartphone | 244 | 91.7% |
| Tablet | 140 | 52.6% |
| No Computing Device | 18 | 6.8% |
| Total | 266 | 100.0% |
Internet Access in Galena
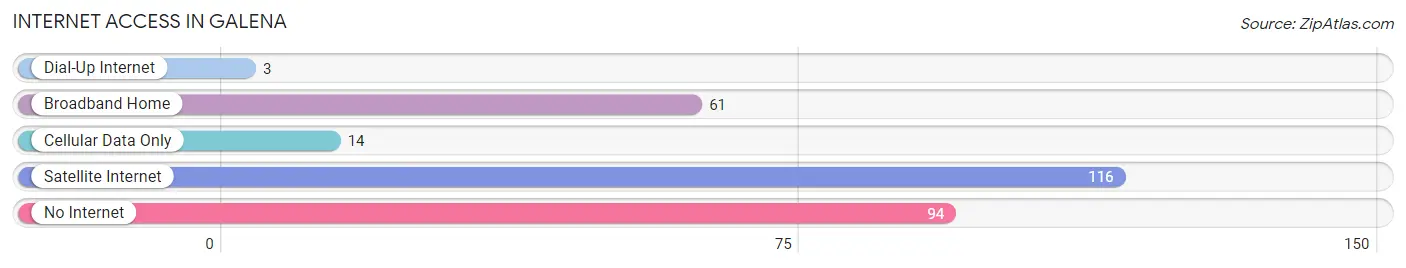
| Internet Type | # Households | % Households |
| Dial-Up Internet | 3 | 1.1% |
| Broadband Home | 61 | 22.9% |
| Cellular Data Only | 14 | 5.3% |
| Satellite Internet | 116 | 43.6% |
| No Internet | 94 | 35.3% |
| Total | 266 | 100.0% |
Galena Summary
Galena, Alaska is a city located in the Yukon-Koyukuk Census Area of the U.S. state of Alaska. It is situated on the west bank of the Yukon River, approximately 130 miles northwest of Fairbanks. The city is the second largest in the region, with a population of 662 as of the 2010 census.
History
The area around Galena has been inhabited by the Koyukon Athabascan people for thousands of years. The first European to visit the area was the Russian explorer Vitus Bering in 1741. The first permanent settlement in the area was established in 1846 by the Hudson's Bay Company. The settlement was named Galena after the lead ore found in the area.
In the early 1900s, the area was a major center for gold mining. The population of Galena grew rapidly during this time, reaching a peak of 1,500 in the 1920s. The gold rush ended in the 1930s, and the population declined to just over 500 by the 1950s.
Geography
Galena is located in the Yukon-Koyukuk Census Area of Alaska, approximately 130 miles northwest of Fairbanks. It is situated on the west bank of the Yukon River, at an elevation of approximately 200 feet. The city covers an area of 4.3 square miles, and has a total land area of 4.2 square miles.
The climate in Galena is subarctic, with long, cold winters and short, mild summers. The average temperature in January is -17°F, and the average temperature in July is 57°F. The average annual precipitation is 11.5 inches.
Economy
The economy of Galena is largely based on subsistence activities, such as fishing, hunting, and trapping. The city also has a small tourism industry, with visitors coming to experience the area's natural beauty and outdoor activities.
The city is home to a number of businesses, including a grocery store, a hardware store, a restaurant, and a hotel. The city also has a small airport, which serves as a hub for air travel in the region.
Demographics
As of the 2010 census, the population of Galena was 662, with a population density of 153.3 people per square mile. The median age of the population was 33.7 years, and the median household income was $41,250.
The racial makeup of the city was 85.3% Native American, 8.2% White, 0.5% Asian, 0.3% Black or African American, and 0.2% from other races. The largest ethnic group was the Koyukon Athabascan, which made up 85.3% of the population.
The city is served by the Galena City School District, which includes one elementary school, one middle school, and one high school. The city also has a public library, a post office, and a health clinic.
Common Questions
What is Per Capita Income in Galena?
Per Capita income in Galena is $42,687.
What is the Median Family Income in Galena?
Median Family Income in Galena is $86,806.
What is the Median Household income in Galena?
Median Household Income in Galena is $77,813.
What is Income or Wage Gap in Galena?
Income or Wage Gap in Galena is 30.7%.
Women in Galena earn 69.3 cents for every dollar earned by a man.
What is Inequality or Gini Index in Galena?
Inequality or Gini Index in Galena is 0.37.
What is the Total Population of Galena?
Total Population of Galena is 627.
What is the Total Male Population of Galena?
Total Male Population of Galena is 280.
What is the Total Female Population of Galena?
Total Female Population of Galena is 347.
What is the Ratio of Males per 100 Females in Galena?
There are 80.69 Males per 100 Females in Galena.
What is the Ratio of Females per 100 Males in Galena?
There are 123.93 Females per 100 Males in Galena.
What is the Median Population Age in Galena?
Median Population Age in Galena is 32.1 Years.
What is the Average Family Size in Galena
Average Family Size in Galena is 2.7 People.
What is the Average Household Size in Galena
Average Household Size in Galena is 2.3 People.
How Large is the Labor Force in Galena?
There are 361 People in the Labor Forcein in Galena.
What is the Percentage of People in the Labor Force in Galena?
76.2% of People are in the Labor Force in Galena.
What is the Unemployment Rate in Galena?
Unemployment Rate in Galena is 6.9%.