Fort Yukon, AK Map & Demographics
Fort Yukon Map
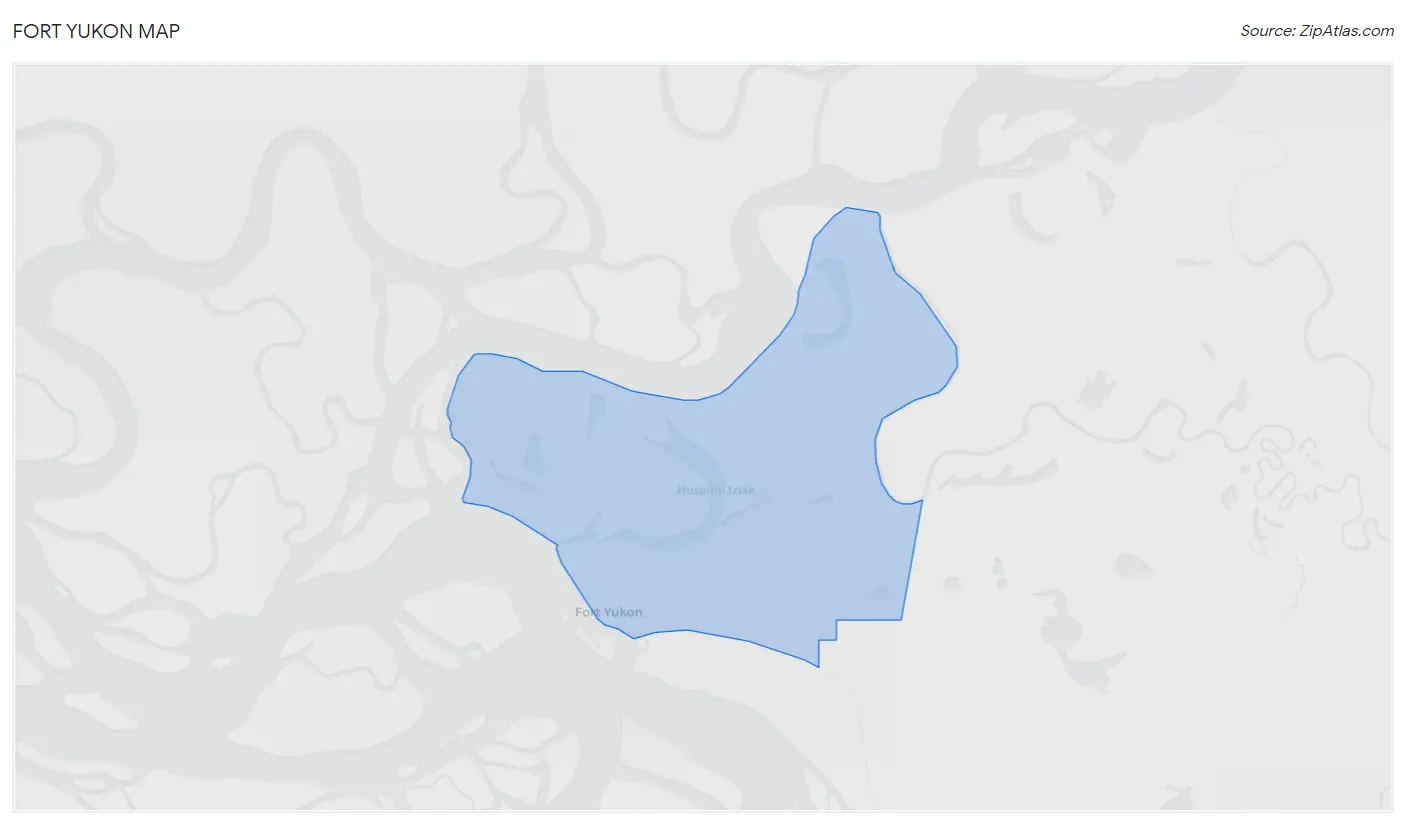
Fort Yukon Overview
$31,460
PER CAPITA INCOME
$81,875
AVG FAMILY INCOME
$46,250
AVG HOUSEHOLD INCOME
24.7%
WAGE / INCOME GAP [ % ]
75.3¢/ $1
WAGE / INCOME GAP [ $ ]
0.45
INEQUALITY / GINI INDEX
476
TOTAL POPULATION
221
MALE POPULATION
255
FEMALE POPULATION
86.67
MALES / 100 FEMALES
115.38
FEMALES / 100 MALES
43.7
MEDIAN AGE
2.6
AVG FAMILY SIZE
1.8
AVG HOUSEHOLD SIZE
219
LABOR FORCE [ PEOPLE ]
60.0%
PERCENT IN LABOR FORCE
24.5%
UNEMPLOYMENT RATE
Fort Yukon Zip Codes
Fort Yukon Area Codes
Income in Fort Yukon
Income Overview in Fort Yukon
Per Capita Income in Fort Yukon is $31,460, while median incomes of families and households are $81,875 and $46,250 respectively.
| Characteristic | Number | Measure |
| Per Capita Income | 476 | $31,460 |
| Median Family Income | 114 | $81,875 |
| Mean Family Income | 114 | $81,749 |
| Median Household Income | 250 | $46,250 |
| Mean Household Income | 250 | $60,506 |
| Income Deficit | 114 | $0 |
| Wage / Income Gap (%) | 476 | 24.70% |
| Wage / Income Gap ($) | 476 | 75.30¢ per $1 |
| Gini / Inequality Index | 476 | 0.45 |
Earnings by Sex in Fort Yukon
Average Earnings in Fort Yukon are $33,000, $26,827 for men and $35,625 for women, a difference of 24.7%.
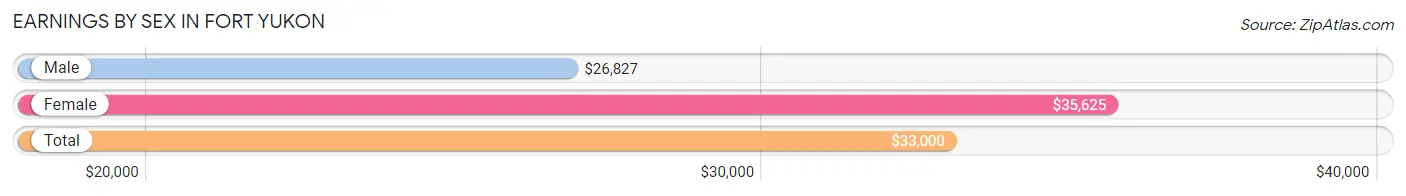
| Sex | Number | Average Earnings |
| Male | 109 (47.4%) | $26,827 |
| Female | 121 (52.6%) | $35,625 |
| Total | 230 (100.0%) | $33,000 |
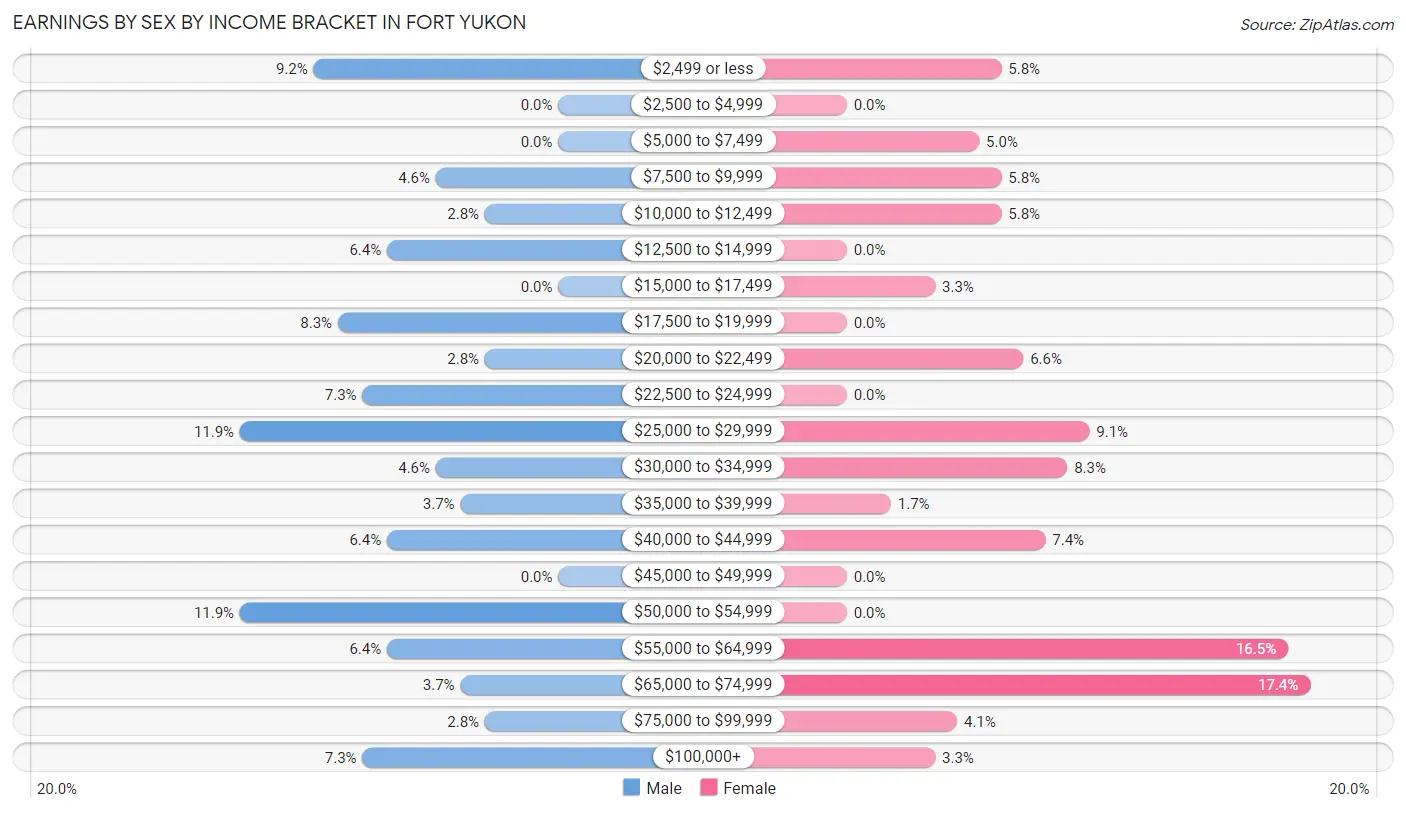
Earnings by Sex by Income Bracket in Fort Yukon
The most common earnings brackets in Fort Yukon are $25,000 to $29,999 for men (13 | 11.9%) and $65,000 to $74,999 for women (21 | 17.4%).
| Income | Male | Female |
| $2,499 or less | 10 (9.2%) | 7 (5.8%) |
| $2,500 to $4,999 | 0 (0.0%) | 0 (0.0%) |
| $5,000 to $7,499 | 0 (0.0%) | 6 (5.0%) |
| $7,500 to $9,999 | 5 (4.6%) | 7 (5.8%) |
| $10,000 to $12,499 | 3 (2.8%) | 7 (5.8%) |
| $12,500 to $14,999 | 7 (6.4%) | 0 (0.0%) |
| $15,000 to $17,499 | 0 (0.0%) | 4 (3.3%) |
| $17,500 to $19,999 | 9 (8.3%) | 0 (0.0%) |
| $20,000 to $22,499 | 3 (2.8%) | 8 (6.6%) |
| $22,500 to $24,999 | 8 (7.3%) | 0 (0.0%) |
| $25,000 to $29,999 | 13 (11.9%) | 11 (9.1%) |
| $30,000 to $34,999 | 5 (4.6%) | 10 (8.3%) |
| $35,000 to $39,999 | 4 (3.7%) | 2 (1.7%) |
| $40,000 to $44,999 | 7 (6.4%) | 9 (7.4%) |
| $45,000 to $49,999 | 0 (0.0%) | 0 (0.0%) |
| $50,000 to $54,999 | 13 (11.9%) | 0 (0.0%) |
| $55,000 to $64,999 | 7 (6.4%) | 20 (16.5%) |
| $65,000 to $74,999 | 4 (3.7%) | 21 (17.4%) |
| $75,000 to $99,999 | 3 (2.8%) | 5 (4.1%) |
| $100,000+ | 8 (7.3%) | 4 (3.3%) |
| Total | 109 (100.0%) | 121 (100.0%) |
Earnings by Sex by Educational Attainment in Fort Yukon
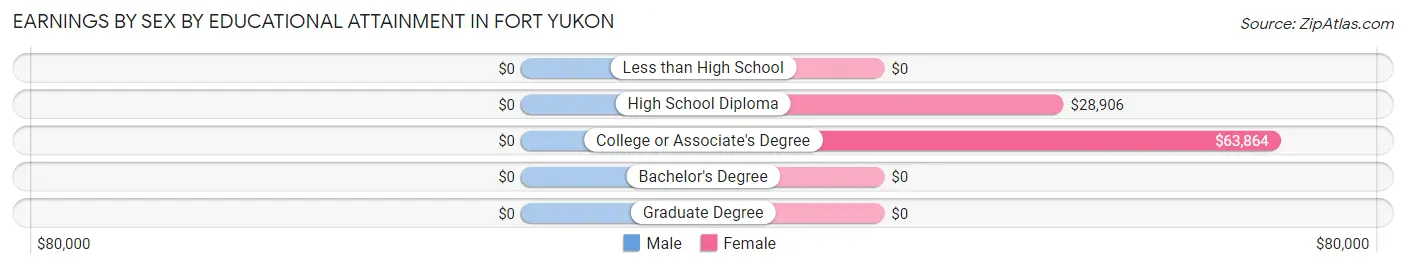
| Educational Attainment | Male Income | Female Income |
| Less than High School | - | - |
| High School Diploma | - | - |
| College or Associate's Degree | - | - |
| Bachelor's Degree | - | - |
| Graduate Degree | - | - |
| Total | $27,292 | $44,063 |
Family Income in Fort Yukon
Family Income Brackets in Fort Yukon
According to the Fort Yukon family income data, there are 34 families falling into the $100,000 to $149,999 income range, which is the most common income bracket and makes up 29.8% of all families.
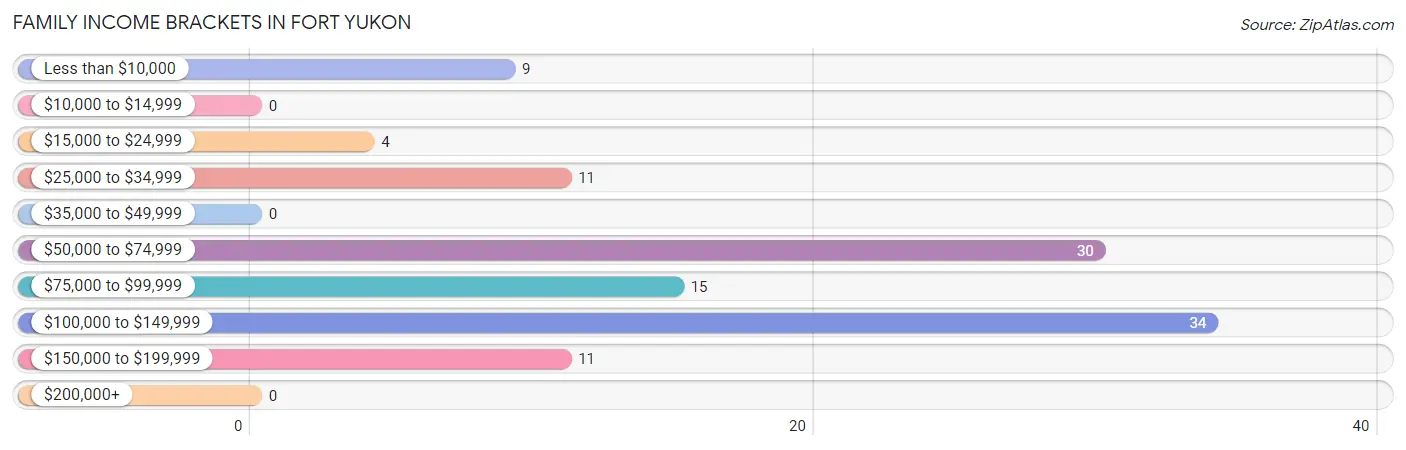
| Income Bracket | # Families | % Families |
| Less than $10,000 | 9 | 7.9% |
| $10,000 to $14,999 | 0 | 0.0% |
| $15,000 to $24,999 | 4 | 3.5% |
| $25,000 to $34,999 | 11 | 9.6% |
| $35,000 to $49,999 | 0 | 0.0% |
| $50,000 to $74,999 | 30 | 26.3% |
| $75,000 to $99,999 | 15 | 13.2% |
| $100,000 to $149,999 | 34 | 29.8% |
| $150,000 to $199,999 | 11 | 9.6% |
| $200,000+ | 0 | 0.0% |
Family Income by Famaliy Size in Fort Yukon
4-person families (10 | 8.8%) account for the highest median family income in Fort Yukon with $138,750 per family, while 2-person families (62 | 54.4%) have the highest median income of $36,666 per family member.
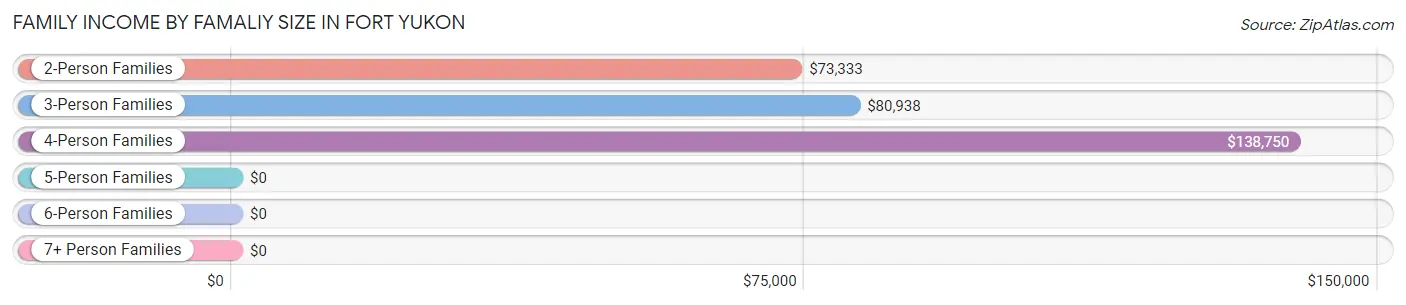
| Income Bracket | # Families | Median Income |
| 2-Person Families | 62 (54.4%) | $73,333 |
| 3-Person Families | 23 (20.2%) | $80,938 |
| 4-Person Families | 10 (8.8%) | $138,750 |
| 5-Person Families | 16 (14.0%) | $0 |
| 6-Person Families | 3 (2.6%) | $0 |
| 7+ Person Families | 0 (0.0%) | $0 |
| Total | 114 (100.0%) | $81,875 |
Family Income by Number of Earners in Fort Yukon
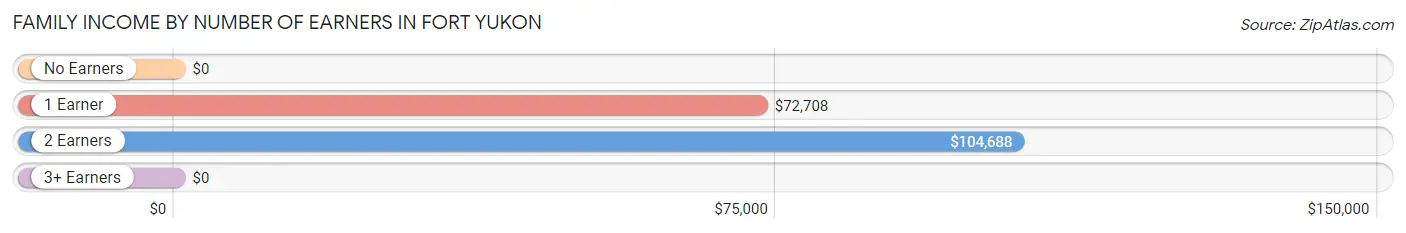
| Number of Earners | # Families | Median Income |
| No Earners | 15 (13.2%) | $0 |
| 1 Earner | 45 (39.5%) | $72,708 |
| 2 Earners | 51 (44.7%) | $104,688 |
| 3+ Earners | 3 (2.6%) | $0 |
| Total | 114 (100.0%) | $81,875 |
Household Income in Fort Yukon
Household Income Brackets in Fort Yukon
With 39 households falling in the category, the $100,000 to $149,999 income range is the most frequent in Fort Yukon, accounting for 15.6% of all households. In contrast, only 5 households (2.0%) fall into the $200,000+ income bracket, making it the least populous group.
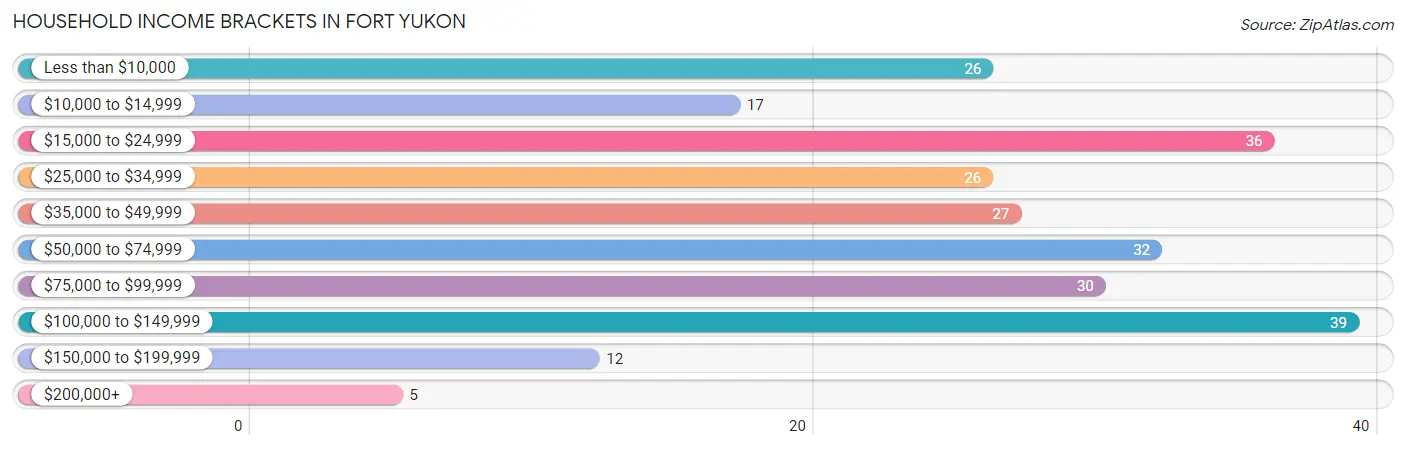
| Income Bracket | # Households | % Households |
| Less than $10,000 | 26 | 10.4% |
| $10,000 to $14,999 | 17 | 6.8% |
| $15,000 to $24,999 | 36 | 14.4% |
| $25,000 to $34,999 | 26 | 10.4% |
| $35,000 to $49,999 | 27 | 10.8% |
| $50,000 to $74,999 | 32 | 12.8% |
| $75,000 to $99,999 | 30 | 12.0% |
| $100,000 to $149,999 | 39 | 15.6% |
| $150,000 to $199,999 | 12 | 4.8% |
| $200,000+ | 5 | 2.0% |
Household Income by Householder Age in Fort Yukon
The median household income in Fort Yukon is $46,250, with the highest median household income of $74,375 found in the 25 to 44 years age bracket for the primary householder. A total of 57 households (22.8%) fall into this category.
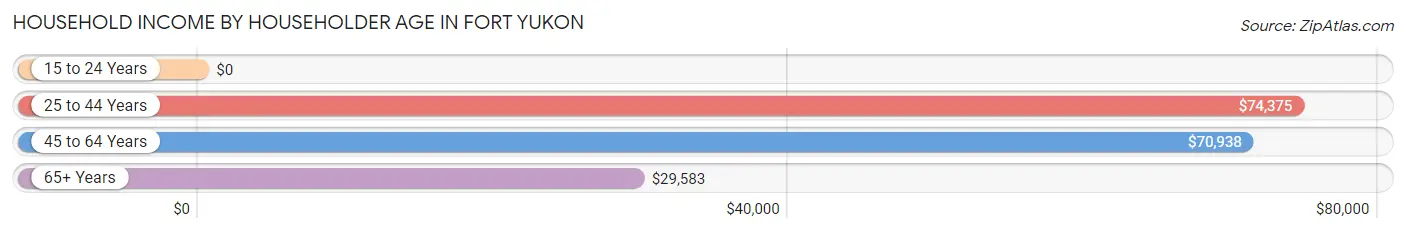
| Income Bracket | # Households | Median Income |
| 15 to 24 Years | 0 (0.0%) | $0 |
| 25 to 44 Years | 57 (22.8%) | $74,375 |
| 45 to 64 Years | 89 (35.6%) | $70,938 |
| 65+ Years | 104 (41.6%) | $29,583 |
| Total | 250 (100.0%) | $46,250 |
Poverty in Fort Yukon
Income Below Poverty by Sex and Age in Fort Yukon
With 13.8% poverty level for males and 14.5% for females among the residents of Fort Yukon, 55 to 64 year old males and 5 year old females are the most vulnerable to poverty, with 10 males (35.7%) and 3 females (100.0%) in their respective age groups living below the poverty level.
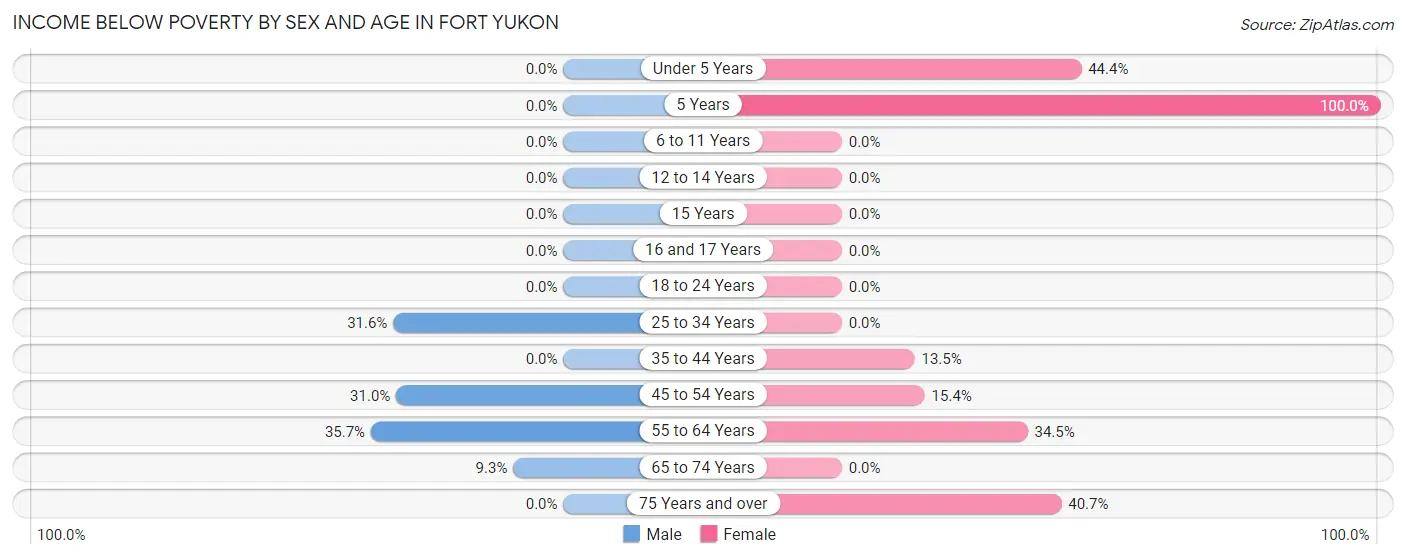
| Age Bracket | Male | Female |
| Under 5 Years | 0 (0.0%) | 4 (44.4%) |
| 5 Years | 0 (0.0%) | 3 (100.0%) |
| 6 to 11 Years | 0 (0.0%) | 0 (0.0%) |
| 12 to 14 Years | 0 (0.0%) | 0 (0.0%) |
| 15 Years | 0 (0.0%) | 0 (0.0%) |
| 16 and 17 Years | 0 (0.0%) | 0 (0.0%) |
| 18 to 24 Years | 0 (0.0%) | 0 (0.0%) |
| 25 to 34 Years | 6 (31.6%) | 0 (0.0%) |
| 35 to 44 Years | 0 (0.0%) | 5 (13.5%) |
| 45 to 54 Years | 9 (31.0%) | 4 (15.4%) |
| 55 to 64 Years | 10 (35.7%) | 10 (34.5%) |
| 65 to 74 Years | 4 (9.3%) | 0 (0.0%) |
| 75 Years and over | 0 (0.0%) | 11 (40.7%) |
| Total | 29 (13.8%) | 37 (14.5%) |
Income Above Poverty by Sex and Age in Fort Yukon
According to the poverty statistics in Fort Yukon, males aged under 5 years and females aged 6 to 11 years are the age groups that are most secure financially, with 100.0% of males and 100.0% of females in these age groups living above the poverty line.
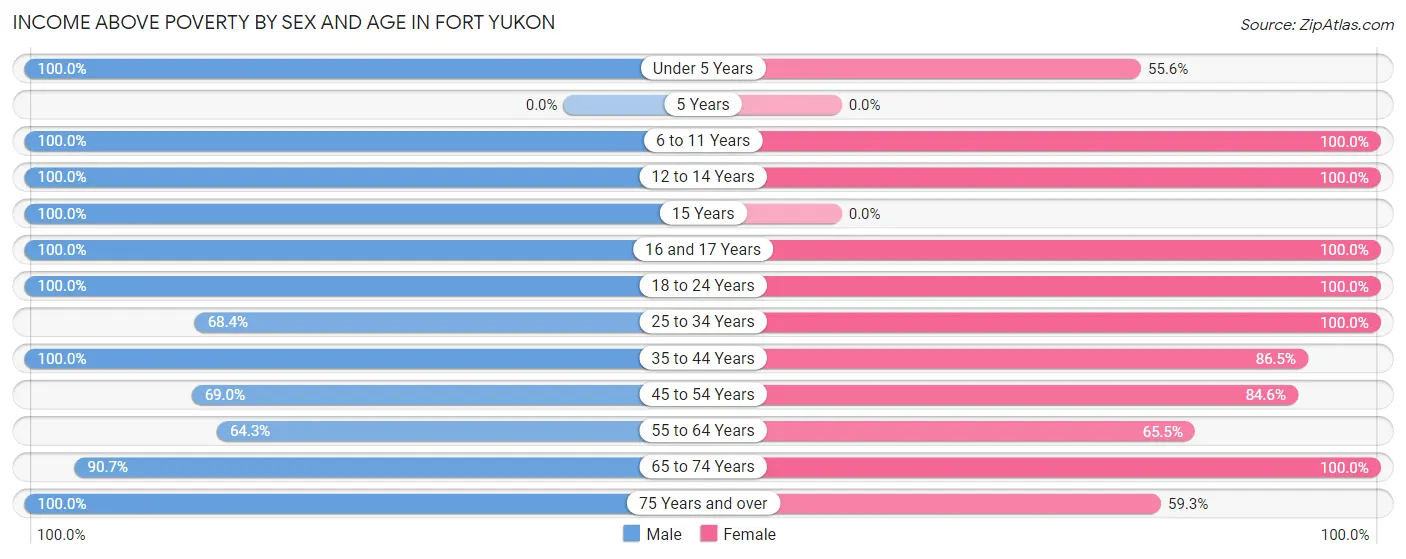
| Age Bracket | Male | Female |
| Under 5 Years | 17 (100.0%) | 5 (55.6%) |
| 5 Years | 0 (0.0%) | 0 (0.0%) |
| 6 to 11 Years | 2 (100.0%) | 36 (100.0%) |
| 12 to 14 Years | 17 (100.0%) | 24 (100.0%) |
| 15 Years | 3 (100.0%) | 0 (0.0%) |
| 16 and 17 Years | 8 (100.0%) | 7 (100.0%) |
| 18 to 24 Years | 2 (100.0%) | 14 (100.0%) |
| 25 to 34 Years | 13 (68.4%) | 13 (100.0%) |
| 35 to 44 Years | 27 (100.0%) | 32 (86.5%) |
| 45 to 54 Years | 20 (69.0%) | 22 (84.6%) |
| 55 to 64 Years | 18 (64.3%) | 19 (65.5%) |
| 65 to 74 Years | 39 (90.7%) | 30 (100.0%) |
| 75 Years and over | 15 (100.0%) | 16 (59.3%) |
| Total | 181 (86.2%) | 218 (85.5%) |
Income Below Poverty Among Married-Couple Families in Fort Yukon
The poverty statistics for married-couple families in Fort Yukon show that 17.1% or 6 of the total 35 families live below the poverty line. Families with no children have the highest poverty rate of 54.5%, comprising of 6 families. On the other hand, families with 1 or 2 children have the lowest poverty rate of 0.0%, which includes 0 families.
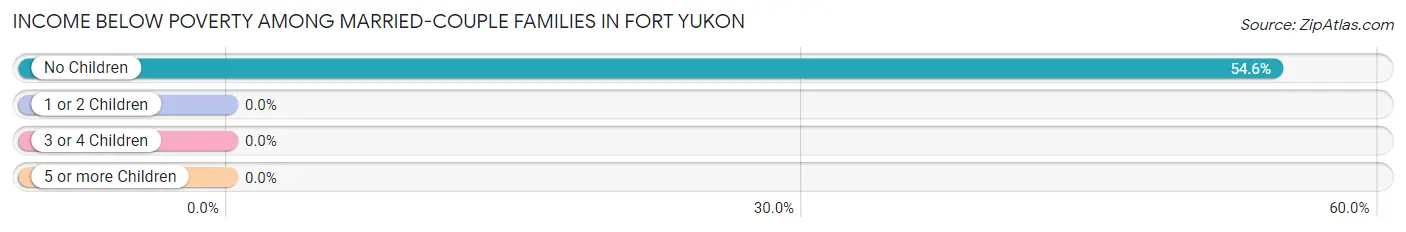
| Children | Above Poverty | Below Poverty |
| No Children | 5 (45.5%) | 6 (54.5%) |
| 1 or 2 Children | 8 (100.0%) | 0 (0.0%) |
| 3 or 4 Children | 16 (100.0%) | 0 (0.0%) |
| 5 or more Children | 0 (0.0%) | 0 (0.0%) |
| Total | 29 (82.9%) | 6 (17.1%) |
Income Below Poverty Among Single-Parent Households in Fort Yukon
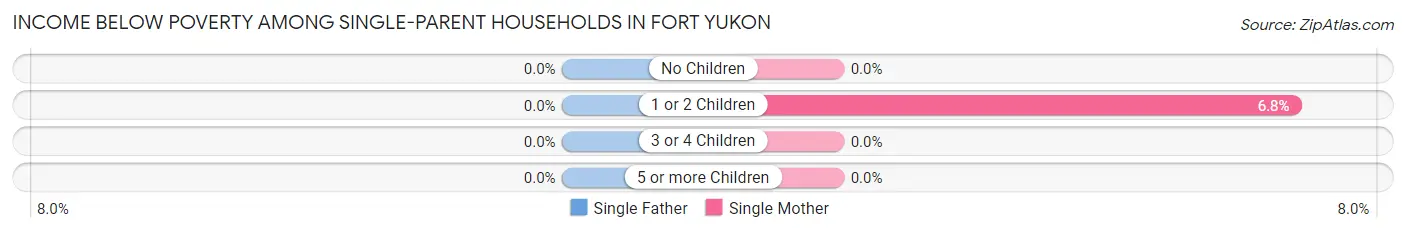
| Children | Single Father | Single Mother |
| No Children | 0 (0.0%) | 0 (0.0%) |
| 1 or 2 Children | 0 (0.0%) | 3 (6.8%) |
| 3 or 4 Children | 0 (0.0%) | 0 (0.0%) |
| 5 or more Children | 0 (0.0%) | 0 (0.0%) |
| Total | 0 (0.0%) | 3 (6.0%) |
Income Below Poverty Among Married-Couple vs Single-Parent Households in Fort Yukon
The poverty data for Fort Yukon shows that 6 of the married-couple family households (17.1%) and 3 of the single-parent households (3.8%) are living below the poverty level. Within the married-couple family households, those with no children have the highest poverty rate, with 6 households (54.5%) falling below the poverty line. Among the single-parent households, those with 1 or 2 children have the highest poverty rate, with 3 household (6.1%) living below poverty.
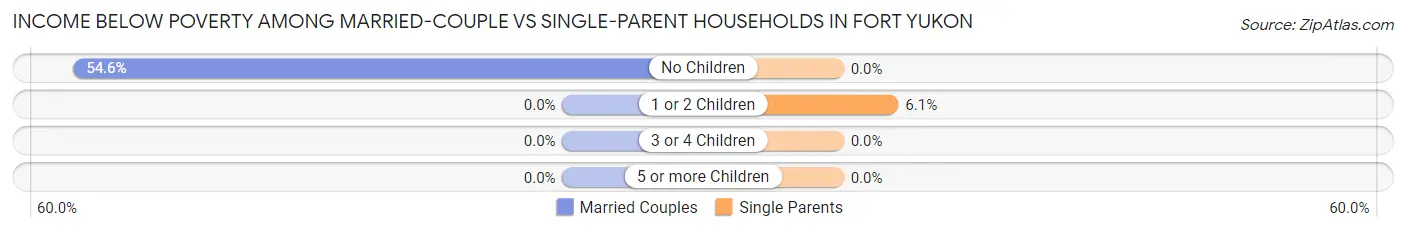
| Children | Married-Couple Families | Single-Parent Households |
| No Children | 6 (54.5%) | 0 (0.0%) |
| 1 or 2 Children | 0 (0.0%) | 3 (6.1%) |
| 3 or 4 Children | 0 (0.0%) | 0 (0.0%) |
| 5 or more Children | 0 (0.0%) | 0 (0.0%) |
| Total | 6 (17.1%) | 3 (3.8%) |
Race in Fort Yukon
The most populous races in Fort Yukon are Native / Alaskan (366 | 76.9%), Two or more Races (65 | 13.7%), and White / Caucasian (30 | 6.3%).
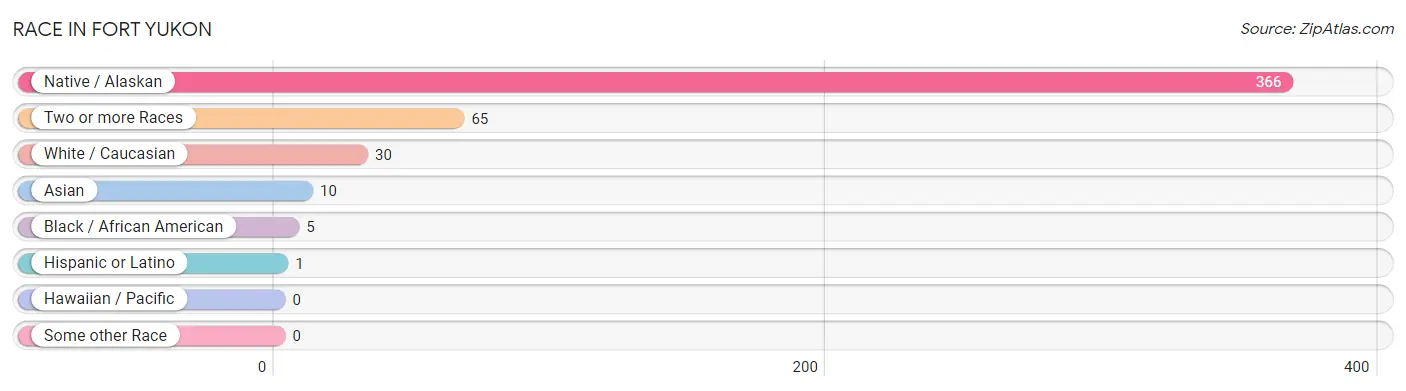
| Race | # Population | % Population |
| Asian | 10 | 2.1% |
| Black / African American | 5 | 1.1% |
| Hawaiian / Pacific | 0 | 0.0% |
| Hispanic or Latino | 1 | 0.2% |
| Native / Alaskan | 366 | 76.9% |
| White / Caucasian | 30 | 6.3% |
| Two or more Races | 65 | 13.7% |
| Some other Race | 0 | 0.0% |
| Total | 476 | 100.0% |
Ancestry in Fort Yukon
The most populous ancestries reported in Fort Yukon are Alaskan Athabascan (368 | 77.3%), Yup'ik (34 | 7.1%), German (23 | 4.8%), Irish (21 | 4.4%), and Danish (13 | 2.7%), together accounting for 96.4% of all Fort Yukon residents.
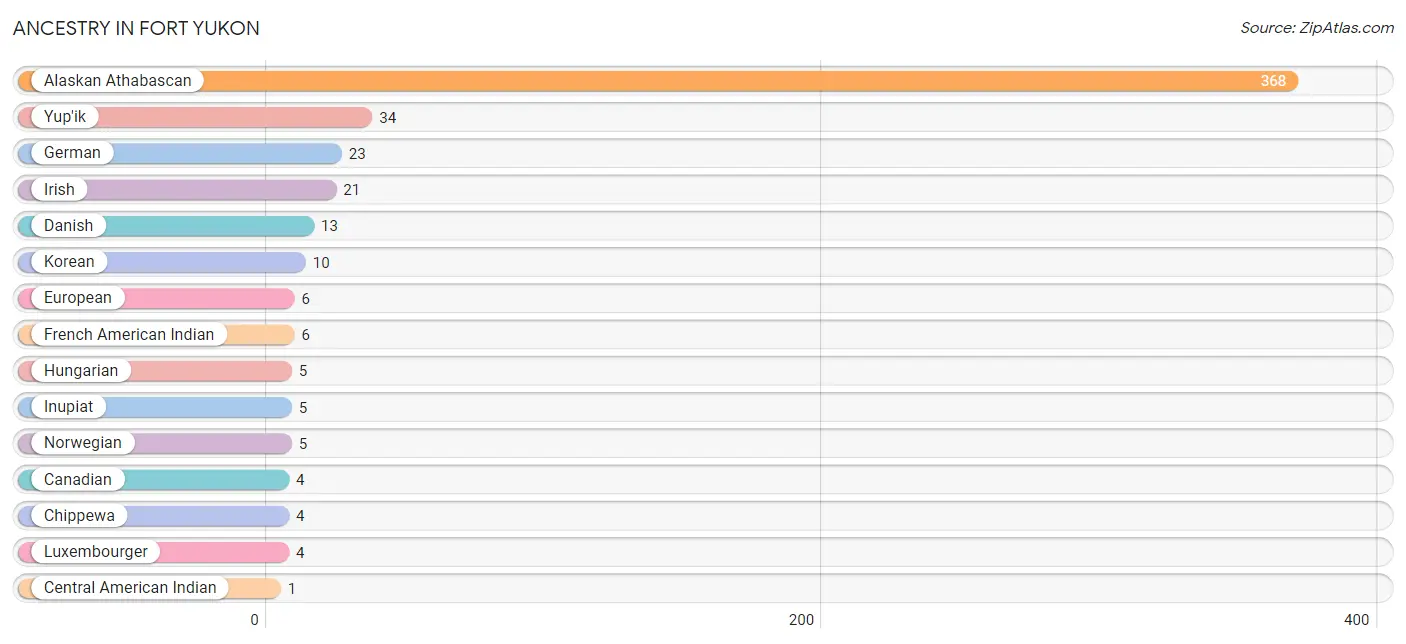
| Ancestry | # Population | % Population |
| Alaskan Athabascan | 368 | 77.3% |
| Canadian | 4 | 0.8% |
| Central American Indian | 1 | 0.2% |
| Chippewa | 4 | 0.8% |
| Danish | 13 | 2.7% |
| European | 6 | 1.3% |
| French American Indian | 6 | 1.3% |
| German | 23 | 4.8% |
| Hungarian | 5 | 1.1% |
| Inupiat | 5 | 1.1% |
| Irish | 21 | 4.4% |
| Korean | 10 | 2.1% |
| Luxembourger | 4 | 0.8% |
| Norwegian | 5 | 1.1% |
| Puerto Rican | 1 | 0.2% |
| Scottish | 1 | 0.2% |
| Yup'ik | 34 | 7.1% | View All 17 Rows |
Immigrants in Fort Yukon
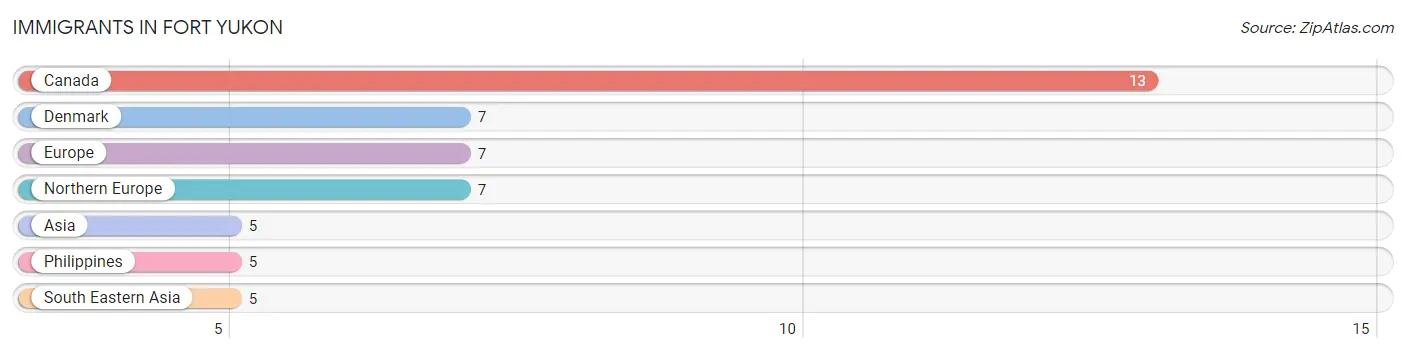
The most numerous immigrant groups reported in Fort Yukon came from Canada (13 | 2.7%), Denmark (7 | 1.5%), Europe (7 | 1.5%), Northern Europe (7 | 1.5%), and Asia (5 | 1.1%), together accounting for 8.2% of all Fort Yukon residents.
| Immigration Origin | # Population | % Population |
| Asia | 5 | 1.1% |
| Canada | 13 | 2.7% |
| Denmark | 7 | 1.5% |
| Europe | 7 | 1.5% |
| Northern Europe | 7 | 1.5% |
| Philippines | 5 | 1.1% |
| South Eastern Asia | 5 | 1.1% | View All 7 Rows |
Sex and Age in Fort Yukon
Sex and Age in Fort Yukon
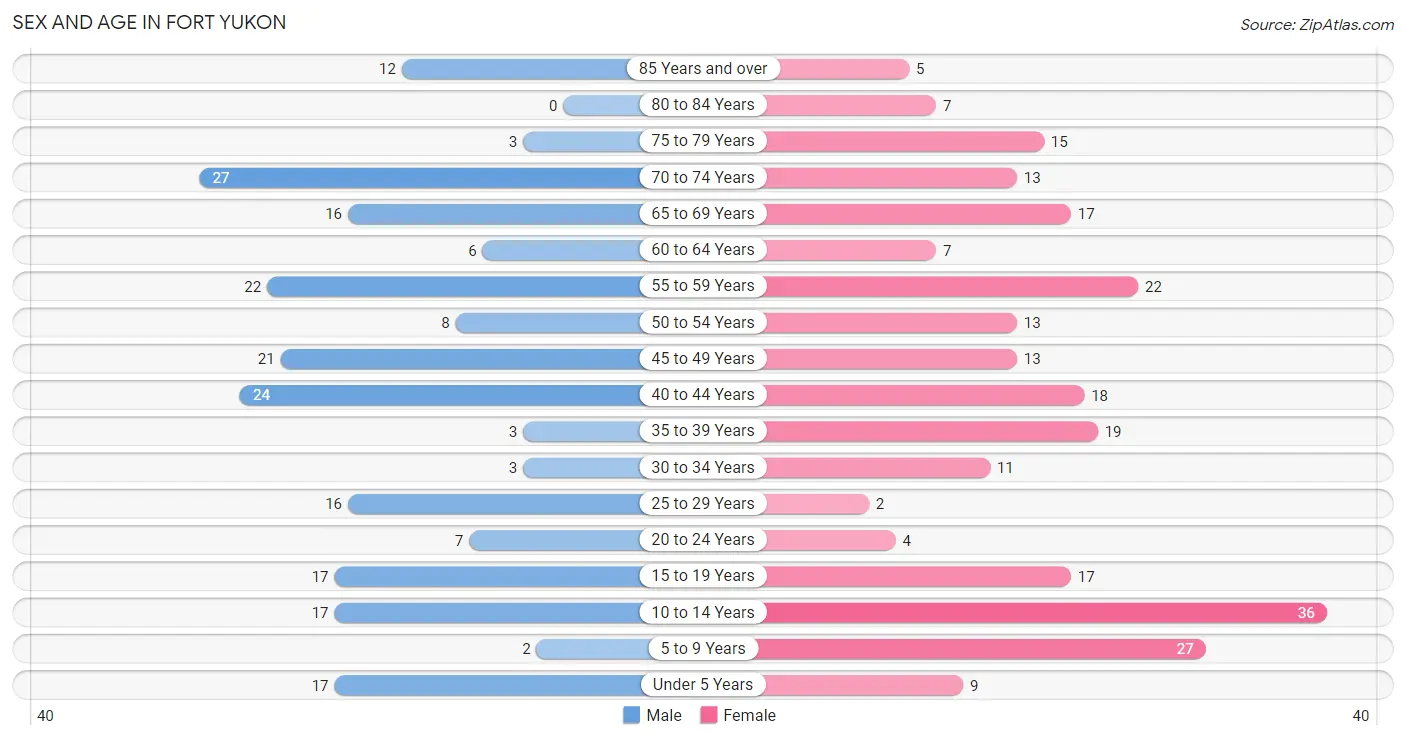
The most populous age groups in Fort Yukon are 70 to 74 Years (27 | 12.2%) for men and 10 to 14 Years (36 | 14.1%) for women.
| Age Bracket | Male | Female |
| Under 5 Years | 17 (7.7%) | 9 (3.5%) |
| 5 to 9 Years | 2 (0.9%) | 27 (10.6%) |
| 10 to 14 Years | 17 (7.7%) | 36 (14.1%) |
| 15 to 19 Years | 17 (7.7%) | 17 (6.7%) |
| 20 to 24 Years | 7 (3.2%) | 4 (1.6%) |
| 25 to 29 Years | 16 (7.2%) | 2 (0.8%) |
| 30 to 34 Years | 3 (1.4%) | 11 (4.3%) |
| 35 to 39 Years | 3 (1.4%) | 19 (7.4%) |
| 40 to 44 Years | 24 (10.9%) | 18 (7.1%) |
| 45 to 49 Years | 21 (9.5%) | 13 (5.1%) |
| 50 to 54 Years | 8 (3.6%) | 13 (5.1%) |
| 55 to 59 Years | 22 (10.0%) | 22 (8.6%) |
| 60 to 64 Years | 6 (2.7%) | 7 (2.8%) |
| 65 to 69 Years | 16 (7.2%) | 17 (6.7%) |
| 70 to 74 Years | 27 (12.2%) | 13 (5.1%) |
| 75 to 79 Years | 3 (1.4%) | 15 (5.9%) |
| 80 to 84 Years | 0 (0.0%) | 7 (2.8%) |
| 85 Years and over | 12 (5.4%) | 5 (2.0%) |
| Total | 221 (100.0%) | 255 (100.0%) |
Families and Households in Fort Yukon
Median Family Size in Fort Yukon
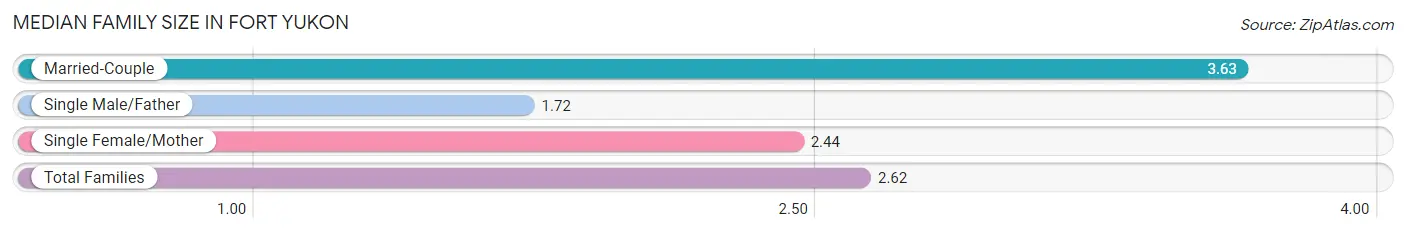
The median family size in Fort Yukon is 2.62 persons per family, with married-couple families (35 | 30.7%) accounting for the largest median family size of 3.63 persons per family. On the other hand, single male/father families (29 | 25.4%) represent the smallest median family size with 1.72 persons per family.
| Family Type | # Families | Family Size |
| Married-Couple | 35 (30.7%) | 3.63 |
| Single Male/Father | 29 (25.4%) | 1.72 |
| Single Female/Mother | 50 (43.9%) | 2.44 |
| Total Families | 114 (100.0%) | 2.62 |
Median Household Size in Fort Yukon
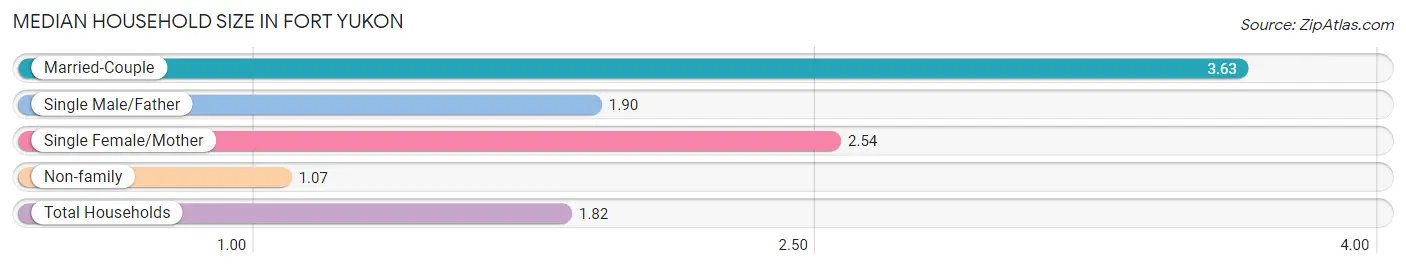
The median household size in Fort Yukon is 1.82 persons per household, with married-couple households (35 | 14.0%) accounting for the largest median household size of 3.63 persons per household. non-family households (136 | 54.4%) represent the smallest median household size with 1.07 persons per household.
| Household Type | # Households | Household Size |
| Married-Couple | 35 (14.0%) | 3.63 |
| Single Male/Father | 29 (11.6%) | 1.90 |
| Single Female/Mother | 50 (20.0%) | 2.54 |
| Non-family | 136 (54.4%) | 1.07 |
| Total Households | 250 (100.0%) | 1.82 |
Household Size by Marriage Status in Fort Yukon
Out of a total of 250 households in Fort Yukon, 114 (45.6%) are family households, while 136 (54.4%) are nonfamily households. The most numerous type of family households are 2-person households, comprising 57, and the most common type of nonfamily households are 1-person households, comprising 124.
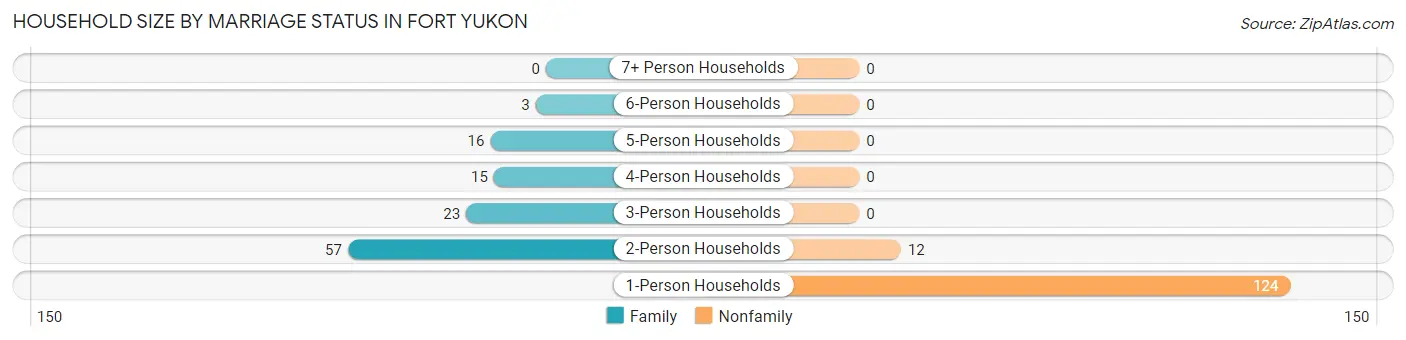
| Household Size | Family Households | Nonfamily Households |
| 1-Person Households | - | 124 (49.6%) |
| 2-Person Households | 57 (22.8%) | 12 (4.8%) |
| 3-Person Households | 23 (9.2%) | 0 (0.0%) |
| 4-Person Households | 15 (6.0%) | 0 (0.0%) |
| 5-Person Households | 16 (6.4%) | 0 (0.0%) |
| 6-Person Households | 3 (1.2%) | 0 (0.0%) |
| 7+ Person Households | 0 (0.0%) | 0 (0.0%) |
| Total | 114 (45.6%) | 136 (54.4%) |
Female Fertility in Fort Yukon
Fertility by Age in Fort Yukon
Average fertility rate in Fort Yukon is 80.0 births per 1,000 women. Women in the age bracket of 15 to 19 years have the highest fertility rate with 412.0 births per 1,000 women. Women in the age bracket of 15 to 19 years acount for 100.0% of all women with births.
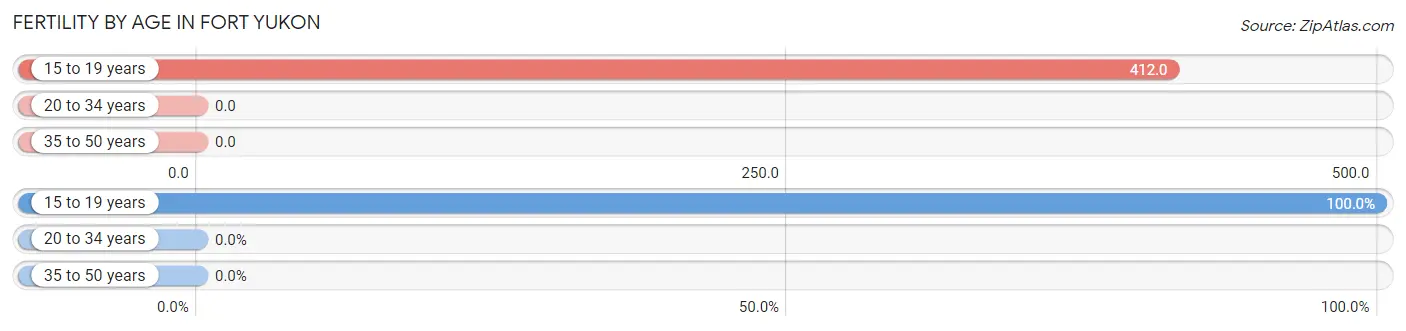
| Age Bracket | Women with Births | Births / 1,000 Women |
| 15 to 19 years | 7 (100.0%) | 412.0 |
| 20 to 34 years | 0 (0.0%) | 0.0 |
| 35 to 50 years | 0 (0.0%) | 0.0 |
| Total | 7 (100.0%) | 80.0 |
Fertility by Age by Marriage Status in Fort Yukon
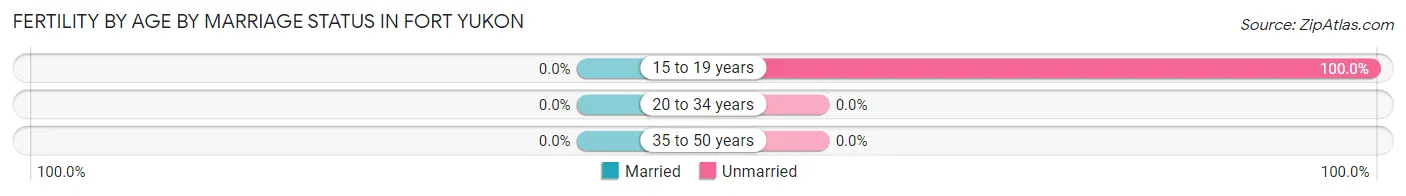
| Age Bracket | Married | Unmarried |
| 15 to 19 years | 0 (0.0%) | 7 (100.0%) |
| 20 to 34 years | 0 (0.0%) | 0 (0.0%) |
| 35 to 50 years | 0 (0.0%) | 0 (0.0%) |
| Total | 0 (0.0%) | 7 (100.0%) |
Fertility by Education in Fort Yukon
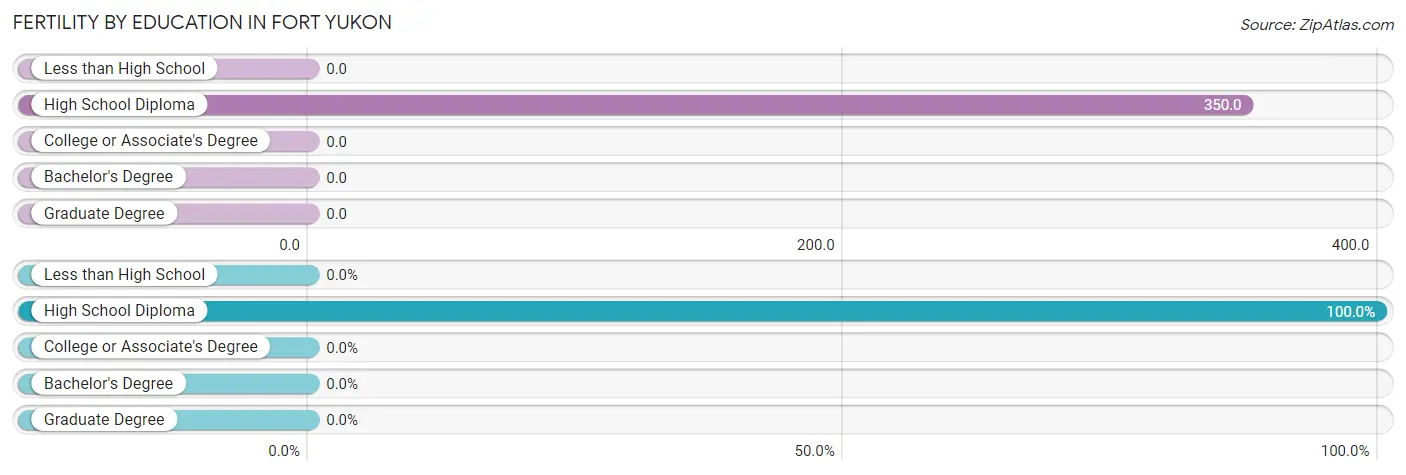
| Educational Attainment | Women with Births | Births / 1,000 Women |
| Less than High School | 0 (0.0%) | 0.0 |
| High School Diploma | 7 (100.0%) | 350.0 |
| College or Associate's Degree | 0 (0.0%) | 0.0 |
| Bachelor's Degree | 0 (0.0%) | 0.0 |
| Graduate Degree | 0 (0.0%) | 0.0 |
| Total | 7 (100.0%) | 80.0 |
Fertility by Education by Marriage Status in Fort Yukon
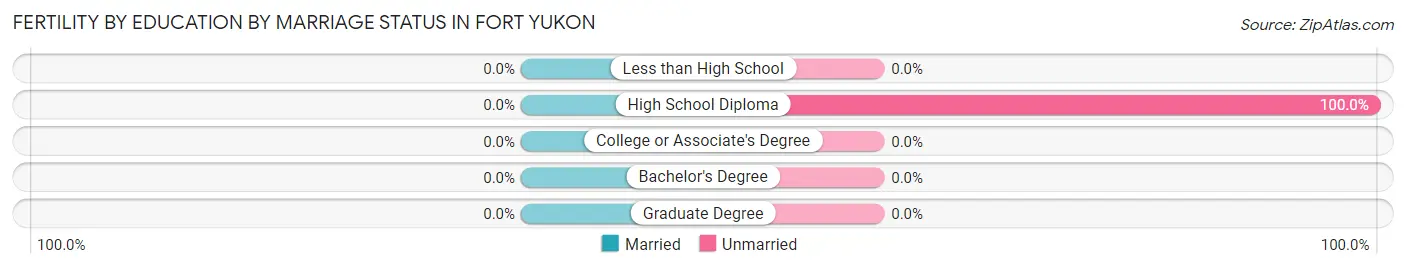
| Educational Attainment | Married | Unmarried |
| Less than High School | 0 (0.0%) | 0 (0.0%) |
| High School Diploma | 0 (0.0%) | 7 (100.0%) |
| College or Associate's Degree | 0 (0.0%) | 0 (0.0%) |
| Bachelor's Degree | 0 (0.0%) | 0 (0.0%) |
| Graduate Degree | 0 (0.0%) | 0 (0.0%) |
| Total | 0 (0.0%) | 7 (100.0%) |
Employment Characteristics in Fort Yukon
Employment by Class of Employer in Fort Yukon
Among the 157 employed individuals in Fort Yukon, local government employees (67 | 42.7%), state government employees (32 | 20.4%), and not-for-profit organizations (26 | 16.6%) make up the most common classes of employment.
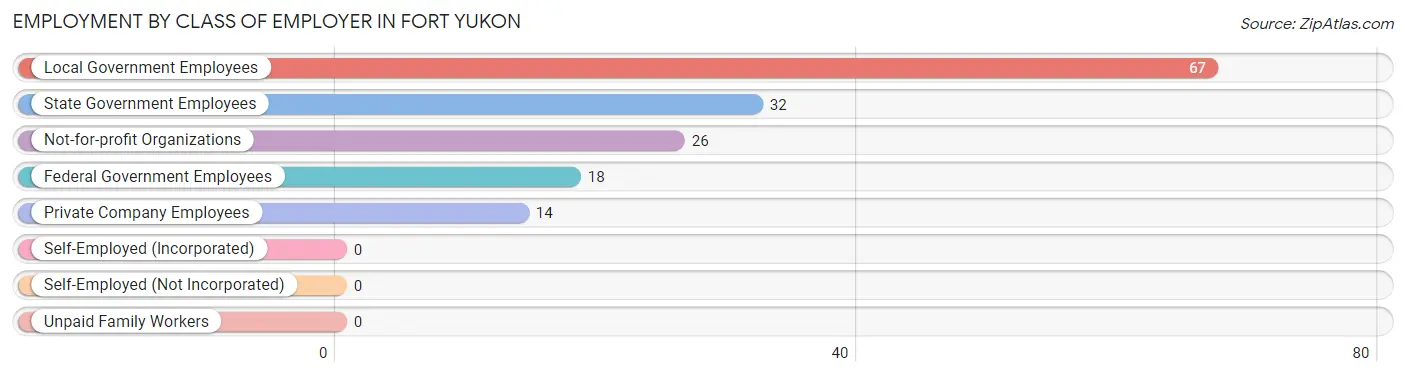
| Employer Class | # Employees | % Employees |
| Private Company Employees | 14 | 8.9% |
| Self-Employed (Incorporated) | 0 | 0.0% |
| Self-Employed (Not Incorporated) | 0 | 0.0% |
| Not-for-profit Organizations | 26 | 16.6% |
| Local Government Employees | 67 | 42.7% |
| State Government Employees | 32 | 20.4% |
| Federal Government Employees | 18 | 11.5% |
| Unpaid Family Workers | 0 | 0.0% |
| Total | 157 | 100.0% |
Employment Status by Age in Fort Yukon
According to the labor force statistics for Fort Yukon, out of the total population over 16 years of age (365), 60.0% or 219 individuals are in the labor force, with 24.5% or 54 of them unemployed. The age group with the highest labor force participation rate is 20 to 24 years, with 100.0% or 11 individuals in the labor force. Within the labor force, the 60 to 64 years age range has the highest percentage of unemployed individuals, with 50.0% or 2 of them being unemployed.
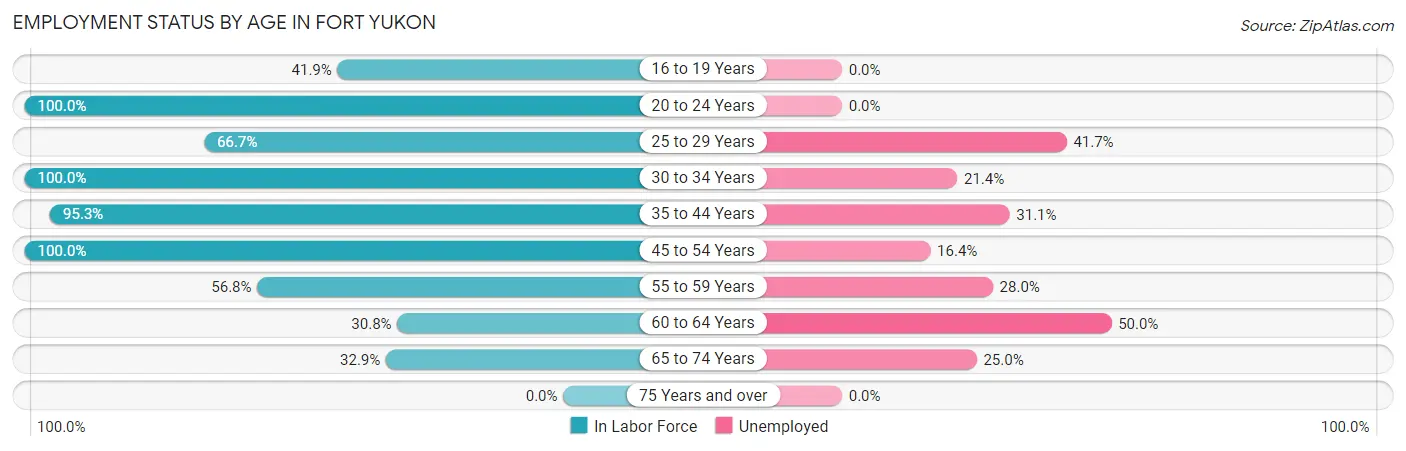
| Age Bracket | In Labor Force | Unemployed |
| 16 to 19 Years | 13 (41.9%) | 0 (0.0%) |
| 20 to 24 Years | 11 (100.0%) | 0 (0.0%) |
| 25 to 29 Years | 12 (66.7%) | 5 (41.7%) |
| 30 to 34 Years | 14 (100.0%) | 3 (21.4%) |
| 35 to 44 Years | 61 (95.3%) | 19 (31.1%) |
| 45 to 54 Years | 55 (100.0%) | 9 (16.4%) |
| 55 to 59 Years | 25 (56.8%) | 7 (28.0%) |
| 60 to 64 Years | 4 (30.8%) | 2 (50.0%) |
| 65 to 74 Years | 24 (32.9%) | 6 (25.0%) |
| 75 Years and over | 0 (0.0%) | 0 (0.0%) |
| Total | 219 (60.0%) | 54 (24.5%) |
Employment Status by Educational Attainment in Fort Yukon
According to labor force statistics for Fort Yukon, 82.2% of individuals (171) out of the total population between 25 and 64 years of age (208) are in the labor force, with 26.3% or 45 of them being unemployed. The group with the highest labor force participation rate are those with the educational attainment of bachelor's degree or higher, with 100.0% or 18 individuals in the labor force. Within the labor force, individuals with high school diploma education have the highest percentage of unemployment, with 35.6% or 21 of them being unemployed.
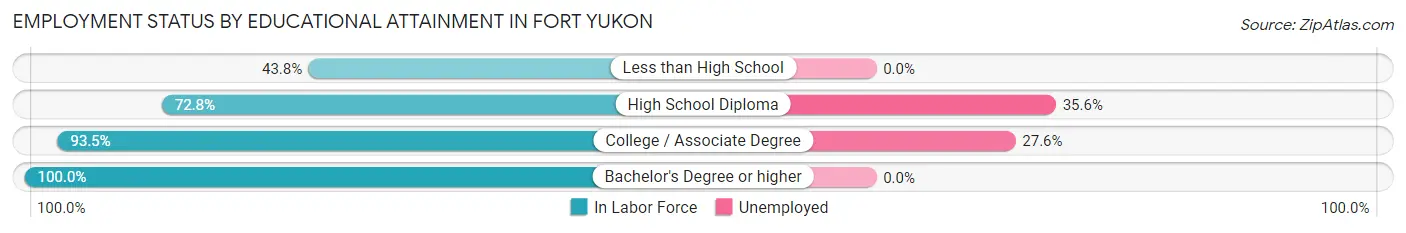
| Educational Attainment | In Labor Force | Unemployed |
| Less than High School | 7 (43.8%) | 0 (0.0%) |
| High School Diploma | 59 (72.8%) | 29 (35.6%) |
| College / Associate Degree | 87 (93.5%) | 26 (27.6%) |
| Bachelor's Degree or higher | 18 (100.0%) | 0 (0.0%) |
| Total | 171 (82.2%) | 55 (26.3%) |
Employment Occupations by Sex in Fort Yukon
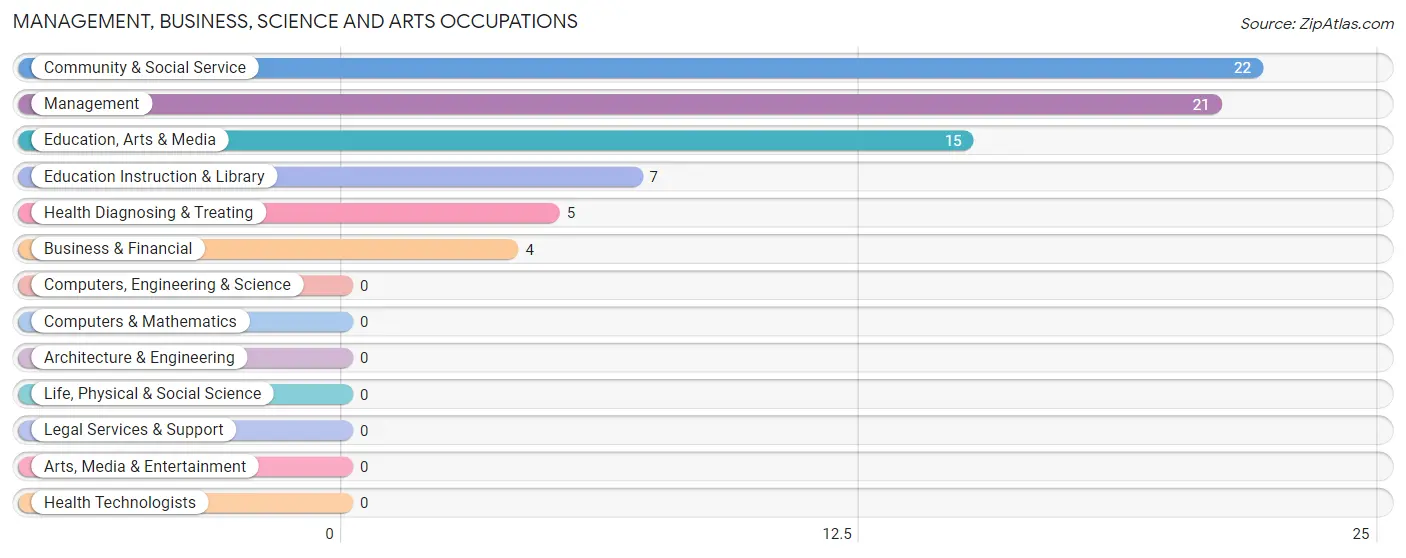
Management, Business, Science and Arts Occupations
The most common Management, Business, Science and Arts occupations in Fort Yukon are Community & Social Service (22 | 14.0%), Management (21 | 13.4%), Education, Arts & Media (15 | 9.6%), Education Instruction & Library (7 | 4.5%), and Health Diagnosing & Treating (5 | 3.2%).
Management, Business, Science and Arts Occupations by Sex
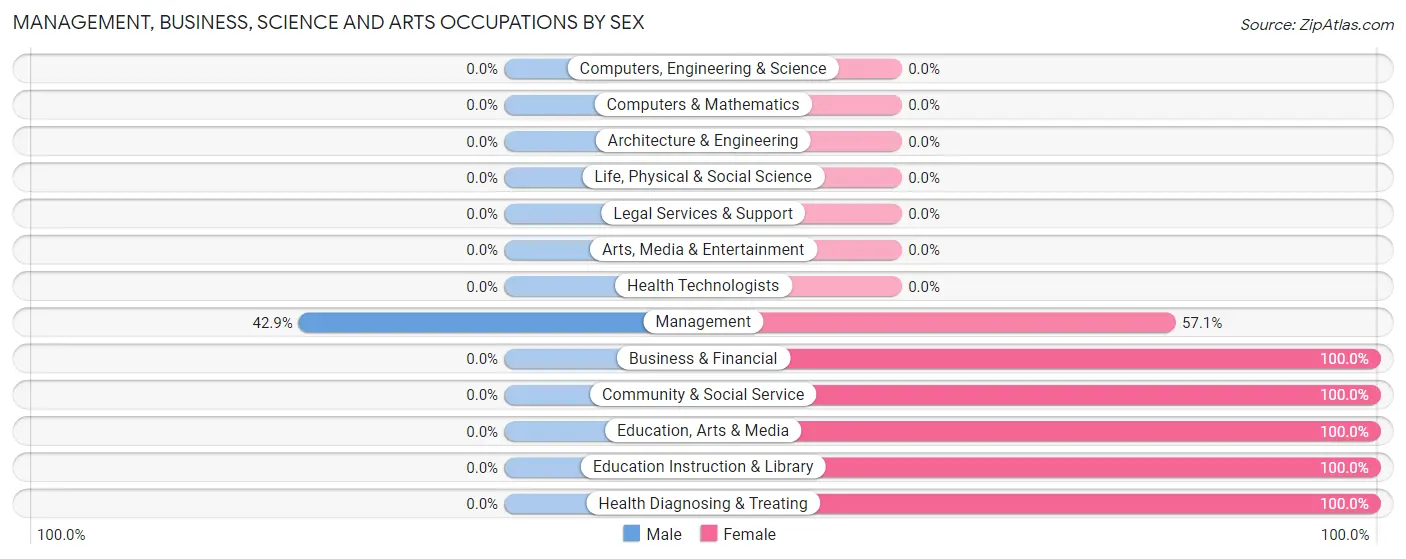
| Occupation | Male | Female |
| Management | 9 (42.9%) | 12 (57.1%) |
| Business & Financial | 0 (0.0%) | 4 (100.0%) |
| Computers, Engineering & Science | 0 (0.0%) | 0 (0.0%) |
| Computers & Mathematics | 0 (0.0%) | 0 (0.0%) |
| Architecture & Engineering | 0 (0.0%) | 0 (0.0%) |
| Life, Physical & Social Science | 0 (0.0%) | 0 (0.0%) |
| Community & Social Service | 0 (0.0%) | 22 (100.0%) |
| Education, Arts & Media | 0 (0.0%) | 15 (100.0%) |
| Legal Services & Support | 0 (0.0%) | 0 (0.0%) |
| Education Instruction & Library | 0 (0.0%) | 7 (100.0%) |
| Arts, Media & Entertainment | 0 (0.0%) | 0 (0.0%) |
| Health Diagnosing & Treating | 0 (0.0%) | 5 (100.0%) |
| Health Technologists | 0 (0.0%) | 0 (0.0%) |
| Total (Category) | 9 (17.3%) | 43 (82.7%) |
| Total (Overall) | 58 (36.9%) | 99 (63.1%) |
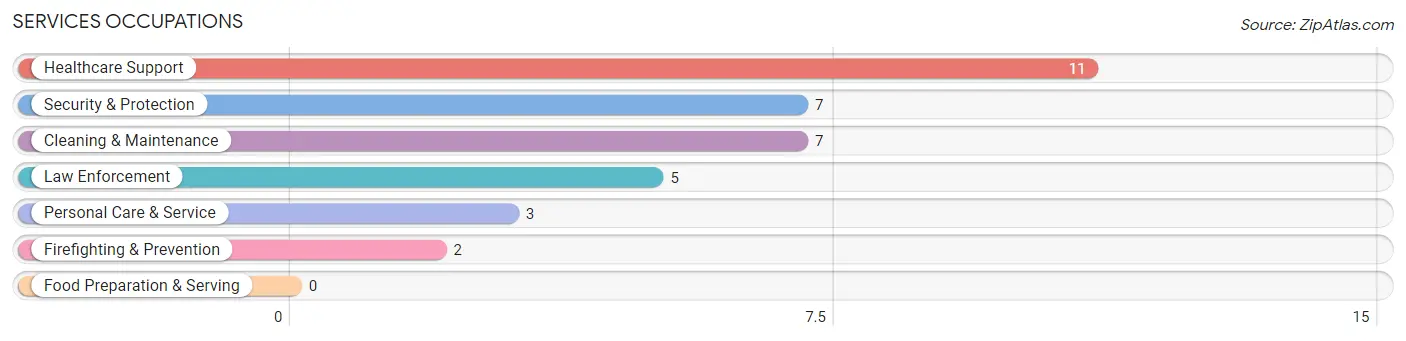
Services Occupations
The most common Services occupations in Fort Yukon are Healthcare Support (11 | 7.0%), Security & Protection (7 | 4.5%), Cleaning & Maintenance (7 | 4.5%), Law Enforcement (5 | 3.2%), and Personal Care & Service (3 | 1.9%).
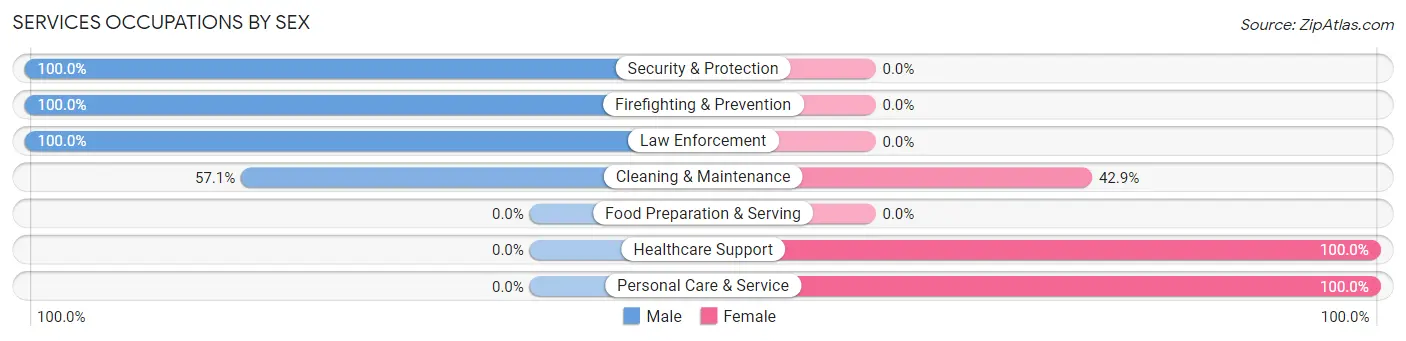
Services Occupations by Sex
Within the Services occupations in Fort Yukon, the most male-oriented occupations are Security & Protection (100.0%), Firefighting & Prevention (100.0%), and Law Enforcement (100.0%), while the most female-oriented occupations are Healthcare Support (100.0%), Personal Care & Service (100.0%), and Cleaning & Maintenance (42.9%).
| Occupation | Male | Female |
| Healthcare Support | 0 (0.0%) | 11 (100.0%) |
| Security & Protection | 7 (100.0%) | 0 (0.0%) |
| Firefighting & Prevention | 2 (100.0%) | 0 (0.0%) |
| Law Enforcement | 5 (100.0%) | 0 (0.0%) |
| Food Preparation & Serving | 0 (0.0%) | 0 (0.0%) |
| Cleaning & Maintenance | 4 (57.1%) | 3 (42.9%) |
| Personal Care & Service | 0 (0.0%) | 3 (100.0%) |
| Total (Category) | 11 (39.3%) | 17 (60.7%) |
| Total (Overall) | 58 (36.9%) | 99 (63.1%) |
Sales and Office Occupations
The most common Sales and Office occupations in Fort Yukon are Office & Administration (24 | 15.3%), and Sales & Related (9 | 5.7%).
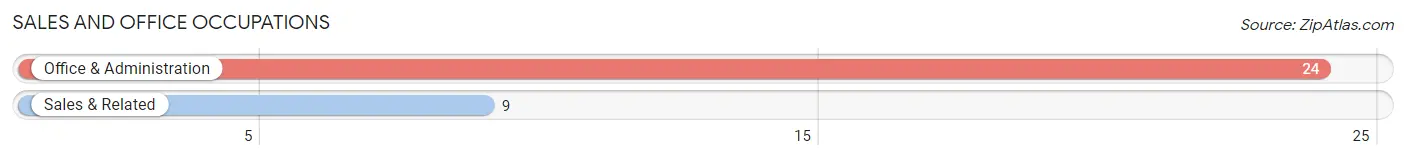
Sales and Office Occupations by Sex
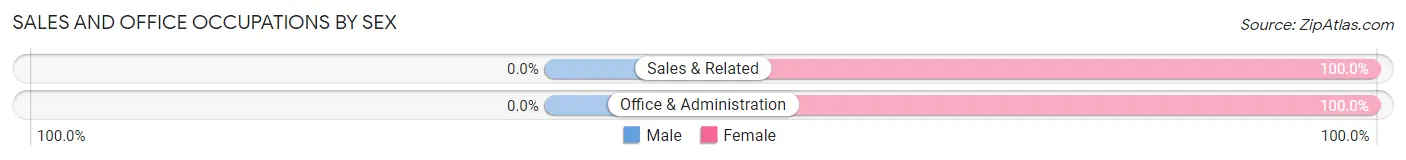
| Occupation | Male | Female |
| Sales & Related | 0 (0.0%) | 9 (100.0%) |
| Office & Administration | 0 (0.0%) | 24 (100.0%) |
| Total (Category) | 0 (0.0%) | 33 (100.0%) |
| Total (Overall) | 58 (36.9%) | 99 (63.1%) |
Natural Resources, Construction and Maintenance Occupations
The most common Natural Resources, Construction and Maintenance occupations in Fort Yukon are Construction & Extraction (15 | 9.6%), and Installation, Maintenance & Repair (8 | 5.1%).
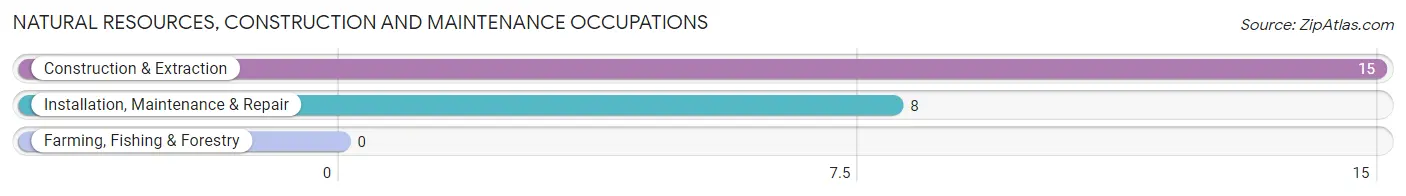
Natural Resources, Construction and Maintenance Occupations by Sex
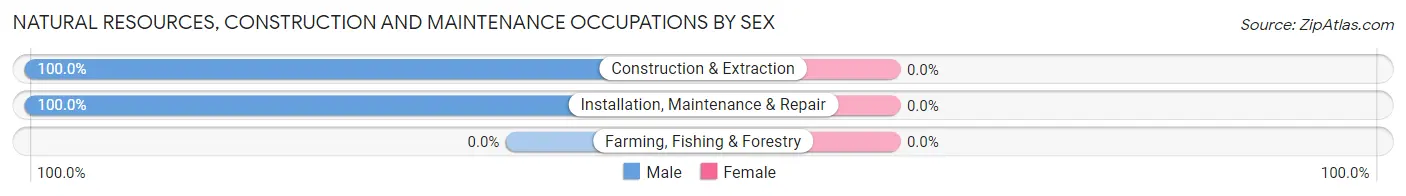
| Occupation | Male | Female |
| Farming, Fishing & Forestry | 0 (0.0%) | 0 (0.0%) |
| Construction & Extraction | 15 (100.0%) | 0 (0.0%) |
| Installation, Maintenance & Repair | 8 (100.0%) | 0 (0.0%) |
| Total (Category) | 23 (100.0%) | 0 (0.0%) |
| Total (Overall) | 58 (36.9%) | 99 (63.1%) |
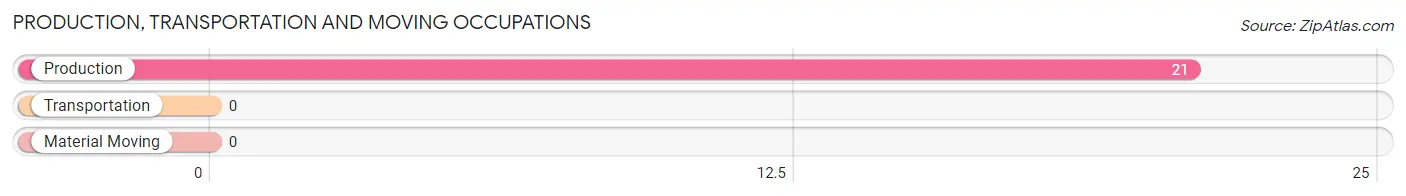
Production, Transportation and Moving Occupations
The most common Production, Transportation and Moving occupations in Fort Yukon are , and Production (21 | 13.4%).
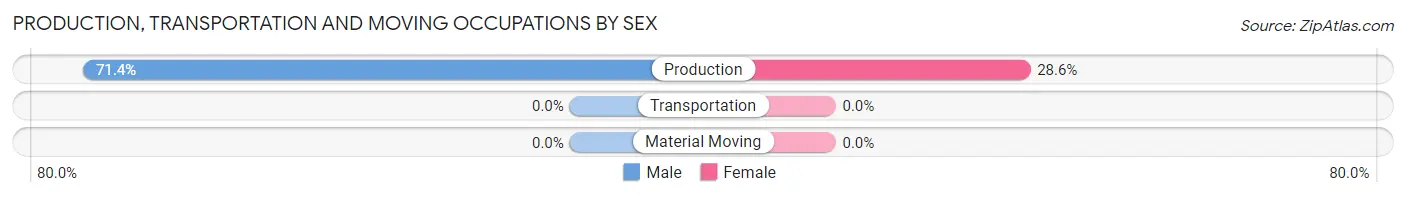
Production, Transportation and Moving Occupations by Sex
| Occupation | Male | Female |
| Production | 15 (71.4%) | 6 (28.6%) |
| Transportation | 0 (0.0%) | 0 (0.0%) |
| Material Moving | 0 (0.0%) | 0 (0.0%) |
| Total (Category) | 15 (71.4%) | 6 (28.6%) |
| Total (Overall) | 58 (36.9%) | 99 (63.1%) |
Employment Industries by Sex in Fort Yukon
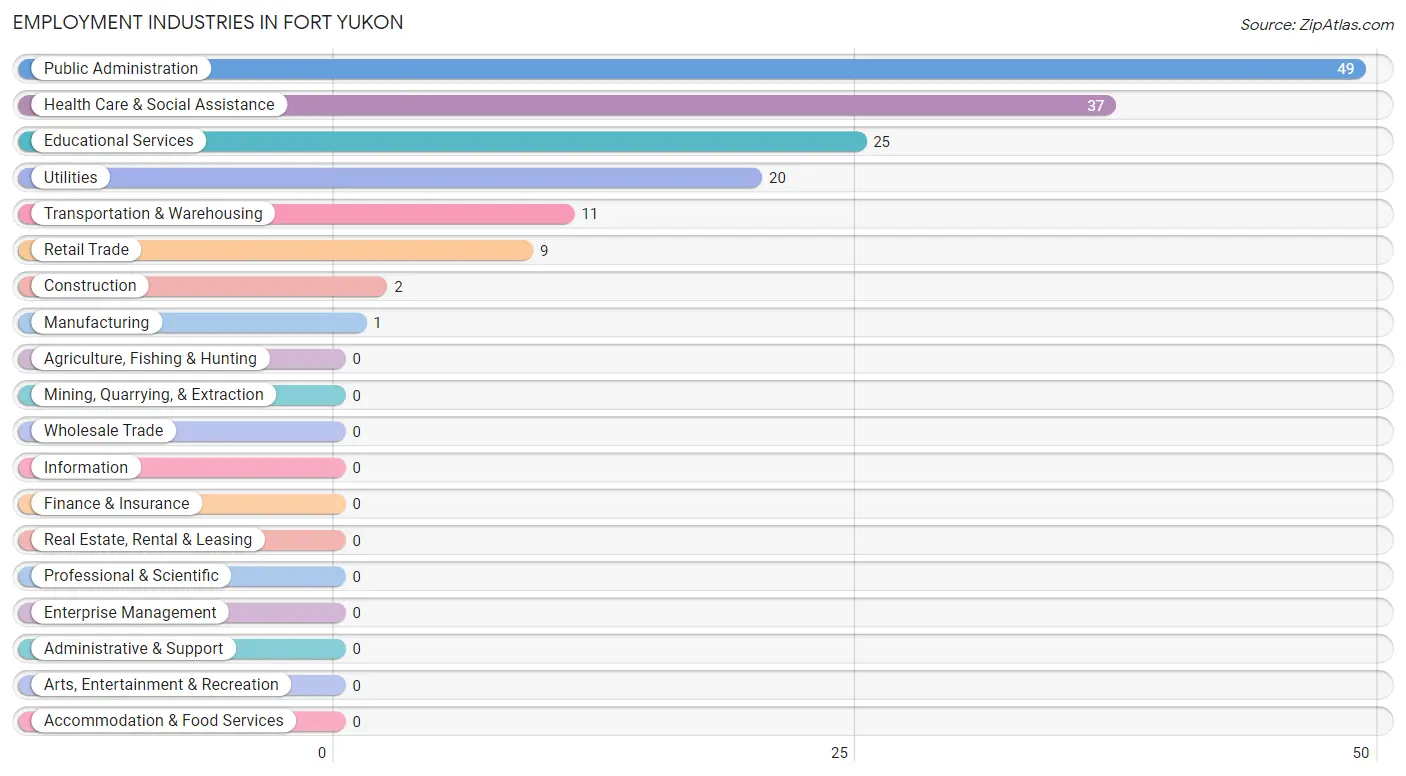
Employment Industries in Fort Yukon
The major employment industries in Fort Yukon include Public Administration (49 | 31.2%), Health Care & Social Assistance (37 | 23.6%), Educational Services (25 | 15.9%), Utilities (20 | 12.7%), and Transportation & Warehousing (11 | 7.0%).
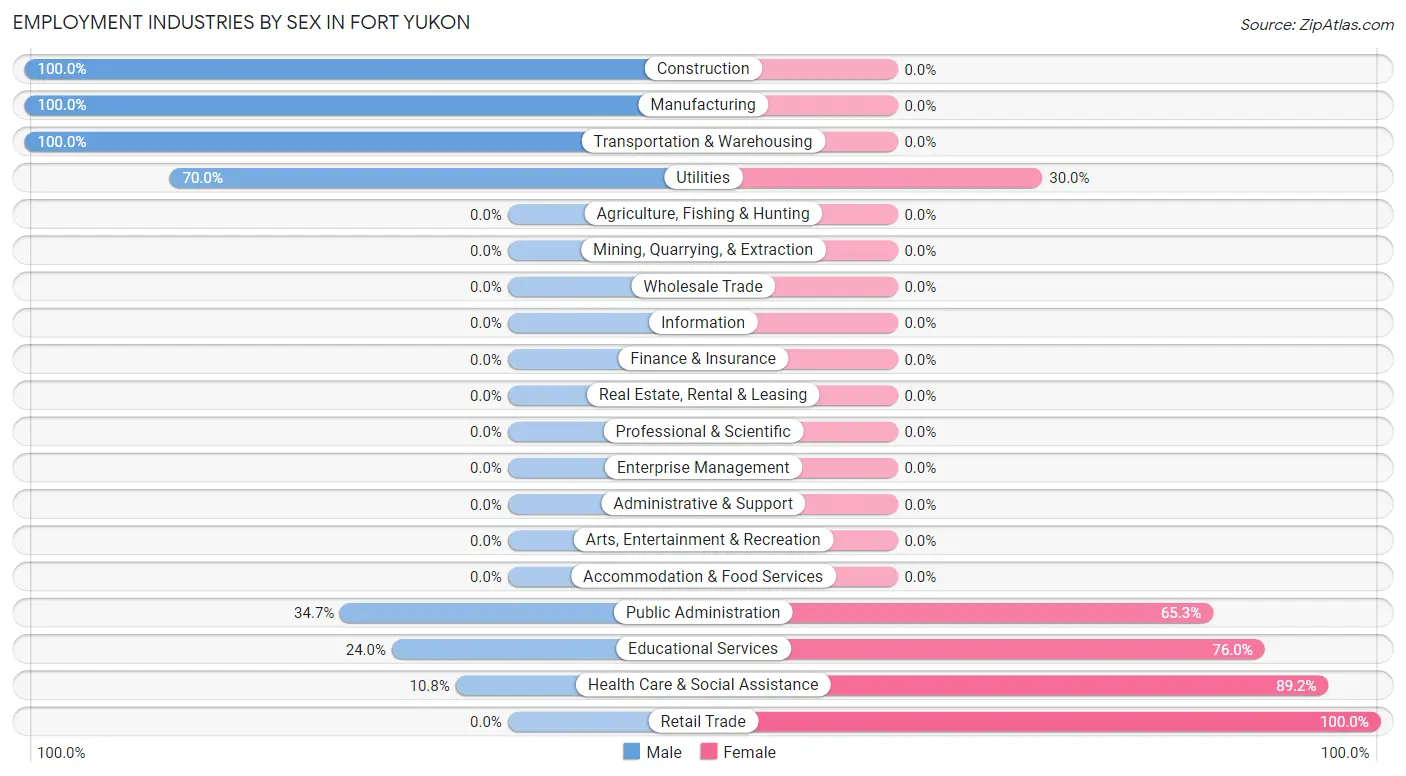
Employment Industries by Sex in Fort Yukon
The Fort Yukon industries that see more men than women are Construction (100.0%), Manufacturing (100.0%), and Transportation & Warehousing (100.0%), whereas the industries that tend to have a higher number of women are Retail Trade (100.0%), Health Care & Social Assistance (89.2%), and Educational Services (76.0%).
| Industry | Male | Female |
| Agriculture, Fishing & Hunting | 0 (0.0%) | 0 (0.0%) |
| Mining, Quarrying, & Extraction | 0 (0.0%) | 0 (0.0%) |
| Construction | 2 (100.0%) | 0 (0.0%) |
| Manufacturing | 1 (100.0%) | 0 (0.0%) |
| Wholesale Trade | 0 (0.0%) | 0 (0.0%) |
| Retail Trade | 0 (0.0%) | 9 (100.0%) |
| Transportation & Warehousing | 11 (100.0%) | 0 (0.0%) |
| Utilities | 14 (70.0%) | 6 (30.0%) |
| Information | 0 (0.0%) | 0 (0.0%) |
| Finance & Insurance | 0 (0.0%) | 0 (0.0%) |
| Real Estate, Rental & Leasing | 0 (0.0%) | 0 (0.0%) |
| Professional & Scientific | 0 (0.0%) | 0 (0.0%) |
| Enterprise Management | 0 (0.0%) | 0 (0.0%) |
| Administrative & Support | 0 (0.0%) | 0 (0.0%) |
| Educational Services | 6 (24.0%) | 19 (76.0%) |
| Health Care & Social Assistance | 4 (10.8%) | 33 (89.2%) |
| Arts, Entertainment & Recreation | 0 (0.0%) | 0 (0.0%) |
| Accommodation & Food Services | 0 (0.0%) | 0 (0.0%) |
| Public Administration | 17 (34.7%) | 32 (65.3%) |
| Total | 58 (36.9%) | 99 (63.1%) |
Education in Fort Yukon
School Enrollment in Fort Yukon
The most common levels of schooling among the 102 students in Fort Yukon are high school (39 | 38.2%), middle school (34 | 33.3%), and elementary school (17 | 16.7%).
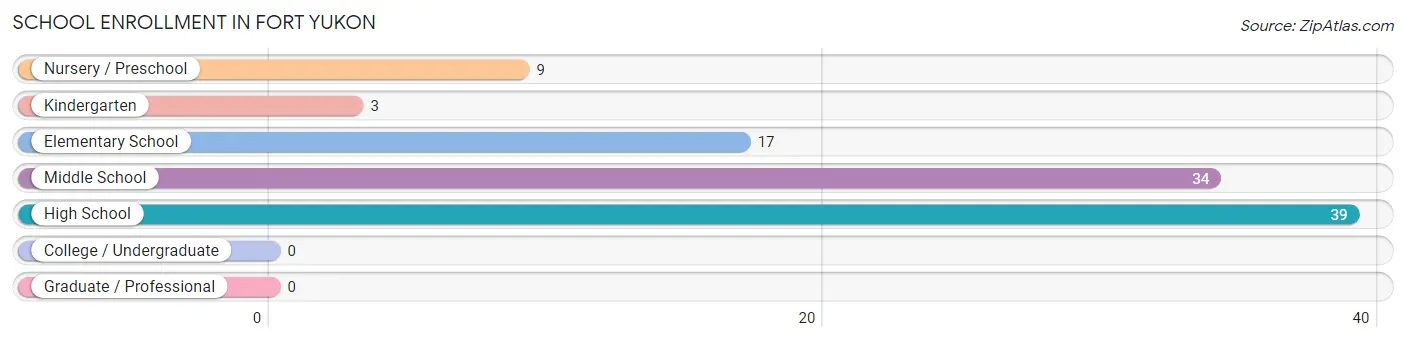
| School Level | # Students | % Students |
| Nursery / Preschool | 9 | 8.8% |
| Kindergarten | 3 | 2.9% |
| Elementary School | 17 | 16.7% |
| Middle School | 34 | 33.3% |
| High School | 39 | 38.2% |
| College / Undergraduate | 0 | 0.0% |
| Graduate / Professional | 0 | 0.0% |
| Total | 102 | 100.0% |
School Enrollment by Age by Funding Source in Fort Yukon
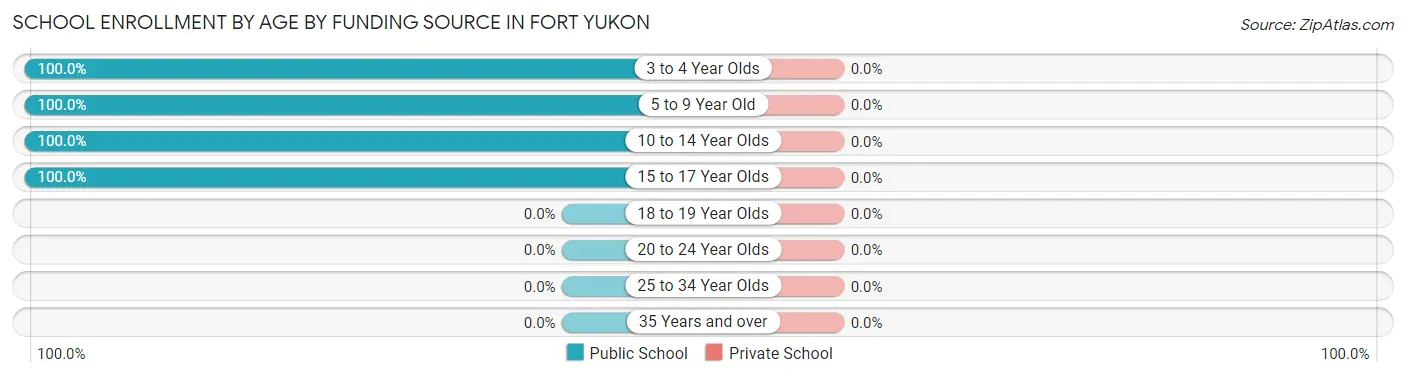
| Age Bracket | Public School | Private School |
| 3 to 4 Year Olds | 9 (100.0%) | 0 (0.0%) |
| 5 to 9 Year Old | 22 (100.0%) | 0 (0.0%) |
| 10 to 14 Year Olds | 53 (100.0%) | 0 (0.0%) |
| 15 to 17 Year Olds | 18 (100.0%) | 0 (0.0%) |
| 18 to 19 Year Olds | 0 (0.0%) | 0 (0.0%) |
| 20 to 24 Year Olds | 0 (0.0%) | 0 (0.0%) |
| 25 to 34 Year Olds | 0 (0.0%) | 0 (0.0%) |
| 35 Years and over | 0 (0.0%) | 0 (0.0%) |
| Total | 102 (100.0%) | 0 (0.0%) |
Educational Attainment by Field of Study in Fort Yukon
Education (16 | 32.7%), social sciences (8 | 16.3%), business (6 | 12.2%), visual & performing arts (6 | 12.2%), and psychology (5 | 10.2%) are the most common fields of study among 49 individuals in Fort Yukon who have obtained a bachelor's degree or higher.
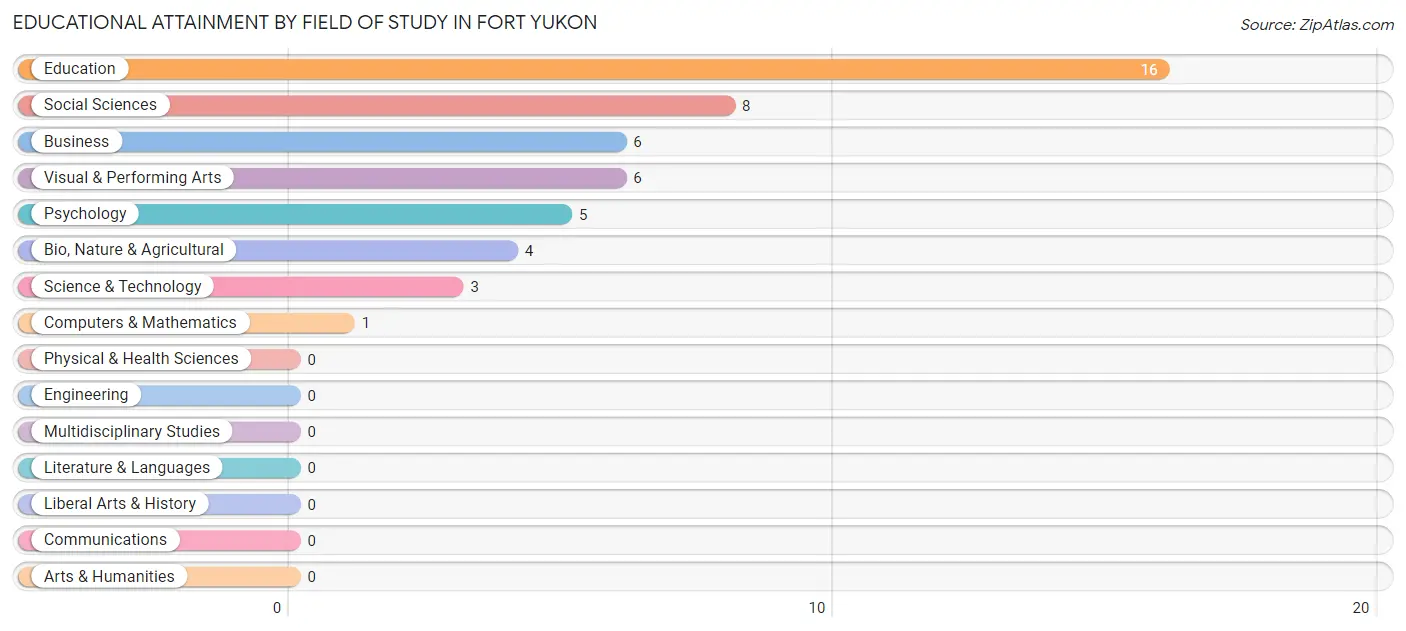
| Field of Study | # Graduates | % Graduates |
| Computers & Mathematics | 1 | 2.0% |
| Bio, Nature & Agricultural | 4 | 8.2% |
| Physical & Health Sciences | 0 | 0.0% |
| Psychology | 5 | 10.2% |
| Social Sciences | 8 | 16.3% |
| Engineering | 0 | 0.0% |
| Multidisciplinary Studies | 0 | 0.0% |
| Science & Technology | 3 | 6.1% |
| Business | 6 | 12.2% |
| Education | 16 | 32.7% |
| Literature & Languages | 0 | 0.0% |
| Liberal Arts & History | 0 | 0.0% |
| Visual & Performing Arts | 6 | 12.2% |
| Communications | 0 | 0.0% |
| Arts & Humanities | 0 | 0.0% |
| Total | 49 | 100.0% |
Transportation & Commute in Fort Yukon
Vehicle Availability by Sex in Fort Yukon
The most prevalent vehicle ownership categories in Fort Yukon are males with 2 vehicles (24, accounting for 51.1%) and females with 2 vehicles (25, making up 25.8%).
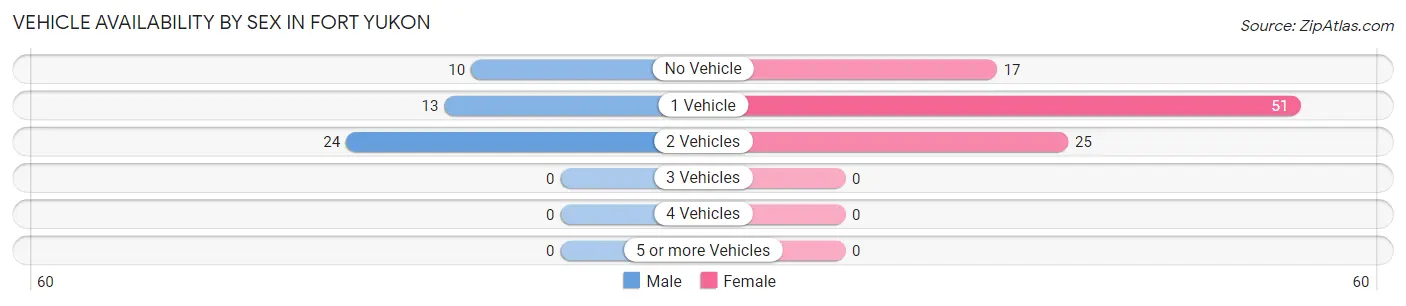
| Vehicles Available | Male | Female |
| No Vehicle | 10 (21.3%) | 17 (18.3%) |
| 1 Vehicle | 13 (27.7%) | 51 (54.8%) |
| 2 Vehicles | 24 (51.1%) | 25 (26.9%) |
| 3 Vehicles | 0 (0.0%) | 0 (0.0%) |
| 4 Vehicles | 0 (0.0%) | 0 (0.0%) |
| 5 or more Vehicles | 0 (0.0%) | 0 (0.0%) |
| Total | 47 (100.0%) | 93 (100.0%) |
Commute Time in Fort Yukon
The most frequently occuring commute durations in Fort Yukon are 5 to 9 minutes (66 commuters, 43.4%), less than 5 minutes (50 commuters, 32.9%), and 20 to 24 minutes (11 commuters, 7.2%).
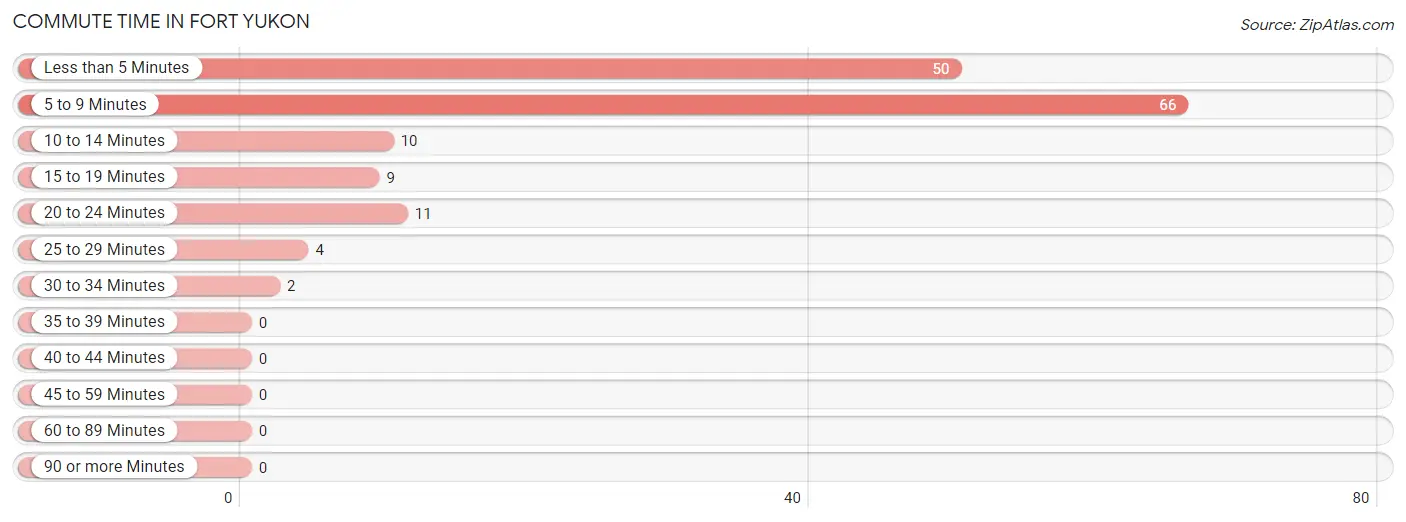
| Commute Time | # Commuters | % Commuters |
| Less than 5 Minutes | 50 | 32.9% |
| 5 to 9 Minutes | 66 | 43.4% |
| 10 to 14 Minutes | 10 | 6.6% |
| 15 to 19 Minutes | 9 | 5.9% |
| 20 to 24 Minutes | 11 | 7.2% |
| 25 to 29 Minutes | 4 | 2.6% |
| 30 to 34 Minutes | 2 | 1.3% |
| 35 to 39 Minutes | 0 | 0.0% |
| 40 to 44 Minutes | 0 | 0.0% |
| 45 to 59 Minutes | 0 | 0.0% |
| 60 to 89 Minutes | 0 | 0.0% |
| 90 or more Minutes | 0 | 0.0% |
Commute Time by Sex in Fort Yukon
The most common commute times in Fort Yukon are 5 to 9 minutes (25 commuters, 42.4%) for males and 5 to 9 minutes (41 commuters, 44.1%) for females.
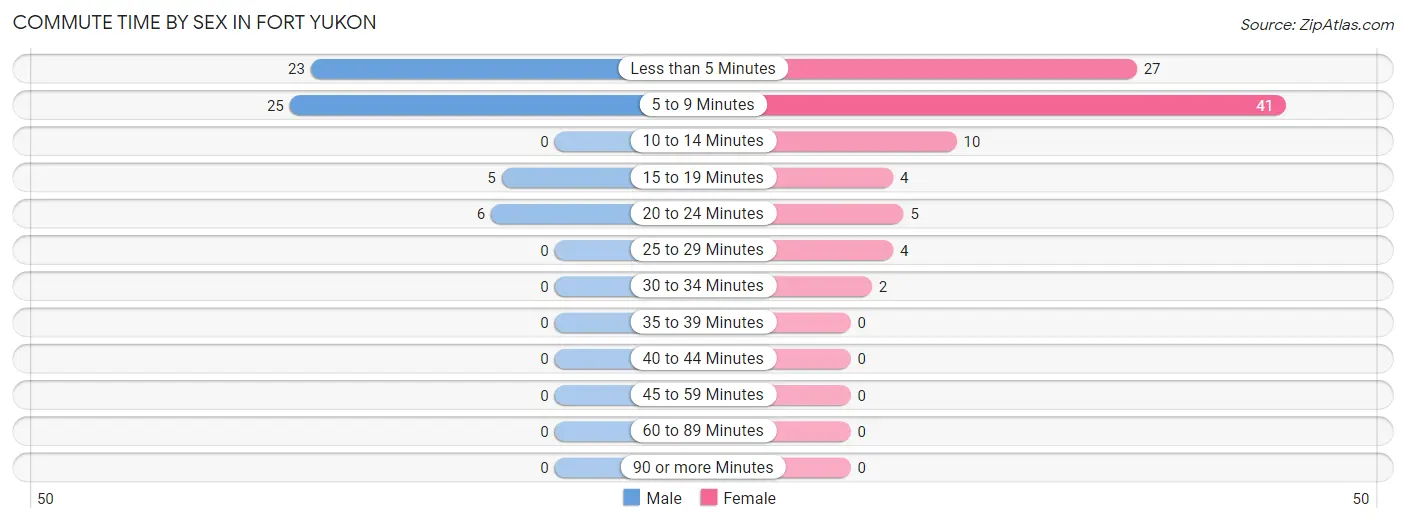
| Commute Time | Male | Female |
| Less than 5 Minutes | 23 (39.0%) | 27 (29.0%) |
| 5 to 9 Minutes | 25 (42.4%) | 41 (44.1%) |
| 10 to 14 Minutes | 0 (0.0%) | 10 (10.7%) |
| 15 to 19 Minutes | 5 (8.5%) | 4 (4.3%) |
| 20 to 24 Minutes | 6 (10.2%) | 5 (5.4%) |
| 25 to 29 Minutes | 0 (0.0%) | 4 (4.3%) |
| 30 to 34 Minutes | 0 (0.0%) | 2 (2.1%) |
| 35 to 39 Minutes | 0 (0.0%) | 0 (0.0%) |
| 40 to 44 Minutes | 0 (0.0%) | 0 (0.0%) |
| 45 to 59 Minutes | 0 (0.0%) | 0 (0.0%) |
| 60 to 89 Minutes | 0 (0.0%) | 0 (0.0%) |
| 90 or more Minutes | 0 (0.0%) | 0 (0.0%) |
Time of Departure to Work by Sex in Fort Yukon
The most frequent times of departure to work in Fort Yukon are 8:00 AM to 8:29 AM (26, 44.1%) for males and 7:30 AM to 7:59 AM (38, 40.9%) for females.
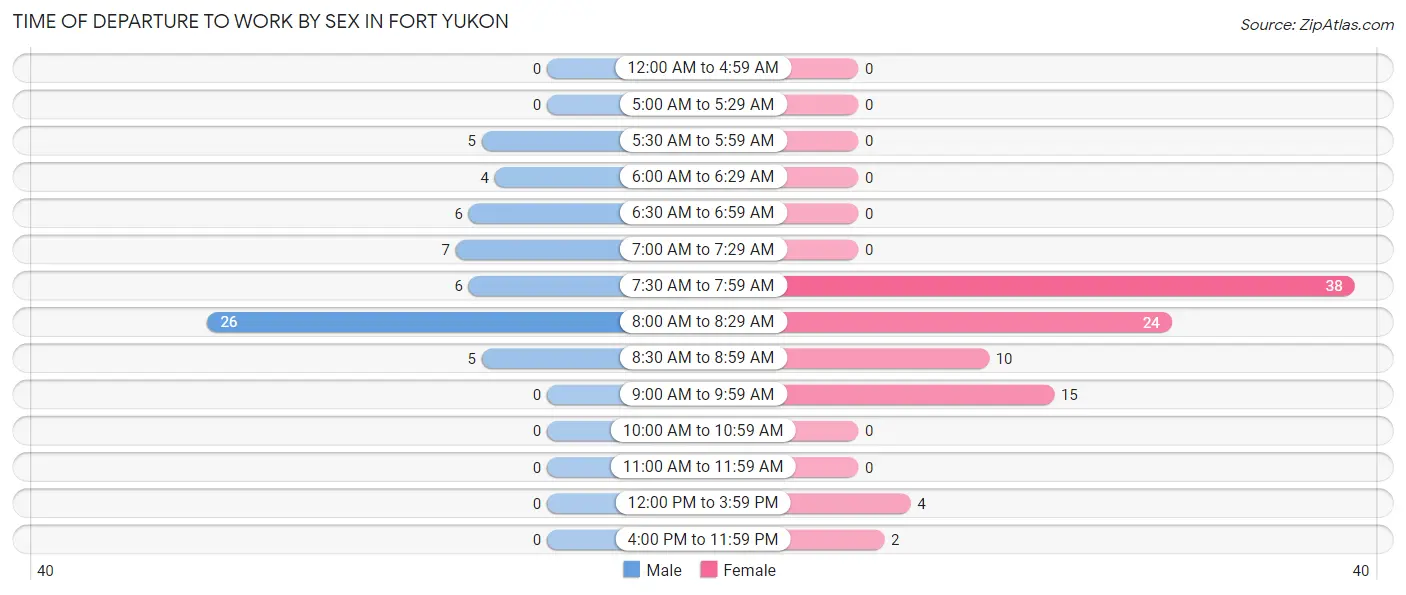
| Time of Departure | Male | Female |
| 12:00 AM to 4:59 AM | 0 (0.0%) | 0 (0.0%) |
| 5:00 AM to 5:29 AM | 0 (0.0%) | 0 (0.0%) |
| 5:30 AM to 5:59 AM | 5 (8.5%) | 0 (0.0%) |
| 6:00 AM to 6:29 AM | 4 (6.8%) | 0 (0.0%) |
| 6:30 AM to 6:59 AM | 6 (10.2%) | 0 (0.0%) |
| 7:00 AM to 7:29 AM | 7 (11.9%) | 0 (0.0%) |
| 7:30 AM to 7:59 AM | 6 (10.2%) | 38 (40.9%) |
| 8:00 AM to 8:29 AM | 26 (44.1%) | 24 (25.8%) |
| 8:30 AM to 8:59 AM | 5 (8.5%) | 10 (10.7%) |
| 9:00 AM to 9:59 AM | 0 (0.0%) | 15 (16.1%) |
| 10:00 AM to 10:59 AM | 0 (0.0%) | 0 (0.0%) |
| 11:00 AM to 11:59 AM | 0 (0.0%) | 0 (0.0%) |
| 12:00 PM to 3:59 PM | 0 (0.0%) | 4 (4.3%) |
| 4:00 PM to 11:59 PM | 0 (0.0%) | 2 (2.1%) |
| Total | 59 (100.0%) | 93 (100.0%) |
Housing Occupancy in Fort Yukon
Occupancy by Ownership in Fort Yukon
Of the total 250 dwellings in Fort Yukon, owner-occupied units account for 194 (77.6%), while renter-occupied units make up 56 (22.4%).
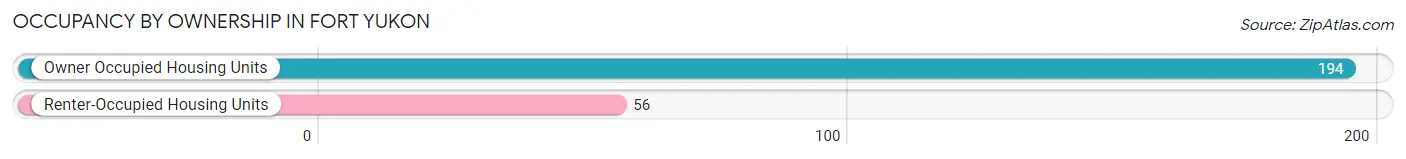
| Occupancy | # Housing Units | % Housing Units |
| Owner Occupied Housing Units | 194 | 77.6% |
| Renter-Occupied Housing Units | 56 | 22.4% |
| Total Occupied Housing Units | 250 | 100.0% |
Occupancy by Household Size in Fort Yukon
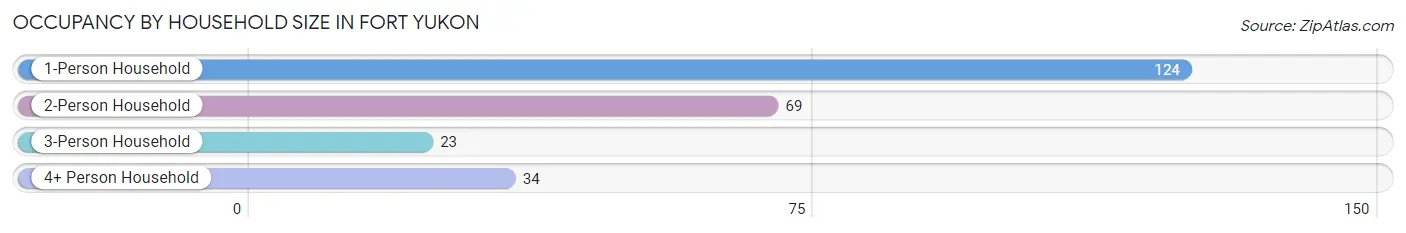
| Household Size | # Housing Units | % Housing Units |
| 1-Person Household | 124 | 49.6% |
| 2-Person Household | 69 | 27.6% |
| 3-Person Household | 23 | 9.2% |
| 4+ Person Household | 34 | 13.6% |
| Total Housing Units | 250 | 100.0% |
Occupancy by Ownership by Household Size in Fort Yukon
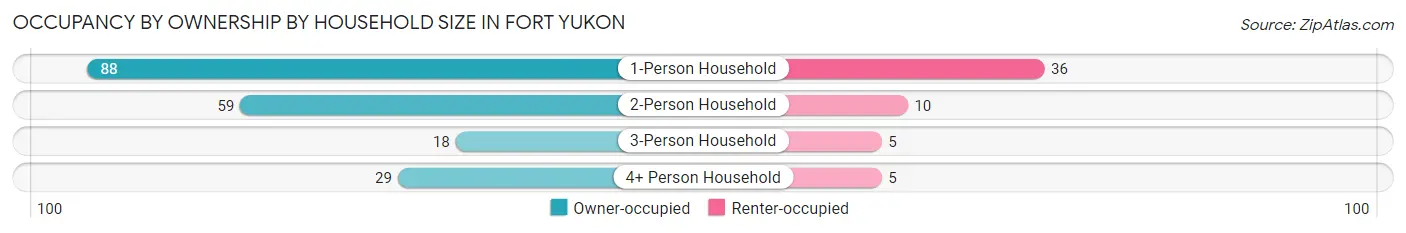
| Household Size | Owner-occupied | Renter-occupied |
| 1-Person Household | 88 (71.0%) | 36 (29.0%) |
| 2-Person Household | 59 (85.5%) | 10 (14.5%) |
| 3-Person Household | 18 (78.3%) | 5 (21.7%) |
| 4+ Person Household | 29 (85.3%) | 5 (14.7%) |
| Total Housing Units | 194 (77.6%) | 56 (22.4%) |
Occupancy by Educational Attainment in Fort Yukon
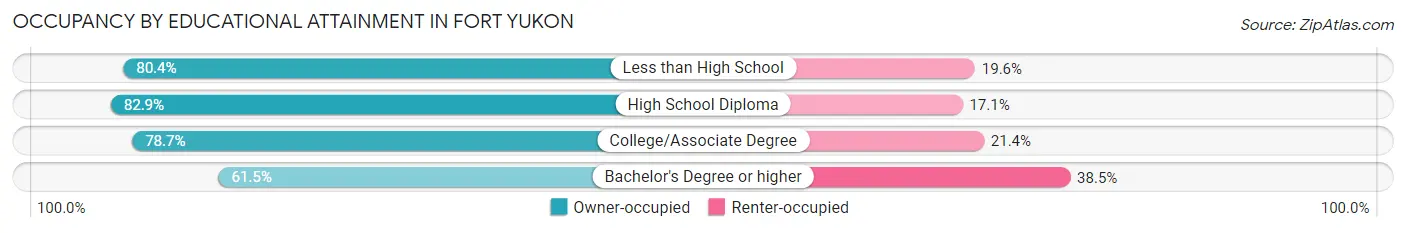
| Household Size | Owner-occupied | Renter-occupied |
| Less than High School | 37 (80.4%) | 9 (19.6%) |
| High School Diploma | 63 (82.9%) | 13 (17.1%) |
| College/Associate Degree | 70 (78.6%) | 19 (21.3%) |
| Bachelor's Degree or higher | 24 (61.5%) | 15 (38.5%) |
Occupancy by Age of Householder in Fort Yukon
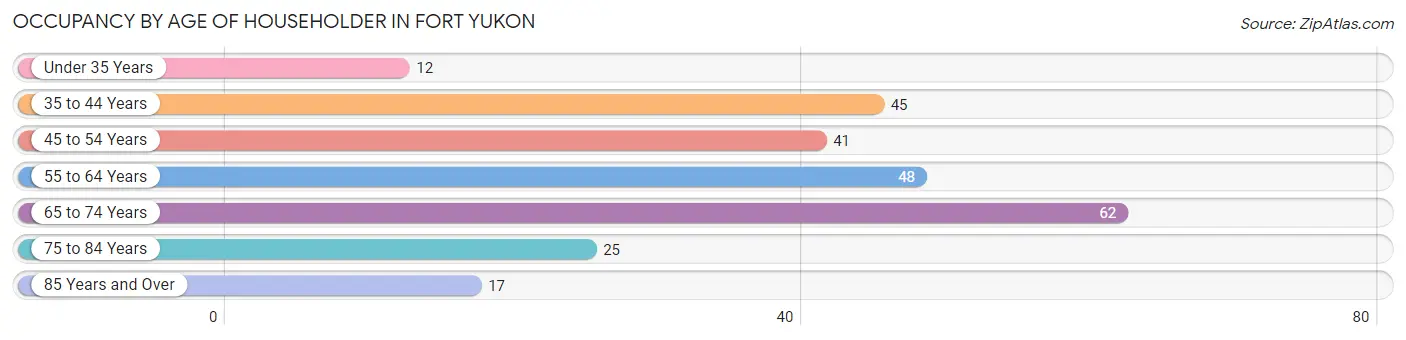
| Age Bracket | # Households | % Households |
| Under 35 Years | 12 | 4.8% |
| 35 to 44 Years | 45 | 18.0% |
| 45 to 54 Years | 41 | 16.4% |
| 55 to 64 Years | 48 | 19.2% |
| 65 to 74 Years | 62 | 24.8% |
| 75 to 84 Years | 25 | 10.0% |
| 85 Years and Over | 17 | 6.8% |
| Total | 250 | 100.0% |
Housing Finances in Fort Yukon
Median Income by Occupancy in Fort Yukon
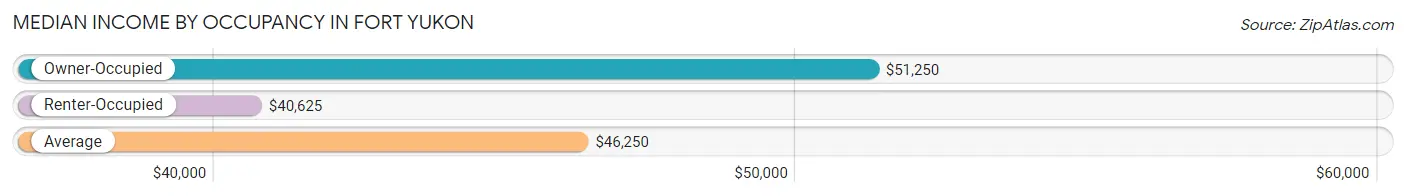
| Occupancy Type | # Households | Median Income |
| Owner-Occupied | 194 (77.6%) | $51,250 |
| Renter-Occupied | 56 (22.4%) | $40,625 |
| Average | 250 (100.0%) | $46,250 |
Occupancy by Householder Income Bracket in Fort Yukon
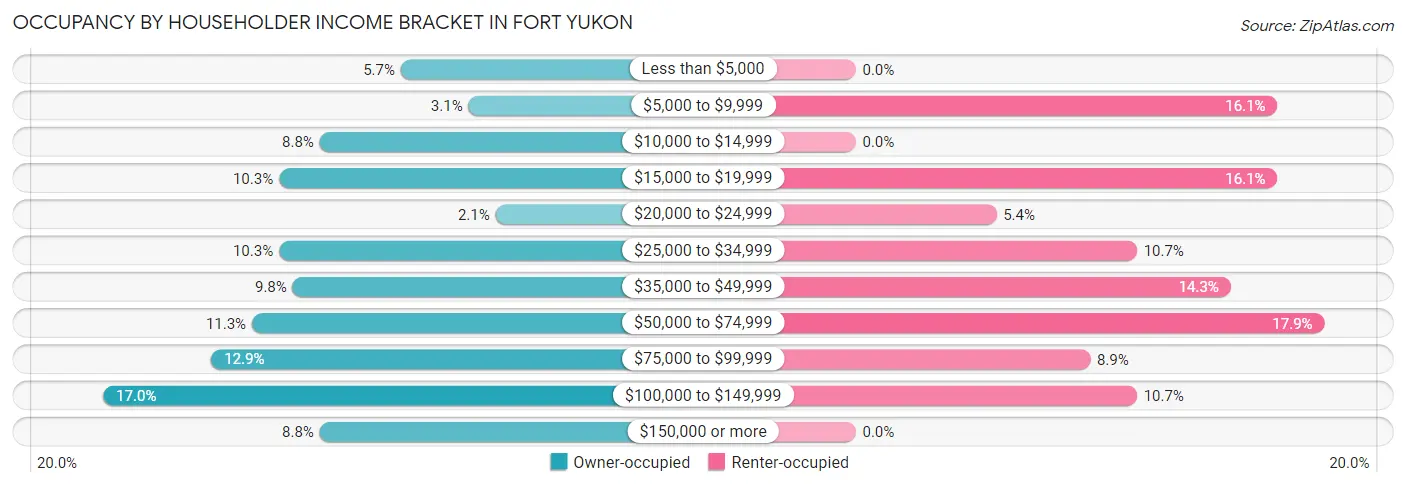
| Income Bracket | Owner-occupied | Renter-occupied |
| Less than $5,000 | 11 (5.7%) | 0 (0.0%) |
| $5,000 to $9,999 | 6 (3.1%) | 9 (16.1%) |
| $10,000 to $14,999 | 17 (8.8%) | 0 (0.0%) |
| $15,000 to $19,999 | 20 (10.3%) | 9 (16.1%) |
| $20,000 to $24,999 | 4 (2.1%) | 3 (5.4%) |
| $25,000 to $34,999 | 20 (10.3%) | 6 (10.7%) |
| $35,000 to $49,999 | 19 (9.8%) | 8 (14.3%) |
| $50,000 to $74,999 | 22 (11.3%) | 10 (17.9%) |
| $75,000 to $99,999 | 25 (12.9%) | 5 (8.9%) |
| $100,000 to $149,999 | 33 (17.0%) | 6 (10.7%) |
| $150,000 or more | 17 (8.8%) | 0 (0.0%) |
| Total | 194 (100.0%) | 56 (100.0%) |
Monthly Housing Cost Tiers in Fort Yukon
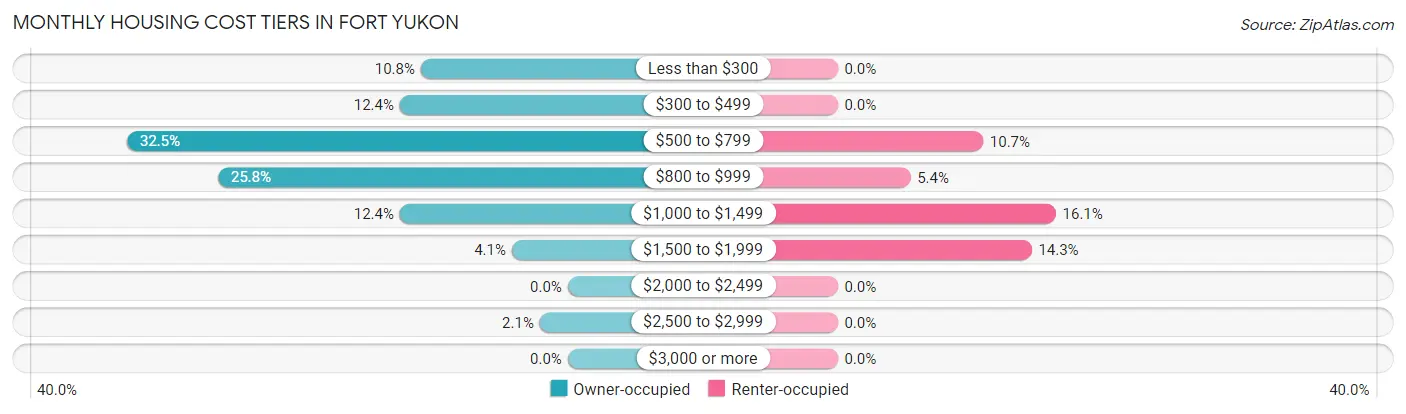
| Monthly Cost | Owner-occupied | Renter-occupied |
| Less than $300 | 21 (10.8%) | 0 (0.0%) |
| $300 to $499 | 24 (12.4%) | 0 (0.0%) |
| $500 to $799 | 63 (32.5%) | 6 (10.7%) |
| $800 to $999 | 50 (25.8%) | 3 (5.4%) |
| $1,000 to $1,499 | 24 (12.4%) | 9 (16.1%) |
| $1,500 to $1,999 | 8 (4.1%) | 8 (14.3%) |
| $2,000 to $2,499 | 0 (0.0%) | 0 (0.0%) |
| $2,500 to $2,999 | 4 (2.1%) | 0 (0.0%) |
| $3,000 or more | 0 (0.0%) | 0 (0.0%) |
| Total | 194 (100.0%) | 56 (100.0%) |
Physical Housing Characteristics in Fort Yukon
Housing Structures in Fort Yukon
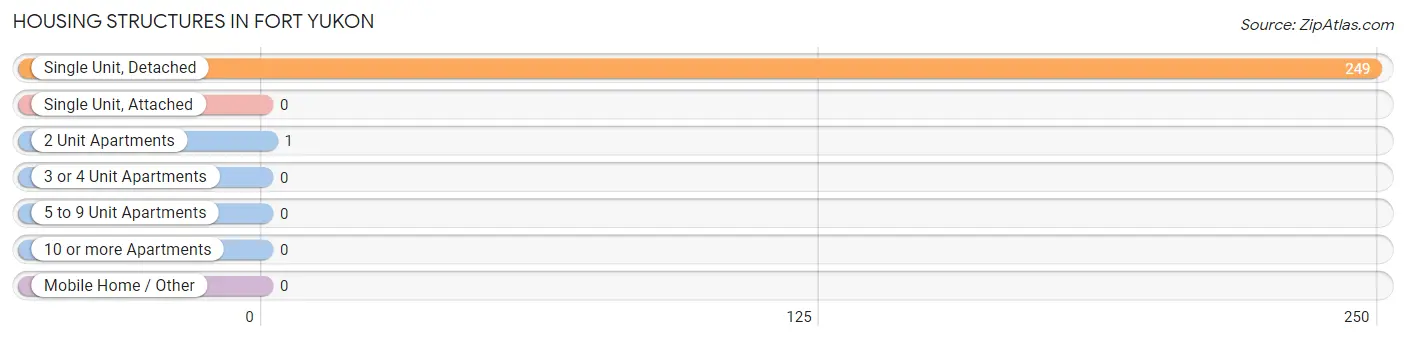
| Structure Type | # Housing Units | % Housing Units |
| Single Unit, Detached | 249 | 99.6% |
| Single Unit, Attached | 0 | 0.0% |
| 2 Unit Apartments | 1 | 0.4% |
| 3 or 4 Unit Apartments | 0 | 0.0% |
| 5 to 9 Unit Apartments | 0 | 0.0% |
| 10 or more Apartments | 0 | 0.0% |
| Mobile Home / Other | 0 | 0.0% |
| Total | 250 | 100.0% |
Housing Structures by Occupancy in Fort Yukon
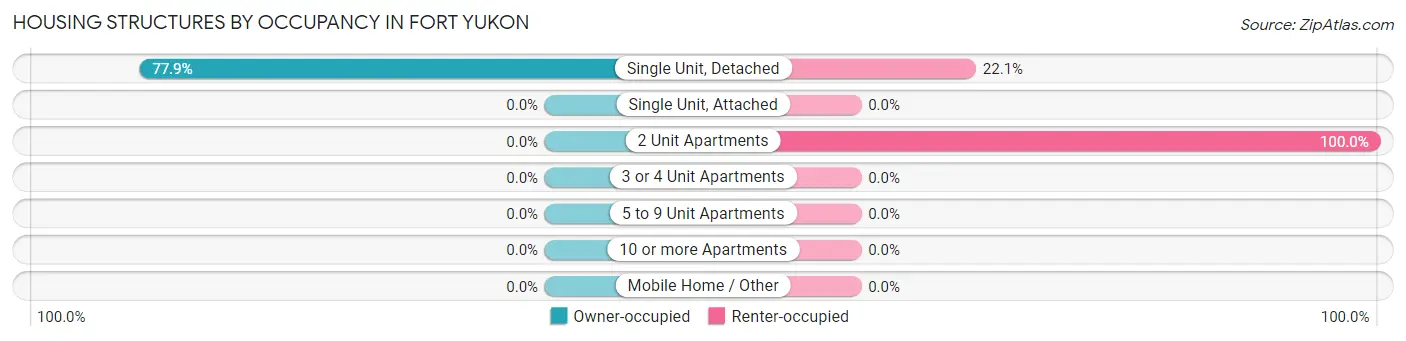
| Structure Type | Owner-occupied | Renter-occupied |
| Single Unit, Detached | 194 (77.9%) | 55 (22.1%) |
| Single Unit, Attached | 0 (0.0%) | 0 (0.0%) |
| 2 Unit Apartments | 0 (0.0%) | 1 (100.0%) |
| 3 or 4 Unit Apartments | 0 (0.0%) | 0 (0.0%) |
| 5 to 9 Unit Apartments | 0 (0.0%) | 0 (0.0%) |
| 10 or more Apartments | 0 (0.0%) | 0 (0.0%) |
| Mobile Home / Other | 0 (0.0%) | 0 (0.0%) |
| Total | 194 (77.6%) | 56 (22.4%) |
Housing Structures by Number of Rooms in Fort Yukon
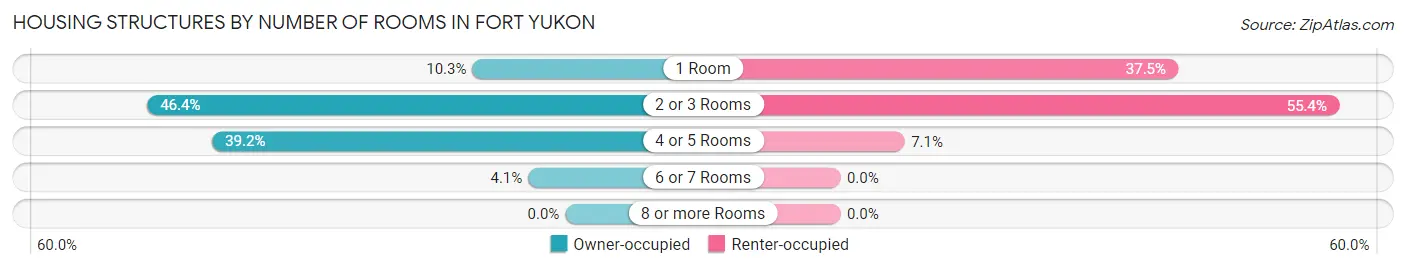
| Number of Rooms | Owner-occupied | Renter-occupied |
| 1 Room | 20 (10.3%) | 21 (37.5%) |
| 2 or 3 Rooms | 90 (46.4%) | 31 (55.4%) |
| 4 or 5 Rooms | 76 (39.2%) | 4 (7.1%) |
| 6 or 7 Rooms | 8 (4.1%) | 0 (0.0%) |
| 8 or more Rooms | 0 (0.0%) | 0 (0.0%) |
| Total | 194 (100.0%) | 56 (100.0%) |
Housing Structure by Heating Type in Fort Yukon
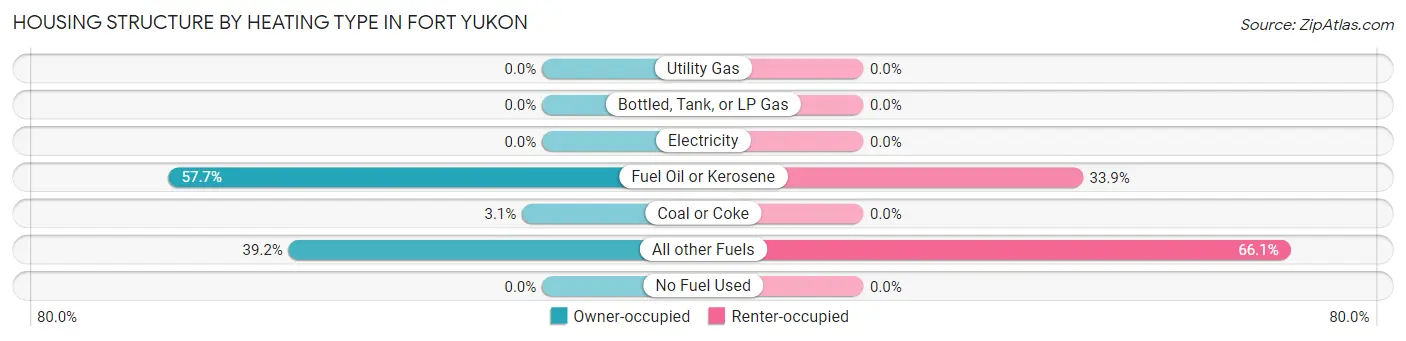
| Heating Type | Owner-occupied | Renter-occupied |
| Utility Gas | 0 (0.0%) | 0 (0.0%) |
| Bottled, Tank, or LP Gas | 0 (0.0%) | 0 (0.0%) |
| Electricity | 0 (0.0%) | 0 (0.0%) |
| Fuel Oil or Kerosene | 112 (57.7%) | 19 (33.9%) |
| Coal or Coke | 6 (3.1%) | 0 (0.0%) |
| All other Fuels | 76 (39.2%) | 37 (66.1%) |
| No Fuel Used | 0 (0.0%) | 0 (0.0%) |
| Total | 194 (100.0%) | 56 (100.0%) |
Household Vehicle Usage in Fort Yukon
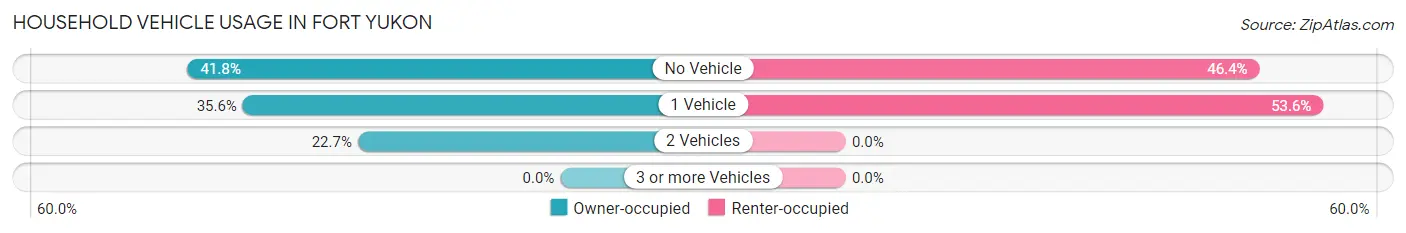
| Vehicles per Household | Owner-occupied | Renter-occupied |
| No Vehicle | 81 (41.7%) | 26 (46.4%) |
| 1 Vehicle | 69 (35.6%) | 30 (53.6%) |
| 2 Vehicles | 44 (22.7%) | 0 (0.0%) |
| 3 or more Vehicles | 0 (0.0%) | 0 (0.0%) |
| Total | 194 (100.0%) | 56 (100.0%) |
Real Estate & Mortgages in Fort Yukon
Real Estate and Mortgage Overview in Fort Yukon
| Characteristic | Without Mortgage | With Mortgage |
| Housing Units | 153 | 41 |
| Median Property Value | $98,500 | $148,600 |
| Median Household Income | $39,306 | $0 |
| Monthly Housing Costs | $637 | $0 |
| Real Estate Taxes | - | - |
Property Value by Mortgage Status in Fort Yukon
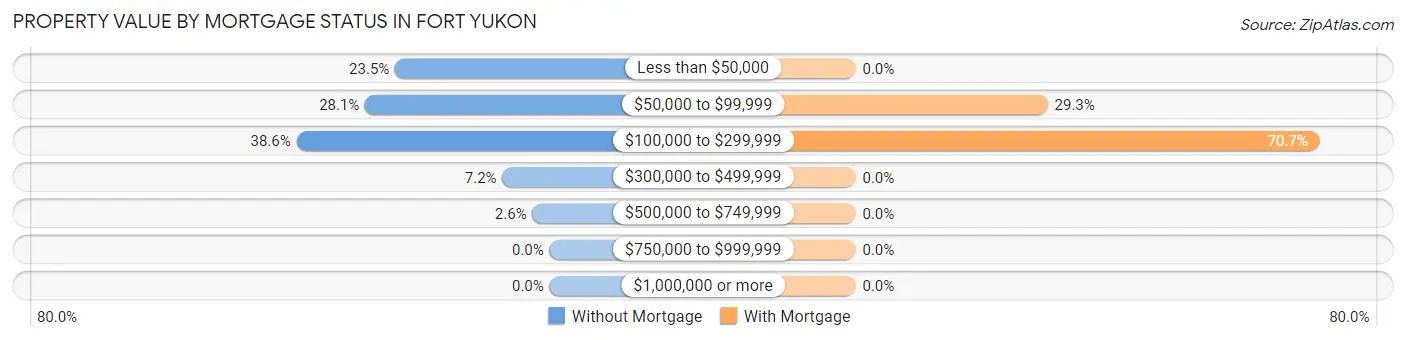
| Property Value | Without Mortgage | With Mortgage |
| Less than $50,000 | 36 (23.5%) | 0 (0.0%) |
| $50,000 to $99,999 | 43 (28.1%) | 12 (29.3%) |
| $100,000 to $299,999 | 59 (38.6%) | 29 (70.7%) |
| $300,000 to $499,999 | 11 (7.2%) | 0 (0.0%) |
| $500,000 to $749,999 | 4 (2.6%) | 0 (0.0%) |
| $750,000 to $999,999 | 0 (0.0%) | 0 (0.0%) |
| $1,000,000 or more | 0 (0.0%) | 0 (0.0%) |
| Total | 153 (100.0%) | 41 (100.0%) |
Household Income by Mortgage Status in Fort Yukon
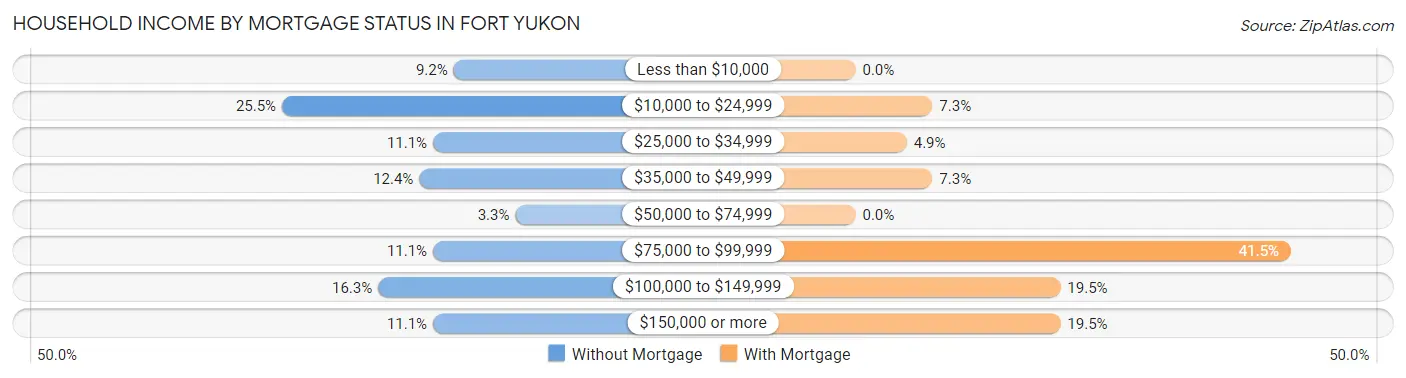
| Household Income | Without Mortgage | With Mortgage |
| Less than $10,000 | 14 (9.1%) | 0 (0.0%) |
| $10,000 to $24,999 | 39 (25.5%) | 3 (7.3%) |
| $25,000 to $34,999 | 17 (11.1%) | 2 (4.9%) |
| $35,000 to $49,999 | 19 (12.4%) | 3 (7.3%) |
| $50,000 to $74,999 | 5 (3.3%) | 0 (0.0%) |
| $75,000 to $99,999 | 17 (11.1%) | 17 (41.5%) |
| $100,000 to $149,999 | 25 (16.3%) | 8 (19.5%) |
| $150,000 or more | 17 (11.1%) | 8 (19.5%) |
| Total | 153 (100.0%) | 41 (100.0%) |
Property Value to Household Income Ratio in Fort Yukon
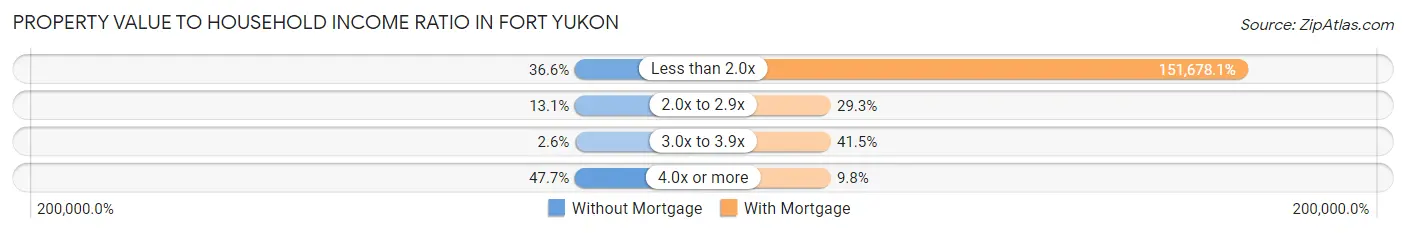
| Value-to-Income Ratio | Without Mortgage | With Mortgage |
| Less than 2.0x | 56 (36.6%) | 62,188 (151,678.1%) |
| 2.0x to 2.9x | 20 (13.1%) | 12 (29.3%) |
| 3.0x to 3.9x | 4 (2.6%) | 17 (41.5%) |
| 4.0x or more | 73 (47.7%) | 4 (9.8%) |
| Total | 153 (100.0%) | 41 (100.0%) |
Real Estate Taxes by Mortgage Status in Fort Yukon
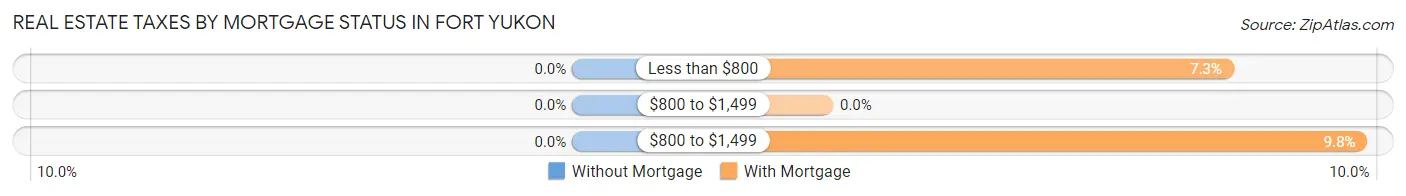
| Property Taxes | Without Mortgage | With Mortgage |
| Less than $800 | 0 (0.0%) | 3 (7.3%) |
| $800 to $1,499 | 0 (0.0%) | 0 (0.0%) |
| $800 to $1,499 | 0 (0.0%) | 4 (9.8%) |
| Total | 153 (100.0%) | 41 (100.0%) |
Health & Disability in Fort Yukon
Health Insurance Coverage by Age in Fort Yukon
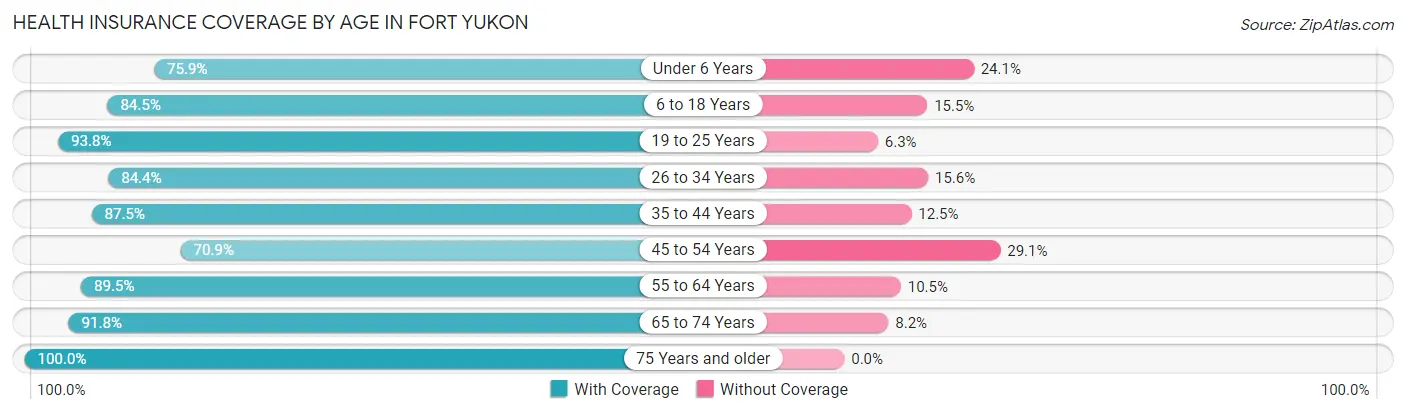
| Age Bracket | With Coverage | Without Coverage |
| Under 6 Years | 22 (75.9%) | 7 (24.1%) |
| 6 to 18 Years | 82 (84.5%) | 15 (15.5%) |
| 19 to 25 Years | 15 (93.8%) | 1 (6.2%) |
| 26 to 34 Years | 27 (84.4%) | 5 (15.6%) |
| 35 to 44 Years | 56 (87.5%) | 8 (12.5%) |
| 45 to 54 Years | 39 (70.9%) | 16 (29.1%) |
| 55 to 64 Years | 51 (89.5%) | 6 (10.5%) |
| 65 to 74 Years | 67 (91.8%) | 6 (8.2%) |
| 75 Years and older | 42 (100.0%) | 0 (0.0%) |
| Total | 401 (86.2%) | 64 (13.8%) |
Health Insurance Coverage by Citizenship Status in Fort Yukon
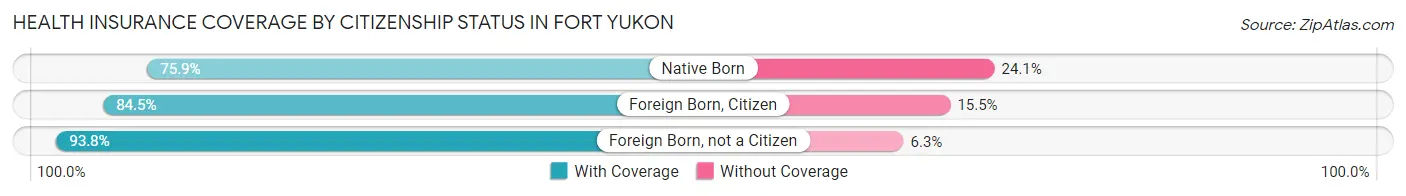
| Citizenship Status | With Coverage | Without Coverage |
| Native Born | 22 (75.9%) | 7 (24.1%) |
| Foreign Born, Citizen | 82 (84.5%) | 15 (15.5%) |
| Foreign Born, not a Citizen | 15 (93.8%) | 1 (6.2%) |
Health Insurance Coverage by Household Income in Fort Yukon
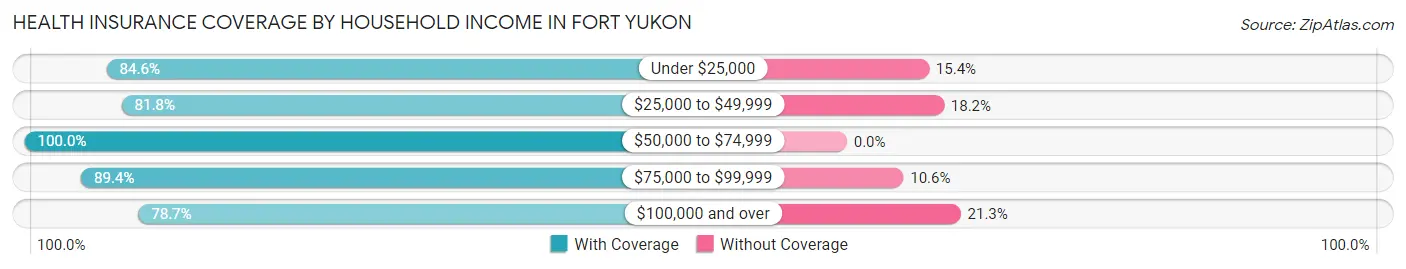
| Household Income | With Coverage | Without Coverage |
| Under $25,000 | 77 (84.6%) | 14 (15.4%) |
| $25,000 to $49,999 | 54 (81.8%) | 12 (18.2%) |
| $50,000 to $74,999 | 76 (100.0%) | 0 (0.0%) |
| $75,000 to $99,999 | 76 (89.4%) | 9 (10.6%) |
| $100,000 and over | 107 (78.7%) | 29 (21.3%) |
Public vs Private Health Insurance Coverage by Age in Fort Yukon
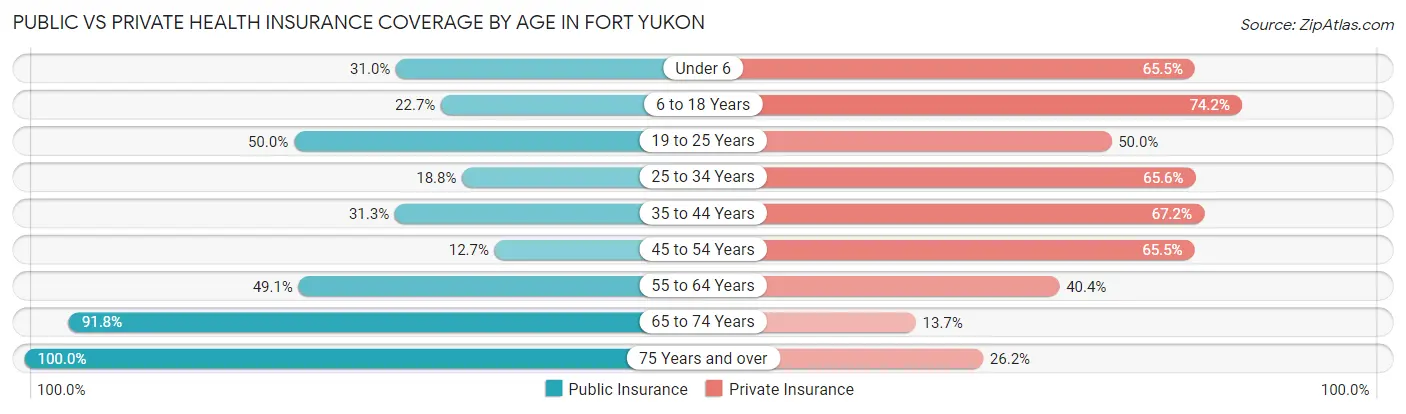
| Age Bracket | Public Insurance | Private Insurance |
| Under 6 | 9 (31.0%) | 19 (65.5%) |
| 6 to 18 Years | 22 (22.7%) | 72 (74.2%) |
| 19 to 25 Years | 8 (50.0%) | 8 (50.0%) |
| 25 to 34 Years | 6 (18.8%) | 21 (65.6%) |
| 35 to 44 Years | 20 (31.2%) | 43 (67.2%) |
| 45 to 54 Years | 7 (12.7%) | 36 (65.4%) |
| 55 to 64 Years | 28 (49.1%) | 23 (40.4%) |
| 65 to 74 Years | 67 (91.8%) | 10 (13.7%) |
| 75 Years and over | 42 (100.0%) | 11 (26.2%) |
| Total | 209 (45.0%) | 243 (52.3%) |
Disability Status by Sex by Age in Fort Yukon
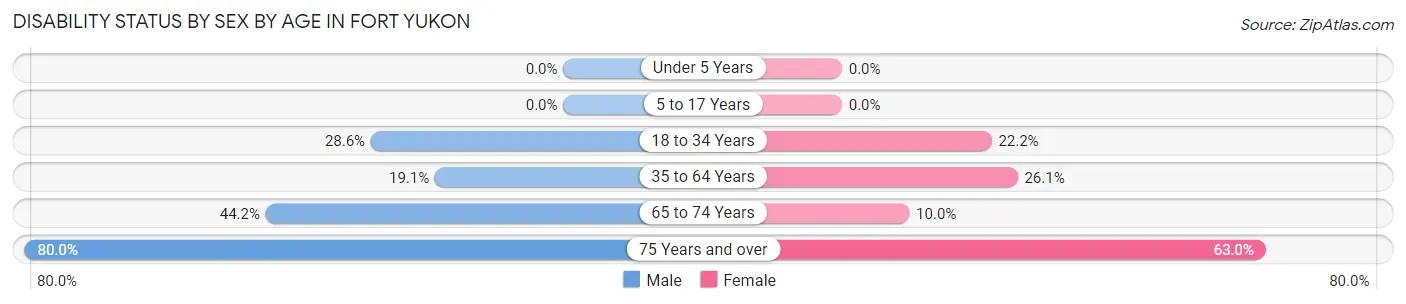
| Age Bracket | Male | Female |
| Under 5 Years | 0 (0.0%) | 0 (0.0%) |
| 5 to 17 Years | 0 (0.0%) | 0 (0.0%) |
| 18 to 34 Years | 6 (28.6%) | 6 (22.2%) |
| 35 to 64 Years | 16 (19.1%) | 24 (26.1%) |
| 65 to 74 Years | 19 (44.2%) | 3 (10.0%) |
| 75 Years and over | 12 (80.0%) | 17 (63.0%) |
Disability Class by Sex by Age in Fort Yukon
Disability Class: Hearing Difficulty
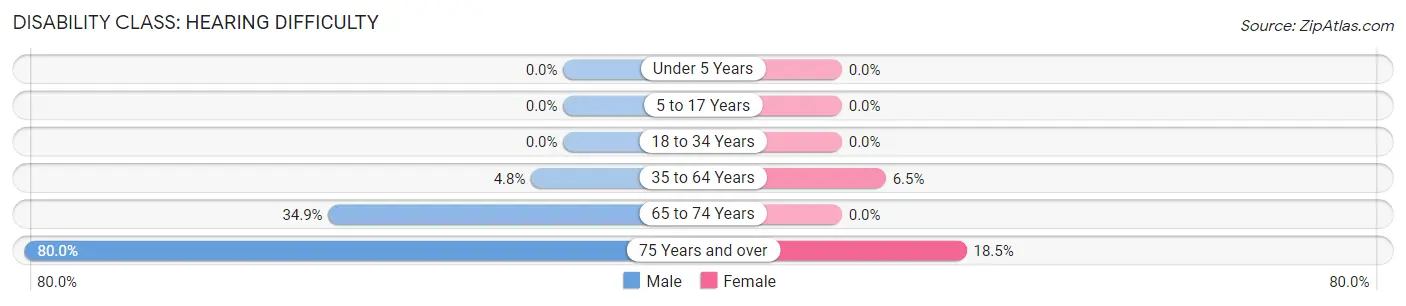
| Age Bracket | Male | Female |
| Under 5 Years | 0 (0.0%) | 0 (0.0%) |
| 5 to 17 Years | 0 (0.0%) | 0 (0.0%) |
| 18 to 34 Years | 0 (0.0%) | 0 (0.0%) |
| 35 to 64 Years | 4 (4.8%) | 6 (6.5%) |
| 65 to 74 Years | 15 (34.9%) | 0 (0.0%) |
| 75 Years and over | 12 (80.0%) | 5 (18.5%) |
Disability Class: Vision Difficulty
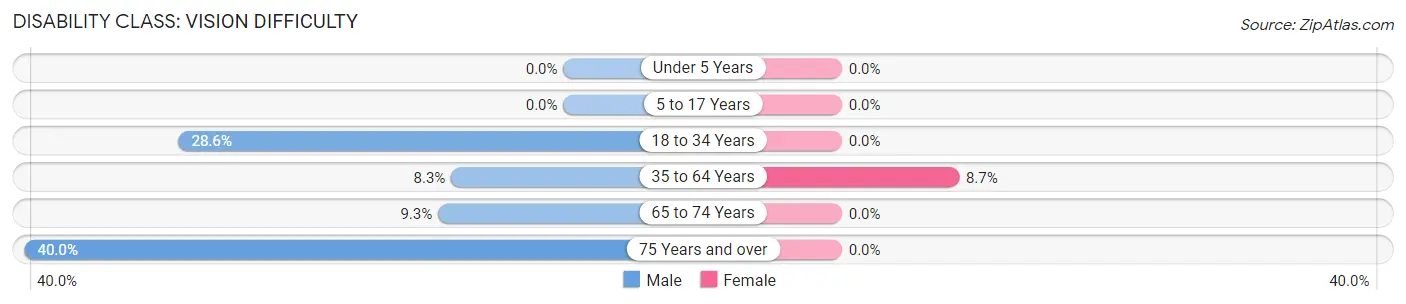
| Age Bracket | Male | Female |
| Under 5 Years | 0 (0.0%) | 0 (0.0%) |
| 5 to 17 Years | 0 (0.0%) | 0 (0.0%) |
| 18 to 34 Years | 6 (28.6%) | 0 (0.0%) |
| 35 to 64 Years | 7 (8.3%) | 8 (8.7%) |
| 65 to 74 Years | 4 (9.3%) | 0 (0.0%) |
| 75 Years and over | 6 (40.0%) | 0 (0.0%) |
Disability Class: Cognitive Difficulty
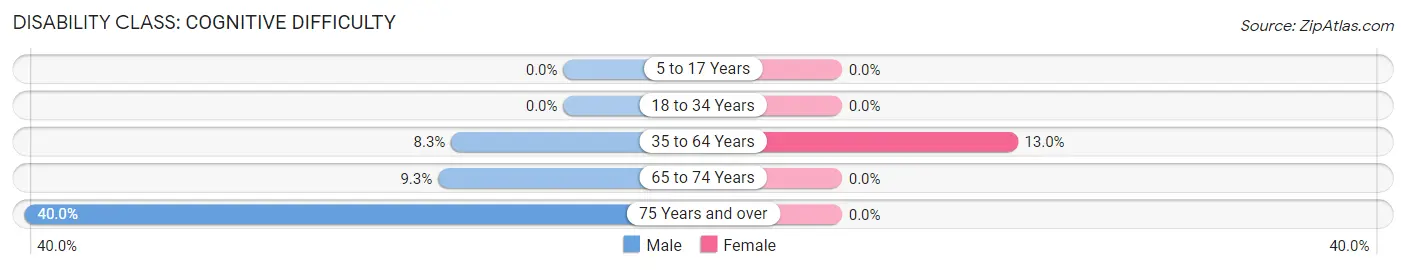
| Age Bracket | Male | Female |
| 5 to 17 Years | 0 (0.0%) | 0 (0.0%) |
| 18 to 34 Years | 0 (0.0%) | 0 (0.0%) |
| 35 to 64 Years | 7 (8.3%) | 12 (13.0%) |
| 65 to 74 Years | 4 (9.3%) | 0 (0.0%) |
| 75 Years and over | 6 (40.0%) | 0 (0.0%) |
Disability Class: Ambulatory Difficulty
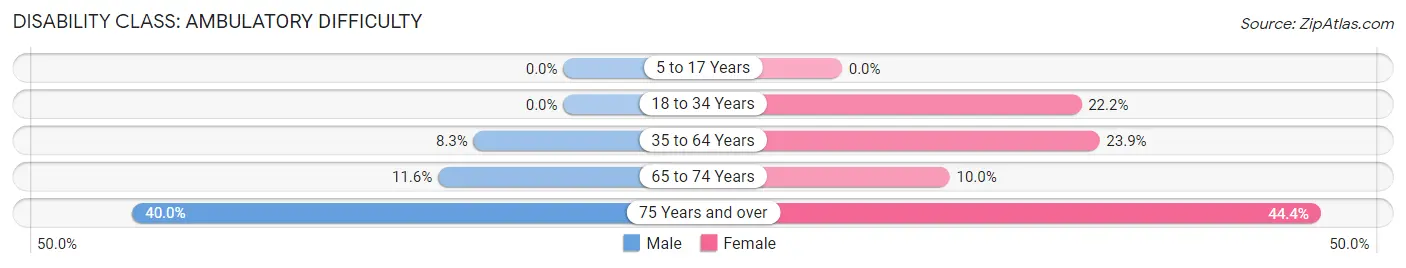
| Age Bracket | Male | Female |
| 5 to 17 Years | 0 (0.0%) | 0 (0.0%) |
| 18 to 34 Years | 0 (0.0%) | 6 (22.2%) |
| 35 to 64 Years | 7 (8.3%) | 22 (23.9%) |
| 65 to 74 Years | 5 (11.6%) | 3 (10.0%) |
| 75 Years and over | 6 (40.0%) | 12 (44.4%) |
Disability Class: Self-Care Difficulty
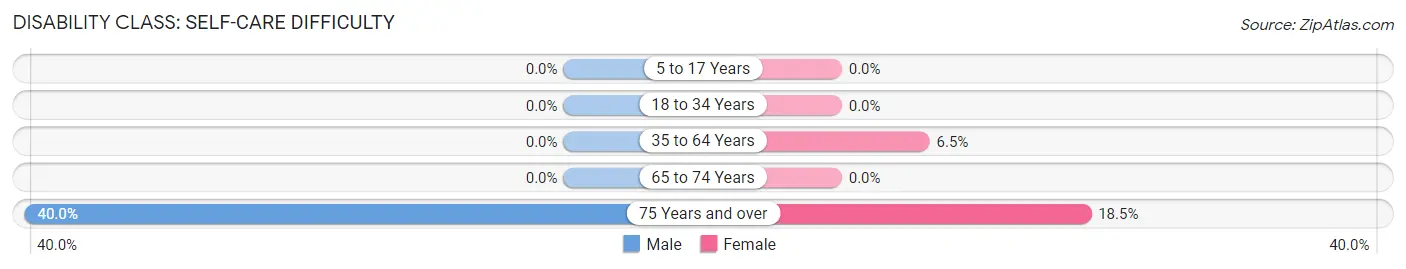
| Age Bracket | Male | Female |
| 5 to 17 Years | 0 (0.0%) | 0 (0.0%) |
| 18 to 34 Years | 0 (0.0%) | 0 (0.0%) |
| 35 to 64 Years | 0 (0.0%) | 6 (6.5%) |
| 65 to 74 Years | 0 (0.0%) | 0 (0.0%) |
| 75 Years and over | 6 (40.0%) | 5 (18.5%) |
Technology Access in Fort Yukon
Computing Device Access in Fort Yukon
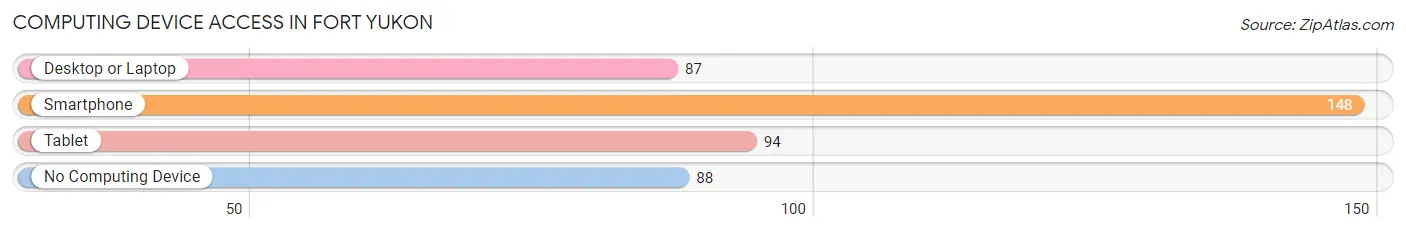
| Device Type | # Households | % Households |
| Desktop or Laptop | 87 | 34.8% |
| Smartphone | 148 | 59.2% |
| Tablet | 94 | 37.6% |
| No Computing Device | 88 | 35.2% |
| Total | 250 | 100.0% |
Internet Access in Fort Yukon
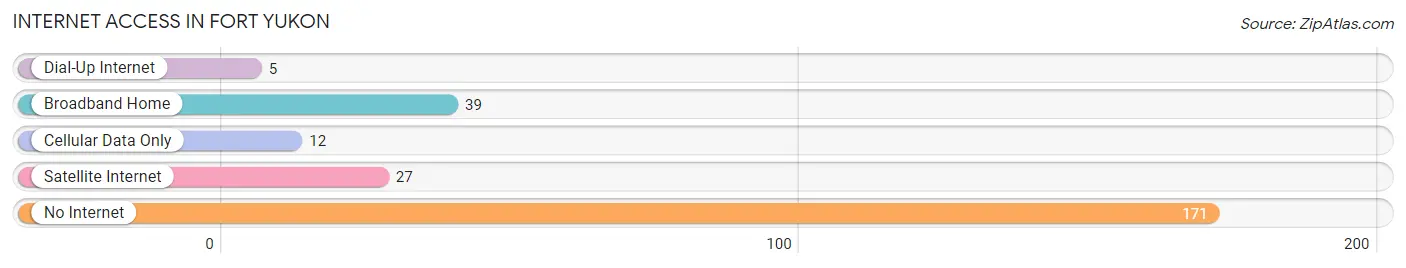
| Internet Type | # Households | % Households |
| Dial-Up Internet | 5 | 2.0% |
| Broadband Home | 39 | 15.6% |
| Cellular Data Only | 12 | 4.8% |
| Satellite Internet | 27 | 10.8% |
| No Internet | 171 | 68.4% |
| Total | 250 | 100.0% |
Fort Yukon Summary
History
Fort Yukon is a city located in the Yukon-Koyukuk Census Area of Alaska. It is situated at the confluence of the Yukon and Porcupine Rivers, and is the largest community in the area. The city was originally inhabited by the Gwich’in people, who have lived in the area for thousands of years. The first Europeans to visit the area were Russian fur traders in the late 18th century. The area was later explored by British and American explorers in the 19th century.
In 1847, the Hudson’s Bay Company established a trading post at the site of present-day Fort Yukon. The post was named after the nearby Yukon River. The post was used as a trading center for the Gwich’in people, who traded furs and other goods with the traders. In 1869, the United States purchased Alaska from Russia, and the area became part of the United States.
In 1885, the United States Army established a military post at the site of present-day Fort Yukon. The post was named Fort Yukon, and was used to protect the area from Canadian and Native American incursions. The post was abandoned in 1891, but was re-established in 1898. The post was used to protect the area from gold miners and other settlers.
In the early 20th century, Fort Yukon became a center for the fur trade. The city was also a supply center for miners and trappers in the area. In the 1950s, the city began to develop as a transportation hub, with the construction of an airport and a road connecting the city to Fairbanks.
Geography
Fort Yukon is located in the Yukon-Koyukuk Census Area of Alaska. It is situated at the confluence of the Yukon and Porcupine Rivers, and is the largest community in the area. The city is located at an elevation of approximately 200 feet above sea level. The climate in the area is subarctic, with cold winters and mild summers.
The city is surrounded by boreal forest, and is home to a variety of wildlife, including moose, caribou, wolves, and bears. The Porcupine River is a major source of fish, and is a popular destination for sport fishing.
Economy
The economy of Fort Yukon is largely based on subsistence activities, such as hunting, fishing, and trapping. The city is also a center for the fur trade, and is home to several fur trading companies. The city is also a transportation hub, with an airport and a road connecting the city to Fairbanks.
The city is home to several businesses, including a grocery store, a hardware store, and a restaurant. The city is also home to a post office, a bank, and a library.
Demographics
As of the 2010 census, the population of Fort Yukon was 862. The population is largely Native American, with the majority of the population being of Gwich’in descent. The city is also home to a small population of non-Native Americans. The median age in the city is 33.7 years, and the median household income is $41,250.
Common Questions
What is Per Capita Income in Fort Yukon?
Per Capita income in Fort Yukon is $31,460.
What is the Median Family Income in Fort Yukon?
Median Family Income in Fort Yukon is $81,875.
What is the Median Household income in Fort Yukon?
Median Household Income in Fort Yukon is $46,250.
What is Income or Wage Gap in Fort Yukon?
Income or Wage Gap in Fort Yukon is 24.7%.
Women in Fort Yukon earn 75.3 cents for every dollar earned by a man.
What is Inequality or Gini Index in Fort Yukon?
Inequality or Gini Index in Fort Yukon is 0.45.
What is the Total Population of Fort Yukon?
Total Population of Fort Yukon is 476.
What is the Total Male Population of Fort Yukon?
Total Male Population of Fort Yukon is 221.
What is the Total Female Population of Fort Yukon?
Total Female Population of Fort Yukon is 255.
What is the Ratio of Males per 100 Females in Fort Yukon?
There are 86.67 Males per 100 Females in Fort Yukon.
What is the Ratio of Females per 100 Males in Fort Yukon?
There are 115.38 Females per 100 Males in Fort Yukon.
What is the Median Population Age in Fort Yukon?
Median Population Age in Fort Yukon is 43.7 Years.
What is the Average Family Size in Fort Yukon
Average Family Size in Fort Yukon is 2.6 People.
What is the Average Household Size in Fort Yukon
Average Household Size in Fort Yukon is 1.8 People.
How Large is the Labor Force in Fort Yukon?
There are 219 People in the Labor Forcein in Fort Yukon.
What is the Percentage of People in the Labor Force in Fort Yukon?
60.0% of People are in the Labor Force in Fort Yukon.
What is the Unemployment Rate in Fort Yukon?
Unemployment Rate in Fort Yukon is 24.5%.