Ester, AK Map & Demographics
Ester Map
Ester Overview
$42,150
PER CAPITA INCOME
$74,278
AVG FAMILY INCOME
$72,917
AVG HOUSEHOLD INCOME
15.3%
WAGE / INCOME GAP [ % ]
84.7¢/ $1
WAGE / INCOME GAP [ $ ]
0.39
INEQUALITY / GINI INDEX
2,989
TOTAL POPULATION
1,851
MALE POPULATION
1,138
FEMALE POPULATION
162.65
MALES / 100 FEMALES
61.48
FEMALES / 100 MALES
38.8
MEDIAN AGE
2.6
AVG FAMILY SIZE
2.1
AVG HOUSEHOLD SIZE
1,656
LABOR FORCE [ PEOPLE ]
62.6%
PERCENT IN LABOR FORCE
3.5%
UNEMPLOYMENT RATE
Ester Zip Codes
Ester Area Codes
Income in Ester
Income Overview in Ester
Per Capita Income in Ester is $42,150, while median incomes of families and households are $74,278 and $72,917 respectively.
| Characteristic | Number | Measure |
| Per Capita Income | 2,989 | $42,150 |
| Median Family Income | 754 | $74,278 |
| Mean Family Income | 754 | $121,802 |
| Median Household Income | 1,368 | $72,917 |
| Mean Household Income | 1,368 | $92,495 |
| Income Deficit | 754 | $0 |
| Wage / Income Gap (%) | 2,989 | 15.29% |
| Wage / Income Gap ($) | 2,989 | 84.71¢ per $1 |
| Gini / Inequality Index | 2,989 | 0.39 |
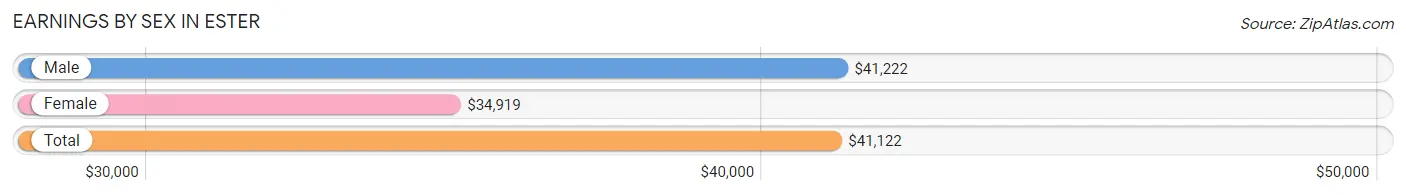
Earnings by Sex in Ester
Average Earnings in Ester are $41,122, $41,222 for men and $34,919 for women, a difference of 15.3%.
| Sex | Number | Average Earnings |
| Male | 962 (52.5%) | $41,222 |
| Female | 869 (47.5%) | $34,919 |
| Total | 1,831 (100.0%) | $41,122 |
Earnings by Sex by Income Bracket in Ester
The most common earnings brackets in Ester are $100,000+ for men (178 | 18.5%) and $55,000 to $64,999 for women (170 | 19.6%).
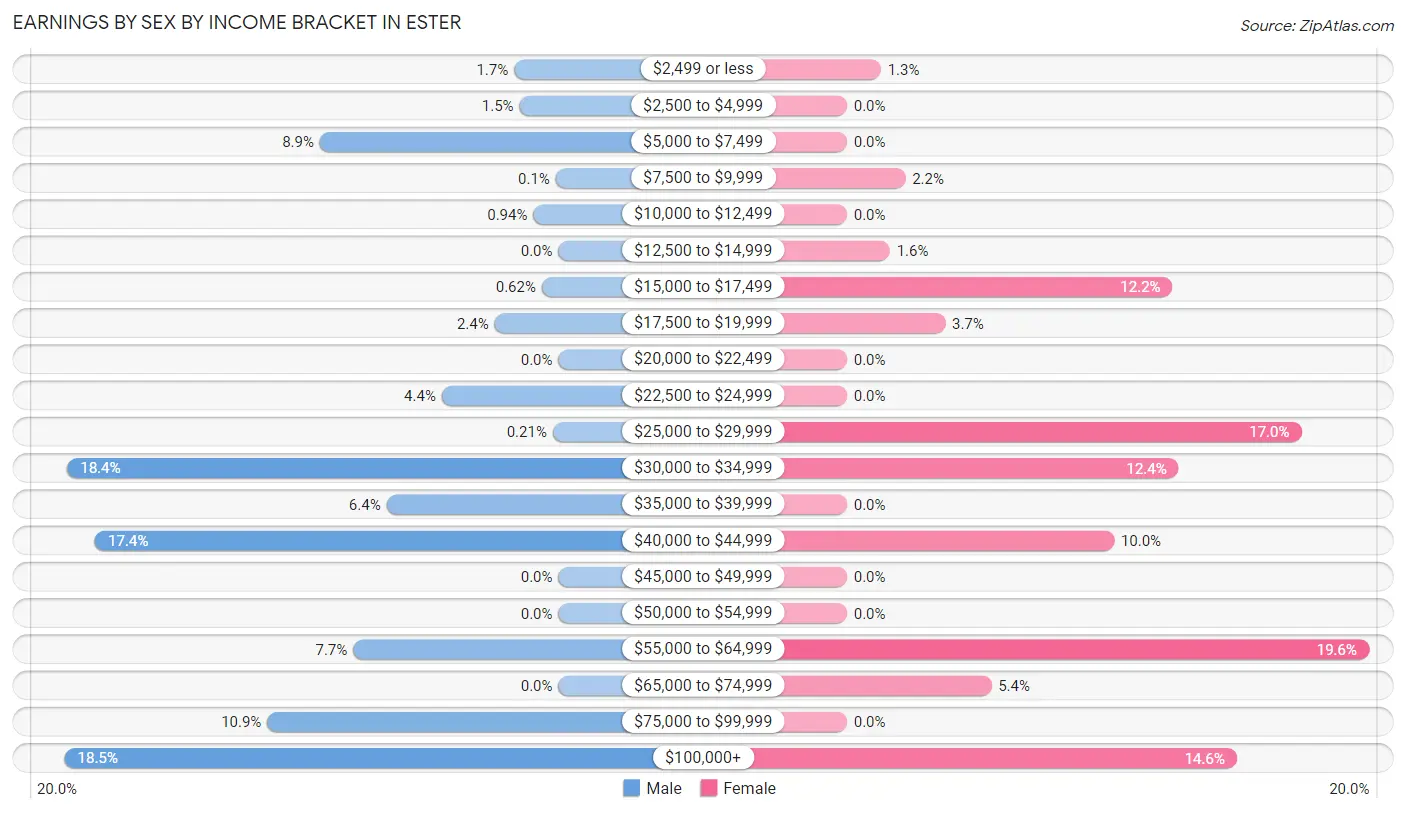
| Income | Male | Female |
| $2,499 or less | 16 (1.7%) | 11 (1.3%) |
| $2,500 to $4,999 | 14 (1.5%) | 0 (0.0%) |
| $5,000 to $7,499 | 86 (8.9%) | 0 (0.0%) |
| $7,500 to $9,999 | 1 (0.1%) | 19 (2.2%) |
| $10,000 to $12,499 | 9 (0.9%) | 0 (0.0%) |
| $12,500 to $14,999 | 0 (0.0%) | 14 (1.6%) |
| $15,000 to $17,499 | 6 (0.6%) | 106 (12.2%) |
| $17,500 to $19,999 | 23 (2.4%) | 32 (3.7%) |
| $20,000 to $22,499 | 0 (0.0%) | 0 (0.0%) |
| $22,500 to $24,999 | 42 (4.4%) | 0 (0.0%) |
| $25,000 to $29,999 | 2 (0.2%) | 148 (17.0%) |
| $30,000 to $34,999 | 177 (18.4%) | 108 (12.4%) |
| $35,000 to $39,999 | 62 (6.4%) | 0 (0.0%) |
| $40,000 to $44,999 | 167 (17.4%) | 87 (10.0%) |
| $45,000 to $49,999 | 0 (0.0%) | 0 (0.0%) |
| $50,000 to $54,999 | 0 (0.0%) | 0 (0.0%) |
| $55,000 to $64,999 | 74 (7.7%) | 170 (19.6%) |
| $65,000 to $74,999 | 0 (0.0%) | 47 (5.4%) |
| $75,000 to $99,999 | 105 (10.9%) | 0 (0.0%) |
| $100,000+ | 178 (18.5%) | 127 (14.6%) |
| Total | 962 (100.0%) | 869 (100.0%) |
Earnings by Sex by Educational Attainment in Ester
Average earnings in Ester are $40,187 for men and $42,687 for women, a difference of 5.9%. Men with an educational attainment of college or associate's degree enjoy the highest average annual earnings of $41,121, while those with less than high school education earn the least with $5,901. Women with an educational attainment of graduate degree earn the most with the average annual earnings of $112,702, while those with high school diploma education have the smallest earnings of $28,206.
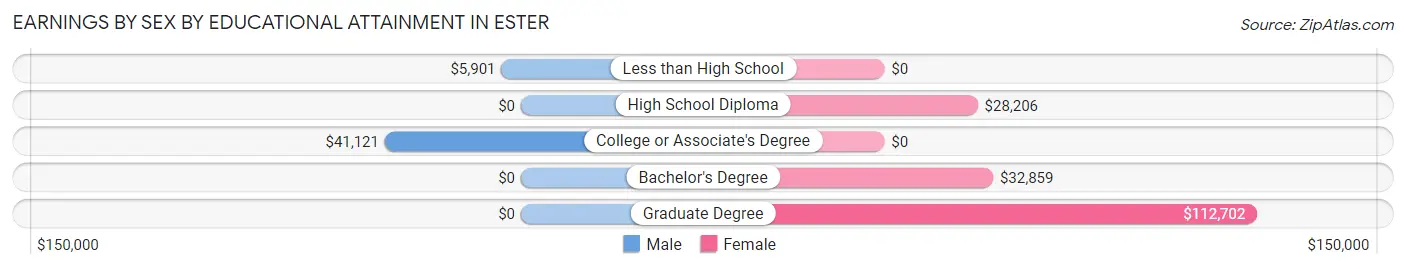
| Educational Attainment | Male Income | Female Income |
| Less than High School | $5,901 | $0 |
| High School Diploma | - | - |
| College or Associate's Degree | $41,121 | $0 |
| Bachelor's Degree | - | - |
| Graduate Degree | - | - |
| Total | $40,187 | $42,687 |
Family Income in Ester
Family Income Brackets in Ester
According to the Ester family income data, there are 343 families falling into the $50,000 to $74,999 income range, which is the most common income bracket and makes up 45.5% of all families.
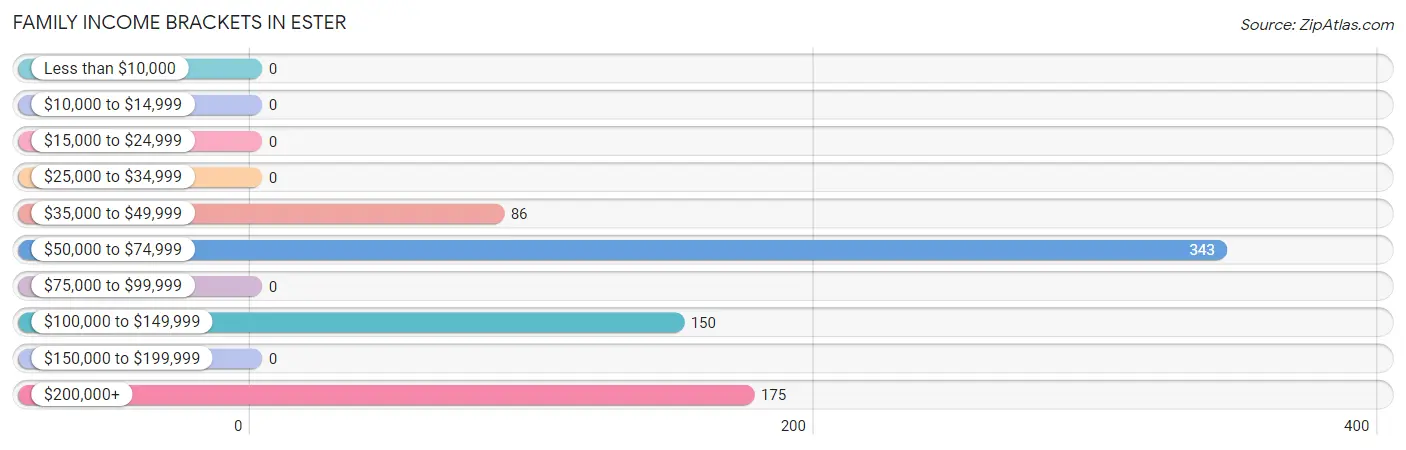
| Income Bracket | # Families | % Families |
| Less than $10,000 | 0 | 0.0% |
| $10,000 to $14,999 | 0 | 0.0% |
| $15,000 to $24,999 | 0 | 0.0% |
| $25,000 to $34,999 | 0 | 0.0% |
| $35,000 to $49,999 | 86 | 11.4% |
| $50,000 to $74,999 | 343 | 45.5% |
| $75,000 to $99,999 | 0 | 0.0% |
| $100,000 to $149,999 | 150 | 19.9% |
| $150,000 to $199,999 | 0 | 0.0% |
| $200,000+ | 175 | 23.2% |
Family Income by Famaliy Size in Ester
2-person families (507 | 67.2%) account for the highest median family income in Ester with $73,979 per family, while 2-person families (507 | 67.2%) have the highest median income of $36,990 per family member.
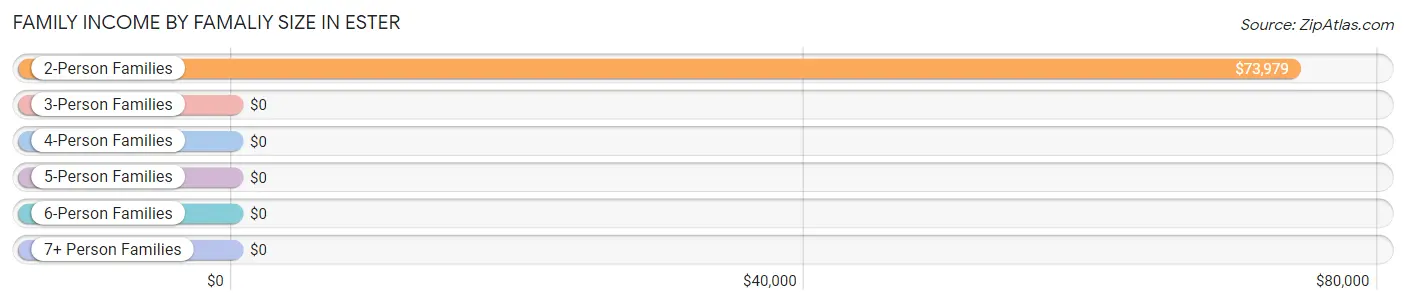
| Income Bracket | # Families | Median Income |
| 2-Person Families | 507 (67.2%) | $73,979 |
| 3-Person Families | 137 (18.2%) | $0 |
| 4-Person Families | 5 (0.7%) | $0 |
| 5-Person Families | 105 (13.9%) | $0 |
| 6-Person Families | 0 (0.0%) | $0 |
| 7+ Person Families | 0 (0.0%) | $0 |
| Total | 754 (100.0%) | $74,278 |
Family Income by Number of Earners in Ester
| Number of Earners | # Families | Median Income |
| No Earners | 95 (12.6%) | $0 |
| 1 Earner | 308 (40.8%) | $0 |
| 2 Earners | 346 (45.9%) | $0 |
| 3+ Earners | 5 (0.7%) | $0 |
| Total | 754 (100.0%) | $74,278 |
Household Income in Ester
Household Income Brackets in Ester
With 393 households falling in the category, the $50,000 to $74,999 income range is the most frequent in Ester, accounting for 28.7% of all households.
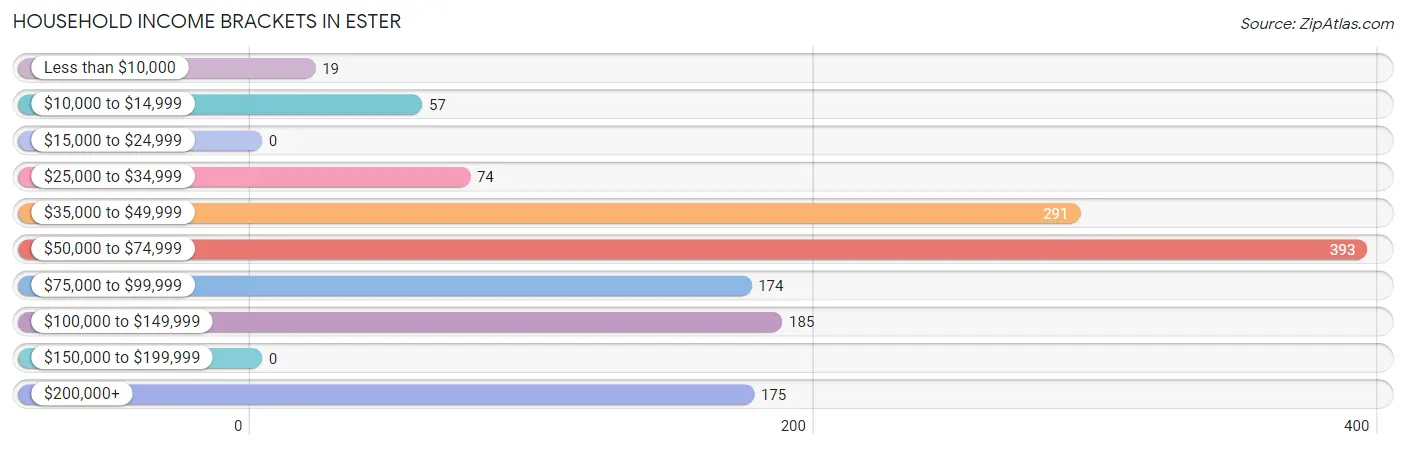
| Income Bracket | # Households | % Households |
| Less than $10,000 | 19 | 1.4% |
| $10,000 to $14,999 | 57 | 4.2% |
| $15,000 to $24,999 | 0 | 0.0% |
| $25,000 to $34,999 | 74 | 5.4% |
| $35,000 to $49,999 | 291 | 21.3% |
| $50,000 to $74,999 | 393 | 28.7% |
| $75,000 to $99,999 | 174 | 12.7% |
| $100,000 to $149,999 | 185 | 13.5% |
| $150,000 to $199,999 | 0 | 0.0% |
| $200,000+ | 175 | 12.8% |
Household Income by Householder Age in Ester
The median household income in Ester is $72,917, with the highest median household income of $71,719 found in the 25 to 44 years age bracket for the primary householder. A total of 498 households (36.4%) fall into this category. Meanwhile, the 15 to 24 years age bracket for the primary householder has the lowest median household income of $0, with 98 households (7.2%) in this group.
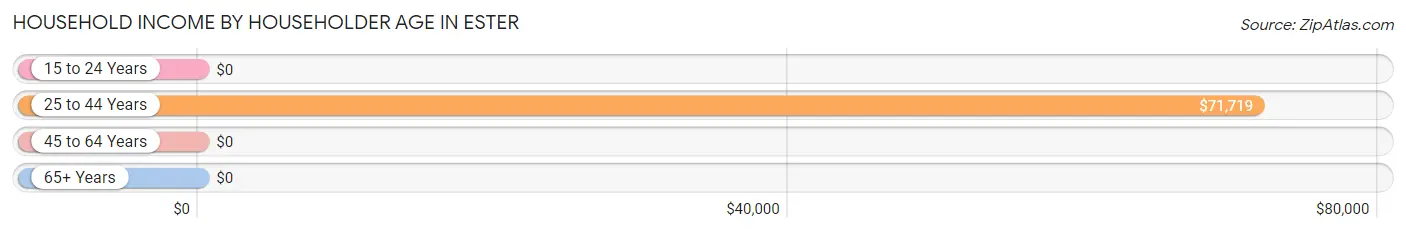
| Income Bracket | # Households | Median Income |
| 15 to 24 Years | 98 (7.2%) | $0 |
| 25 to 44 Years | 498 (36.4%) | $71,719 |
| 45 to 64 Years | 500 (36.5%) | $0 |
| 65+ Years | 272 (19.9%) | $0 |
| Total | 1,368 (100.0%) | $72,917 |
Poverty in Ester
Income Below Poverty by Sex and Age in Ester
With 2.0% poverty level for males and 11.2% for females among the residents of Ester, 35 to 44 year old males and 18 to 24 year old females are the most vulnerable to poverty, with 26 males (13.0%) and 19 females (100.0%) in their respective age groups living below the poverty level.
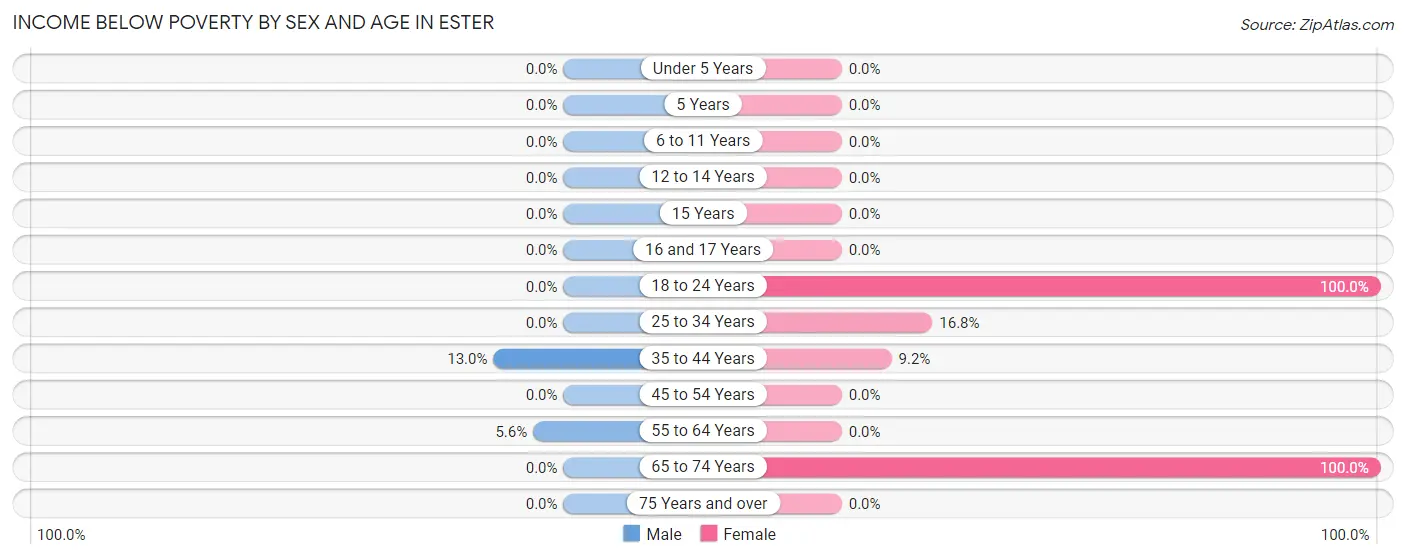
| Age Bracket | Male | Female |
| Under 5 Years | 0 (0.0%) | 0 (0.0%) |
| 5 Years | 0 (0.0%) | 0 (0.0%) |
| 6 to 11 Years | 0 (0.0%) | 0 (0.0%) |
| 12 to 14 Years | 0 (0.0%) | 0 (0.0%) |
| 15 Years | 0 (0.0%) | 0 (0.0%) |
| 16 and 17 Years | 0 (0.0%) | 0 (0.0%) |
| 18 to 24 Years | 0 (0.0%) | 19 (100.0%) |
| 25 to 34 Years | 0 (0.0%) | 40 (16.8%) |
| 35 to 44 Years | 26 (13.0%) | 11 (9.2%) |
| 45 to 54 Years | 0 (0.0%) | 0 (0.0%) |
| 55 to 64 Years | 10 (5.6%) | 0 (0.0%) |
| 65 to 74 Years | 0 (0.0%) | 57 (100.0%) |
| 75 Years and over | 0 (0.0%) | 0 (0.0%) |
| Total | 36 (2.0%) | 127 (11.2%) |
Income Above Poverty by Sex and Age in Ester
According to the poverty statistics in Ester, males aged under 5 years and females aged 12 to 14 years are the age groups that are most secure financially, with 100.0% of males and 100.0% of females in these age groups living above the poverty line.
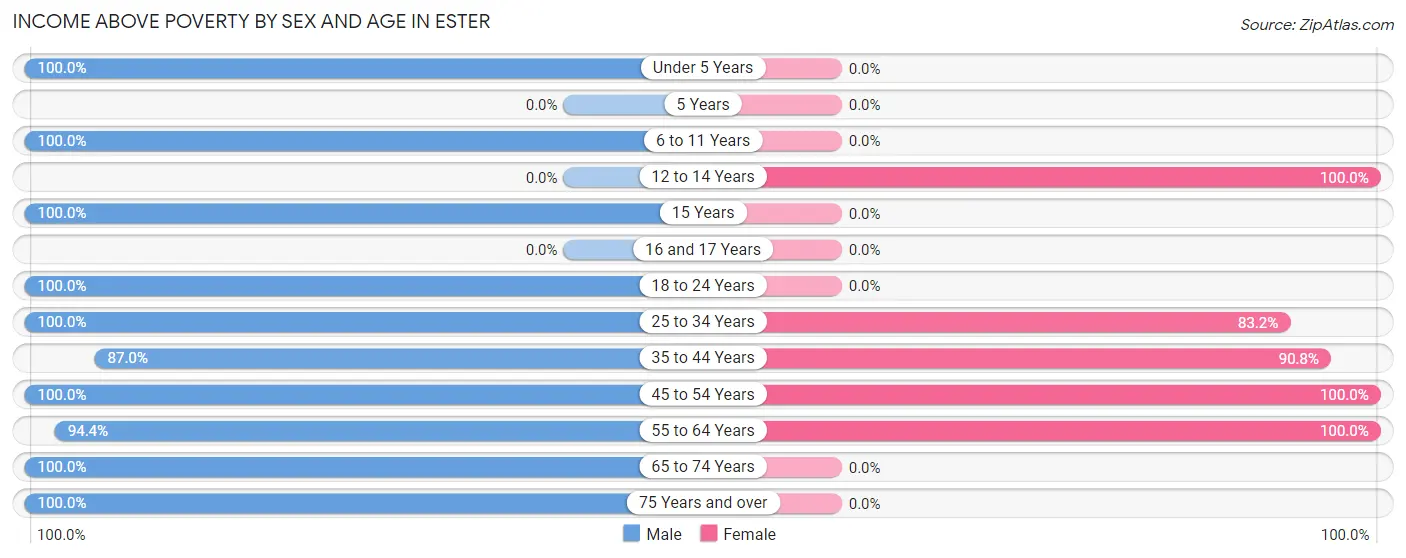
| Age Bracket | Male | Female |
| Under 5 Years | 69 (100.0%) | 0 (0.0%) |
| 5 Years | 0 (0.0%) | 0 (0.0%) |
| 6 to 11 Years | 155 (100.0%) | 0 (0.0%) |
| 12 to 14 Years | 0 (0.0%) | 66 (100.0%) |
| 15 Years | 54 (100.0%) | 0 (0.0%) |
| 16 and 17 Years | 0 (0.0%) | 0 (0.0%) |
| 18 to 24 Years | 174 (100.0%) | 0 (0.0%) |
| 25 to 34 Years | 503 (100.0%) | 198 (83.2%) |
| 35 to 44 Years | 174 (87.0%) | 108 (90.8%) |
| 45 to 54 Years | 215 (100.0%) | 286 (100.0%) |
| 55 to 64 Years | 168 (94.4%) | 352 (100.0%) |
| 65 to 74 Years | 210 (100.0%) | 0 (0.0%) |
| 75 Years and over | 5 (100.0%) | 0 (0.0%) |
| Total | 1,727 (98.0%) | 1,010 (88.8%) |
Income Below Poverty Among Married-Couple Families in Ester
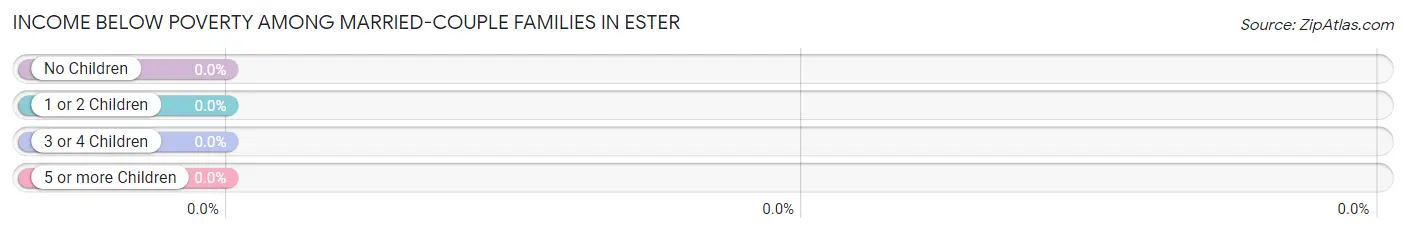
| Children | Above Poverty | Below Poverty |
| No Children | 545 (100.0%) | 0 (0.0%) |
| 1 or 2 Children | 0 (0.0%) | 0 (0.0%) |
| 3 or 4 Children | 105 (100.0%) | 0 (0.0%) |
| 5 or more Children | 0 (0.0%) | 0 (0.0%) |
| Total | 650 (100.0%) | 0 (0.0%) |
Income Below Poverty Among Single-Parent Households in Ester
| Children | Single Father | Single Mother |
| No Children | 0 (0.0%) | 0 (0.0%) |
| 1 or 2 Children | 0 (0.0%) | 0 (0.0%) |
| 3 or 4 Children | 0 (0.0%) | 0 (0.0%) |
| 5 or more Children | 0 (0.0%) | 0 (0.0%) |
| Total | 0 (0.0%) | 0 (0.0%) |
Income Below Poverty Among Married-Couple vs Single-Parent Households in Ester
| Children | Married-Couple Families | Single-Parent Households |
| No Children | 0 (0.0%) | 0 (0.0%) |
| 1 or 2 Children | 0 (0.0%) | 0 (0.0%) |
| 3 or 4 Children | 0 (0.0%) | 0 (0.0%) |
| 5 or more Children | 0 (0.0%) | 0 (0.0%) |
| Total | 0 (0.0%) | 0 (0.0%) |
Race in Ester
The most populous races in Ester are White / Caucasian (2,413 | 80.7%), Hawaiian / Pacific (224 | 7.5%), and Two or more Races (198 | 6.6%).
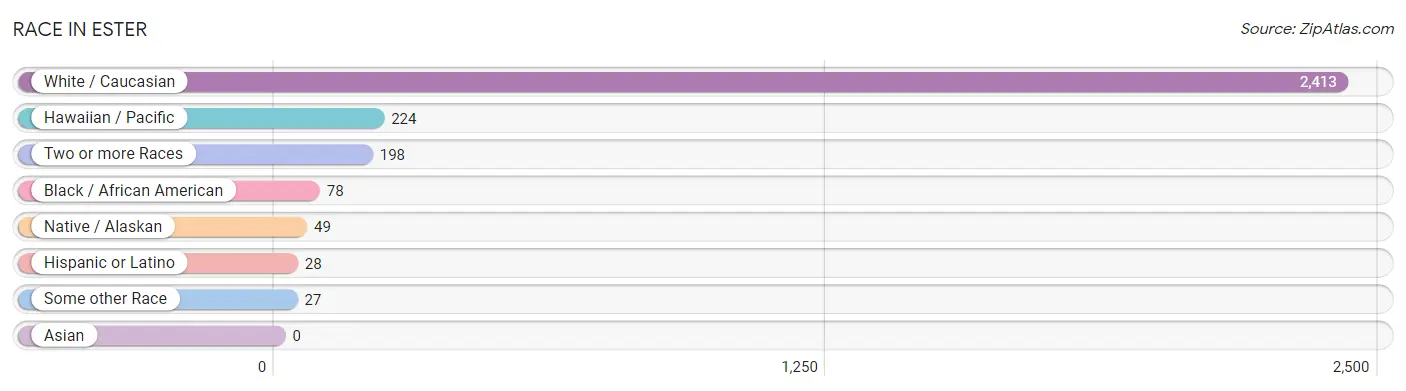
| Race | # Population | % Population |
| Asian | 0 | 0.0% |
| Black / African American | 78 | 2.6% |
| Hawaiian / Pacific | 224 | 7.5% |
| Hispanic or Latino | 28 | 0.9% |
| Native / Alaskan | 49 | 1.6% |
| White / Caucasian | 2,413 | 80.7% |
| Two or more Races | 198 | 6.6% |
| Some other Race | 27 | 0.9% |
| Total | 2,989 | 100.0% |
Ancestry in Ester
The most populous ancestries reported in Ester are German (383 | 12.8%), American (251 | 8.4%), English (230 | 7.7%), European (136 | 4.5%), and Alaskan Athabascan (117 | 3.9%), together accounting for 37.4% of all Ester residents.
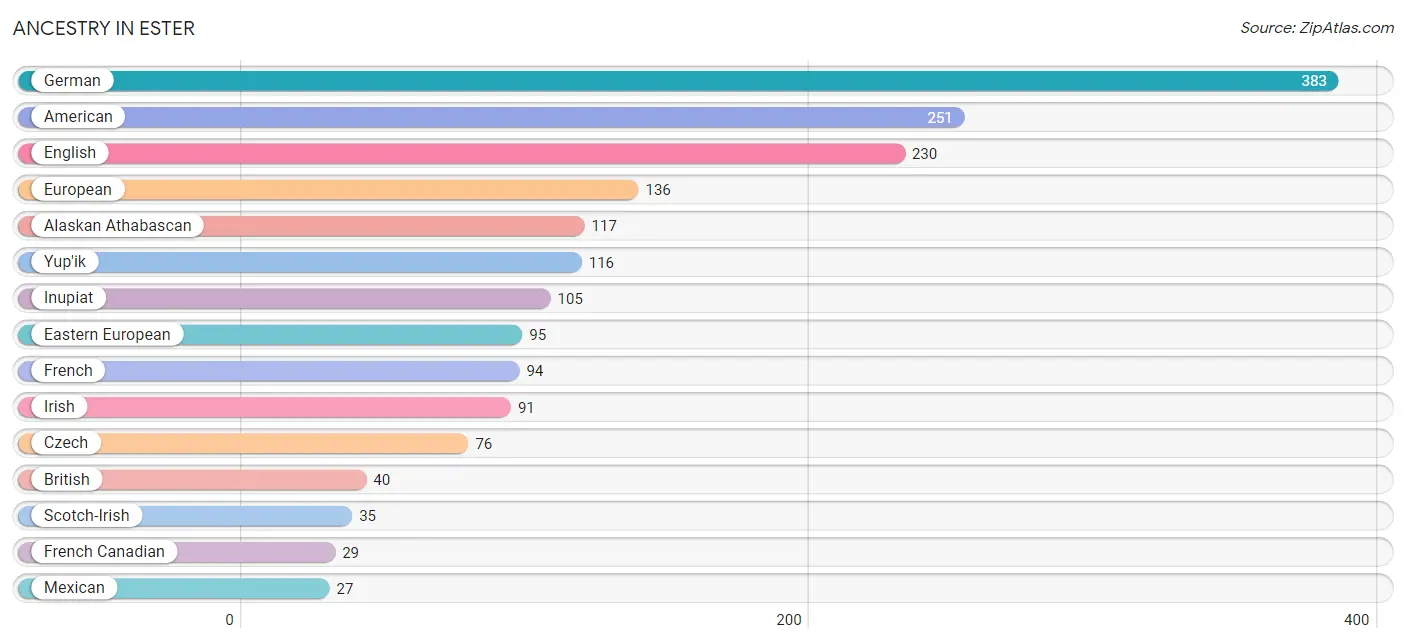
| Ancestry | # Population | % Population |
| Alaskan Athabascan | 117 | 3.9% |
| Aleut | 9 | 0.3% |
| American | 251 | 8.4% |
| British | 40 | 1.3% |
| Cherokee | 1 | 0.0% |
| Czech | 76 | 2.5% |
| Eastern European | 95 | 3.2% |
| English | 230 | 7.7% |
| European | 136 | 4.5% |
| Finnish | 1 | 0.0% |
| French | 94 | 3.1% |
| French Canadian | 29 | 1.0% |
| German | 383 | 12.8% |
| Inupiat | 105 | 3.5% |
| Irish | 91 | 3.0% |
| Mexican | 27 | 0.9% |
| Russian | 1 | 0.0% |
| Samoan | 10 | 0.3% |
| Scotch-Irish | 35 | 1.2% |
| Scottish | 1 | 0.0% |
| Yup'ik | 116 | 3.9% | View All 21 Rows |
Immigrants in Ester
The most numerous immigrant groups reported in Ester came from Oceania (124 | 4.2%), and Micronesia (115 | 3.8%), together accounting for 8.0% of all Ester residents.
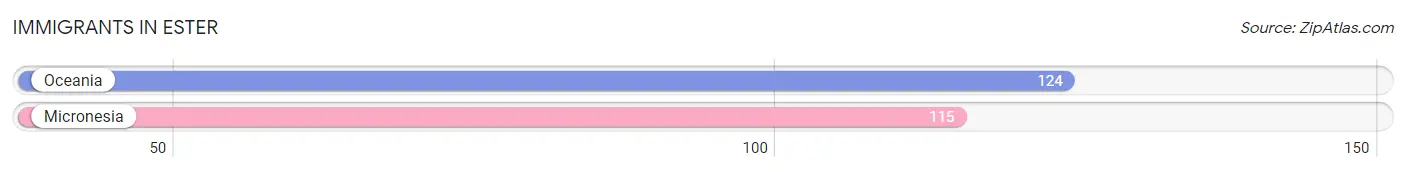
| Immigration Origin | # Population | % Population |
| Micronesia | 115 | 3.8% |
| Oceania | 124 | 4.2% | View All 2 Rows |
Sex and Age in Ester
Sex and Age in Ester
The most populous age groups in Ester are 30 to 34 Years (355 | 19.2%) for men and 55 to 59 Years (226 | 19.9%) for women.
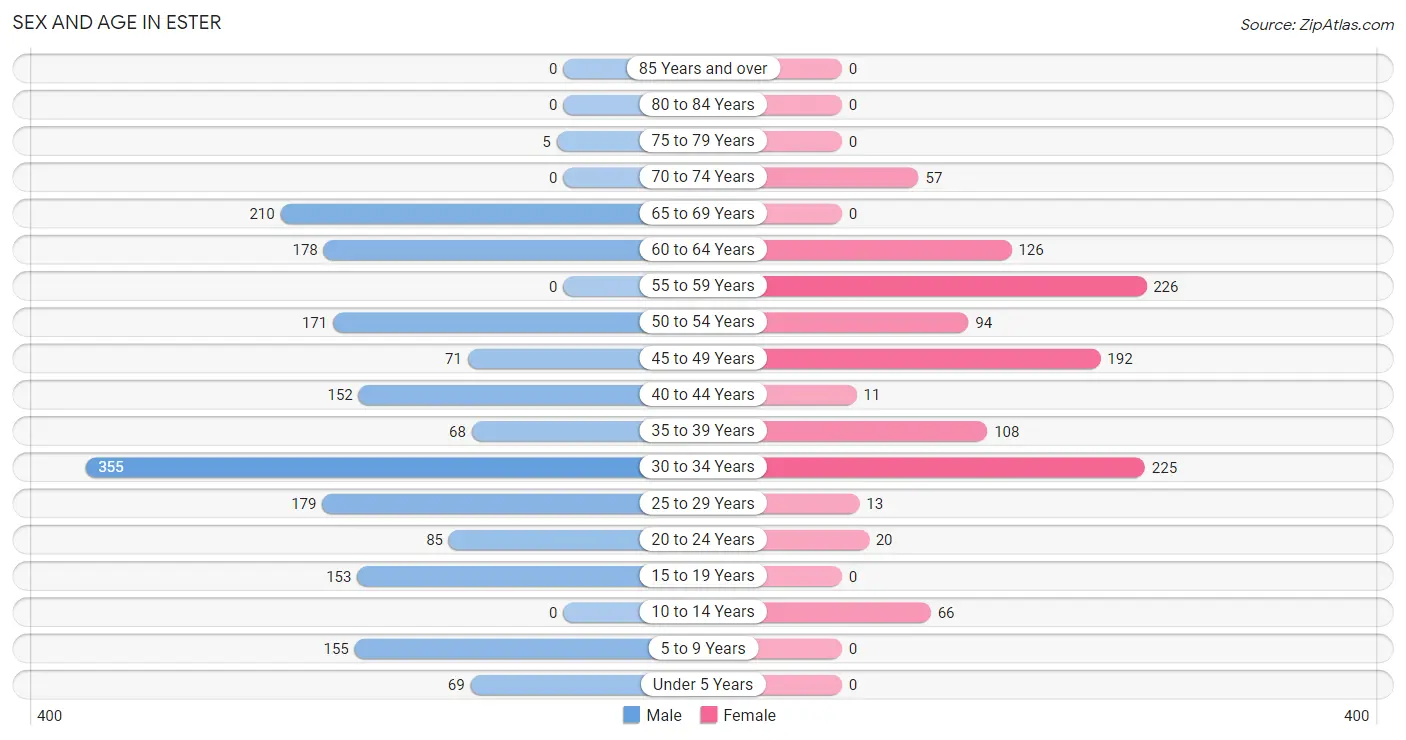
| Age Bracket | Male | Female |
| Under 5 Years | 69 (3.7%) | 0 (0.0%) |
| 5 to 9 Years | 155 (8.4%) | 0 (0.0%) |
| 10 to 14 Years | 0 (0.0%) | 66 (5.8%) |
| 15 to 19 Years | 153 (8.3%) | 0 (0.0%) |
| 20 to 24 Years | 85 (4.6%) | 20 (1.8%) |
| 25 to 29 Years | 179 (9.7%) | 13 (1.1%) |
| 30 to 34 Years | 355 (19.2%) | 225 (19.8%) |
| 35 to 39 Years | 68 (3.7%) | 108 (9.5%) |
| 40 to 44 Years | 152 (8.2%) | 11 (1.0%) |
| 45 to 49 Years | 71 (3.8%) | 192 (16.9%) |
| 50 to 54 Years | 171 (9.2%) | 94 (8.3%) |
| 55 to 59 Years | 0 (0.0%) | 226 (19.9%) |
| 60 to 64 Years | 178 (9.6%) | 126 (11.1%) |
| 65 to 69 Years | 210 (11.4%) | 0 (0.0%) |
| 70 to 74 Years | 0 (0.0%) | 57 (5.0%) |
| 75 to 79 Years | 5 (0.3%) | 0 (0.0%) |
| 80 to 84 Years | 0 (0.0%) | 0 (0.0%) |
| 85 Years and over | 0 (0.0%) | 0 (0.0%) |
| Total | 1,851 (100.0%) | 1,138 (100.0%) |
Families and Households in Ester
Median Family Size in Ester
The median family size in Ester is 2.59 persons per family, with single female/mother families (35 | 4.6%) accounting for the largest median family size of 5 persons per family. On the other hand, single male/father families (69 | 9.1%) represent the smallest median family size with 2.00 persons per family.
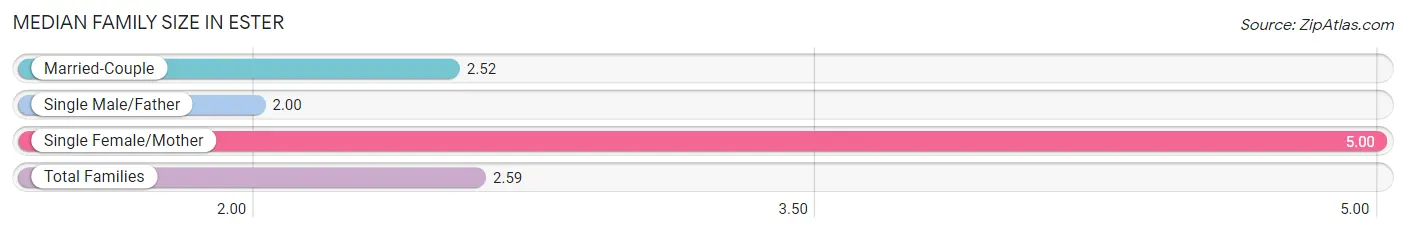
| Family Type | # Families | Family Size |
| Married-Couple | 650 (86.2%) | 2.52 |
| Single Male/Father | 69 (9.1%) | 2.00 |
| Single Female/Mother | 35 (4.6%) | 5.00 |
| Total Families | 754 (100.0%) | 2.59 |
Median Household Size in Ester
The median household size in Ester is 2.07 persons per household, with single female/mother households (35 | 2.6%) accounting for the largest median household size of 5 persons per household. non-family households (614 | 44.9%) represent the smallest median household size with 1.30 persons per household.
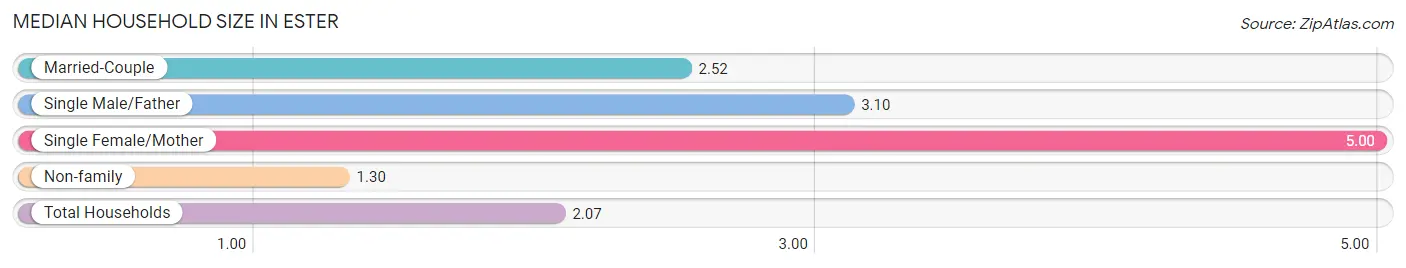
| Household Type | # Households | Household Size |
| Married-Couple | 650 (47.5%) | 2.52 |
| Single Male/Father | 69 (5.0%) | 3.10 |
| Single Female/Mother | 35 (2.6%) | 5.00 |
| Non-family | 614 (44.9%) | 1.30 |
| Total Households | 1,368 (100.0%) | 2.07 |
Household Size by Marriage Status in Ester
Out of a total of 1,368 households in Ester, 754 (55.1%) are family households, while 614 (44.9%) are nonfamily households. The most numerous type of family households are 2-person households, comprising 454, and the most common type of nonfamily households are 1-person households, comprising 472.
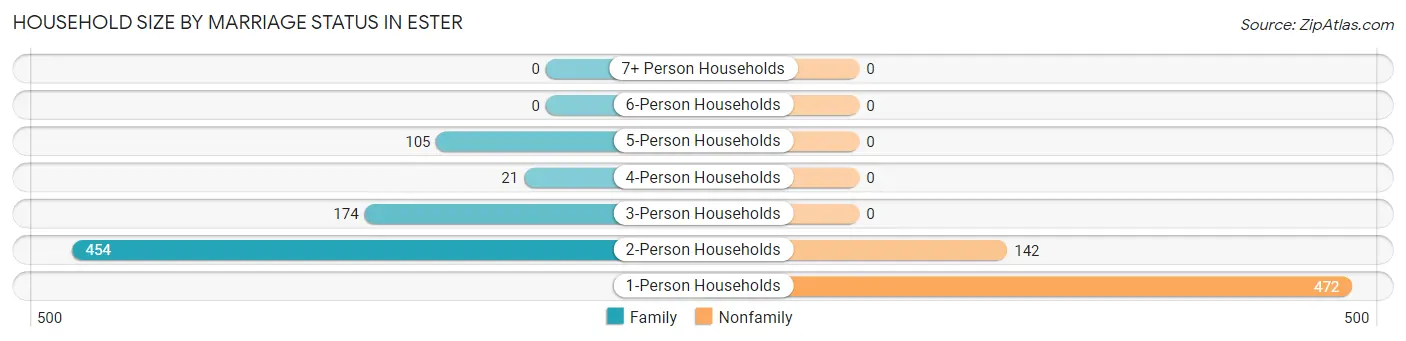
| Household Size | Family Households | Nonfamily Households |
| 1-Person Households | - | 472 (34.5%) |
| 2-Person Households | 454 (33.2%) | 142 (10.4%) |
| 3-Person Households | 174 (12.7%) | 0 (0.0%) |
| 4-Person Households | 21 (1.5%) | 0 (0.0%) |
| 5-Person Households | 105 (7.7%) | 0 (0.0%) |
| 6-Person Households | 0 (0.0%) | 0 (0.0%) |
| 7+ Person Households | 0 (0.0%) | 0 (0.0%) |
| Total | 754 (55.1%) | 614 (44.9%) |
Female Fertility in Ester
Fertility by Age in Ester
| Age Bracket | Women with Births | Births / 1,000 Women |
| 15 to 19 years | 0 (0.0%) | 0.0 |
| 20 to 34 years | 0 (0.0%) | 0.0 |
| 35 to 50 years | 0 (0.0%) | 0.0 |
| Total | 0 (0.0%) | 0.0 |
Fertility by Age by Marriage Status in Ester
| Age Bracket | Married | Unmarried |
| 15 to 19 years | 0 (0.0%) | 0 (0.0%) |
| 20 to 34 years | 0 (0.0%) | 0 (0.0%) |
| 35 to 50 years | 0 (0.0%) | 0 (0.0%) |
| Total | 0 (0.0%) | 0 (0.0%) |
Fertility by Education in Ester
| Educational Attainment | Women with Births | Births / 1,000 Women |
| Less than High School | 0 (0.0%) | 0.0 |
| High School Diploma | 0 (0.0%) | 0.0 |
| College or Associate's Degree | 0 (0.0%) | 0.0 |
| Bachelor's Degree | 0 (0.0%) | 0.0 |
| Graduate Degree | 0 (0.0%) | 0.0 |
| Total | 0 (0.0%) | 0.0 |
Fertility by Education by Marriage Status in Ester
| Educational Attainment | Married | Unmarried |
| Less than High School | 0 (0.0%) | 0 (0.0%) |
| High School Diploma | 0 (0.0%) | 0 (0.0%) |
| College or Associate's Degree | 0 (0.0%) | 0 (0.0%) |
| Bachelor's Degree | 0 (0.0%) | 0 (0.0%) |
| Graduate Degree | 0 (0.0%) | 0 (0.0%) |
| Total | 0 (0.0%) | 0 (0.0%) |
Employment Characteristics in Ester
Employment by Class of Employer in Ester
Among the 1,564 employed individuals in Ester, private company employees (643 | 41.1%), state government employees (441 | 28.2%), and not-for-profit organizations (237 | 15.1%) make up the most common classes of employment.
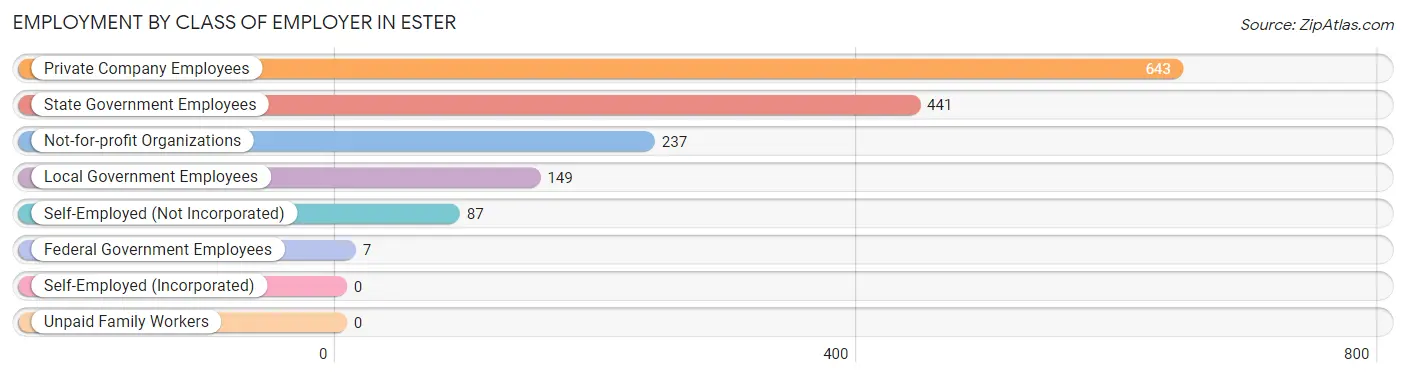
| Employer Class | # Employees | % Employees |
| Private Company Employees | 643 | 41.1% |
| Self-Employed (Incorporated) | 0 | 0.0% |
| Self-Employed (Not Incorporated) | 87 | 5.6% |
| Not-for-profit Organizations | 237 | 15.1% |
| Local Government Employees | 149 | 9.5% |
| State Government Employees | 441 | 28.2% |
| Federal Government Employees | 7 | 0.4% |
| Unpaid Family Workers | 0 | 0.0% |
| Total | 1,564 | 100.0% |
Employment Status by Age in Ester
According to the labor force statistics for Ester, out of the total population over 16 years of age (2,645), 62.6% or 1,656 individuals are in the labor force, with 3.5% or 58 of them unemployed. The age group with the highest labor force participation rate is 20 to 24 years, with 100.0% or 105 individuals in the labor force. Within the labor force, the 45 to 54 years age range has the highest percentage of unemployed individuals, with 16.6% or 57 of them being unemployed.
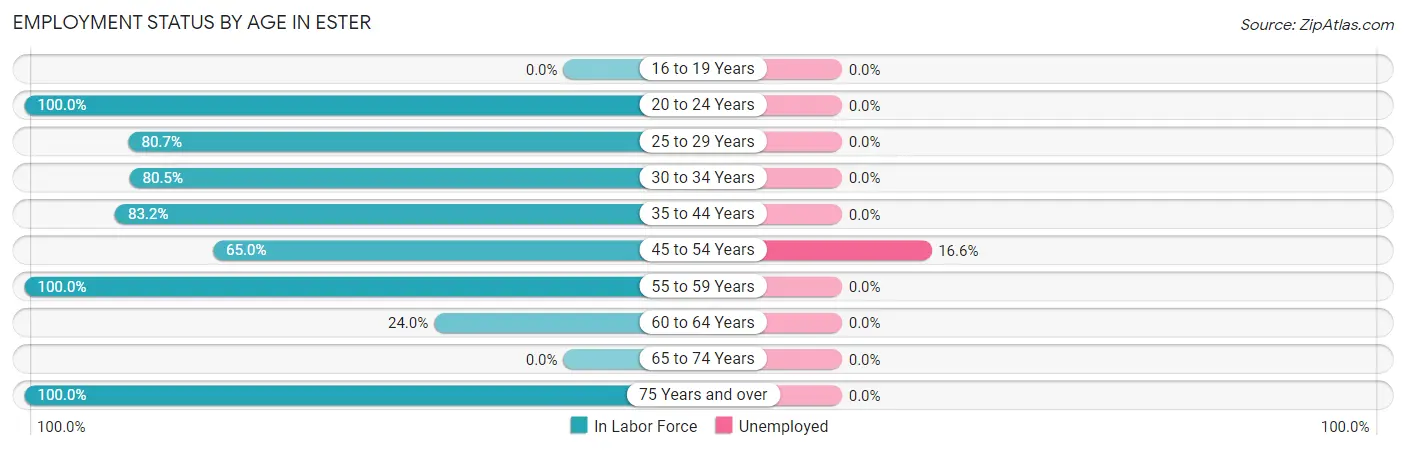
| Age Bracket | In Labor Force | Unemployed |
| 16 to 19 Years | 0 (0.0%) | 0 (0.0%) |
| 20 to 24 Years | 105 (100.0%) | 0 (0.0%) |
| 25 to 29 Years | 155 (80.7%) | 0 (0.0%) |
| 30 to 34 Years | 467 (80.5%) | 0 (0.0%) |
| 35 to 44 Years | 282 (83.2%) | 0 (0.0%) |
| 45 to 54 Years | 343 (65.0%) | 57 (16.6%) |
| 55 to 59 Years | 226 (100.0%) | 0 (0.0%) |
| 60 to 64 Years | 73 (24.0%) | 0 (0.0%) |
| 65 to 74 Years | 0 (0.0%) | 0 (0.0%) |
| 75 Years and over | 5 (100.0%) | 0 (0.0%) |
| Total | 1,656 (62.6%) | 58 (3.5%) |
Employment Status by Educational Attainment in Ester
According to labor force statistics for Ester, 71.3% of individuals (1,546) out of the total population between 25 and 64 years of age (2,169) are in the labor force, with 3.7% or 57 of them being unemployed. The group with the highest labor force participation rate are those with the educational attainment of bachelor's degree or higher, with 100.0% or 755 individuals in the labor force. Within the labor force, individuals with bachelor's degree or higher education have the highest percentage of unemployment, with 7.5% or 57 of them being unemployed.
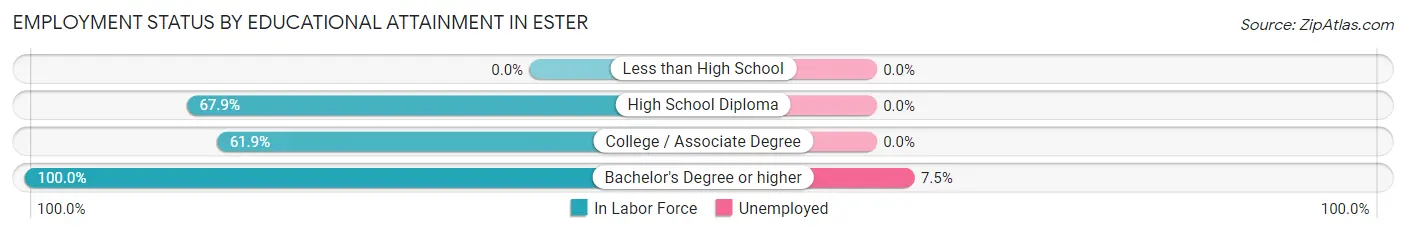
| Educational Attainment | In Labor Force | Unemployed |
| Less than High School | 0 (0.0%) | 0 (0.0%) |
| High School Diploma | 495 (67.9%) | 0 (0.0%) |
| College / Associate Degree | 296 (61.9%) | 0 (0.0%) |
| Bachelor's Degree or higher | 755 (100.0%) | 57 (7.5%) |
| Total | 1,546 (71.3%) | 80 (3.7%) |
Employment Occupations by Sex in Ester
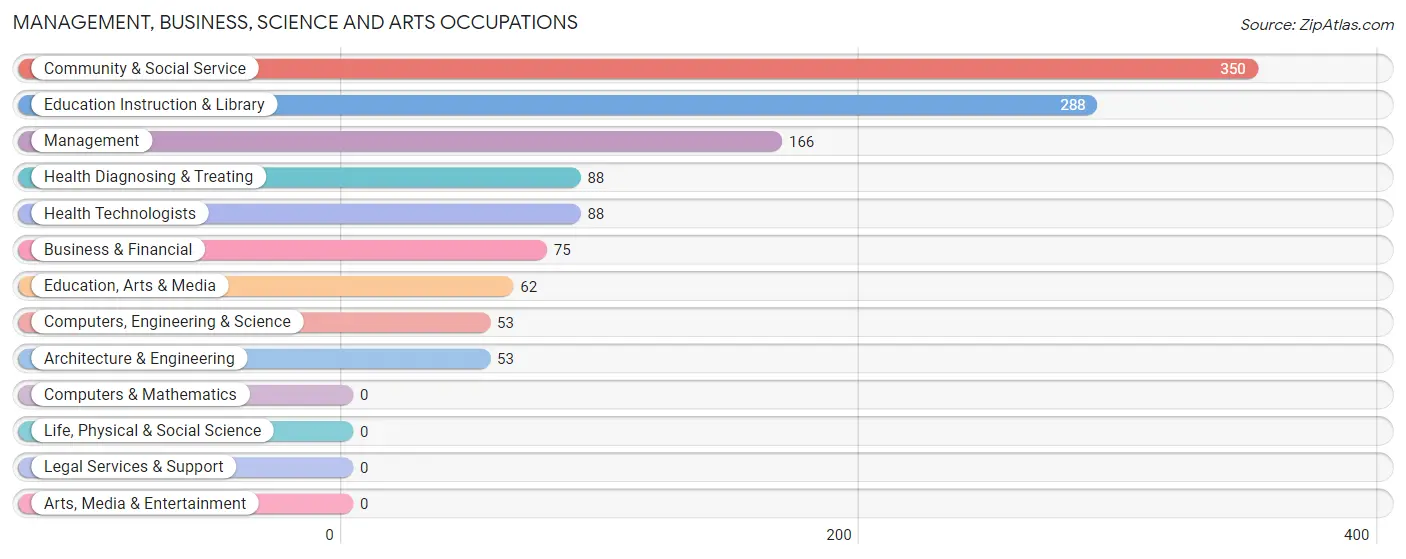
Management, Business, Science and Arts Occupations
The most common Management, Business, Science and Arts occupations in Ester are Community & Social Service (350 | 22.0%), Education Instruction & Library (288 | 18.1%), Management (166 | 10.4%), Health Diagnosing & Treating (88 | 5.5%), and Health Technologists (88 | 5.5%).
Management, Business, Science and Arts Occupations by Sex
Within the Management, Business, Science and Arts occupations in Ester, the most male-oriented occupations are Management (100.0%), Computers, Engineering & Science (100.0%), and Architecture & Engineering (100.0%), while the most female-oriented occupations are Health Diagnosing & Treating (100.0%), Health Technologists (100.0%), and Education Instruction & Library (36.5%).
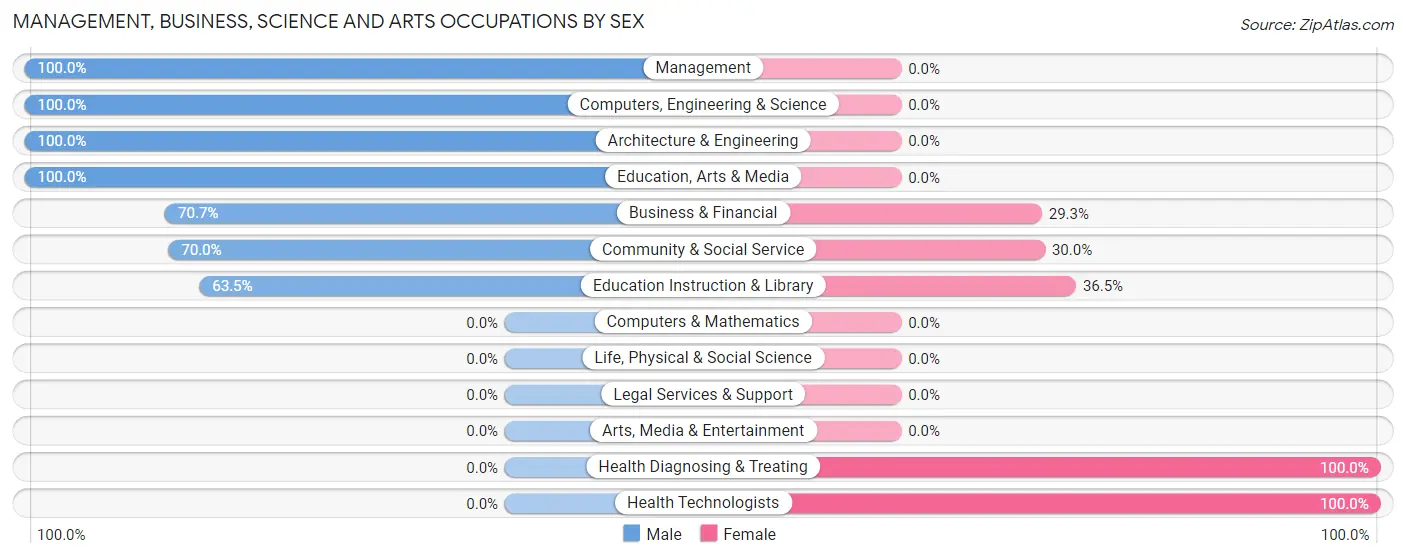
| Occupation | Male | Female |
| Management | 166 (100.0%) | 0 (0.0%) |
| Business & Financial | 53 (70.7%) | 22 (29.3%) |
| Computers, Engineering & Science | 53 (100.0%) | 0 (0.0%) |
| Computers & Mathematics | 0 (0.0%) | 0 (0.0%) |
| Architecture & Engineering | 53 (100.0%) | 0 (0.0%) |
| Life, Physical & Social Science | 0 (0.0%) | 0 (0.0%) |
| Community & Social Service | 245 (70.0%) | 105 (30.0%) |
| Education, Arts & Media | 62 (100.0%) | 0 (0.0%) |
| Legal Services & Support | 0 (0.0%) | 0 (0.0%) |
| Education Instruction & Library | 183 (63.5%) | 105 (36.5%) |
| Arts, Media & Entertainment | 0 (0.0%) | 0 (0.0%) |
| Health Diagnosing & Treating | 0 (0.0%) | 88 (100.0%) |
| Health Technologists | 0 (0.0%) | 88 (100.0%) |
| Total (Category) | 517 (70.6%) | 215 (29.4%) |
| Total (Overall) | 767 (48.2%) | 825 (51.8%) |
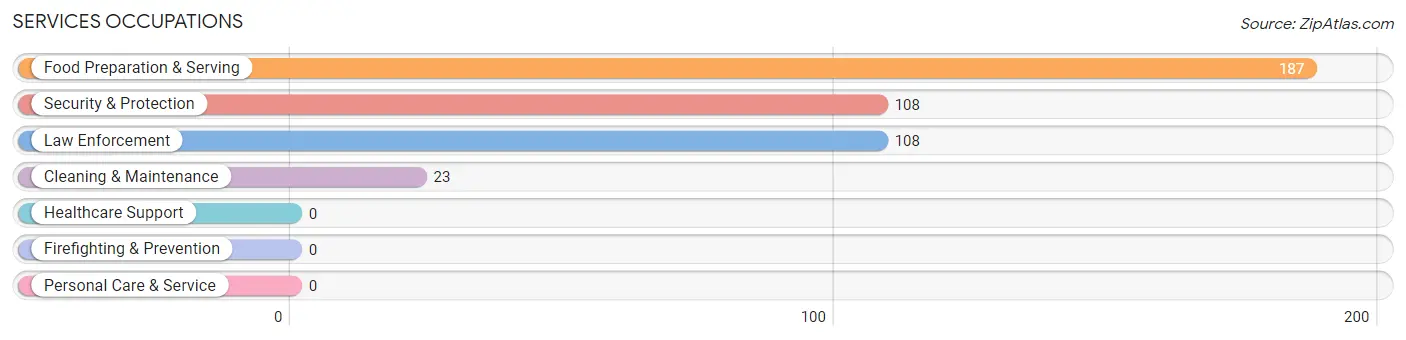
Services Occupations
The most common Services occupations in Ester are Food Preparation & Serving (187 | 11.7%), Security & Protection (108 | 6.8%), Law Enforcement (108 | 6.8%), and Cleaning & Maintenance (23 | 1.4%).
Services Occupations by Sex
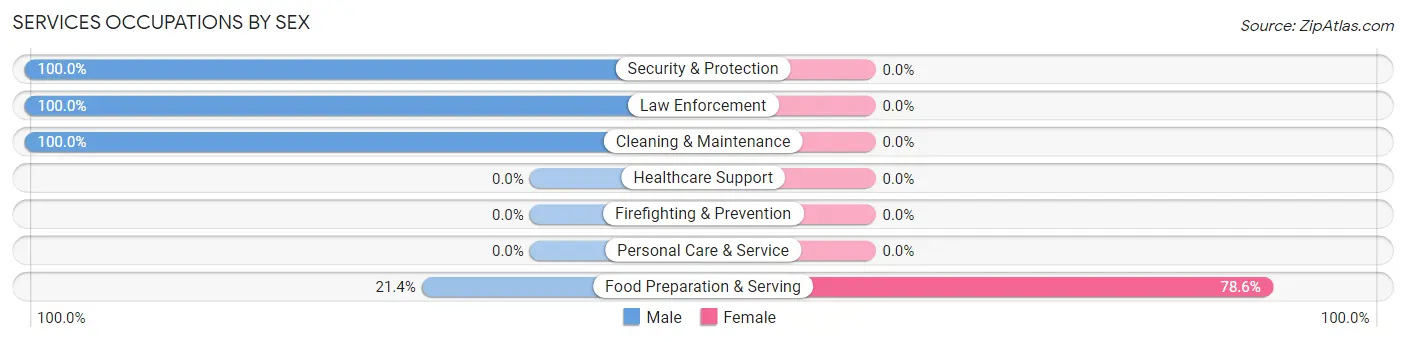
| Occupation | Male | Female |
| Healthcare Support | 0 (0.0%) | 0 (0.0%) |
| Security & Protection | 108 (100.0%) | 0 (0.0%) |
| Firefighting & Prevention | 0 (0.0%) | 0 (0.0%) |
| Law Enforcement | 108 (100.0%) | 0 (0.0%) |
| Food Preparation & Serving | 40 (21.4%) | 147 (78.6%) |
| Cleaning & Maintenance | 23 (100.0%) | 0 (0.0%) |
| Personal Care & Service | 0 (0.0%) | 0 (0.0%) |
| Total (Category) | 171 (53.8%) | 147 (46.2%) |
| Total (Overall) | 767 (48.2%) | 825 (51.8%) |
Sales and Office Occupations
The most common Sales and Office occupations in Ester are Sales & Related (234 | 14.7%), and Office & Administration (202 | 12.7%).

Sales and Office Occupations by Sex

| Occupation | Male | Female |
| Sales & Related | 74 (31.6%) | 160 (68.4%) |
| Office & Administration | 0 (0.0%) | 202 (100.0%) |
| Total (Category) | 74 (17.0%) | 362 (83.0%) |
| Total (Overall) | 767 (48.2%) | 825 (51.8%) |
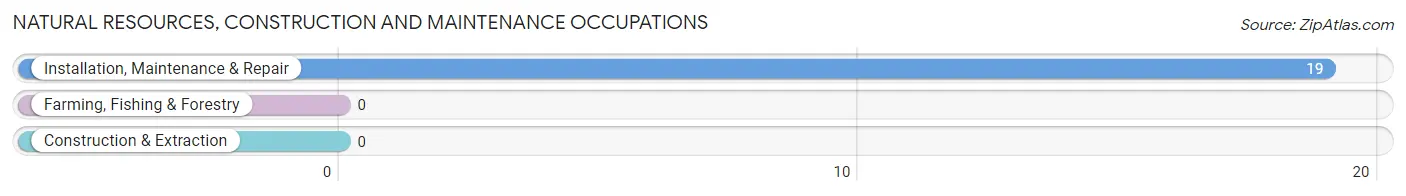
Natural Resources, Construction and Maintenance Occupations
The most common Natural Resources, Construction and Maintenance occupations in Ester are , and Installation, Maintenance & Repair (19 | 1.2%).
Natural Resources, Construction and Maintenance Occupations by Sex
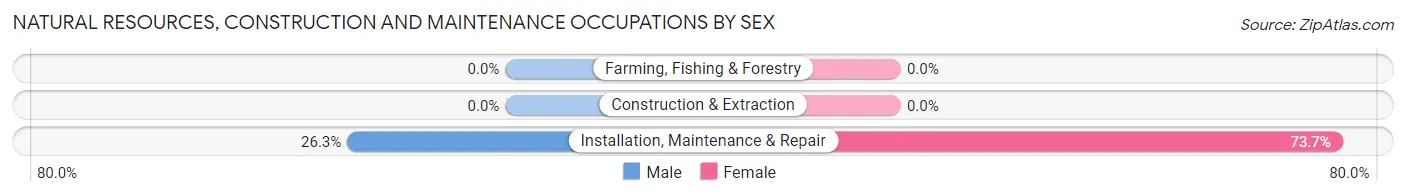
| Occupation | Male | Female |
| Farming, Fishing & Forestry | 0 (0.0%) | 0 (0.0%) |
| Construction & Extraction | 0 (0.0%) | 0 (0.0%) |
| Installation, Maintenance & Repair | 5 (26.3%) | 14 (73.7%) |
| Total (Category) | 5 (26.3%) | 14 (73.7%) |
| Total (Overall) | 767 (48.2%) | 825 (51.8%) |
Production, Transportation and Moving Occupations
The most common Production, Transportation and Moving occupations in Ester are , and Production (87 | 5.5%).
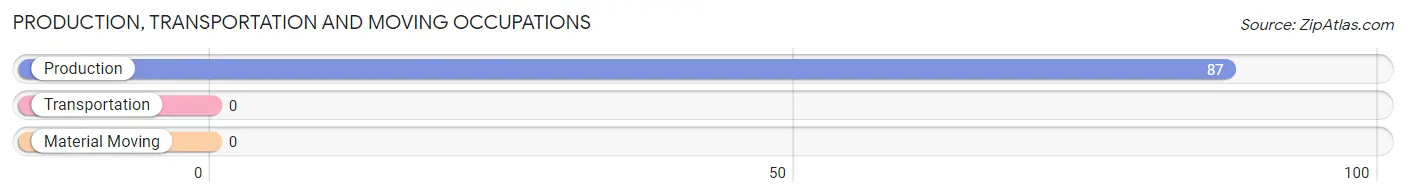
Production, Transportation and Moving Occupations by Sex
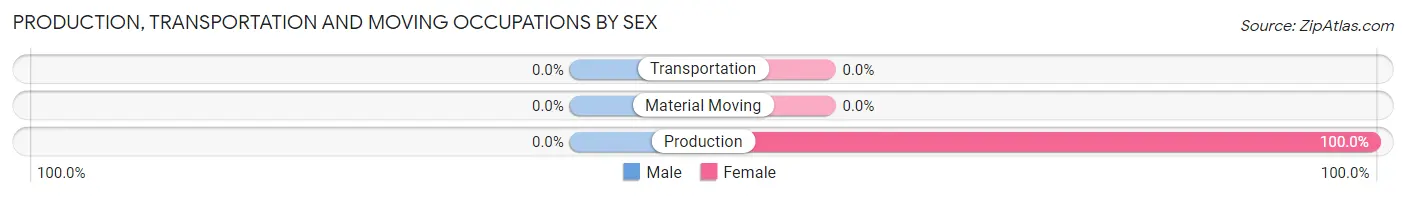
| Occupation | Male | Female |
| Production | 0 (0.0%) | 87 (100.0%) |
| Transportation | 0 (0.0%) | 0 (0.0%) |
| Material Moving | 0 (0.0%) | 0 (0.0%) |
| Total (Category) | 0 (0.0%) | 87 (100.0%) |
| Total (Overall) | 767 (48.2%) | 825 (51.8%) |
Employment Industries by Sex in Ester
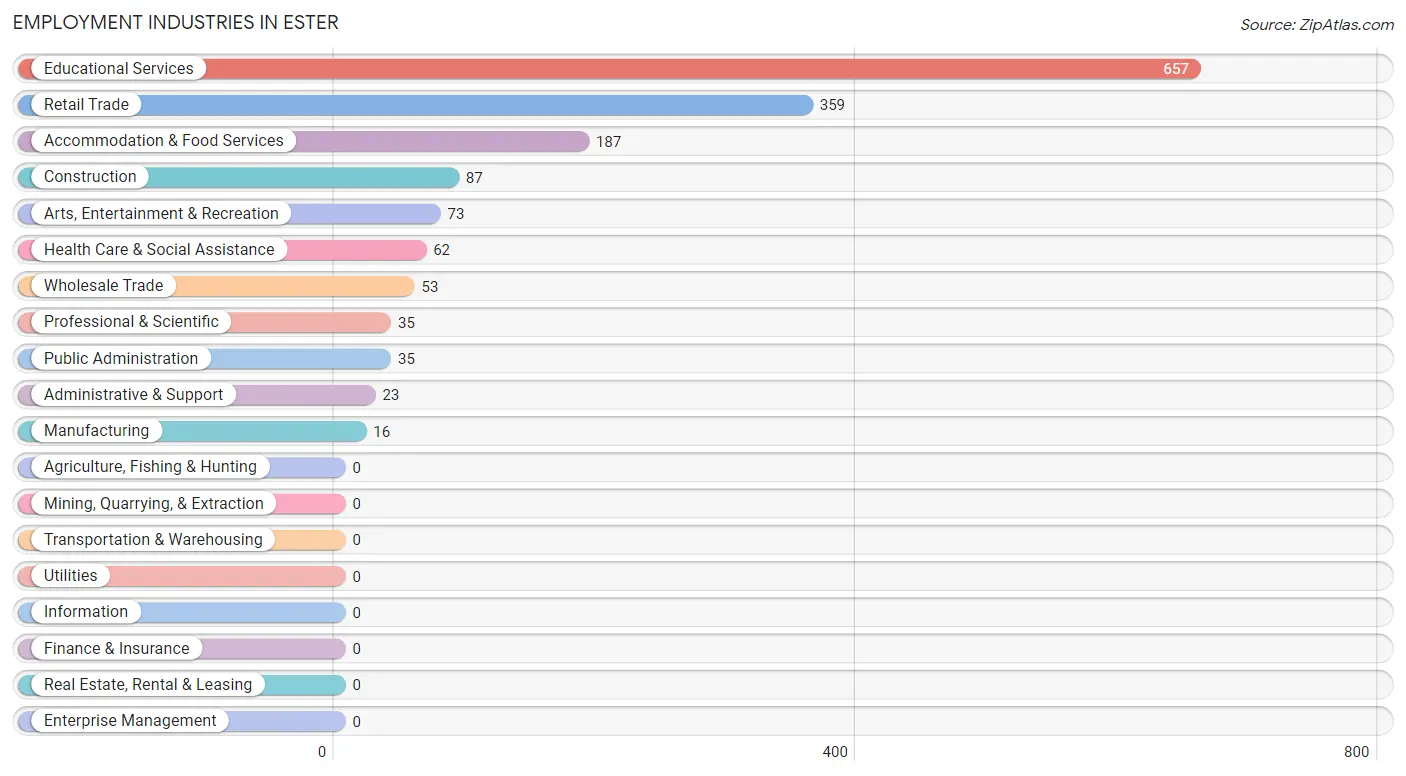
Employment Industries in Ester
The major employment industries in Ester include Educational Services (657 | 41.3%), Retail Trade (359 | 22.6%), Accommodation & Food Services (187 | 11.7%), Construction (87 | 5.5%), and Arts, Entertainment & Recreation (73 | 4.6%).
Employment Industries by Sex in Ester
The Ester industries that see more men than women are Construction (100.0%), Manufacturing (100.0%), and Wholesale Trade (100.0%), whereas the industries that tend to have a higher number of women are Accommodation & Food Services (78.6%), Retail Trade (72.7%), and Professional & Scientific (62.9%).
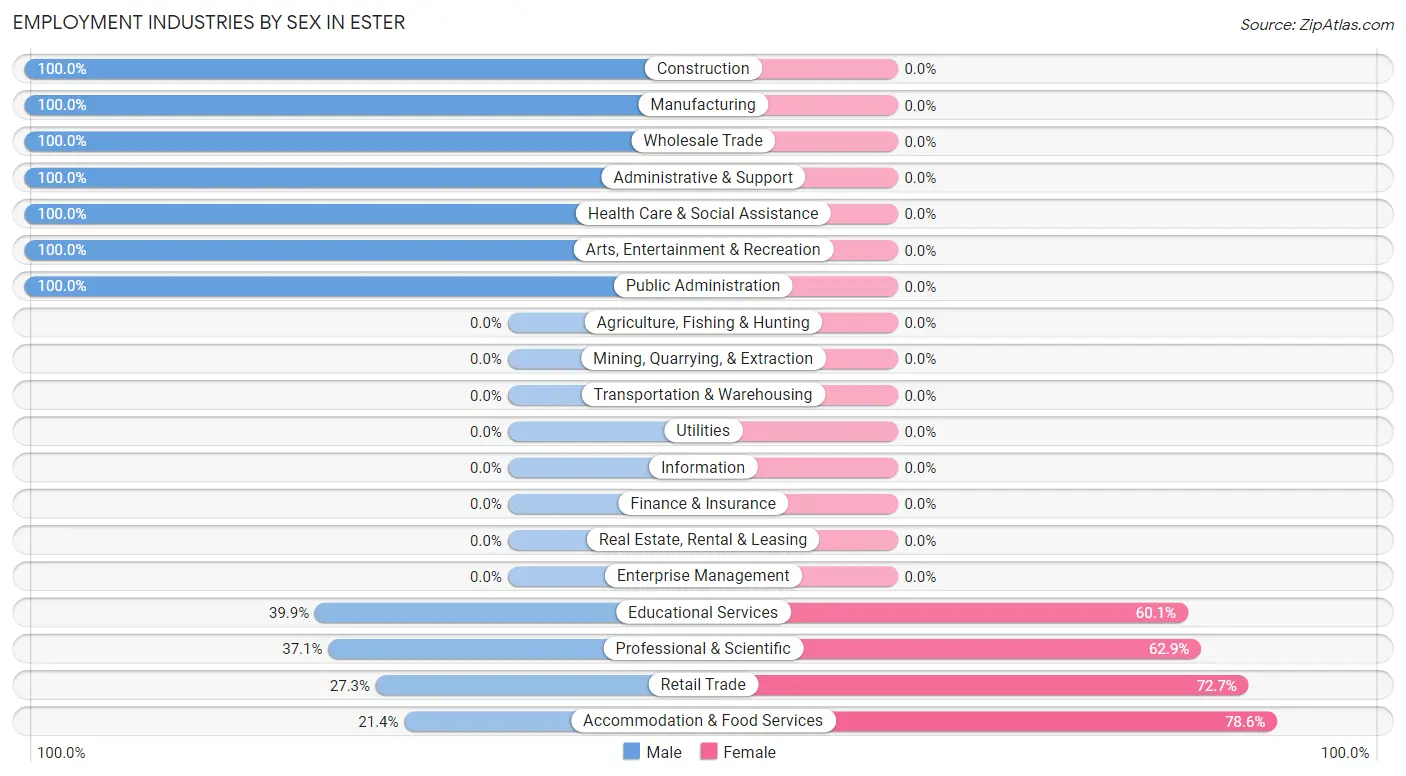
| Industry | Male | Female |
| Agriculture, Fishing & Hunting | 0 (0.0%) | 0 (0.0%) |
| Mining, Quarrying, & Extraction | 0 (0.0%) | 0 (0.0%) |
| Construction | 87 (100.0%) | 0 (0.0%) |
| Manufacturing | 16 (100.0%) | 0 (0.0%) |
| Wholesale Trade | 53 (100.0%) | 0 (0.0%) |
| Retail Trade | 98 (27.3%) | 261 (72.7%) |
| Transportation & Warehousing | 0 (0.0%) | 0 (0.0%) |
| Utilities | 0 (0.0%) | 0 (0.0%) |
| Information | 0 (0.0%) | 0 (0.0%) |
| Finance & Insurance | 0 (0.0%) | 0 (0.0%) |
| Real Estate, Rental & Leasing | 0 (0.0%) | 0 (0.0%) |
| Professional & Scientific | 13 (37.1%) | 22 (62.9%) |
| Enterprise Management | 0 (0.0%) | 0 (0.0%) |
| Administrative & Support | 23 (100.0%) | 0 (0.0%) |
| Educational Services | 262 (39.9%) | 395 (60.1%) |
| Health Care & Social Assistance | 62 (100.0%) | 0 (0.0%) |
| Arts, Entertainment & Recreation | 73 (100.0%) | 0 (0.0%) |
| Accommodation & Food Services | 40 (21.4%) | 147 (78.6%) |
| Public Administration | 35 (100.0%) | 0 (0.0%) |
| Total | 767 (48.2%) | 825 (51.8%) |
Education in Ester
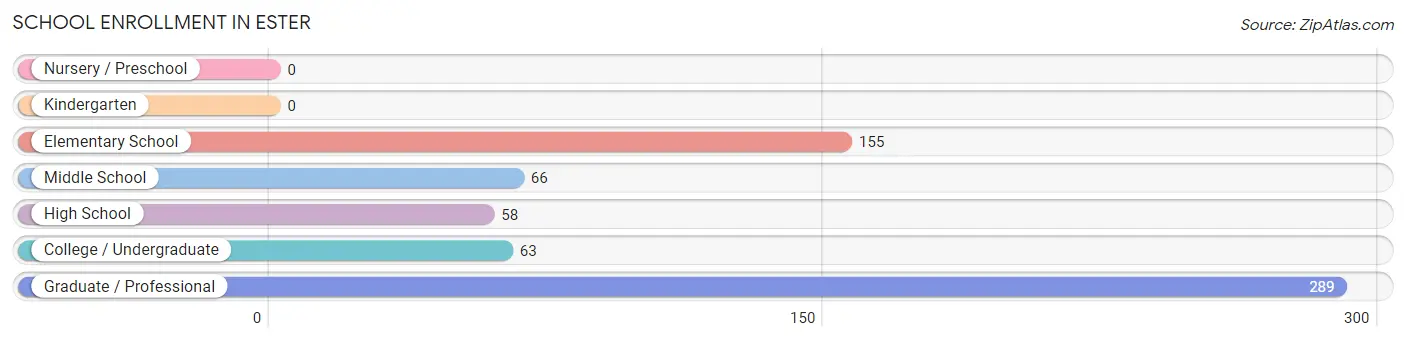
School Enrollment in Ester
The most common levels of schooling among the 631 students in Ester are graduate / professional (289 | 45.8%), elementary school (155 | 24.6%), and middle school (66 | 10.5%).
| School Level | # Students | % Students |
| Nursery / Preschool | 0 | 0.0% |
| Kindergarten | 0 | 0.0% |
| Elementary School | 155 | 24.6% |
| Middle School | 66 | 10.5% |
| High School | 58 | 9.2% |
| College / Undergraduate | 63 | 10.0% |
| Graduate / Professional | 289 | 45.8% |
| Total | 631 | 100.0% |
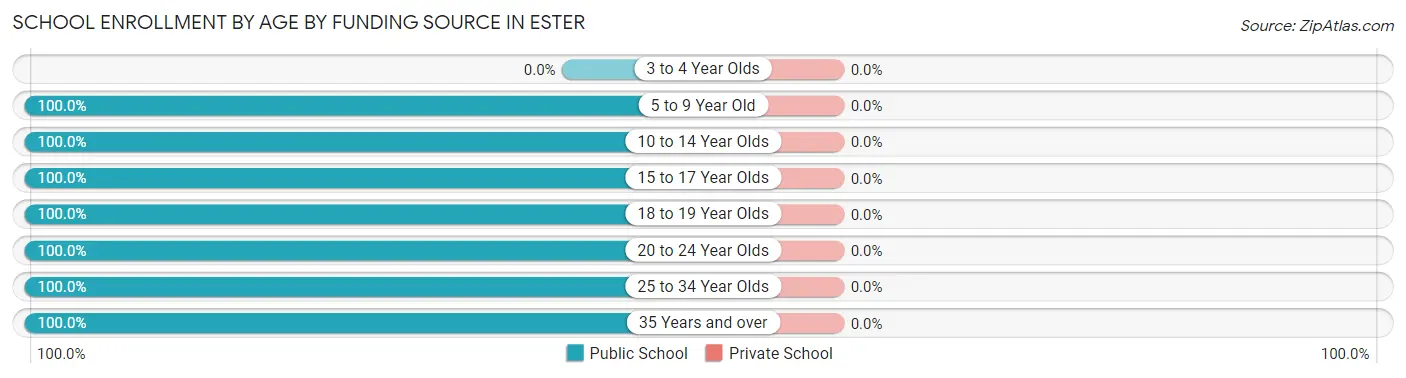
School Enrollment by Age by Funding Source in Ester
| Age Bracket | Public School | Private School |
| 3 to 4 Year Olds | 0 (0.0%) | 0 (0.0%) |
| 5 to 9 Year Old | 155 (100.0%) | 0 (0.0%) |
| 10 to 14 Year Olds | 66 (100.0%) | 0 (0.0%) |
| 15 to 17 Year Olds | 57 (100.0%) | 0 (0.0%) |
| 18 to 19 Year Olds | 1 (100.0%) | 0 (0.0%) |
| 20 to 24 Year Olds | 80 (100.0%) | 0 (0.0%) |
| 25 to 34 Year Olds | 164 (100.0%) | 0 (0.0%) |
| 35 Years and over | 108 (100.0%) | 0 (0.0%) |
| Total | 631 (100.0%) | 0 (0.0%) |
Educational Attainment by Field of Study in Ester
Bio, nature & agricultural (385 | 39.1%), visual & performing arts (161 | 16.4%), communications (133 | 13.5%), social sciences (85 | 8.6%), and liberal arts & history (81 | 8.2%) are the most common fields of study among 985 individuals in Ester who have obtained a bachelor's degree or higher.
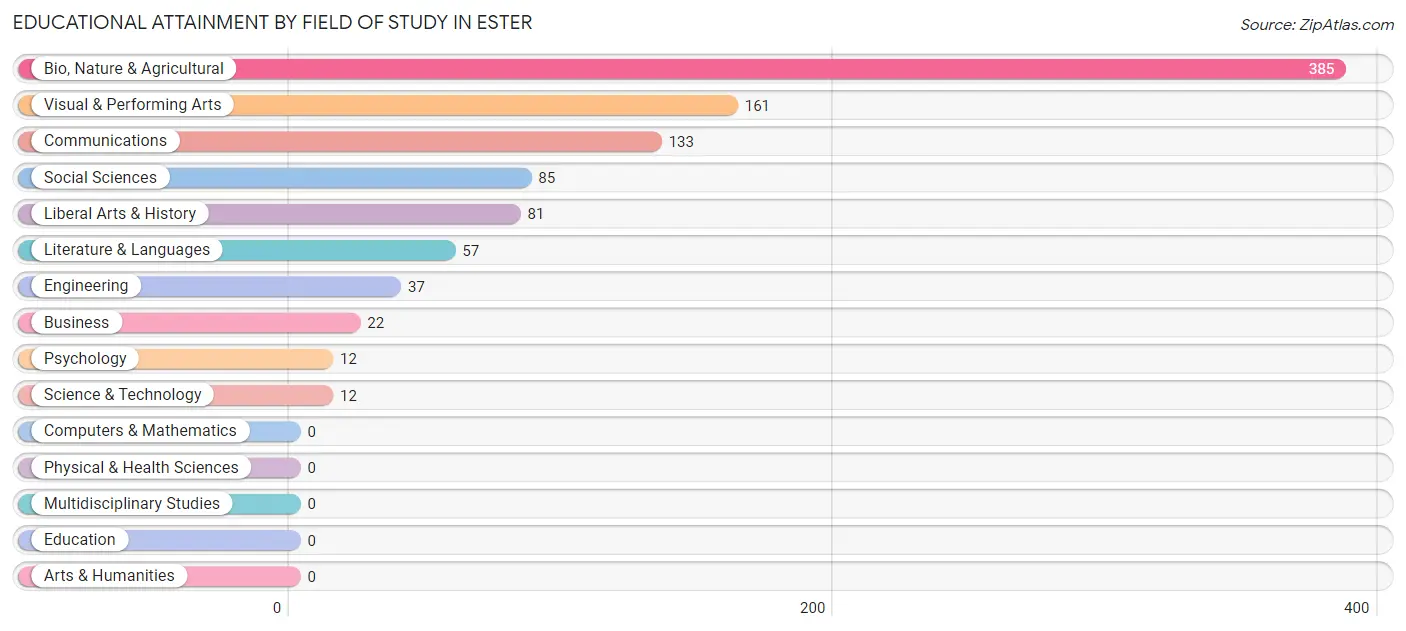
| Field of Study | # Graduates | % Graduates |
| Computers & Mathematics | 0 | 0.0% |
| Bio, Nature & Agricultural | 385 | 39.1% |
| Physical & Health Sciences | 0 | 0.0% |
| Psychology | 12 | 1.2% |
| Social Sciences | 85 | 8.6% |
| Engineering | 37 | 3.8% |
| Multidisciplinary Studies | 0 | 0.0% |
| Science & Technology | 12 | 1.2% |
| Business | 22 | 2.2% |
| Education | 0 | 0.0% |
| Literature & Languages | 57 | 5.8% |
| Liberal Arts & History | 81 | 8.2% |
| Visual & Performing Arts | 161 | 16.4% |
| Communications | 133 | 13.5% |
| Arts & Humanities | 0 | 0.0% |
| Total | 985 | 100.0% |
Transportation & Commute in Ester
Vehicle Availability by Sex in Ester
The most prevalent vehicle ownership categories in Ester are males with 1 vehicle (280, accounting for 36.5%) and females with 1 vehicle (221, making up 35.4%).
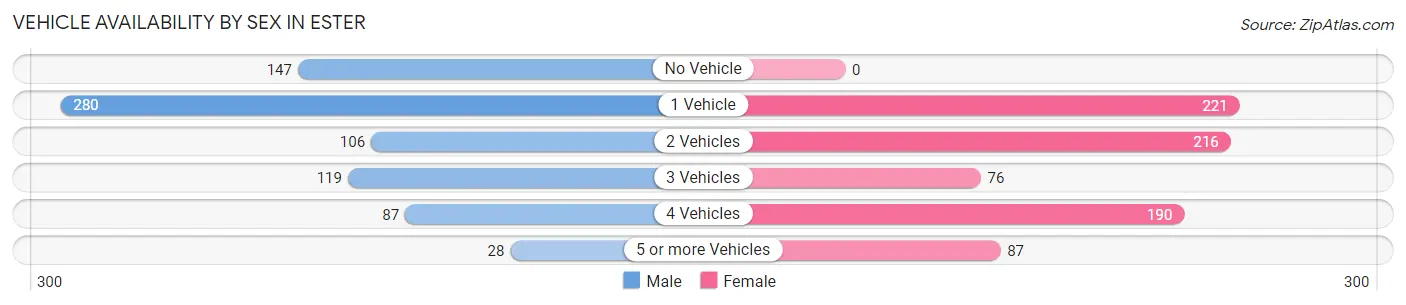
| Vehicles Available | Male | Female |
| No Vehicle | 147 (19.2%) | 0 (0.0%) |
| 1 Vehicle | 280 (36.5%) | 221 (28.0%) |
| 2 Vehicles | 106 (13.8%) | 216 (27.3%) |
| 3 Vehicles | 119 (15.5%) | 76 (9.6%) |
| 4 Vehicles | 87 (11.3%) | 190 (24.0%) |
| 5 or more Vehicles | 28 (3.6%) | 87 (11.0%) |
| Total | 767 (100.0%) | 790 (100.0%) |
Commute Time in Ester
The most frequently occuring commute durations in Ester are 10 to 14 minutes (367 commuters, 26.1%), 20 to 24 minutes (285 commuters, 20.2%), and 30 to 34 minutes (253 commuters, 18.0%).
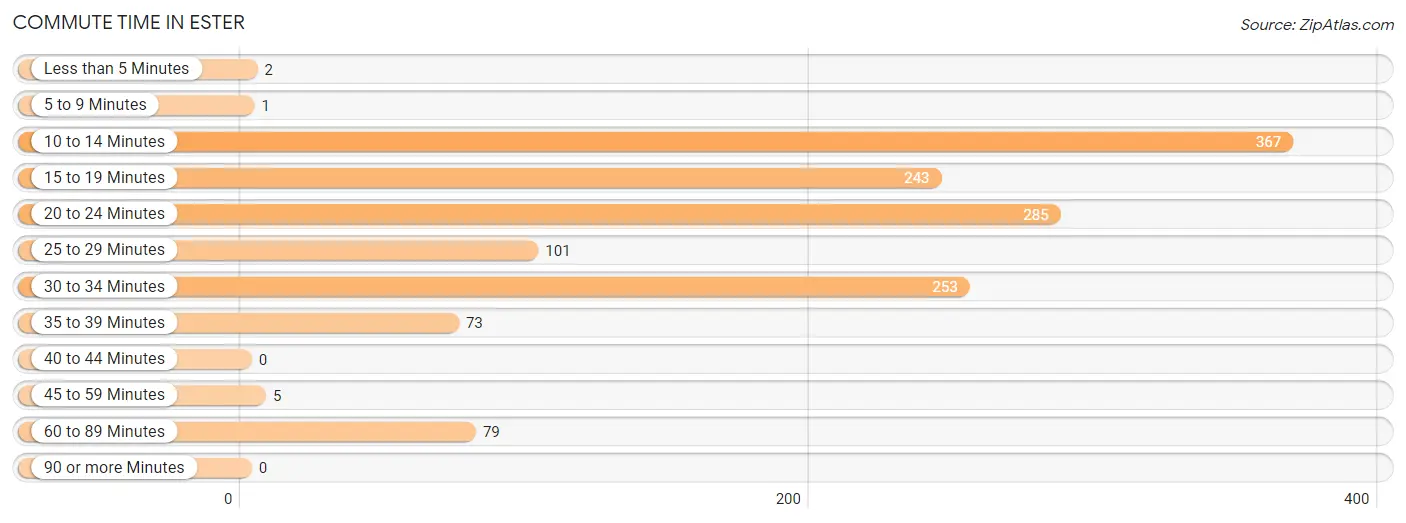
| Commute Time | # Commuters | % Commuters |
| Less than 5 Minutes | 2 | 0.1% |
| 5 to 9 Minutes | 1 | 0.1% |
| 10 to 14 Minutes | 367 | 26.1% |
| 15 to 19 Minutes | 243 | 17.2% |
| 20 to 24 Minutes | 285 | 20.2% |
| 25 to 29 Minutes | 101 | 7.2% |
| 30 to 34 Minutes | 253 | 18.0% |
| 35 to 39 Minutes | 73 | 5.2% |
| 40 to 44 Minutes | 0 | 0.0% |
| 45 to 59 Minutes | 5 | 0.4% |
| 60 to 89 Minutes | 79 | 5.6% |
| 90 or more Minutes | 0 | 0.0% |
Commute Time by Sex in Ester
The most common commute times in Ester are 30 to 34 minutes (227 commuters, 30.3%) for males and 20 to 24 minutes (285 commuters, 43.1%) for females.
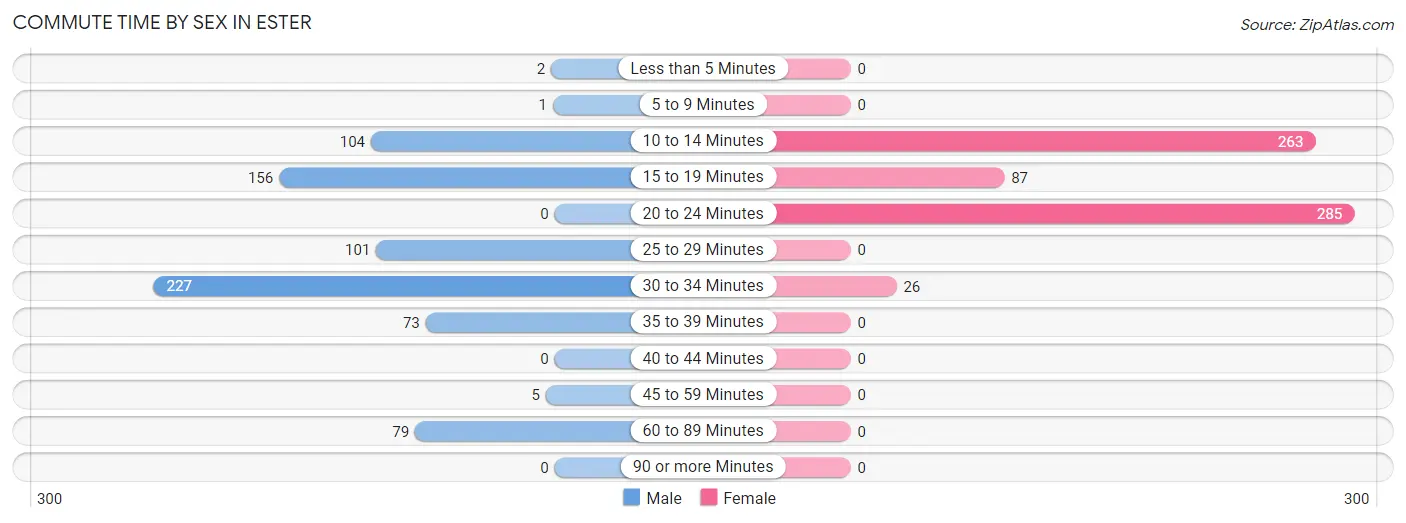
| Commute Time | Male | Female |
| Less than 5 Minutes | 2 (0.3%) | 0 (0.0%) |
| 5 to 9 Minutes | 1 (0.1%) | 0 (0.0%) |
| 10 to 14 Minutes | 104 (13.9%) | 263 (39.8%) |
| 15 to 19 Minutes | 156 (20.9%) | 87 (13.2%) |
| 20 to 24 Minutes | 0 (0.0%) | 285 (43.1%) |
| 25 to 29 Minutes | 101 (13.5%) | 0 (0.0%) |
| 30 to 34 Minutes | 227 (30.3%) | 26 (3.9%) |
| 35 to 39 Minutes | 73 (9.8%) | 0 (0.0%) |
| 40 to 44 Minutes | 0 (0.0%) | 0 (0.0%) |
| 45 to 59 Minutes | 5 (0.7%) | 0 (0.0%) |
| 60 to 89 Minutes | 79 (10.6%) | 0 (0.0%) |
| 90 or more Minutes | 0 (0.0%) | 0 (0.0%) |
Time of Departure to Work by Sex in Ester
The most frequent times of departure to work in Ester are 8:00 AM to 8:29 AM (160, 21.4%) for males and 10:00 AM to 10:59 AM (124, 18.8%) for females.
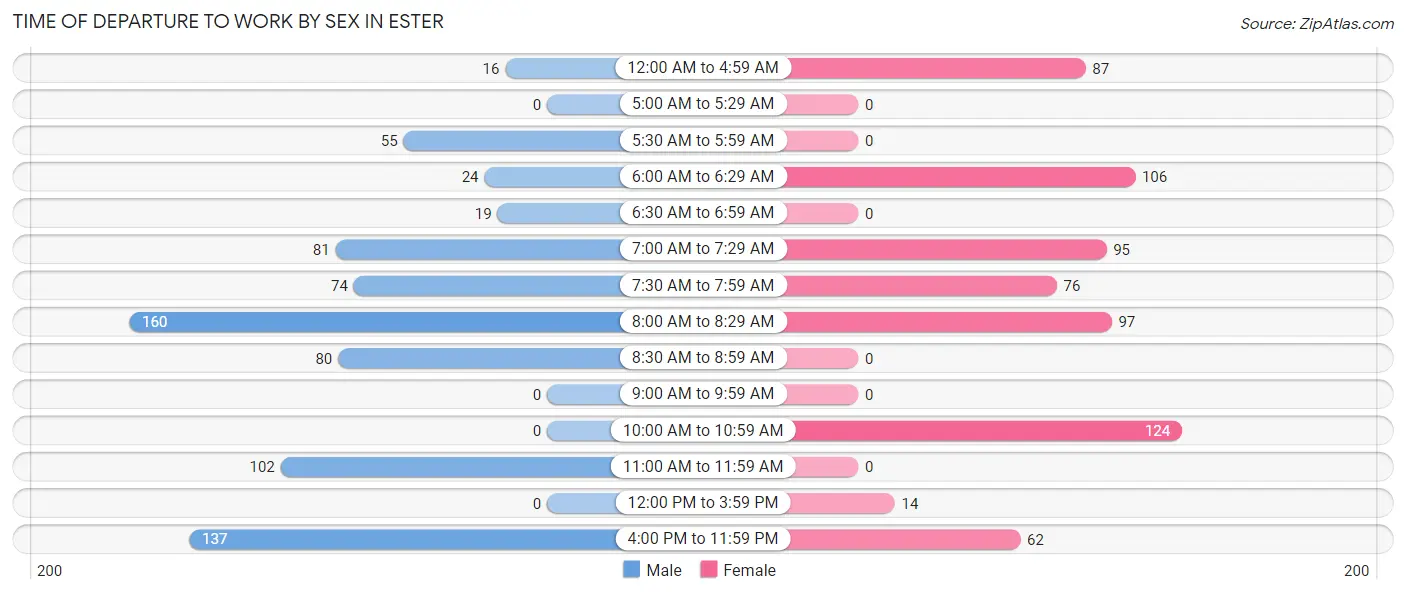
| Time of Departure | Male | Female |
| 12:00 AM to 4:59 AM | 16 (2.1%) | 87 (13.2%) |
| 5:00 AM to 5:29 AM | 0 (0.0%) | 0 (0.0%) |
| 5:30 AM to 5:59 AM | 55 (7.3%) | 0 (0.0%) |
| 6:00 AM to 6:29 AM | 24 (3.2%) | 106 (16.0%) |
| 6:30 AM to 6:59 AM | 19 (2.5%) | 0 (0.0%) |
| 7:00 AM to 7:29 AM | 81 (10.8%) | 95 (14.4%) |
| 7:30 AM to 7:59 AM | 74 (9.9%) | 76 (11.5%) |
| 8:00 AM to 8:29 AM | 160 (21.4%) | 97 (14.7%) |
| 8:30 AM to 8:59 AM | 80 (10.7%) | 0 (0.0%) |
| 9:00 AM to 9:59 AM | 0 (0.0%) | 0 (0.0%) |
| 10:00 AM to 10:59 AM | 0 (0.0%) | 124 (18.8%) |
| 11:00 AM to 11:59 AM | 102 (13.6%) | 0 (0.0%) |
| 12:00 PM to 3:59 PM | 0 (0.0%) | 14 (2.1%) |
| 4:00 PM to 11:59 PM | 137 (18.3%) | 62 (9.4%) |
| Total | 748 (100.0%) | 661 (100.0%) |
Housing Occupancy in Ester
Occupancy by Ownership in Ester
Of the total 1,368 dwellings in Ester, owner-occupied units account for 708 (51.7%), while renter-occupied units make up 660 (48.2%).
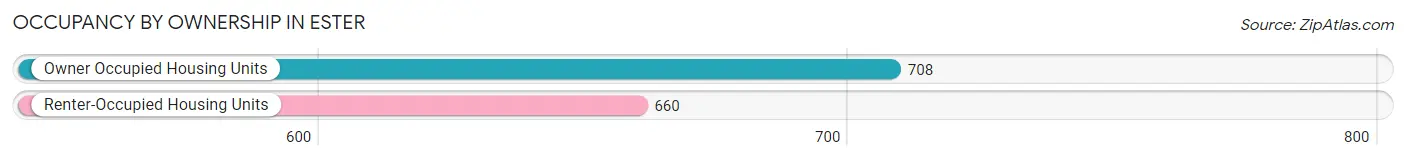
| Occupancy | # Housing Units | % Housing Units |
| Owner Occupied Housing Units | 708 | 51.7% |
| Renter-Occupied Housing Units | 660 | 48.2% |
| Total Occupied Housing Units | 1,368 | 100.0% |
Occupancy by Household Size in Ester
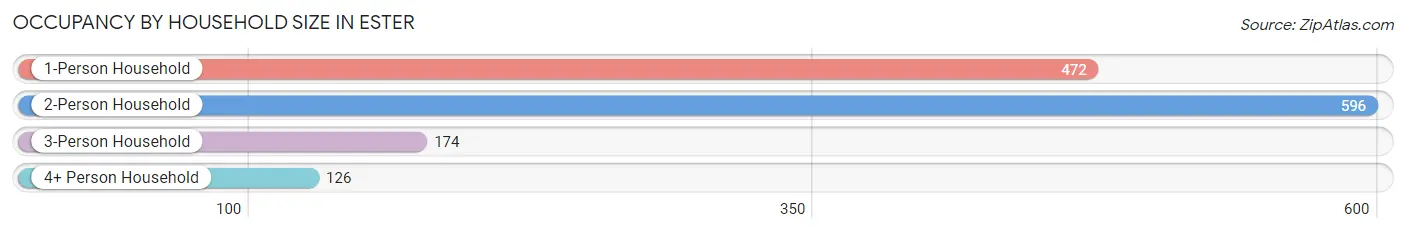
| Household Size | # Housing Units | % Housing Units |
| 1-Person Household | 472 | 34.5% |
| 2-Person Household | 596 | 43.6% |
| 3-Person Household | 174 | 12.7% |
| 4+ Person Household | 126 | 9.2% |
| Total Housing Units | 1,368 | 100.0% |
Occupancy by Ownership by Household Size in Ester
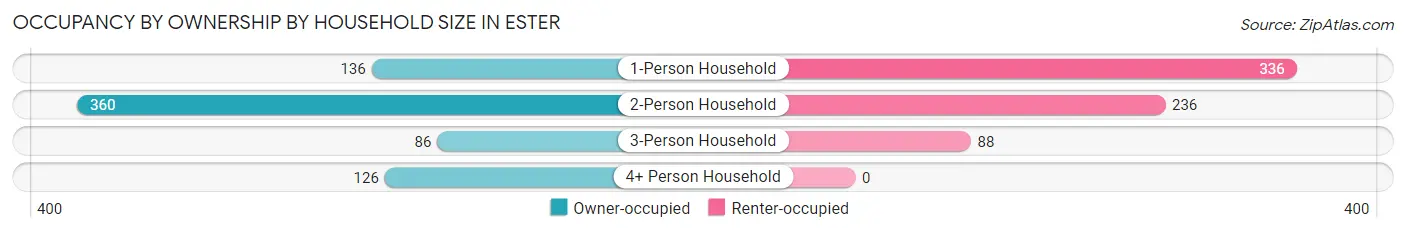
| Household Size | Owner-occupied | Renter-occupied |
| 1-Person Household | 136 (28.8%) | 336 (71.2%) |
| 2-Person Household | 360 (60.4%) | 236 (39.6%) |
| 3-Person Household | 86 (49.4%) | 88 (50.6%) |
| 4+ Person Household | 126 (100.0%) | 0 (0.0%) |
| Total Housing Units | 708 (51.7%) | 660 (48.2%) |
Occupancy by Educational Attainment in Ester

| Household Size | Owner-occupied | Renter-occupied |
| Less than High School | 91 (100.0%) | 0 (0.0%) |
| High School Diploma | 145 (47.1%) | 163 (52.9%) |
| College/Associate Degree | 95 (25.8%) | 274 (74.3%) |
| Bachelor's Degree or higher | 377 (62.8%) | 223 (37.2%) |
Occupancy by Age of Householder in Ester
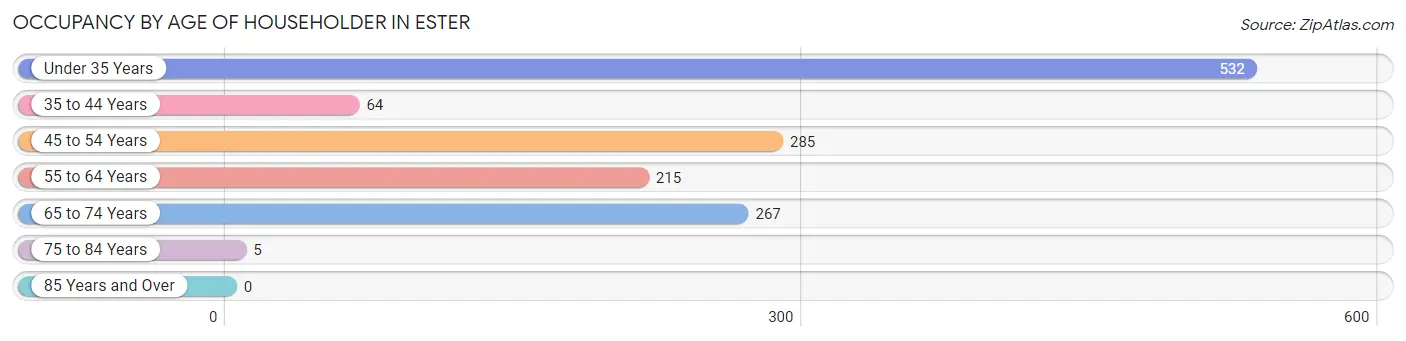
| Age Bracket | # Households | % Households |
| Under 35 Years | 532 | 38.9% |
| 35 to 44 Years | 64 | 4.7% |
| 45 to 54 Years | 285 | 20.8% |
| 55 to 64 Years | 215 | 15.7% |
| 65 to 74 Years | 267 | 19.5% |
| 75 to 84 Years | 5 | 0.4% |
| 85 Years and Over | 0 | 0.0% |
| Total | 1,368 | 100.0% |
Housing Finances in Ester
Median Income by Occupancy in Ester
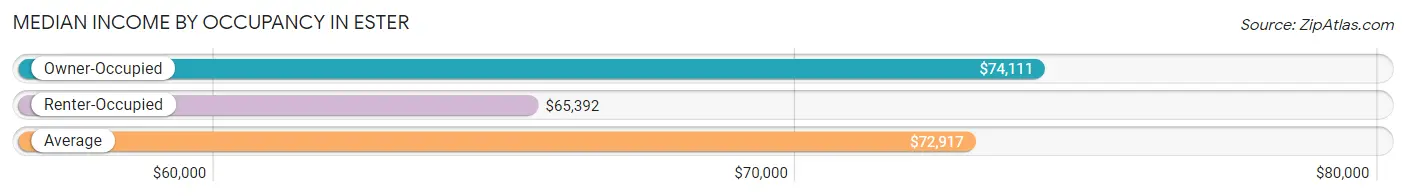
| Occupancy Type | # Households | Median Income |
| Owner-Occupied | 708 (51.7%) | $74,111 |
| Renter-Occupied | 660 (48.2%) | $65,392 |
| Average | 1,368 (100.0%) | $72,917 |
Occupancy by Householder Income Bracket in Ester
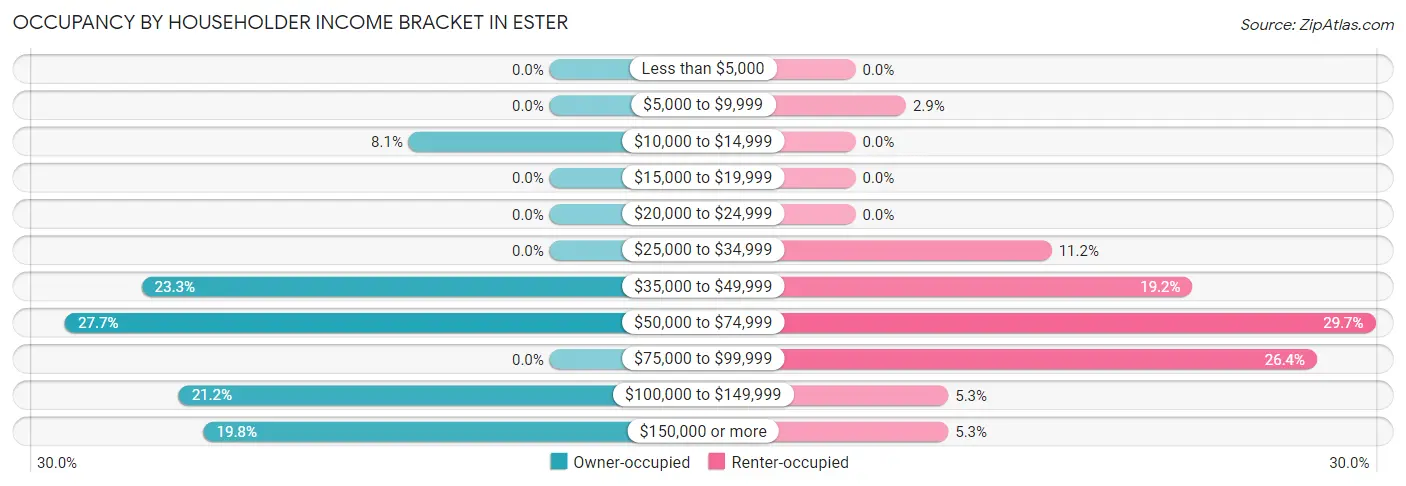
| Income Bracket | Owner-occupied | Renter-occupied |
| Less than $5,000 | 0 (0.0%) | 0 (0.0%) |
| $5,000 to $9,999 | 0 (0.0%) | 19 (2.9%) |
| $10,000 to $14,999 | 57 (8.1%) | 0 (0.0%) |
| $15,000 to $19,999 | 0 (0.0%) | 0 (0.0%) |
| $20,000 to $24,999 | 0 (0.0%) | 0 (0.0%) |
| $25,000 to $34,999 | 0 (0.0%) | 74 (11.2%) |
| $35,000 to $49,999 | 165 (23.3%) | 127 (19.2%) |
| $50,000 to $74,999 | 196 (27.7%) | 196 (29.7%) |
| $75,000 to $99,999 | 0 (0.0%) | 174 (26.4%) |
| $100,000 to $149,999 | 150 (21.2%) | 35 (5.3%) |
| $150,000 or more | 140 (19.8%) | 35 (5.3%) |
| Total | 708 (100.0%) | 660 (100.0%) |
Monthly Housing Cost Tiers in Ester
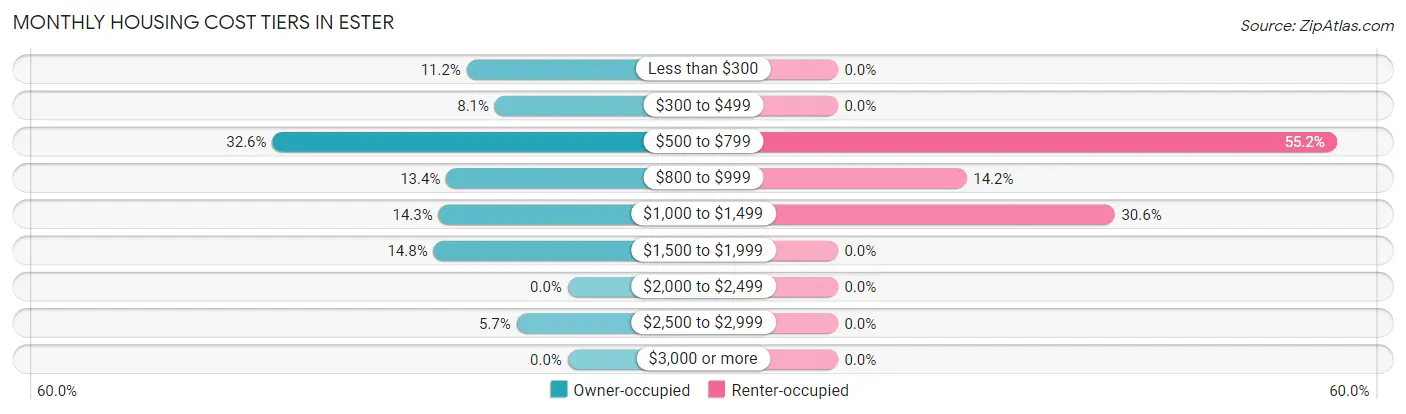
| Monthly Cost | Owner-occupied | Renter-occupied |
| Less than $300 | 79 (11.2%) | 0 (0.0%) |
| $300 to $499 | 57 (8.1%) | 0 (0.0%) |
| $500 to $799 | 231 (32.6%) | 364 (55.1%) |
| $800 to $999 | 95 (13.4%) | 94 (14.2%) |
| $1,000 to $1,499 | 101 (14.3%) | 202 (30.6%) |
| $1,500 to $1,999 | 105 (14.8%) | 0 (0.0%) |
| $2,000 to $2,499 | 0 (0.0%) | 0 (0.0%) |
| $2,500 to $2,999 | 40 (5.7%) | 0 (0.0%) |
| $3,000 or more | 0 (0.0%) | 0 (0.0%) |
| Total | 708 (100.0%) | 660 (100.0%) |
Physical Housing Characteristics in Ester
Housing Structures in Ester
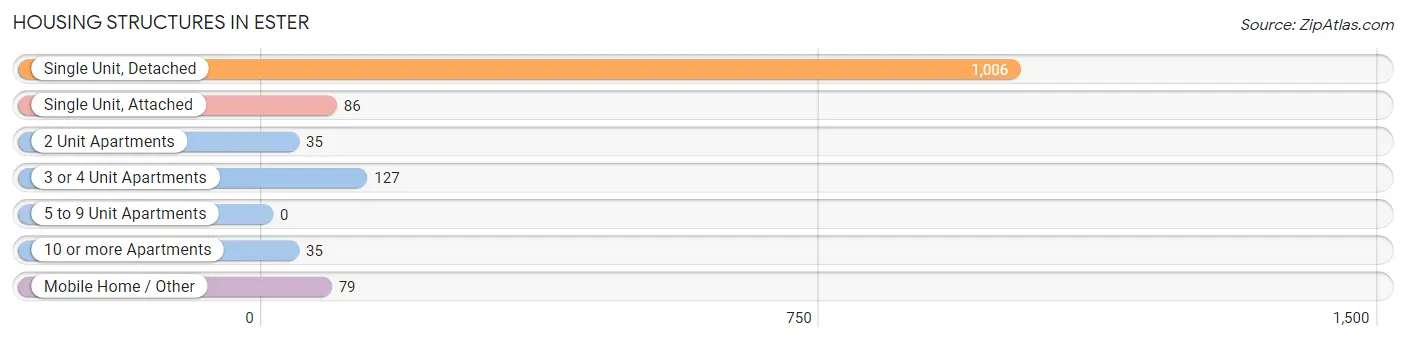
| Structure Type | # Housing Units | % Housing Units |
| Single Unit, Detached | 1,006 | 73.5% |
| Single Unit, Attached | 86 | 6.3% |
| 2 Unit Apartments | 35 | 2.6% |
| 3 or 4 Unit Apartments | 127 | 9.3% |
| 5 to 9 Unit Apartments | 0 | 0.0% |
| 10 or more Apartments | 35 | 2.6% |
| Mobile Home / Other | 79 | 5.8% |
| Total | 1,368 | 100.0% |
Housing Structures by Occupancy in Ester
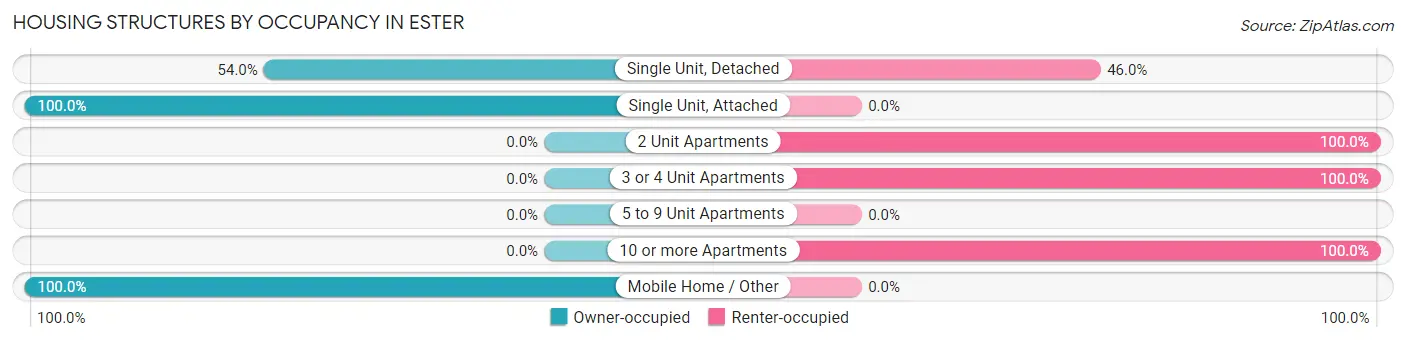
| Structure Type | Owner-occupied | Renter-occupied |
| Single Unit, Detached | 543 (54.0%) | 463 (46.0%) |
| Single Unit, Attached | 86 (100.0%) | 0 (0.0%) |
| 2 Unit Apartments | 0 (0.0%) | 35 (100.0%) |
| 3 or 4 Unit Apartments | 0 (0.0%) | 127 (100.0%) |
| 5 to 9 Unit Apartments | 0 (0.0%) | 0 (0.0%) |
| 10 or more Apartments | 0 (0.0%) | 35 (100.0%) |
| Mobile Home / Other | 79 (100.0%) | 0 (0.0%) |
| Total | 708 (51.7%) | 660 (48.2%) |
Housing Structures by Number of Rooms in Ester
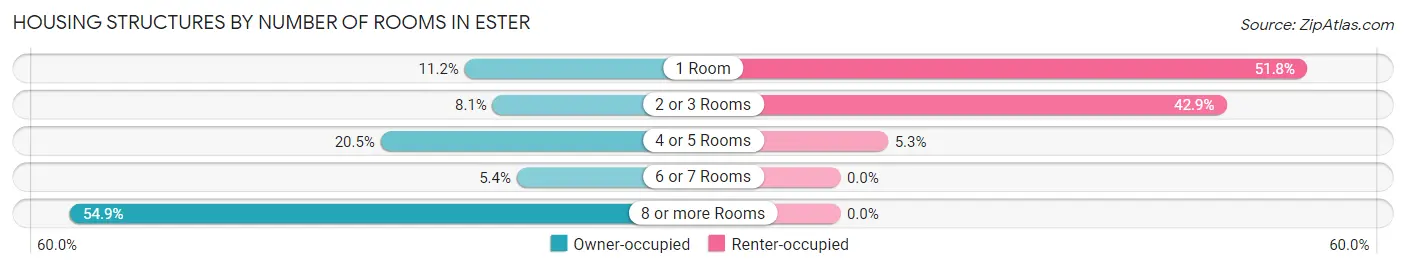
| Number of Rooms | Owner-occupied | Renter-occupied |
| 1 Room | 79 (11.2%) | 342 (51.8%) |
| 2 or 3 Rooms | 57 (8.1%) | 283 (42.9%) |
| 4 or 5 Rooms | 145 (20.5%) | 35 (5.3%) |
| 6 or 7 Rooms | 38 (5.4%) | 0 (0.0%) |
| 8 or more Rooms | 389 (54.9%) | 0 (0.0%) |
| Total | 708 (100.0%) | 660 (100.0%) |
Housing Structure by Heating Type in Ester
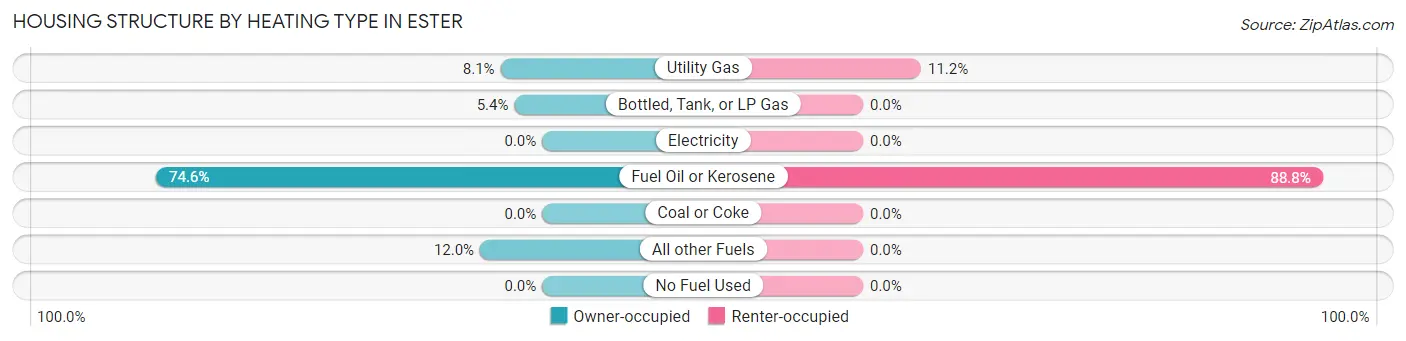
| Heating Type | Owner-occupied | Renter-occupied |
| Utility Gas | 57 (8.1%) | 74 (11.2%) |
| Bottled, Tank, or LP Gas | 38 (5.4%) | 0 (0.0%) |
| Electricity | 0 (0.0%) | 0 (0.0%) |
| Fuel Oil or Kerosene | 528 (74.6%) | 586 (88.8%) |
| Coal or Coke | 0 (0.0%) | 0 (0.0%) |
| All other Fuels | 85 (12.0%) | 0 (0.0%) |
| No Fuel Used | 0 (0.0%) | 0 (0.0%) |
| Total | 708 (100.0%) | 660 (100.0%) |
Household Vehicle Usage in Ester
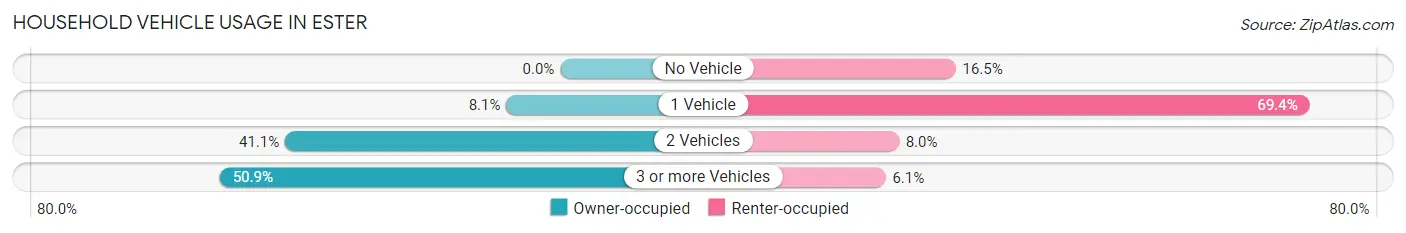
| Vehicles per Household | Owner-occupied | Renter-occupied |
| No Vehicle | 0 (0.0%) | 109 (16.5%) |
| 1 Vehicle | 57 (8.1%) | 458 (69.4%) |
| 2 Vehicles | 291 (41.1%) | 53 (8.0%) |
| 3 or more Vehicles | 360 (50.8%) | 40 (6.1%) |
| Total | 708 (100.0%) | 660 (100.0%) |
Real Estate & Mortgages in Ester
Real Estate and Mortgage Overview in Ester
| Characteristic | Without Mortgage | With Mortgage |
| Housing Units | 547 | 161 |
| Median Property Value | $238,200 | $356,700 |
| Median Household Income | $73,215 | $140 |
| Monthly Housing Costs | $736 | $0 |
| Real Estate Taxes | - | - |
Property Value by Mortgage Status in Ester
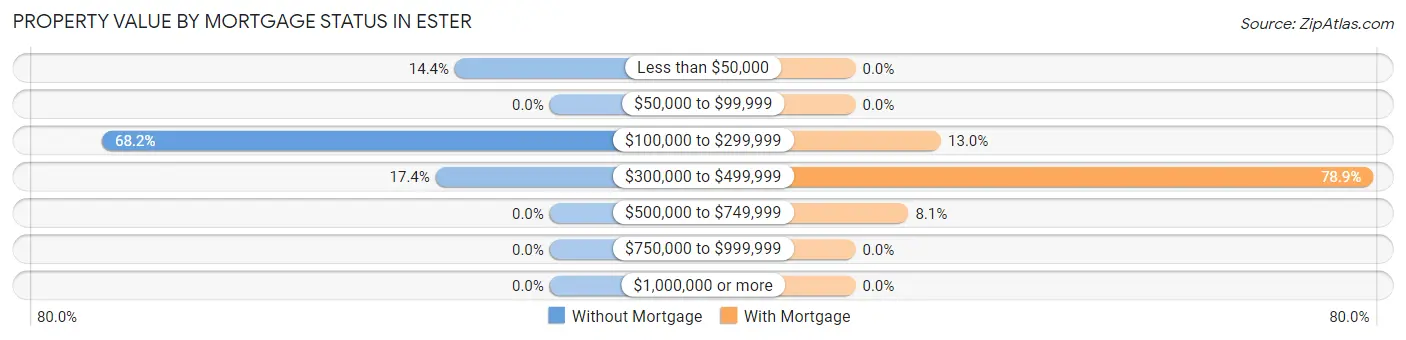
| Property Value | Without Mortgage | With Mortgage |
| Less than $50,000 | 79 (14.4%) | 0 (0.0%) |
| $50,000 to $99,999 | 0 (0.0%) | 0 (0.0%) |
| $100,000 to $299,999 | 373 (68.2%) | 21 (13.0%) |
| $300,000 to $499,999 | 95 (17.4%) | 127 (78.9%) |
| $500,000 to $749,999 | 0 (0.0%) | 13 (8.1%) |
| $750,000 to $999,999 | 0 (0.0%) | 0 (0.0%) |
| $1,000,000 or more | 0 (0.0%) | 0 (0.0%) |
| Total | 547 (100.0%) | 161 (100.0%) |
Household Income by Mortgage Status in Ester
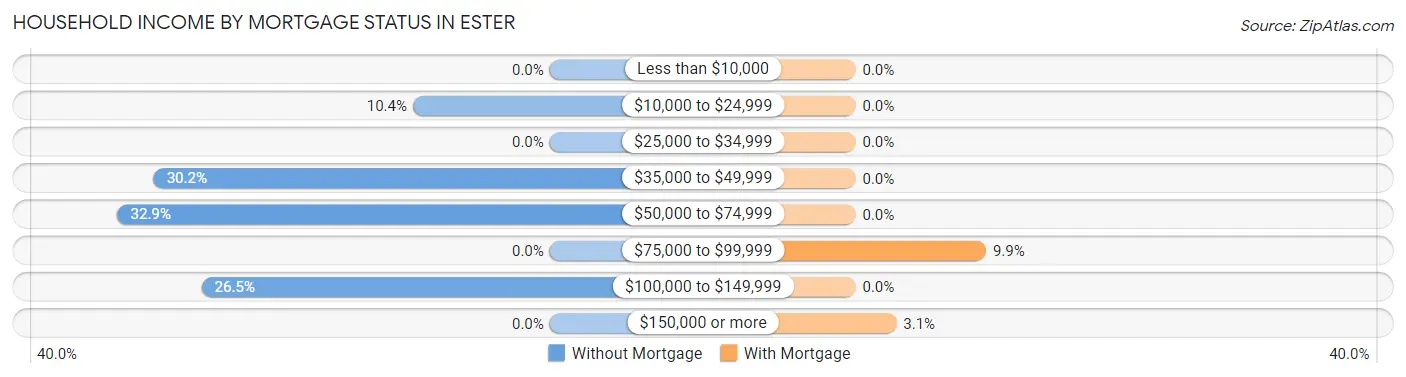
| Household Income | Without Mortgage | With Mortgage |
| Less than $10,000 | 0 (0.0%) | 0 (0.0%) |
| $10,000 to $24,999 | 57 (10.4%) | 0 (0.0%) |
| $25,000 to $34,999 | 0 (0.0%) | 0 (0.0%) |
| $35,000 to $49,999 | 165 (30.2%) | 0 (0.0%) |
| $50,000 to $74,999 | 180 (32.9%) | 0 (0.0%) |
| $75,000 to $99,999 | 0 (0.0%) | 16 (9.9%) |
| $100,000 to $149,999 | 145 (26.5%) | 0 (0.0%) |
| $150,000 or more | 0 (0.0%) | 5 (3.1%) |
| Total | 547 (100.0%) | 161 (100.0%) |
Property Value to Household Income Ratio in Ester
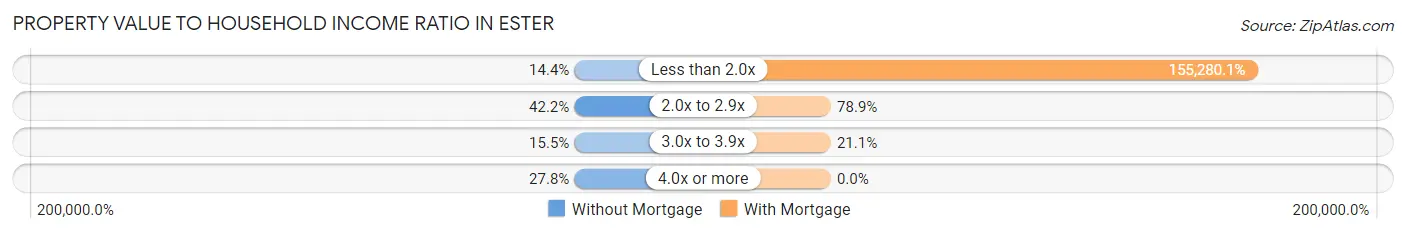
| Value-to-Income Ratio | Without Mortgage | With Mortgage |
| Less than 2.0x | 79 (14.4%) | 250,001 (155,280.1%) |
| 2.0x to 2.9x | 231 (42.2%) | 127 (78.9%) |
| 3.0x to 3.9x | 85 (15.5%) | 34 (21.1%) |
| 4.0x or more | 152 (27.8%) | 0 (0.0%) |
| Total | 547 (100.0%) | 161 (100.0%) |
Real Estate Taxes by Mortgage Status in Ester
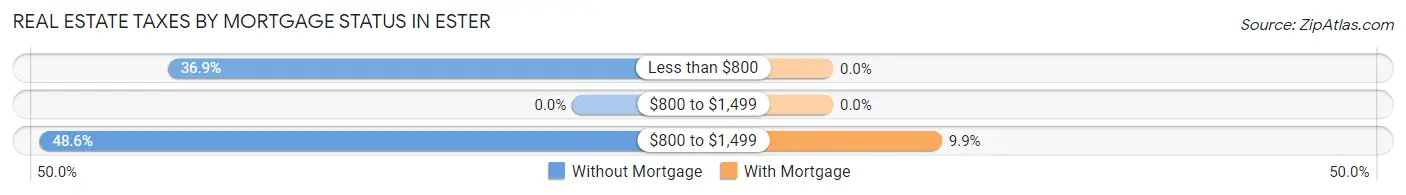
| Property Taxes | Without Mortgage | With Mortgage |
| Less than $800 | 202 (36.9%) | 0 (0.0%) |
| $800 to $1,499 | 0 (0.0%) | 0 (0.0%) |
| $800 to $1,499 | 266 (48.6%) | 16 (9.9%) |
| Total | 547 (100.0%) | 161 (100.0%) |
Health & Disability in Ester
Health Insurance Coverage by Age in Ester
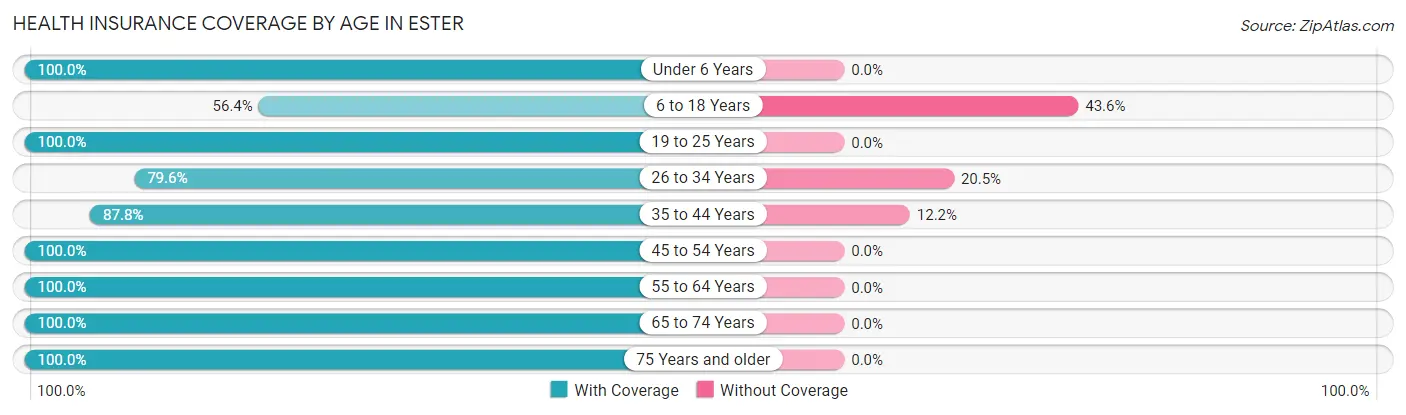
| Age Bracket | With Coverage | Without Coverage |
| Under 6 Years | 69 (100.0%) | 0 (0.0%) |
| 6 to 18 Years | 155 (56.4%) | 120 (43.6%) |
| 19 to 25 Years | 308 (100.0%) | 0 (0.0%) |
| 26 to 34 Years | 498 (79.5%) | 128 (20.4%) |
| 35 to 44 Years | 280 (87.8%) | 39 (12.2%) |
| 45 to 54 Years | 501 (100.0%) | 0 (0.0%) |
| 55 to 64 Years | 530 (100.0%) | 0 (0.0%) |
| 65 to 74 Years | 267 (100.0%) | 0 (0.0%) |
| 75 Years and older | 5 (100.0%) | 0 (0.0%) |
| Total | 2,613 (90.1%) | 287 (9.9%) |
Health Insurance Coverage by Citizenship Status in Ester

| Citizenship Status | With Coverage | Without Coverage |
| Native Born | 69 (100.0%) | 0 (0.0%) |
| Foreign Born, Citizen | 155 (56.4%) | 120 (43.6%) |
| Foreign Born, not a Citizen | 308 (100.0%) | 0 (0.0%) |
Health Insurance Coverage by Household Income in Ester
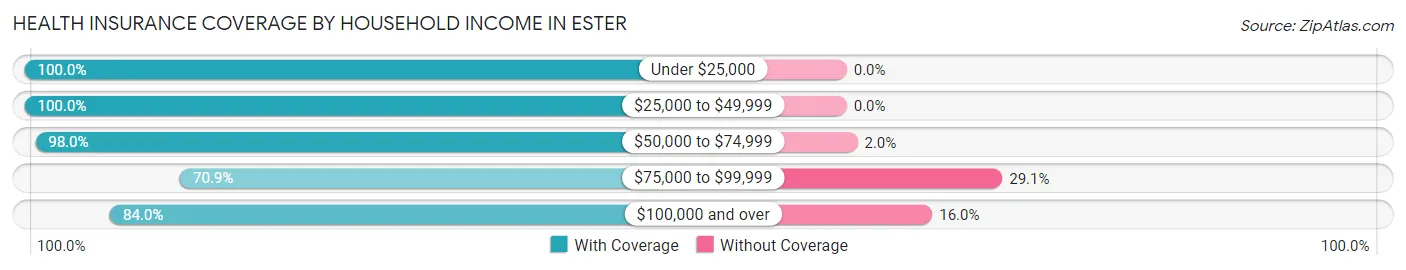
| Household Income | With Coverage | Without Coverage |
| Under $25,000 | 76 (100.0%) | 0 (0.0%) |
| $25,000 to $49,999 | 548 (100.0%) | 0 (0.0%) |
| $50,000 to $74,999 | 782 (98.0%) | 16 (2.0%) |
| $75,000 to $99,999 | 248 (70.9%) | 102 (29.1%) |
| $100,000 and over | 886 (84.0%) | 169 (16.0%) |
Public vs Private Health Insurance Coverage by Age in Ester
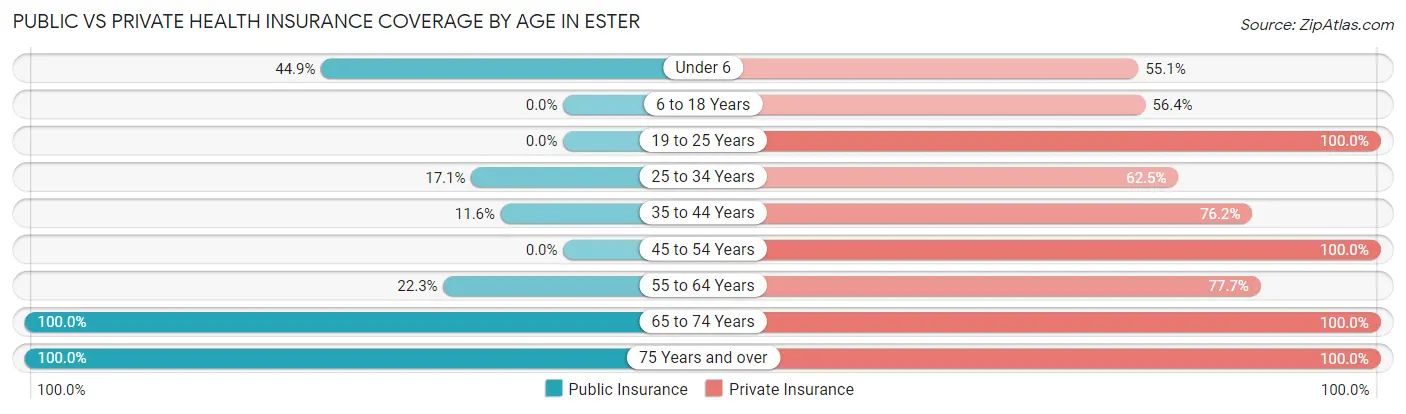
| Age Bracket | Public Insurance | Private Insurance |
| Under 6 | 31 (44.9%) | 38 (55.1%) |
| 6 to 18 Years | 0 (0.0%) | 155 (56.4%) |
| 19 to 25 Years | 0 (0.0%) | 308 (100.0%) |
| 25 to 34 Years | 107 (17.1%) | 391 (62.5%) |
| 35 to 44 Years | 37 (11.6%) | 243 (76.2%) |
| 45 to 54 Years | 0 (0.0%) | 501 (100.0%) |
| 55 to 64 Years | 118 (22.3%) | 412 (77.7%) |
| 65 to 74 Years | 267 (100.0%) | 267 (100.0%) |
| 75 Years and over | 5 (100.0%) | 5 (100.0%) |
| Total | 565 (19.5%) | 2,320 (80.0%) |
Disability Status by Sex by Age in Ester
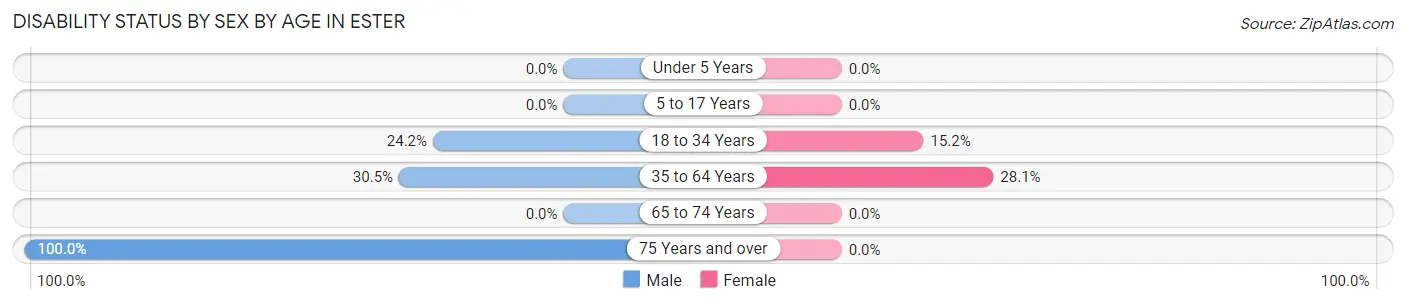
| Age Bracket | Male | Female |
| Under 5 Years | 0 (0.0%) | 0 (0.0%) |
| 5 to 17 Years | 0 (0.0%) | 0 (0.0%) |
| 18 to 34 Years | 164 (24.2%) | 39 (15.2%) |
| 35 to 64 Years | 181 (30.5%) | 213 (28.1%) |
| 65 to 74 Years | 0 (0.0%) | 0 (0.0%) |
| 75 Years and over | 5 (100.0%) | 0 (0.0%) |
Disability Class by Sex by Age in Ester
Disability Class: Hearing Difficulty

| Age Bracket | Male | Female |
| Under 5 Years | 0 (0.0%) | 0 (0.0%) |
| 5 to 17 Years | 0 (0.0%) | 0 (0.0%) |
| 18 to 34 Years | 0 (0.0%) | 0 (0.0%) |
| 35 to 64 Years | 26 (4.4%) | 0 (0.0%) |
| 65 to 74 Years | 0 (0.0%) | 0 (0.0%) |
| 75 Years and over | 5 (100.0%) | 0 (0.0%) |
Disability Class: Vision Difficulty
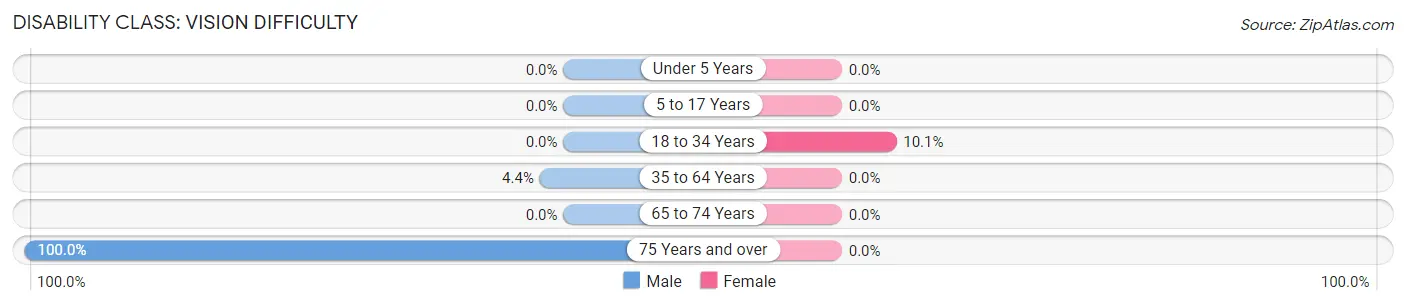
| Age Bracket | Male | Female |
| Under 5 Years | 0 (0.0%) | 0 (0.0%) |
| 5 to 17 Years | 0 (0.0%) | 0 (0.0%) |
| 18 to 34 Years | 0 (0.0%) | 26 (10.1%) |
| 35 to 64 Years | 26 (4.4%) | 0 (0.0%) |
| 65 to 74 Years | 0 (0.0%) | 0 (0.0%) |
| 75 Years and over | 5 (100.0%) | 0 (0.0%) |
Disability Class: Cognitive Difficulty
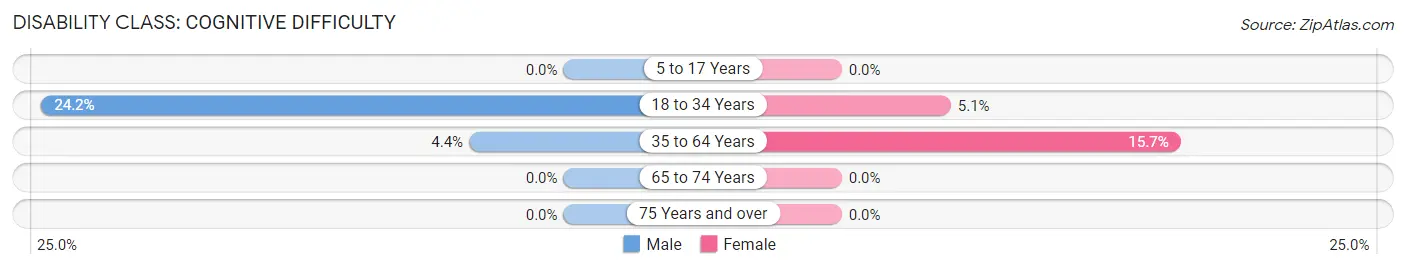
| Age Bracket | Male | Female |
| 5 to 17 Years | 0 (0.0%) | 0 (0.0%) |
| 18 to 34 Years | 164 (24.2%) | 13 (5.1%) |
| 35 to 64 Years | 26 (4.4%) | 119 (15.7%) |
| 65 to 74 Years | 0 (0.0%) | 0 (0.0%) |
| 75 Years and over | 0 (0.0%) | 0 (0.0%) |
Disability Class: Ambulatory Difficulty
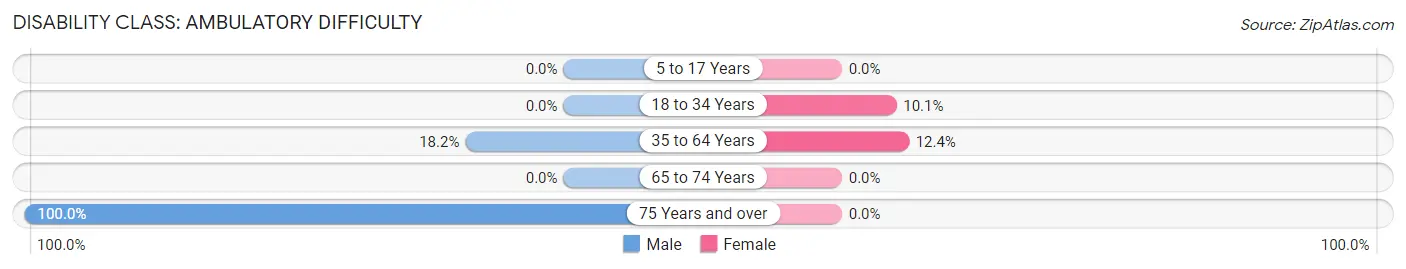
| Age Bracket | Male | Female |
| 5 to 17 Years | 0 (0.0%) | 0 (0.0%) |
| 18 to 34 Years | 0 (0.0%) | 26 (10.1%) |
| 35 to 64 Years | 108 (18.2%) | 94 (12.4%) |
| 65 to 74 Years | 0 (0.0%) | 0 (0.0%) |
| 75 Years and over | 5 (100.0%) | 0 (0.0%) |
Disability Class: Self-Care Difficulty
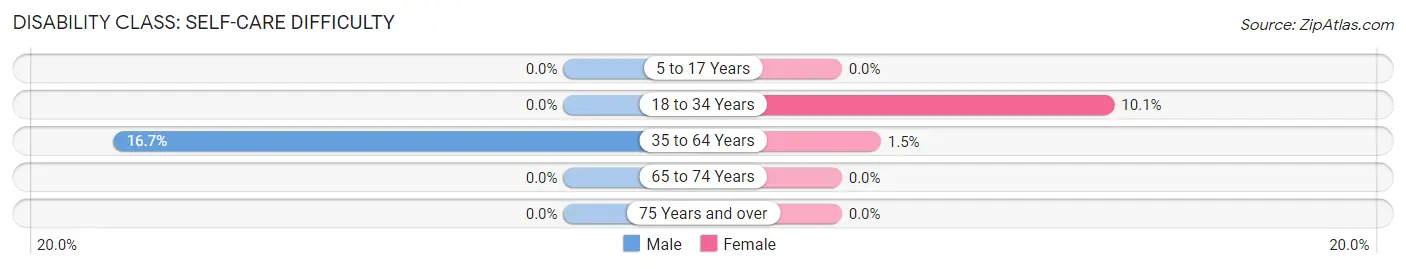
| Age Bracket | Male | Female |
| 5 to 17 Years | 0 (0.0%) | 0 (0.0%) |
| 18 to 34 Years | 0 (0.0%) | 26 (10.1%) |
| 35 to 64 Years | 99 (16.7%) | 11 (1.5%) |
| 65 to 74 Years | 0 (0.0%) | 0 (0.0%) |
| 75 Years and over | 0 (0.0%) | 0 (0.0%) |
Technology Access in Ester
Computing Device Access in Ester
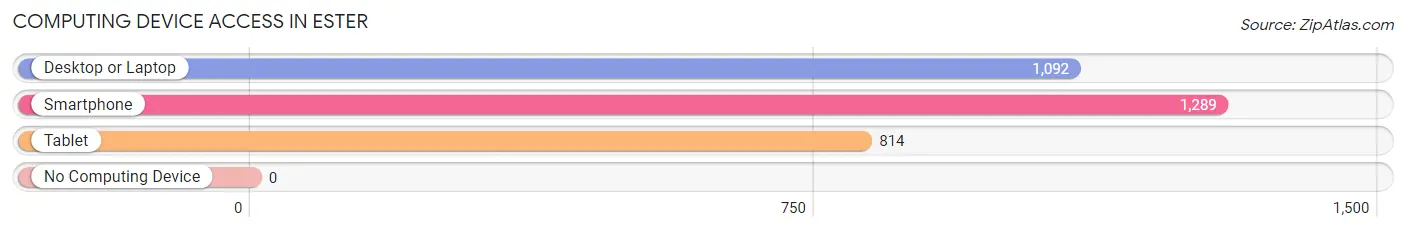
| Device Type | # Households | % Households |
| Desktop or Laptop | 1,092 | 79.8% |
| Smartphone | 1,289 | 94.2% |
| Tablet | 814 | 59.5% |
| No Computing Device | 0 | 0.0% |
| Total | 1,368 | 100.0% |
Internet Access in Ester
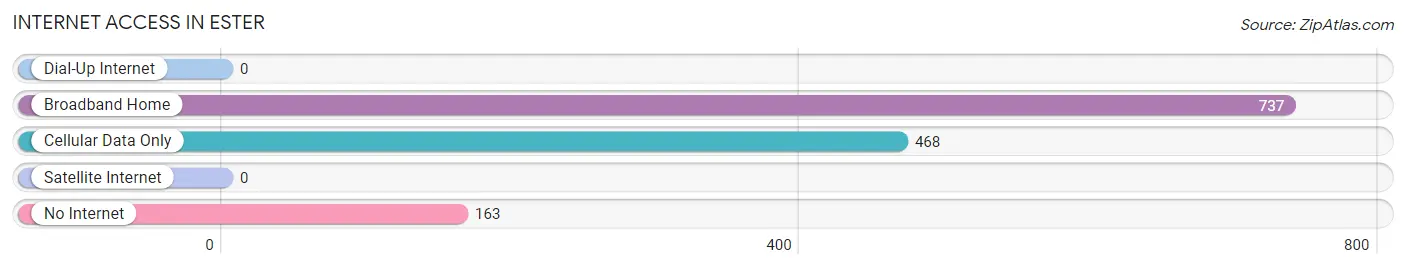
| Internet Type | # Households | % Households |
| Dial-Up Internet | 0 | 0.0% |
| Broadband Home | 737 | 53.9% |
| Cellular Data Only | 468 | 34.2% |
| Satellite Internet | 0 | 0.0% |
| No Internet | 163 | 11.9% |
| Total | 1,368 | 100.0% |
Ester Summary
Ester is a census-designated place (CDP) located in the Fairbanks North Star Borough in the U.S. state of Alaska. It is located on the south bank of the Chena River, about 10 miles (16 km) east of Fairbanks. As of the 2010 census, the population of Ester was 1,722.
Geography
Ester is located at 64°51'17" North, 147°45'17" West (64.854722, -147.754722). According to the United States Census Bureau, the CDP has a total area of 11.2 square miles (29.0 km2), all of it land.
Ester is located in the Tanana Valley, a flat, low-lying area between the Alaska Range to the south and the White Mountains to the north. The Chena River flows through the valley, and Ester is located on its south bank. The climate is subarctic, with long, cold winters and short, cool summers.
Economy
Ester's economy is largely based on tourism and services. The area is popular with tourists due to its proximity to Fairbanks and its natural beauty. There are several lodges and cabins in the area, as well as a few restaurants and stores.
The Ester Gold Camp is a popular tourist attraction. It is a former gold mining camp that has been restored and is now open to the public. Visitors can pan for gold, take a tour of the camp, and learn about the history of gold mining in the area.
The Ester Community Center is a popular gathering place for locals and visitors alike. It hosts a variety of events, including concerts, art shows, and community meetings.
Demographics
As of the 2010 census, there were 1,722 people, 745 households, and 463 families residing in the CDP. The population density was 153.7 people per square mile (59.3/km2). There were 845 housing units at an average density of 75.3 per square mile (29.1/km2). The racial makeup of the CDP was 87.2% White, 0.9% Black or African American, 5.2% Native American, 0.7% Asian, 0.1% Pacific Islander, 0.9% from other races, and 4.9% from two or more races. Hispanic or Latino of any race were 3.2% of the population.
There were 745 households, out of which 28.2% had children under the age of 18 living with them, 44.2% were married couples living together, 11.2% had a female householder with no husband present, and 38.7% were non-families. 32.2% of all households were made up of individuals, and 8.2% had someone living alone who was 65 years of age or older. The average household size was 2.30 and the average family size was 2.90.
In the CDP, the population was spread out, with 24.2% under the age of 18, 8.2% from 18 to 24, 28.2% from 25 to 44, 28.2% from 45 to 64, and 11.2% who were 65 years of age or older. The median age was 38 years. For every 100 females, there were 103.2 males. For every 100 females age 18 and over, there were 103.2 males.
The median income for a household in the CDP was $45,000, and the median income for a family was $50,000. Males had a median income of $41,000 versus $30,000 for females. The per capita income for the CDP was $20,000. About 8.2% of families and 11.2% of the population were below the poverty line, including 16.2% of those under age 18 and none of those age 65 or over.
Common Questions
What is Per Capita Income in Ester?
Per Capita income in Ester is $42,150.
What is the Median Family Income in Ester?
Median Family Income in Ester is $74,278.
What is the Median Household income in Ester?
Median Household Income in Ester is $72,917.
What is Income or Wage Gap in Ester?
Income or Wage Gap in Ester is 15.3%.
Women in Ester earn 84.7 cents for every dollar earned by a man.
What is Inequality or Gini Index in Ester?
Inequality or Gini Index in Ester is 0.39.
What is the Total Population of Ester?
Total Population of Ester is 2,989.
What is the Total Male Population of Ester?
Total Male Population of Ester is 1,851.
What is the Total Female Population of Ester?
Total Female Population of Ester is 1,138.
What is the Ratio of Males per 100 Females in Ester?
There are 162.65 Males per 100 Females in Ester.
What is the Ratio of Females per 100 Males in Ester?
There are 61.48 Females per 100 Males in Ester.
What is the Median Population Age in Ester?
Median Population Age in Ester is 38.8 Years.
What is the Average Family Size in Ester
Average Family Size in Ester is 2.6 People.
What is the Average Household Size in Ester
Average Household Size in Ester is 2.1 People.
How Large is the Labor Force in Ester?
There are 1,656 People in the Labor Forcein in Ester.
What is the Percentage of People in the Labor Force in Ester?
62.6% of People are in the Labor Force in Ester.
What is the Unemployment Rate in Ester?
Unemployment Rate in Ester is 3.5%.