Emmonak, AK Map & Demographics
Emmonak Map
Emmonak Overview
$18,825
PER CAPITA INCOME
$41,641
AVG FAMILY INCOME
$45,655
AVG HOUSEHOLD INCOME
23.0%
WAGE / INCOME GAP [ % ]
77.0¢/ $1
WAGE / INCOME GAP [ $ ]
0.44
INEQUALITY / GINI INDEX
1,293
TOTAL POPULATION
731
MALE POPULATION
562
FEMALE POPULATION
130.07
MALES / 100 FEMALES
76.88
FEMALES / 100 MALES
26.8
MEDIAN AGE
4.3
AVG FAMILY SIZE
3.6
AVG HOUSEHOLD SIZE
570
LABOR FORCE [ PEOPLE ]
67.6%
PERCENT IN LABOR FORCE
17.5%
UNEMPLOYMENT RATE
Emmonak Zip Codes
Emmonak Area Codes
Income in Emmonak
Income Overview in Emmonak
Per Capita Income in Emmonak is $18,825, while median incomes of families and households are $41,641 and $45,655 respectively.
| Characteristic | Number | Measure |
| Per Capita Income | 1,293 | $18,825 |
| Median Family Income | 241 | $41,641 |
| Mean Family Income | 241 | $60,976 |
| Median Household Income | 343 | $45,655 |
| Mean Household Income | 343 | $57,161 |
| Income Deficit | 241 | $0 |
| Wage / Income Gap (%) | 1,293 | 23.04% |
| Wage / Income Gap ($) | 1,293 | 76.96¢ per $1 |
| Gini / Inequality Index | 1,293 | 0.44 |
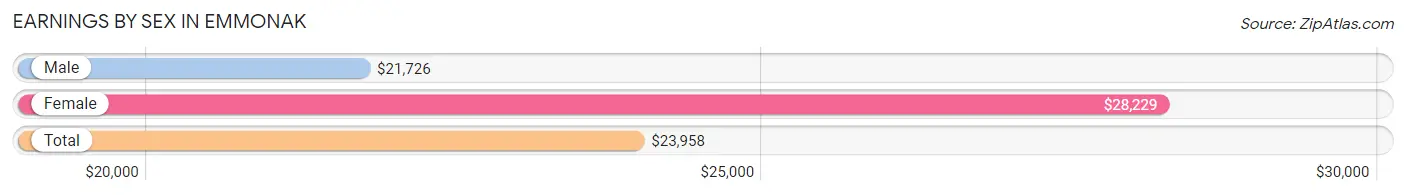
Earnings by Sex in Emmonak
Average Earnings in Emmonak are $23,958, $21,726 for men and $28,229 for women, a difference of 23.0%.
| Sex | Number | Average Earnings |
| Male | 367 (55.7%) | $21,726 |
| Female | 292 (44.3%) | $28,229 |
| Total | 659 (100.0%) | $23,958 |
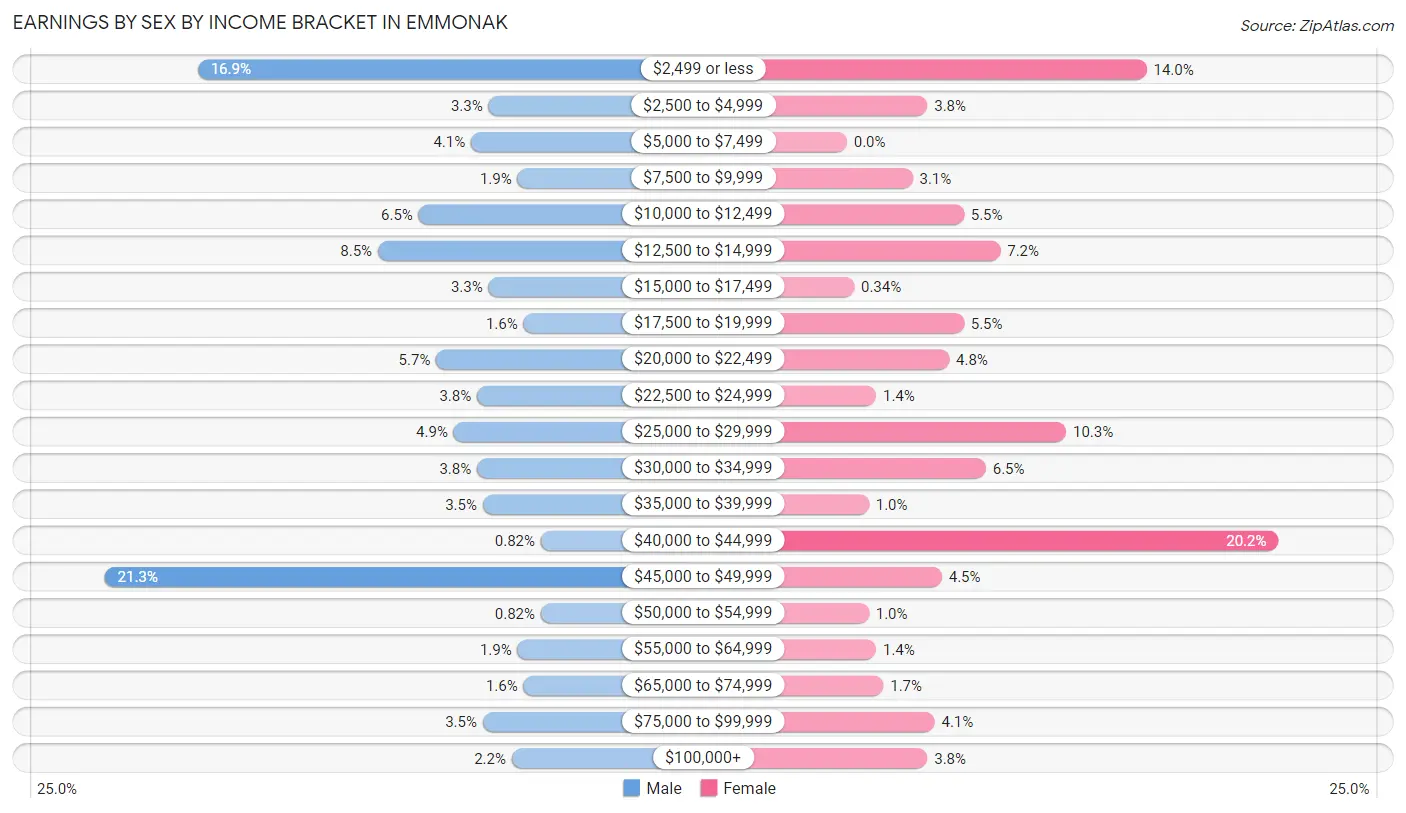
Earnings by Sex by Income Bracket in Emmonak
The most common earnings brackets in Emmonak are $45,000 to $49,999 for men (78 | 21.2%) and $40,000 to $44,999 for women (59 | 20.2%).
| Income | Male | Female |
| $2,499 or less | 62 (16.9%) | 41 (14.0%) |
| $2,500 to $4,999 | 12 (3.3%) | 11 (3.8%) |
| $5,000 to $7,499 | 15 (4.1%) | 0 (0.0%) |
| $7,500 to $9,999 | 7 (1.9%) | 9 (3.1%) |
| $10,000 to $12,499 | 24 (6.5%) | 16 (5.5%) |
| $12,500 to $14,999 | 31 (8.5%) | 21 (7.2%) |
| $15,000 to $17,499 | 12 (3.3%) | 1 (0.3%) |
| $17,500 to $19,999 | 6 (1.6%) | 16 (5.5%) |
| $20,000 to $22,499 | 21 (5.7%) | 14 (4.8%) |
| $22,500 to $24,999 | 14 (3.8%) | 4 (1.4%) |
| $25,000 to $29,999 | 18 (4.9%) | 30 (10.3%) |
| $30,000 to $34,999 | 14 (3.8%) | 19 (6.5%) |
| $35,000 to $39,999 | 13 (3.5%) | 3 (1.0%) |
| $40,000 to $44,999 | 3 (0.8%) | 59 (20.2%) |
| $45,000 to $49,999 | 78 (21.2%) | 13 (4.4%) |
| $50,000 to $54,999 | 3 (0.8%) | 3 (1.0%) |
| $55,000 to $64,999 | 7 (1.9%) | 4 (1.4%) |
| $65,000 to $74,999 | 6 (1.6%) | 5 (1.7%) |
| $75,000 to $99,999 | 13 (3.5%) | 12 (4.1%) |
| $100,000+ | 8 (2.2%) | 11 (3.8%) |
| Total | 367 (100.0%) | 292 (100.0%) |
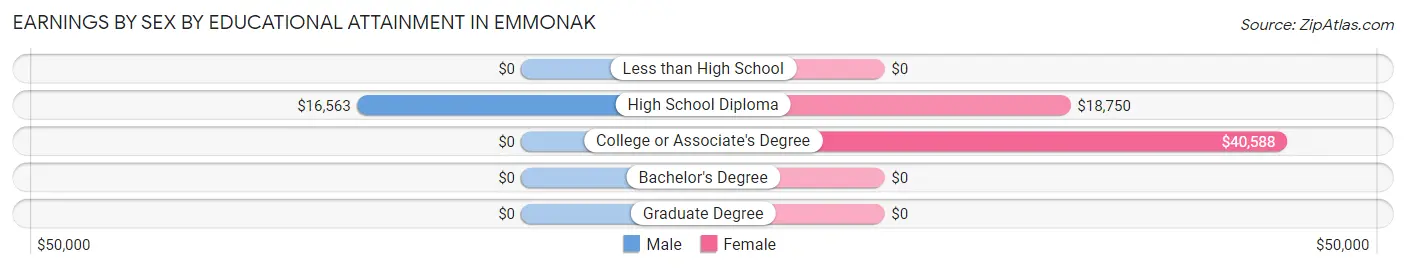
Earnings by Sex by Educational Attainment in Emmonak
| Educational Attainment | Male Income | Female Income |
| Less than High School | - | - |
| High School Diploma | $16,563 | $18,750 |
| College or Associate's Degree | - | - |
| Bachelor's Degree | - | - |
| Graduate Degree | - | - |
| Total | - | - |
Family Income in Emmonak
Family Income Brackets in Emmonak
According to the Emmonak family income data, there are 64 families falling into the $35,000 to $49,999 income range, which is the most common income bracket and makes up 26.6% of all families. Conversely, the $200,000+ income bracket is the least frequent group with only 3 families (1.2%) belonging to this category.
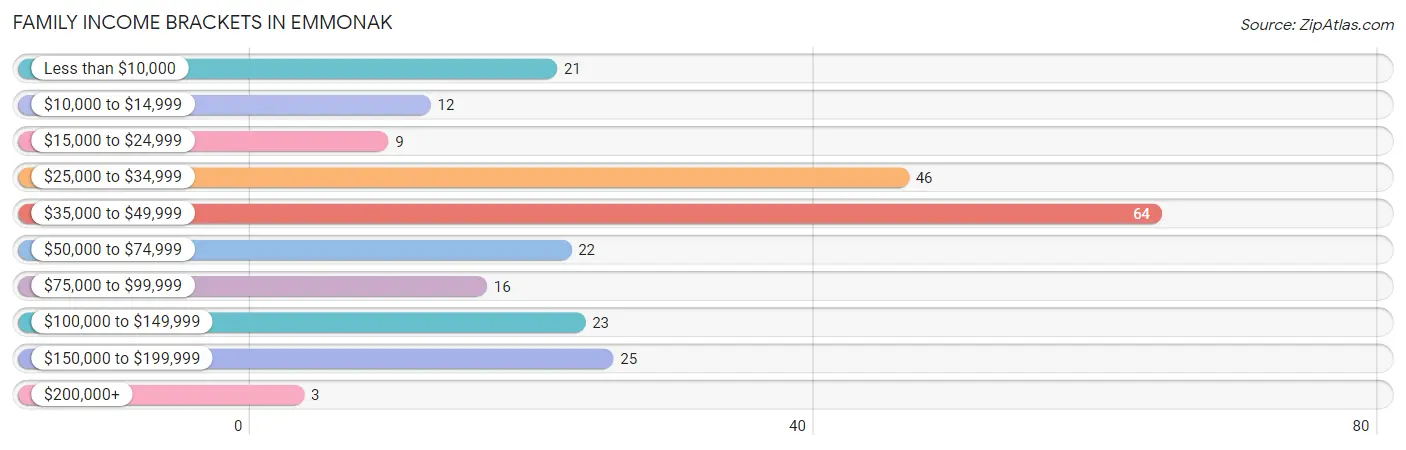
| Income Bracket | # Families | % Families |
| Less than $10,000 | 21 | 8.7% |
| $10,000 to $14,999 | 12 | 5.0% |
| $15,000 to $24,999 | 9 | 3.7% |
| $25,000 to $34,999 | 46 | 19.1% |
| $35,000 to $49,999 | 64 | 26.6% |
| $50,000 to $74,999 | 22 | 9.1% |
| $75,000 to $99,999 | 16 | 6.6% |
| $100,000 to $149,999 | 23 | 9.5% |
| $150,000 to $199,999 | 25 | 10.4% |
| $200,000+ | 3 | 1.2% |
Family Income by Famaliy Size in Emmonak
3-person families (69 | 28.6%) account for the highest median family income in Emmonak with $37,344 per family, while 2-person families (54 | 22.4%) have the highest median income of $13,173 per family member.
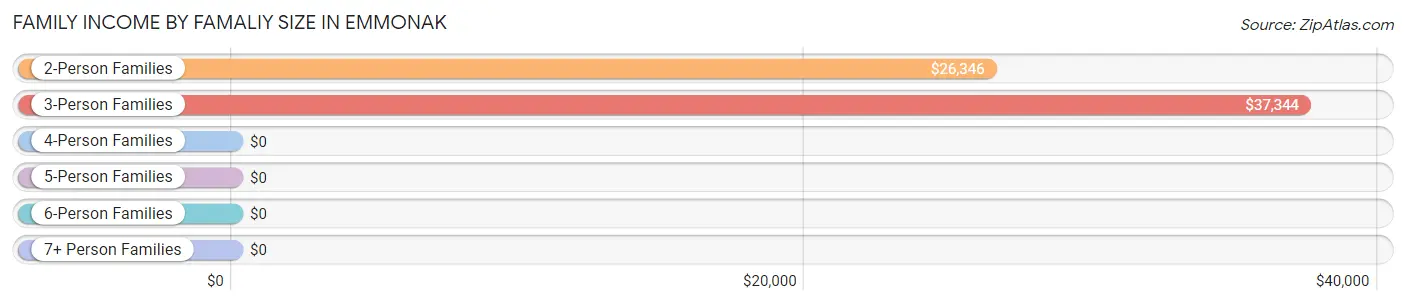
| Income Bracket | # Families | Median Income |
| 2-Person Families | 54 (22.4%) | $26,346 |
| 3-Person Families | 69 (28.6%) | $37,344 |
| 4-Person Families | 45 (18.7%) | $0 |
| 5-Person Families | 16 (6.6%) | $0 |
| 6-Person Families | 32 (13.3%) | $0 |
| 7+ Person Families | 25 (10.4%) | $0 |
| Total | 241 (100.0%) | $41,641 |
Family Income by Number of Earners in Emmonak
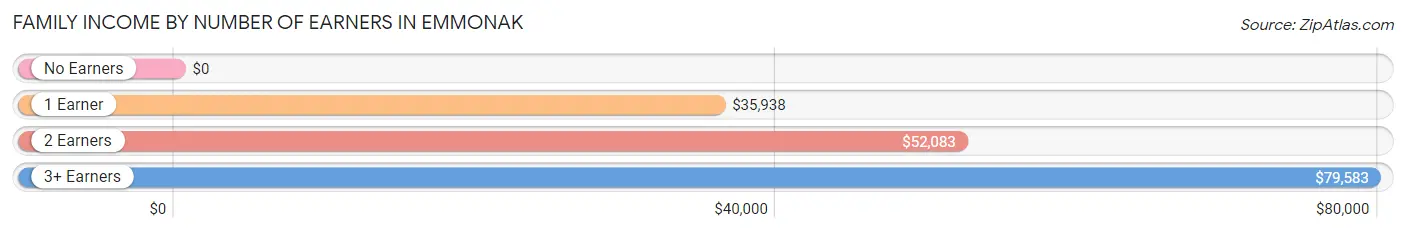
| Number of Earners | # Families | Median Income |
| No Earners | 19 (7.9%) | $0 |
| 1 Earner | 110 (45.6%) | $35,938 |
| 2 Earners | 71 (29.5%) | $52,083 |
| 3+ Earners | 41 (17.0%) | $79,583 |
| Total | 241 (100.0%) | $41,641 |
Household Income in Emmonak
Household Income Brackets in Emmonak
With 73 households falling in the category, the $50,000 to $74,999 income range is the most frequent in Emmonak, accounting for 21.3% of all households. In contrast, only 3 households (0.9%) fall into the $200,000+ income bracket, making it the least populous group.
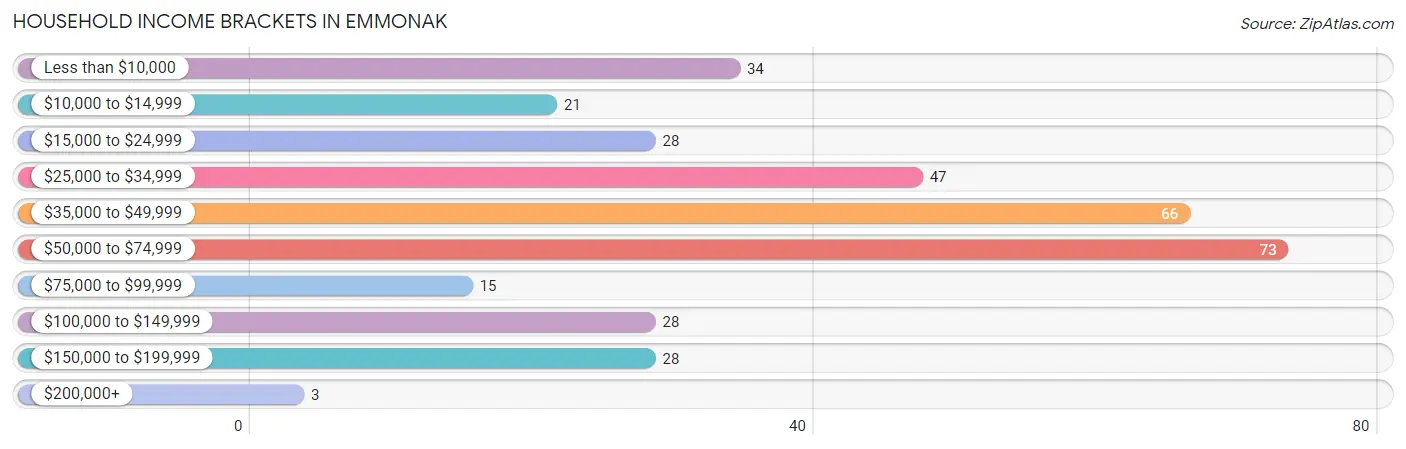
| Income Bracket | # Households | % Households |
| Less than $10,000 | 34 | 9.9% |
| $10,000 to $14,999 | 21 | 6.1% |
| $15,000 to $24,999 | 28 | 8.2% |
| $25,000 to $34,999 | 47 | 13.7% |
| $35,000 to $49,999 | 66 | 19.2% |
| $50,000 to $74,999 | 73 | 21.3% |
| $75,000 to $99,999 | 15 | 4.4% |
| $100,000 to $149,999 | 28 | 8.2% |
| $150,000 to $199,999 | 28 | 8.2% |
| $200,000+ | 3 | 0.9% |
Household Income by Householder Age in Emmonak
The median household income in Emmonak is $45,655, with the highest median household income of $53,028 found in the 65+ years age bracket for the primary householder. A total of 107 households (31.2%) fall into this category. Meanwhile, the 15 to 24 years age bracket for the primary householder has the lowest median household income of $0, with 11 households (3.2%) in this group.
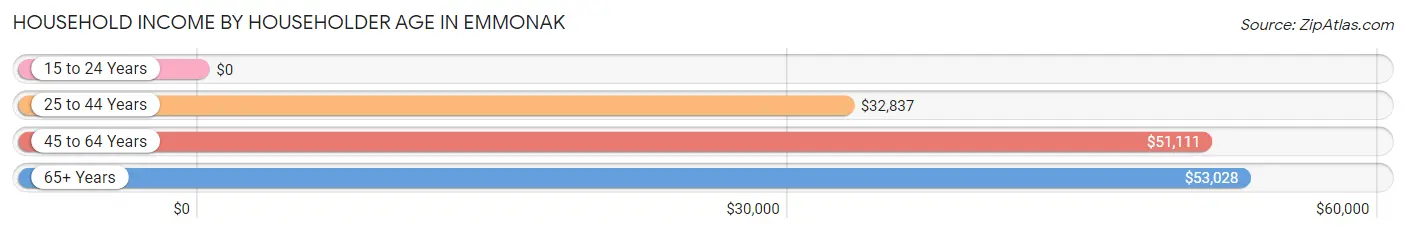
| Income Bracket | # Households | Median Income |
| 15 to 24 Years | 11 (3.2%) | $0 |
| 25 to 44 Years | 113 (32.9%) | $32,837 |
| 45 to 64 Years | 112 (32.7%) | $51,111 |
| 65+ Years | 107 (31.2%) | $53,028 |
| Total | 343 (100.0%) | $45,655 |
Poverty in Emmonak
Income Below Poverty by Sex and Age in Emmonak
With 23.9% poverty level for males and 20.0% for females among the residents of Emmonak, 16 and 17 year old males and 35 to 44 year old females are the most vulnerable to poverty, with 3 males (60.0%) and 21 females (58.3%) in their respective age groups living below the poverty level.
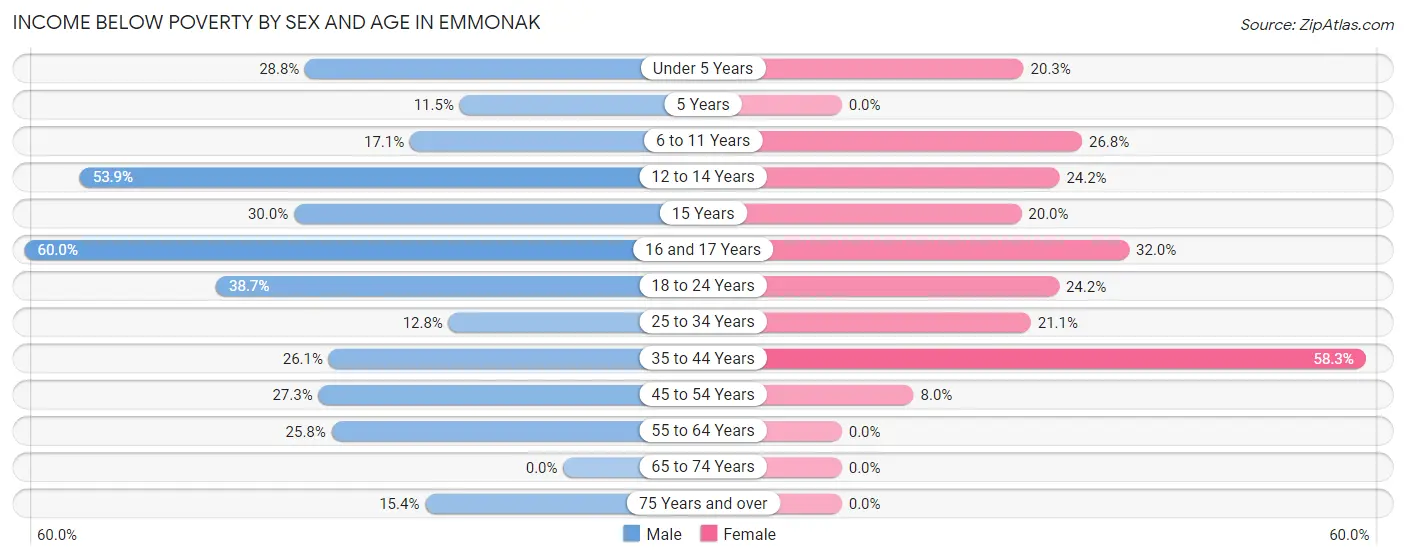
| Age Bracket | Male | Female |
| Under 5 Years | 23 (28.7%) | 16 (20.3%) |
| 5 Years | 3 (11.5%) | 0 (0.0%) |
| 6 to 11 Years | 14 (17.1%) | 19 (26.8%) |
| 12 to 14 Years | 14 (53.8%) | 8 (24.2%) |
| 15 Years | 6 (30.0%) | 3 (20.0%) |
| 16 and 17 Years | 3 (60.0%) | 8 (32.0%) |
| 18 to 24 Years | 29 (38.7%) | 15 (24.2%) |
| 25 to 34 Years | 12 (12.8%) | 20 (21.0%) |
| 35 to 44 Years | 35 (26.1%) | 21 (58.3%) |
| 45 to 54 Years | 15 (27.3%) | 2 (8.0%) |
| 55 to 64 Years | 16 (25.8%) | 0 (0.0%) |
| 65 to 74 Years | 0 (0.0%) | 0 (0.0%) |
| 75 Years and over | 2 (15.4%) | 0 (0.0%) |
| Total | 172 (23.9%) | 112 (20.0%) |
Income Above Poverty by Sex and Age in Emmonak
According to the poverty statistics in Emmonak, males aged 65 to 74 years and females aged 5 years are the age groups that are most secure financially, with 100.0% of males and 100.0% of females in these age groups living above the poverty line.
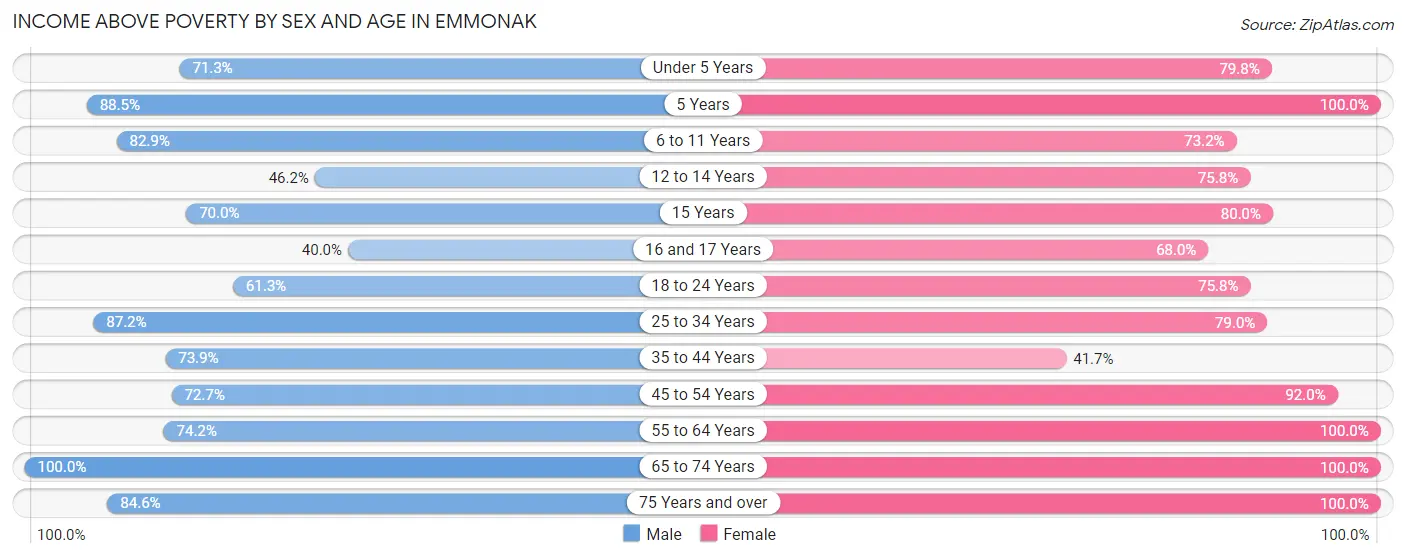
| Age Bracket | Male | Female |
| Under 5 Years | 57 (71.3%) | 63 (79.7%) |
| 5 Years | 23 (88.5%) | 3 (100.0%) |
| 6 to 11 Years | 68 (82.9%) | 52 (73.2%) |
| 12 to 14 Years | 12 (46.2%) | 25 (75.8%) |
| 15 Years | 14 (70.0%) | 12 (80.0%) |
| 16 and 17 Years | 2 (40.0%) | 17 (68.0%) |
| 18 to 24 Years | 46 (61.3%) | 47 (75.8%) |
| 25 to 34 Years | 82 (87.2%) | 75 (78.9%) |
| 35 to 44 Years | 99 (73.9%) | 15 (41.7%) |
| 45 to 54 Years | 40 (72.7%) | 23 (92.0%) |
| 55 to 64 Years | 46 (74.2%) | 35 (100.0%) |
| 65 to 74 Years | 47 (100.0%) | 76 (100.0%) |
| 75 Years and over | 11 (84.6%) | 4 (100.0%) |
| Total | 547 (76.1%) | 447 (80.0%) |
Income Below Poverty Among Married-Couple Families in Emmonak
The poverty statistics for married-couple families in Emmonak show that 4.2% or 4 of the total 95 families live below the poverty line. Families with 5 or more children have the highest poverty rate of 66.7%, comprising of 4 families. On the other hand, families with no children have the lowest poverty rate of 0.0%, which includes 0 families.
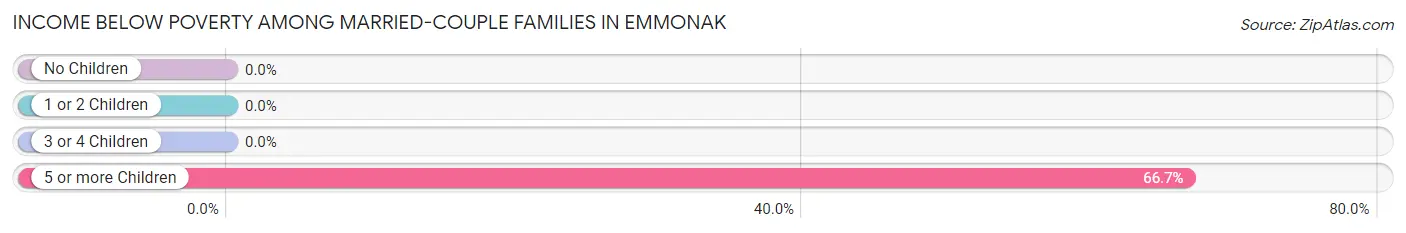
| Children | Above Poverty | Below Poverty |
| No Children | 23 (100.0%) | 0 (0.0%) |
| 1 or 2 Children | 53 (100.0%) | 0 (0.0%) |
| 3 or 4 Children | 13 (100.0%) | 0 (0.0%) |
| 5 or more Children | 2 (33.3%) | 4 (66.7%) |
| Total | 91 (95.8%) | 4 (4.2%) |
Income Below Poverty Among Single-Parent Households in Emmonak
According to the poverty data in Emmonak, 41.0% or 32 single-father households and 20.6% or 14 single-mother households are living below the poverty line. Among single-father households, those with 5 or more children have the highest poverty rate, with 7 households (63.6%) experiencing poverty. Likewise, among single-mother households, those with 5 or more children have the highest poverty rate, with 4 households (57.1%) falling below the poverty line.
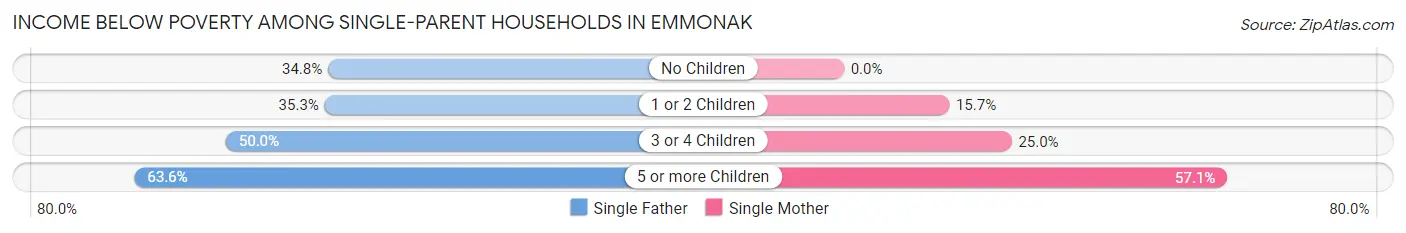
| Children | Single Father | Single Mother |
| No Children | 8 (34.8%) | 0 (0.0%) |
| 1 or 2 Children | 12 (35.3%) | 8 (15.7%) |
| 3 or 4 Children | 5 (50.0%) | 2 (25.0%) |
| 5 or more Children | 7 (63.6%) | 4 (57.1%) |
| Total | 32 (41.0%) | 14 (20.6%) |
Income Below Poverty Among Married-Couple vs Single-Parent Households in Emmonak
The poverty data for Emmonak shows that 4 of the married-couple family households (4.2%) and 46 of the single-parent households (31.5%) are living below the poverty level. Within the married-couple family households, those with 5 or more children have the highest poverty rate, with 4 households (66.7%) falling below the poverty line. Among the single-parent households, those with 5 or more children have the highest poverty rate, with 11 household (61.1%) living below poverty.
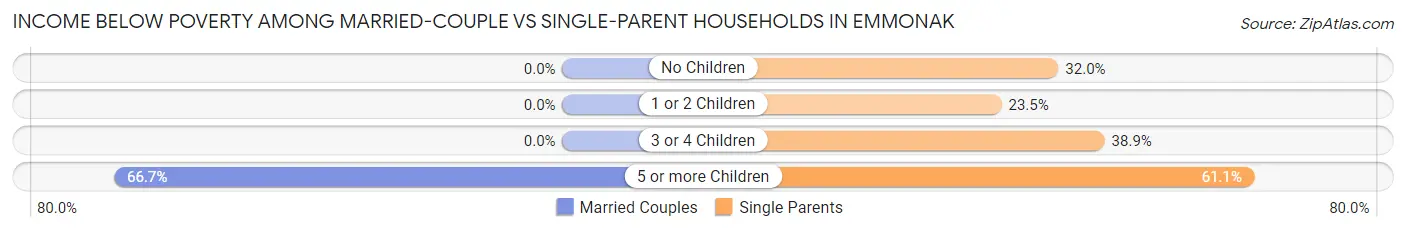
| Children | Married-Couple Families | Single-Parent Households |
| No Children | 0 (0.0%) | 8 (32.0%) |
| 1 or 2 Children | 0 (0.0%) | 20 (23.5%) |
| 3 or 4 Children | 0 (0.0%) | 7 (38.9%) |
| 5 or more Children | 4 (66.7%) | 11 (61.1%) |
| Total | 4 (4.2%) | 46 (31.5%) |
Race in Emmonak
The most populous races in Emmonak are Native / Alaskan (1,068 | 82.6%), Two or more Races (149 | 11.5%), and Black / African American (68 | 5.3%).
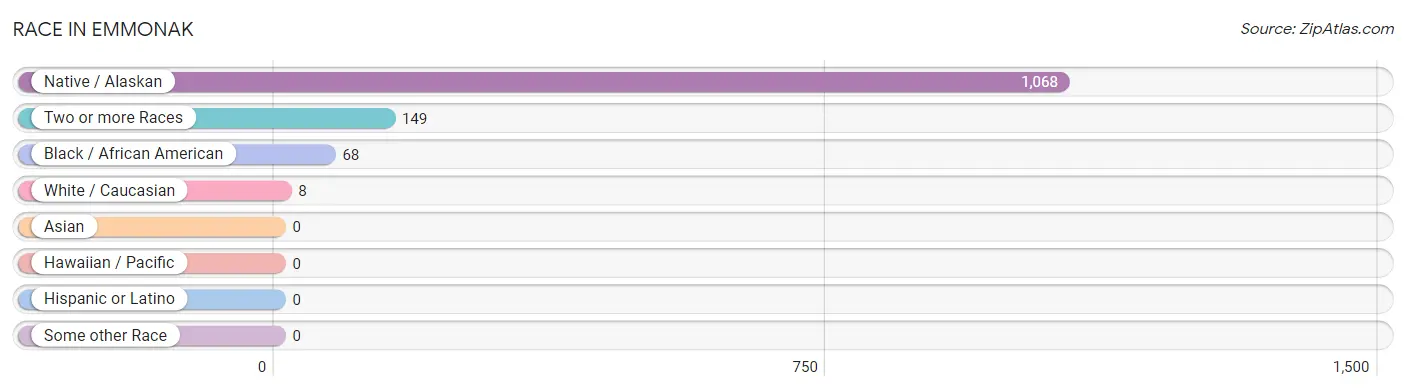
| Race | # Population | % Population |
| Asian | 0 | 0.0% |
| Black / African American | 68 | 5.3% |
| Hawaiian / Pacific | 0 | 0.0% |
| Hispanic or Latino | 0 | 0.0% |
| Native / Alaskan | 1,068 | 82.6% |
| White / Caucasian | 8 | 0.6% |
| Two or more Races | 149 | 11.5% |
| Some other Race | 0 | 0.0% |
| Total | 1,293 | 100.0% |
Ancestry in Emmonak
The most populous ancestries reported in Emmonak are Yup'ik (1,107 | 85.6%), Subsaharan African (71 | 5.5%), Sudanese (68 | 5.3%), Alaska Native (57 | 4.4%), and Swedish (47 | 3.6%), together accounting for 104.4% of all Emmonak residents.
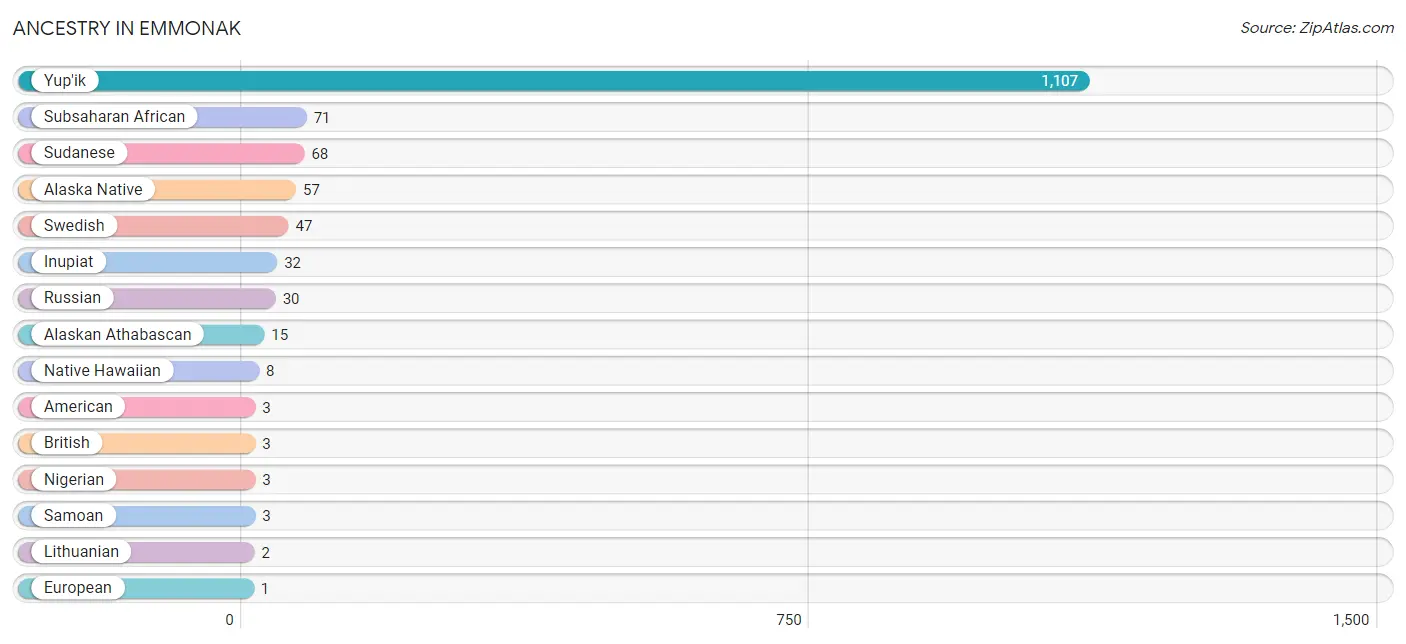
| Ancestry | # Population | % Population |
| Alaska Native | 57 | 4.4% |
| Alaskan Athabascan | 15 | 1.2% |
| American | 3 | 0.2% |
| British | 3 | 0.2% |
| European | 1 | 0.1% |
| Inupiat | 32 | 2.5% |
| Lithuanian | 2 | 0.2% |
| Native Hawaiian | 8 | 0.6% |
| Nigerian | 3 | 0.2% |
| Russian | 30 | 2.3% |
| Samoan | 3 | 0.2% |
| Subsaharan African | 71 | 5.5% |
| Sudanese | 68 | 5.3% |
| Swedish | 47 | 3.6% |
| Yup'ik | 1,107 | 85.6% | View All 15 Rows |
Immigrants in Emmonak
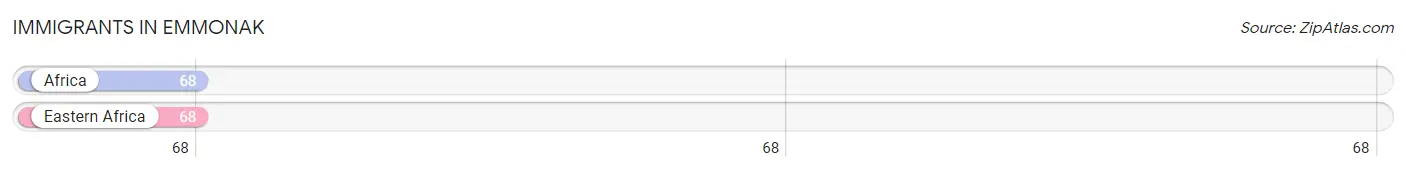
The most numerous immigrant groups reported in Emmonak came from Africa (68 | 5.3%), and Eastern Africa (68 | 5.3%), together accounting for 10.5% of all Emmonak residents.
| Immigration Origin | # Population | % Population |
| Africa | 68 | 5.3% |
| Eastern Africa | 68 | 5.3% | View All 2 Rows |
Sex and Age in Emmonak
Sex and Age in Emmonak
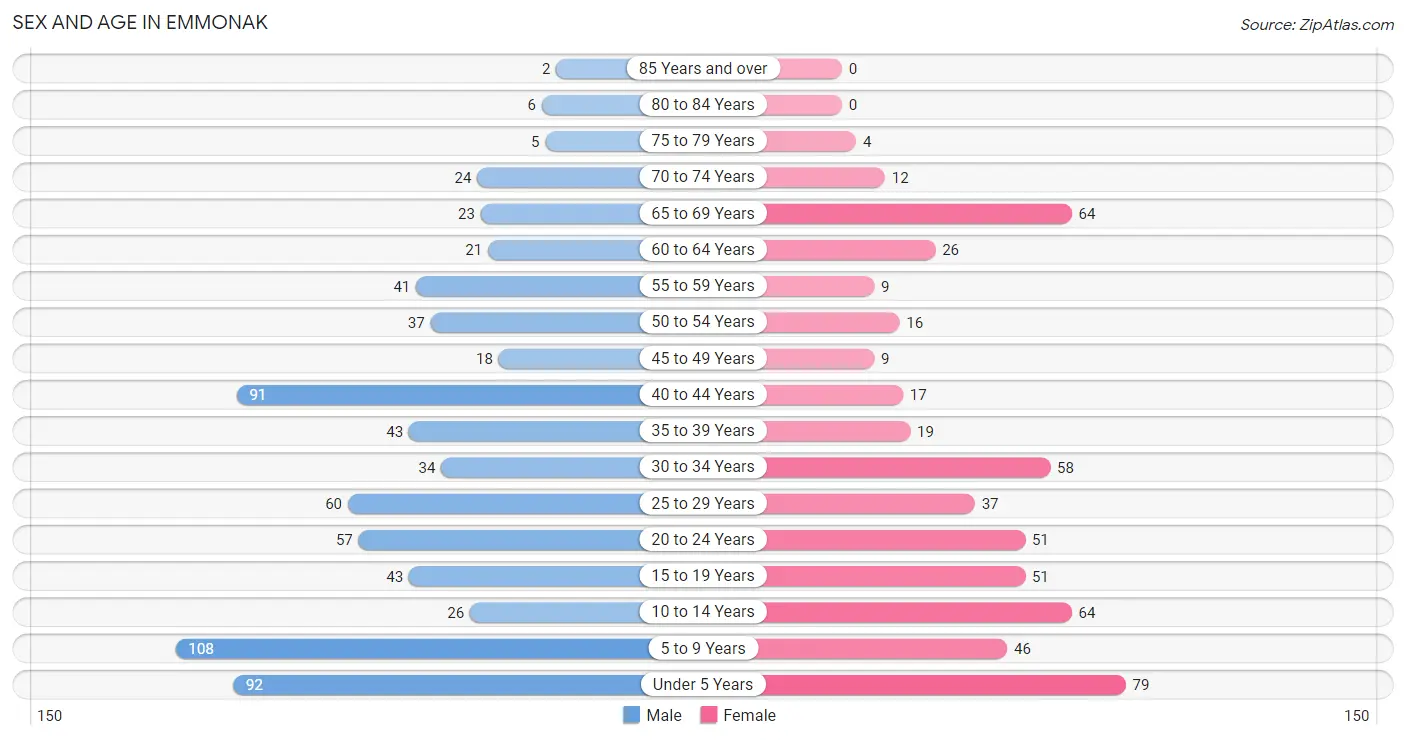
The most populous age groups in Emmonak are 5 to 9 Years (108 | 14.8%) for men and Under 5 Years (79 | 14.1%) for women.
| Age Bracket | Male | Female |
| Under 5 Years | 92 (12.6%) | 79 (14.1%) |
| 5 to 9 Years | 108 (14.8%) | 46 (8.2%) |
| 10 to 14 Years | 26 (3.6%) | 64 (11.4%) |
| 15 to 19 Years | 43 (5.9%) | 51 (9.1%) |
| 20 to 24 Years | 57 (7.8%) | 51 (9.1%) |
| 25 to 29 Years | 60 (8.2%) | 37 (6.6%) |
| 30 to 34 Years | 34 (4.6%) | 58 (10.3%) |
| 35 to 39 Years | 43 (5.9%) | 19 (3.4%) |
| 40 to 44 Years | 91 (12.4%) | 17 (3.0%) |
| 45 to 49 Years | 18 (2.5%) | 9 (1.6%) |
| 50 to 54 Years | 37 (5.1%) | 16 (2.9%) |
| 55 to 59 Years | 41 (5.6%) | 9 (1.6%) |
| 60 to 64 Years | 21 (2.9%) | 26 (4.6%) |
| 65 to 69 Years | 23 (3.2%) | 64 (11.4%) |
| 70 to 74 Years | 24 (3.3%) | 12 (2.1%) |
| 75 to 79 Years | 5 (0.7%) | 4 (0.7%) |
| 80 to 84 Years | 6 (0.8%) | 0 (0.0%) |
| 85 Years and over | 2 (0.3%) | 0 (0.0%) |
| Total | 731 (100.0%) | 562 (100.0%) |
Families and Households in Emmonak
Median Family Size in Emmonak
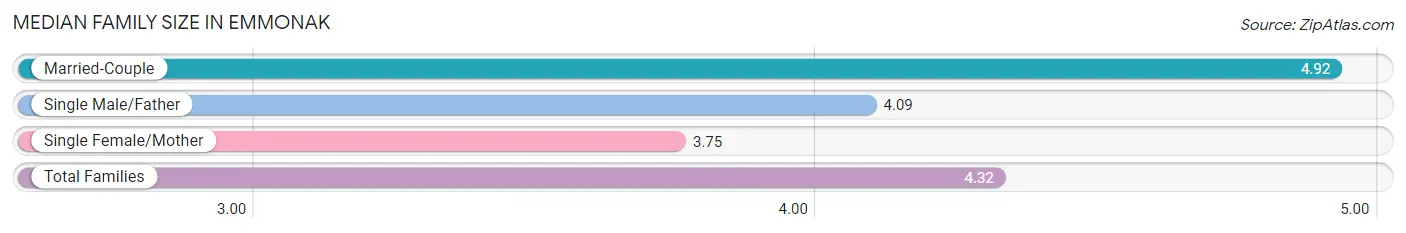
The median family size in Emmonak is 4.32 persons per family, with married-couple families (95 | 39.4%) accounting for the largest median family size of 4.92 persons per family. On the other hand, single female/mother families (68 | 28.2%) represent the smallest median family size with 3.75 persons per family.
| Family Type | # Families | Family Size |
| Married-Couple | 95 (39.4%) | 4.92 |
| Single Male/Father | 78 (32.4%) | 4.09 |
| Single Female/Mother | 68 (28.2%) | 3.75 |
| Total Families | 241 (100.0%) | 4.32 |
Median Household Size in Emmonak
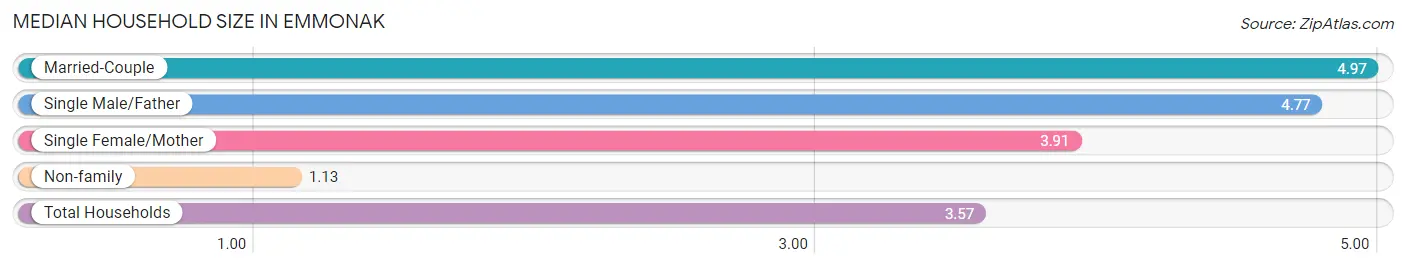
The median household size in Emmonak is 3.57 persons per household, with married-couple households (95 | 27.7%) accounting for the largest median household size of 4.97 persons per household. non-family households (102 | 29.7%) represent the smallest median household size with 1.13 persons per household.
| Household Type | # Households | Household Size |
| Married-Couple | 95 (27.7%) | 4.97 |
| Single Male/Father | 78 (22.7%) | 4.77 |
| Single Female/Mother | 68 (19.8%) | 3.91 |
| Non-family | 102 (29.7%) | 1.13 |
| Total Households | 343 (100.0%) | 3.57 |
Household Size by Marriage Status in Emmonak
Out of a total of 343 households in Emmonak, 241 (70.3%) are family households, while 102 (29.7%) are nonfamily households. The most numerous type of family households are 3-person households, comprising 73, and the most common type of nonfamily households are 1-person households, comprising 92.
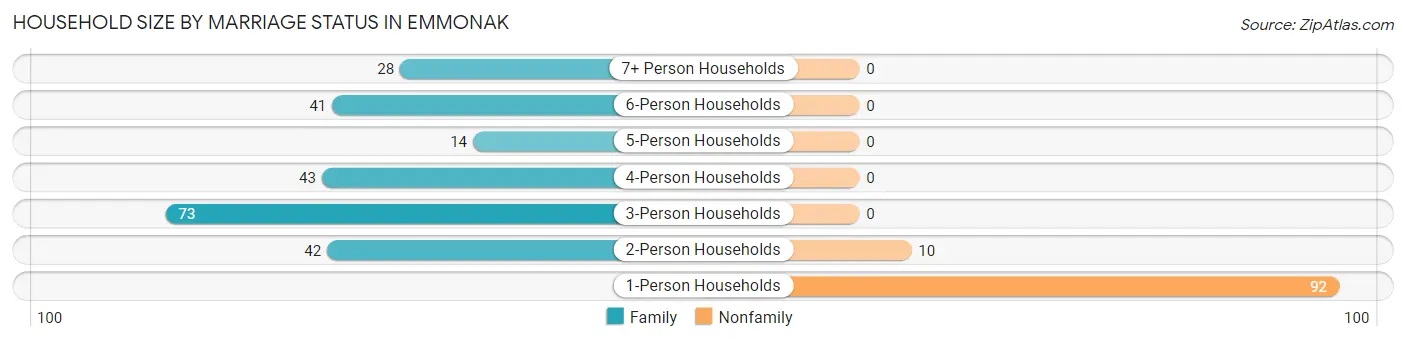
| Household Size | Family Households | Nonfamily Households |
| 1-Person Households | - | 92 (26.8%) |
| 2-Person Households | 42 (12.2%) | 10 (2.9%) |
| 3-Person Households | 73 (21.3%) | 0 (0.0%) |
| 4-Person Households | 43 (12.5%) | 0 (0.0%) |
| 5-Person Households | 14 (4.1%) | 0 (0.0%) |
| 6-Person Households | 41 (11.9%) | 0 (0.0%) |
| 7+ Person Households | 28 (8.2%) | 0 (0.0%) |
| Total | 241 (70.3%) | 102 (29.7%) |
Female Fertility in Emmonak
Fertility by Age in Emmonak
Average fertility rate in Emmonak is 96.0 births per 1,000 women. Women in the age bracket of 20 to 34 years have the highest fertility rate with 110.0 births per 1,000 women. Women in the age bracket of 20 to 34 years acount for 66.7% of all women with births.
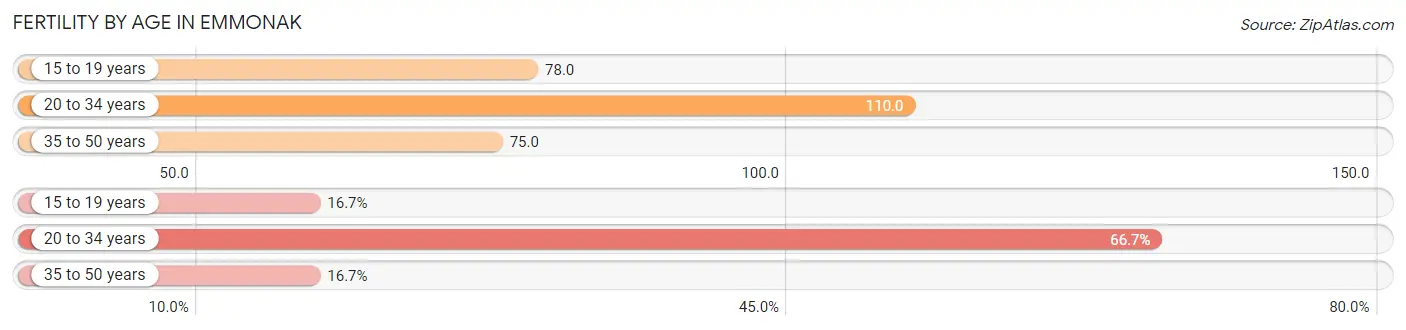
| Age Bracket | Women with Births | Births / 1,000 Women |
| 15 to 19 years | 4 (16.7%) | 78.0 |
| 20 to 34 years | 16 (66.7%) | 110.0 |
| 35 to 50 years | 4 (16.7%) | 75.0 |
| Total | 24 (100.0%) | 96.0 |
Fertility by Age by Marriage Status in Emmonak
45.8% of women with births (24) in Emmonak are married. The highest percentage of unmarried women with births falls into 15 to 19 years age bracket with 100.0% of them unmarried at the time of birth, while the lowest percentage of unmarried women with births belong to 35 to 50 years age bracket with 0.0% of them unmarried.
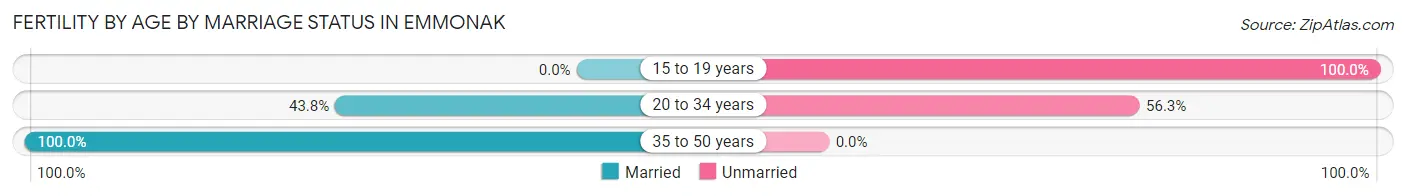
| Age Bracket | Married | Unmarried |
| 15 to 19 years | 0 (0.0%) | 4 (100.0%) |
| 20 to 34 years | 7 (43.8%) | 9 (56.2%) |
| 35 to 50 years | 4 (100.0%) | 0 (0.0%) |
| Total | 11 (45.8%) | 13 (54.2%) |
Fertility by Education in Emmonak
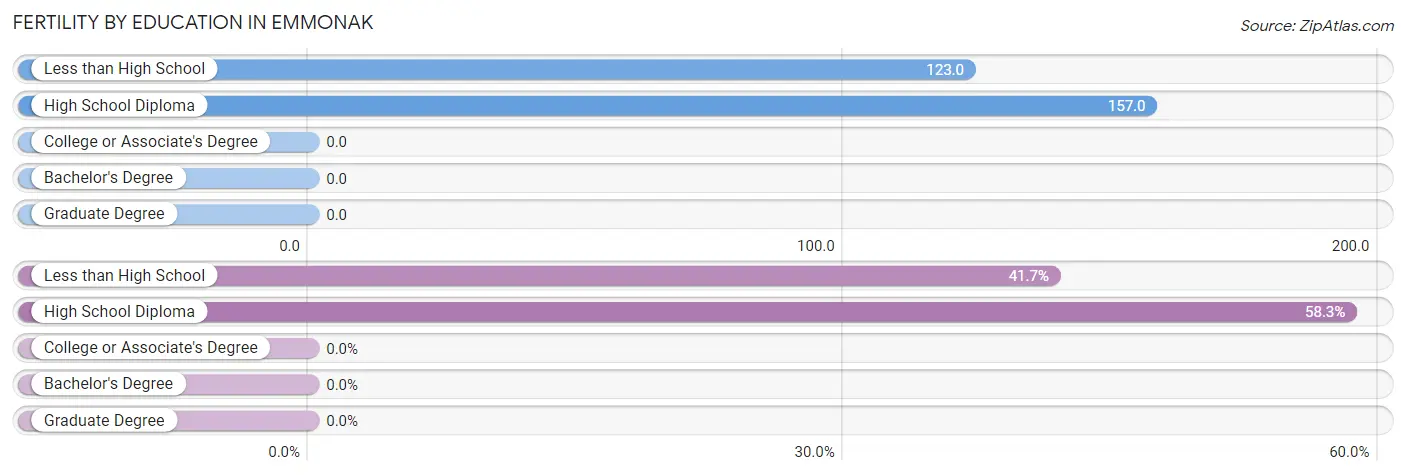
| Educational Attainment | Women with Births | Births / 1,000 Women |
| Less than High School | 10 (41.7%) | 123.0 |
| High School Diploma | 14 (58.3%) | 157.0 |
| College or Associate's Degree | 0 (0.0%) | 0.0 |
| Bachelor's Degree | 0 (0.0%) | 0.0 |
| Graduate Degree | 0 (0.0%) | 0.0 |
| Total | 24 (100.0%) | 96.0 |
Fertility by Education by Marriage Status in Emmonak
54.2% of women with births in Emmonak are unmarried. Women with the educational attainment of high school diploma are most likely to be married with 78.6% of them married at childbirth, while women with the educational attainment of less than high school are least likely to be married with 100.0% of them unmarried at childbirth.
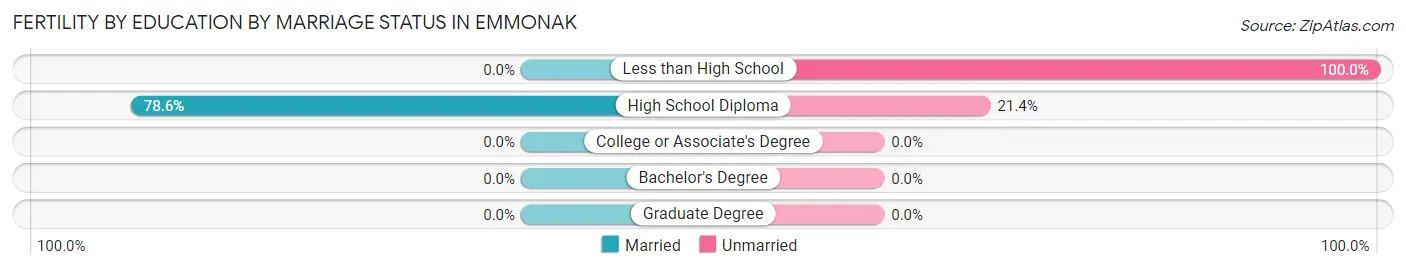
| Educational Attainment | Married | Unmarried |
| Less than High School | 0 (0.0%) | 10 (100.0%) |
| High School Diploma | 11 (78.6%) | 3 (21.4%) |
| College or Associate's Degree | 0 (0.0%) | 0 (0.0%) |
| Bachelor's Degree | 0 (0.0%) | 0 (0.0%) |
| Graduate Degree | 0 (0.0%) | 0 (0.0%) |
| Total | 11 (45.8%) | 13 (54.2%) |
Employment Characteristics in Emmonak
Employment by Class of Employer in Emmonak
Among the 451 employed individuals in Emmonak, private company employees (211 | 46.8%), local government employees (84 | 18.6%), and federal government employees (67 | 14.9%) make up the most common classes of employment.
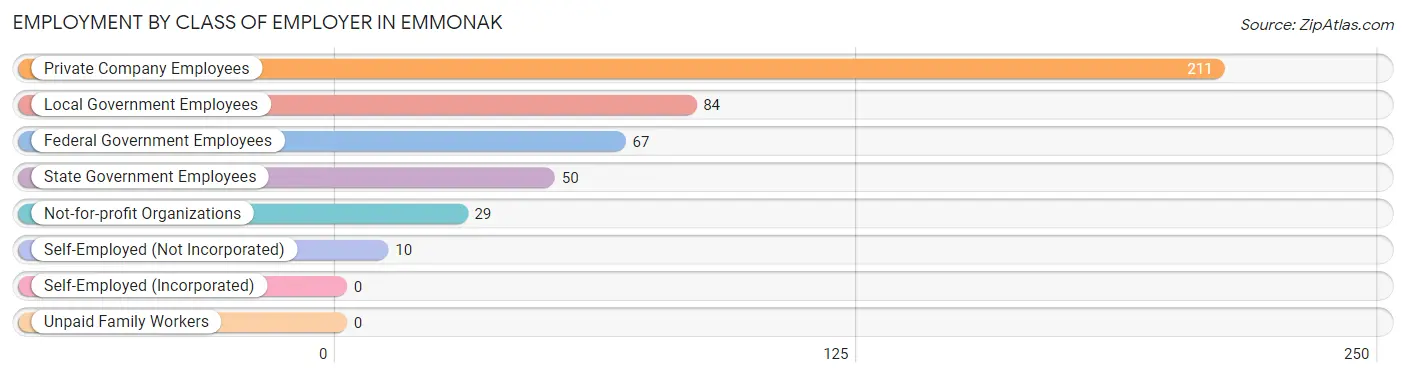
| Employer Class | # Employees | % Employees |
| Private Company Employees | 211 | 46.8% |
| Self-Employed (Incorporated) | 0 | 0.0% |
| Self-Employed (Not Incorporated) | 10 | 2.2% |
| Not-for-profit Organizations | 29 | 6.4% |
| Local Government Employees | 84 | 18.6% |
| State Government Employees | 50 | 11.1% |
| Federal Government Employees | 67 | 14.9% |
| Unpaid Family Workers | 0 | 0.0% |
| Total | 451 | 100.0% |
Employment Status by Age in Emmonak
According to the labor force statistics for Emmonak, out of the total population over 16 years of age (843), 67.6% or 570 individuals are in the labor force, with 17.5% or 100 of them unemployed. The age group with the highest labor force participation rate is 20 to 24 years, with 90.7% or 98 individuals in the labor force. Within the labor force, the 16 to 19 years age range has the highest percentage of unemployed individuals, with 72.2% or 13 of them being unemployed.
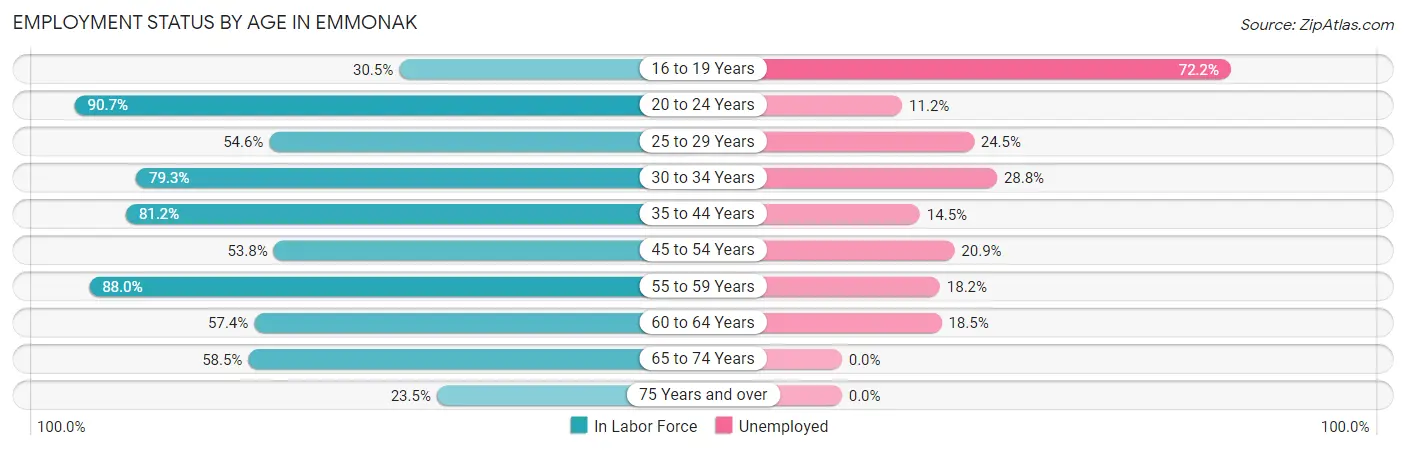
| Age Bracket | In Labor Force | Unemployed |
| 16 to 19 Years | 18 (30.5%) | 13 (72.2%) |
| 20 to 24 Years | 98 (90.7%) | 11 (11.2%) |
| 25 to 29 Years | 53 (54.6%) | 13 (24.5%) |
| 30 to 34 Years | 73 (79.3%) | 21 (28.8%) |
| 35 to 44 Years | 138 (81.2%) | 20 (14.5%) |
| 45 to 54 Years | 43 (53.8%) | 9 (20.9%) |
| 55 to 59 Years | 44 (88.0%) | 8 (18.2%) |
| 60 to 64 Years | 27 (57.4%) | 5 (18.5%) |
| 65 to 74 Years | 72 (58.5%) | 0 (0.0%) |
| 75 Years and over | 4 (23.5%) | 0 (0.0%) |
| Total | 570 (67.6%) | 100 (17.5%) |
Employment Status by Educational Attainment in Emmonak
According to labor force statistics for Emmonak, 70.5% of individuals (378) out of the total population between 25 and 64 years of age (536) are in the labor force, with 20.1% or 76 of them being unemployed. The group with the highest labor force participation rate are those with the educational attainment of bachelor's degree or higher, with 87.8% or 79 individuals in the labor force. Within the labor force, individuals with less than high school education have the highest percentage of unemployment, with 32.7% or 18 of them being unemployed.
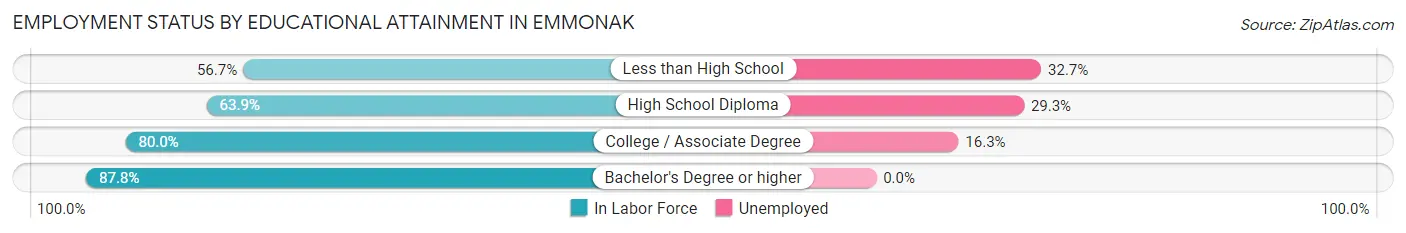
| Educational Attainment | In Labor Force | Unemployed |
| Less than High School | 55 (56.7%) | 32 (32.7%) |
| High School Diploma | 140 (63.9%) | 64 (29.3%) |
| College / Associate Degree | 104 (80.0%) | 21 (16.3%) |
| Bachelor's Degree or higher | 79 (87.8%) | 0 (0.0%) |
| Total | 378 (70.5%) | 108 (20.1%) |
Employment Occupations by Sex in Emmonak
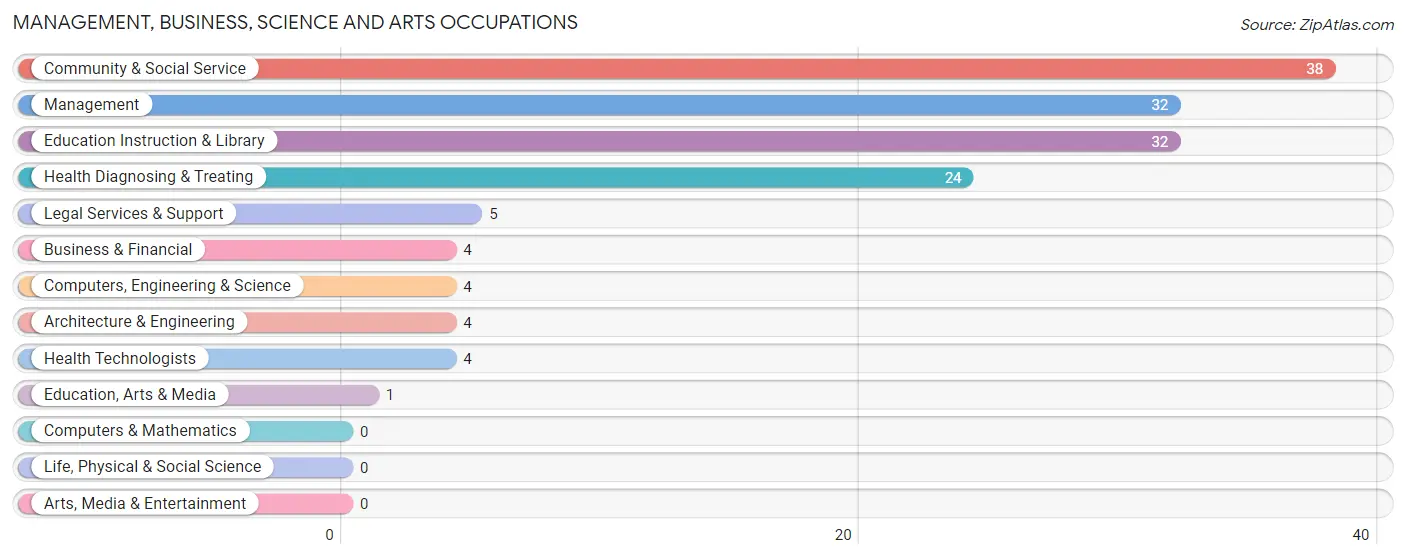
Management, Business, Science and Arts Occupations
The most common Management, Business, Science and Arts occupations in Emmonak are Community & Social Service (38 | 8.1%), Management (32 | 6.8%), Education Instruction & Library (32 | 6.8%), Health Diagnosing & Treating (24 | 5.1%), and Legal Services & Support (5 | 1.1%).
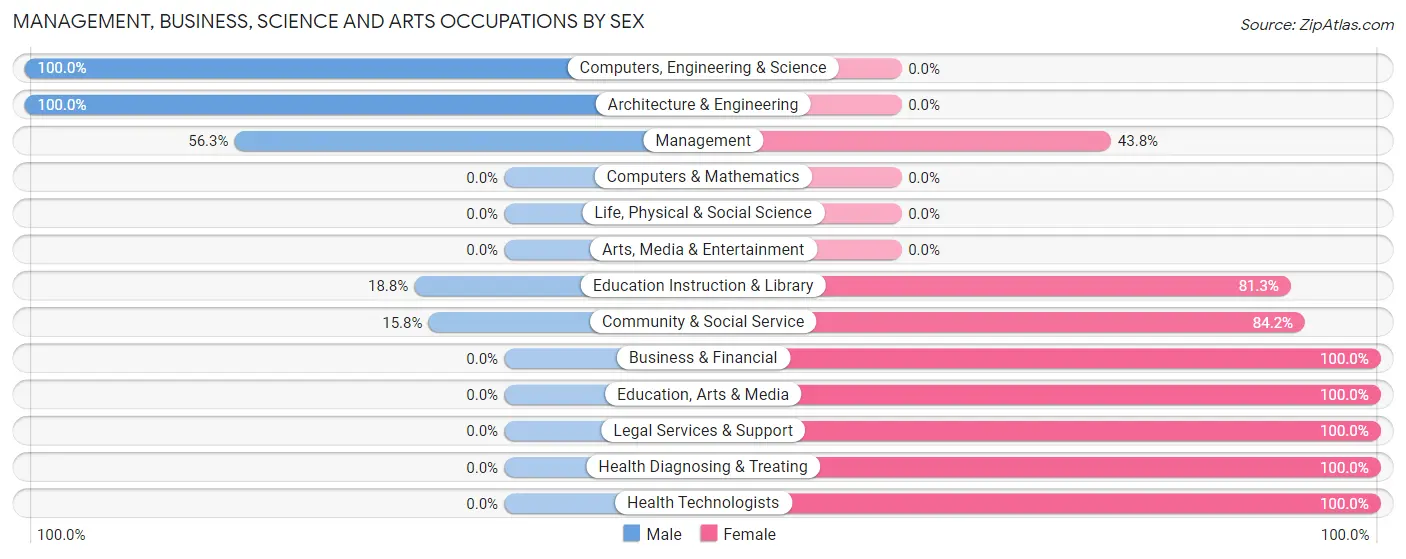
Management, Business, Science and Arts Occupations by Sex
Within the Management, Business, Science and Arts occupations in Emmonak, the most male-oriented occupations are Computers, Engineering & Science (100.0%), Architecture & Engineering (100.0%), and Management (56.2%), while the most female-oriented occupations are Business & Financial (100.0%), Education, Arts & Media (100.0%), and Legal Services & Support (100.0%).
| Occupation | Male | Female |
| Management | 18 (56.2%) | 14 (43.8%) |
| Business & Financial | 0 (0.0%) | 4 (100.0%) |
| Computers, Engineering & Science | 4 (100.0%) | 0 (0.0%) |
| Computers & Mathematics | 0 (0.0%) | 0 (0.0%) |
| Architecture & Engineering | 4 (100.0%) | 0 (0.0%) |
| Life, Physical & Social Science | 0 (0.0%) | 0 (0.0%) |
| Community & Social Service | 6 (15.8%) | 32 (84.2%) |
| Education, Arts & Media | 0 (0.0%) | 1 (100.0%) |
| Legal Services & Support | 0 (0.0%) | 5 (100.0%) |
| Education Instruction & Library | 6 (18.8%) | 26 (81.2%) |
| Arts, Media & Entertainment | 0 (0.0%) | 0 (0.0%) |
| Health Diagnosing & Treating | 0 (0.0%) | 24 (100.0%) |
| Health Technologists | 0 (0.0%) | 4 (100.0%) |
| Total (Category) | 28 (27.5%) | 74 (72.6%) |
| Total (Overall) | 221 (47.0%) | 249 (53.0%) |
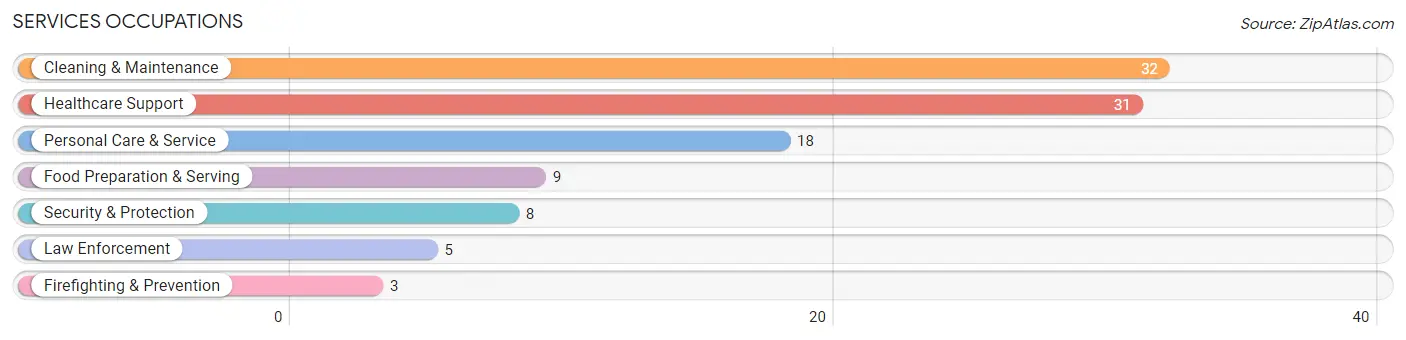
Services Occupations
The most common Services occupations in Emmonak are Cleaning & Maintenance (32 | 6.8%), Healthcare Support (31 | 6.6%), Personal Care & Service (18 | 3.8%), Food Preparation & Serving (9 | 1.9%), and Security & Protection (8 | 1.7%).
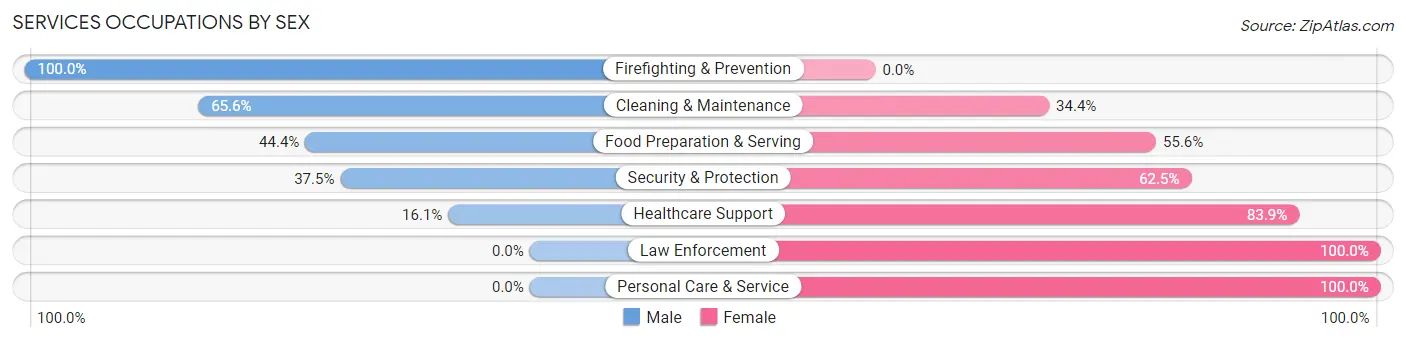
Services Occupations by Sex
Within the Services occupations in Emmonak, the most male-oriented occupations are Firefighting & Prevention (100.0%), Cleaning & Maintenance (65.6%), and Food Preparation & Serving (44.4%), while the most female-oriented occupations are Law Enforcement (100.0%), Personal Care & Service (100.0%), and Healthcare Support (83.9%).
| Occupation | Male | Female |
| Healthcare Support | 5 (16.1%) | 26 (83.9%) |
| Security & Protection | 3 (37.5%) | 5 (62.5%) |
| Firefighting & Prevention | 3 (100.0%) | 0 (0.0%) |
| Law Enforcement | 0 (0.0%) | 5 (100.0%) |
| Food Preparation & Serving | 4 (44.4%) | 5 (55.6%) |
| Cleaning & Maintenance | 21 (65.6%) | 11 (34.4%) |
| Personal Care & Service | 0 (0.0%) | 18 (100.0%) |
| Total (Category) | 33 (33.7%) | 65 (66.3%) |
| Total (Overall) | 221 (47.0%) | 249 (53.0%) |
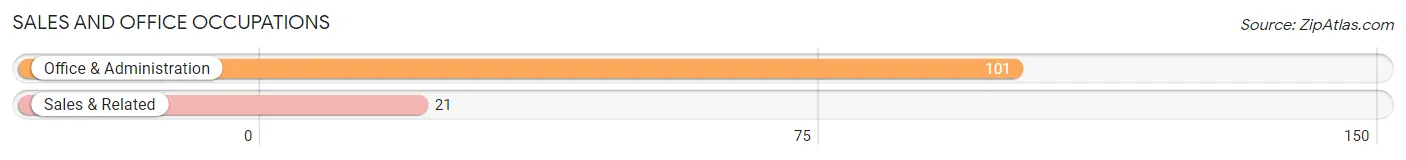
Sales and Office Occupations
The most common Sales and Office occupations in Emmonak are Office & Administration (101 | 21.5%), and Sales & Related (21 | 4.5%).
Sales and Office Occupations by Sex
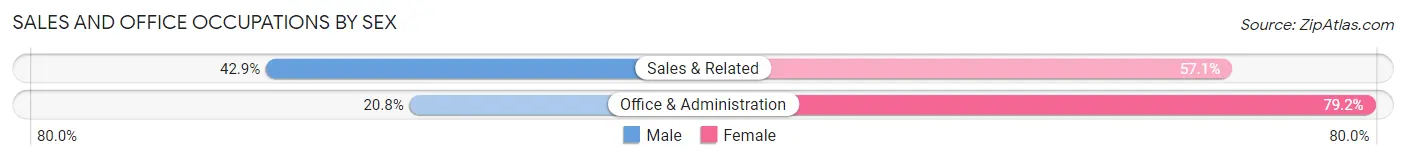
| Occupation | Male | Female |
| Sales & Related | 9 (42.9%) | 12 (57.1%) |
| Office & Administration | 21 (20.8%) | 80 (79.2%) |
| Total (Category) | 30 (24.6%) | 92 (75.4%) |
| Total (Overall) | 221 (47.0%) | 249 (53.0%) |
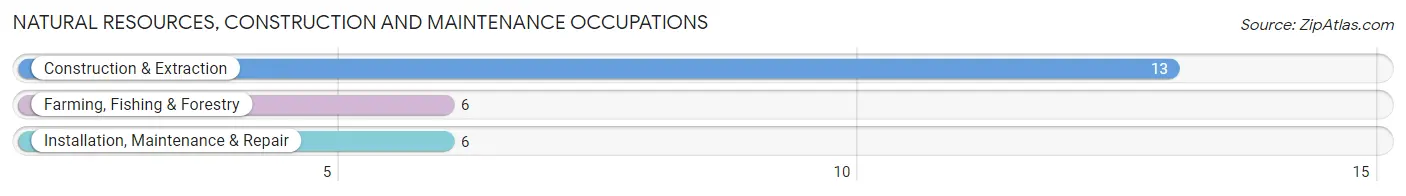
Natural Resources, Construction and Maintenance Occupations
The most common Natural Resources, Construction and Maintenance occupations in Emmonak are Construction & Extraction (13 | 2.8%), Farming, Fishing & Forestry (6 | 1.3%), and Installation, Maintenance & Repair (6 | 1.3%).
Natural Resources, Construction and Maintenance Occupations by Sex
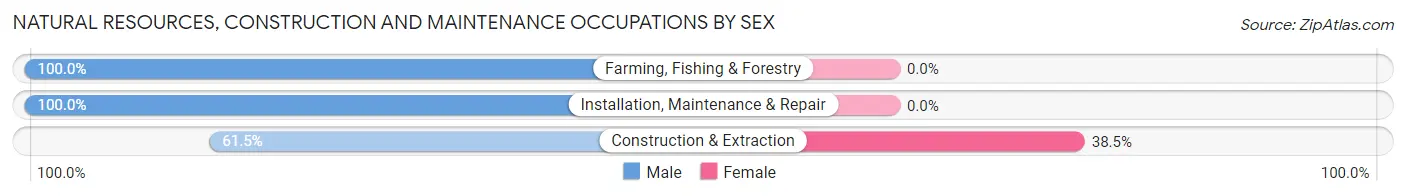
| Occupation | Male | Female |
| Farming, Fishing & Forestry | 6 (100.0%) | 0 (0.0%) |
| Construction & Extraction | 8 (61.5%) | 5 (38.5%) |
| Installation, Maintenance & Repair | 6 (100.0%) | 0 (0.0%) |
| Total (Category) | 20 (80.0%) | 5 (20.0%) |
| Total (Overall) | 221 (47.0%) | 249 (53.0%) |
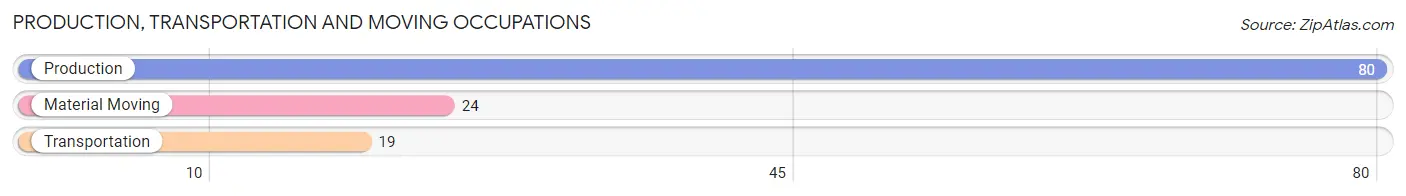
Production, Transportation and Moving Occupations
The most common Production, Transportation and Moving occupations in Emmonak are Production (80 | 17.0%), Material Moving (24 | 5.1%), and Transportation (19 | 4.0%).
Production, Transportation and Moving Occupations by Sex
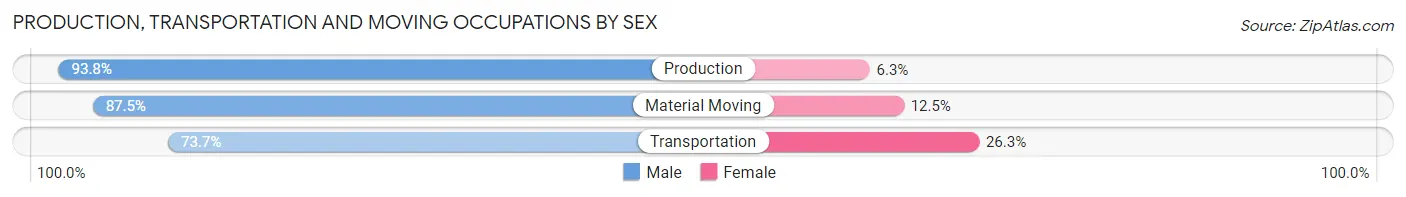
| Occupation | Male | Female |
| Production | 75 (93.8%) | 5 (6.2%) |
| Transportation | 14 (73.7%) | 5 (26.3%) |
| Material Moving | 21 (87.5%) | 3 (12.5%) |
| Total (Category) | 110 (89.4%) | 13 (10.6%) |
| Total (Overall) | 221 (47.0%) | 249 (53.0%) |
Employment Industries by Sex in Emmonak
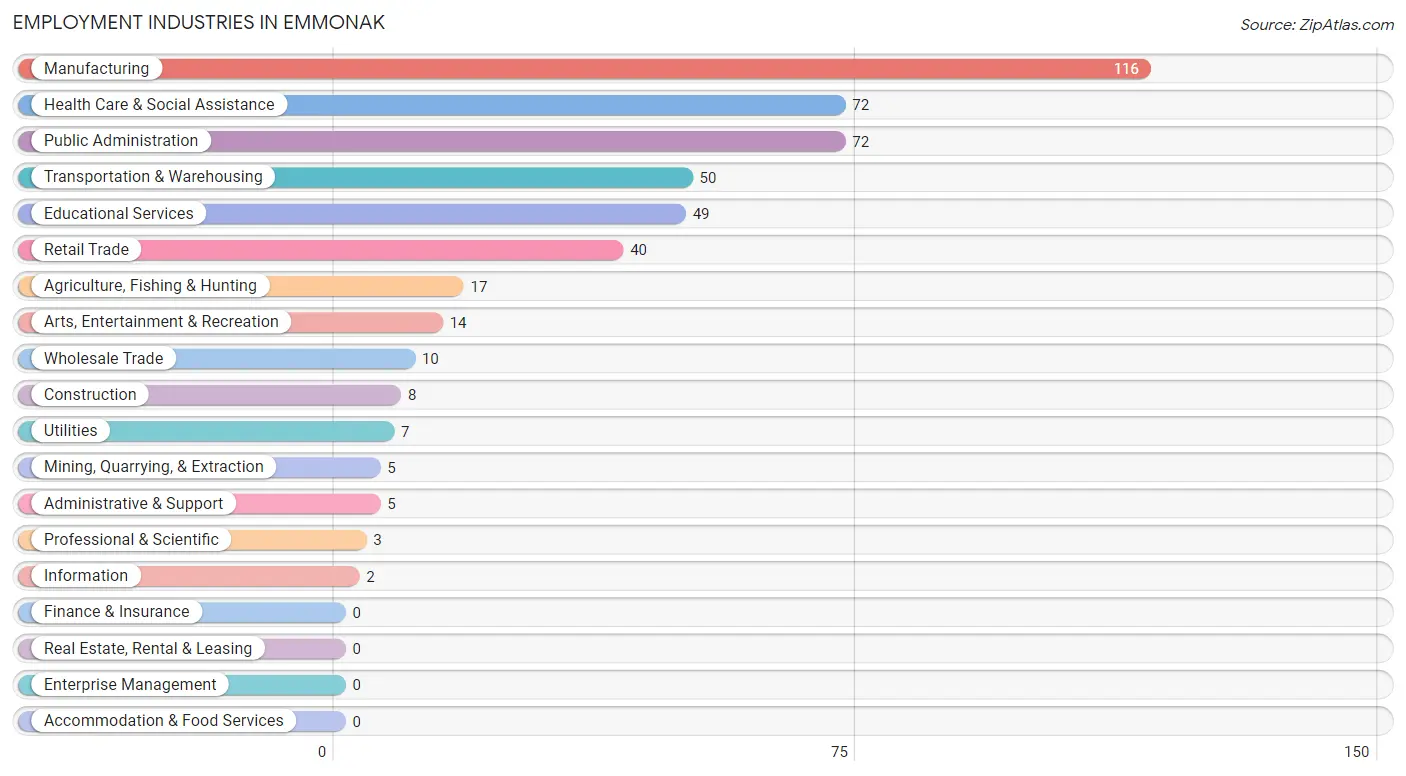
Employment Industries in Emmonak
The major employment industries in Emmonak include Manufacturing (116 | 24.7%), Health Care & Social Assistance (72 | 15.3%), Public Administration (72 | 15.3%), Transportation & Warehousing (50 | 10.6%), and Educational Services (49 | 10.4%).
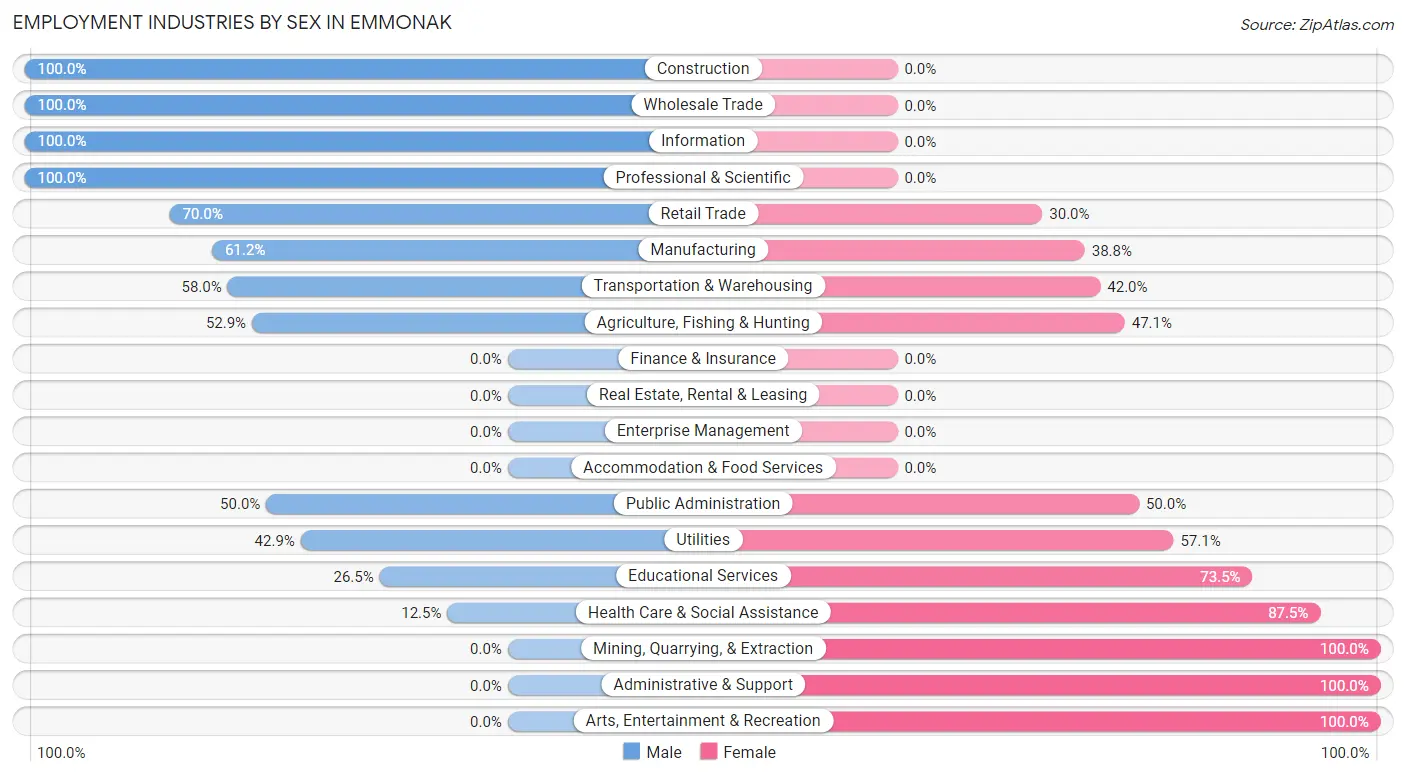
Employment Industries by Sex in Emmonak
The Emmonak industries that see more men than women are Construction (100.0%), Wholesale Trade (100.0%), and Information (100.0%), whereas the industries that tend to have a higher number of women are Mining, Quarrying, & Extraction (100.0%), Administrative & Support (100.0%), and Arts, Entertainment & Recreation (100.0%).
| Industry | Male | Female |
| Agriculture, Fishing & Hunting | 9 (52.9%) | 8 (47.1%) |
| Mining, Quarrying, & Extraction | 0 (0.0%) | 5 (100.0%) |
| Construction | 8 (100.0%) | 0 (0.0%) |
| Manufacturing | 71 (61.2%) | 45 (38.8%) |
| Wholesale Trade | 10 (100.0%) | 0 (0.0%) |
| Retail Trade | 28 (70.0%) | 12 (30.0%) |
| Transportation & Warehousing | 29 (58.0%) | 21 (42.0%) |
| Utilities | 3 (42.9%) | 4 (57.1%) |
| Information | 2 (100.0%) | 0 (0.0%) |
| Finance & Insurance | 0 (0.0%) | 0 (0.0%) |
| Real Estate, Rental & Leasing | 0 (0.0%) | 0 (0.0%) |
| Professional & Scientific | 3 (100.0%) | 0 (0.0%) |
| Enterprise Management | 0 (0.0%) | 0 (0.0%) |
| Administrative & Support | 0 (0.0%) | 5 (100.0%) |
| Educational Services | 13 (26.5%) | 36 (73.5%) |
| Health Care & Social Assistance | 9 (12.5%) | 63 (87.5%) |
| Arts, Entertainment & Recreation | 0 (0.0%) | 14 (100.0%) |
| Accommodation & Food Services | 0 (0.0%) | 0 (0.0%) |
| Public Administration | 36 (50.0%) | 36 (50.0%) |
| Total | 221 (47.0%) | 249 (53.0%) |
Education in Emmonak
School Enrollment in Emmonak
The most common levels of schooling among the 324 students in Emmonak are elementary school (114 | 35.2%), high school (73 | 22.5%), and middle school (71 | 21.9%).
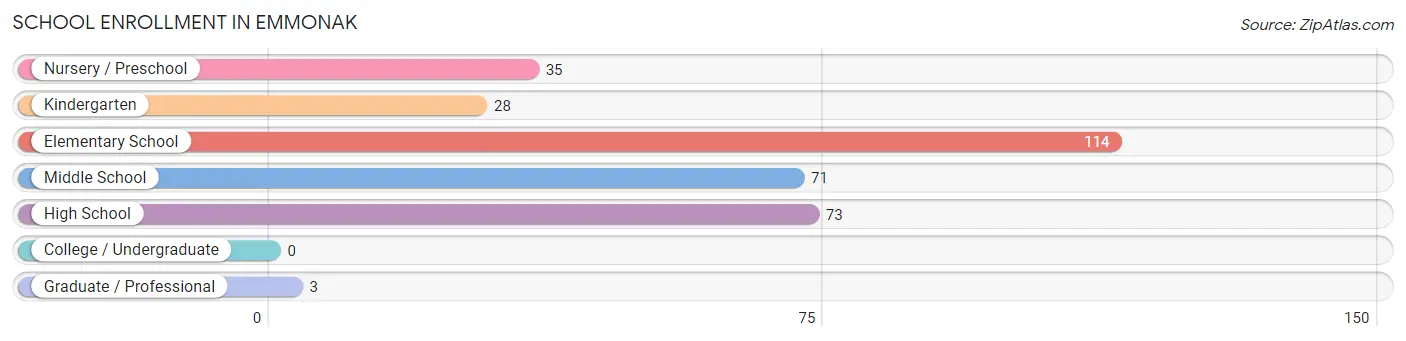
| School Level | # Students | % Students |
| Nursery / Preschool | 35 | 10.8% |
| Kindergarten | 28 | 8.6% |
| Elementary School | 114 | 35.2% |
| Middle School | 71 | 21.9% |
| High School | 73 | 22.5% |
| College / Undergraduate | 0 | 0.0% |
| Graduate / Professional | 3 | 0.9% |
| Total | 324 | 100.0% |
School Enrollment by Age by Funding Source in Emmonak
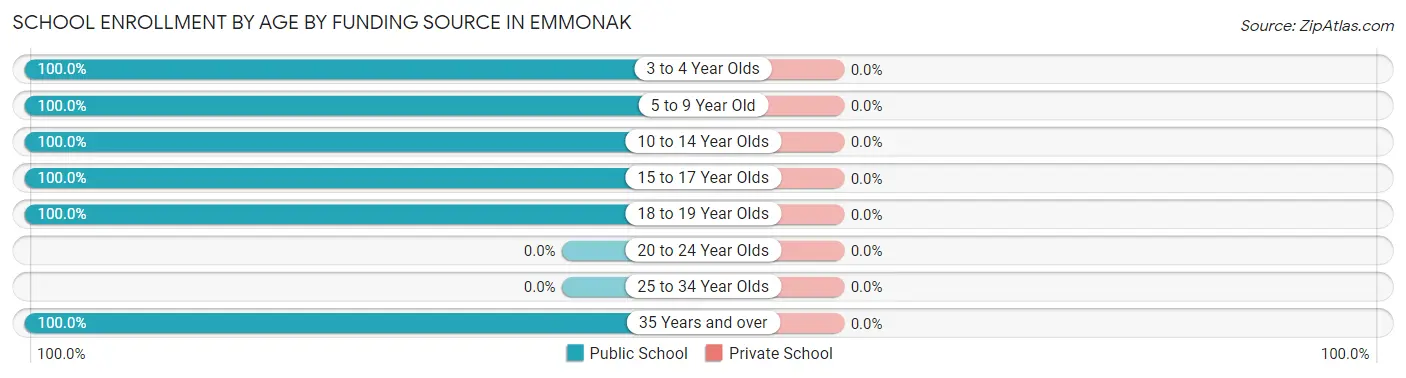
| Age Bracket | Public School | Private School |
| 3 to 4 Year Olds | 38 (100.0%) | 0 (0.0%) |
| 5 to 9 Year Old | 131 (100.0%) | 0 (0.0%) |
| 10 to 14 Year Olds | 86 (100.0%) | 0 (0.0%) |
| 15 to 17 Year Olds | 59 (100.0%) | 0 (0.0%) |
| 18 to 19 Year Olds | 7 (100.0%) | 0 (0.0%) |
| 20 to 24 Year Olds | 0 (0.0%) | 0 (0.0%) |
| 25 to 34 Year Olds | 0 (0.0%) | 0 (0.0%) |
| 35 Years and over | 3 (100.0%) | 0 (0.0%) |
| Total | 324 (100.0%) | 0 (0.0%) |
Educational Attainment by Field of Study in Emmonak
Business (68 | 69.4%), bio, nature & agricultural (10 | 10.2%), literature & languages (9 | 9.2%), education (6 | 6.1%), and physical & health sciences (5 | 5.1%) are the most common fields of study among 98 individuals in Emmonak who have obtained a bachelor's degree or higher.
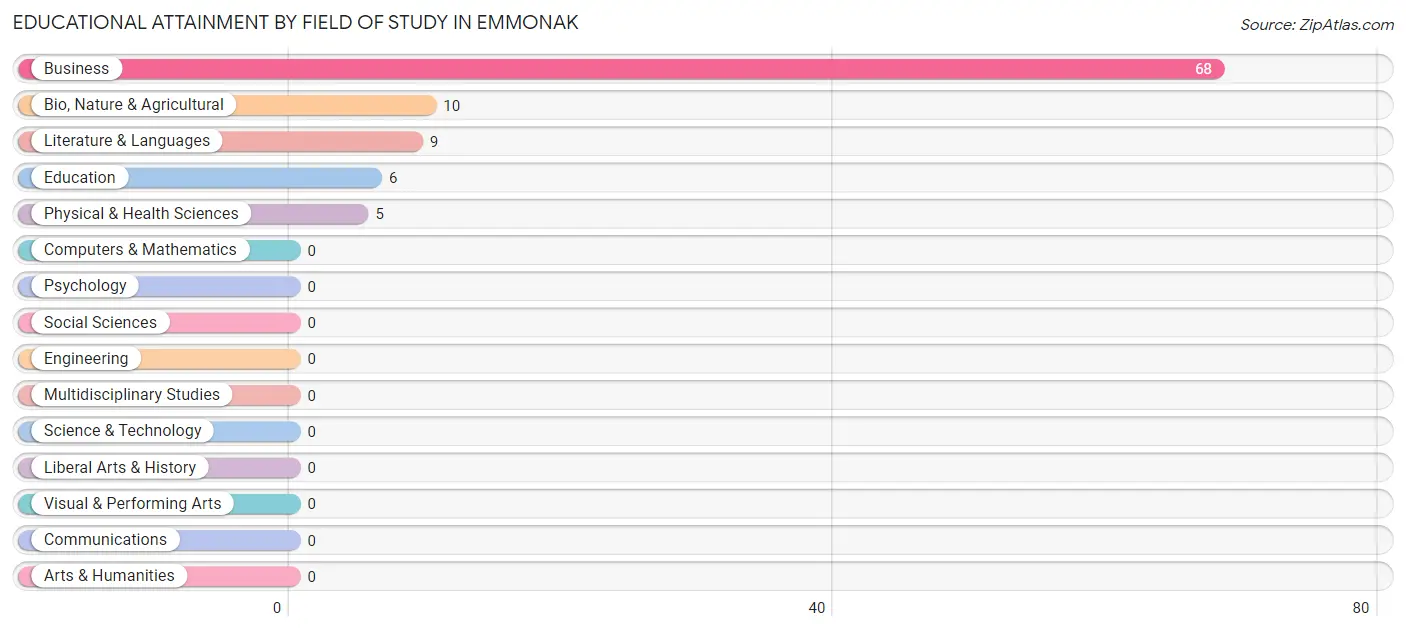
| Field of Study | # Graduates | % Graduates |
| Computers & Mathematics | 0 | 0.0% |
| Bio, Nature & Agricultural | 10 | 10.2% |
| Physical & Health Sciences | 5 | 5.1% |
| Psychology | 0 | 0.0% |
| Social Sciences | 0 | 0.0% |
| Engineering | 0 | 0.0% |
| Multidisciplinary Studies | 0 | 0.0% |
| Science & Technology | 0 | 0.0% |
| Business | 68 | 69.4% |
| Education | 6 | 6.1% |
| Literature & Languages | 9 | 9.2% |
| Liberal Arts & History | 0 | 0.0% |
| Visual & Performing Arts | 0 | 0.0% |
| Communications | 0 | 0.0% |
| Arts & Humanities | 0 | 0.0% |
| Total | 98 | 100.0% |
Transportation & Commute in Emmonak
Vehicle Availability by Sex in Emmonak
The most prevalent vehicle ownership categories in Emmonak are males with no vehicle (96, accounting for 67.1%) and females with no vehicle (176, making up 40.0%).
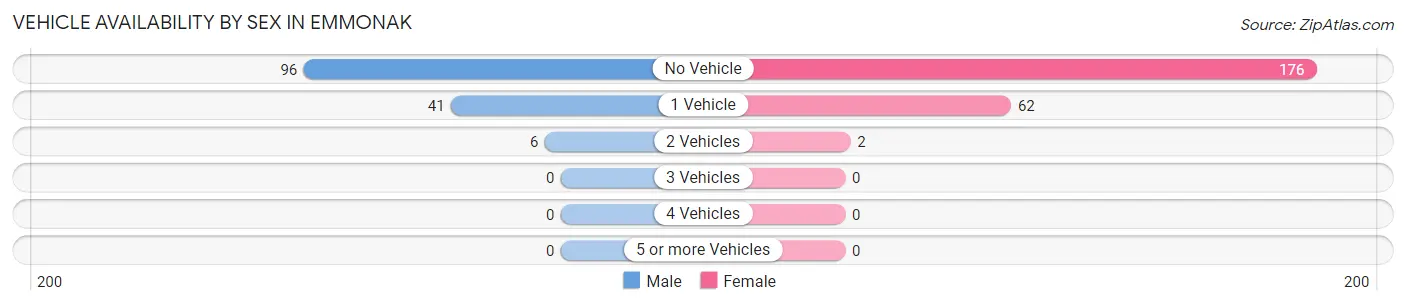
| Vehicles Available | Male | Female |
| No Vehicle | 96 (67.1%) | 176 (73.3%) |
| 1 Vehicle | 41 (28.7%) | 62 (25.8%) |
| 2 Vehicles | 6 (4.2%) | 2 (0.8%) |
| 3 Vehicles | 0 (0.0%) | 0 (0.0%) |
| 4 Vehicles | 0 (0.0%) | 0 (0.0%) |
| 5 or more Vehicles | 0 (0.0%) | 0 (0.0%) |
| Total | 143 (100.0%) | 240 (100.0%) |
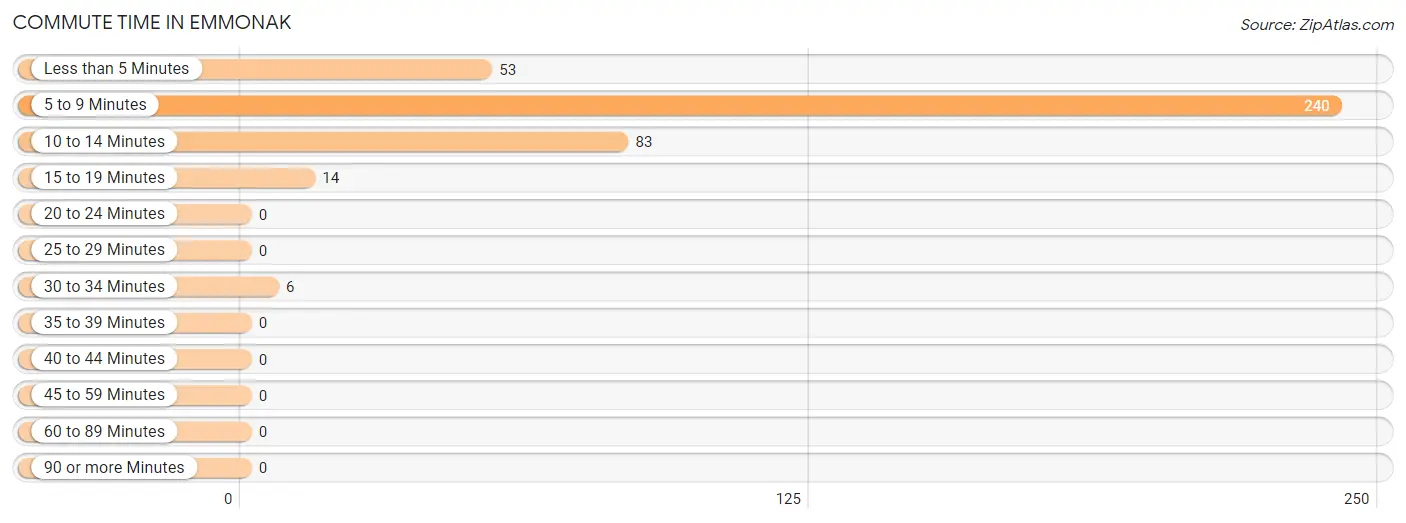
Commute Time in Emmonak
The most frequently occuring commute durations in Emmonak are 5 to 9 minutes (240 commuters, 60.6%), 10 to 14 minutes (83 commuters, 21.0%), and less than 5 minutes (53 commuters, 13.4%).
| Commute Time | # Commuters | % Commuters |
| Less than 5 Minutes | 53 | 13.4% |
| 5 to 9 Minutes | 240 | 60.6% |
| 10 to 14 Minutes | 83 | 21.0% |
| 15 to 19 Minutes | 14 | 3.5% |
| 20 to 24 Minutes | 0 | 0.0% |
| 25 to 29 Minutes | 0 | 0.0% |
| 30 to 34 Minutes | 6 | 1.5% |
| 35 to 39 Minutes | 0 | 0.0% |
| 40 to 44 Minutes | 0 | 0.0% |
| 45 to 59 Minutes | 0 | 0.0% |
| 60 to 89 Minutes | 0 | 0.0% |
| 90 or more Minutes | 0 | 0.0% |
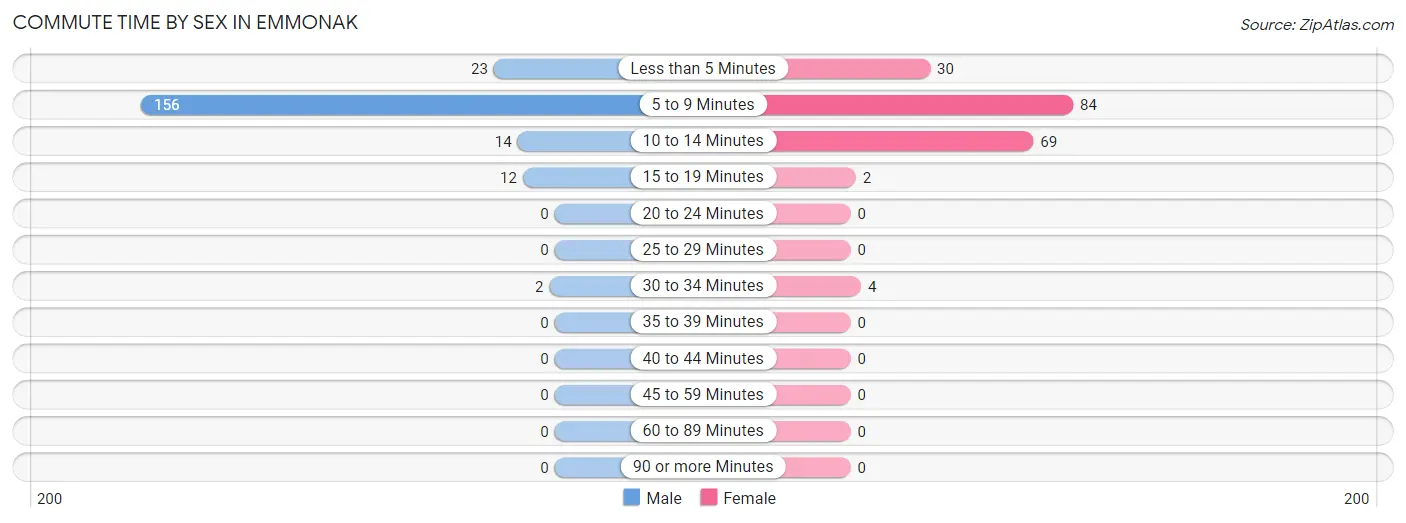
Commute Time by Sex in Emmonak
The most common commute times in Emmonak are 5 to 9 minutes (156 commuters, 75.4%) for males and 5 to 9 minutes (84 commuters, 44.4%) for females.
| Commute Time | Male | Female |
| Less than 5 Minutes | 23 (11.1%) | 30 (15.9%) |
| 5 to 9 Minutes | 156 (75.4%) | 84 (44.4%) |
| 10 to 14 Minutes | 14 (6.8%) | 69 (36.5%) |
| 15 to 19 Minutes | 12 (5.8%) | 2 (1.1%) |
| 20 to 24 Minutes | 0 (0.0%) | 0 (0.0%) |
| 25 to 29 Minutes | 0 (0.0%) | 0 (0.0%) |
| 30 to 34 Minutes | 2 (1.0%) | 4 (2.1%) |
| 35 to 39 Minutes | 0 (0.0%) | 0 (0.0%) |
| 40 to 44 Minutes | 0 (0.0%) | 0 (0.0%) |
| 45 to 59 Minutes | 0 (0.0%) | 0 (0.0%) |
| 60 to 89 Minutes | 0 (0.0%) | 0 (0.0%) |
| 90 or more Minutes | 0 (0.0%) | 0 (0.0%) |
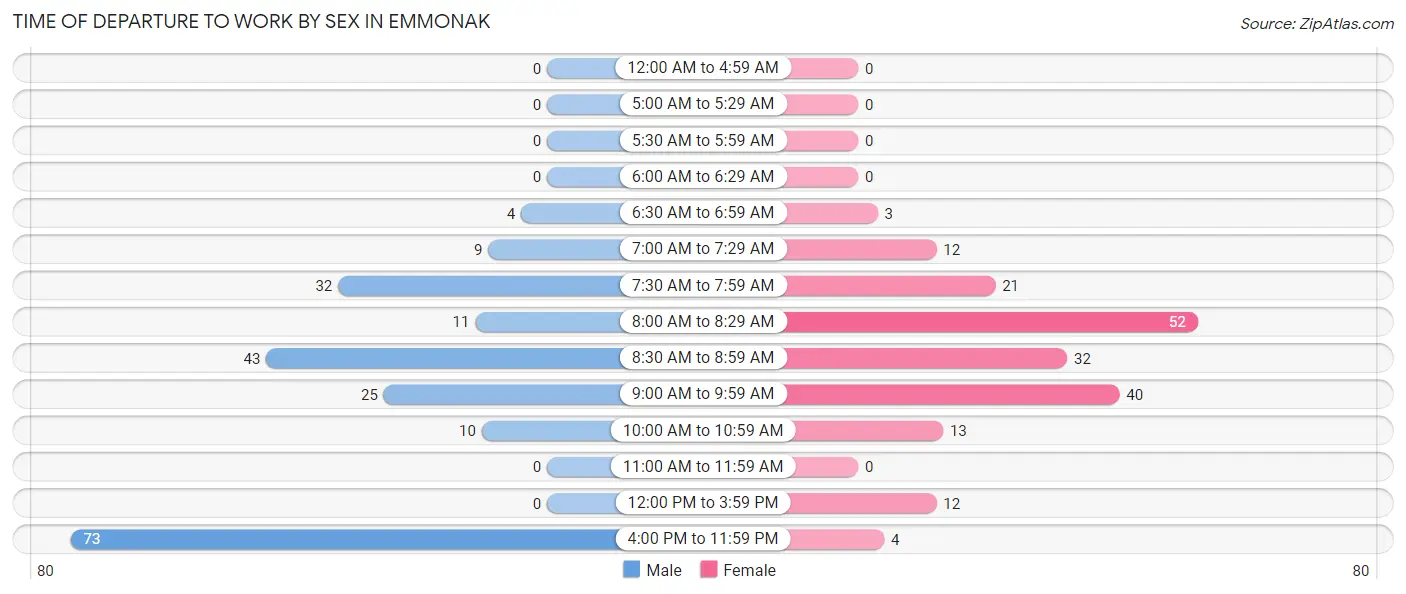
Time of Departure to Work by Sex in Emmonak
The most frequent times of departure to work in Emmonak are 4:00 PM to 11:59 PM (73, 35.3%) for males and 8:00 AM to 8:29 AM (52, 27.5%) for females.
| Time of Departure | Male | Female |
| 12:00 AM to 4:59 AM | 0 (0.0%) | 0 (0.0%) |
| 5:00 AM to 5:29 AM | 0 (0.0%) | 0 (0.0%) |
| 5:30 AM to 5:59 AM | 0 (0.0%) | 0 (0.0%) |
| 6:00 AM to 6:29 AM | 0 (0.0%) | 0 (0.0%) |
| 6:30 AM to 6:59 AM | 4 (1.9%) | 3 (1.6%) |
| 7:00 AM to 7:29 AM | 9 (4.3%) | 12 (6.4%) |
| 7:30 AM to 7:59 AM | 32 (15.5%) | 21 (11.1%) |
| 8:00 AM to 8:29 AM | 11 (5.3%) | 52 (27.5%) |
| 8:30 AM to 8:59 AM | 43 (20.8%) | 32 (16.9%) |
| 9:00 AM to 9:59 AM | 25 (12.1%) | 40 (21.2%) |
| 10:00 AM to 10:59 AM | 10 (4.8%) | 13 (6.9%) |
| 11:00 AM to 11:59 AM | 0 (0.0%) | 0 (0.0%) |
| 12:00 PM to 3:59 PM | 0 (0.0%) | 12 (6.4%) |
| 4:00 PM to 11:59 PM | 73 (35.3%) | 4 (2.1%) |
| Total | 207 (100.0%) | 189 (100.0%) |
Housing Occupancy in Emmonak
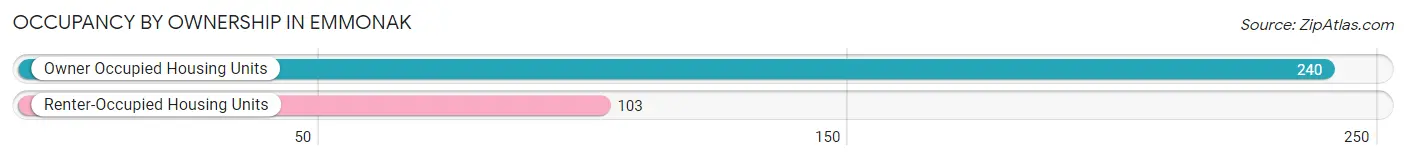
Occupancy by Ownership in Emmonak
Of the total 343 dwellings in Emmonak, owner-occupied units account for 240 (70.0%), while renter-occupied units make up 103 (30.0%).
| Occupancy | # Housing Units | % Housing Units |
| Owner Occupied Housing Units | 240 | 70.0% |
| Renter-Occupied Housing Units | 103 | 30.0% |
| Total Occupied Housing Units | 343 | 100.0% |
Occupancy by Household Size in Emmonak
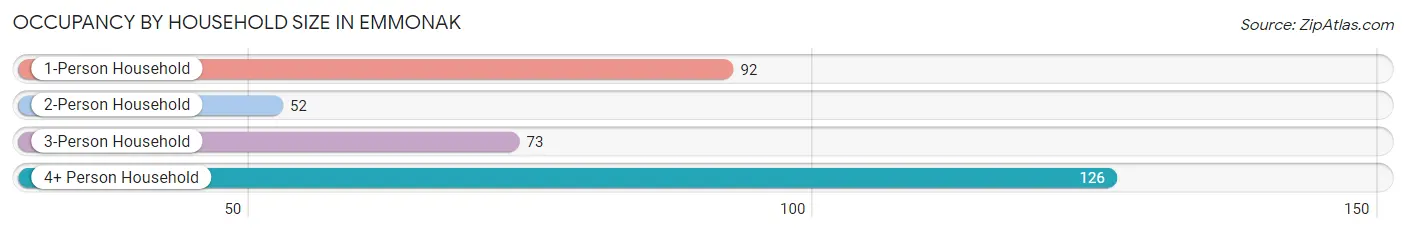
| Household Size | # Housing Units | % Housing Units |
| 1-Person Household | 92 | 26.8% |
| 2-Person Household | 52 | 15.2% |
| 3-Person Household | 73 | 21.3% |
| 4+ Person Household | 126 | 36.7% |
| Total Housing Units | 343 | 100.0% |
Occupancy by Ownership by Household Size in Emmonak
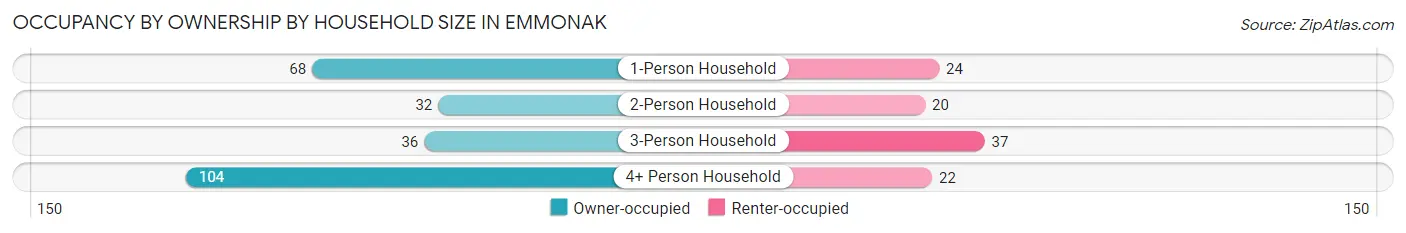
| Household Size | Owner-occupied | Renter-occupied |
| 1-Person Household | 68 (73.9%) | 24 (26.1%) |
| 2-Person Household | 32 (61.5%) | 20 (38.5%) |
| 3-Person Household | 36 (49.3%) | 37 (50.7%) |
| 4+ Person Household | 104 (82.5%) | 22 (17.5%) |
| Total Housing Units | 240 (70.0%) | 103 (30.0%) |
Occupancy by Educational Attainment in Emmonak
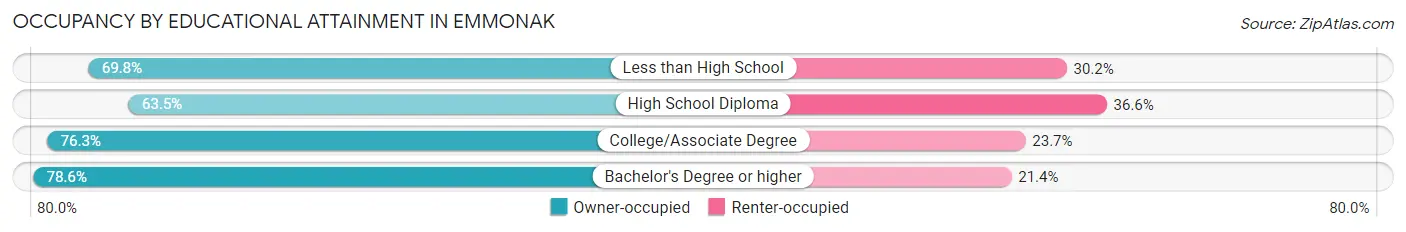
| Household Size | Owner-occupied | Renter-occupied |
| Less than High School | 37 (69.8%) | 16 (30.2%) |
| High School Diploma | 92 (63.4%) | 53 (36.5%) |
| College/Associate Degree | 100 (76.3%) | 31 (23.7%) |
| Bachelor's Degree or higher | 11 (78.6%) | 3 (21.4%) |
Occupancy by Age of Householder in Emmonak
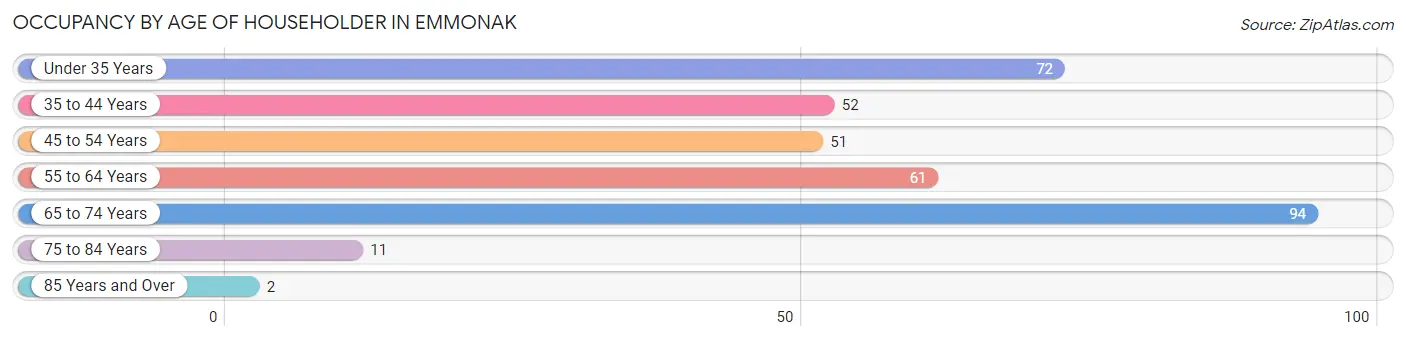
| Age Bracket | # Households | % Households |
| Under 35 Years | 72 | 21.0% |
| 35 to 44 Years | 52 | 15.2% |
| 45 to 54 Years | 51 | 14.9% |
| 55 to 64 Years | 61 | 17.8% |
| 65 to 74 Years | 94 | 27.4% |
| 75 to 84 Years | 11 | 3.2% |
| 85 Years and Over | 2 | 0.6% |
| Total | 343 | 100.0% |
Housing Finances in Emmonak
Median Income by Occupancy in Emmonak
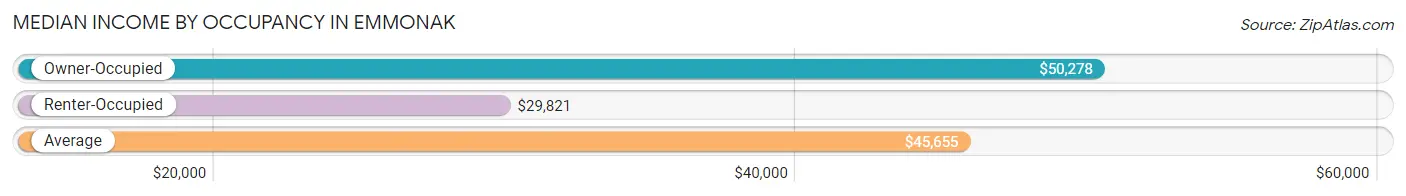
| Occupancy Type | # Households | Median Income |
| Owner-Occupied | 240 (70.0%) | $50,278 |
| Renter-Occupied | 103 (30.0%) | $29,821 |
| Average | 343 (100.0%) | $45,655 |
Occupancy by Householder Income Bracket in Emmonak
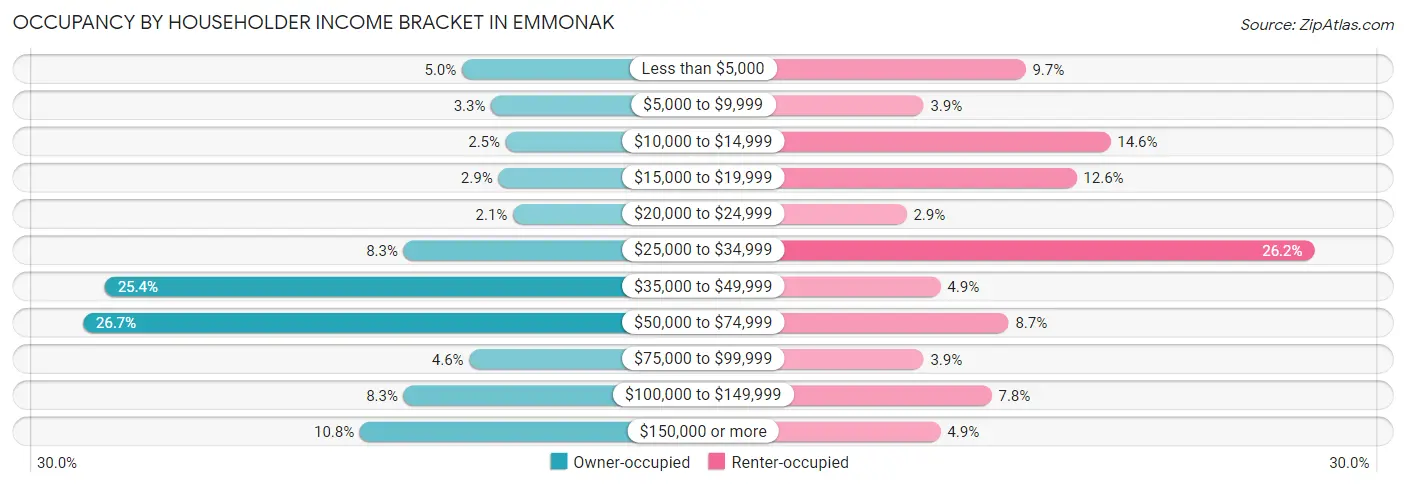
| Income Bracket | Owner-occupied | Renter-occupied |
| Less than $5,000 | 12 (5.0%) | 10 (9.7%) |
| $5,000 to $9,999 | 8 (3.3%) | 4 (3.9%) |
| $10,000 to $14,999 | 6 (2.5%) | 15 (14.6%) |
| $15,000 to $19,999 | 7 (2.9%) | 13 (12.6%) |
| $20,000 to $24,999 | 5 (2.1%) | 3 (2.9%) |
| $25,000 to $34,999 | 20 (8.3%) | 27 (26.2%) |
| $35,000 to $49,999 | 61 (25.4%) | 5 (4.9%) |
| $50,000 to $74,999 | 64 (26.7%) | 9 (8.7%) |
| $75,000 to $99,999 | 11 (4.6%) | 4 (3.9%) |
| $100,000 to $149,999 | 20 (8.3%) | 8 (7.8%) |
| $150,000 or more | 26 (10.8%) | 5 (4.9%) |
| Total | 240 (100.0%) | 103 (100.0%) |
Monthly Housing Cost Tiers in Emmonak
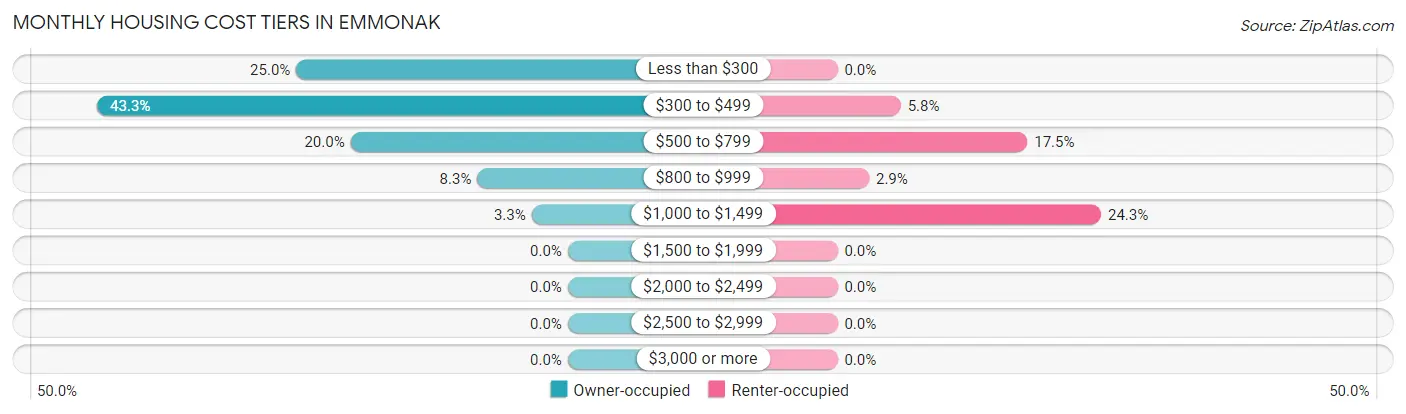
| Monthly Cost | Owner-occupied | Renter-occupied |
| Less than $300 | 60 (25.0%) | 0 (0.0%) |
| $300 to $499 | 104 (43.3%) | 6 (5.8%) |
| $500 to $799 | 48 (20.0%) | 18 (17.5%) |
| $800 to $999 | 20 (8.3%) | 3 (2.9%) |
| $1,000 to $1,499 | 8 (3.3%) | 25 (24.3%) |
| $1,500 to $1,999 | 0 (0.0%) | 0 (0.0%) |
| $2,000 to $2,499 | 0 (0.0%) | 0 (0.0%) |
| $2,500 to $2,999 | 0 (0.0%) | 0 (0.0%) |
| $3,000 or more | 0 (0.0%) | 0 (0.0%) |
| Total | 240 (100.0%) | 103 (100.0%) |
Physical Housing Characteristics in Emmonak
Housing Structures in Emmonak
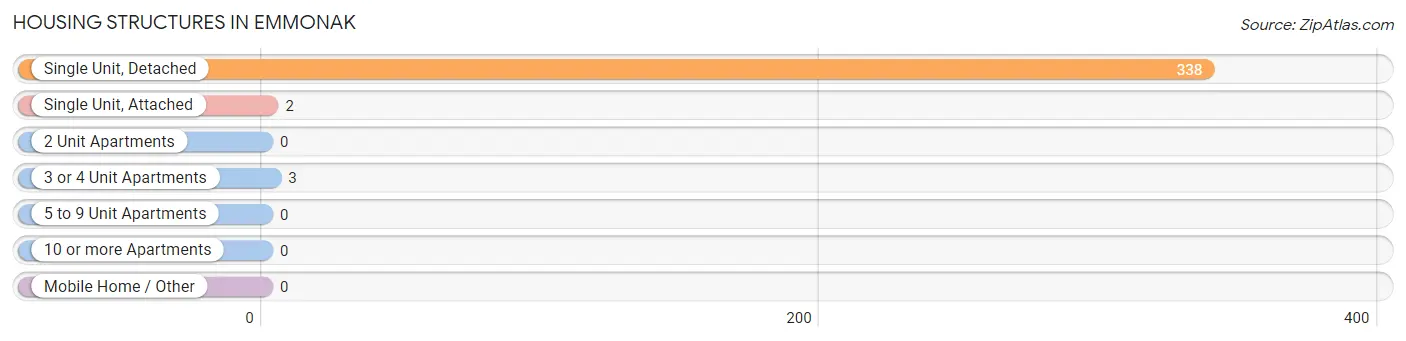
| Structure Type | # Housing Units | % Housing Units |
| Single Unit, Detached | 338 | 98.5% |
| Single Unit, Attached | 2 | 0.6% |
| 2 Unit Apartments | 0 | 0.0% |
| 3 or 4 Unit Apartments | 3 | 0.9% |
| 5 to 9 Unit Apartments | 0 | 0.0% |
| 10 or more Apartments | 0 | 0.0% |
| Mobile Home / Other | 0 | 0.0% |
| Total | 343 | 100.0% |
Housing Structures by Occupancy in Emmonak
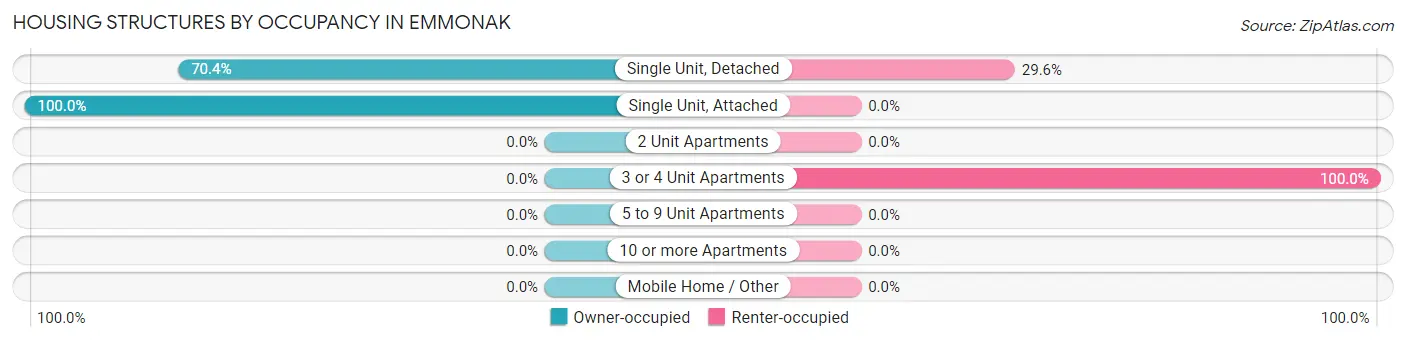
| Structure Type | Owner-occupied | Renter-occupied |
| Single Unit, Detached | 238 (70.4%) | 100 (29.6%) |
| Single Unit, Attached | 2 (100.0%) | 0 (0.0%) |
| 2 Unit Apartments | 0 (0.0%) | 0 (0.0%) |
| 3 or 4 Unit Apartments | 0 (0.0%) | 3 (100.0%) |
| 5 to 9 Unit Apartments | 0 (0.0%) | 0 (0.0%) |
| 10 or more Apartments | 0 (0.0%) | 0 (0.0%) |
| Mobile Home / Other | 0 (0.0%) | 0 (0.0%) |
| Total | 240 (70.0%) | 103 (30.0%) |
Housing Structures by Number of Rooms in Emmonak
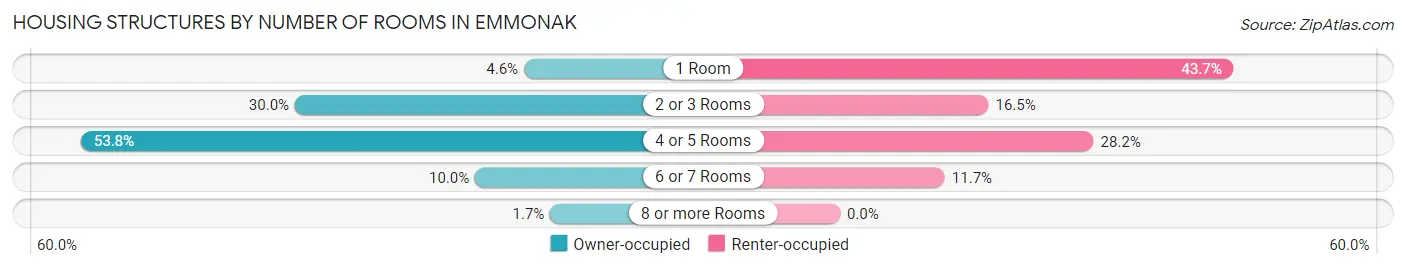
| Number of Rooms | Owner-occupied | Renter-occupied |
| 1 Room | 11 (4.6%) | 45 (43.7%) |
| 2 or 3 Rooms | 72 (30.0%) | 17 (16.5%) |
| 4 or 5 Rooms | 129 (53.7%) | 29 (28.2%) |
| 6 or 7 Rooms | 24 (10.0%) | 12 (11.7%) |
| 8 or more Rooms | 4 (1.7%) | 0 (0.0%) |
| Total | 240 (100.0%) | 103 (100.0%) |
Housing Structure by Heating Type in Emmonak
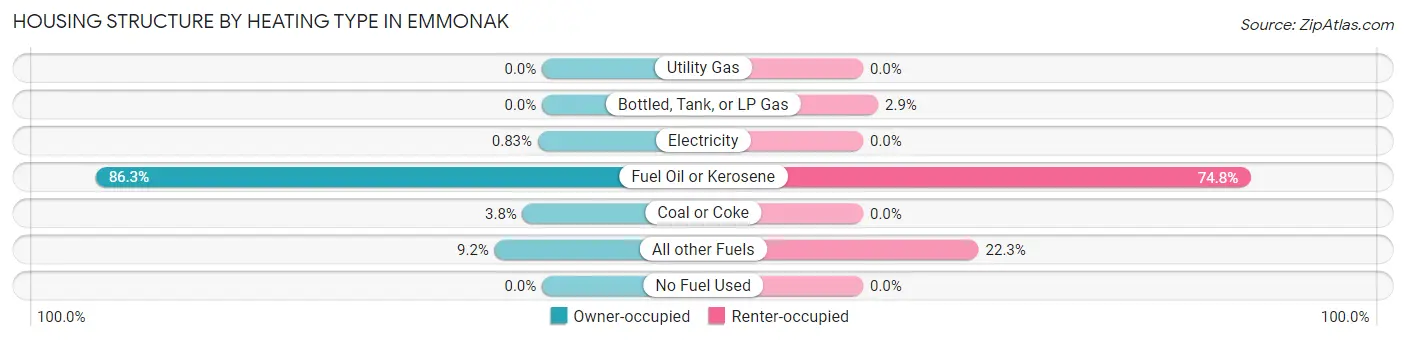
| Heating Type | Owner-occupied | Renter-occupied |
| Utility Gas | 0 (0.0%) | 0 (0.0%) |
| Bottled, Tank, or LP Gas | 0 (0.0%) | 3 (2.9%) |
| Electricity | 2 (0.8%) | 0 (0.0%) |
| Fuel Oil or Kerosene | 207 (86.3%) | 77 (74.8%) |
| Coal or Coke | 9 (3.7%) | 0 (0.0%) |
| All other Fuels | 22 (9.2%) | 23 (22.3%) |
| No Fuel Used | 0 (0.0%) | 0 (0.0%) |
| Total | 240 (100.0%) | 103 (100.0%) |
Household Vehicle Usage in Emmonak
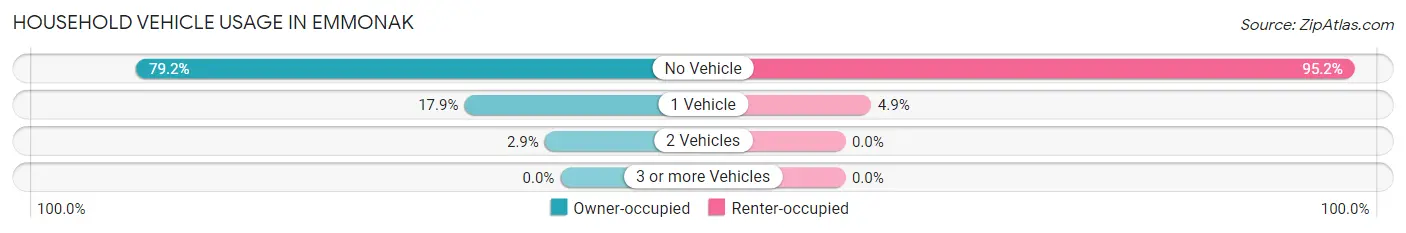
| Vehicles per Household | Owner-occupied | Renter-occupied |
| No Vehicle | 190 (79.2%) | 98 (95.2%) |
| 1 Vehicle | 43 (17.9%) | 5 (4.9%) |
| 2 Vehicles | 7 (2.9%) | 0 (0.0%) |
| 3 or more Vehicles | 0 (0.0%) | 0 (0.0%) |
| Total | 240 (100.0%) | 103 (100.0%) |
Real Estate & Mortgages in Emmonak
Real Estate and Mortgage Overview in Emmonak
| Characteristic | Without Mortgage | With Mortgage |
| Housing Units | 221 | 19 |
| Median Property Value | $107,200 | $107,500 |
| Median Household Income | $49,750 | $3 |
| Monthly Housing Costs | $425 | $0 |
| Real Estate Taxes | $199 | $16 |
Property Value by Mortgage Status in Emmonak
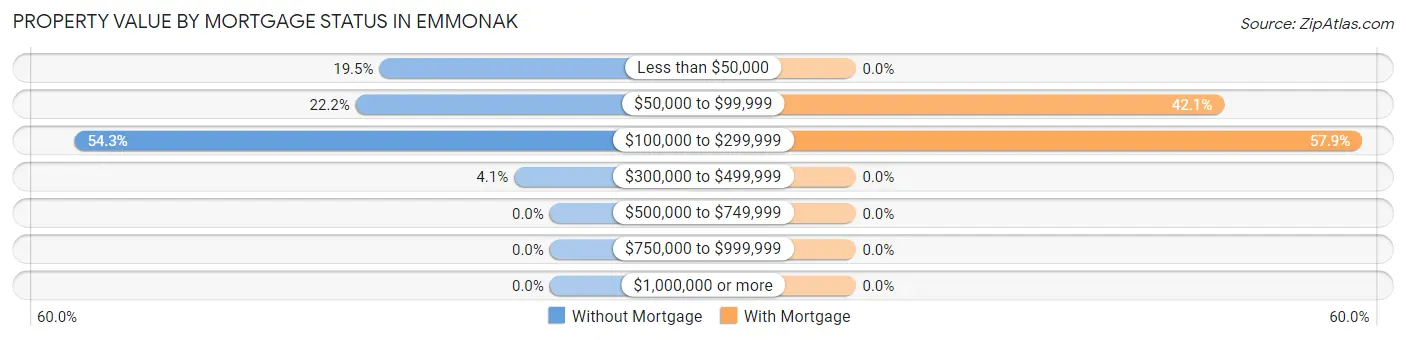
| Property Value | Without Mortgage | With Mortgage |
| Less than $50,000 | 43 (19.5%) | 0 (0.0%) |
| $50,000 to $99,999 | 49 (22.2%) | 8 (42.1%) |
| $100,000 to $299,999 | 120 (54.3%) | 11 (57.9%) |
| $300,000 to $499,999 | 9 (4.1%) | 0 (0.0%) |
| $500,000 to $749,999 | 0 (0.0%) | 0 (0.0%) |
| $750,000 to $999,999 | 0 (0.0%) | 0 (0.0%) |
| $1,000,000 or more | 0 (0.0%) | 0 (0.0%) |
| Total | 221 (100.0%) | 19 (100.0%) |
Household Income by Mortgage Status in Emmonak
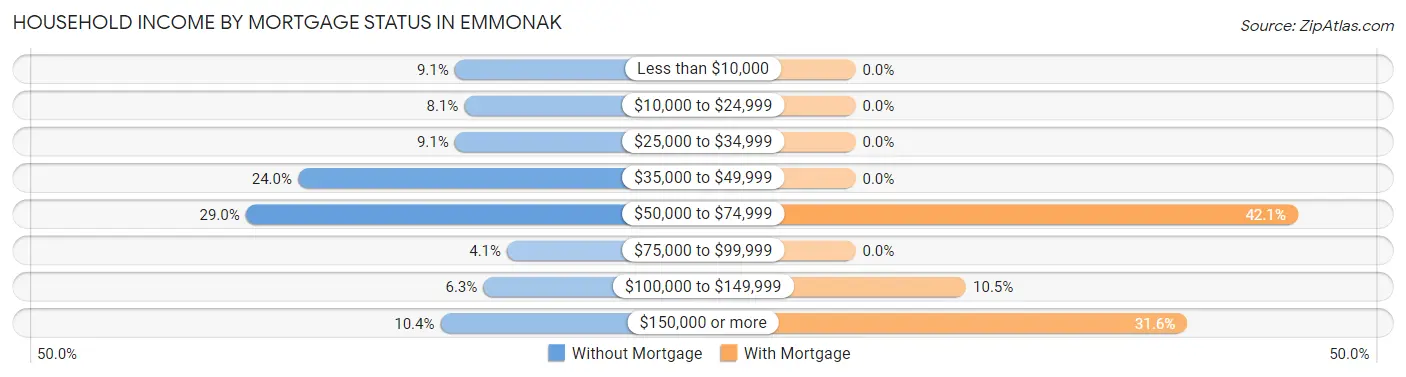
| Household Income | Without Mortgage | With Mortgage |
| Less than $10,000 | 20 (9.0%) | 0 (0.0%) |
| $10,000 to $24,999 | 18 (8.1%) | 0 (0.0%) |
| $25,000 to $34,999 | 20 (9.0%) | 0 (0.0%) |
| $35,000 to $49,999 | 53 (24.0%) | 0 (0.0%) |
| $50,000 to $74,999 | 64 (29.0%) | 8 (42.1%) |
| $75,000 to $99,999 | 9 (4.1%) | 0 (0.0%) |
| $100,000 to $149,999 | 14 (6.3%) | 2 (10.5%) |
| $150,000 or more | 23 (10.4%) | 6 (31.6%) |
| Total | 221 (100.0%) | 19 (100.0%) |
Property Value to Household Income Ratio in Emmonak
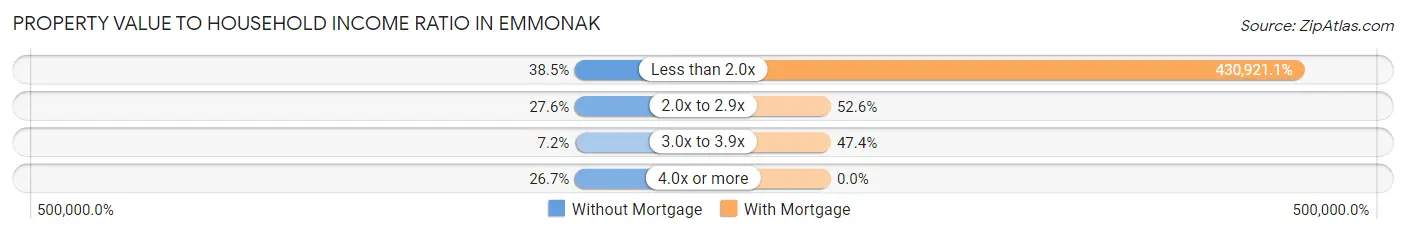
| Value-to-Income Ratio | Without Mortgage | With Mortgage |
| Less than 2.0x | 85 (38.5%) | 81,875 (430,921.1%) |
| 2.0x to 2.9x | 61 (27.6%) | 10 (52.6%) |
| 3.0x to 3.9x | 16 (7.2%) | 9 (47.4%) |
| 4.0x or more | 59 (26.7%) | 0 (0.0%) |
| Total | 221 (100.0%) | 19 (100.0%) |
Real Estate Taxes by Mortgage Status in Emmonak
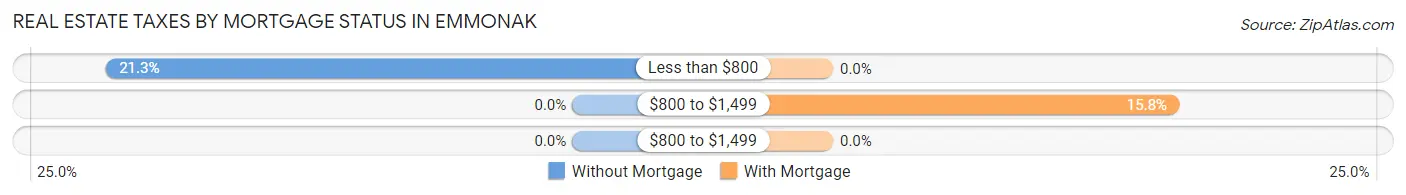
| Property Taxes | Without Mortgage | With Mortgage |
| Less than $800 | 47 (21.3%) | 0 (0.0%) |
| $800 to $1,499 | 0 (0.0%) | 3 (15.8%) |
| $800 to $1,499 | 0 (0.0%) | 0 (0.0%) |
| Total | 221 (100.0%) | 19 (100.0%) |
Health & Disability in Emmonak
Health Insurance Coverage by Age in Emmonak
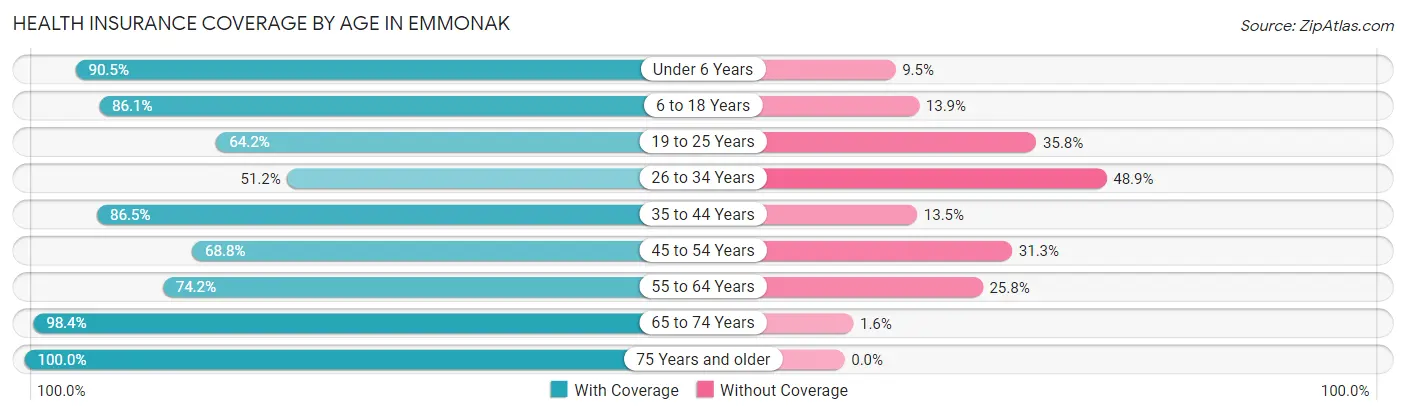
| Age Bracket | With Coverage | Without Coverage |
| Under 6 Years | 181 (90.5%) | 19 (9.5%) |
| 6 to 18 Years | 254 (86.1%) | 41 (13.9%) |
| 19 to 25 Years | 88 (64.2%) | 49 (35.8%) |
| 26 to 34 Years | 89 (51.1%) | 85 (48.8%) |
| 35 to 44 Years | 147 (86.5%) | 23 (13.5%) |
| 45 to 54 Years | 55 (68.8%) | 25 (31.2%) |
| 55 to 64 Years | 72 (74.2%) | 25 (25.8%) |
| 65 to 74 Years | 121 (98.4%) | 2 (1.6%) |
| 75 Years and older | 17 (100.0%) | 0 (0.0%) |
| Total | 1,024 (79.2%) | 269 (20.8%) |
Health Insurance Coverage by Citizenship Status in Emmonak
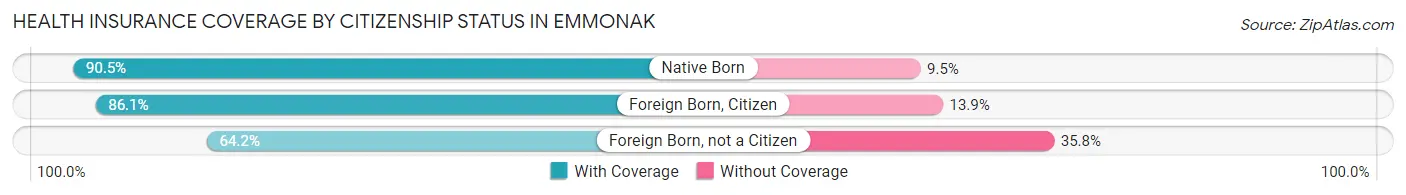
| Citizenship Status | With Coverage | Without Coverage |
| Native Born | 181 (90.5%) | 19 (9.5%) |
| Foreign Born, Citizen | 254 (86.1%) | 41 (13.9%) |
| Foreign Born, not a Citizen | 88 (64.2%) | 49 (35.8%) |
Health Insurance Coverage by Household Income in Emmonak
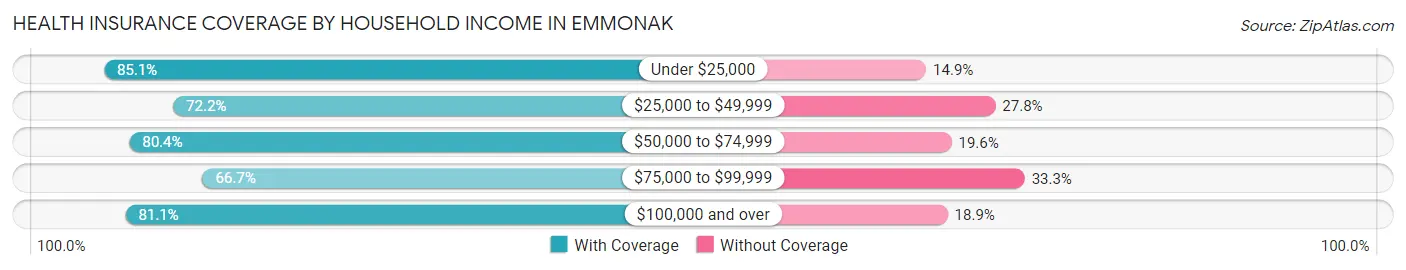
| Household Income | With Coverage | Without Coverage |
| Under $25,000 | 166 (85.1%) | 29 (14.9%) |
| $25,000 to $49,999 | 280 (72.2%) | 108 (27.8%) |
| $50,000 to $74,999 | 127 (80.4%) | 31 (19.6%) |
| $75,000 to $99,999 | 44 (66.7%) | 22 (33.3%) |
| $100,000 and over | 339 (81.1%) | 79 (18.9%) |
Public vs Private Health Insurance Coverage by Age in Emmonak
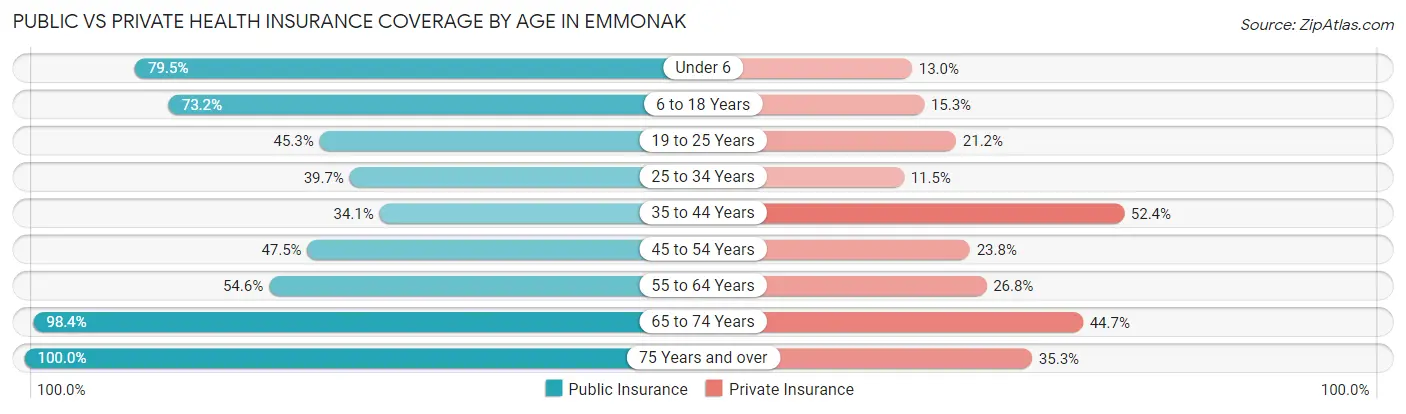
| Age Bracket | Public Insurance | Private Insurance |
| Under 6 | 159 (79.5%) | 26 (13.0%) |
| 6 to 18 Years | 216 (73.2%) | 45 (15.2%) |
| 19 to 25 Years | 62 (45.3%) | 29 (21.2%) |
| 25 to 34 Years | 69 (39.7%) | 20 (11.5%) |
| 35 to 44 Years | 58 (34.1%) | 89 (52.3%) |
| 45 to 54 Years | 38 (47.5%) | 19 (23.7%) |
| 55 to 64 Years | 53 (54.6%) | 26 (26.8%) |
| 65 to 74 Years | 121 (98.4%) | 55 (44.7%) |
| 75 Years and over | 17 (100.0%) | 6 (35.3%) |
| Total | 793 (61.3%) | 315 (24.4%) |
Disability Status by Sex by Age in Emmonak
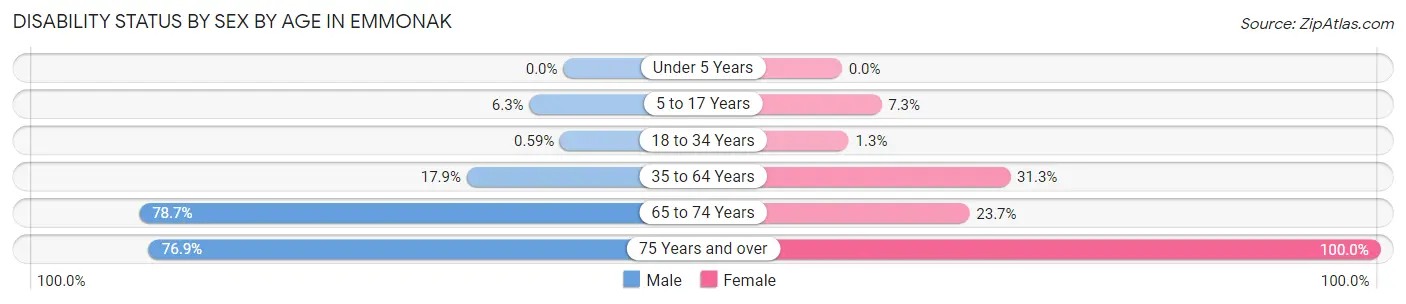
| Age Bracket | Male | Female |
| Under 5 Years | 0 (0.0%) | 0 (0.0%) |
| 5 to 17 Years | 10 (6.3%) | 11 (7.3%) |
| 18 to 34 Years | 1 (0.6%) | 2 (1.3%) |
| 35 to 64 Years | 45 (17.9%) | 30 (31.2%) |
| 65 to 74 Years | 37 (78.7%) | 18 (23.7%) |
| 75 Years and over | 10 (76.9%) | 4 (100.0%) |
Disability Class by Sex by Age in Emmonak
Disability Class: Hearing Difficulty
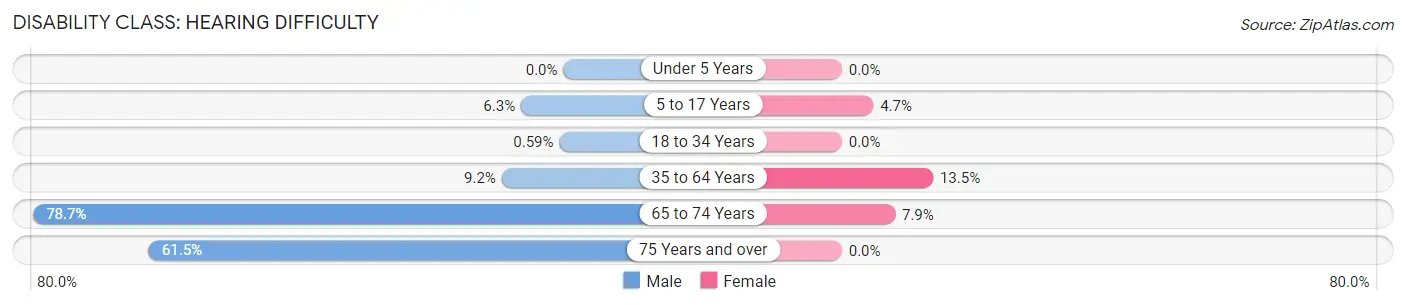
| Age Bracket | Male | Female |
| Under 5 Years | 0 (0.0%) | 0 (0.0%) |
| 5 to 17 Years | 10 (6.3%) | 7 (4.7%) |
| 18 to 34 Years | 1 (0.6%) | 0 (0.0%) |
| 35 to 64 Years | 23 (9.2%) | 13 (13.5%) |
| 65 to 74 Years | 37 (78.7%) | 6 (7.9%) |
| 75 Years and over | 8 (61.5%) | 0 (0.0%) |
Disability Class: Vision Difficulty
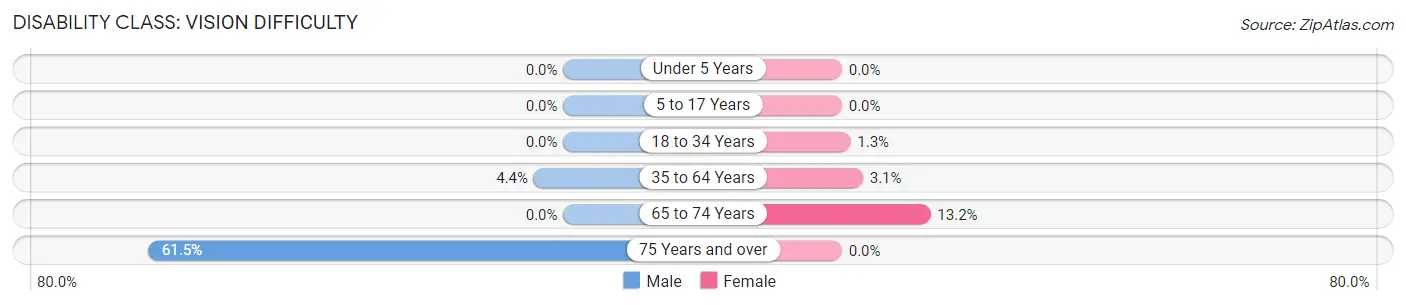
| Age Bracket | Male | Female |
| Under 5 Years | 0 (0.0%) | 0 (0.0%) |
| 5 to 17 Years | 0 (0.0%) | 0 (0.0%) |
| 18 to 34 Years | 0 (0.0%) | 2 (1.3%) |
| 35 to 64 Years | 11 (4.4%) | 3 (3.1%) |
| 65 to 74 Years | 0 (0.0%) | 10 (13.2%) |
| 75 Years and over | 8 (61.5%) | 0 (0.0%) |
Disability Class: Cognitive Difficulty
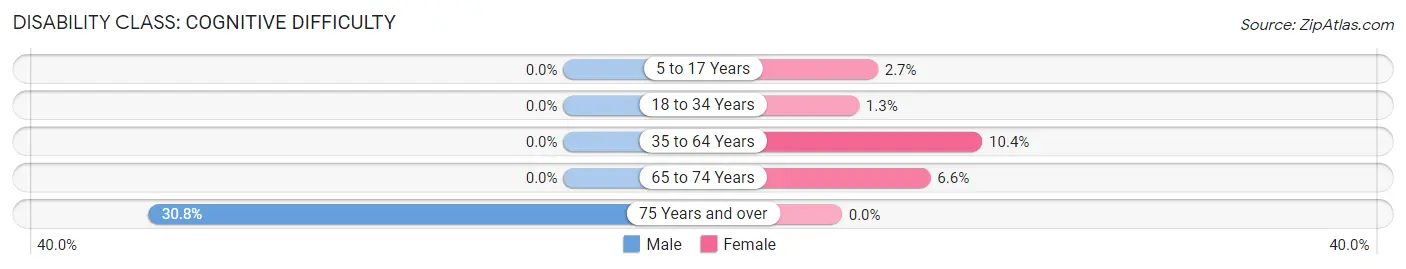
| Age Bracket | Male | Female |
| 5 to 17 Years | 0 (0.0%) | 4 (2.7%) |
| 18 to 34 Years | 0 (0.0%) | 2 (1.3%) |
| 35 to 64 Years | 0 (0.0%) | 10 (10.4%) |
| 65 to 74 Years | 0 (0.0%) | 5 (6.6%) |
| 75 Years and over | 4 (30.8%) | 0 (0.0%) |
Disability Class: Ambulatory Difficulty
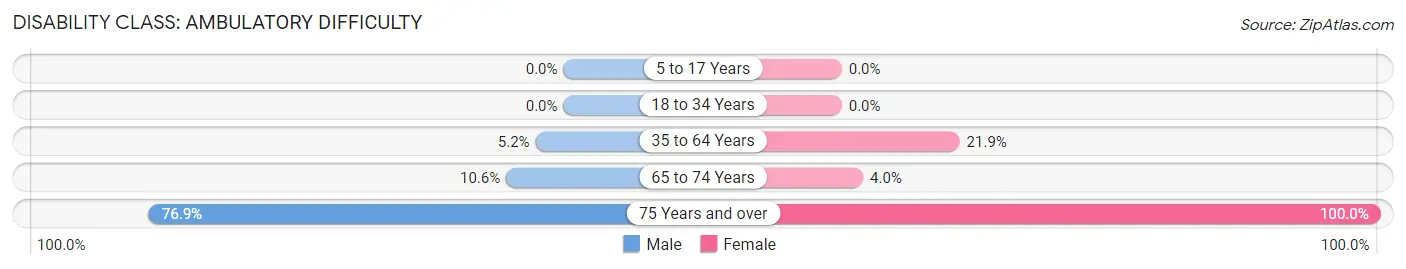
| Age Bracket | Male | Female |
| 5 to 17 Years | 0 (0.0%) | 0 (0.0%) |
| 18 to 34 Years | 0 (0.0%) | 0 (0.0%) |
| 35 to 64 Years | 13 (5.2%) | 21 (21.9%) |
| 65 to 74 Years | 5 (10.6%) | 3 (4.0%) |
| 75 Years and over | 10 (76.9%) | 4 (100.0%) |
Disability Class: Self-Care Difficulty
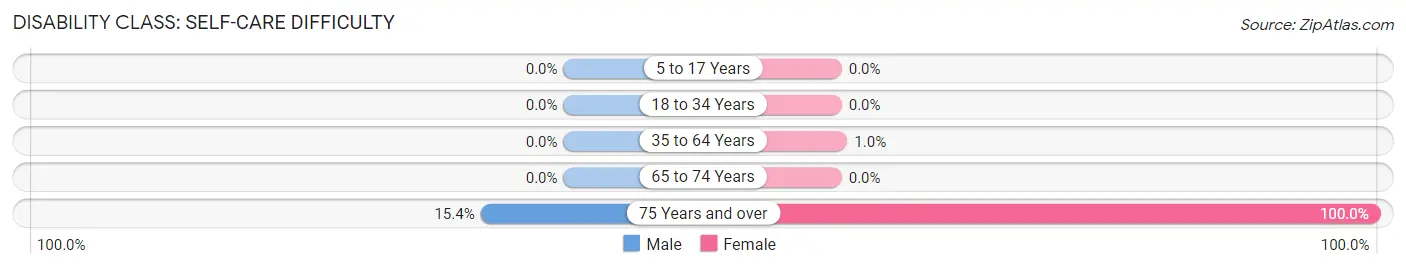
| Age Bracket | Male | Female |
| 5 to 17 Years | 0 (0.0%) | 0 (0.0%) |
| 18 to 34 Years | 0 (0.0%) | 0 (0.0%) |
| 35 to 64 Years | 0 (0.0%) | 1 (1.0%) |
| 65 to 74 Years | 0 (0.0%) | 0 (0.0%) |
| 75 Years and over | 2 (15.4%) | 4 (100.0%) |
Technology Access in Emmonak
Computing Device Access in Emmonak
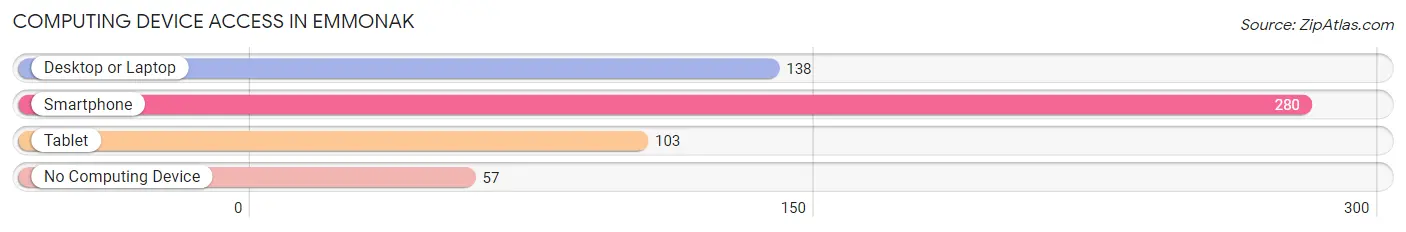
| Device Type | # Households | % Households |
| Desktop or Laptop | 138 | 40.2% |
| Smartphone | 280 | 81.6% |
| Tablet | 103 | 30.0% |
| No Computing Device | 57 | 16.6% |
| Total | 343 | 100.0% |
Internet Access in Emmonak
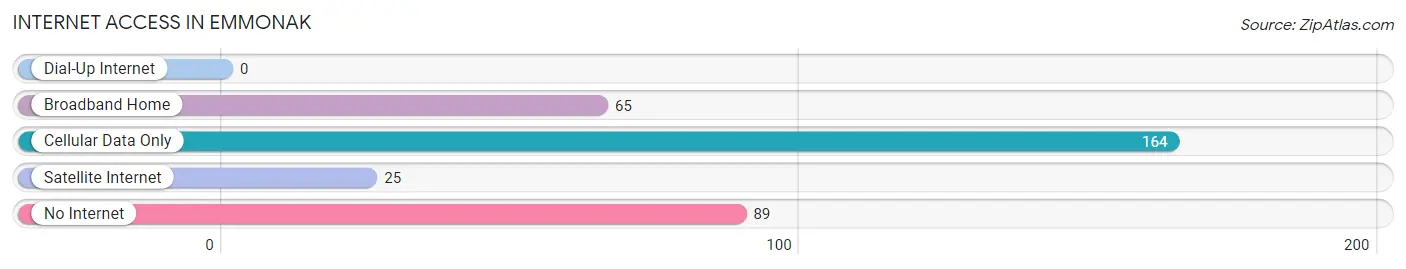
| Internet Type | # Households | % Households |
| Dial-Up Internet | 0 | 0.0% |
| Broadband Home | 65 | 19.0% |
| Cellular Data Only | 164 | 47.8% |
| Satellite Internet | 25 | 7.3% |
| No Internet | 89 | 26.0% |
| Total | 343 | 100.0% |
Emmonak Summary
Emmonak is a small city located in the western region of Alaska, United States. It is situated on the banks of the Yukon River, near the Bering Sea. The city is part of the Kusilvak Census Area and has a population of 862 people, according to the 2010 census.
Geography
Emmonak is located in the Yukon-Kuskokwim Delta, which is the largest delta in the United States. The city is situated on the banks of the Yukon River, near the Bering Sea. The city is surrounded by wetlands, tundra, and mountains. The climate in Emmonak is subarctic, with cold winters and mild summers. The average temperature in the summer is around 50°F (10°C), and in the winter it is around -10°F (-23°C).
Economy
The economy of Emmonak is largely based on fishing and subsistence activities. The city is home to several commercial fishing operations, which provide employment for many of the city’s residents. The city also has a fish processing plant, which processes salmon, herring, and other fish caught in the area.
The city also has a small tourism industry, with visitors coming to the area to experience the unique culture and natural beauty of the region. The city also has a small retail sector, with several stores selling local crafts and souvenirs.
Demographics
According to the 2010 census, the population of Emmonak was 862 people. The racial makeup of the city was 95.2% Native American, 2.2% White, 0.7% Asian, and 1.9% from other races. The median household income in the city was $25,000, and the median age was 33.
The majority of the population in Emmonak is Alaska Native, with the majority of the population belonging to the Yup’ik Eskimo tribe. The city is also home to a small population of Russian Old Believers, who are descendants of Russian settlers who arrived in the area in the late 19th century.
Conclusion
Emmonak is a small city located in the western region of Alaska, United States. It is situated on the banks of the Yukon River, near the Bering Sea. The city is part of the Kusilvak Census Area and has a population of 862 people, according to the 2010 census. The economy of Emmonak is largely based on fishing and subsistence activities, and the city also has a small tourism industry. The majority of the population in Emmonak is Alaska Native, with the majority of the population belonging to the Yup’ik Eskimo tribe. The city is also home to a small population of Russian Old Believers, who are descendants of Russian settlers who arrived in the area in the late 19th century.
Common Questions
What is Per Capita Income in Emmonak?
Per Capita income in Emmonak is $18,825.
What is the Median Family Income in Emmonak?
Median Family Income in Emmonak is $41,641.
What is the Median Household income in Emmonak?
Median Household Income in Emmonak is $45,655.
What is Income or Wage Gap in Emmonak?
Income or Wage Gap in Emmonak is 23.0%.
Women in Emmonak earn 77.0 cents for every dollar earned by a man.
What is Inequality or Gini Index in Emmonak?
Inequality or Gini Index in Emmonak is 0.44.
What is the Total Population of Emmonak?
Total Population of Emmonak is 1,293.
What is the Total Male Population of Emmonak?
Total Male Population of Emmonak is 731.
What is the Total Female Population of Emmonak?
Total Female Population of Emmonak is 562.
What is the Ratio of Males per 100 Females in Emmonak?
There are 130.07 Males per 100 Females in Emmonak.
What is the Ratio of Females per 100 Males in Emmonak?
There are 76.88 Females per 100 Males in Emmonak.
What is the Median Population Age in Emmonak?
Median Population Age in Emmonak is 26.8 Years.
What is the Average Family Size in Emmonak
Average Family Size in Emmonak is 4.3 People.
What is the Average Household Size in Emmonak
Average Household Size in Emmonak is 3.6 People.
How Large is the Labor Force in Emmonak?
There are 570 People in the Labor Forcein in Emmonak.
What is the Percentage of People in the Labor Force in Emmonak?
67.6% of People are in the Labor Force in Emmonak.
What is the Unemployment Rate in Emmonak?
Unemployment Rate in Emmonak is 17.5%.