Eek, AK Map & Demographics
Eek Map
Eek Overview
$17,033
PER CAPITA INCOME
$49,688
AVG FAMILY INCOME
$48,750
AVG HOUSEHOLD INCOME
0.44
INEQUALITY / GINI INDEX
475
TOTAL POPULATION
257
MALE POPULATION
218
FEMALE POPULATION
117.89
MALES / 100 FEMALES
84.82
FEMALES / 100 MALES
26.0
MEDIAN AGE
5.0
AVG FAMILY SIZE
4.4
AVG HOUSEHOLD SIZE
205
LABOR FORCE [ PEOPLE ]
66.1%
PERCENT IN LABOR FORCE
28.8%
UNEMPLOYMENT RATE
Eek Zip Codes
Eek Area Codes
Income in Eek
Income Overview in Eek
Per Capita Income in Eek is $17,033, while median incomes of families and households are $49,688 and $48,750 respectively.
| Characteristic | Number | Measure |
| Per Capita Income | 475 | $17,033 |
| Median Family Income | 91 | $49,688 |
| Mean Family Income | 91 | $80,247 |
| Median Household Income | 108 | $48,750 |
| Mean Household Income | 108 | $75,144 |
| Income Deficit | 91 | $0 |
| Wage / Income Gap (%) | 475 | 0.00% |
| Wage / Income Gap ($) | 475 | 100.00¢ per $1 |
| Gini / Inequality Index | 475 | 0.44 |
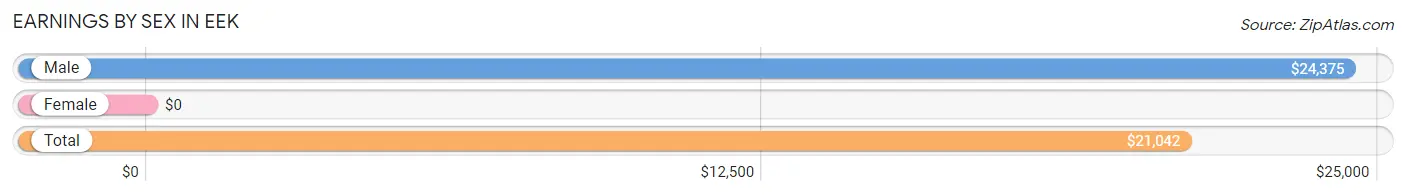
Earnings by Sex in Eek
| Sex | Number | Average Earnings |
| Male | 120 (59.1%) | $24,375 |
| Female | 83 (40.9%) | $0 |
| Total | 203 (100.0%) | $21,042 |
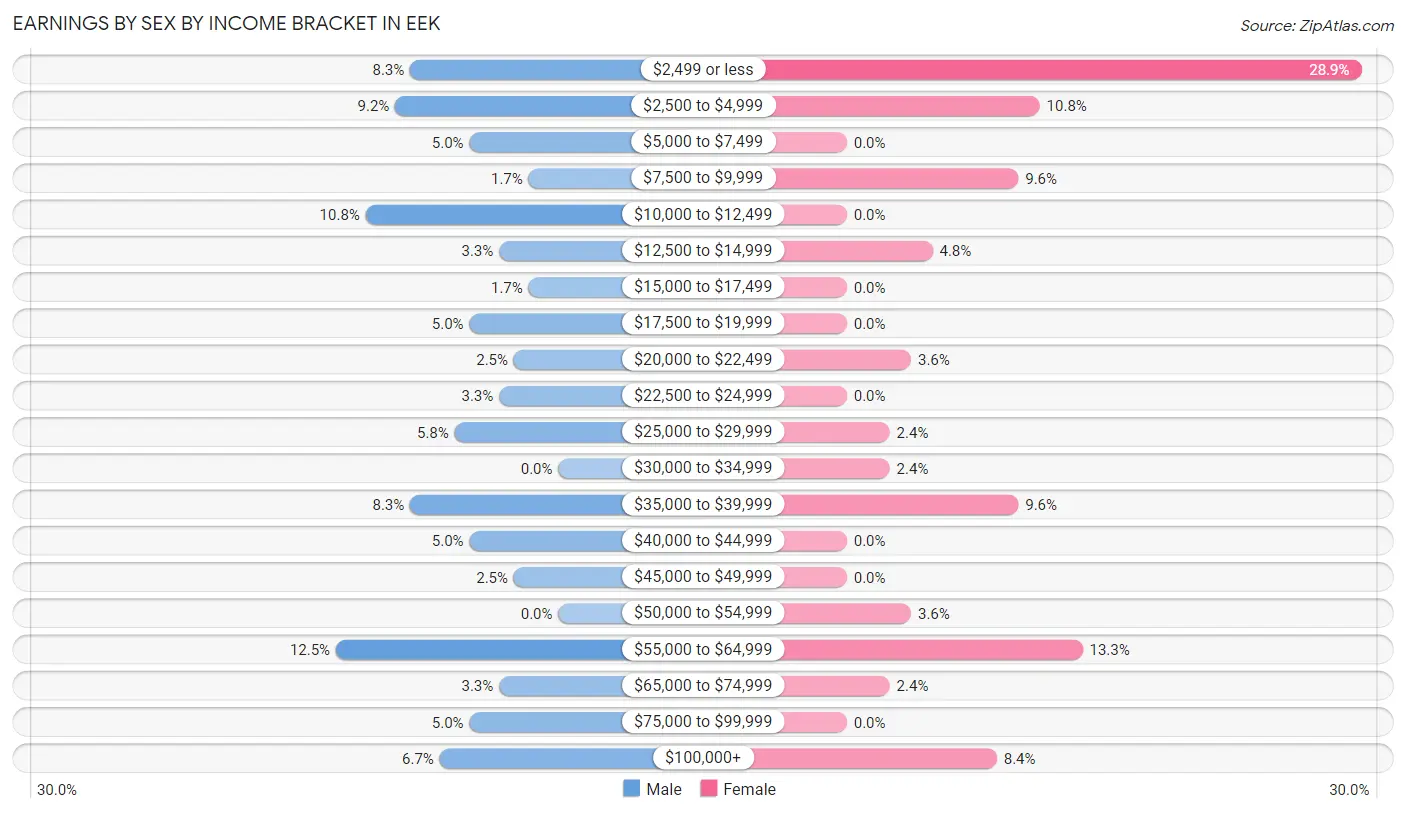
Earnings by Sex by Income Bracket in Eek
The most common earnings brackets in Eek are $55,000 to $64,999 for men (15 | 12.5%) and $2,499 or less for women (24 | 28.9%).
| Income | Male | Female |
| $2,499 or less | 10 (8.3%) | 24 (28.9%) |
| $2,500 to $4,999 | 11 (9.2%) | 9 (10.8%) |
| $5,000 to $7,499 | 6 (5.0%) | 0 (0.0%) |
| $7,500 to $9,999 | 2 (1.7%) | 8 (9.6%) |
| $10,000 to $12,499 | 13 (10.8%) | 0 (0.0%) |
| $12,500 to $14,999 | 4 (3.3%) | 4 (4.8%) |
| $15,000 to $17,499 | 2 (1.7%) | 0 (0.0%) |
| $17,500 to $19,999 | 6 (5.0%) | 0 (0.0%) |
| $20,000 to $22,499 | 3 (2.5%) | 3 (3.6%) |
| $22,500 to $24,999 | 4 (3.3%) | 0 (0.0%) |
| $25,000 to $29,999 | 7 (5.8%) | 2 (2.4%) |
| $30,000 to $34,999 | 0 (0.0%) | 2 (2.4%) |
| $35,000 to $39,999 | 10 (8.3%) | 8 (9.6%) |
| $40,000 to $44,999 | 6 (5.0%) | 0 (0.0%) |
| $45,000 to $49,999 | 3 (2.5%) | 0 (0.0%) |
| $50,000 to $54,999 | 0 (0.0%) | 3 (3.6%) |
| $55,000 to $64,999 | 15 (12.5%) | 11 (13.3%) |
| $65,000 to $74,999 | 4 (3.3%) | 2 (2.4%) |
| $75,000 to $99,999 | 6 (5.0%) | 0 (0.0%) |
| $100,000+ | 8 (6.7%) | 7 (8.4%) |
| Total | 120 (100.0%) | 83 (100.0%) |
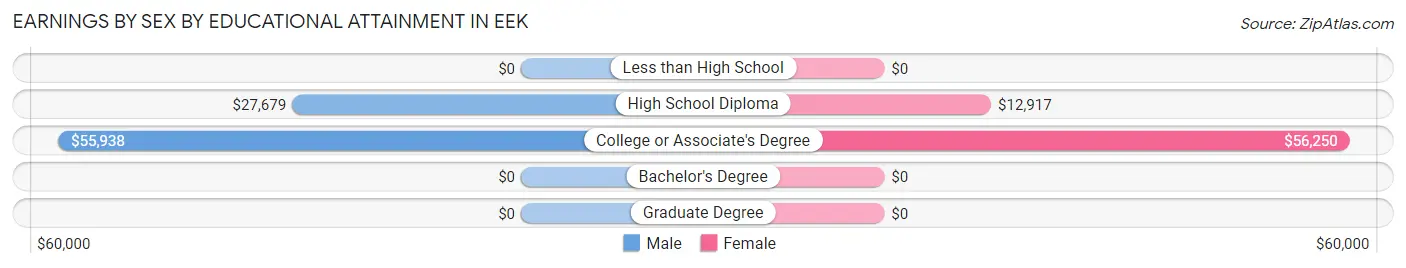
Earnings by Sex by Educational Attainment in Eek
Average earnings in Eek are $28,036 for men and $35,156 for women, a difference of 20.3%. Men with an educational attainment of college or associate's degree enjoy the highest average annual earnings of $55,938, while those with high school diploma education earn the least with $27,679. Women with an educational attainment of college or associate's degree earn the most with the average annual earnings of $56,250, while those with high school diploma education have the smallest earnings of $12,917.
| Educational Attainment | Male Income | Female Income |
| Less than High School | - | - |
| High School Diploma | $27,679 | $12,917 |
| College or Associate's Degree | $55,938 | $56,250 |
| Bachelor's Degree | - | - |
| Graduate Degree | - | - |
| Total | $28,036 | $35,156 |
Family Income in Eek
Family Income Brackets in Eek
According to the Eek family income data, there are 22 families falling into the $35,000 to $49,999 income range, which is the most common income bracket and makes up 24.2% of all families.
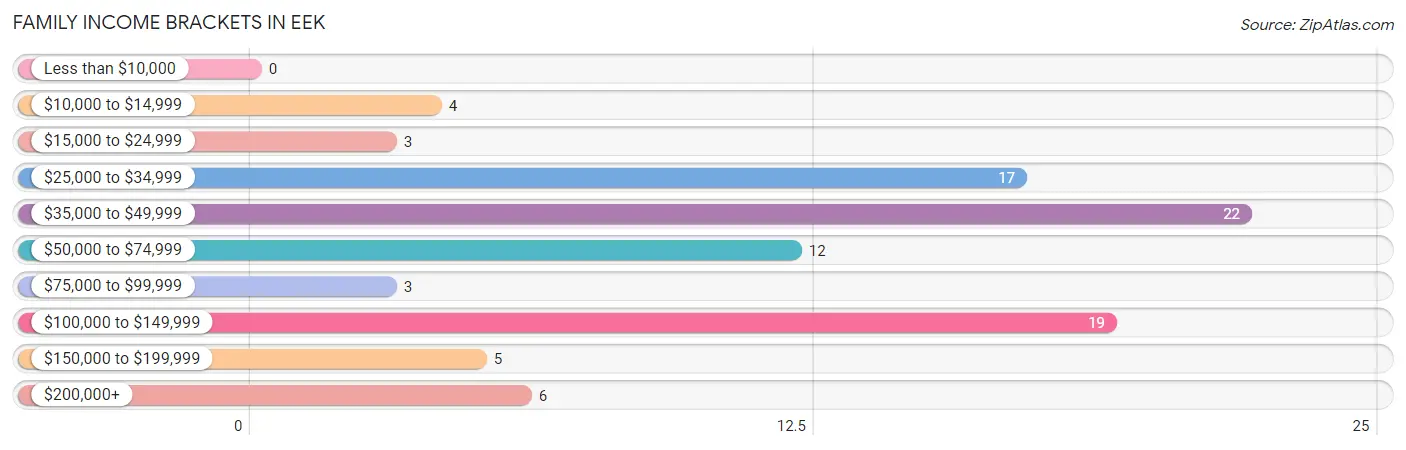
| Income Bracket | # Families | % Families |
| Less than $10,000 | 0 | 0.0% |
| $10,000 to $14,999 | 4 | 4.4% |
| $15,000 to $24,999 | 3 | 3.3% |
| $25,000 to $34,999 | 17 | 18.7% |
| $35,000 to $49,999 | 22 | 24.2% |
| $50,000 to $74,999 | 12 | 13.2% |
| $75,000 to $99,999 | 3 | 3.3% |
| $100,000 to $149,999 | 19 | 20.9% |
| $150,000 to $199,999 | 5 | 5.5% |
| $200,000+ | 6 | 6.6% |
Family Income by Famaliy Size in Eek
4-person families (14 | 15.4%) account for the highest median family income in Eek with $131,250 per family, while 4-person families (14 | 15.4%) have the highest median income of $32,812 per family member.
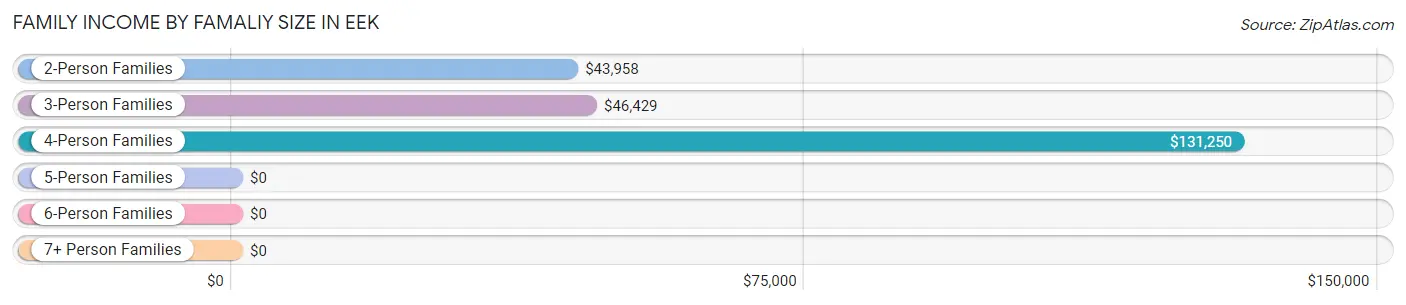
| Income Bracket | # Families | Median Income |
| 2-Person Families | 13 (14.3%) | $43,958 |
| 3-Person Families | 22 (24.2%) | $46,429 |
| 4-Person Families | 14 (15.4%) | $131,250 |
| 5-Person Families | 0 (0.0%) | $0 |
| 6-Person Families | 17 (18.7%) | $0 |
| 7+ Person Families | 25 (27.5%) | $0 |
| Total | 91 (100.0%) | $49,688 |
Family Income by Number of Earners in Eek
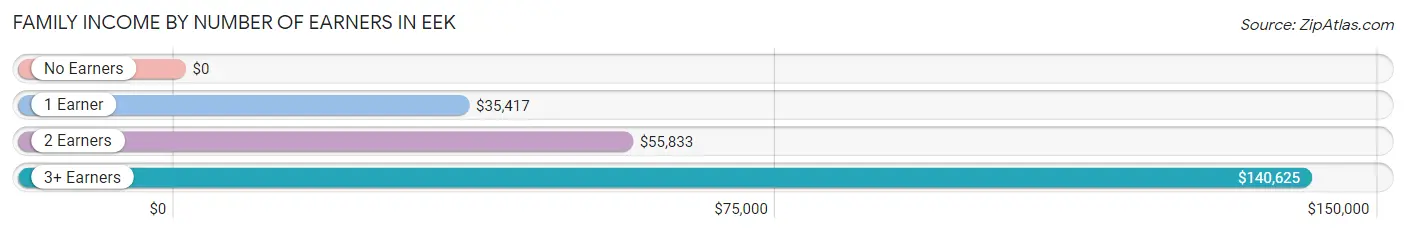
| Number of Earners | # Families | Median Income |
| No Earners | 2 (2.2%) | $0 |
| 1 Earner | 27 (29.7%) | $35,417 |
| 2 Earners | 38 (41.8%) | $55,833 |
| 3+ Earners | 24 (26.4%) | $140,625 |
| Total | 91 (100.0%) | $49,688 |
Household Income in Eek
Household Income Brackets in Eek
With 20 households falling in the category, the $35,000 to $49,999 income range is the most frequent in Eek, accounting for 18.5% of all households. In contrast, only 2 households (1.8%) fall into the less than $10,000 income bracket, making it the least populous group.
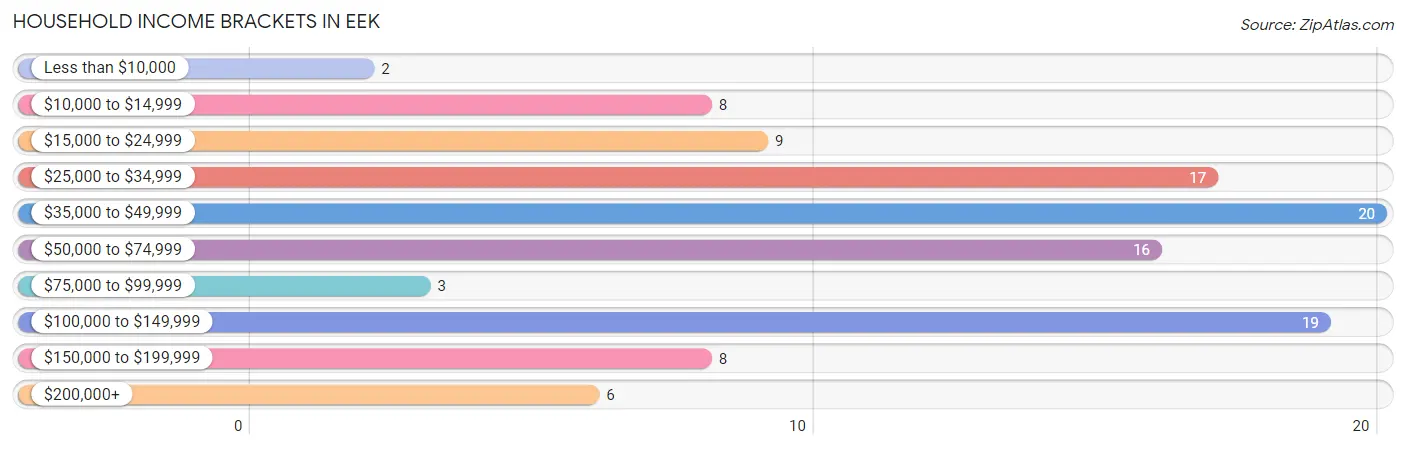
| Income Bracket | # Households | % Households |
| Less than $10,000 | 2 | 1.9% |
| $10,000 to $14,999 | 8 | 7.4% |
| $15,000 to $24,999 | 9 | 8.3% |
| $25,000 to $34,999 | 17 | 15.7% |
| $35,000 to $49,999 | 20 | 18.5% |
| $50,000 to $74,999 | 16 | 14.8% |
| $75,000 to $99,999 | 3 | 2.8% |
| $100,000 to $149,999 | 19 | 17.6% |
| $150,000 to $199,999 | 8 | 7.4% |
| $200,000+ | 6 | 5.6% |
Household Income by Householder Age in Eek
The median household income in Eek is $48,750, with the highest median household income of $50,938 found in the 45 to 64 years age bracket for the primary householder. A total of 71 households (65.7%) fall into this category.
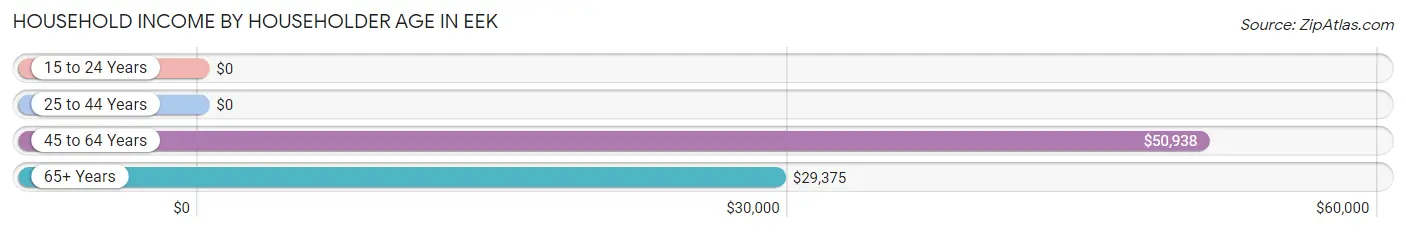
| Income Bracket | # Households | Median Income |
| 15 to 24 Years | 0 (0.0%) | $0 |
| 25 to 44 Years | 16 (14.8%) | $0 |
| 45 to 64 Years | 71 (65.7%) | $50,938 |
| 65+ Years | 21 (19.4%) | $29,375 |
| Total | 108 (100.0%) | $48,750 |
Poverty in Eek
Income Below Poverty by Sex and Age in Eek
With 28.8% poverty level for males and 29.4% for females among the residents of Eek, 16 and 17 year old males and 6 to 11 year old females are the most vulnerable to poverty, with 3 males (100.0%) and 25 females (78.1%) in their respective age groups living below the poverty level.
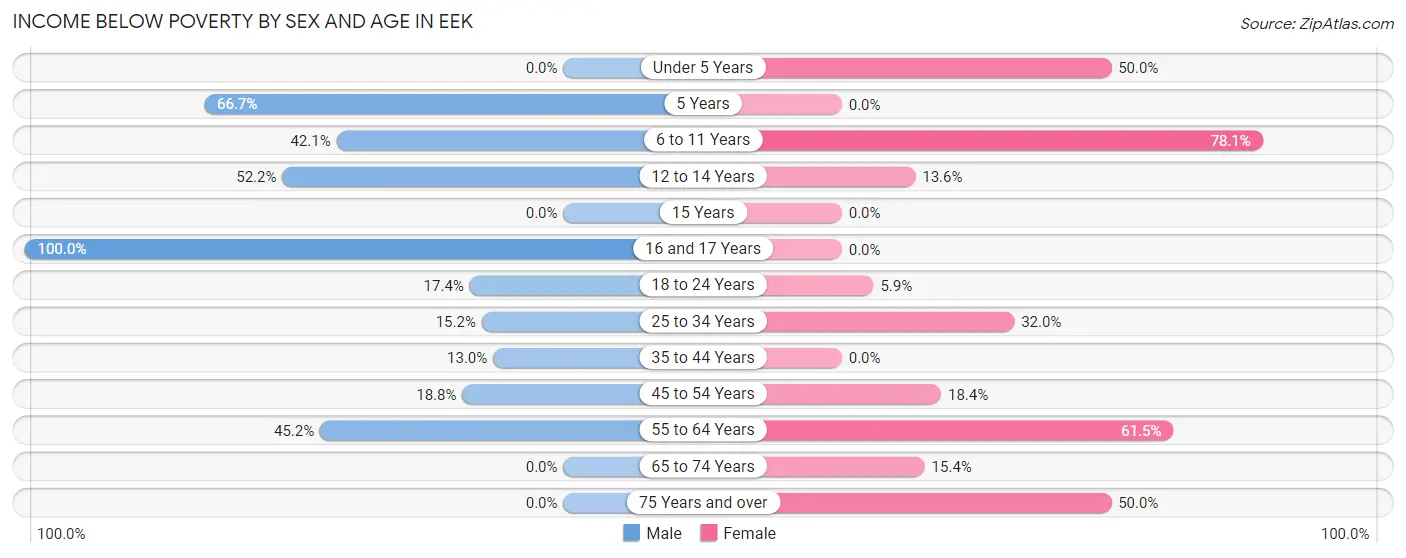
| Age Bracket | Male | Female |
| Under 5 Years | 0 (0.0%) | 6 (50.0%) |
| 5 Years | 8 (66.7%) | 0 (0.0%) |
| 6 to 11 Years | 16 (42.1%) | 25 (78.1%) |
| 12 to 14 Years | 12 (52.2%) | 3 (13.6%) |
| 15 Years | 0 (0.0%) | 0 (0.0%) |
| 16 and 17 Years | 3 (100.0%) | 0 (0.0%) |
| 18 to 24 Years | 4 (17.4%) | 1 (5.9%) |
| 25 to 34 Years | 5 (15.1%) | 8 (32.0%) |
| 35 to 44 Years | 3 (13.0%) | 0 (0.0%) |
| 45 to 54 Years | 9 (18.8%) | 7 (18.4%) |
| 55 to 64 Years | 14 (45.2%) | 8 (61.5%) |
| 65 to 74 Years | 0 (0.0%) | 2 (15.4%) |
| 75 Years and over | 0 (0.0%) | 4 (50.0%) |
| Total | 74 (28.8%) | 64 (29.4%) |
Income Above Poverty by Sex and Age in Eek
According to the poverty statistics in Eek, males aged under 5 years and females aged 5 years are the age groups that are most secure financially, with 100.0% of males and 100.0% of females in these age groups living above the poverty line.
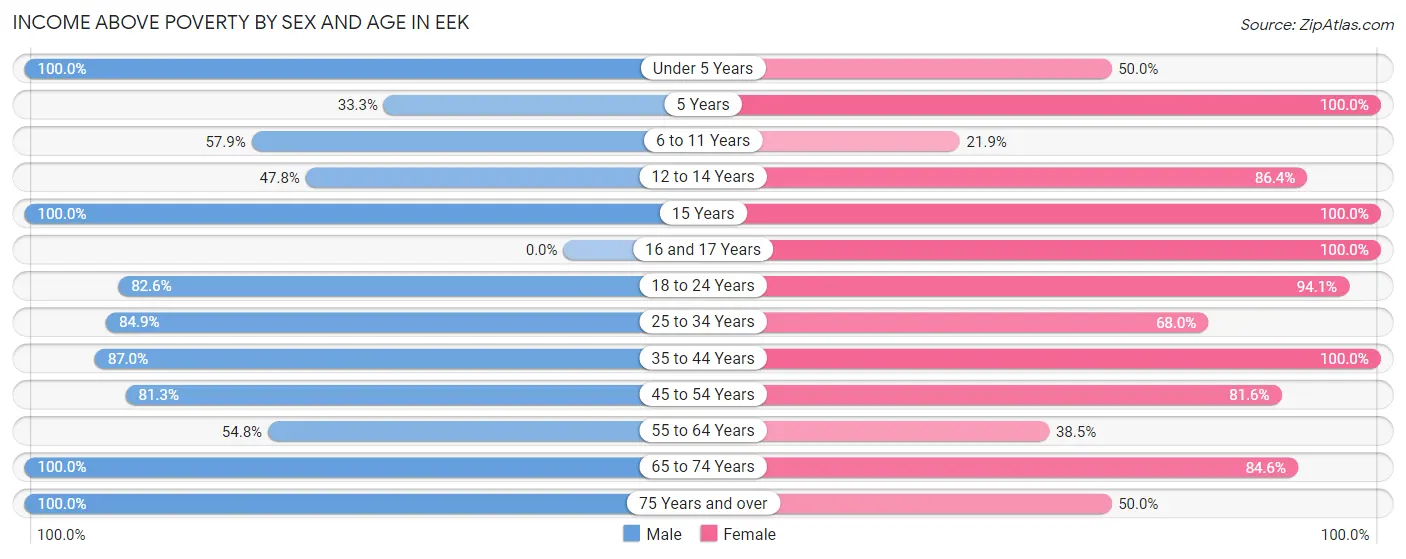
| Age Bracket | Male | Female |
| Under 5 Years | 12 (100.0%) | 6 (50.0%) |
| 5 Years | 4 (33.3%) | 6 (100.0%) |
| 6 to 11 Years | 22 (57.9%) | 7 (21.9%) |
| 12 to 14 Years | 11 (47.8%) | 19 (86.4%) |
| 15 Years | 3 (100.0%) | 5 (100.0%) |
| 16 and 17 Years | 0 (0.0%) | 19 (100.0%) |
| 18 to 24 Years | 19 (82.6%) | 16 (94.1%) |
| 25 to 34 Years | 28 (84.9%) | 17 (68.0%) |
| 35 to 44 Years | 20 (87.0%) | 8 (100.0%) |
| 45 to 54 Years | 39 (81.2%) | 31 (81.6%) |
| 55 to 64 Years | 17 (54.8%) | 5 (38.5%) |
| 65 to 74 Years | 5 (100.0%) | 11 (84.6%) |
| 75 Years and over | 3 (100.0%) | 4 (50.0%) |
| Total | 183 (71.2%) | 154 (70.6%) |
Income Below Poverty Among Married-Couple Families in Eek
The poverty statistics for married-couple families in Eek show that 23.2% or 16 of the total 69 families live below the poverty line. Families with 3 or 4 children have the highest poverty rate of 42.3%, comprising of 11 families. On the other hand, families with 1 or 2 children have the lowest poverty rate of 0.0%, which includes 0 families.
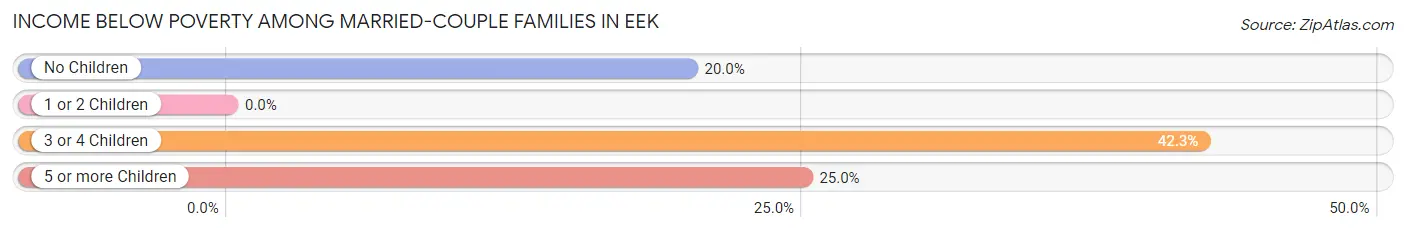
| Children | Above Poverty | Below Poverty |
| No Children | 12 (80.0%) | 3 (20.0%) |
| 1 or 2 Children | 20 (100.0%) | 0 (0.0%) |
| 3 or 4 Children | 15 (57.7%) | 11 (42.3%) |
| 5 or more Children | 6 (75.0%) | 2 (25.0%) |
| Total | 53 (76.8%) | 16 (23.2%) |
Income Below Poverty Among Single-Parent Households in Eek
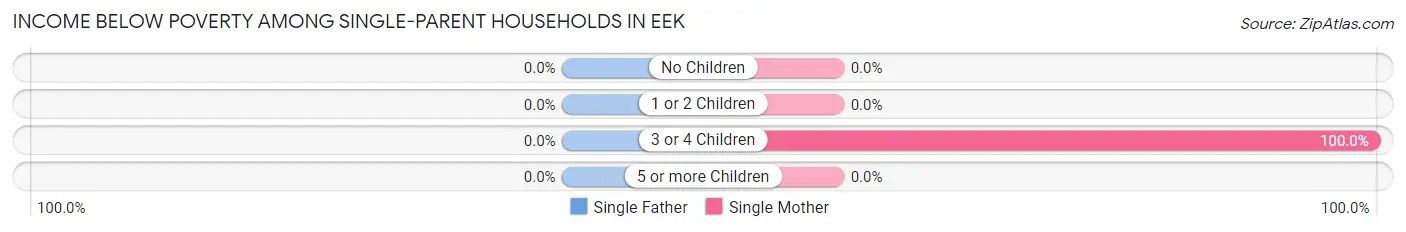
| Children | Single Father | Single Mother |
| No Children | 0 (0.0%) | 0 (0.0%) |
| 1 or 2 Children | 0 (0.0%) | 0 (0.0%) |
| 3 or 4 Children | 0 (0.0%) | 2 (100.0%) |
| 5 or more Children | 0 (0.0%) | 0 (0.0%) |
| Total | 0 (0.0%) | 2 (14.3%) |
Income Below Poverty Among Married-Couple vs Single-Parent Households in Eek
The poverty data for Eek shows that 16 of the married-couple family households (23.2%) and 2 of the single-parent households (9.1%) are living below the poverty level. Within the married-couple family households, those with 3 or 4 children have the highest poverty rate, with 11 households (42.3%) falling below the poverty line. Among the single-parent households, those with 3 or 4 children have the highest poverty rate, with 2 household (100.0%) living below poverty.
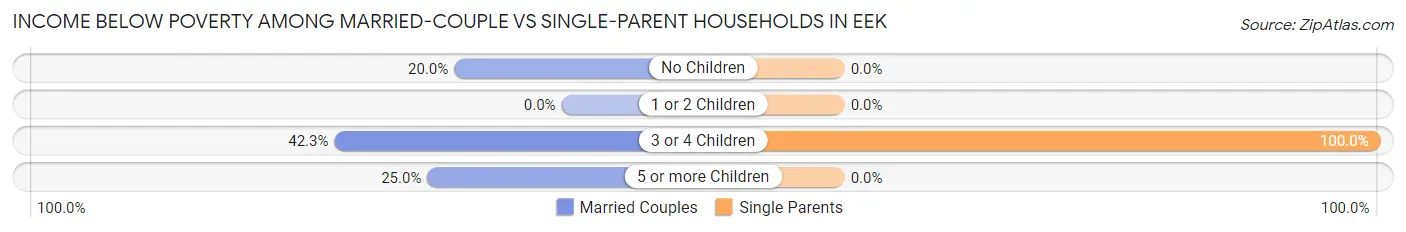
| Children | Married-Couple Families | Single-Parent Households |
| No Children | 3 (20.0%) | 0 (0.0%) |
| 1 or 2 Children | 0 (0.0%) | 0 (0.0%) |
| 3 or 4 Children | 11 (42.3%) | 2 (100.0%) |
| 5 or more Children | 2 (25.0%) | 0 (0.0%) |
| Total | 16 (23.2%) | 2 (9.1%) |
Race in Eek
The most populous races in Eek are Native / Alaskan (462 | 97.3%), Two or more Races (13 | 2.7%), and Hispanic or Latino (4 | 0.8%).
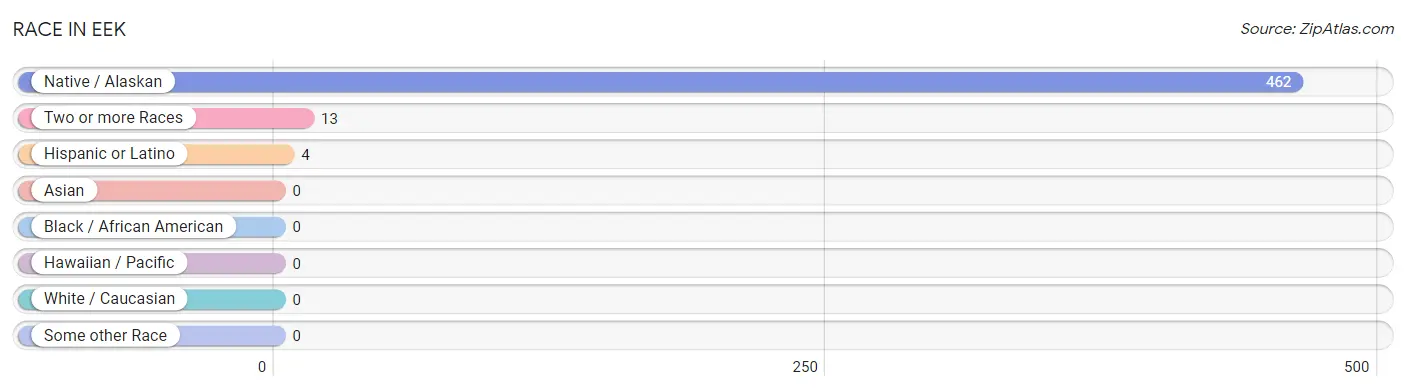
| Race | # Population | % Population |
| Asian | 0 | 0.0% |
| Black / African American | 0 | 0.0% |
| Hawaiian / Pacific | 0 | 0.0% |
| Hispanic or Latino | 4 | 0.8% |
| Native / Alaskan | 462 | 97.3% |
| White / Caucasian | 0 | 0.0% |
| Two or more Races | 13 | 2.7% |
| Some other Race | 0 | 0.0% |
| Total | 475 | 100.0% |
Ancestry in Eek
The most populous ancestries reported in Eek are Yup'ik (449 | 94.5%), Alaskan Athabascan (25 | 5.3%), English (10 | 2.1%), Chickasaw (8 | 1.7%), and Alaska Native (6 | 1.3%), together accounting for 104.8% of all Eek residents.
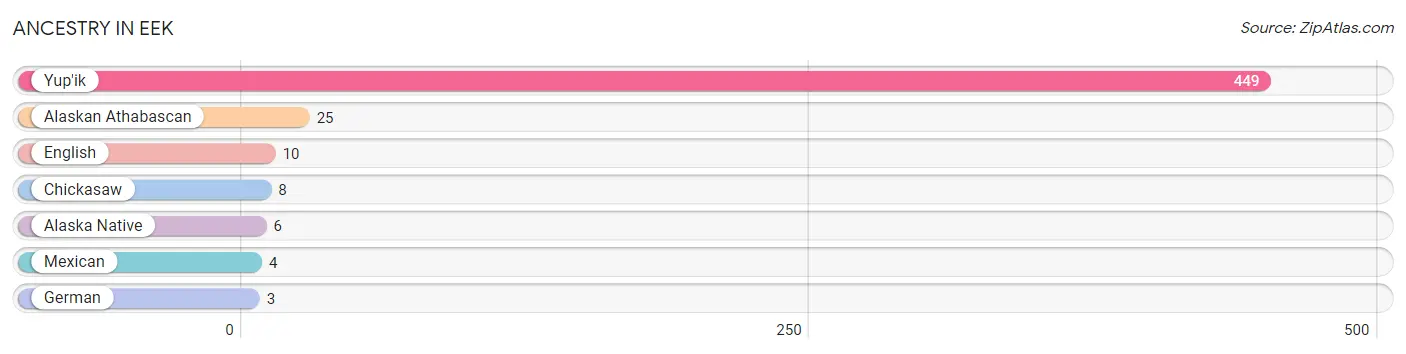
| Ancestry | # Population | % Population |
| Alaska Native | 6 | 1.3% |
| Alaskan Athabascan | 25 | 5.3% |
| Chickasaw | 8 | 1.7% |
| English | 10 | 2.1% |
| German | 3 | 0.6% |
| Mexican | 4 | 0.8% |
| Yup'ik | 449 | 94.5% | View All 7 Rows |
Immigrants in Eek
The most numerous immigrant groups reported in Eek came from Central America (3 | 0.6%), Latin America (3 | 0.6%), and Mexico (3 | 0.6%), together accounting for 1.9% of all Eek residents.
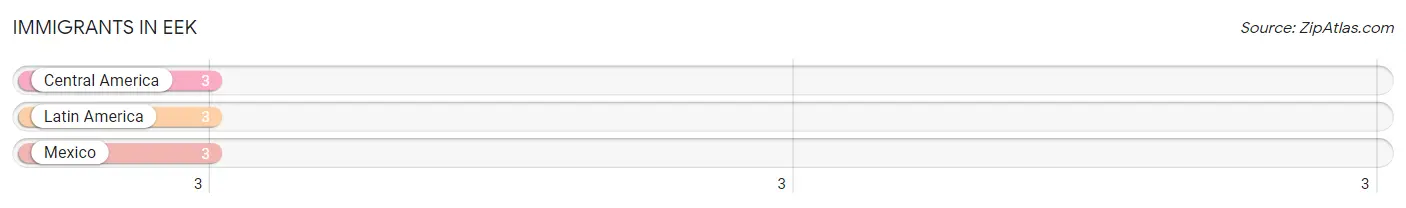
| Immigration Origin | # Population | % Population |
| Central America | 3 | 0.6% |
| Latin America | 3 | 0.6% |
| Mexico | 3 | 0.6% | View All 3 Rows |
Sex and Age in Eek
Sex and Age in Eek
The most populous age groups in Eek are 10 to 14 Years (41 | 16.0%) for men and 5 to 9 Years (35 | 16.1%) for women.
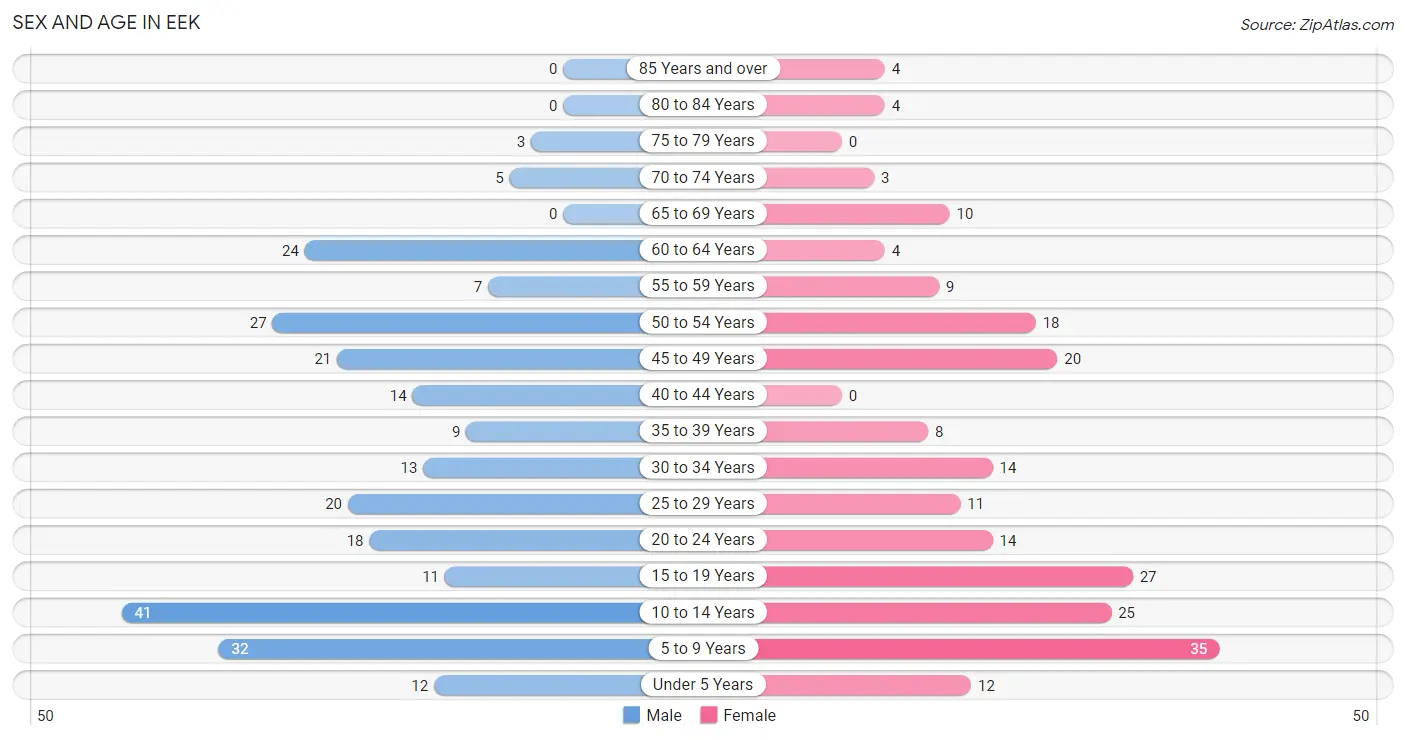
| Age Bracket | Male | Female |
| Under 5 Years | 12 (4.7%) | 12 (5.5%) |
| 5 to 9 Years | 32 (12.4%) | 35 (16.1%) |
| 10 to 14 Years | 41 (16.0%) | 25 (11.5%) |
| 15 to 19 Years | 11 (4.3%) | 27 (12.4%) |
| 20 to 24 Years | 18 (7.0%) | 14 (6.4%) |
| 25 to 29 Years | 20 (7.8%) | 11 (5.1%) |
| 30 to 34 Years | 13 (5.1%) | 14 (6.4%) |
| 35 to 39 Years | 9 (3.5%) | 8 (3.7%) |
| 40 to 44 Years | 14 (5.4%) | 0 (0.0%) |
| 45 to 49 Years | 21 (8.2%) | 20 (9.2%) |
| 50 to 54 Years | 27 (10.5%) | 18 (8.3%) |
| 55 to 59 Years | 7 (2.7%) | 9 (4.1%) |
| 60 to 64 Years | 24 (9.3%) | 4 (1.8%) |
| 65 to 69 Years | 0 (0.0%) | 10 (4.6%) |
| 70 to 74 Years | 5 (1.9%) | 3 (1.4%) |
| 75 to 79 Years | 3 (1.2%) | 0 (0.0%) |
| 80 to 84 Years | 0 (0.0%) | 4 (1.8%) |
| 85 Years and over | 0 (0.0%) | 4 (1.8%) |
| Total | 257 (100.0%) | 218 (100.0%) |
Families and Households in Eek
Median Family Size in Eek
The median family size in Eek is 5.00 persons per family, with married-couple families (69 | 75.8%) accounting for the largest median family size of 5.45 persons per family. On the other hand, single male/father families (8 | 8.8%) represent the smallest median family size with 2.75 persons per family.
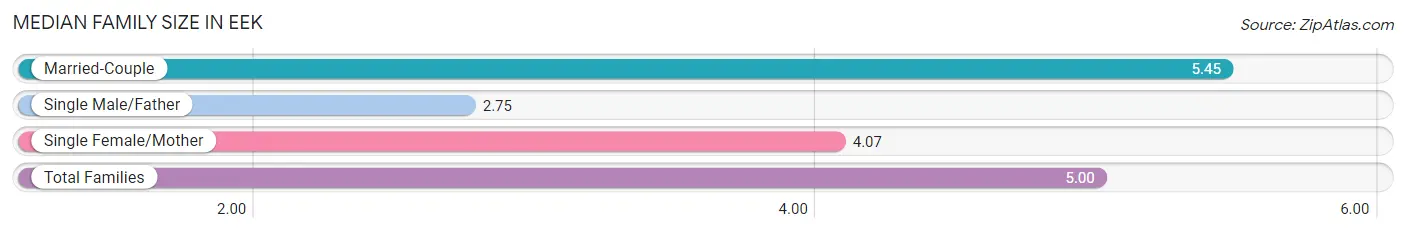
| Family Type | # Families | Family Size |
| Married-Couple | 69 (75.8%) | 5.45 |
| Single Male/Father | 8 (8.8%) | 2.75 |
| Single Female/Mother | 14 (15.4%) | 4.07 |
| Total Families | 91 (100.0%) | 5.00 |
Median Household Size in Eek
The median household size in Eek is 4.40 persons per household, with married-couple households (69 | 63.9%) accounting for the largest median household size of 5.45 persons per household. non-family households (17 | 15.7%) represent the smallest median household size with 1.12 persons per household.
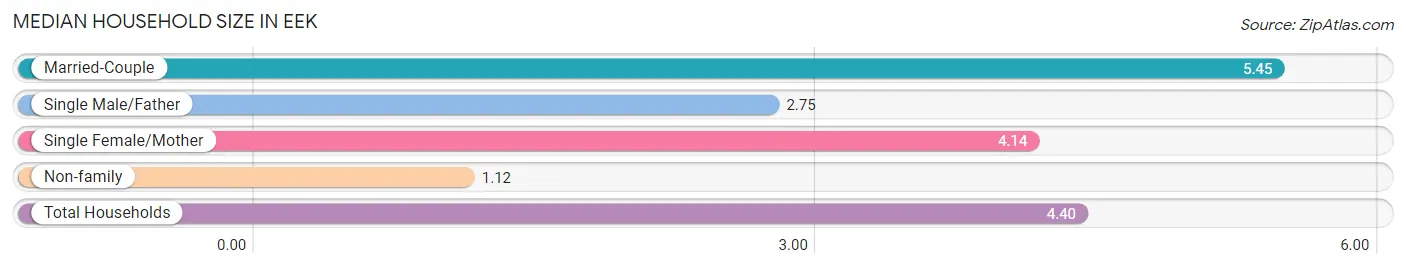
| Household Type | # Households | Household Size |
| Married-Couple | 69 (63.9%) | 5.45 |
| Single Male/Father | 8 (7.4%) | 2.75 |
| Single Female/Mother | 14 (13.0%) | 4.14 |
| Non-family | 17 (15.7%) | 1.12 |
| Total Households | 108 (100.0%) | 4.40 |
Household Size by Marriage Status in Eek
Out of a total of 108 households in Eek, 91 (84.3%) are family households, while 17 (15.7%) are nonfamily households. The most numerous type of family households are 7+ person households, comprising 25, and the most common type of nonfamily households are 1-person households, comprising 15.
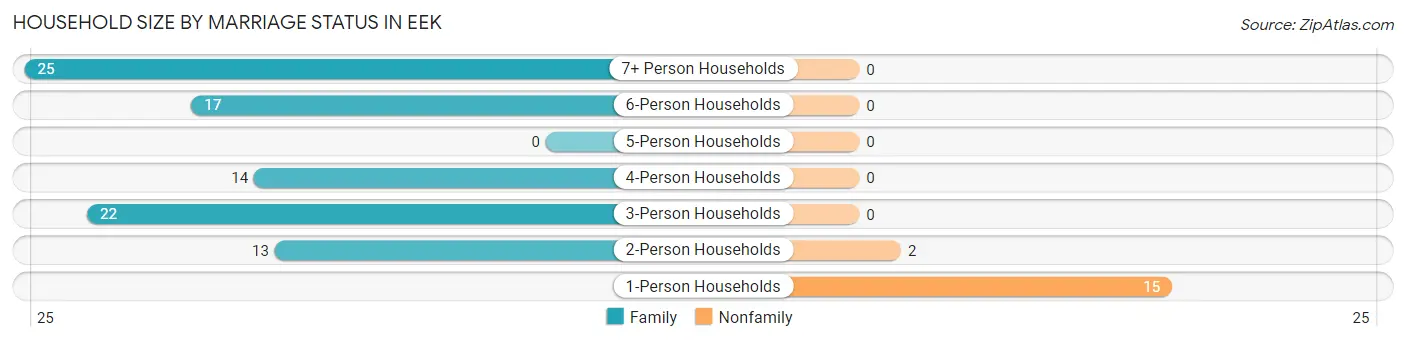
| Household Size | Family Households | Nonfamily Households |
| 1-Person Households | - | 15 (13.9%) |
| 2-Person Households | 13 (12.0%) | 2 (1.8%) |
| 3-Person Households | 22 (20.4%) | 0 (0.0%) |
| 4-Person Households | 14 (13.0%) | 0 (0.0%) |
| 5-Person Households | 0 (0.0%) | 0 (0.0%) |
| 6-Person Households | 17 (15.7%) | 0 (0.0%) |
| 7+ Person Households | 25 (23.2%) | 0 (0.0%) |
| Total | 91 (84.3%) | 17 (15.7%) |
Female Fertility in Eek
Fertility by Age in Eek
Average fertility rate in Eek is 40.0 births per 1,000 women. Women in the age bracket of 20 to 34 years have the highest fertility rate with 103.0 births per 1,000 women. Women in the age bracket of 20 to 34 years acount for 100.0% of all women with births.
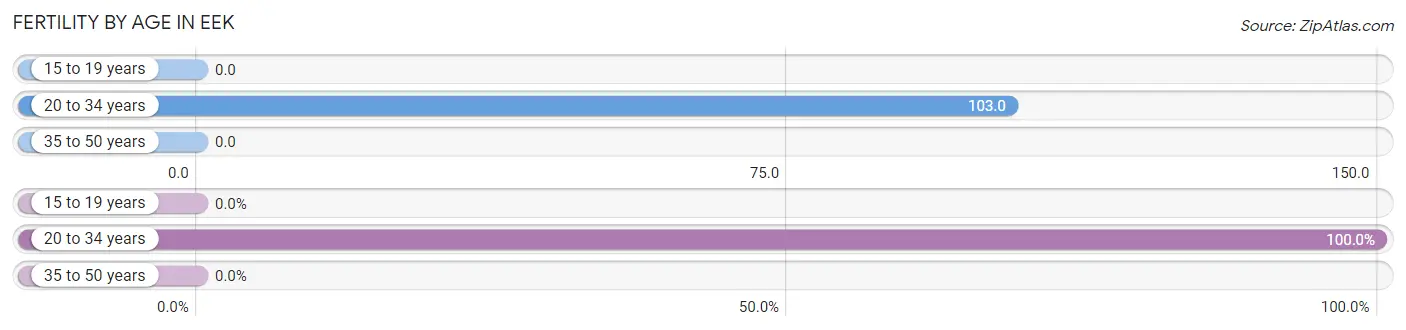
| Age Bracket | Women with Births | Births / 1,000 Women |
| 15 to 19 years | 0 (0.0%) | 0.0 |
| 20 to 34 years | 4 (100.0%) | 103.0 |
| 35 to 50 years | 0 (0.0%) | 0.0 |
| Total | 4 (100.0%) | 40.0 |
Fertility by Age by Marriage Status in Eek
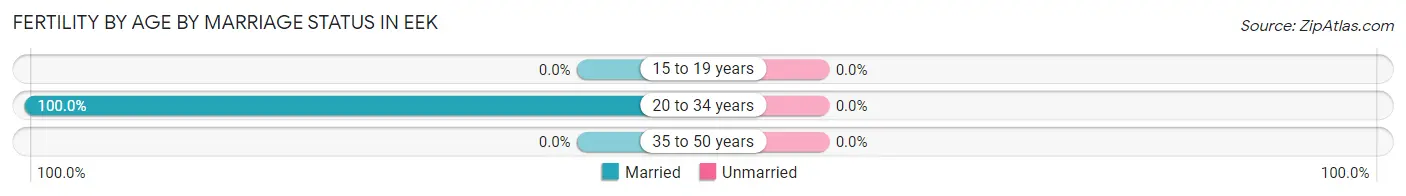
| Age Bracket | Married | Unmarried |
| 15 to 19 years | 0 (0.0%) | 0 (0.0%) |
| 20 to 34 years | 4 (100.0%) | 0 (0.0%) |
| 35 to 50 years | 0 (0.0%) | 0 (0.0%) |
| Total | 4 (100.0%) | 0 (0.0%) |
Fertility by Education in Eek
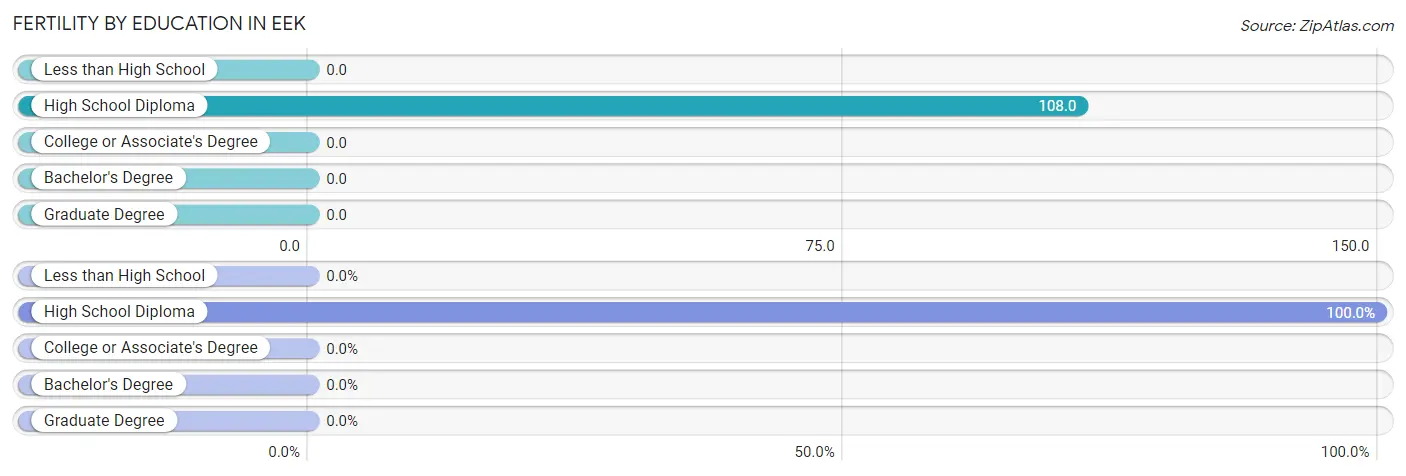
| Educational Attainment | Women with Births | Births / 1,000 Women |
| Less than High School | 0 (0.0%) | 0.0 |
| High School Diploma | 4 (100.0%) | 108.0 |
| College or Associate's Degree | 0 (0.0%) | 0.0 |
| Bachelor's Degree | 0 (0.0%) | 0.0 |
| Graduate Degree | 0 (0.0%) | 0.0 |
| Total | 4 (100.0%) | 40.0 |
Fertility by Education by Marriage Status in Eek
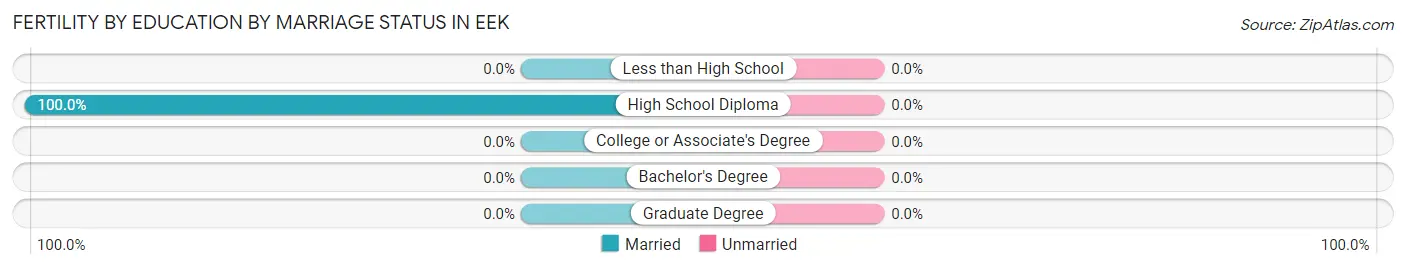
| Educational Attainment | Married | Unmarried |
| Less than High School | 0 (0.0%) | 0 (0.0%) |
| High School Diploma | 4 (100.0%) | 0 (0.0%) |
| College or Associate's Degree | 0 (0.0%) | 0 (0.0%) |
| Bachelor's Degree | 0 (0.0%) | 0 (0.0%) |
| Graduate Degree | 0 (0.0%) | 0 (0.0%) |
| Total | 4 (100.0%) | 0 (0.0%) |
Employment Characteristics in Eek
Employment by Class of Employer in Eek
Among the 146 employed individuals in Eek, local government employees (76 | 52.0%), private company employees (27 | 18.5%), and state government employees (20 | 13.7%) make up the most common classes of employment.
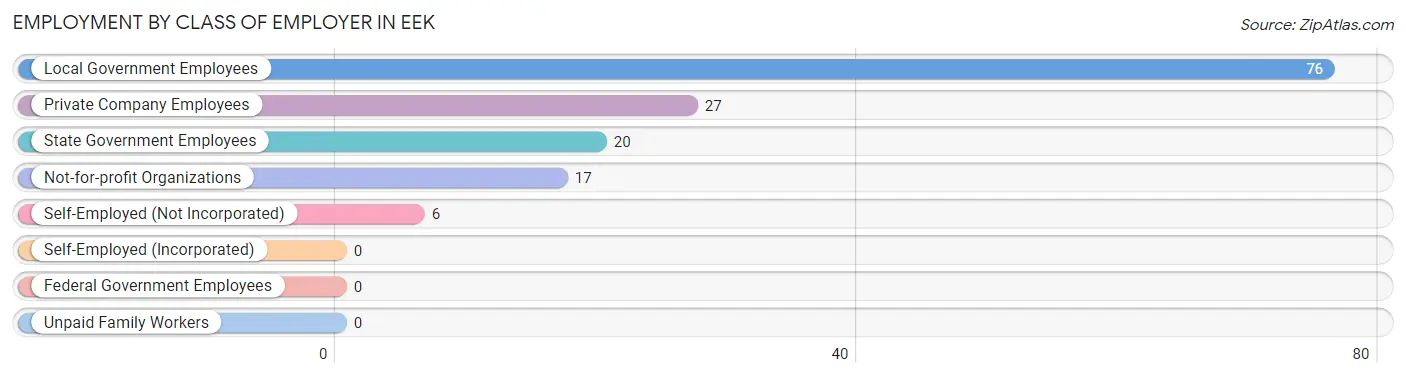
| Employer Class | # Employees | % Employees |
| Private Company Employees | 27 | 18.5% |
| Self-Employed (Incorporated) | 0 | 0.0% |
| Self-Employed (Not Incorporated) | 6 | 4.1% |
| Not-for-profit Organizations | 17 | 11.6% |
| Local Government Employees | 76 | 52.0% |
| State Government Employees | 20 | 13.7% |
| Federal Government Employees | 0 | 0.0% |
| Unpaid Family Workers | 0 | 0.0% |
| Total | 146 | 100.0% |
Employment Status by Age in Eek
According to the labor force statistics for Eek, out of the total population over 16 years of age (310), 66.1% or 205 individuals are in the labor force, with 28.8% or 59 of them unemployed. The age group with the highest labor force participation rate is 35 to 44 years, with 90.3% or 28 individuals in the labor force. Within the labor force, the 16 to 19 years age range has the highest percentage of unemployed individuals, with 50.0% or 2 of them being unemployed.
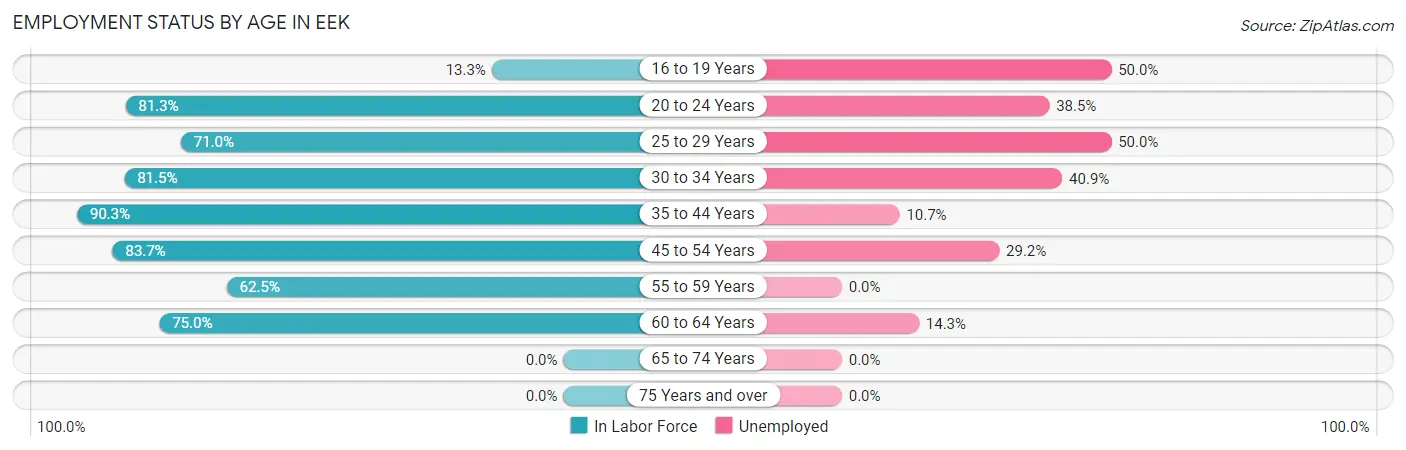
| Age Bracket | In Labor Force | Unemployed |
| 16 to 19 Years | 4 (13.3%) | 2 (50.0%) |
| 20 to 24 Years | 26 (81.3%) | 10 (38.5%) |
| 25 to 29 Years | 22 (71.0%) | 11 (50.0%) |
| 30 to 34 Years | 22 (81.5%) | 9 (40.9%) |
| 35 to 44 Years | 28 (90.3%) | 3 (10.7%) |
| 45 to 54 Years | 72 (83.7%) | 21 (29.2%) |
| 55 to 59 Years | 10 (62.5%) | 0 (0.0%) |
| 60 to 64 Years | 21 (75.0%) | 3 (14.3%) |
| 65 to 74 Years | 0 (0.0%) | 0 (0.0%) |
| 75 Years and over | 0 (0.0%) | 0 (0.0%) |
| Total | 205 (66.1%) | 59 (28.8%) |
Employment Status by Educational Attainment in Eek
According to labor force statistics for Eek, 79.9% of individuals (175) out of the total population between 25 and 64 years of age (219) are in the labor force, with 26.9% or 47 of them being unemployed. The group with the highest labor force participation rate are those with the educational attainment of bachelor's degree or higher, with 100.0% or 3 individuals in the labor force. Within the labor force, individuals with less than high school education have the highest percentage of unemployment, with 38.9% or 7 of them being unemployed.
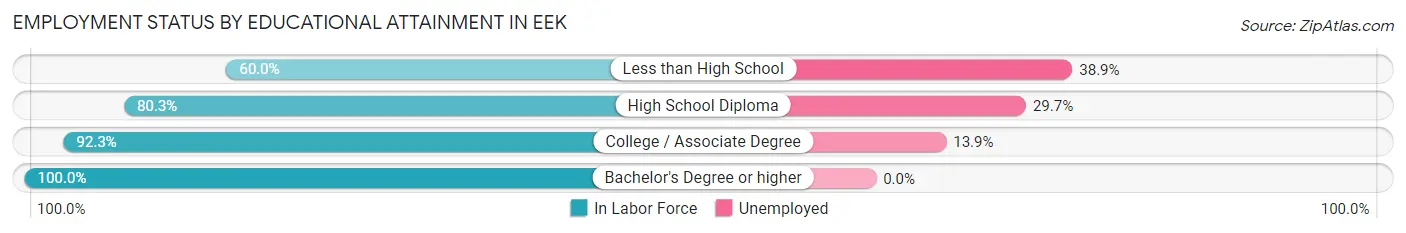
| Educational Attainment | In Labor Force | Unemployed |
| Less than High School | 18 (60.0%) | 12 (38.9%) |
| High School Diploma | 118 (80.3%) | 44 (29.7%) |
| College / Associate Degree | 36 (92.3%) | 5 (13.9%) |
| Bachelor's Degree or higher | 3 (100.0%) | 0 (0.0%) |
| Total | 175 (79.9%) | 59 (26.9%) |
Employment Occupations by Sex in Eek
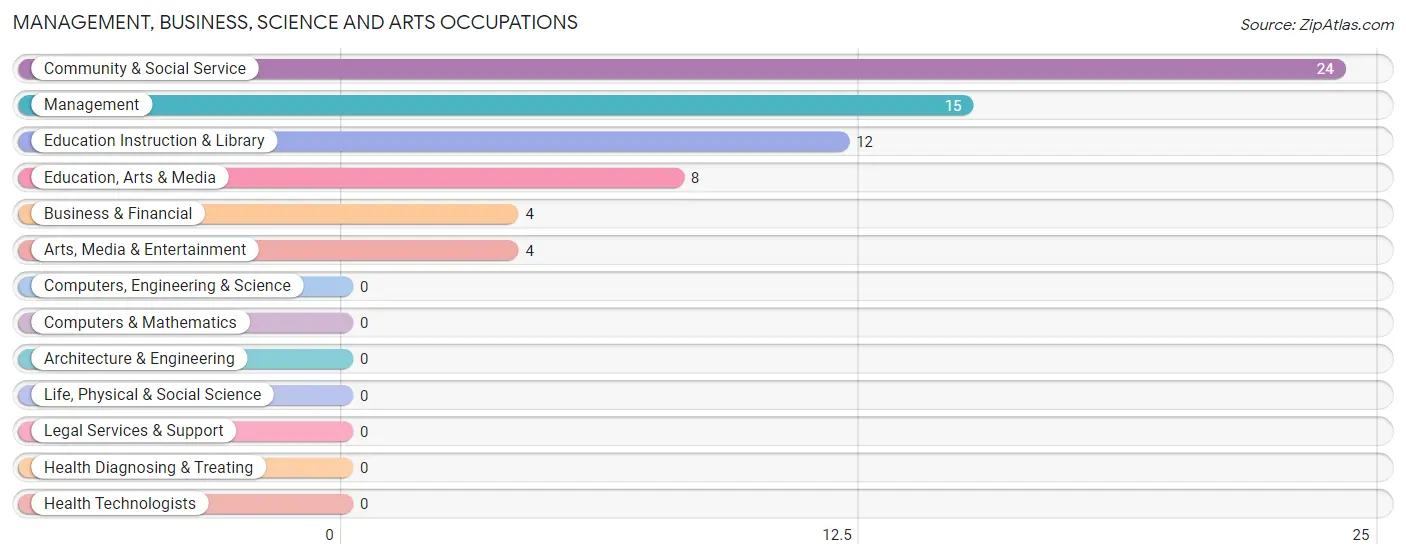
Management, Business, Science and Arts Occupations
The most common Management, Business, Science and Arts occupations in Eek are Community & Social Service (24 | 16.4%), Management (15 | 10.3%), Education Instruction & Library (12 | 8.2%), Education, Arts & Media (8 | 5.5%), and Business & Financial (4 | 2.7%).
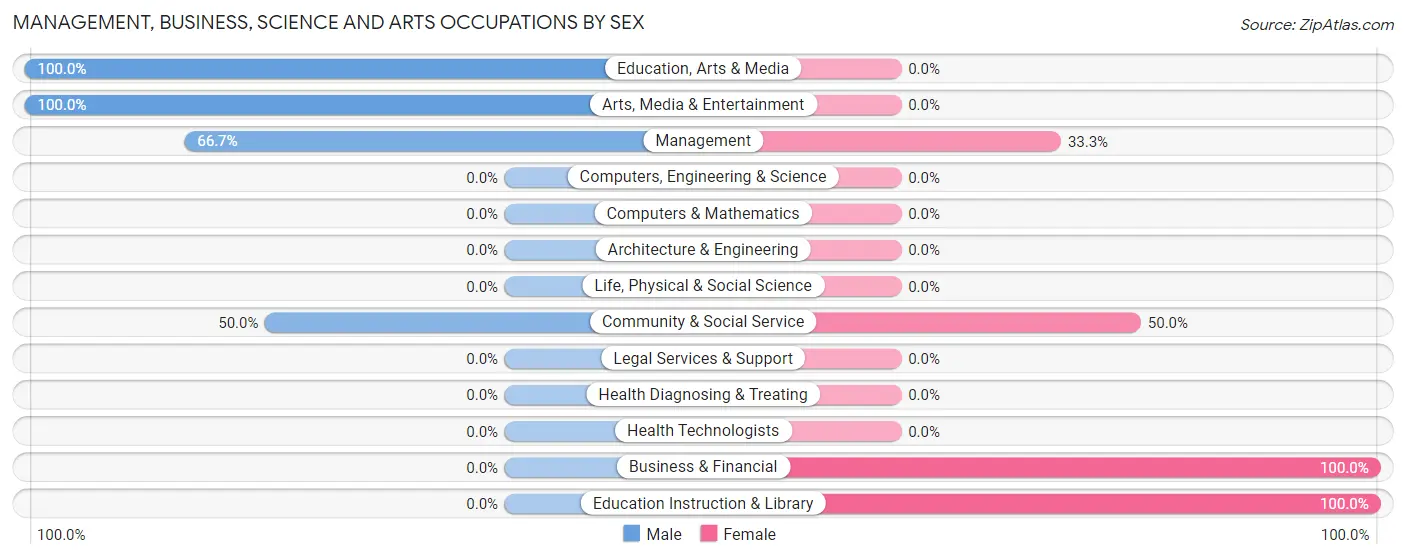
Management, Business, Science and Arts Occupations by Sex
Within the Management, Business, Science and Arts occupations in Eek, the most male-oriented occupations are Education, Arts & Media (100.0%), Arts, Media & Entertainment (100.0%), and Management (66.7%), while the most female-oriented occupations are Business & Financial (100.0%), Education Instruction & Library (100.0%), and Community & Social Service (50.0%).
| Occupation | Male | Female |
| Management | 10 (66.7%) | 5 (33.3%) |
| Business & Financial | 0 (0.0%) | 4 (100.0%) |
| Computers, Engineering & Science | 0 (0.0%) | 0 (0.0%) |
| Computers & Mathematics | 0 (0.0%) | 0 (0.0%) |
| Architecture & Engineering | 0 (0.0%) | 0 (0.0%) |
| Life, Physical & Social Science | 0 (0.0%) | 0 (0.0%) |
| Community & Social Service | 12 (50.0%) | 12 (50.0%) |
| Education, Arts & Media | 8 (100.0%) | 0 (0.0%) |
| Legal Services & Support | 0 (0.0%) | 0 (0.0%) |
| Education Instruction & Library | 0 (0.0%) | 12 (100.0%) |
| Arts, Media & Entertainment | 4 (100.0%) | 0 (0.0%) |
| Health Diagnosing & Treating | 0 (0.0%) | 0 (0.0%) |
| Health Technologists | 0 (0.0%) | 0 (0.0%) |
| Total (Category) | 22 (51.2%) | 21 (48.8%) |
| Total (Overall) | 96 (65.7%) | 50 (34.3%) |
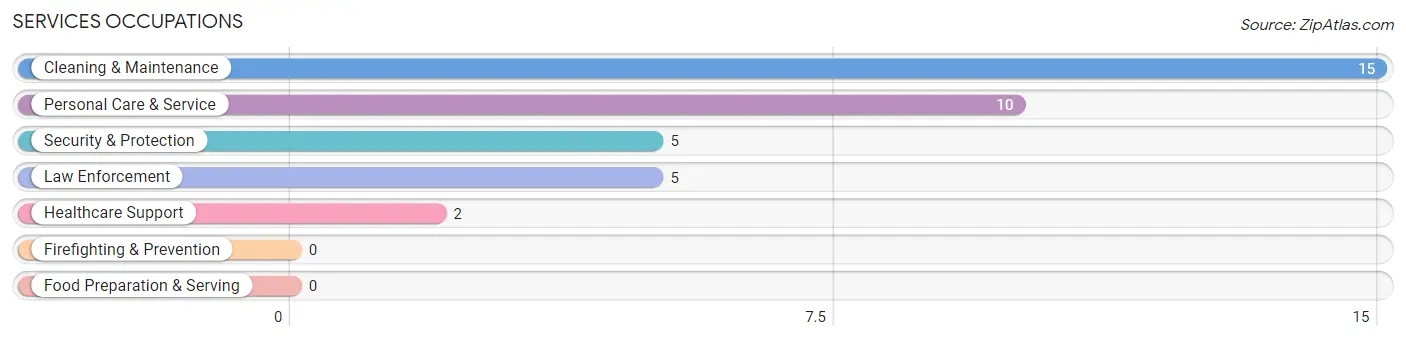
Services Occupations
The most common Services occupations in Eek are Cleaning & Maintenance (15 | 10.3%), Personal Care & Service (10 | 6.9%), Security & Protection (5 | 3.4%), Law Enforcement (5 | 3.4%), and Healthcare Support (2 | 1.4%).
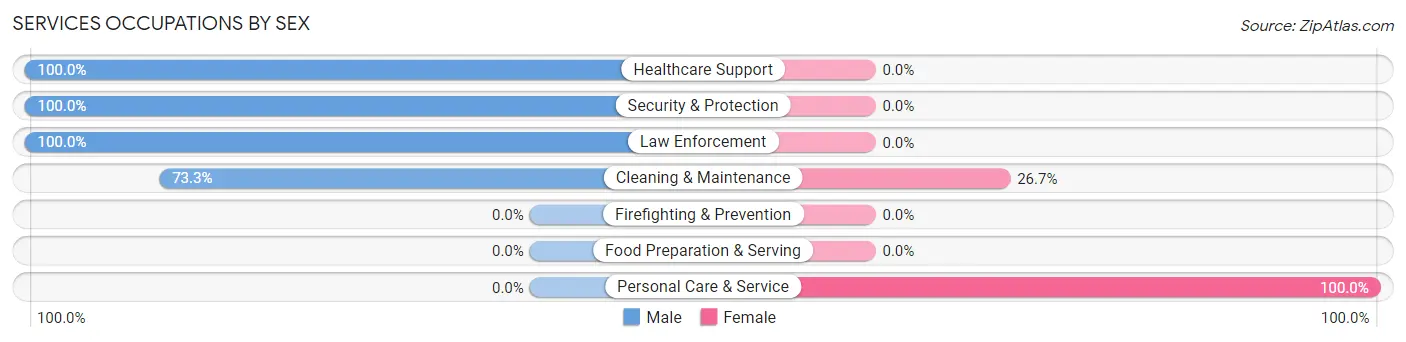
Services Occupations by Sex
Within the Services occupations in Eek, the most male-oriented occupations are Healthcare Support (100.0%), Security & Protection (100.0%), and Law Enforcement (100.0%), while the most female-oriented occupations are Personal Care & Service (100.0%), and Cleaning & Maintenance (26.7%).
| Occupation | Male | Female |
| Healthcare Support | 2 (100.0%) | 0 (0.0%) |
| Security & Protection | 5 (100.0%) | 0 (0.0%) |
| Firefighting & Prevention | 0 (0.0%) | 0 (0.0%) |
| Law Enforcement | 5 (100.0%) | 0 (0.0%) |
| Food Preparation & Serving | 0 (0.0%) | 0 (0.0%) |
| Cleaning & Maintenance | 11 (73.3%) | 4 (26.7%) |
| Personal Care & Service | 0 (0.0%) | 10 (100.0%) |
| Total (Category) | 18 (56.2%) | 14 (43.8%) |
| Total (Overall) | 96 (65.7%) | 50 (34.3%) |
Sales and Office Occupations
The most common Sales and Office occupations in Eek are Sales & Related (12 | 8.2%), and Office & Administration (12 | 8.2%).
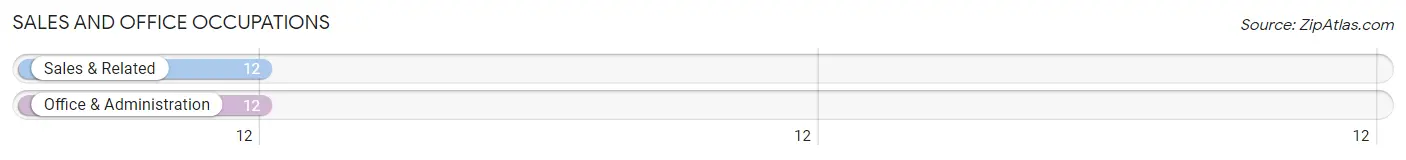
Sales and Office Occupations by Sex
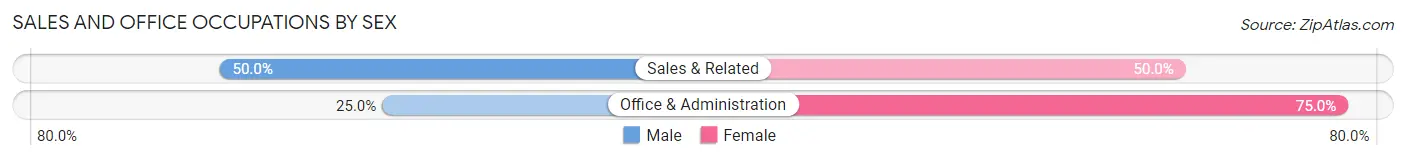
| Occupation | Male | Female |
| Sales & Related | 6 (50.0%) | 6 (50.0%) |
| Office & Administration | 3 (25.0%) | 9 (75.0%) |
| Total (Category) | 9 (37.5%) | 15 (62.5%) |
| Total (Overall) | 96 (65.7%) | 50 (34.3%) |
Natural Resources, Construction and Maintenance Occupations
The most common Natural Resources, Construction and Maintenance occupations in Eek are , and Construction & Extraction (27 | 18.5%).
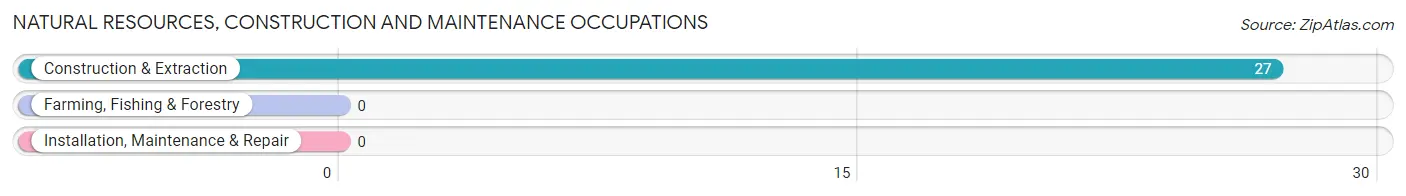
Natural Resources, Construction and Maintenance Occupations by Sex
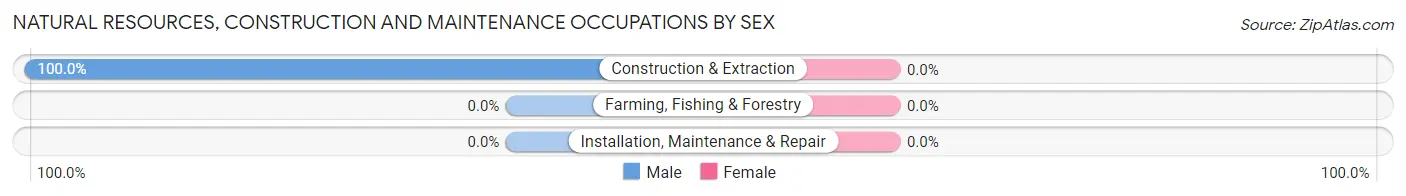
| Occupation | Male | Female |
| Farming, Fishing & Forestry | 0 (0.0%) | 0 (0.0%) |
| Construction & Extraction | 27 (100.0%) | 0 (0.0%) |
| Installation, Maintenance & Repair | 0 (0.0%) | 0 (0.0%) |
| Total (Category) | 27 (100.0%) | 0 (0.0%) |
| Total (Overall) | 96 (65.7%) | 50 (34.3%) |
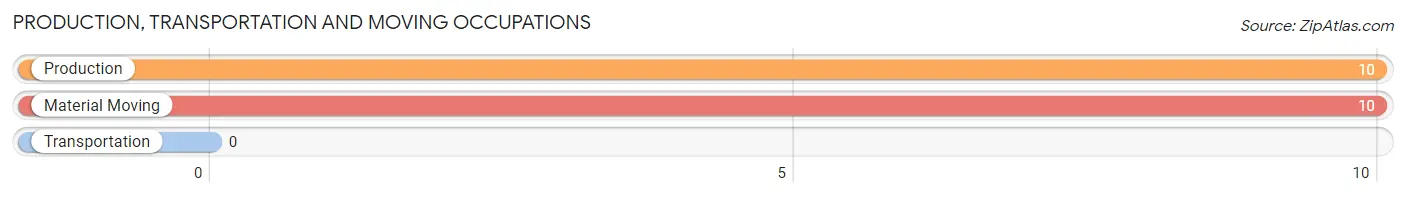
Production, Transportation and Moving Occupations
The most common Production, Transportation and Moving occupations in Eek are Production (10 | 6.9%), and Material Moving (10 | 6.9%).
Production, Transportation and Moving Occupations by Sex
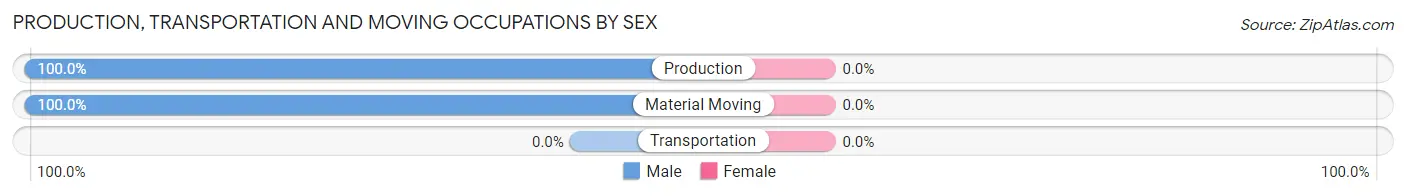
| Occupation | Male | Female |
| Production | 10 (100.0%) | 0 (0.0%) |
| Transportation | 0 (0.0%) | 0 (0.0%) |
| Material Moving | 10 (100.0%) | 0 (0.0%) |
| Total (Category) | 20 (100.0%) | 0 (0.0%) |
| Total (Overall) | 96 (65.7%) | 50 (34.3%) |
Employment Industries by Sex in Eek
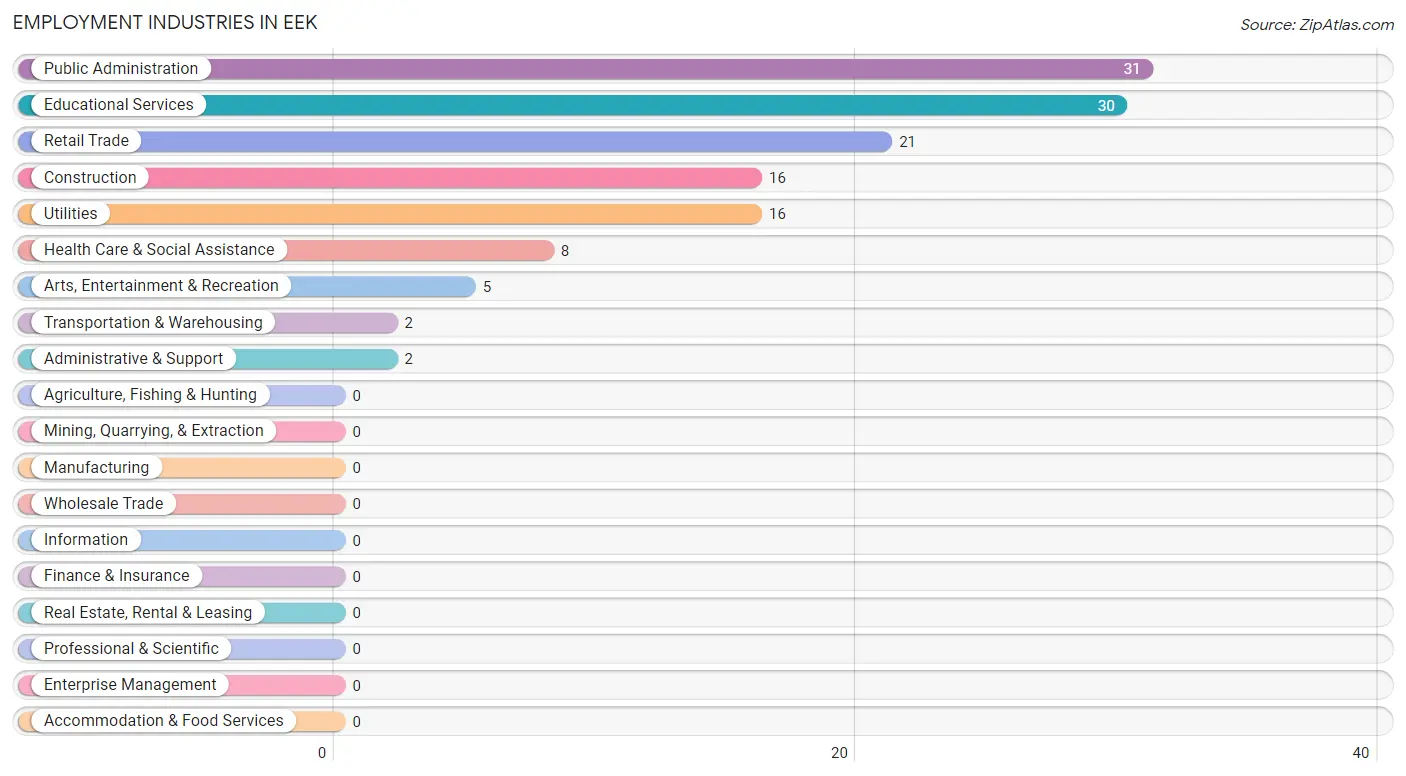
Employment Industries in Eek
The major employment industries in Eek include Public Administration (31 | 21.2%), Educational Services (30 | 20.5%), Retail Trade (21 | 14.4%), Construction (16 | 11.0%), and Utilities (16 | 11.0%).
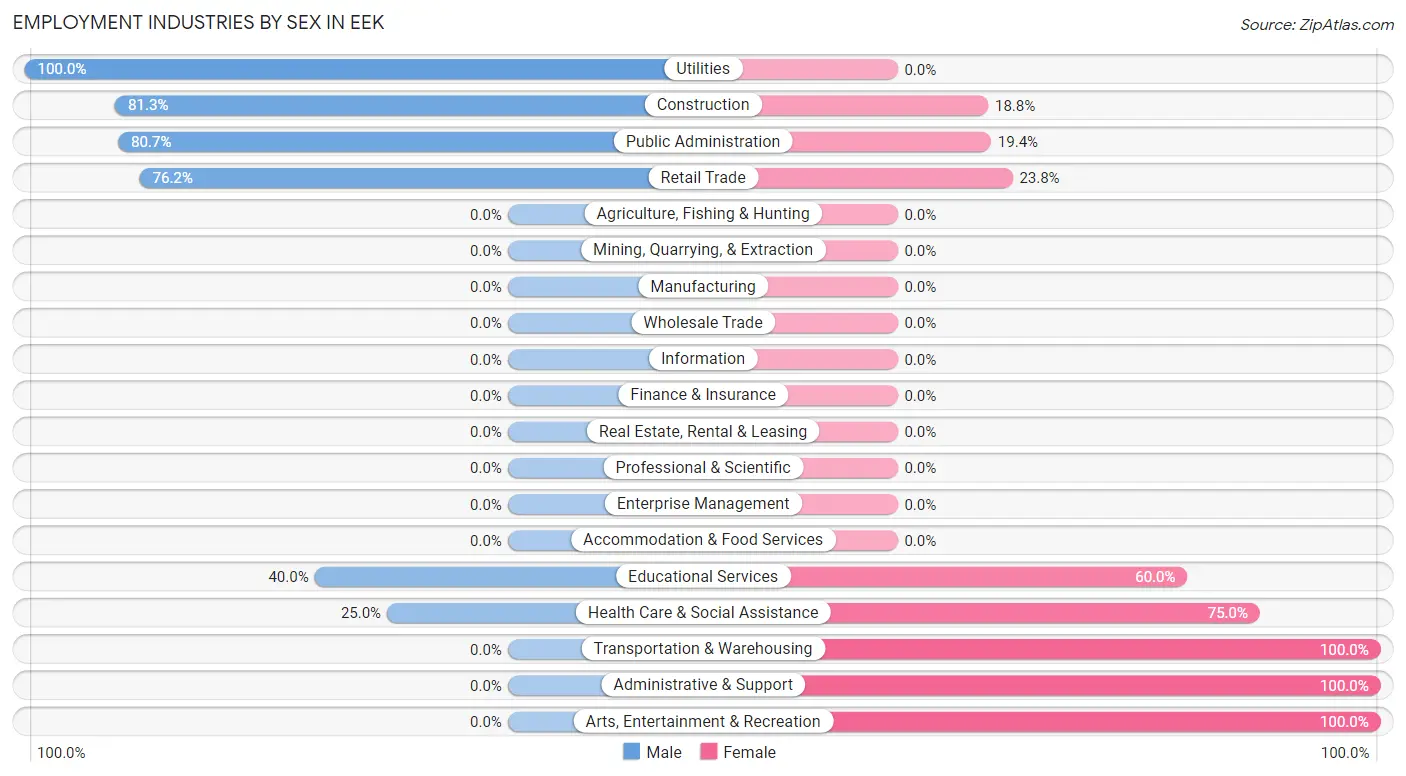
Employment Industries by Sex in Eek
The Eek industries that see more men than women are Utilities (100.0%), Construction (81.2%), and Public Administration (80.6%), whereas the industries that tend to have a higher number of women are Transportation & Warehousing (100.0%), Administrative & Support (100.0%), and Arts, Entertainment & Recreation (100.0%).
| Industry | Male | Female |
| Agriculture, Fishing & Hunting | 0 (0.0%) | 0 (0.0%) |
| Mining, Quarrying, & Extraction | 0 (0.0%) | 0 (0.0%) |
| Construction | 13 (81.2%) | 3 (18.8%) |
| Manufacturing | 0 (0.0%) | 0 (0.0%) |
| Wholesale Trade | 0 (0.0%) | 0 (0.0%) |
| Retail Trade | 16 (76.2%) | 5 (23.8%) |
| Transportation & Warehousing | 0 (0.0%) | 2 (100.0%) |
| Utilities | 16 (100.0%) | 0 (0.0%) |
| Information | 0 (0.0%) | 0 (0.0%) |
| Finance & Insurance | 0 (0.0%) | 0 (0.0%) |
| Real Estate, Rental & Leasing | 0 (0.0%) | 0 (0.0%) |
| Professional & Scientific | 0 (0.0%) | 0 (0.0%) |
| Enterprise Management | 0 (0.0%) | 0 (0.0%) |
| Administrative & Support | 0 (0.0%) | 2 (100.0%) |
| Educational Services | 12 (40.0%) | 18 (60.0%) |
| Health Care & Social Assistance | 2 (25.0%) | 6 (75.0%) |
| Arts, Entertainment & Recreation | 0 (0.0%) | 5 (100.0%) |
| Accommodation & Food Services | 0 (0.0%) | 0 (0.0%) |
| Public Administration | 25 (80.6%) | 6 (19.4%) |
| Total | 96 (65.7%) | 50 (34.3%) |
Education in Eek
School Enrollment in Eek
The most common levels of schooling among the 175 students in Eek are middle school (60 | 34.3%), high school (45 | 25.7%), and elementary school (40 | 22.9%).
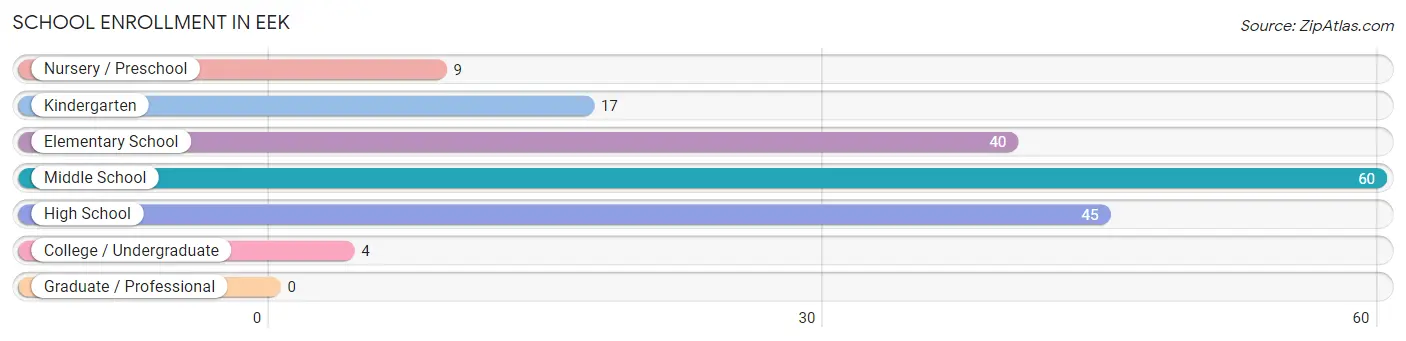
| School Level | # Students | % Students |
| Nursery / Preschool | 9 | 5.1% |
| Kindergarten | 17 | 9.7% |
| Elementary School | 40 | 22.9% |
| Middle School | 60 | 34.3% |
| High School | 45 | 25.7% |
| College / Undergraduate | 4 | 2.3% |
| Graduate / Professional | 0 | 0.0% |
| Total | 175 | 100.0% |
School Enrollment by Age by Funding Source in Eek
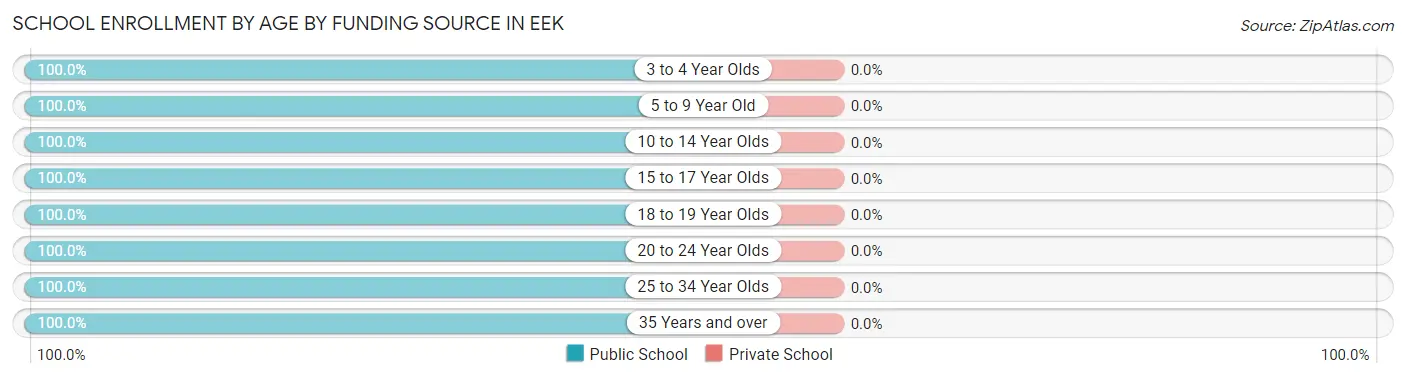
| Age Bracket | Public School | Private School |
| 3 to 4 Year Olds | 3 (100.0%) | 0 (0.0%) |
| 5 to 9 Year Old | 64 (100.0%) | 0 (0.0%) |
| 10 to 14 Year Olds | 64 (100.0%) | 0 (0.0%) |
| 15 to 17 Year Olds | 30 (100.0%) | 0 (0.0%) |
| 18 to 19 Year Olds | 3 (100.0%) | 0 (0.0%) |
| 20 to 24 Year Olds | 2 (100.0%) | 0 (0.0%) |
| 25 to 34 Year Olds | 6 (100.0%) | 0 (0.0%) |
| 35 Years and over | 3 (100.0%) | 0 (0.0%) |
| Total | 175 (100.0%) | 0 (0.0%) |
Educational Attainment by Field of Study in Eek
, and education (3 | 100.0%) are the most common fields of study among 3 individuals in Eek who have obtained a bachelor's degree or higher.
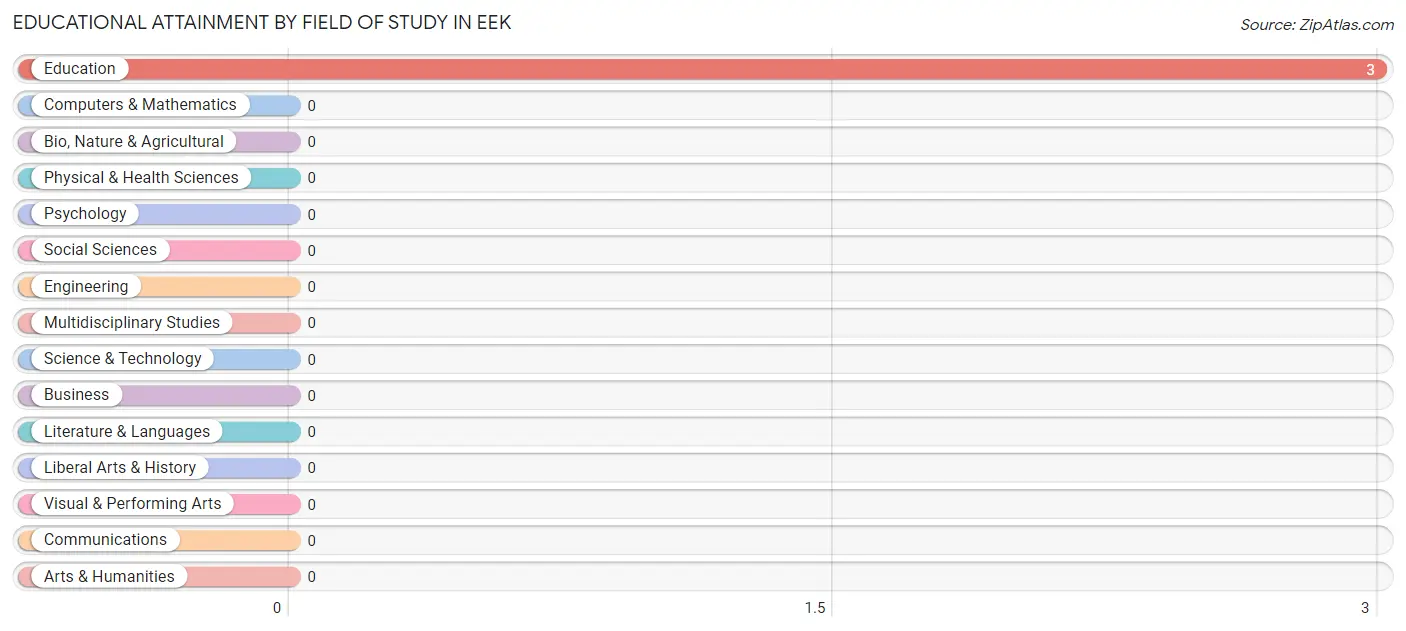
| Field of Study | # Graduates | % Graduates |
| Computers & Mathematics | 0 | 0.0% |
| Bio, Nature & Agricultural | 0 | 0.0% |
| Physical & Health Sciences | 0 | 0.0% |
| Psychology | 0 | 0.0% |
| Social Sciences | 0 | 0.0% |
| Engineering | 0 | 0.0% |
| Multidisciplinary Studies | 0 | 0.0% |
| Science & Technology | 0 | 0.0% |
| Business | 0 | 0.0% |
| Education | 3 | 100.0% |
| Literature & Languages | 0 | 0.0% |
| Liberal Arts & History | 0 | 0.0% |
| Visual & Performing Arts | 0 | 0.0% |
| Communications | 0 | 0.0% |
| Arts & Humanities | 0 | 0.0% |
| Total | 3 | 100.0% |
Transportation & Commute in Eek
Vehicle Availability by Sex in Eek
The most prevalent vehicle ownership categories in Eek are males with no vehicle (96, accounting for 100.0%) and females with no vehicle (50, making up 192.0%).
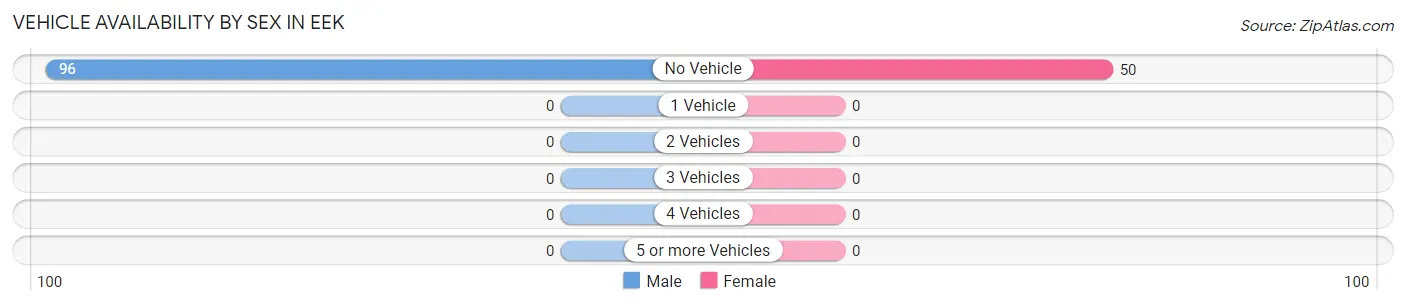
| Vehicles Available | Male | Female |
| No Vehicle | 96 (100.0%) | 50 (100.0%) |
| 1 Vehicle | 0 (0.0%) | 0 (0.0%) |
| 2 Vehicles | 0 (0.0%) | 0 (0.0%) |
| 3 Vehicles | 0 (0.0%) | 0 (0.0%) |
| 4 Vehicles | 0 (0.0%) | 0 (0.0%) |
| 5 or more Vehicles | 0 (0.0%) | 0 (0.0%) |
| Total | 96 (100.0%) | 50 (100.0%) |
Commute Time in Eek
The most frequently occuring commute durations in Eek are 5 to 9 minutes (96 commuters, 68.6%), 10 to 14 minutes (26 commuters, 18.6%), and less than 5 minutes (18 commuters, 12.9%).
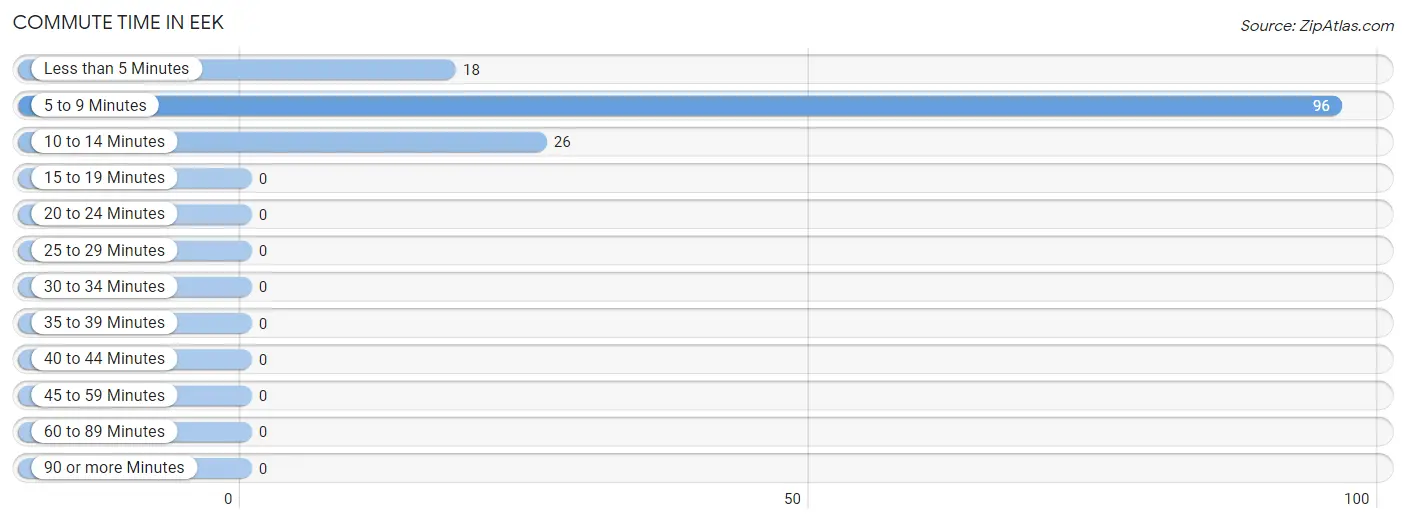
| Commute Time | # Commuters | % Commuters |
| Less than 5 Minutes | 18 | 12.9% |
| 5 to 9 Minutes | 96 | 68.6% |
| 10 to 14 Minutes | 26 | 18.6% |
| 15 to 19 Minutes | 0 | 0.0% |
| 20 to 24 Minutes | 0 | 0.0% |
| 25 to 29 Minutes | 0 | 0.0% |
| 30 to 34 Minutes | 0 | 0.0% |
| 35 to 39 Minutes | 0 | 0.0% |
| 40 to 44 Minutes | 0 | 0.0% |
| 45 to 59 Minutes | 0 | 0.0% |
| 60 to 89 Minutes | 0 | 0.0% |
| 90 or more Minutes | 0 | 0.0% |
Commute Time by Sex in Eek
The most common commute times in Eek are 5 to 9 minutes (70 commuters, 72.9%) for males and 5 to 9 minutes (26 commuters, 59.1%) for females.
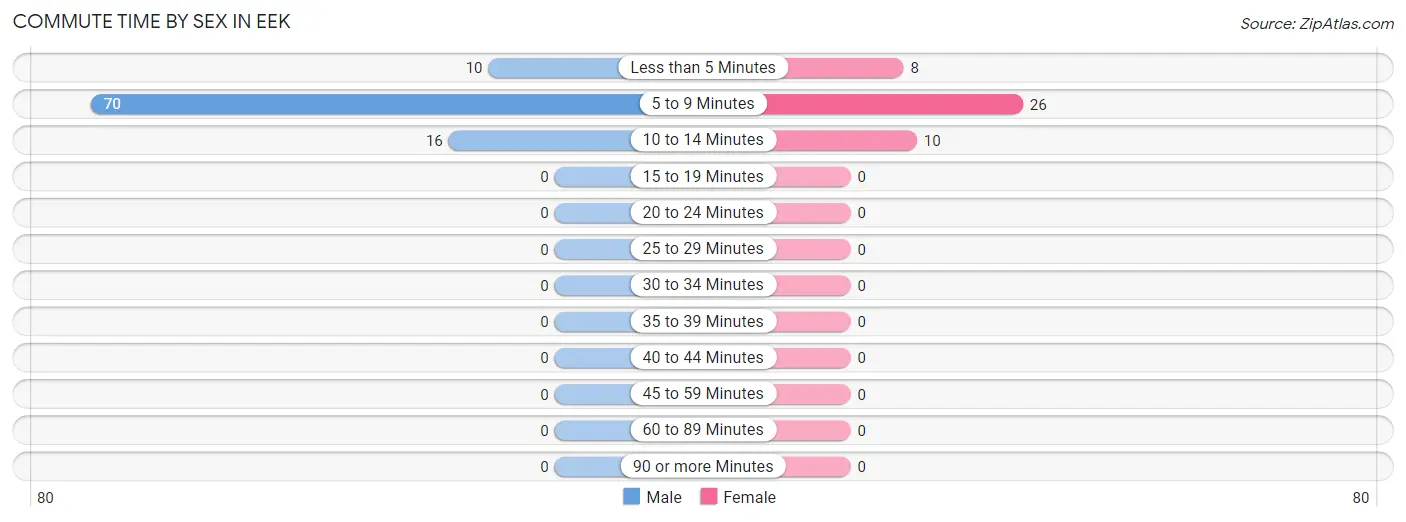
| Commute Time | Male | Female |
| Less than 5 Minutes | 10 (10.4%) | 8 (18.2%) |
| 5 to 9 Minutes | 70 (72.9%) | 26 (59.1%) |
| 10 to 14 Minutes | 16 (16.7%) | 10 (22.7%) |
| 15 to 19 Minutes | 0 (0.0%) | 0 (0.0%) |
| 20 to 24 Minutes | 0 (0.0%) | 0 (0.0%) |
| 25 to 29 Minutes | 0 (0.0%) | 0 (0.0%) |
| 30 to 34 Minutes | 0 (0.0%) | 0 (0.0%) |
| 35 to 39 Minutes | 0 (0.0%) | 0 (0.0%) |
| 40 to 44 Minutes | 0 (0.0%) | 0 (0.0%) |
| 45 to 59 Minutes | 0 (0.0%) | 0 (0.0%) |
| 60 to 89 Minutes | 0 (0.0%) | 0 (0.0%) |
| 90 or more Minutes | 0 (0.0%) | 0 (0.0%) |
Time of Departure to Work by Sex in Eek
The most frequent times of departure to work in Eek are 7:30 AM to 7:59 AM (17, 17.7%) for males and 8:00 AM to 8:29 AM (20, 45.5%) for females.
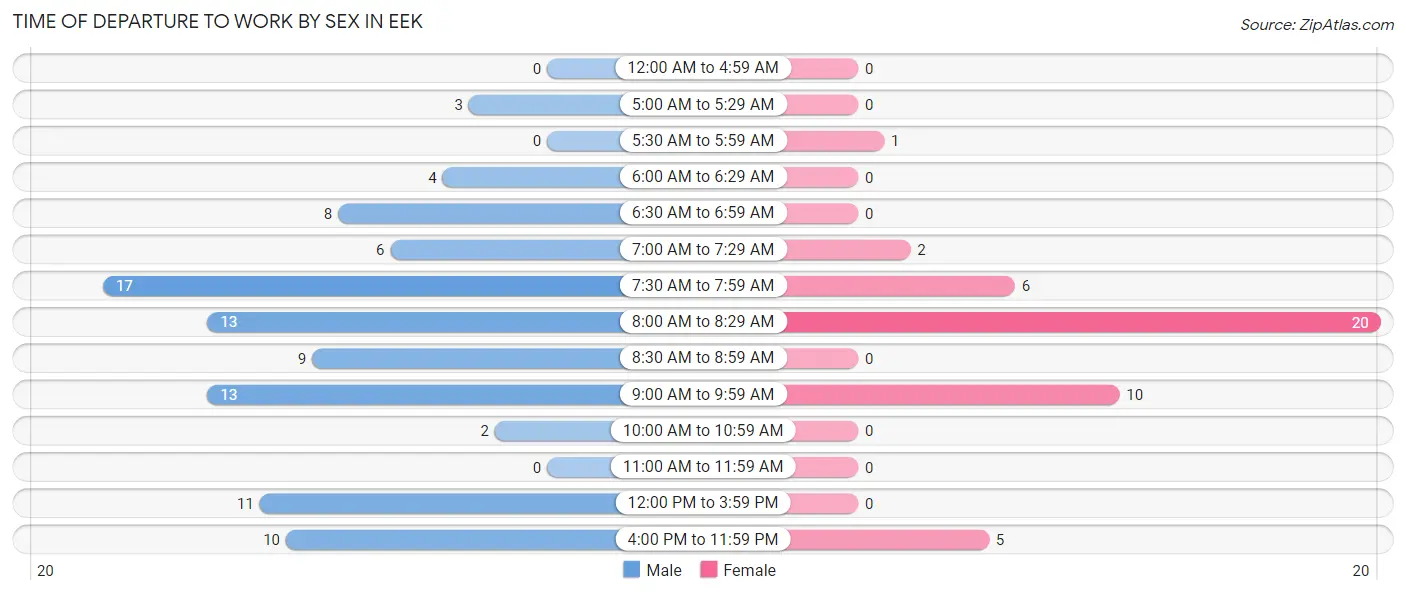
| Time of Departure | Male | Female |
| 12:00 AM to 4:59 AM | 0 (0.0%) | 0 (0.0%) |
| 5:00 AM to 5:29 AM | 3 (3.1%) | 0 (0.0%) |
| 5:30 AM to 5:59 AM | 0 (0.0%) | 1 (2.3%) |
| 6:00 AM to 6:29 AM | 4 (4.2%) | 0 (0.0%) |
| 6:30 AM to 6:59 AM | 8 (8.3%) | 0 (0.0%) |
| 7:00 AM to 7:29 AM | 6 (6.2%) | 2 (4.5%) |
| 7:30 AM to 7:59 AM | 17 (17.7%) | 6 (13.6%) |
| 8:00 AM to 8:29 AM | 13 (13.5%) | 20 (45.5%) |
| 8:30 AM to 8:59 AM | 9 (9.4%) | 0 (0.0%) |
| 9:00 AM to 9:59 AM | 13 (13.5%) | 10 (22.7%) |
| 10:00 AM to 10:59 AM | 2 (2.1%) | 0 (0.0%) |
| 11:00 AM to 11:59 AM | 0 (0.0%) | 0 (0.0%) |
| 12:00 PM to 3:59 PM | 11 (11.5%) | 0 (0.0%) |
| 4:00 PM to 11:59 PM | 10 (10.4%) | 5 (11.4%) |
| Total | 96 (100.0%) | 44 (100.0%) |
Housing Occupancy in Eek
Occupancy by Ownership in Eek
Of the total 108 dwellings in Eek, owner-occupied units account for 80 (74.1%), while renter-occupied units make up 28 (25.9%).
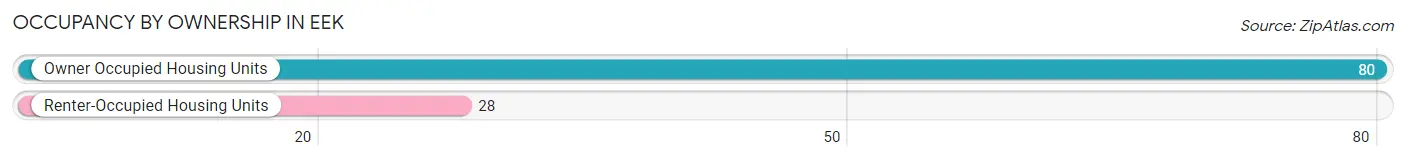
| Occupancy | # Housing Units | % Housing Units |
| Owner Occupied Housing Units | 80 | 74.1% |
| Renter-Occupied Housing Units | 28 | 25.9% |
| Total Occupied Housing Units | 108 | 100.0% |
Occupancy by Household Size in Eek
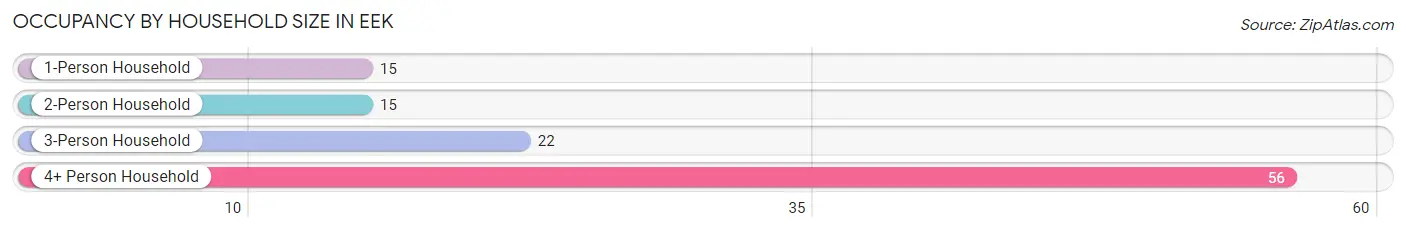
| Household Size | # Housing Units | % Housing Units |
| 1-Person Household | 15 | 13.9% |
| 2-Person Household | 15 | 13.9% |
| 3-Person Household | 22 | 20.4% |
| 4+ Person Household | 56 | 51.8% |
| Total Housing Units | 108 | 100.0% |
Occupancy by Ownership by Household Size in Eek
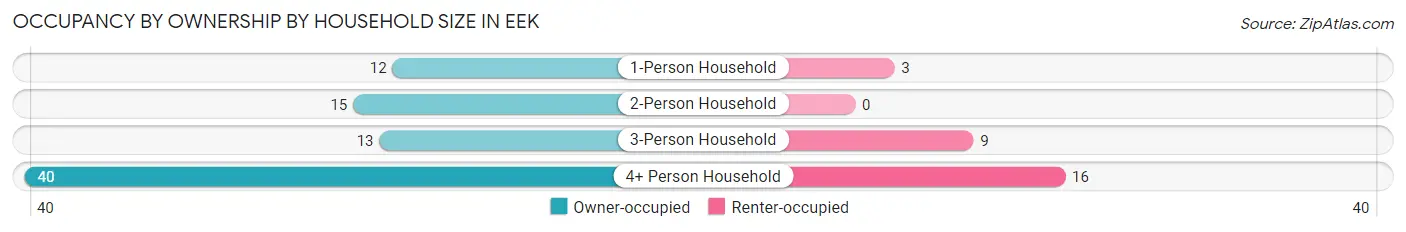
| Household Size | Owner-occupied | Renter-occupied |
| 1-Person Household | 12 (80.0%) | 3 (20.0%) |
| 2-Person Household | 15 (100.0%) | 0 (0.0%) |
| 3-Person Household | 13 (59.1%) | 9 (40.9%) |
| 4+ Person Household | 40 (71.4%) | 16 (28.6%) |
| Total Housing Units | 80 (74.1%) | 28 (25.9%) |
Occupancy by Educational Attainment in Eek
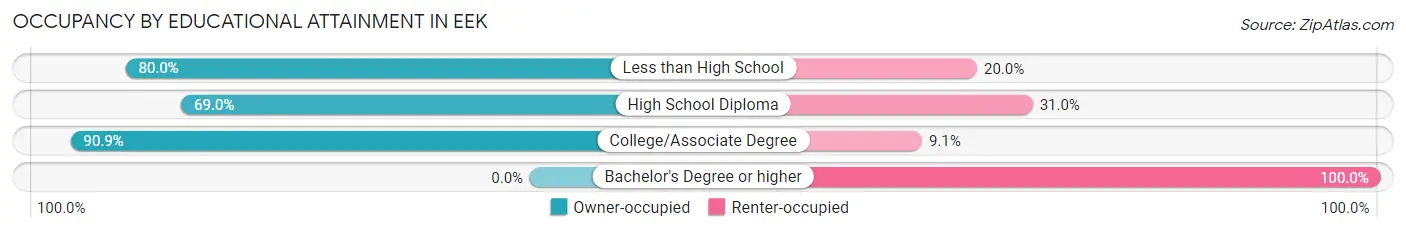
| Household Size | Owner-occupied | Renter-occupied |
| Less than High School | 20 (80.0%) | 5 (20.0%) |
| High School Diploma | 40 (69.0%) | 18 (31.0%) |
| College/Associate Degree | 20 (90.9%) | 2 (9.1%) |
| Bachelor's Degree or higher | 0 (0.0%) | 3 (100.0%) |
Occupancy by Age of Householder in Eek
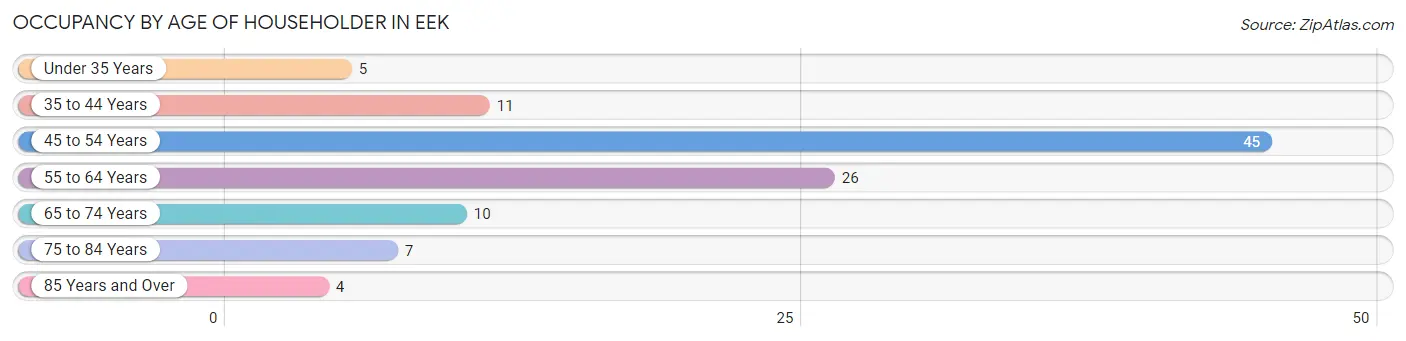
| Age Bracket | # Households | % Households |
| Under 35 Years | 5 | 4.6% |
| 35 to 44 Years | 11 | 10.2% |
| 45 to 54 Years | 45 | 41.7% |
| 55 to 64 Years | 26 | 24.1% |
| 65 to 74 Years | 10 | 9.3% |
| 75 to 84 Years | 7 | 6.5% |
| 85 Years and Over | 4 | 3.7% |
| Total | 108 | 100.0% |
Housing Finances in Eek
Median Income by Occupancy in Eek
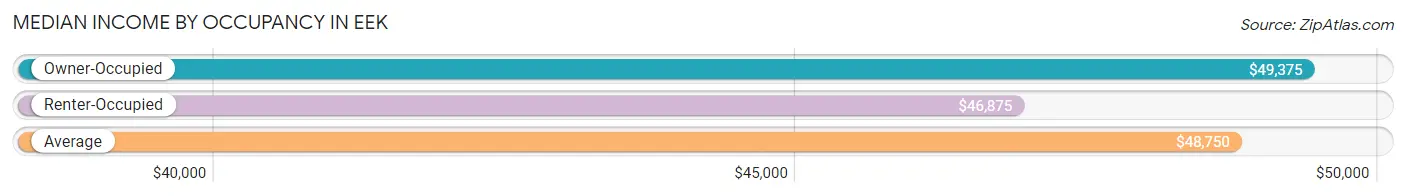
| Occupancy Type | # Households | Median Income |
| Owner-Occupied | 80 (74.1%) | $49,375 |
| Renter-Occupied | 28 (25.9%) | $46,875 |
| Average | 108 (100.0%) | $48,750 |
Occupancy by Householder Income Bracket in Eek
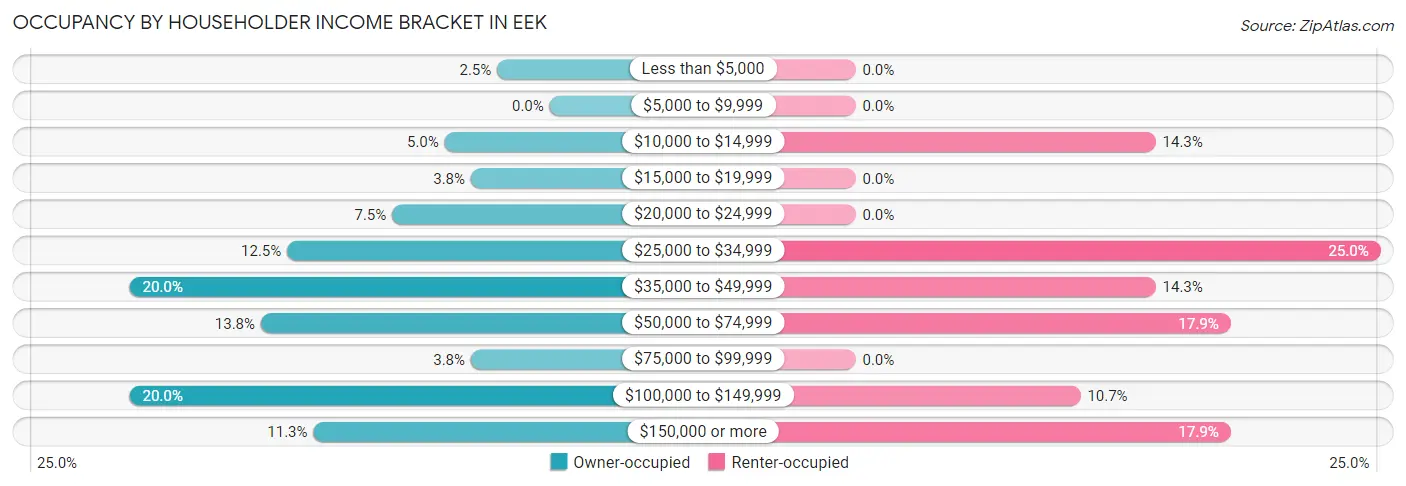
| Income Bracket | Owner-occupied | Renter-occupied |
| Less than $5,000 | 2 (2.5%) | 0 (0.0%) |
| $5,000 to $9,999 | 0 (0.0%) | 0 (0.0%) |
| $10,000 to $14,999 | 4 (5.0%) | 4 (14.3%) |
| $15,000 to $19,999 | 3 (3.7%) | 0 (0.0%) |
| $20,000 to $24,999 | 6 (7.5%) | 0 (0.0%) |
| $25,000 to $34,999 | 10 (12.5%) | 7 (25.0%) |
| $35,000 to $49,999 | 16 (20.0%) | 4 (14.3%) |
| $50,000 to $74,999 | 11 (13.8%) | 5 (17.9%) |
| $75,000 to $99,999 | 3 (3.7%) | 0 (0.0%) |
| $100,000 to $149,999 | 16 (20.0%) | 3 (10.7%) |
| $150,000 or more | 9 (11.3%) | 5 (17.9%) |
| Total | 80 (100.0%) | 28 (100.0%) |
Monthly Housing Cost Tiers in Eek
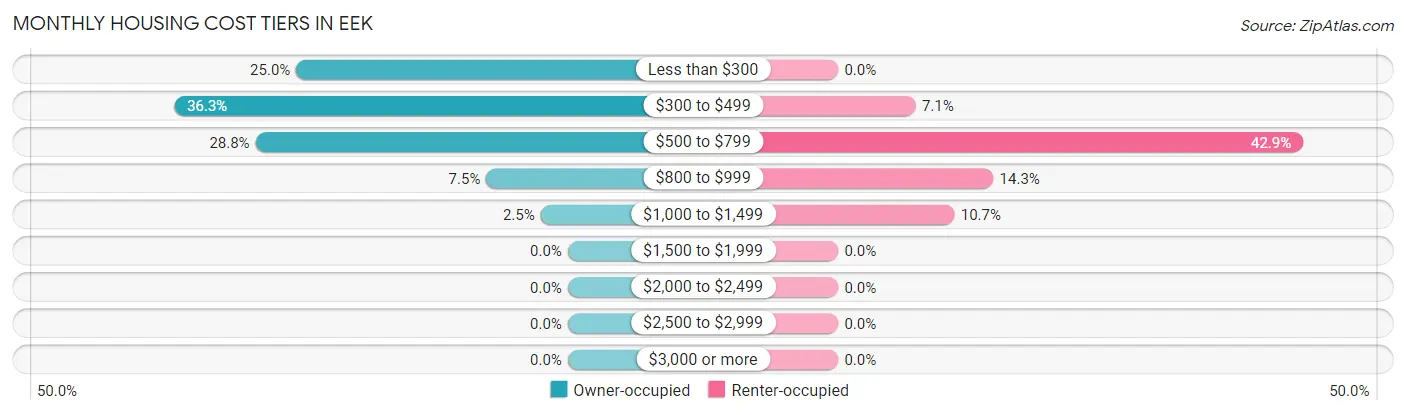
| Monthly Cost | Owner-occupied | Renter-occupied |
| Less than $300 | 20 (25.0%) | 0 (0.0%) |
| $300 to $499 | 29 (36.2%) | 2 (7.1%) |
| $500 to $799 | 23 (28.7%) | 12 (42.9%) |
| $800 to $999 | 6 (7.5%) | 4 (14.3%) |
| $1,000 to $1,499 | 2 (2.5%) | 3 (10.7%) |
| $1,500 to $1,999 | 0 (0.0%) | 0 (0.0%) |
| $2,000 to $2,499 | 0 (0.0%) | 0 (0.0%) |
| $2,500 to $2,999 | 0 (0.0%) | 0 (0.0%) |
| $3,000 or more | 0 (0.0%) | 0 (0.0%) |
| Total | 80 (100.0%) | 28 (100.0%) |
Physical Housing Characteristics in Eek
Housing Structures in Eek
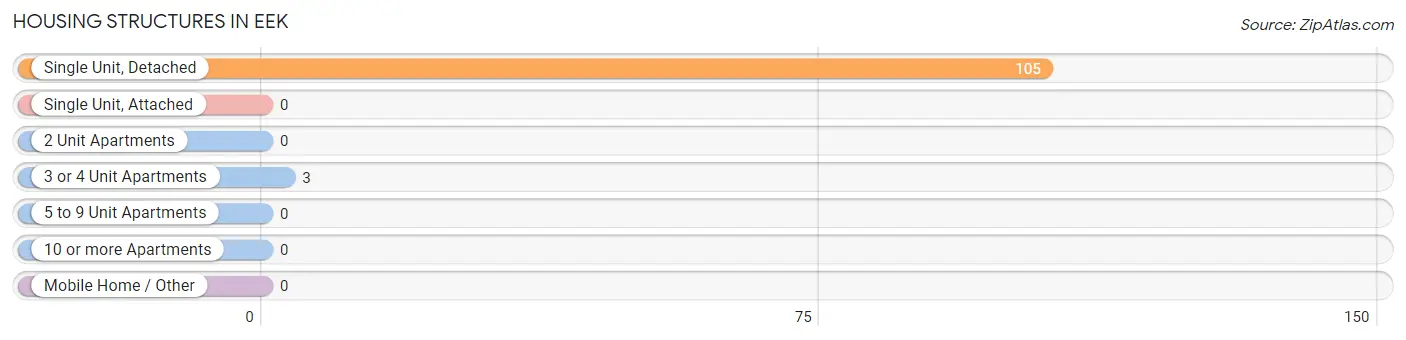
| Structure Type | # Housing Units | % Housing Units |
| Single Unit, Detached | 105 | 97.2% |
| Single Unit, Attached | 0 | 0.0% |
| 2 Unit Apartments | 0 | 0.0% |
| 3 or 4 Unit Apartments | 3 | 2.8% |
| 5 to 9 Unit Apartments | 0 | 0.0% |
| 10 or more Apartments | 0 | 0.0% |
| Mobile Home / Other | 0 | 0.0% |
| Total | 108 | 100.0% |
Housing Structures by Occupancy in Eek
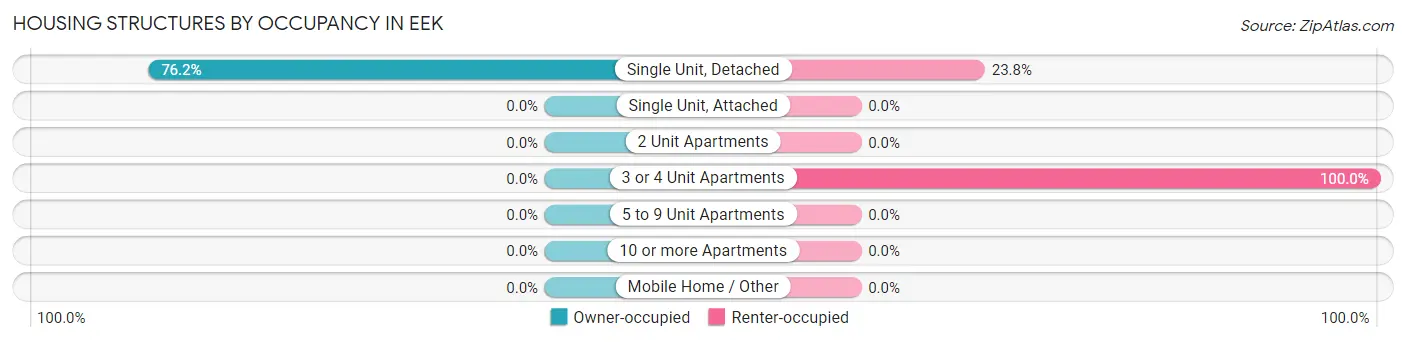
| Structure Type | Owner-occupied | Renter-occupied |
| Single Unit, Detached | 80 (76.2%) | 25 (23.8%) |
| Single Unit, Attached | 0 (0.0%) | 0 (0.0%) |
| 2 Unit Apartments | 0 (0.0%) | 0 (0.0%) |
| 3 or 4 Unit Apartments | 0 (0.0%) | 3 (100.0%) |
| 5 to 9 Unit Apartments | 0 (0.0%) | 0 (0.0%) |
| 10 or more Apartments | 0 (0.0%) | 0 (0.0%) |
| Mobile Home / Other | 0 (0.0%) | 0 (0.0%) |
| Total | 80 (74.1%) | 28 (25.9%) |
Housing Structures by Number of Rooms in Eek
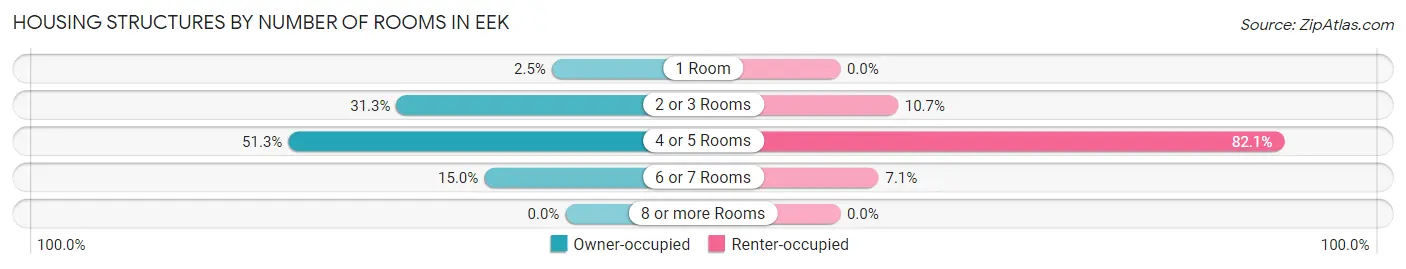
| Number of Rooms | Owner-occupied | Renter-occupied |
| 1 Room | 2 (2.5%) | 0 (0.0%) |
| 2 or 3 Rooms | 25 (31.2%) | 3 (10.7%) |
| 4 or 5 Rooms | 41 (51.2%) | 23 (82.1%) |
| 6 or 7 Rooms | 12 (15.0%) | 2 (7.1%) |
| 8 or more Rooms | 0 (0.0%) | 0 (0.0%) |
| Total | 80 (100.0%) | 28 (100.0%) |
Housing Structure by Heating Type in Eek
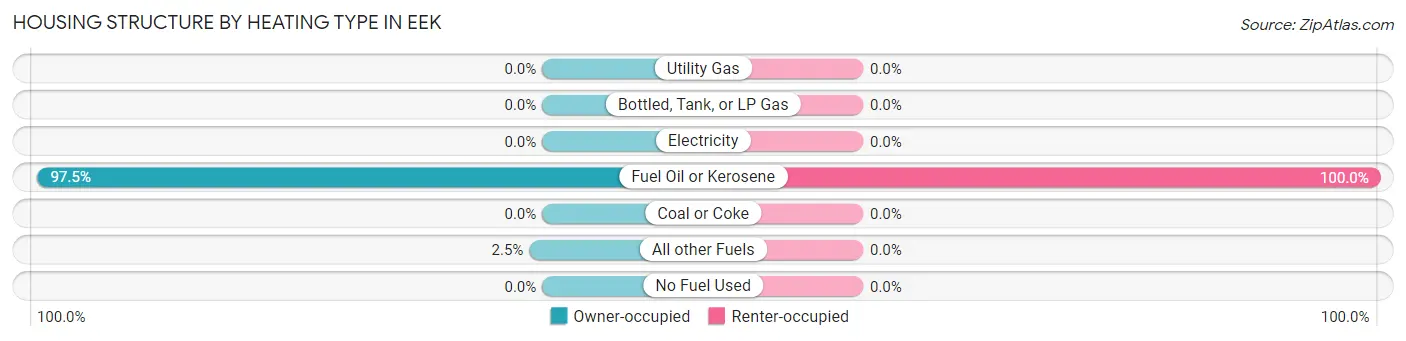
| Heating Type | Owner-occupied | Renter-occupied |
| Utility Gas | 0 (0.0%) | 0 (0.0%) |
| Bottled, Tank, or LP Gas | 0 (0.0%) | 0 (0.0%) |
| Electricity | 0 (0.0%) | 0 (0.0%) |
| Fuel Oil or Kerosene | 78 (97.5%) | 28 (100.0%) |
| Coal or Coke | 0 (0.0%) | 0 (0.0%) |
| All other Fuels | 2 (2.5%) | 0 (0.0%) |
| No Fuel Used | 0 (0.0%) | 0 (0.0%) |
| Total | 80 (100.0%) | 28 (100.0%) |
Household Vehicle Usage in Eek
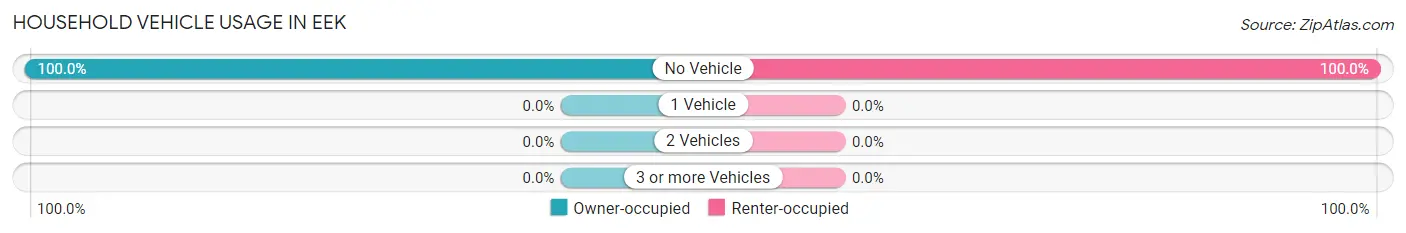
| Vehicles per Household | Owner-occupied | Renter-occupied |
| No Vehicle | 80 (100.0%) | 28 (100.0%) |
| 1 Vehicle | 0 (0.0%) | 0 (0.0%) |
| 2 Vehicles | 0 (0.0%) | 0 (0.0%) |
| 3 or more Vehicles | 0 (0.0%) | 0 (0.0%) |
| Total | 80 (100.0%) | 28 (100.0%) |
Real Estate & Mortgages in Eek
Real Estate and Mortgage Overview in Eek
| Characteristic | Without Mortgage | With Mortgage |
| Housing Units | 63 | 17 |
| Median Property Value | $55,000 | $111,300 |
| Median Household Income | $45,417 | $2 |
| Monthly Housing Costs | $344 | $0 |
| Real Estate Taxes | - | - |
Property Value by Mortgage Status in Eek
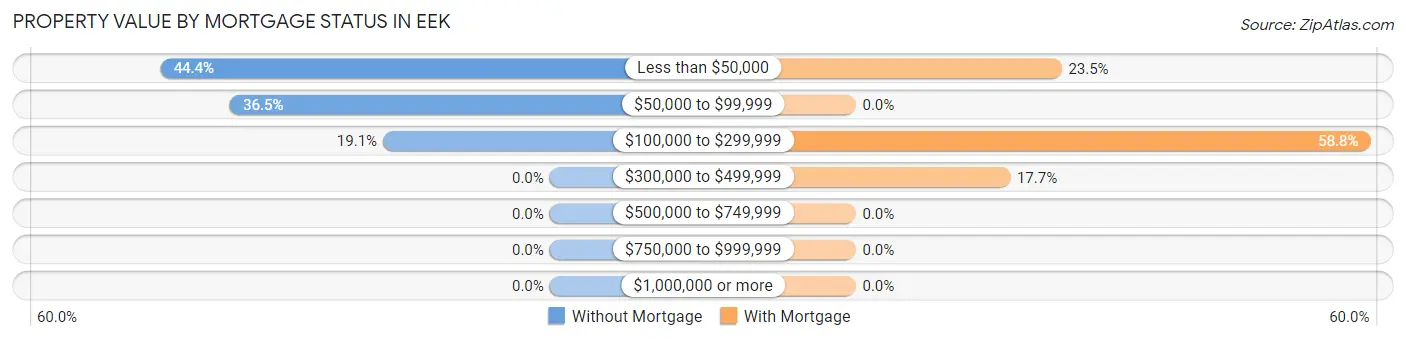
| Property Value | Without Mortgage | With Mortgage |
| Less than $50,000 | 28 (44.4%) | 4 (23.5%) |
| $50,000 to $99,999 | 23 (36.5%) | 0 (0.0%) |
| $100,000 to $299,999 | 12 (19.1%) | 10 (58.8%) |
| $300,000 to $499,999 | 0 (0.0%) | 3 (17.6%) |
| $500,000 to $749,999 | 0 (0.0%) | 0 (0.0%) |
| $750,000 to $999,999 | 0 (0.0%) | 0 (0.0%) |
| $1,000,000 or more | 0 (0.0%) | 0 (0.0%) |
| Total | 63 (100.0%) | 17 (100.0%) |
Household Income by Mortgage Status in Eek
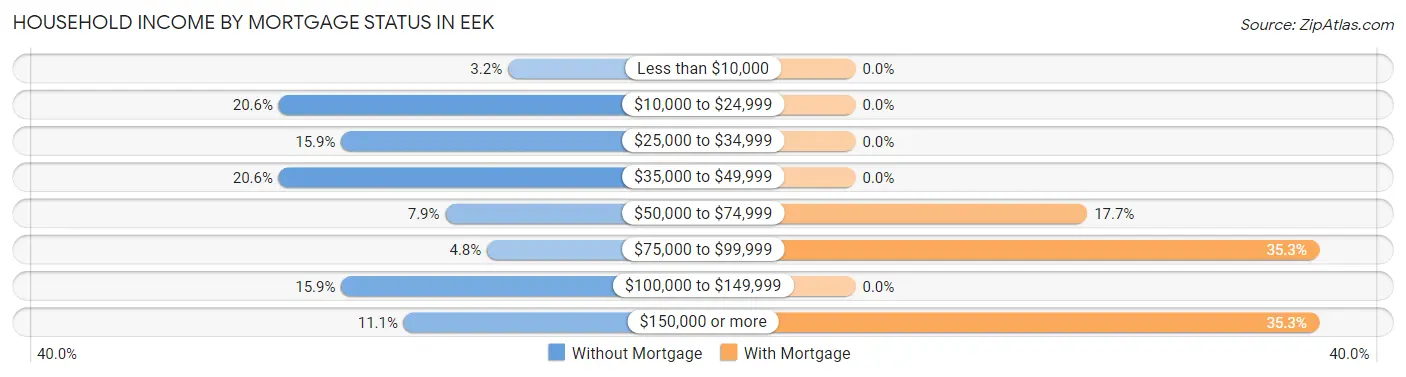
| Household Income | Without Mortgage | With Mortgage |
| Less than $10,000 | 2 (3.2%) | 0 (0.0%) |
| $10,000 to $24,999 | 13 (20.6%) | 0 (0.0%) |
| $25,000 to $34,999 | 10 (15.9%) | 0 (0.0%) |
| $35,000 to $49,999 | 13 (20.6%) | 0 (0.0%) |
| $50,000 to $74,999 | 5 (7.9%) | 3 (17.6%) |
| $75,000 to $99,999 | 3 (4.8%) | 6 (35.3%) |
| $100,000 to $149,999 | 10 (15.9%) | 0 (0.0%) |
| $150,000 or more | 7 (11.1%) | 6 (35.3%) |
| Total | 63 (100.0%) | 17 (100.0%) |
Property Value to Household Income Ratio in Eek
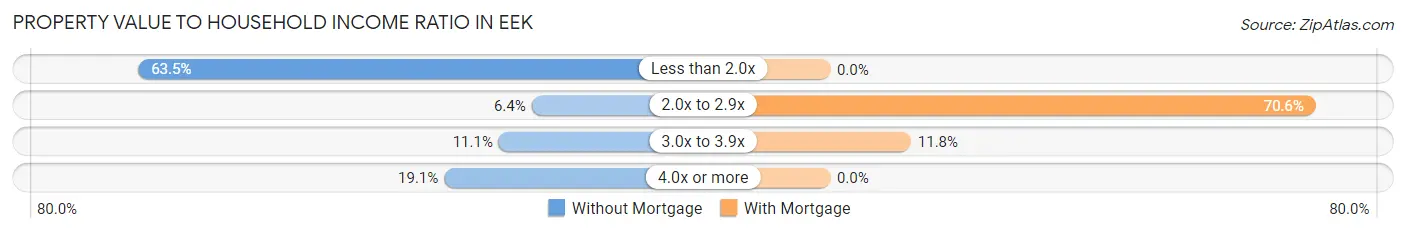
| Value-to-Income Ratio | Without Mortgage | With Mortgage |
| Less than 2.0x | 40 (63.5%) | 0 (0.0%) |
| 2.0x to 2.9x | 4 (6.4%) | 12 (70.6%) |
| 3.0x to 3.9x | 7 (11.1%) | 2 (11.8%) |
| 4.0x or more | 12 (19.1%) | 0 (0.0%) |
| Total | 63 (100.0%) | 17 (100.0%) |
Real Estate Taxes by Mortgage Status in Eek
| Property Taxes | Without Mortgage | With Mortgage |
| Less than $800 | 0 (0.0%) | 0 (0.0%) |
| $800 to $1,499 | 0 (0.0%) | 0 (0.0%) |
| $800 to $1,499 | 0 (0.0%) | 0 (0.0%) |
| Total | 63 (100.0%) | 17 (100.0%) |
Health & Disability in Eek
Health Insurance Coverage by Age in Eek
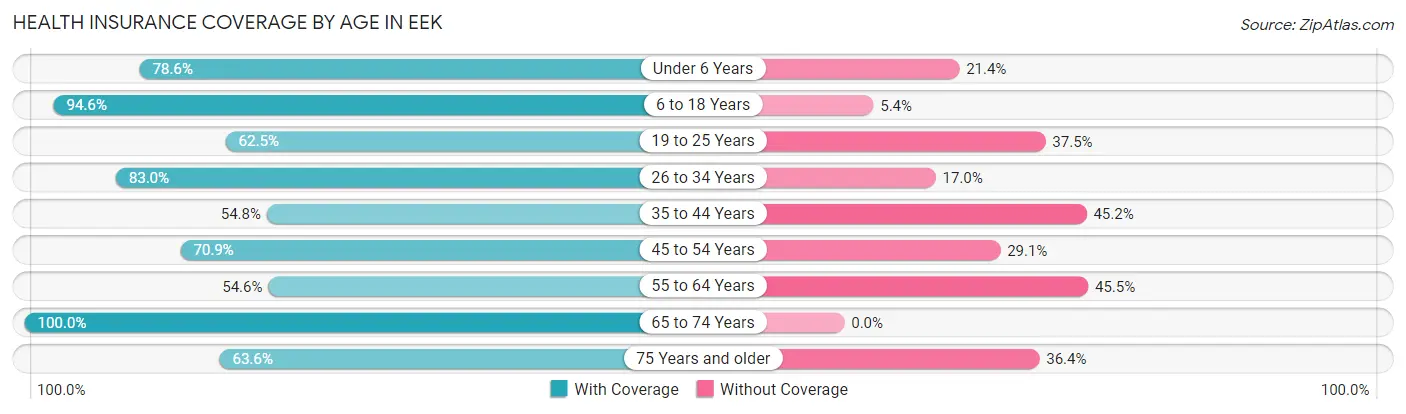
| Age Bracket | With Coverage | Without Coverage |
| Under 6 Years | 33 (78.6%) | 9 (21.4%) |
| 6 to 18 Years | 140 (94.6%) | 8 (5.4%) |
| 19 to 25 Years | 30 (62.5%) | 18 (37.5%) |
| 26 to 34 Years | 39 (83.0%) | 8 (17.0%) |
| 35 to 44 Years | 17 (54.8%) | 14 (45.2%) |
| 45 to 54 Years | 61 (70.9%) | 25 (29.1%) |
| 55 to 64 Years | 24 (54.5%) | 20 (45.5%) |
| 65 to 74 Years | 18 (100.0%) | 0 (0.0%) |
| 75 Years and older | 7 (63.6%) | 4 (36.4%) |
| Total | 369 (77.7%) | 106 (22.3%) |
Health Insurance Coverage by Citizenship Status in Eek
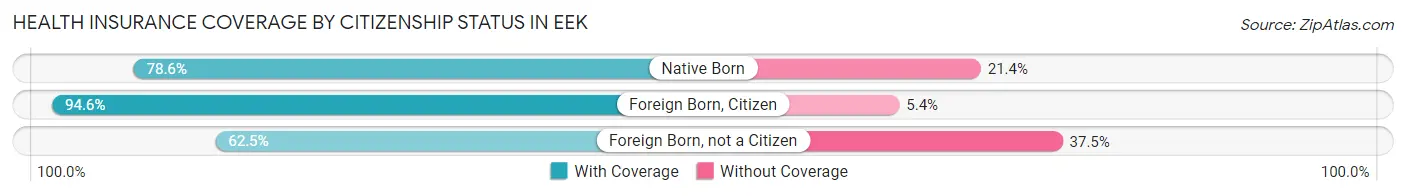
| Citizenship Status | With Coverage | Without Coverage |
| Native Born | 33 (78.6%) | 9 (21.4%) |
| Foreign Born, Citizen | 140 (94.6%) | 8 (5.4%) |
| Foreign Born, not a Citizen | 30 (62.5%) | 18 (37.5%) |
Health Insurance Coverage by Household Income in Eek
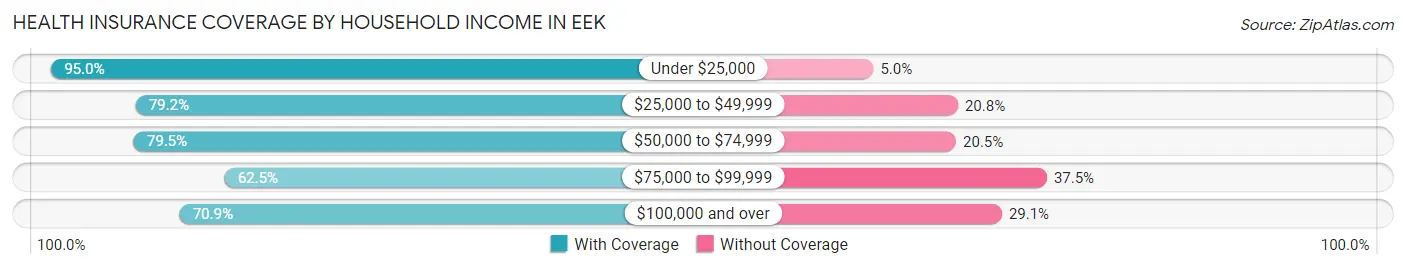
| Household Income | With Coverage | Without Coverage |
| Under $25,000 | 57 (95.0%) | 3 (5.0%) |
| $25,000 to $49,999 | 114 (79.2%) | 30 (20.8%) |
| $50,000 to $74,999 | 66 (79.5%) | 17 (20.5%) |
| $75,000 to $99,999 | 10 (62.5%) | 6 (37.5%) |
| $100,000 and over | 122 (70.9%) | 50 (29.1%) |
Public vs Private Health Insurance Coverage by Age in Eek
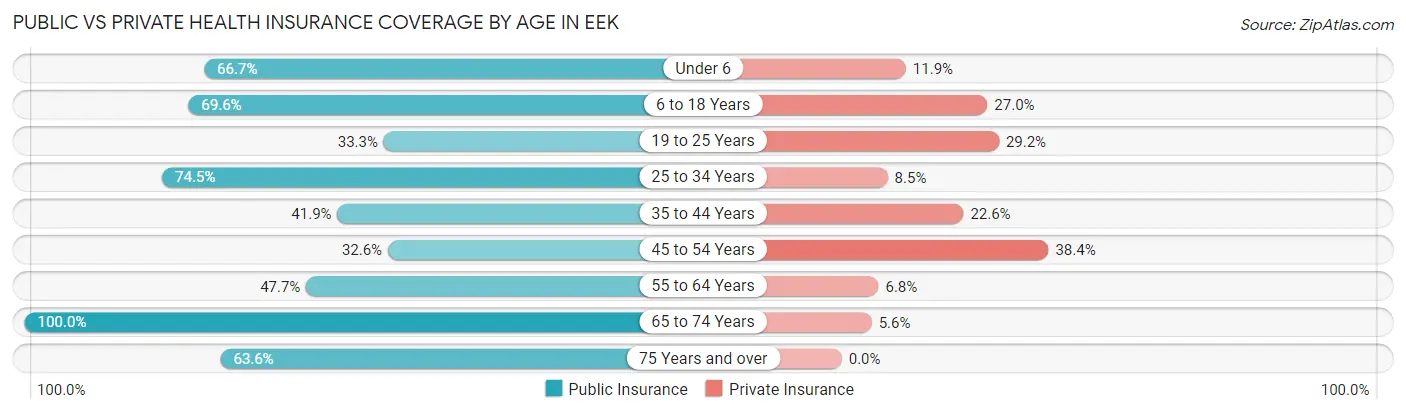
| Age Bracket | Public Insurance | Private Insurance |
| Under 6 | 28 (66.7%) | 5 (11.9%) |
| 6 to 18 Years | 103 (69.6%) | 40 (27.0%) |
| 19 to 25 Years | 16 (33.3%) | 14 (29.2%) |
| 25 to 34 Years | 35 (74.5%) | 4 (8.5%) |
| 35 to 44 Years | 13 (41.9%) | 7 (22.6%) |
| 45 to 54 Years | 28 (32.6%) | 33 (38.4%) |
| 55 to 64 Years | 21 (47.7%) | 3 (6.8%) |
| 65 to 74 Years | 18 (100.0%) | 1 (5.6%) |
| 75 Years and over | 7 (63.6%) | 0 (0.0%) |
| Total | 269 (56.6%) | 107 (22.5%) |
Disability Status by Sex by Age in Eek
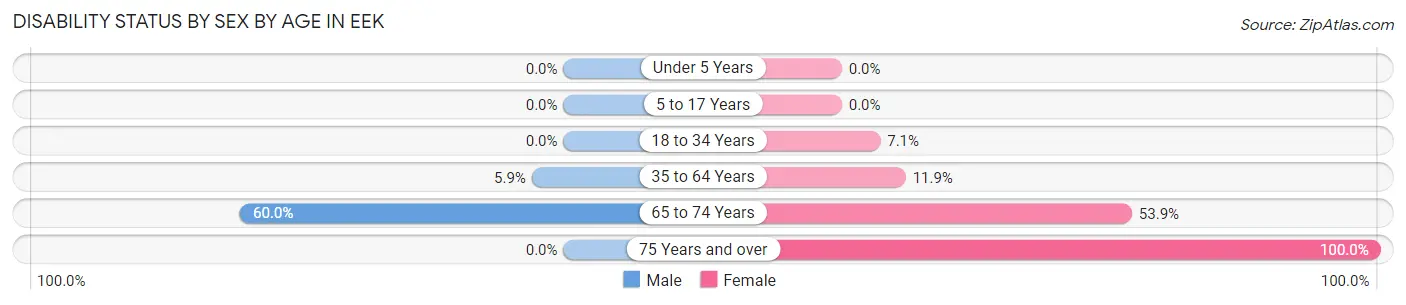
| Age Bracket | Male | Female |
| Under 5 Years | 0 (0.0%) | 0 (0.0%) |
| 5 to 17 Years | 0 (0.0%) | 0 (0.0%) |
| 18 to 34 Years | 0 (0.0%) | 3 (7.1%) |
| 35 to 64 Years | 6 (5.9%) | 7 (11.9%) |
| 65 to 74 Years | 3 (60.0%) | 7 (53.8%) |
| 75 Years and over | 0 (0.0%) | 8 (100.0%) |
Disability Class by Sex by Age in Eek
Disability Class: Hearing Difficulty
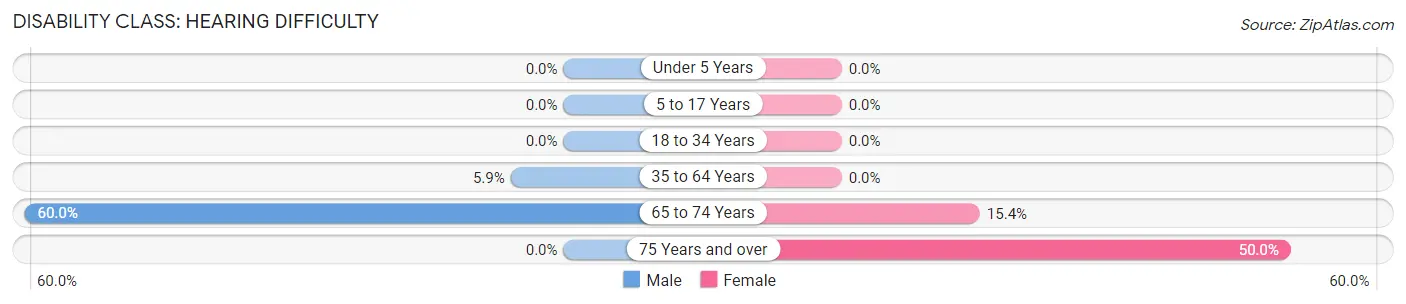
| Age Bracket | Male | Female |
| Under 5 Years | 0 (0.0%) | 0 (0.0%) |
| 5 to 17 Years | 0 (0.0%) | 0 (0.0%) |
| 18 to 34 Years | 0 (0.0%) | 0 (0.0%) |
| 35 to 64 Years | 6 (5.9%) | 0 (0.0%) |
| 65 to 74 Years | 3 (60.0%) | 2 (15.4%) |
| 75 Years and over | 0 (0.0%) | 4 (50.0%) |
Disability Class: Vision Difficulty
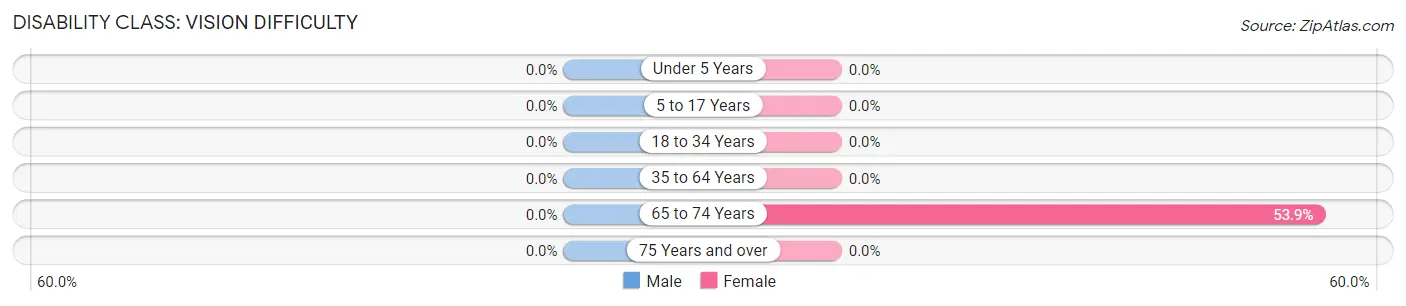
| Age Bracket | Male | Female |
| Under 5 Years | 0 (0.0%) | 0 (0.0%) |
| 5 to 17 Years | 0 (0.0%) | 0 (0.0%) |
| 18 to 34 Years | 0 (0.0%) | 0 (0.0%) |
| 35 to 64 Years | 0 (0.0%) | 0 (0.0%) |
| 65 to 74 Years | 0 (0.0%) | 7 (53.8%) |
| 75 Years and over | 0 (0.0%) | 0 (0.0%) |
Disability Class: Cognitive Difficulty
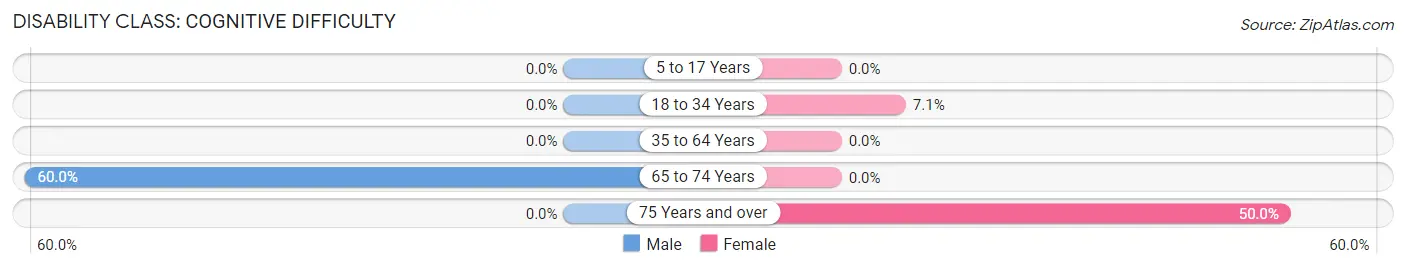
| Age Bracket | Male | Female |
| 5 to 17 Years | 0 (0.0%) | 0 (0.0%) |
| 18 to 34 Years | 0 (0.0%) | 3 (7.1%) |
| 35 to 64 Years | 0 (0.0%) | 0 (0.0%) |
| 65 to 74 Years | 3 (60.0%) | 0 (0.0%) |
| 75 Years and over | 0 (0.0%) | 4 (50.0%) |
Disability Class: Ambulatory Difficulty
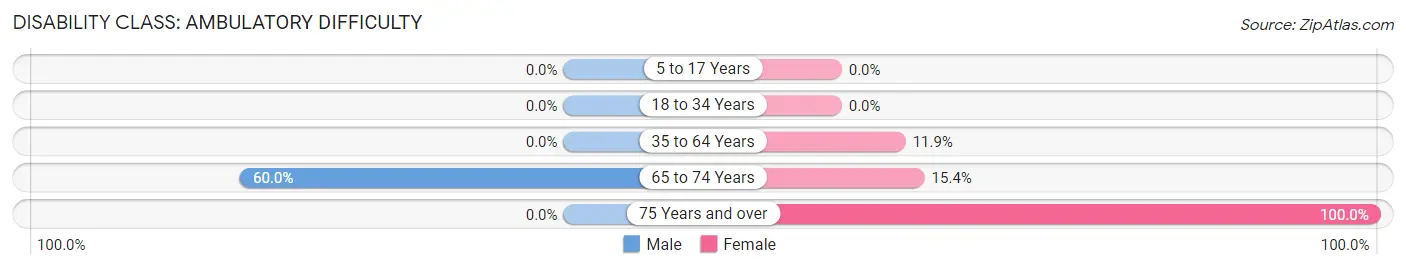
| Age Bracket | Male | Female |
| 5 to 17 Years | 0 (0.0%) | 0 (0.0%) |
| 18 to 34 Years | 0 (0.0%) | 0 (0.0%) |
| 35 to 64 Years | 0 (0.0%) | 7 (11.9%) |
| 65 to 74 Years | 3 (60.0%) | 2 (15.4%) |
| 75 Years and over | 0 (0.0%) | 8 (100.0%) |
Disability Class: Self-Care Difficulty
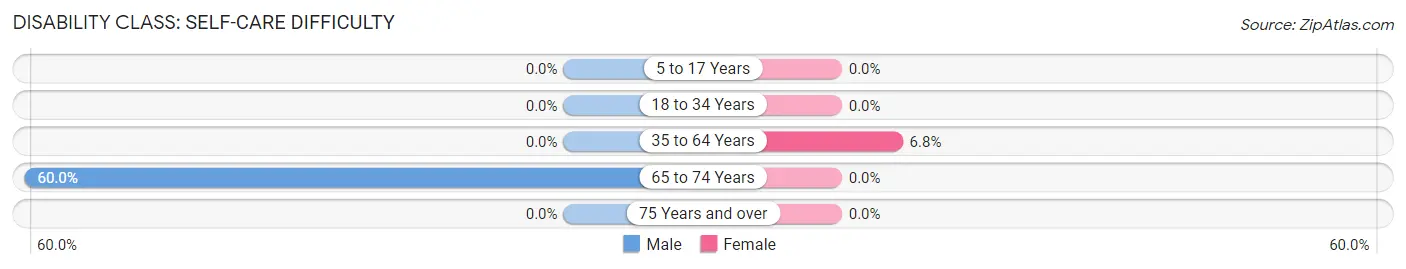
| Age Bracket | Male | Female |
| 5 to 17 Years | 0 (0.0%) | 0 (0.0%) |
| 18 to 34 Years | 0 (0.0%) | 0 (0.0%) |
| 35 to 64 Years | 0 (0.0%) | 4 (6.8%) |
| 65 to 74 Years | 3 (60.0%) | 0 (0.0%) |
| 75 Years and over | 0 (0.0%) | 0 (0.0%) |
Technology Access in Eek
Computing Device Access in Eek
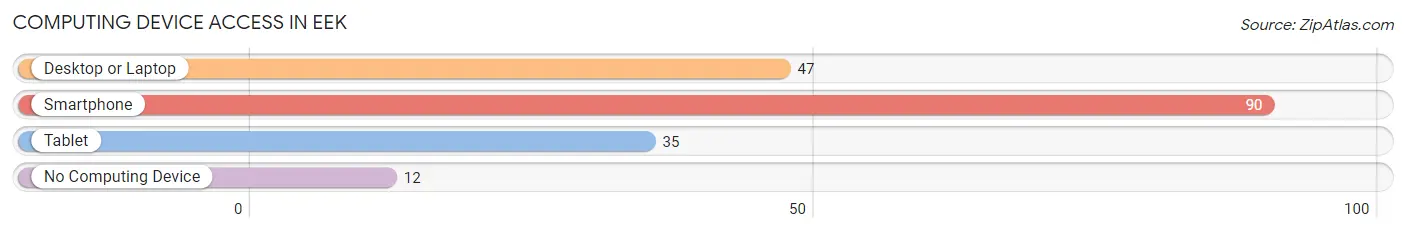
| Device Type | # Households | % Households |
| Desktop or Laptop | 47 | 43.5% |
| Smartphone | 90 | 83.3% |
| Tablet | 35 | 32.4% |
| No Computing Device | 12 | 11.1% |
| Total | 108 | 100.0% |
Internet Access in Eek
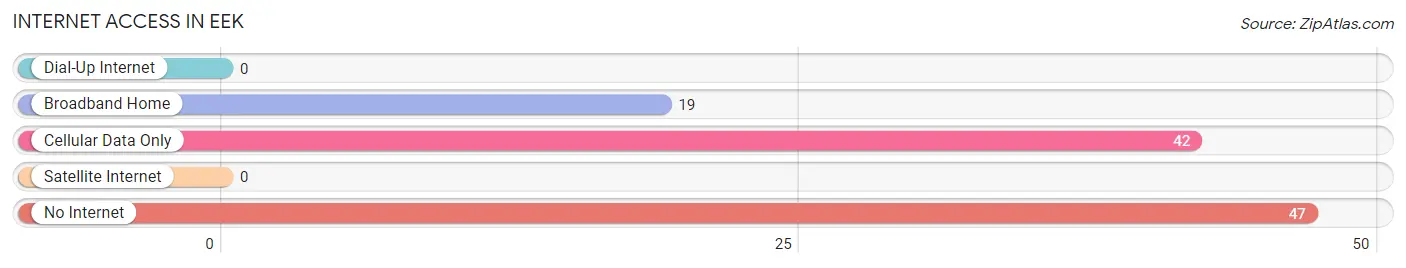
| Internet Type | # Households | % Households |
| Dial-Up Internet | 0 | 0.0% |
| Broadband Home | 19 | 17.6% |
| Cellular Data Only | 42 | 38.9% |
| Satellite Internet | 0 | 0.0% |
| No Internet | 47 | 43.5% |
| Total | 108 | 100.0% |
Eek Summary
History
Alaska is the largest state in the United States, and it has a rich and varied history. The first people to inhabit the area were the Inuit, Aleut, and Athabascan tribes, who have lived in the region for thousands of years. The first Europeans to explore the area were Russian fur traders, who arrived in the late 1700s. In 1867, the United States purchased Alaska from Russia for $7.2 million, and it became the 49th state in 1959.
Since then, Alaska has become an important part of the United States. It is home to the largest national park in the country, Denali National Park, and it is the only state with a coastline on three different seas: the Arctic Ocean, the Pacific Ocean, and the Bering Sea. Alaska is also home to the highest mountain peak in North America, Mount McKinley.
Geography
Alaska is located in the northwest corner of the United States, and it is bordered by Canada to the east and the Arctic Ocean to the north. It is the largest state in the country, covering an area of 663,268 square miles. Alaska is divided into five regions: the Interior, the Southcentral, the Southeast, the North Slope, and the Aleutian Islands.
The Interior region is home to the state's highest mountain peak, Mount McKinley, and it is also home to Denali National Park. The Southcentral region is home to the state's largest city, Anchorage, and it is also home to the Chugach Mountains and the Kenai Peninsula. The Southeast region is home to the Tongass National Forest, the largest national forest in the United States. The North Slope region is home to the Arctic National Wildlife Refuge, and the Aleutian Islands are home to the Aleutian Islands National Wildlife Refuge.
Economy
Alaska's economy is largely based on natural resources, such as oil, gas, timber, and fisheries. Oil and gas production account for the majority of the state's economic activity, and Alaska is the largest oil-producing state in the United States. The state also has a large fishing industry, and it is the largest producer of wild salmon in the world.
The state's economy is also supported by tourism, with visitors coming to Alaska to experience its natural beauty and unique wildlife. The state is home to some of the most spectacular scenery in the world, and it is also home to a variety of wildlife, including bears, moose, caribou, and whales.
Demographics
As of 2020, Alaska had an estimated population of 731,545. The state is home to a variety of ethnic and racial groups, including Native Americans, whites, Asians, and Hispanics. The largest racial group in the state is white, accounting for 66.3% of the population. Native Americans make up 15.2% of the population, and Asians make up 6.2%.
Alaska is also home to a variety of religious groups, with the largest being Christianity, which accounts for 63.3% of the population. Other religious groups include Judaism, Islam, Buddhism, and Hinduism.
Conclusion
Alaska is a unique and beautiful state with a rich history and a diverse population. It is home to some of the most spectacular scenery in the world, and it is also home to a variety of wildlife. The state's economy is largely based on natural resources, such as oil, gas, timber, and fisheries, and it is also supported by tourism. Alaska is an important part of the United States, and it is a great place to visit and explore.
Common Questions
What is Per Capita Income in Eek?
Per Capita income in Eek is $17,033.
What is the Median Family Income in Eek?
Median Family Income in Eek is $49,688.
What is the Median Household income in Eek?
Median Household Income in Eek is $48,750.
What is Inequality or Gini Index in Eek?
Inequality or Gini Index in Eek is 0.44.
What is the Total Population of Eek?
Total Population of Eek is 475.
What is the Total Male Population of Eek?
Total Male Population of Eek is 257.
What is the Total Female Population of Eek?
Total Female Population of Eek is 218.
What is the Ratio of Males per 100 Females in Eek?
There are 117.89 Males per 100 Females in Eek.
What is the Ratio of Females per 100 Males in Eek?
There are 84.82 Females per 100 Males in Eek.
What is the Median Population Age in Eek?
Median Population Age in Eek is 26.0 Years.
What is the Average Family Size in Eek
Average Family Size in Eek is 5.0 People.
What is the Average Household Size in Eek
Average Household Size in Eek is 4.4 People.
How Large is the Labor Force in Eek?
There are 205 People in the Labor Forcein in Eek.
What is the Percentage of People in the Labor Force in Eek?
66.1% of People are in the Labor Force in Eek.
What is the Unemployment Rate in Eek?
Unemployment Rate in Eek is 28.8%.