Dillingham, AK Map & Demographics
Dillingham Map
Dillingham Overview
$40,299
PER CAPITA INCOME
$94,375
AVG FAMILY INCOME
$92,578
AVG HOUSEHOLD INCOME
20.5%
WAGE / INCOME GAP [ % ]
79.5¢/ $1
WAGE / INCOME GAP [ $ ]
$11,120
FAMILY INCOME DEFICIT
0.38
INEQUALITY / GINI INDEX
2,175
TOTAL POPULATION
1,072
MALE POPULATION
1,103
FEMALE POPULATION
97.19
MALES / 100 FEMALES
102.89
FEMALES / 100 MALES
32.3
MEDIAN AGE
3.2
AVG FAMILY SIZE
2.8
AVG HOUSEHOLD SIZE
1,160
LABOR FORCE [ PEOPLE ]
71.8%
PERCENT IN LABOR FORCE
7.1%
UNEMPLOYMENT RATE
Dillingham Zip Codes
Dillingham Area Codes
Income in Dillingham
Income Overview in Dillingham
Per Capita Income in Dillingham is $40,299, while median incomes of families and households are $94,375 and $92,578 respectively.
| Characteristic | Number | Measure |
| Per Capita Income | 2,175 | $40,299 |
| Median Family Income | 490 | $94,375 |
| Mean Family Income | 490 | $104,884 |
| Median Household Income | 713 | $92,578 |
| Mean Household Income | 713 | $104,635 |
| Income Deficit | 490 | $11,120 |
| Wage / Income Gap (%) | 2,175 | 20.48% |
| Wage / Income Gap ($) | 2,175 | 79.52¢ per $1 |
| Gini / Inequality Index | 2,175 | 0.38 |
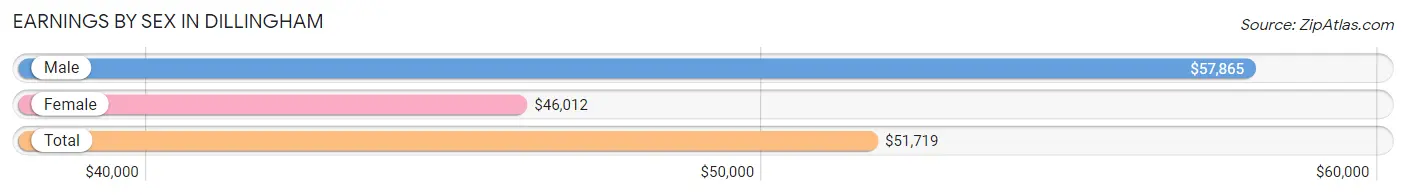
Earnings by Sex in Dillingham
Average Earnings in Dillingham are $51,719, $57,865 for men and $46,012 for women, a difference of 20.5%.
| Sex | Number | Average Earnings |
| Male | 635 (51.1%) | $57,865 |
| Female | 607 (48.9%) | $46,012 |
| Total | 1,242 (100.0%) | $51,719 |
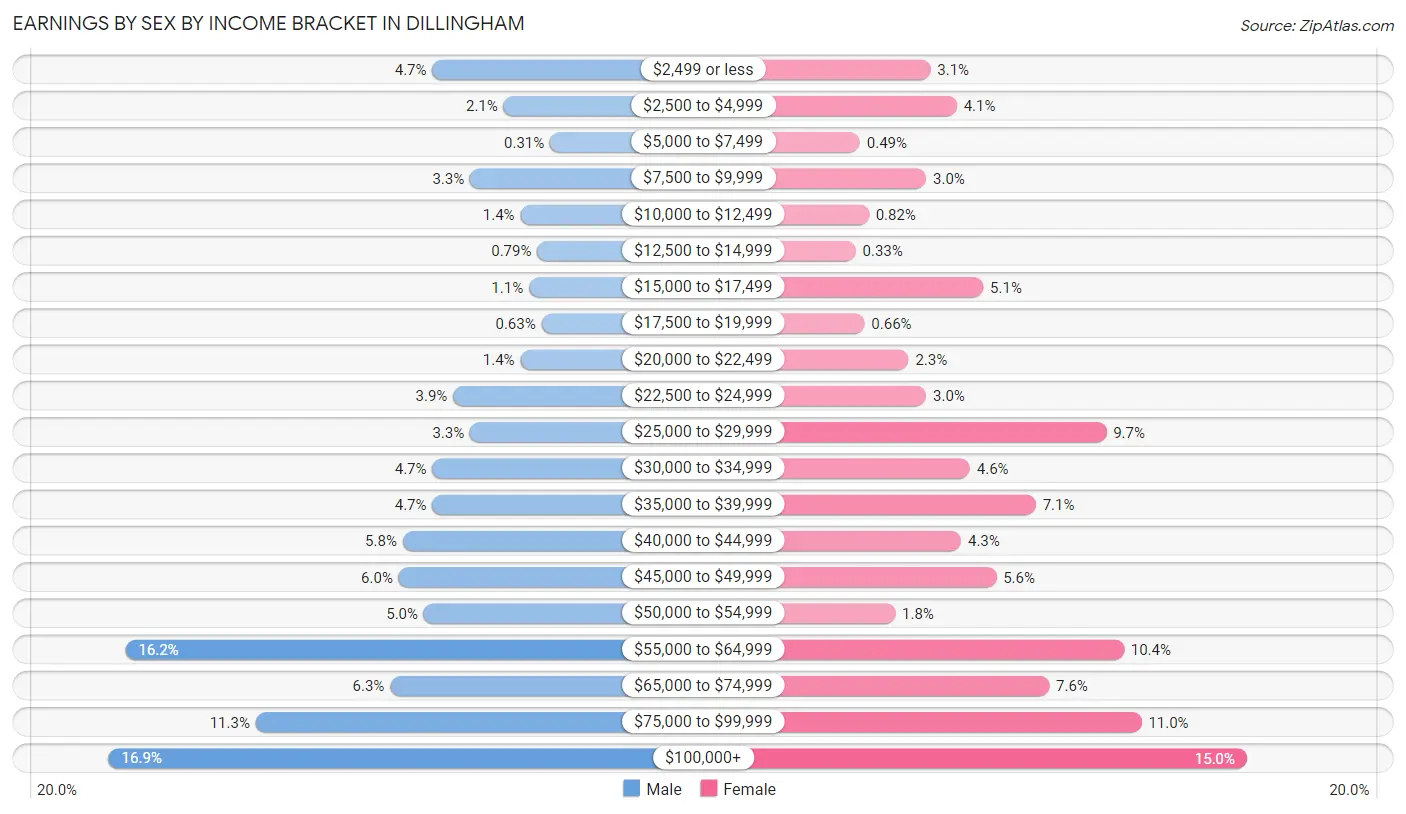
Earnings by Sex by Income Bracket in Dillingham
The most common earnings brackets in Dillingham are $100,000+ for men (107 | 16.9%) and $100,000+ for women (91 | 15.0%).
| Income | Male | Female |
| $2,499 or less | 30 (4.7%) | 19 (3.1%) |
| $2,500 to $4,999 | 13 (2.1%) | 25 (4.1%) |
| $5,000 to $7,499 | 2 (0.3%) | 3 (0.5%) |
| $7,500 to $9,999 | 21 (3.3%) | 18 (3.0%) |
| $10,000 to $12,499 | 9 (1.4%) | 5 (0.8%) |
| $12,500 to $14,999 | 5 (0.8%) | 2 (0.3%) |
| $15,000 to $17,499 | 7 (1.1%) | 31 (5.1%) |
| $17,500 to $19,999 | 4 (0.6%) | 4 (0.7%) |
| $20,000 to $22,499 | 9 (1.4%) | 14 (2.3%) |
| $22,500 to $24,999 | 25 (3.9%) | 18 (3.0%) |
| $25,000 to $29,999 | 21 (3.3%) | 59 (9.7%) |
| $30,000 to $34,999 | 30 (4.7%) | 28 (4.6%) |
| $35,000 to $39,999 | 30 (4.7%) | 43 (7.1%) |
| $40,000 to $44,999 | 37 (5.8%) | 26 (4.3%) |
| $45,000 to $49,999 | 38 (6.0%) | 34 (5.6%) |
| $50,000 to $54,999 | 32 (5.0%) | 11 (1.8%) |
| $55,000 to $64,999 | 103 (16.2%) | 63 (10.4%) |
| $65,000 to $74,999 | 40 (6.3%) | 46 (7.6%) |
| $75,000 to $99,999 | 72 (11.3%) | 67 (11.0%) |
| $100,000+ | 107 (16.9%) | 91 (15.0%) |
| Total | 635 (100.0%) | 607 (100.0%) |
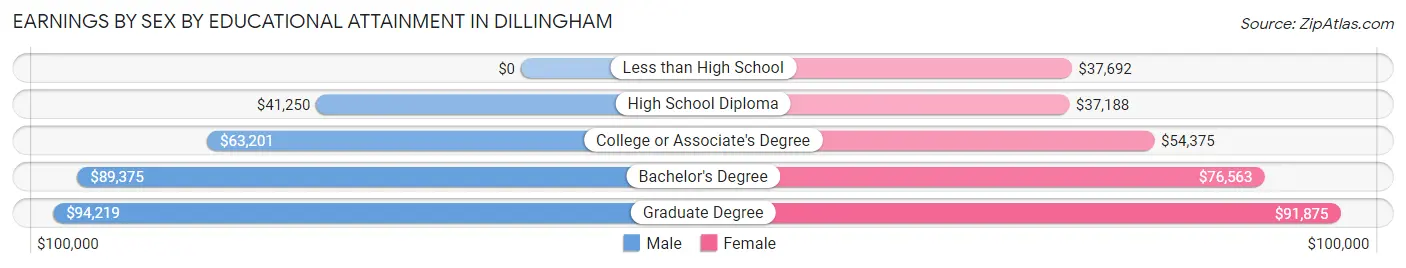
Earnings by Sex by Educational Attainment in Dillingham
Average earnings in Dillingham are $61,607 for men and $54,318 for women, a difference of 11.8%. Men with an educational attainment of graduate degree enjoy the highest average annual earnings of $94,219, while those with high school diploma education earn the least with $41,250. Women with an educational attainment of graduate degree earn the most with the average annual earnings of $91,875, while those with high school diploma education have the smallest earnings of $37,188.
| Educational Attainment | Male Income | Female Income |
| Less than High School | - | - |
| High School Diploma | $41,250 | $37,188 |
| College or Associate's Degree | $63,201 | $54,375 |
| Bachelor's Degree | $89,375 | $76,563 |
| Graduate Degree | $94,219 | $91,875 |
| Total | $61,607 | $54,318 |
Family Income in Dillingham
Family Income Brackets in Dillingham
According to the Dillingham family income data, there are 142 families falling into the $100,000 to $149,999 income range, which is the most common income bracket and makes up 29.0% of all families. Conversely, the $15,000 to $24,999 income bracket is the least frequent group with only 14 families (2.9%) belonging to this category.
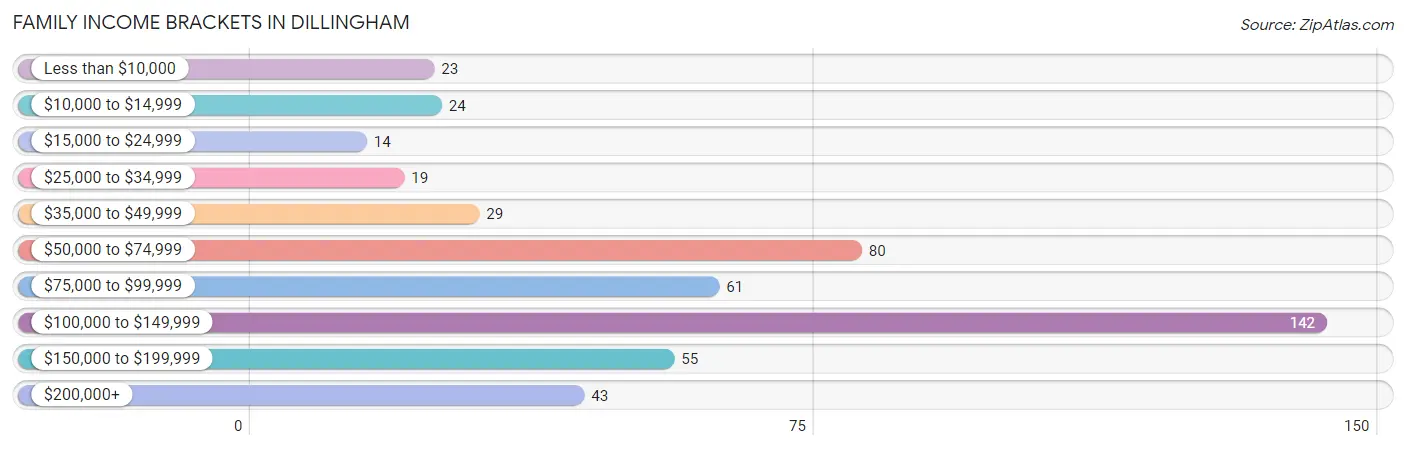
| Income Bracket | # Families | % Families |
| Less than $10,000 | 23 | 4.7% |
| $10,000 to $14,999 | 24 | 4.9% |
| $15,000 to $24,999 | 14 | 2.9% |
| $25,000 to $34,999 | 19 | 3.9% |
| $35,000 to $49,999 | 29 | 5.9% |
| $50,000 to $74,999 | 80 | 16.3% |
| $75,000 to $99,999 | 61 | 12.4% |
| $100,000 to $149,999 | 142 | 29.0% |
| $150,000 to $199,999 | 55 | 11.2% |
| $200,000+ | 43 | 8.8% |
Family Income by Famaliy Size in Dillingham
6-person families (18 | 3.7%) account for the highest median family income in Dillingham with $129,375 per family, while 2-person families (208 | 42.4%) have the highest median income of $45,625 per family member.
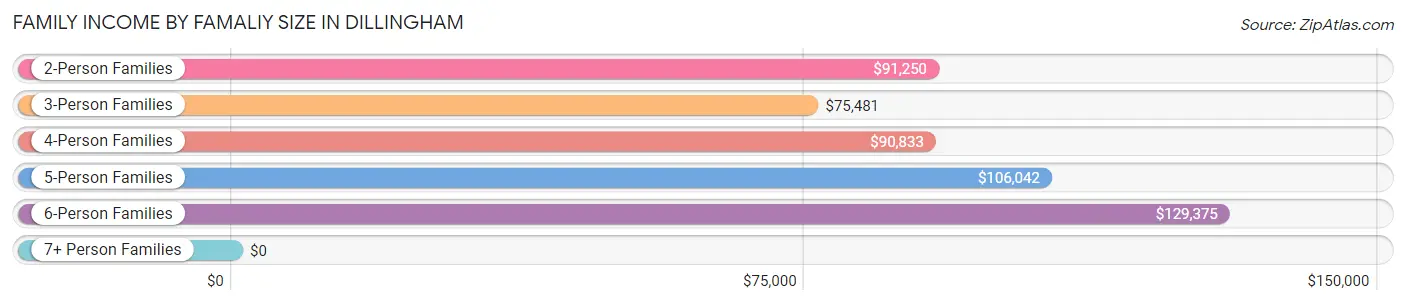
| Income Bracket | # Families | Median Income |
| 2-Person Families | 208 (42.4%) | $91,250 |
| 3-Person Families | 105 (21.4%) | $75,481 |
| 4-Person Families | 82 (16.7%) | $90,833 |
| 5-Person Families | 67 (13.7%) | $106,042 |
| 6-Person Families | 18 (3.7%) | $129,375 |
| 7+ Person Families | 10 (2.0%) | $0 |
| Total | 490 (100.0%) | $94,375 |
Family Income by Number of Earners in Dillingham
The median family income in Dillingham is $94,375, with families comprising 3+ earners (51) having the highest median family income of $153,542, while families with no earners (40) have the lowest median family income of $12,500, accounting for 10.4% and 8.2% of families, respectively.
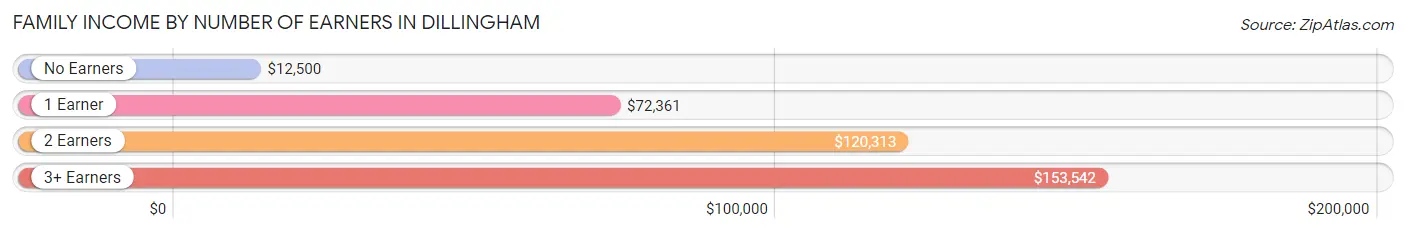
| Number of Earners | # Families | Median Income |
| No Earners | 40 (8.2%) | $12,500 |
| 1 Earner | 211 (43.1%) | $72,361 |
| 2 Earners | 188 (38.4%) | $120,313 |
| 3+ Earners | 51 (10.4%) | $153,542 |
| Total | 490 (100.0%) | $94,375 |
Household Income in Dillingham
Household Income Brackets in Dillingham
With 150 households falling in the category, the $100,000 to $149,999 income range is the most frequent in Dillingham, accounting for 21.0% of all households. In contrast, only 17 households (2.4%) fall into the less than $10,000 income bracket, making it the least populous group.
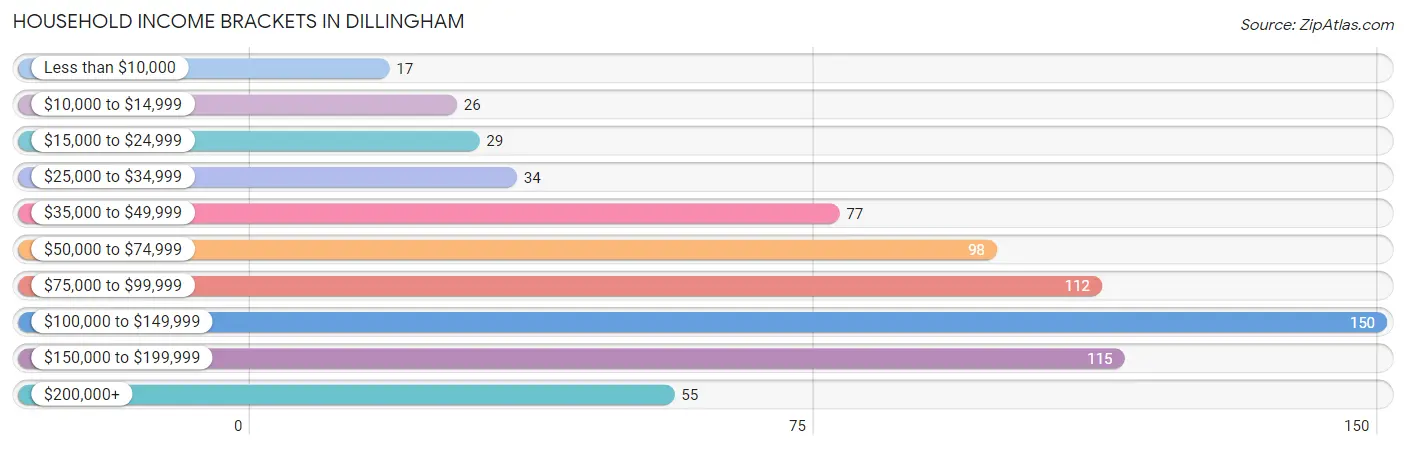
| Income Bracket | # Households | % Households |
| Less than $10,000 | 17 | 2.4% |
| $10,000 to $14,999 | 26 | 3.6% |
| $15,000 to $24,999 | 29 | 4.1% |
| $25,000 to $34,999 | 34 | 4.8% |
| $35,000 to $49,999 | 77 | 10.8% |
| $50,000 to $74,999 | 98 | 13.7% |
| $75,000 to $99,999 | 112 | 15.7% |
| $100,000 to $149,999 | 150 | 21.0% |
| $150,000 to $199,999 | 115 | 16.1% |
| $200,000+ | 55 | 7.7% |
Household Income by Householder Age in Dillingham
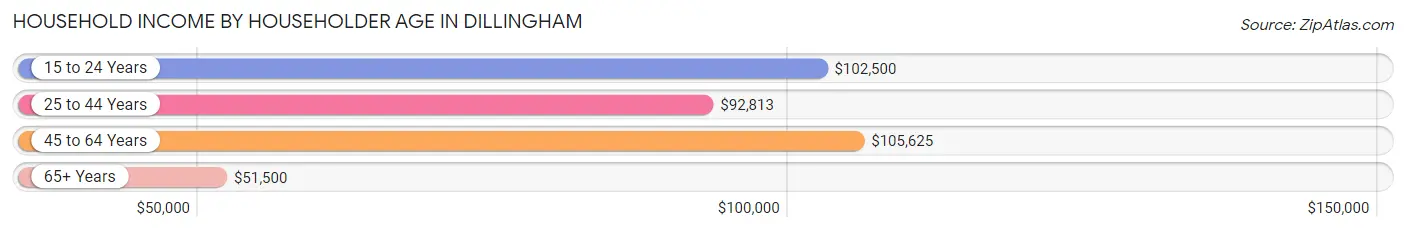
The median household income in Dillingham is $92,578, with the highest median household income of $105,625 found in the 45 to 64 years age bracket for the primary householder. A total of 255 households (35.8%) fall into this category. Meanwhile, the 65+ years age bracket for the primary householder has the lowest median household income of $51,500, with 128 households (17.9%) in this group.
| Income Bracket | # Households | Median Income |
| 15 to 24 Years | 22 (3.1%) | $102,500 |
| 25 to 44 Years | 308 (43.2%) | $92,813 |
| 45 to 64 Years | 255 (35.8%) | $105,625 |
| 65+ Years | 128 (17.9%) | $51,500 |
| Total | 713 (100.0%) | $92,578 |
Poverty in Dillingham
Income Below Poverty by Sex and Age in Dillingham
With 7.7% poverty level for males and 14.5% for females among the residents of Dillingham, under 5 year old males and 35 to 44 year old females are the most vulnerable to poverty, with 34 males (44.7%) and 45 females (32.1%) in their respective age groups living below the poverty level.
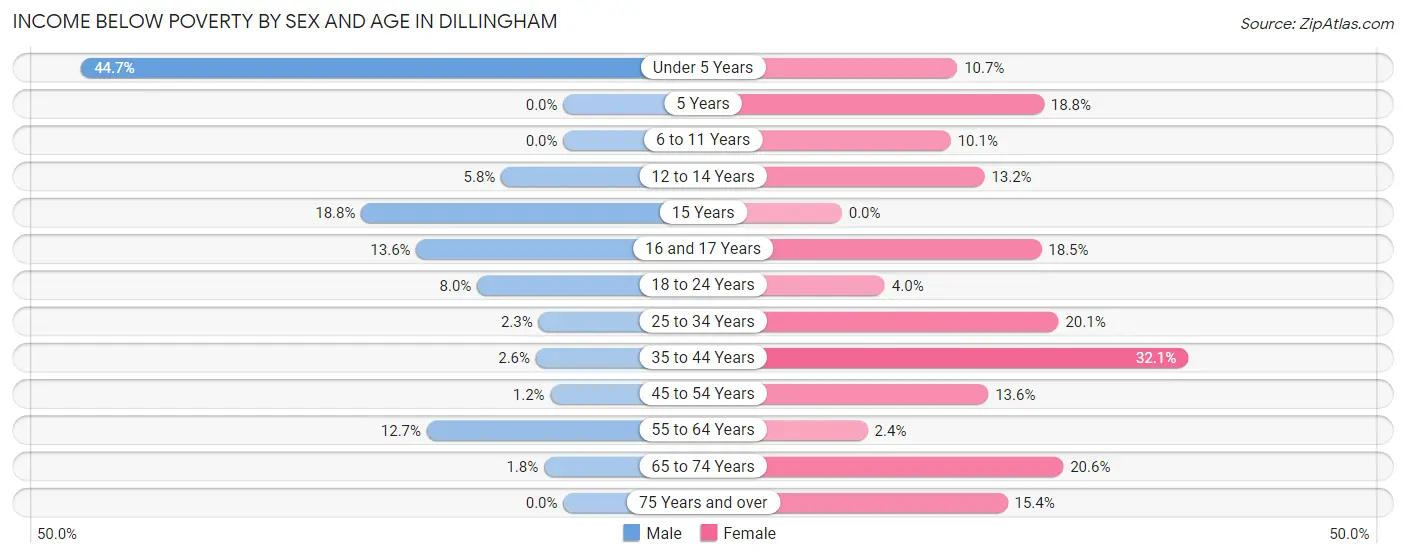
| Age Bracket | Male | Female |
| Under 5 Years | 34 (44.7%) | 9 (10.7%) |
| 5 Years | 0 (0.0%) | 3 (18.8%) |
| 6 to 11 Years | 0 (0.0%) | 9 (10.1%) |
| 12 to 14 Years | 3 (5.8%) | 9 (13.2%) |
| 15 Years | 3 (18.8%) | 0 (0.0%) |
| 16 and 17 Years | 3 (13.6%) | 5 (18.5%) |
| 18 to 24 Years | 8 (8.0%) | 4 (4.0%) |
| 25 to 34 Years | 4 (2.3%) | 38 (20.1%) |
| 35 to 44 Years | 4 (2.5%) | 45 (32.1%) |
| 45 to 54 Years | 1 (1.2%) | 14 (13.6%) |
| 55 to 64 Years | 19 (12.7%) | 4 (2.4%) |
| 65 to 74 Years | 1 (1.8%) | 15 (20.5%) |
| 75 Years and over | 0 (0.0%) | 4 (15.4%) |
| Total | 80 (7.7%) | 159 (14.5%) |
Income Above Poverty by Sex and Age in Dillingham
According to the poverty statistics in Dillingham, males aged 5 years and females aged 15 years are the age groups that are most secure financially, with 100.0% of males and 100.0% of females in these age groups living above the poverty line.
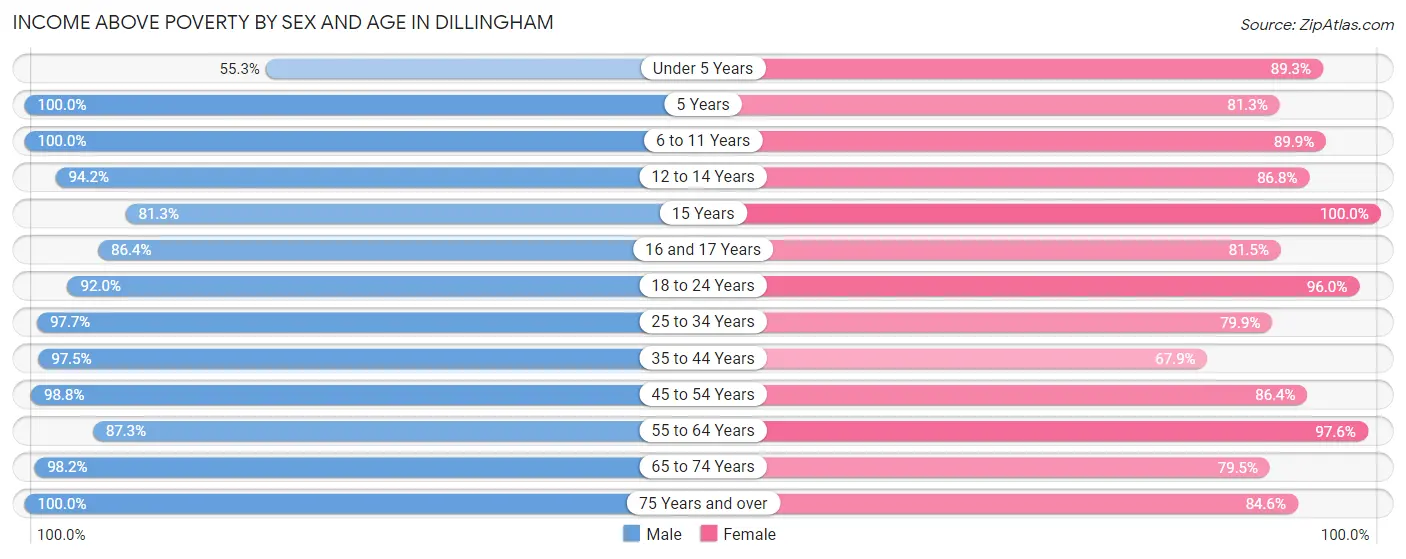
| Age Bracket | Male | Female |
| Under 5 Years | 42 (55.3%) | 75 (89.3%) |
| 5 Years | 6 (100.0%) | 13 (81.2%) |
| 6 to 11 Years | 124 (100.0%) | 80 (89.9%) |
| 12 to 14 Years | 49 (94.2%) | 59 (86.8%) |
| 15 Years | 13 (81.2%) | 12 (100.0%) |
| 16 and 17 Years | 19 (86.4%) | 22 (81.5%) |
| 18 to 24 Years | 92 (92.0%) | 96 (96.0%) |
| 25 to 34 Years | 170 (97.7%) | 151 (79.9%) |
| 35 to 44 Years | 153 (97.5%) | 95 (67.9%) |
| 45 to 54 Years | 82 (98.8%) | 89 (86.4%) |
| 55 to 64 Years | 131 (87.3%) | 163 (97.6%) |
| 65 to 74 Years | 55 (98.2%) | 58 (79.4%) |
| 75 Years and over | 29 (100.0%) | 22 (84.6%) |
| Total | 965 (92.3%) | 935 (85.5%) |
Income Below Poverty Among Married-Couple Families in Dillingham
The poverty statistics for married-couple families in Dillingham show that 4.6% or 12 of the total 260 families live below the poverty line. Families with 1 or 2 children have the highest poverty rate of 7.7%, comprising of 7 families. On the other hand, families with 5 or more children have the lowest poverty rate of 0.0%, which includes 0 families.
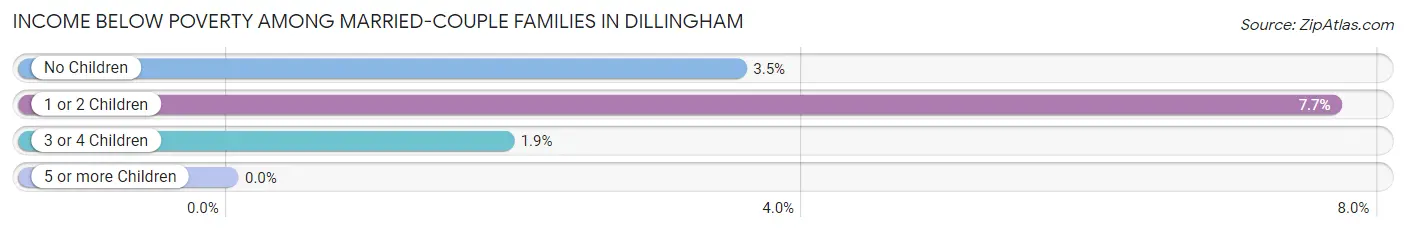
| Children | Above Poverty | Below Poverty |
| No Children | 109 (96.5%) | 4 (3.5%) |
| 1 or 2 Children | 84 (92.3%) | 7 (7.7%) |
| 3 or 4 Children | 51 (98.1%) | 1 (1.9%) |
| 5 or more Children | 4 (100.0%) | 0 (0.0%) |
| Total | 248 (95.4%) | 12 (4.6%) |
Income Below Poverty Among Single-Parent Households in Dillingham
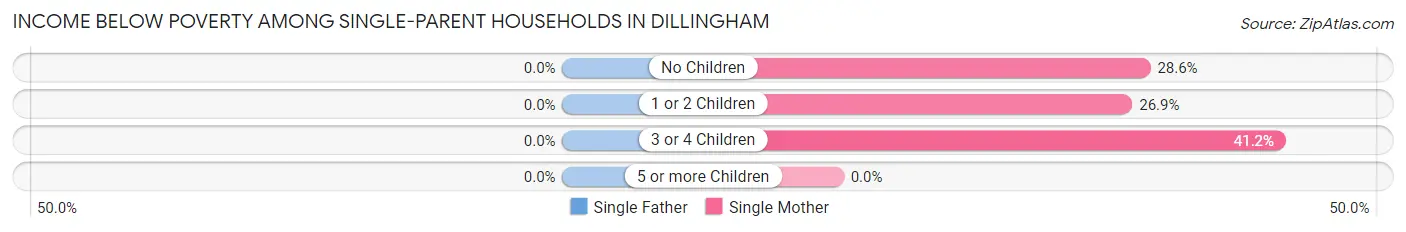
| Children | Single Father | Single Mother |
| No Children | 0 (0.0%) | 10 (28.6%) |
| 1 or 2 Children | 0 (0.0%) | 25 (26.9%) |
| 3 or 4 Children | 0 (0.0%) | 14 (41.2%) |
| 5 or more Children | 0 (0.0%) | 0 (0.0%) |
| Total | 0 (0.0%) | 49 (30.1%) |
Income Below Poverty Among Married-Couple vs Single-Parent Households in Dillingham
The poverty data for Dillingham shows that 12 of the married-couple family households (4.6%) and 49 of the single-parent households (21.3%) are living below the poverty level. Within the married-couple family households, those with 1 or 2 children have the highest poverty rate, with 7 households (7.7%) falling below the poverty line. Among the single-parent households, those with 3 or 4 children have the highest poverty rate, with 14 household (31.8%) living below poverty.
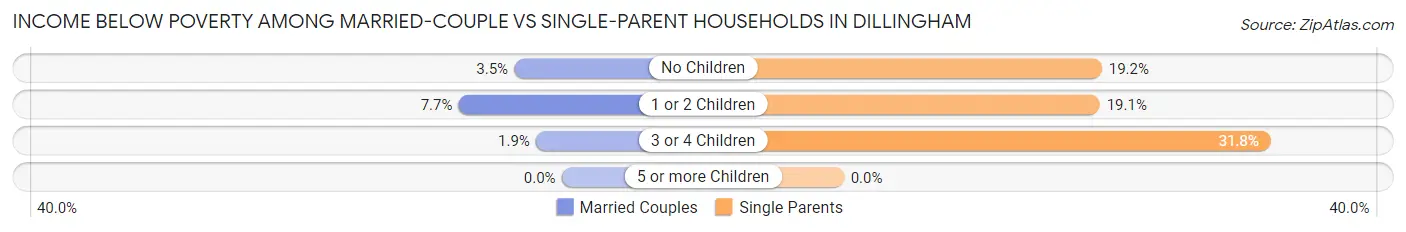
| Children | Married-Couple Families | Single-Parent Households |
| No Children | 4 (3.5%) | 10 (19.2%) |
| 1 or 2 Children | 7 (7.7%) | 25 (19.1%) |
| 3 or 4 Children | 1 (1.9%) | 14 (31.8%) |
| 5 or more Children | 0 (0.0%) | 0 (0.0%) |
| Total | 12 (4.6%) | 49 (21.3%) |
Race in Dillingham
The most populous races in Dillingham are Native / Alaskan (1,235 | 56.8%), White / Caucasian (550 | 25.3%), and Two or more Races (313 | 14.4%).
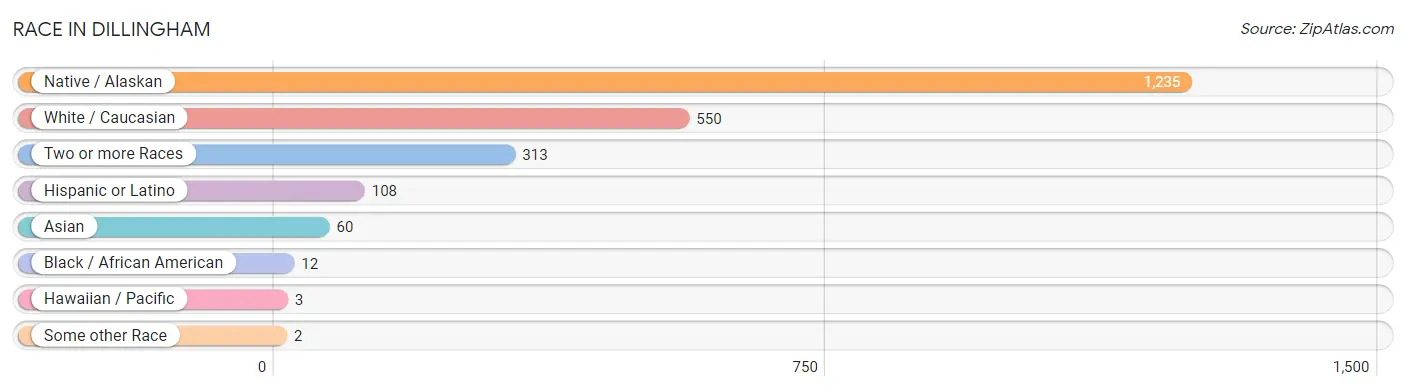
| Race | # Population | % Population |
| Asian | 60 | 2.8% |
| Black / African American | 12 | 0.5% |
| Hawaiian / Pacific | 3 | 0.1% |
| Hispanic or Latino | 108 | 5.0% |
| Native / Alaskan | 1,235 | 56.8% |
| White / Caucasian | 550 | 25.3% |
| Two or more Races | 313 | 14.4% |
| Some other Race | 2 | 0.1% |
| Total | 2,175 | 100.0% |
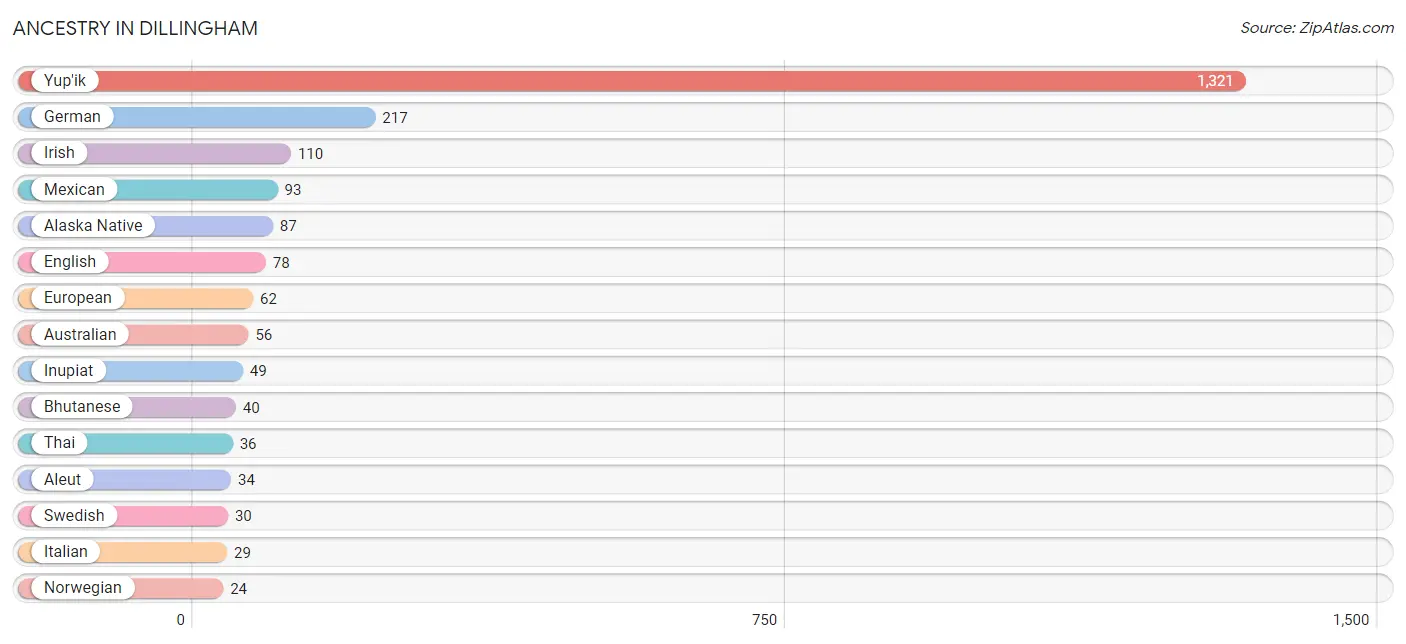
Ancestry in Dillingham
The most populous ancestries reported in Dillingham are Yup'ik (1,321 | 60.7%), German (217 | 10.0%), Irish (110 | 5.1%), Mexican (93 | 4.3%), and Alaska Native (87 | 4.0%), together accounting for 84.1% of all Dillingham residents.
| Ancestry | # Population | % Population |
| African | 4 | 0.2% |
| Alaska Native | 87 | 4.0% |
| Alaskan Athabascan | 16 | 0.7% |
| Aleut | 34 | 1.6% |
| Arab | 1 | 0.1% |
| Australian | 56 | 2.6% |
| Austrian | 4 | 0.2% |
| Belgian | 2 | 0.1% |
| Bhutanese | 40 | 1.8% |
| Burmese | 1 | 0.1% |
| Canadian | 1 | 0.1% |
| Croatian | 6 | 0.3% |
| Czech | 1 | 0.1% |
| Danish | 12 | 0.5% |
| Dominican | 3 | 0.1% |
| Dutch | 19 | 0.9% |
| Eastern European | 1 | 0.1% |
| English | 78 | 3.6% |
| European | 62 | 2.9% |
| French | 14 | 0.6% |
| French Canadian | 9 | 0.4% |
| German | 217 | 10.0% |
| Greek | 2 | 0.1% |
| Houma | 3 | 0.1% |
| Inupiat | 49 | 2.2% |
| Irish | 110 | 5.1% |
| Italian | 29 | 1.3% |
| Jamaican | 2 | 0.1% |
| Korean | 13 | 0.6% |
| Lithuanian | 1 | 0.1% |
| Mexican | 93 | 4.3% |
| Norwegian | 24 | 1.1% |
| Polish | 11 | 0.5% |
| Puerto Rican | 6 | 0.3% |
| Russian | 7 | 0.3% |
| Samoan | 14 | 0.6% |
| Scandinavian | 3 | 0.1% |
| Scotch-Irish | 3 | 0.1% |
| Scottish | 5 | 0.2% |
| Sioux | 10 | 0.5% |
| Spaniard | 6 | 0.3% |
| Subsaharan African | 16 | 0.7% |
| Sudanese | 7 | 0.3% |
| Swedish | 30 | 1.4% |
| Swiss | 22 | 1.0% |
| Syrian | 1 | 0.1% |
| Thai | 36 | 1.7% |
| Ukrainian | 1 | 0.1% |
| Welsh | 9 | 0.4% |
| Yup'ik | 1,321 | 60.7% | View All 50 Rows |
Immigrants in Dillingham
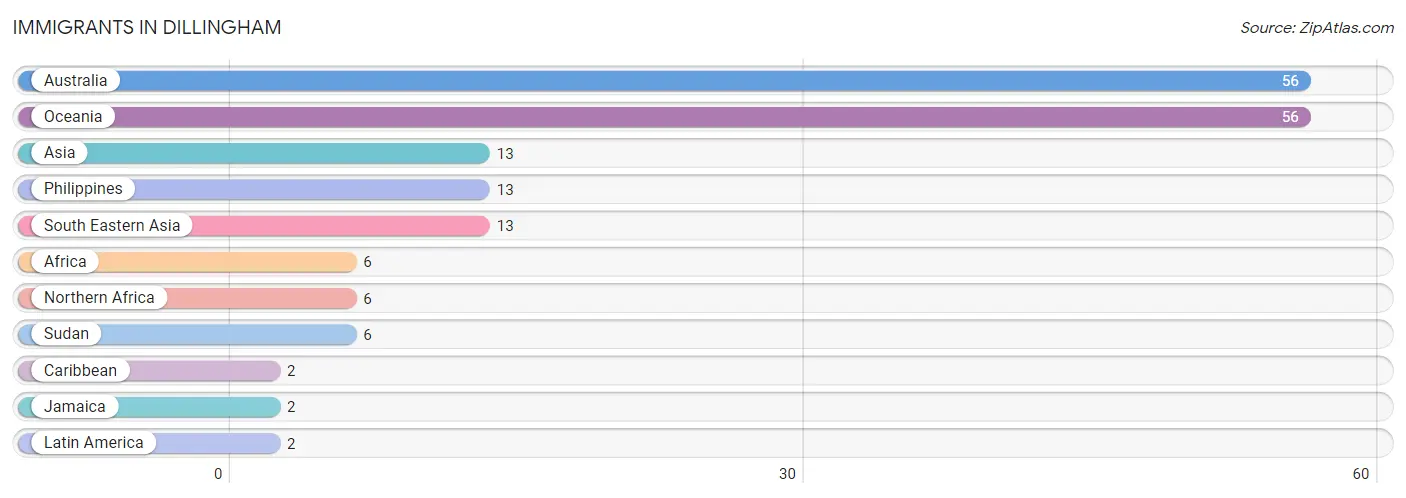
The most numerous immigrant groups reported in Dillingham came from Australia (56 | 2.6%), Oceania (56 | 2.6%), Asia (13 | 0.6%), Philippines (13 | 0.6%), and South Eastern Asia (13 | 0.6%), together accounting for 6.9% of all Dillingham residents.
| Immigration Origin | # Population | % Population |
| Africa | 6 | 0.3% |
| Asia | 13 | 0.6% |
| Australia | 56 | 2.6% |
| Caribbean | 2 | 0.1% |
| Jamaica | 2 | 0.1% |
| Latin America | 2 | 0.1% |
| Northern Africa | 6 | 0.3% |
| Oceania | 56 | 2.6% |
| Philippines | 13 | 0.6% |
| South Eastern Asia | 13 | 0.6% |
| Sudan | 6 | 0.3% | View All 11 Rows |
Sex and Age in Dillingham
Sex and Age in Dillingham
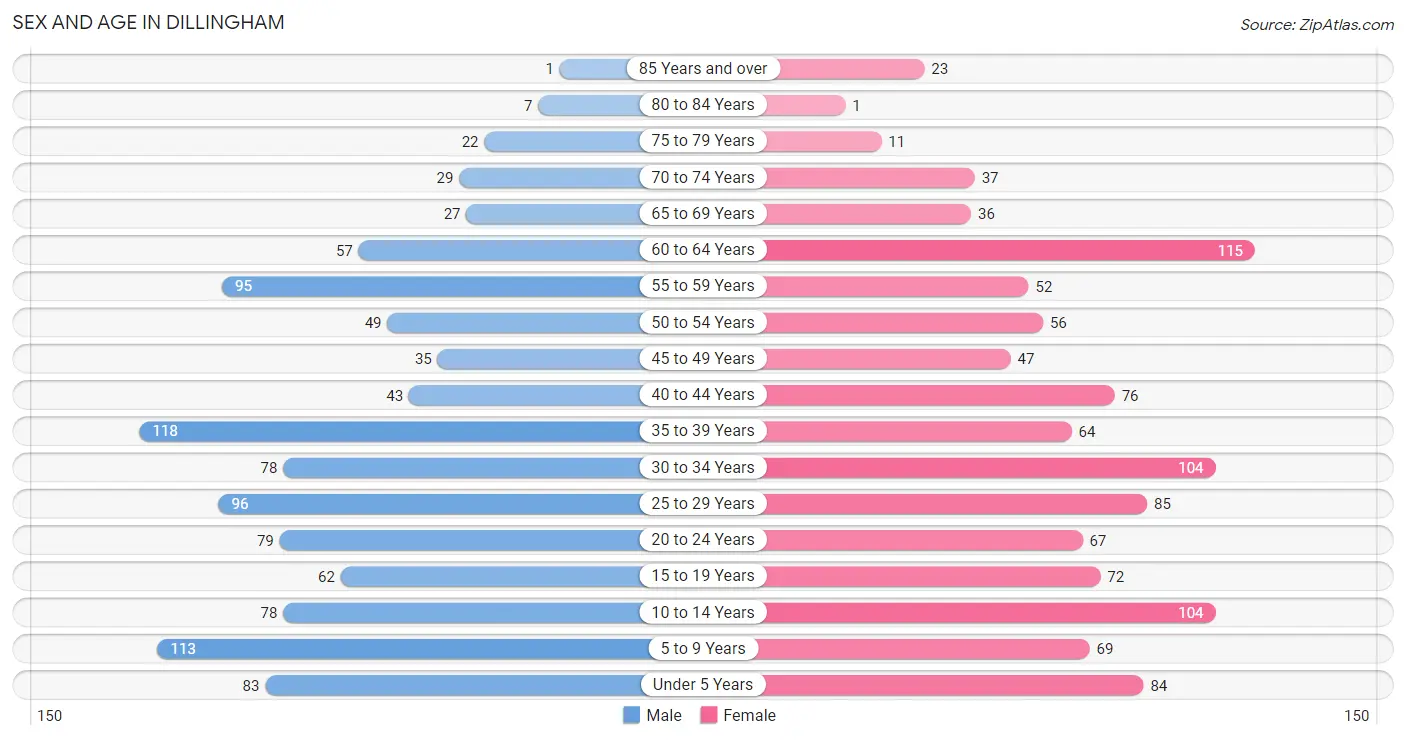
The most populous age groups in Dillingham are 35 to 39 Years (118 | 11.0%) for men and 60 to 64 Years (115 | 10.4%) for women.
| Age Bracket | Male | Female |
| Under 5 Years | 83 (7.7%) | 84 (7.6%) |
| 5 to 9 Years | 113 (10.5%) | 69 (6.3%) |
| 10 to 14 Years | 78 (7.3%) | 104 (9.4%) |
| 15 to 19 Years | 62 (5.8%) | 72 (6.5%) |
| 20 to 24 Years | 79 (7.4%) | 67 (6.1%) |
| 25 to 29 Years | 96 (9.0%) | 85 (7.7%) |
| 30 to 34 Years | 78 (7.3%) | 104 (9.4%) |
| 35 to 39 Years | 118 (11.0%) | 64 (5.8%) |
| 40 to 44 Years | 43 (4.0%) | 76 (6.9%) |
| 45 to 49 Years | 35 (3.3%) | 47 (4.3%) |
| 50 to 54 Years | 49 (4.6%) | 56 (5.1%) |
| 55 to 59 Years | 95 (8.9%) | 52 (4.7%) |
| 60 to 64 Years | 57 (5.3%) | 115 (10.4%) |
| 65 to 69 Years | 27 (2.5%) | 36 (3.3%) |
| 70 to 74 Years | 29 (2.7%) | 37 (3.4%) |
| 75 to 79 Years | 22 (2.1%) | 11 (1.0%) |
| 80 to 84 Years | 7 (0.6%) | 1 (0.1%) |
| 85 Years and over | 1 (0.1%) | 23 (2.1%) |
| Total | 1,072 (100.0%) | 1,103 (100.0%) |
Families and Households in Dillingham
Median Family Size in Dillingham
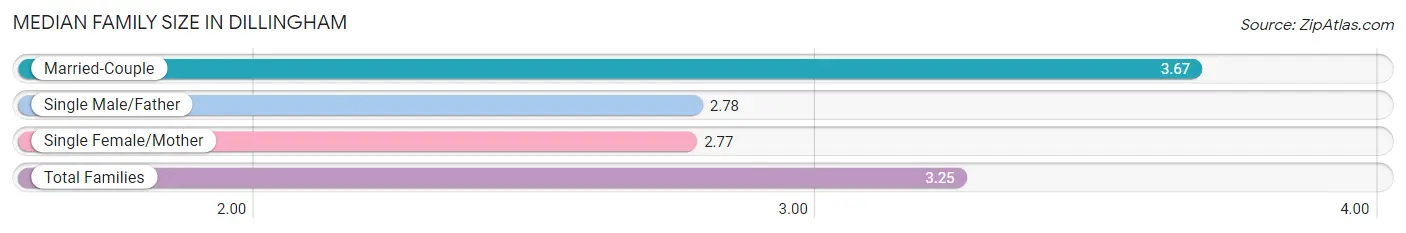
The median family size in Dillingham is 3.25 persons per family, with married-couple families (260 | 53.1%) accounting for the largest median family size of 3.67 persons per family. On the other hand, single female/mother families (163 | 33.3%) represent the smallest median family size with 2.77 persons per family.
| Family Type | # Families | Family Size |
| Married-Couple | 260 (53.1%) | 3.67 |
| Single Male/Father | 67 (13.7%) | 2.78 |
| Single Female/Mother | 163 (33.3%) | 2.77 |
| Total Families | 490 (100.0%) | 3.25 |
Median Household Size in Dillingham
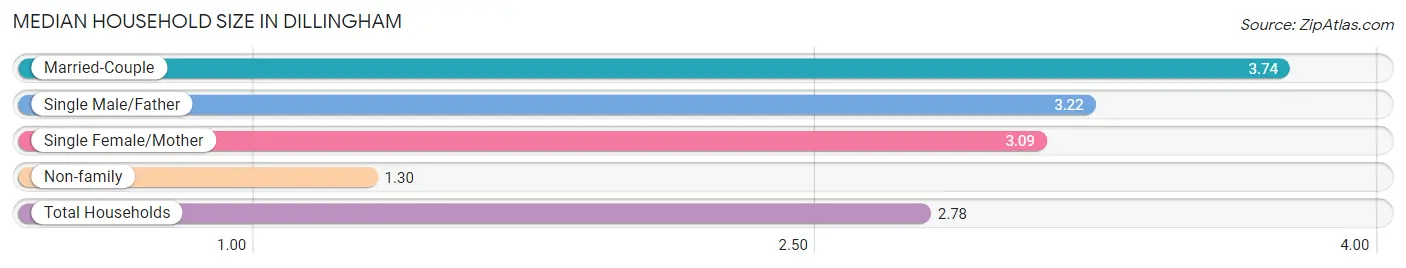
The median household size in Dillingham is 2.78 persons per household, with married-couple households (260 | 36.5%) accounting for the largest median household size of 3.74 persons per household. non-family households (223 | 31.3%) represent the smallest median household size with 1.30 persons per household.
| Household Type | # Households | Household Size |
| Married-Couple | 260 (36.5%) | 3.74 |
| Single Male/Father | 67 (9.4%) | 3.22 |
| Single Female/Mother | 163 (22.9%) | 3.09 |
| Non-family | 223 (31.3%) | 1.30 |
| Total Households | 713 (100.0%) | 2.78 |
Household Size by Marriage Status in Dillingham
Out of a total of 713 households in Dillingham, 490 (68.7%) are family households, while 223 (31.3%) are nonfamily households. The most numerous type of family households are 2-person households, comprising 177, and the most common type of nonfamily households are 1-person households, comprising 161.
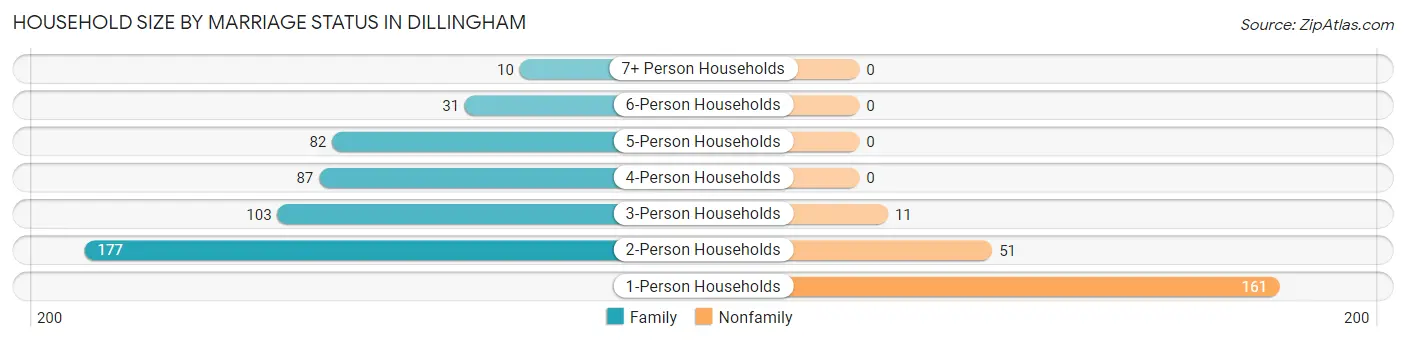
| Household Size | Family Households | Nonfamily Households |
| 1-Person Households | - | 161 (22.6%) |
| 2-Person Households | 177 (24.8%) | 51 (7.1%) |
| 3-Person Households | 103 (14.4%) | 11 (1.5%) |
| 4-Person Households | 87 (12.2%) | 0 (0.0%) |
| 5-Person Households | 82 (11.5%) | 0 (0.0%) |
| 6-Person Households | 31 (4.3%) | 0 (0.0%) |
| 7+ Person Households | 10 (1.4%) | 0 (0.0%) |
| Total | 490 (68.7%) | 223 (31.3%) |
Female Fertility in Dillingham
Fertility by Age in Dillingham
Average fertility rate in Dillingham is 81.0 births per 1,000 women. Women in the age bracket of 20 to 34 years have the highest fertility rate with 164.0 births per 1,000 women. Women in the age bracket of 20 to 34 years acount for 97.7% of all women with births.
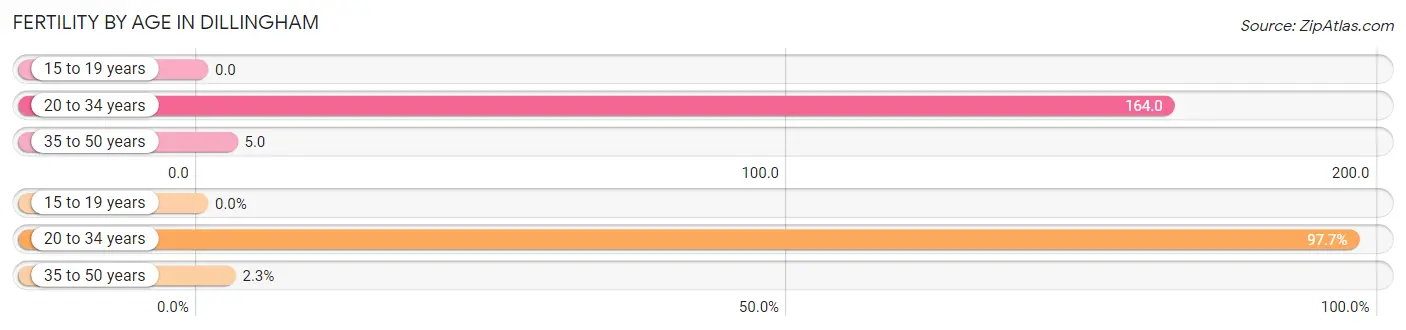
| Age Bracket | Women with Births | Births / 1,000 Women |
| 15 to 19 years | 0 (0.0%) | 0.0 |
| 20 to 34 years | 42 (97.7%) | 164.0 |
| 35 to 50 years | 1 (2.3%) | 5.0 |
| Total | 43 (100.0%) | 81.0 |
Fertility by Age by Marriage Status in Dillingham
51.2% of women with births (43) in Dillingham are married. The highest percentage of unmarried women with births falls into 35 to 50 years age bracket with 100.0% of them unmarried at the time of birth, while the lowest percentage of unmarried women with births belong to 20 to 34 years age bracket with 47.6% of them unmarried.
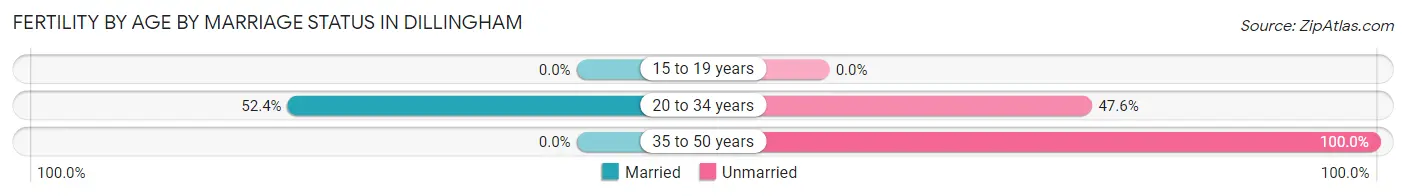
| Age Bracket | Married | Unmarried |
| 15 to 19 years | 0 (0.0%) | 0 (0.0%) |
| 20 to 34 years | 22 (52.4%) | 20 (47.6%) |
| 35 to 50 years | 0 (0.0%) | 1 (100.0%) |
| Total | 22 (51.2%) | 21 (48.8%) |
Fertility by Education in Dillingham
Average fertility rate in Dillingham is 81.0 births per 1,000 women. Women with the education attainment of graduate degree have the highest fertility rate of 133.0 births per 1,000 women, while women with the education attainment of less than high school have the lowest fertility at 32.0 births per 1,000 women. Women with the education attainment of college or associate's degree represent 44.2% of all women with births.
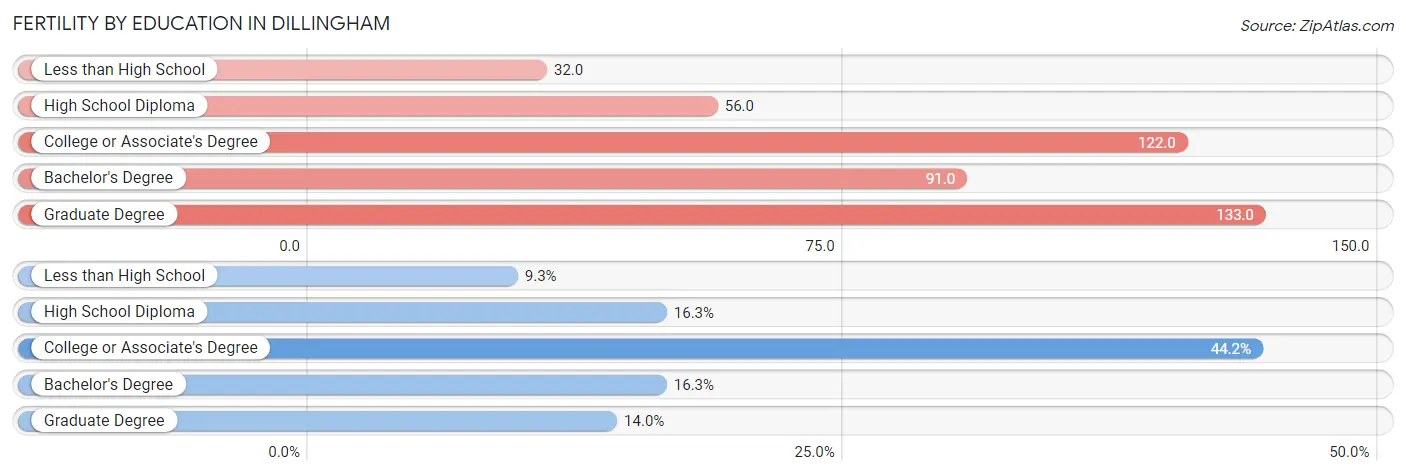
| Educational Attainment | Women with Births | Births / 1,000 Women |
| Less than High School | 4 (9.3%) | 32.0 |
| High School Diploma | 7 (16.3%) | 56.0 |
| College or Associate's Degree | 19 (44.2%) | 122.0 |
| Bachelor's Degree | 7 (16.3%) | 91.0 |
| Graduate Degree | 6 (14.0%) | 133.0 |
| Total | 43 (100.0%) | 81.0 |
Fertility by Education by Marriage Status in Dillingham
48.8% of women with births in Dillingham are unmarried. Women with the educational attainment of graduate degree are most likely to be married with 100.0% of them married at childbirth, while women with the educational attainment of less than high school are least likely to be married with 100.0% of them unmarried at childbirth.
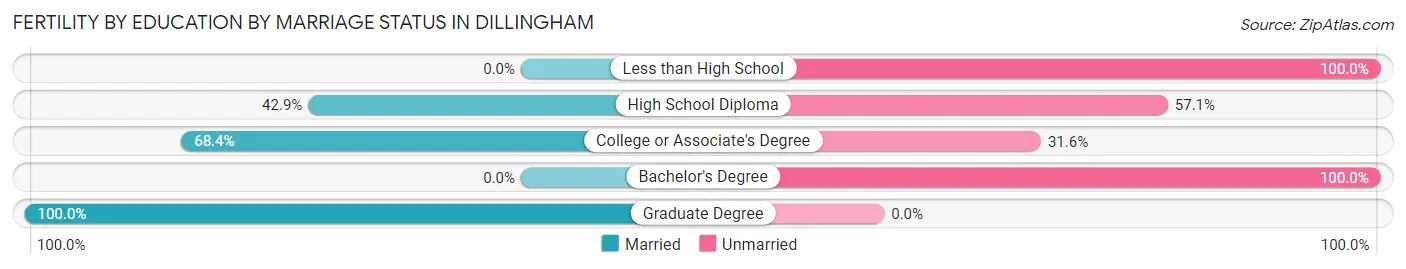
| Educational Attainment | Married | Unmarried |
| Less than High School | 0 (0.0%) | 4 (100.0%) |
| High School Diploma | 3 (42.9%) | 4 (57.1%) |
| College or Associate's Degree | 13 (68.4%) | 6 (31.6%) |
| Bachelor's Degree | 0 (0.0%) | 7 (100.0%) |
| Graduate Degree | 6 (100.0%) | 0 (0.0%) |
| Total | 22 (51.2%) | 21 (48.8%) |
Employment Characteristics in Dillingham
Employment by Class of Employer in Dillingham
Among the 1,039 employed individuals in Dillingham, not-for-profit organizations (332 | 32.0%), private company employees (327 | 31.5%), and local government employees (197 | 19.0%) make up the most common classes of employment.
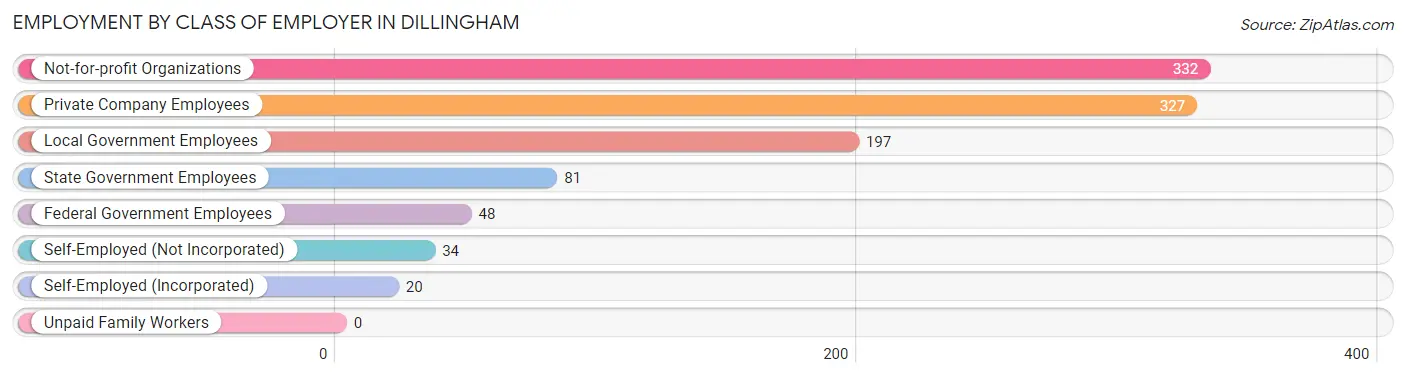
| Employer Class | # Employees | % Employees |
| Private Company Employees | 327 | 31.5% |
| Self-Employed (Incorporated) | 20 | 1.9% |
| Self-Employed (Not Incorporated) | 34 | 3.3% |
| Not-for-profit Organizations | 332 | 32.0% |
| Local Government Employees | 197 | 19.0% |
| State Government Employees | 81 | 7.8% |
| Federal Government Employees | 48 | 4.6% |
| Unpaid Family Workers | 0 | 0.0% |
| Total | 1,039 | 100.0% |
Employment Status by Age in Dillingham
According to the labor force statistics for Dillingham, out of the total population over 16 years of age (1,616), 71.8% or 1,160 individuals are in the labor force, with 7.1% or 82 of them unemployed. The age group with the highest labor force participation rate is 25 to 29 years, with 86.7% or 157 individuals in the labor force. Within the labor force, the 25 to 29 years age range has the highest percentage of unemployed individuals, with 17.2% or 27 of them being unemployed.
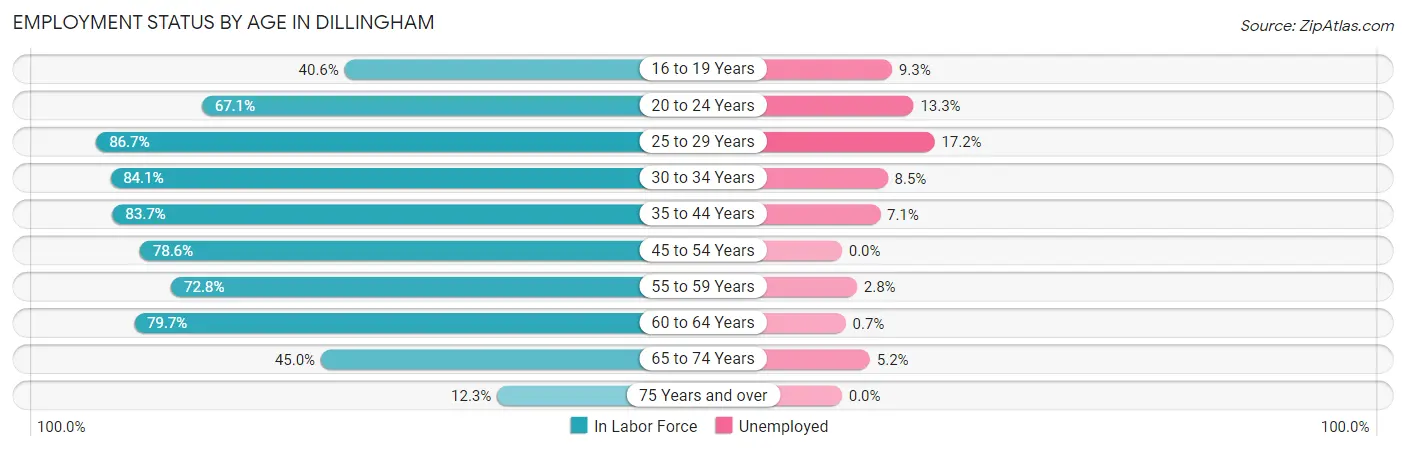
| Age Bracket | In Labor Force | Unemployed |
| 16 to 19 Years | 43 (40.6%) | 4 (9.3%) |
| 20 to 24 Years | 98 (67.1%) | 13 (13.3%) |
| 25 to 29 Years | 157 (86.7%) | 27 (17.2%) |
| 30 to 34 Years | 153 (84.1%) | 13 (8.5%) |
| 35 to 44 Years | 252 (83.7%) | 18 (7.1%) |
| 45 to 54 Years | 147 (78.6%) | 0 (0.0%) |
| 55 to 59 Years | 107 (72.8%) | 3 (2.8%) |
| 60 to 64 Years | 137 (79.7%) | 1 (0.7%) |
| 65 to 74 Years | 58 (45.0%) | 3 (5.2%) |
| 75 Years and over | 8 (12.3%) | 0 (0.0%) |
| Total | 1,160 (71.8%) | 82 (7.1%) |
Employment Status by Educational Attainment in Dillingham
According to labor force statistics for Dillingham, 81.5% of individuals (954) out of the total population between 25 and 64 years of age (1,170) are in the labor force, with 6.5% or 62 of them being unemployed. The group with the highest labor force participation rate are those with the educational attainment of bachelor's degree or higher, with 94.1% or 255 individuals in the labor force. Within the labor force, individuals with less than high school education have the highest percentage of unemployment, with 28.6% or 10 of them being unemployed.
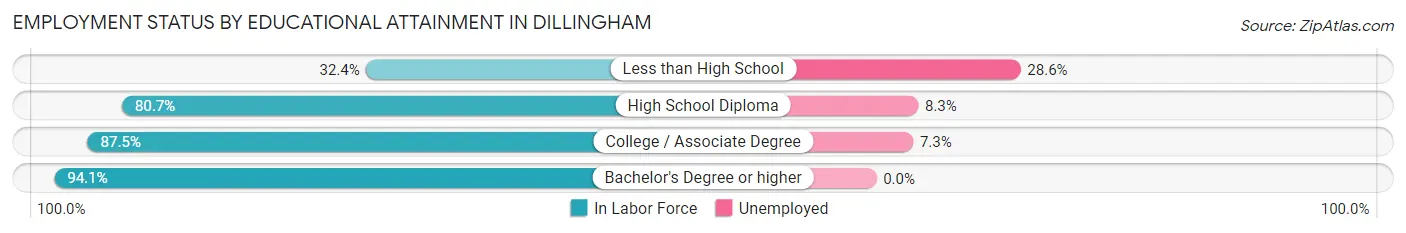
| Educational Attainment | In Labor Force | Unemployed |
| Less than High School | 35 (32.4%) | 31 (28.6%) |
| High School Diploma | 348 (80.7%) | 36 (8.3%) |
| College / Associate Degree | 315 (87.5%) | 26 (7.3%) |
| Bachelor's Degree or higher | 255 (94.1%) | 0 (0.0%) |
| Total | 954 (81.5%) | 76 (6.5%) |
Employment Occupations by Sex in Dillingham
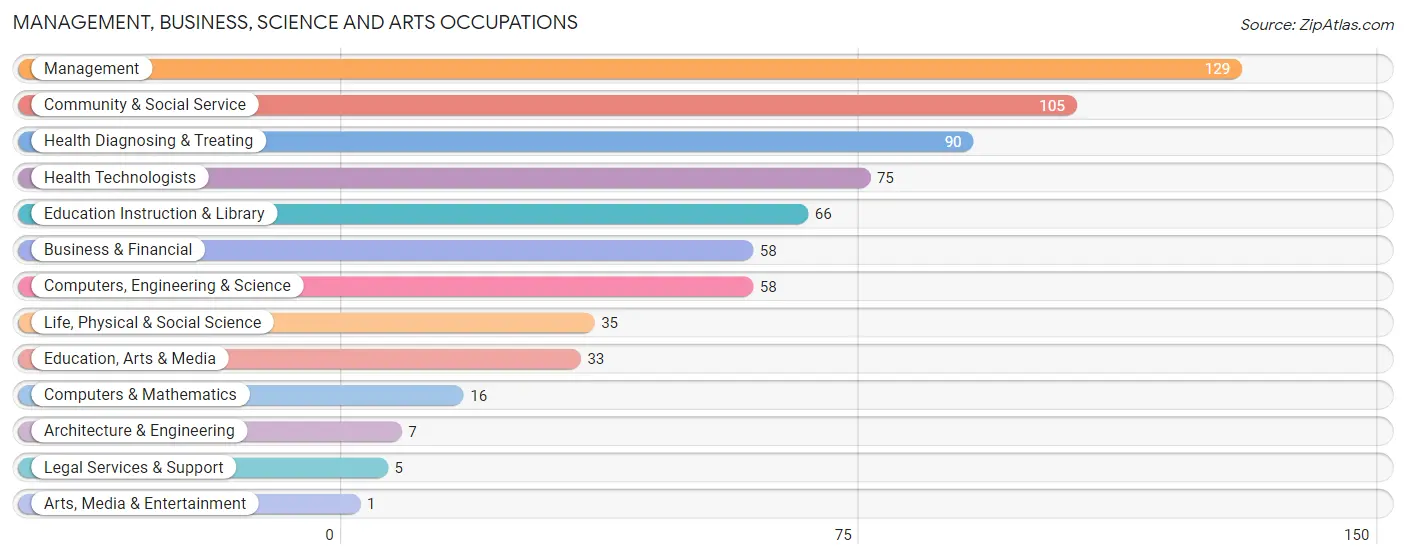
Management, Business, Science and Arts Occupations
The most common Management, Business, Science and Arts occupations in Dillingham are Management (129 | 12.0%), Community & Social Service (105 | 9.7%), Health Diagnosing & Treating (90 | 8.4%), Health Technologists (75 | 7.0%), and Education Instruction & Library (66 | 6.1%).
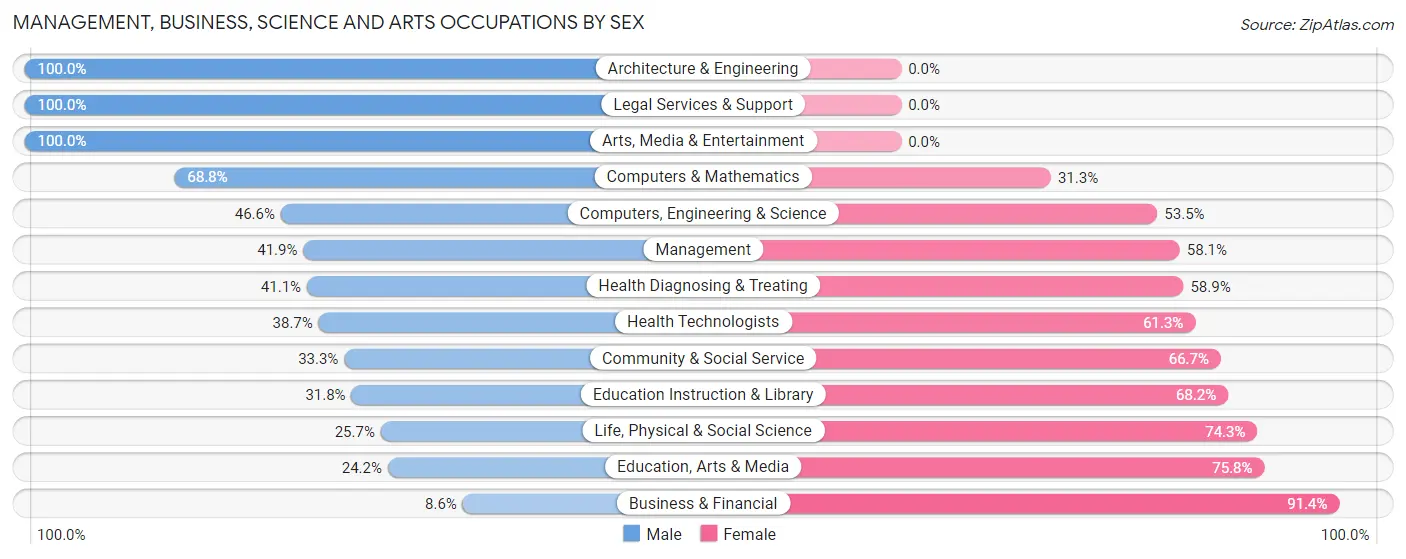
Management, Business, Science and Arts Occupations by Sex
Within the Management, Business, Science and Arts occupations in Dillingham, the most male-oriented occupations are Architecture & Engineering (100.0%), Legal Services & Support (100.0%), and Arts, Media & Entertainment (100.0%), while the most female-oriented occupations are Business & Financial (91.4%), Education, Arts & Media (75.8%), and Life, Physical & Social Science (74.3%).
| Occupation | Male | Female |
| Management | 54 (41.9%) | 75 (58.1%) |
| Business & Financial | 5 (8.6%) | 53 (91.4%) |
| Computers, Engineering & Science | 27 (46.6%) | 31 (53.4%) |
| Computers & Mathematics | 11 (68.8%) | 5 (31.2%) |
| Architecture & Engineering | 7 (100.0%) | 0 (0.0%) |
| Life, Physical & Social Science | 9 (25.7%) | 26 (74.3%) |
| Community & Social Service | 35 (33.3%) | 70 (66.7%) |
| Education, Arts & Media | 8 (24.2%) | 25 (75.8%) |
| Legal Services & Support | 5 (100.0%) | 0 (0.0%) |
| Education Instruction & Library | 21 (31.8%) | 45 (68.2%) |
| Arts, Media & Entertainment | 1 (100.0%) | 0 (0.0%) |
| Health Diagnosing & Treating | 37 (41.1%) | 53 (58.9%) |
| Health Technologists | 29 (38.7%) | 46 (61.3%) |
| Total (Category) | 158 (35.9%) | 282 (64.1%) |
| Total (Overall) | 568 (52.7%) | 510 (47.3%) |
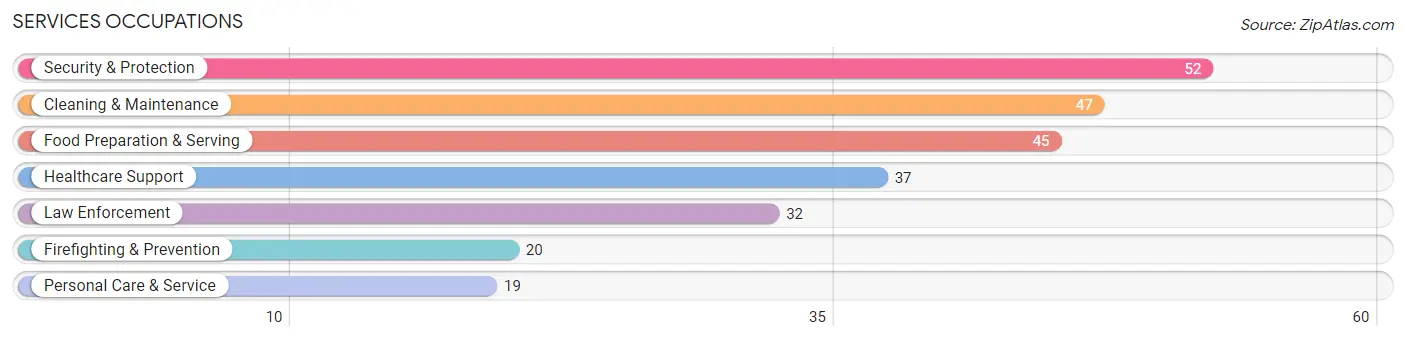
Services Occupations
The most common Services occupations in Dillingham are Security & Protection (52 | 4.8%), Cleaning & Maintenance (47 | 4.4%), Food Preparation & Serving (45 | 4.2%), Healthcare Support (37 | 3.4%), and Law Enforcement (32 | 3.0%).
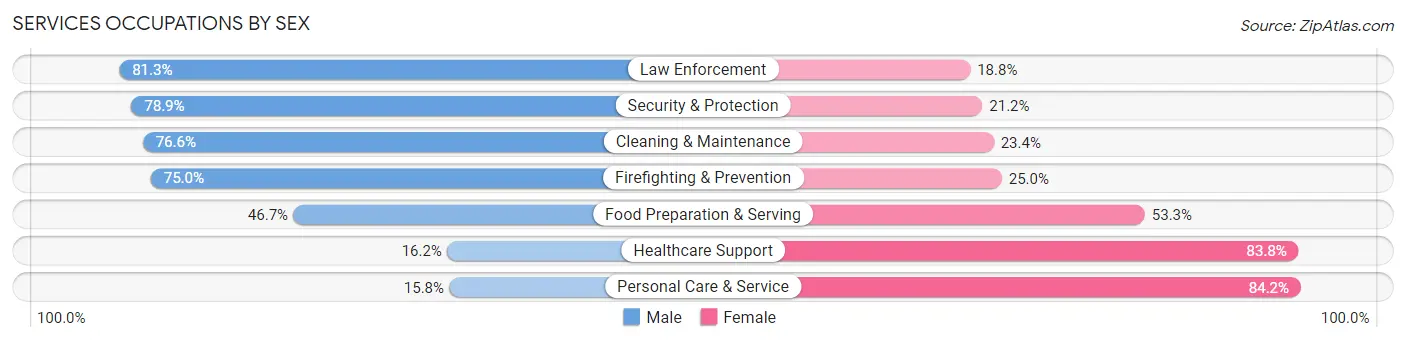
Services Occupations by Sex
Within the Services occupations in Dillingham, the most male-oriented occupations are Law Enforcement (81.2%), Security & Protection (78.8%), and Cleaning & Maintenance (76.6%), while the most female-oriented occupations are Personal Care & Service (84.2%), Healthcare Support (83.8%), and Food Preparation & Serving (53.3%).
| Occupation | Male | Female |
| Healthcare Support | 6 (16.2%) | 31 (83.8%) |
| Security & Protection | 41 (78.8%) | 11 (21.1%) |
| Firefighting & Prevention | 15 (75.0%) | 5 (25.0%) |
| Law Enforcement | 26 (81.2%) | 6 (18.8%) |
| Food Preparation & Serving | 21 (46.7%) | 24 (53.3%) |
| Cleaning & Maintenance | 36 (76.6%) | 11 (23.4%) |
| Personal Care & Service | 3 (15.8%) | 16 (84.2%) |
| Total (Category) | 107 (53.5%) | 93 (46.5%) |
| Total (Overall) | 568 (52.7%) | 510 (47.3%) |
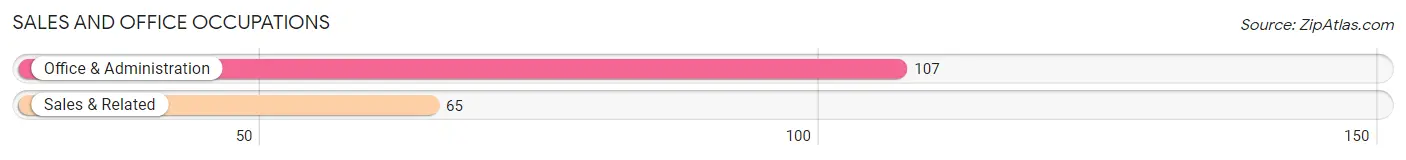
Sales and Office Occupations
The most common Sales and Office occupations in Dillingham are Office & Administration (107 | 9.9%), and Sales & Related (65 | 6.0%).
Sales and Office Occupations by Sex
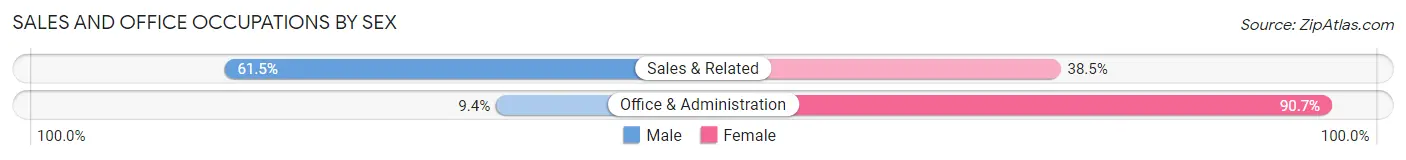
| Occupation | Male | Female |
| Sales & Related | 40 (61.5%) | 25 (38.5%) |
| Office & Administration | 10 (9.3%) | 97 (90.6%) |
| Total (Category) | 50 (29.1%) | 122 (70.9%) |
| Total (Overall) | 568 (52.7%) | 510 (47.3%) |
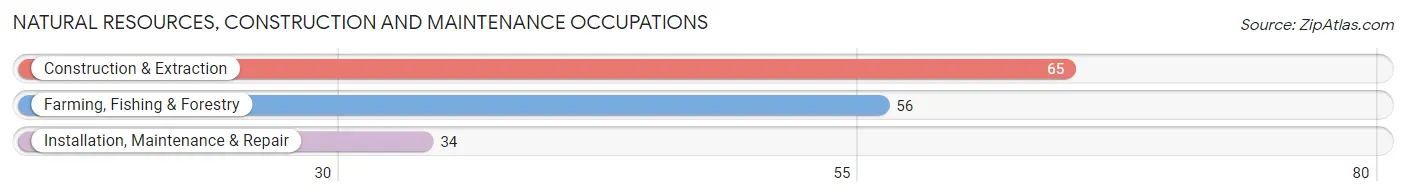
Natural Resources, Construction and Maintenance Occupations
The most common Natural Resources, Construction and Maintenance occupations in Dillingham are Construction & Extraction (65 | 6.0%), Farming, Fishing & Forestry (56 | 5.2%), and Installation, Maintenance & Repair (34 | 3.2%).
Natural Resources, Construction and Maintenance Occupations by Sex
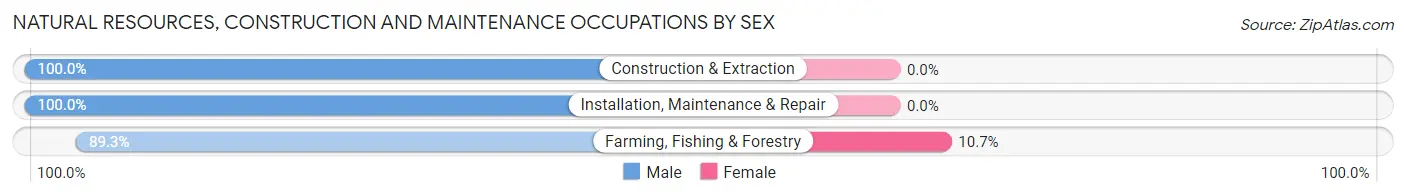
| Occupation | Male | Female |
| Farming, Fishing & Forestry | 50 (89.3%) | 6 (10.7%) |
| Construction & Extraction | 65 (100.0%) | 0 (0.0%) |
| Installation, Maintenance & Repair | 34 (100.0%) | 0 (0.0%) |
| Total (Category) | 149 (96.1%) | 6 (3.9%) |
| Total (Overall) | 568 (52.7%) | 510 (47.3%) |
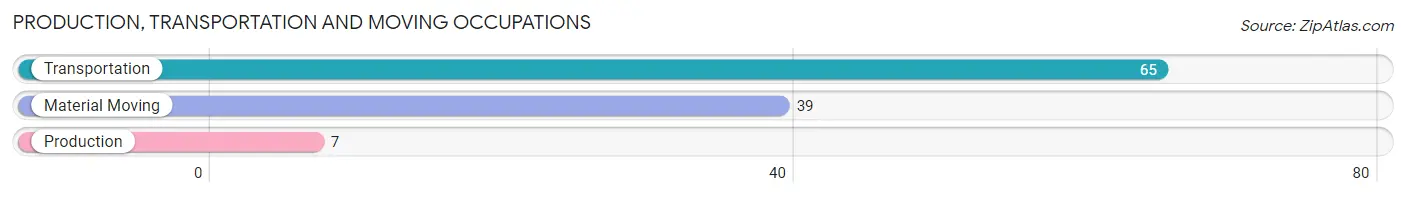
Production, Transportation and Moving Occupations
The most common Production, Transportation and Moving occupations in Dillingham are Transportation (65 | 6.0%), Material Moving (39 | 3.6%), and Production (7 | 0.6%).
Production, Transportation and Moving Occupations by Sex
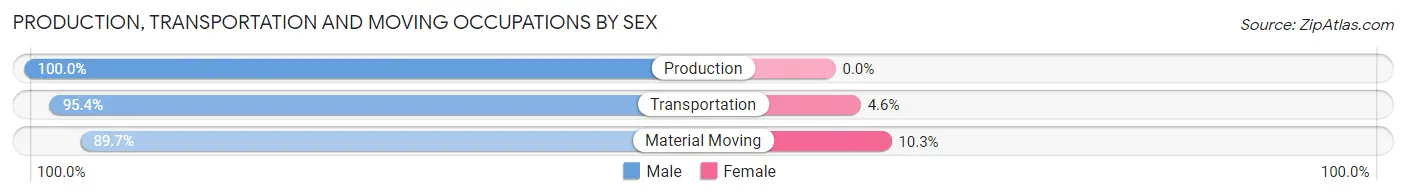
| Occupation | Male | Female |
| Production | 7 (100.0%) | 0 (0.0%) |
| Transportation | 62 (95.4%) | 3 (4.6%) |
| Material Moving | 35 (89.7%) | 4 (10.3%) |
| Total (Category) | 104 (93.7%) | 7 (6.3%) |
| Total (Overall) | 568 (52.7%) | 510 (47.3%) |
Employment Industries by Sex in Dillingham
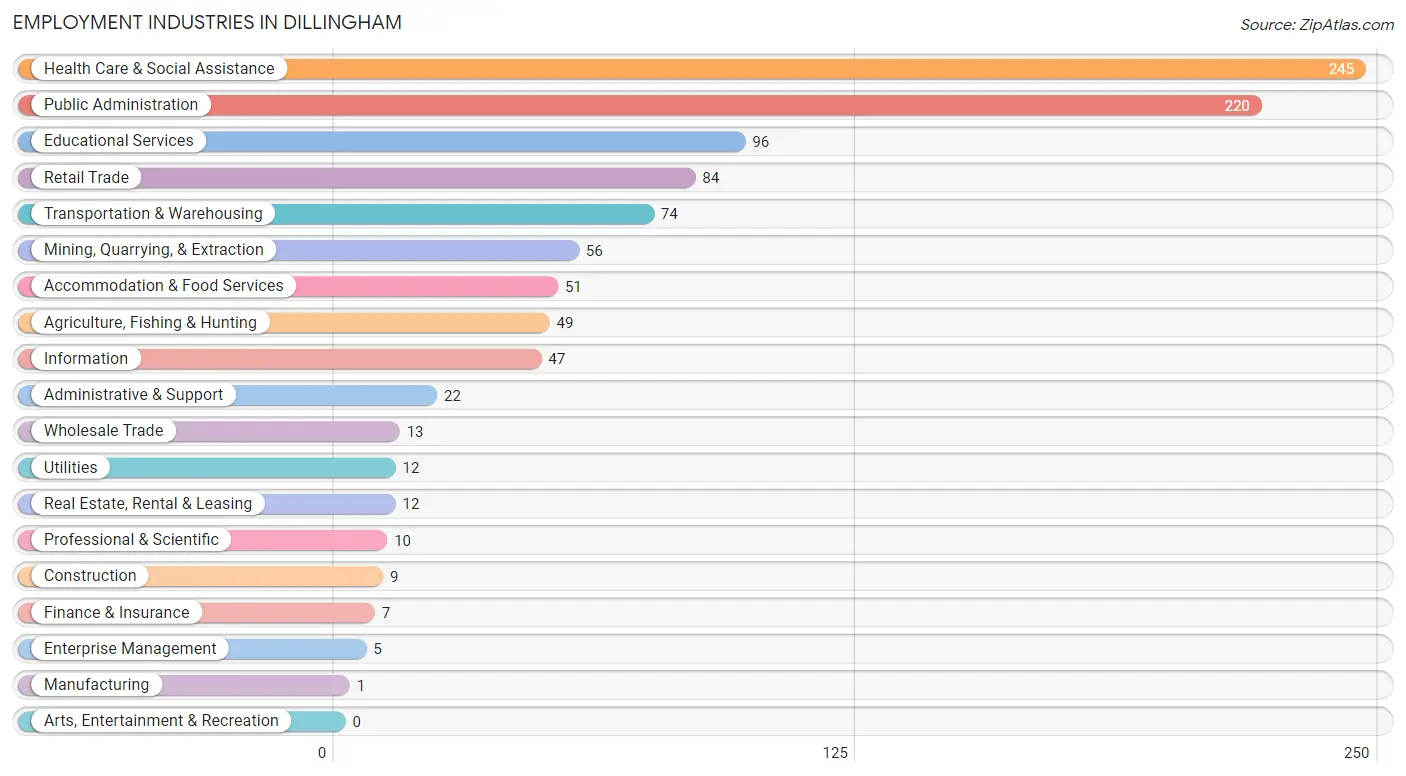
Employment Industries in Dillingham
The major employment industries in Dillingham include Health Care & Social Assistance (245 | 22.7%), Public Administration (220 | 20.4%), Educational Services (96 | 8.9%), Retail Trade (84 | 7.8%), and Transportation & Warehousing (74 | 6.9%).
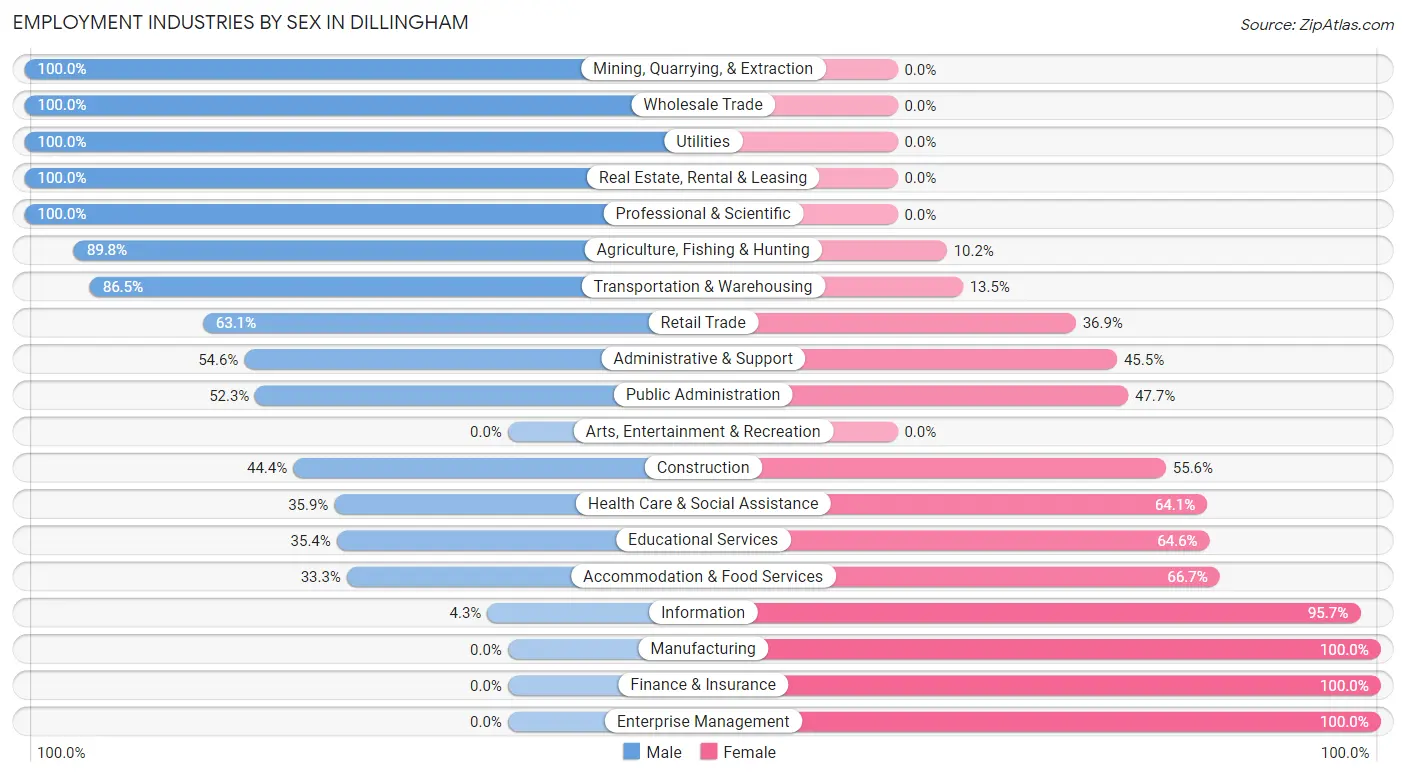
Employment Industries by Sex in Dillingham
The Dillingham industries that see more men than women are Mining, Quarrying, & Extraction (100.0%), Wholesale Trade (100.0%), and Utilities (100.0%), whereas the industries that tend to have a higher number of women are Manufacturing (100.0%), Finance & Insurance (100.0%), and Enterprise Management (100.0%).
| Industry | Male | Female |
| Agriculture, Fishing & Hunting | 44 (89.8%) | 5 (10.2%) |
| Mining, Quarrying, & Extraction | 56 (100.0%) | 0 (0.0%) |
| Construction | 4 (44.4%) | 5 (55.6%) |
| Manufacturing | 0 (0.0%) | 1 (100.0%) |
| Wholesale Trade | 13 (100.0%) | 0 (0.0%) |
| Retail Trade | 53 (63.1%) | 31 (36.9%) |
| Transportation & Warehousing | 64 (86.5%) | 10 (13.5%) |
| Utilities | 12 (100.0%) | 0 (0.0%) |
| Information | 2 (4.3%) | 45 (95.7%) |
| Finance & Insurance | 0 (0.0%) | 7 (100.0%) |
| Real Estate, Rental & Leasing | 12 (100.0%) | 0 (0.0%) |
| Professional & Scientific | 10 (100.0%) | 0 (0.0%) |
| Enterprise Management | 0 (0.0%) | 5 (100.0%) |
| Administrative & Support | 12 (54.5%) | 10 (45.5%) |
| Educational Services | 34 (35.4%) | 62 (64.6%) |
| Health Care & Social Assistance | 88 (35.9%) | 157 (64.1%) |
| Arts, Entertainment & Recreation | 0 (0.0%) | 0 (0.0%) |
| Accommodation & Food Services | 17 (33.3%) | 34 (66.7%) |
| Public Administration | 115 (52.3%) | 105 (47.7%) |
| Total | 568 (52.7%) | 510 (47.3%) |
Education in Dillingham
School Enrollment in Dillingham
The most common levels of schooling among the 524 students in Dillingham are elementary school (158 | 30.1%), high school (137 | 26.2%), and middle school (136 | 26.0%).
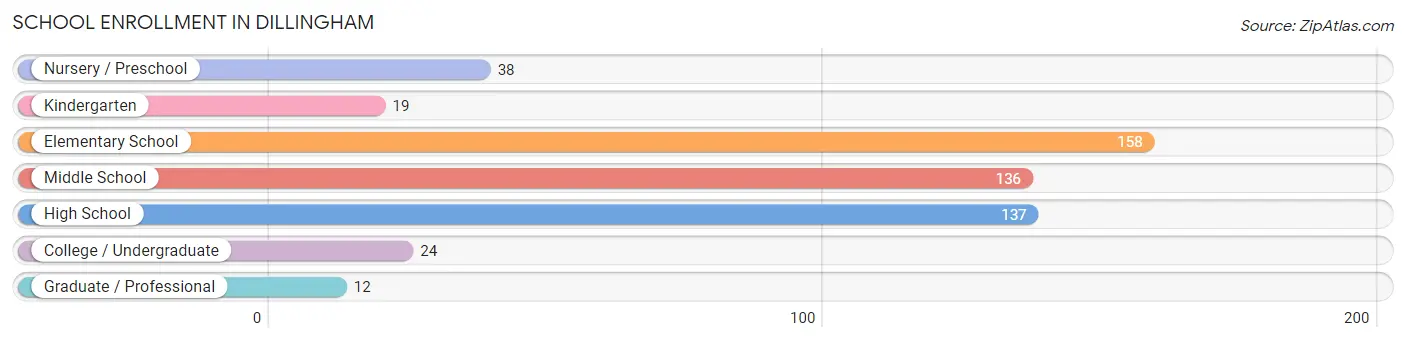
| School Level | # Students | % Students |
| Nursery / Preschool | 38 | 7.2% |
| Kindergarten | 19 | 3.6% |
| Elementary School | 158 | 30.1% |
| Middle School | 136 | 26.0% |
| High School | 137 | 26.2% |
| College / Undergraduate | 24 | 4.6% |
| Graduate / Professional | 12 | 2.3% |
| Total | 524 | 100.0% |
School Enrollment by Age by Funding Source in Dillingham
Out of a total of 524 students who are enrolled in schools in Dillingham, 24 (4.6%) attend a private institution, while the remaining 500 (95.4%) are enrolled in public schools. The age group of 25 to 34 year olds has the highest likelihood of being enrolled in private schools, with 5 (35.7% in the age bracket) enrolled. Conversely, the age group of 18 to 19 year olds has the lowest likelihood of being enrolled in a private school, with 37 (100.0% in the age bracket) attending a public institution.
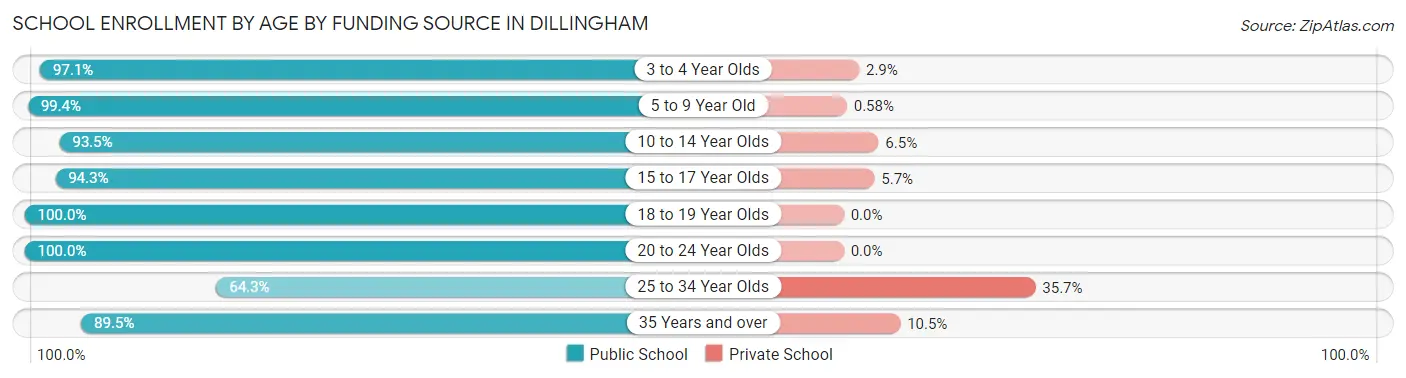
| Age Bracket | Public School | Private School |
| 3 to 4 Year Olds | 34 (97.1%) | 1 (2.9%) |
| 5 to 9 Year Old | 170 (99.4%) | 1 (0.6%) |
| 10 to 14 Year Olds | 159 (93.5%) | 11 (6.5%) |
| 15 to 17 Year Olds | 66 (94.3%) | 4 (5.7%) |
| 18 to 19 Year Olds | 37 (100.0%) | 0 (0.0%) |
| 20 to 24 Year Olds | 8 (100.0%) | 0 (0.0%) |
| 25 to 34 Year Olds | 9 (64.3%) | 5 (35.7%) |
| 35 Years and over | 17 (89.5%) | 2 (10.5%) |
| Total | 500 (95.4%) | 24 (4.6%) |
Educational Attainment by Field of Study in Dillingham
Science & technology (61 | 18.4%), bio, nature & agricultural (59 | 17.8%), education (48 | 14.5%), business (35 | 10.5%), and arts & humanities (35 | 10.5%) are the most common fields of study among 332 individuals in Dillingham who have obtained a bachelor's degree or higher.
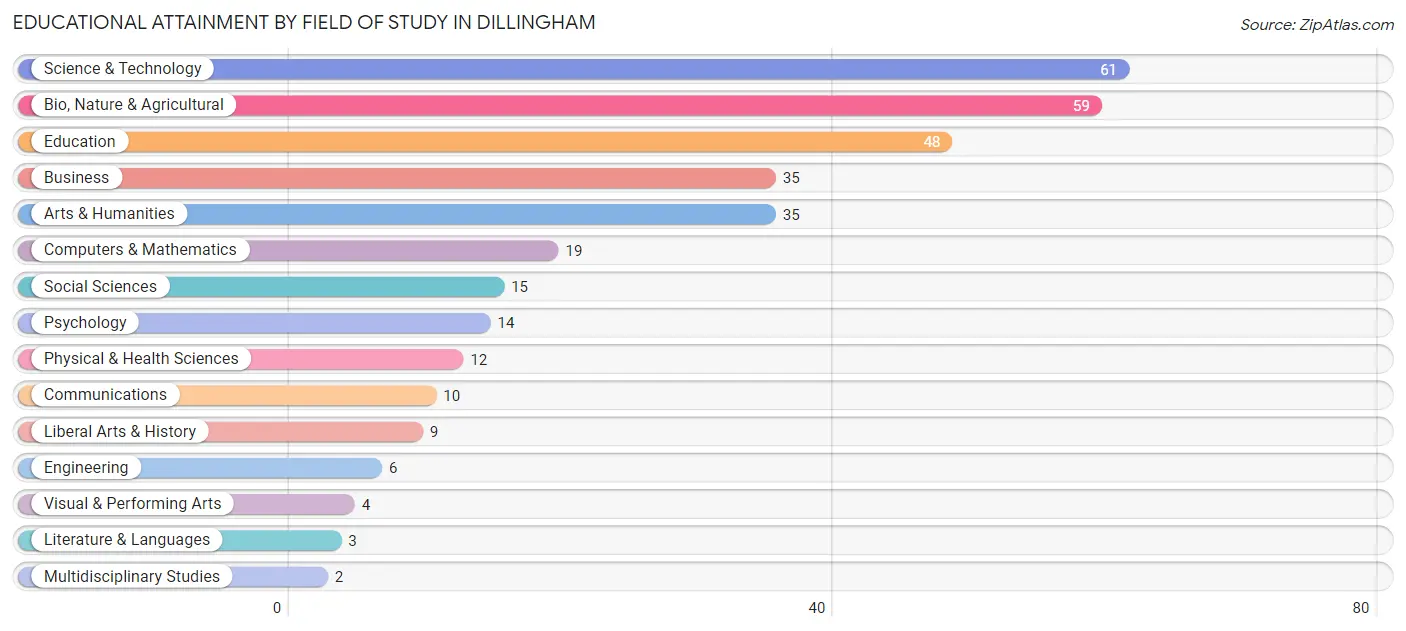
| Field of Study | # Graduates | % Graduates |
| Computers & Mathematics | 19 | 5.7% |
| Bio, Nature & Agricultural | 59 | 17.8% |
| Physical & Health Sciences | 12 | 3.6% |
| Psychology | 14 | 4.2% |
| Social Sciences | 15 | 4.5% |
| Engineering | 6 | 1.8% |
| Multidisciplinary Studies | 2 | 0.6% |
| Science & Technology | 61 | 18.4% |
| Business | 35 | 10.5% |
| Education | 48 | 14.5% |
| Literature & Languages | 3 | 0.9% |
| Liberal Arts & History | 9 | 2.7% |
| Visual & Performing Arts | 4 | 1.2% |
| Communications | 10 | 3.0% |
| Arts & Humanities | 35 | 10.5% |
| Total | 332 | 100.0% |
Transportation & Commute in Dillingham
Vehicle Availability by Sex in Dillingham
The most prevalent vehicle ownership categories in Dillingham are males with 2 vehicles (217, accounting for 46.0%) and females with 2 vehicles (167, making up 51.8%).
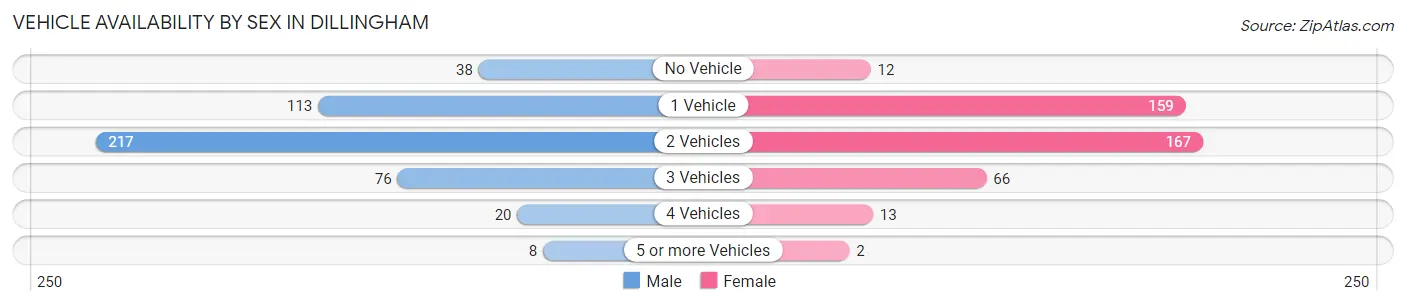
| Vehicles Available | Male | Female |
| No Vehicle | 38 (8.1%) | 12 (2.9%) |
| 1 Vehicle | 113 (23.9%) | 159 (38.0%) |
| 2 Vehicles | 217 (46.0%) | 167 (39.9%) |
| 3 Vehicles | 76 (16.1%) | 66 (15.8%) |
| 4 Vehicles | 20 (4.2%) | 13 (3.1%) |
| 5 or more Vehicles | 8 (1.7%) | 2 (0.5%) |
| Total | 472 (100.0%) | 419 (100.0%) |
Commute Time in Dillingham
The most frequently occuring commute durations in Dillingham are 5 to 9 minutes (363 commuters, 37.7%), 10 to 14 minutes (231 commuters, 24.0%), and less than 5 minutes (139 commuters, 14.4%).
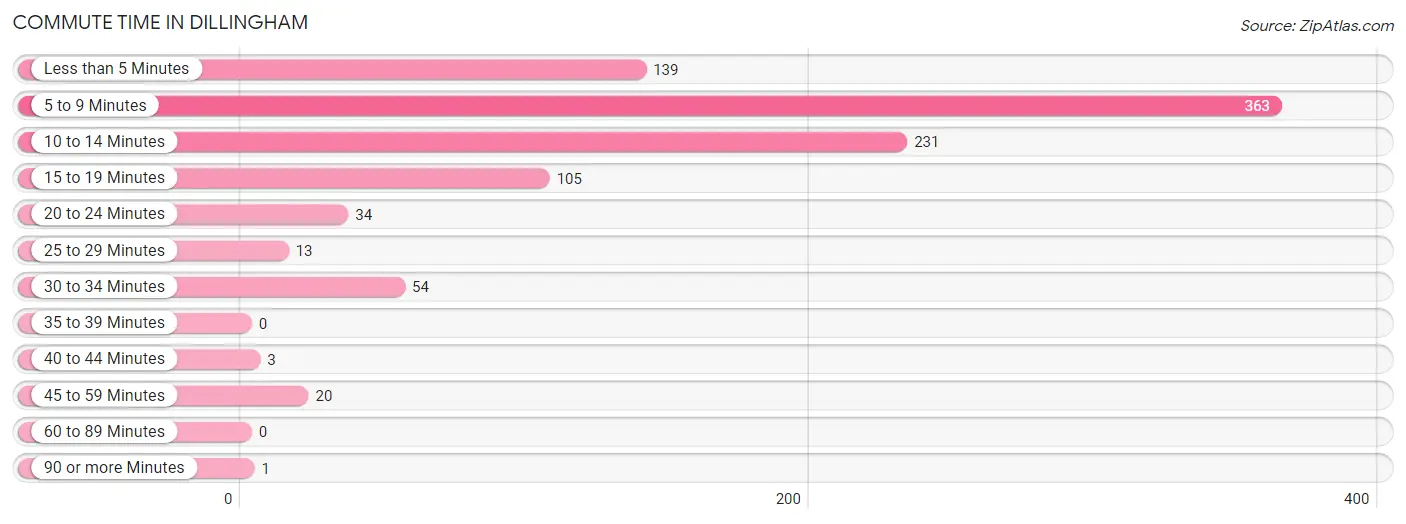
| Commute Time | # Commuters | % Commuters |
| Less than 5 Minutes | 139 | 14.4% |
| 5 to 9 Minutes | 363 | 37.7% |
| 10 to 14 Minutes | 231 | 24.0% |
| 15 to 19 Minutes | 105 | 10.9% |
| 20 to 24 Minutes | 34 | 3.5% |
| 25 to 29 Minutes | 13 | 1.3% |
| 30 to 34 Minutes | 54 | 5.6% |
| 35 to 39 Minutes | 0 | 0.0% |
| 40 to 44 Minutes | 3 | 0.3% |
| 45 to 59 Minutes | 20 | 2.1% |
| 60 to 89 Minutes | 0 | 0.0% |
| 90 or more Minutes | 1 | 0.1% |
Commute Time by Sex in Dillingham
The most common commute times in Dillingham are 5 to 9 minutes (205 commuters, 40.4%) for males and 5 to 9 minutes (158 commuters, 34.6%) for females.
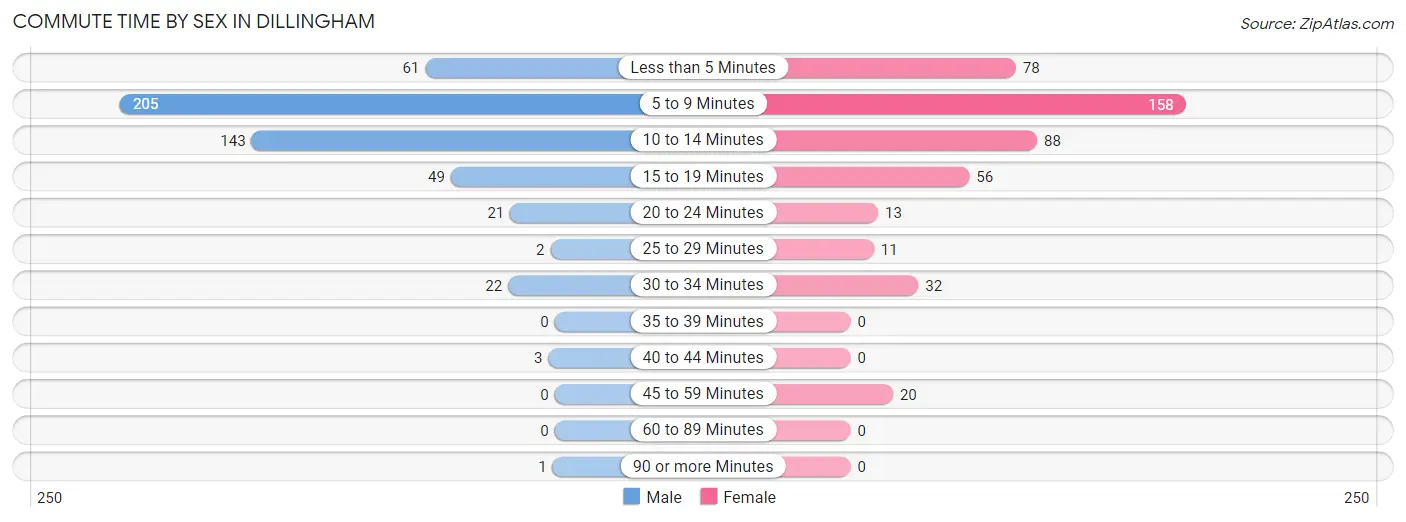
| Commute Time | Male | Female |
| Less than 5 Minutes | 61 (12.0%) | 78 (17.1%) |
| 5 to 9 Minutes | 205 (40.4%) | 158 (34.6%) |
| 10 to 14 Minutes | 143 (28.2%) | 88 (19.3%) |
| 15 to 19 Minutes | 49 (9.7%) | 56 (12.3%) |
| 20 to 24 Minutes | 21 (4.1%) | 13 (2.9%) |
| 25 to 29 Minutes | 2 (0.4%) | 11 (2.4%) |
| 30 to 34 Minutes | 22 (4.3%) | 32 (7.0%) |
| 35 to 39 Minutes | 0 (0.0%) | 0 (0.0%) |
| 40 to 44 Minutes | 3 (0.6%) | 0 (0.0%) |
| 45 to 59 Minutes | 0 (0.0%) | 20 (4.4%) |
| 60 to 89 Minutes | 0 (0.0%) | 0 (0.0%) |
| 90 or more Minutes | 1 (0.2%) | 0 (0.0%) |
Time of Departure to Work by Sex in Dillingham
The most frequent times of departure to work in Dillingham are 7:30 AM to 7:59 AM (169, 33.3%) for males and 7:30 AM to 7:59 AM (235, 51.5%) for females.
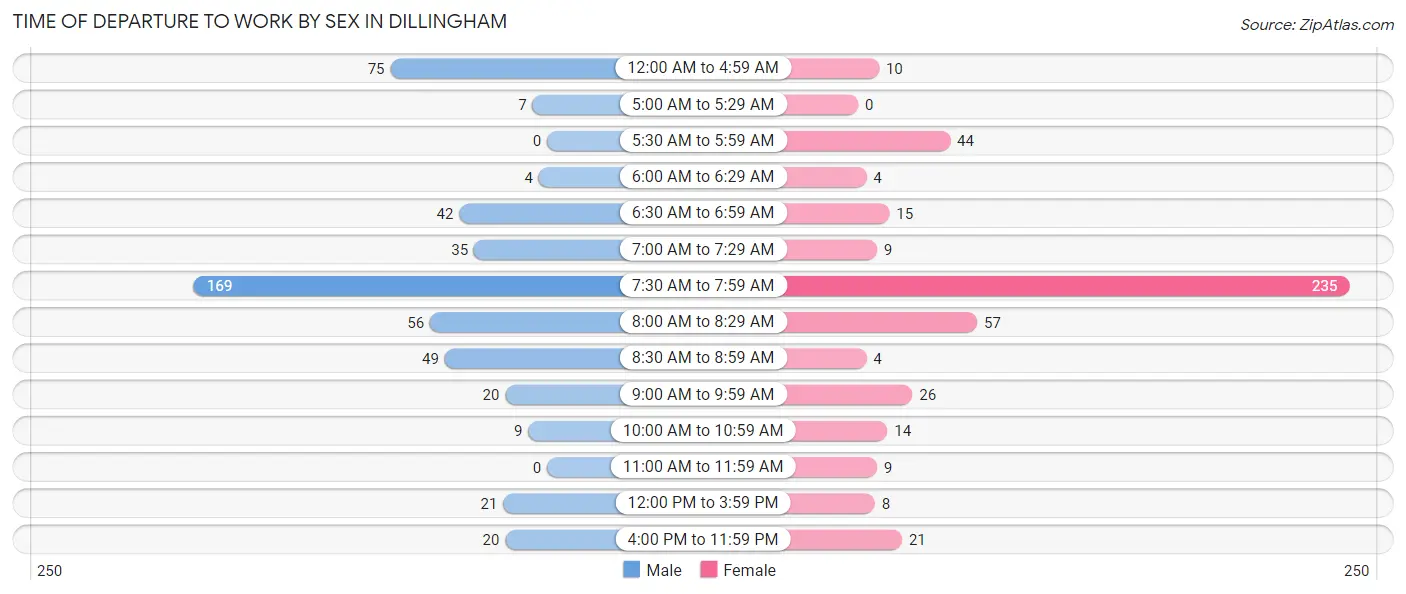
| Time of Departure | Male | Female |
| 12:00 AM to 4:59 AM | 75 (14.8%) | 10 (2.2%) |
| 5:00 AM to 5:29 AM | 7 (1.4%) | 0 (0.0%) |
| 5:30 AM to 5:59 AM | 0 (0.0%) | 44 (9.7%) |
| 6:00 AM to 6:29 AM | 4 (0.8%) | 4 (0.9%) |
| 6:30 AM to 6:59 AM | 42 (8.3%) | 15 (3.3%) |
| 7:00 AM to 7:29 AM | 35 (6.9%) | 9 (2.0%) |
| 7:30 AM to 7:59 AM | 169 (33.3%) | 235 (51.5%) |
| 8:00 AM to 8:29 AM | 56 (11.1%) | 57 (12.5%) |
| 8:30 AM to 8:59 AM | 49 (9.7%) | 4 (0.9%) |
| 9:00 AM to 9:59 AM | 20 (3.9%) | 26 (5.7%) |
| 10:00 AM to 10:59 AM | 9 (1.8%) | 14 (3.1%) |
| 11:00 AM to 11:59 AM | 0 (0.0%) | 9 (2.0%) |
| 12:00 PM to 3:59 PM | 21 (4.1%) | 8 (1.8%) |
| 4:00 PM to 11:59 PM | 20 (3.9%) | 21 (4.6%) |
| Total | 507 (100.0%) | 456 (100.0%) |
Housing Occupancy in Dillingham
Occupancy by Ownership in Dillingham
Of the total 713 dwellings in Dillingham, owner-occupied units account for 359 (50.3%), while renter-occupied units make up 354 (49.6%).
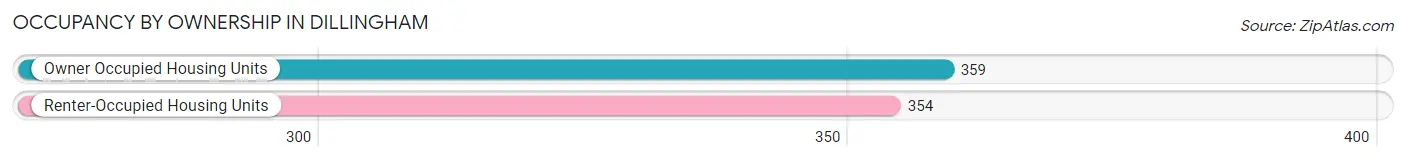
| Occupancy | # Housing Units | % Housing Units |
| Owner Occupied Housing Units | 359 | 50.3% |
| Renter-Occupied Housing Units | 354 | 49.6% |
| Total Occupied Housing Units | 713 | 100.0% |
Occupancy by Household Size in Dillingham
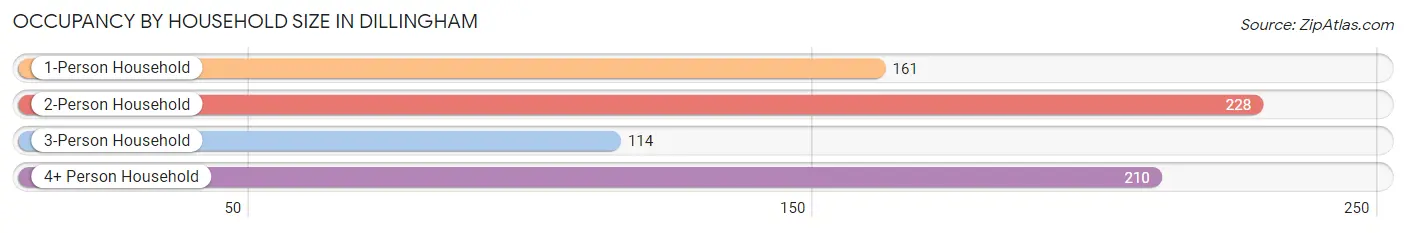
| Household Size | # Housing Units | % Housing Units |
| 1-Person Household | 161 | 22.6% |
| 2-Person Household | 228 | 32.0% |
| 3-Person Household | 114 | 16.0% |
| 4+ Person Household | 210 | 29.4% |
| Total Housing Units | 713 | 100.0% |
Occupancy by Ownership by Household Size in Dillingham
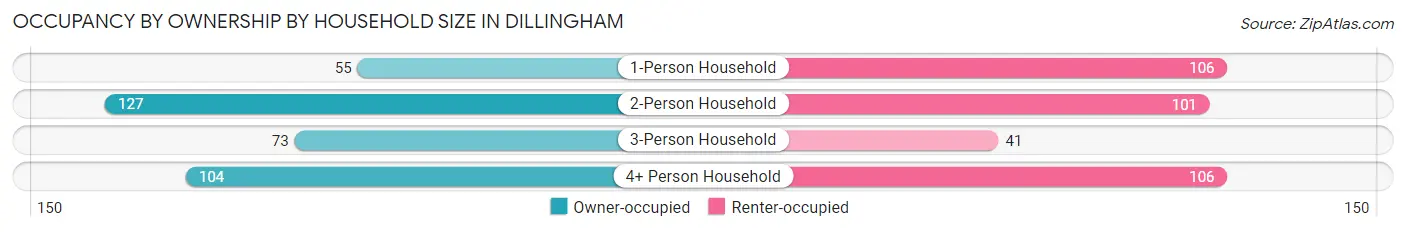
| Household Size | Owner-occupied | Renter-occupied |
| 1-Person Household | 55 (34.2%) | 106 (65.8%) |
| 2-Person Household | 127 (55.7%) | 101 (44.3%) |
| 3-Person Household | 73 (64.0%) | 41 (36.0%) |
| 4+ Person Household | 104 (49.5%) | 106 (50.5%) |
| Total Housing Units | 359 (50.3%) | 354 (49.6%) |
Occupancy by Educational Attainment in Dillingham
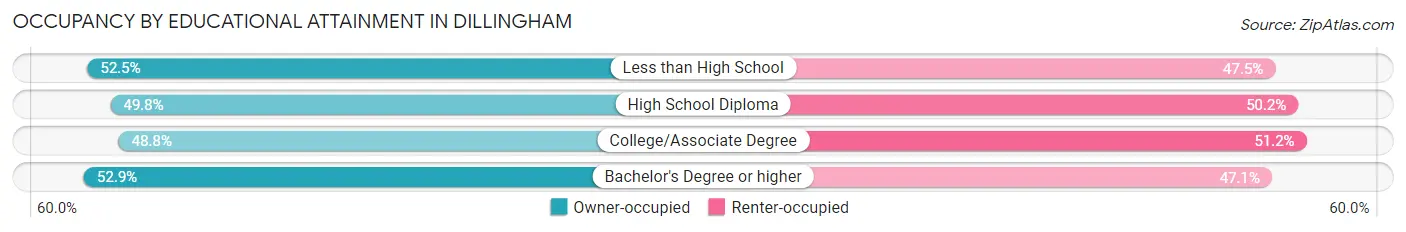
| Household Size | Owner-occupied | Renter-occupied |
| Less than High School | 31 (52.5%) | 28 (47.5%) |
| High School Diploma | 123 (49.8%) | 124 (50.2%) |
| College/Associate Degree | 124 (48.8%) | 130 (51.2%) |
| Bachelor's Degree or higher | 81 (52.9%) | 72 (47.1%) |
Occupancy by Age of Householder in Dillingham
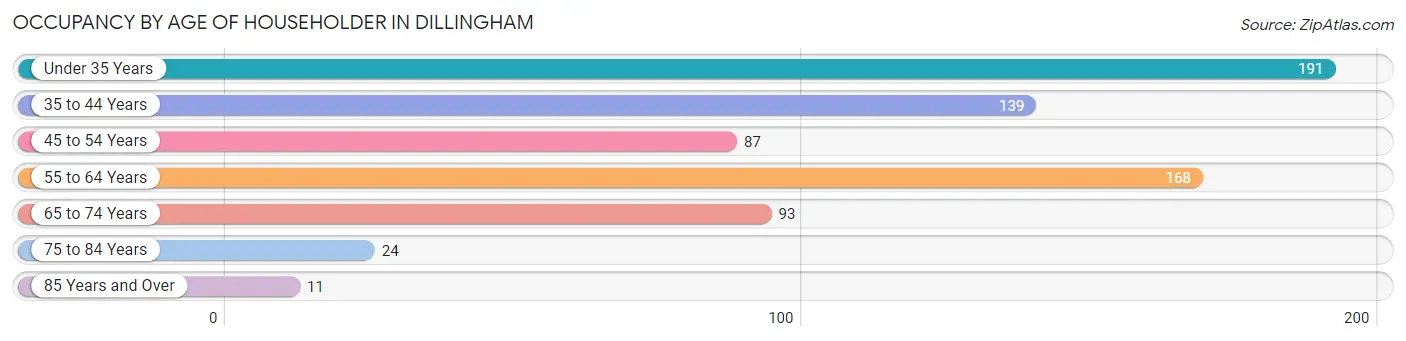
| Age Bracket | # Households | % Households |
| Under 35 Years | 191 | 26.8% |
| 35 to 44 Years | 139 | 19.5% |
| 45 to 54 Years | 87 | 12.2% |
| 55 to 64 Years | 168 | 23.6% |
| 65 to 74 Years | 93 | 13.0% |
| 75 to 84 Years | 24 | 3.4% |
| 85 Years and Over | 11 | 1.5% |
| Total | 713 | 100.0% |
Housing Finances in Dillingham
Median Income by Occupancy in Dillingham
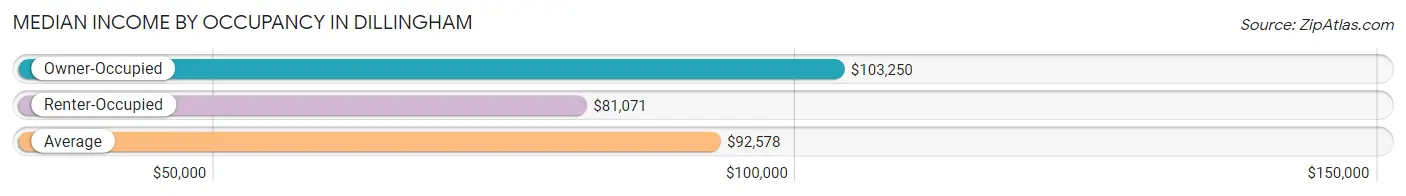
| Occupancy Type | # Households | Median Income |
| Owner-Occupied | 359 (50.3%) | $103,250 |
| Renter-Occupied | 354 (49.6%) | $81,071 |
| Average | 713 (100.0%) | $92,578 |
Occupancy by Householder Income Bracket in Dillingham
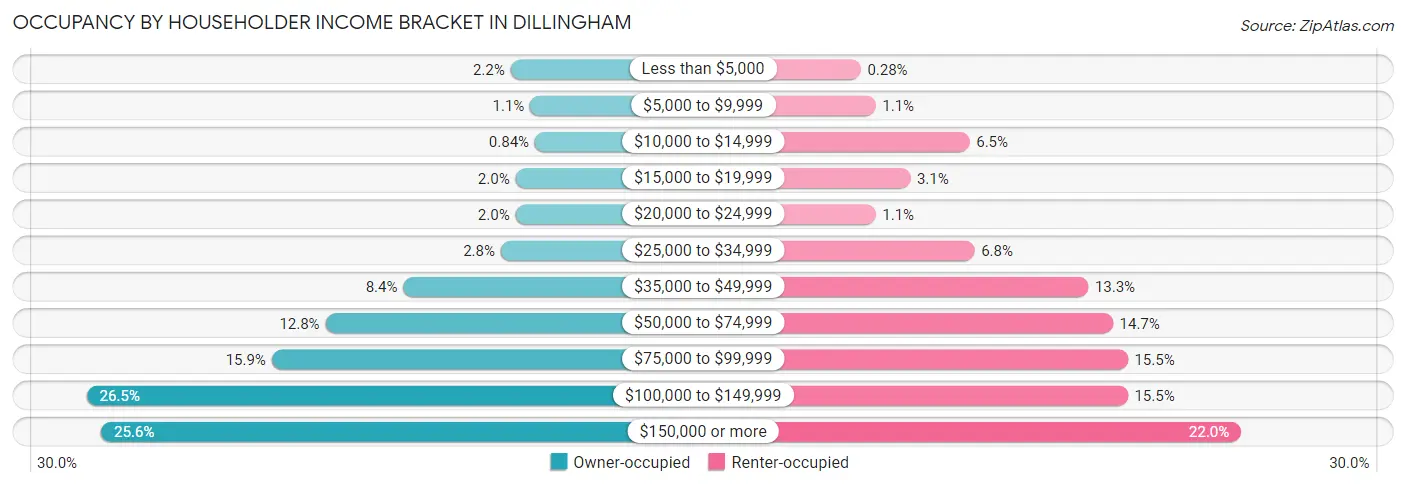
| Income Bracket | Owner-occupied | Renter-occupied |
| Less than $5,000 | 8 (2.2%) | 1 (0.3%) |
| $5,000 to $9,999 | 4 (1.1%) | 4 (1.1%) |
| $10,000 to $14,999 | 3 (0.8%) | 23 (6.5%) |
| $15,000 to $19,999 | 7 (1.9%) | 11 (3.1%) |
| $20,000 to $24,999 | 7 (1.9%) | 4 (1.1%) |
| $25,000 to $34,999 | 10 (2.8%) | 24 (6.8%) |
| $35,000 to $49,999 | 30 (8.4%) | 47 (13.3%) |
| $50,000 to $74,999 | 46 (12.8%) | 52 (14.7%) |
| $75,000 to $99,999 | 57 (15.9%) | 55 (15.5%) |
| $100,000 to $149,999 | 95 (26.5%) | 55 (15.5%) |
| $150,000 or more | 92 (25.6%) | 78 (22.0%) |
| Total | 359 (100.0%) | 354 (100.0%) |
Monthly Housing Cost Tiers in Dillingham
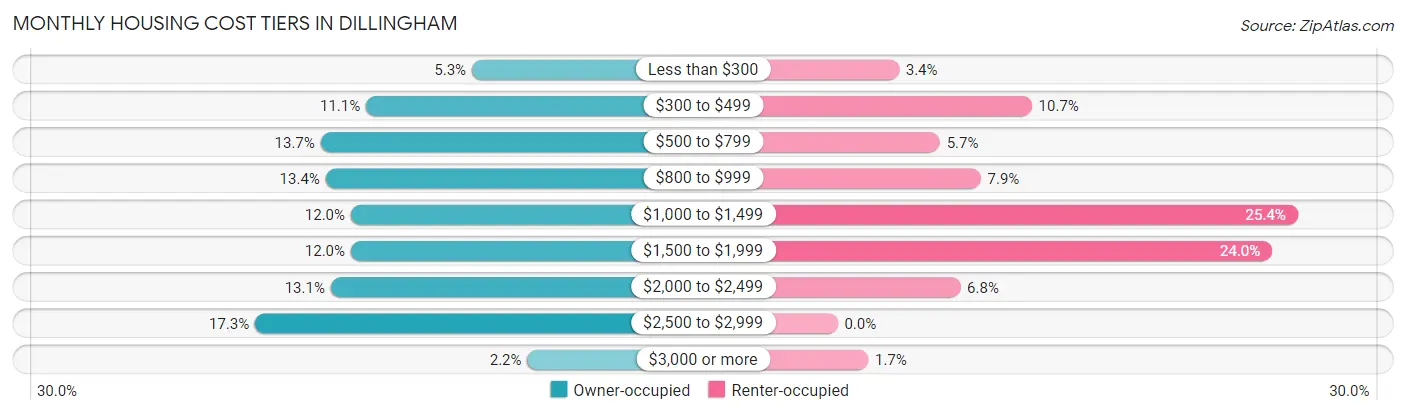
| Monthly Cost | Owner-occupied | Renter-occupied |
| Less than $300 | 19 (5.3%) | 12 (3.4%) |
| $300 to $499 | 40 (11.1%) | 38 (10.7%) |
| $500 to $799 | 49 (13.7%) | 20 (5.7%) |
| $800 to $999 | 48 (13.4%) | 28 (7.9%) |
| $1,000 to $1,499 | 43 (12.0%) | 90 (25.4%) |
| $1,500 to $1,999 | 43 (12.0%) | 85 (24.0%) |
| $2,000 to $2,499 | 47 (13.1%) | 24 (6.8%) |
| $2,500 to $2,999 | 62 (17.3%) | 0 (0.0%) |
| $3,000 or more | 8 (2.2%) | 6 (1.7%) |
| Total | 359 (100.0%) | 354 (100.0%) |
Physical Housing Characteristics in Dillingham
Housing Structures in Dillingham
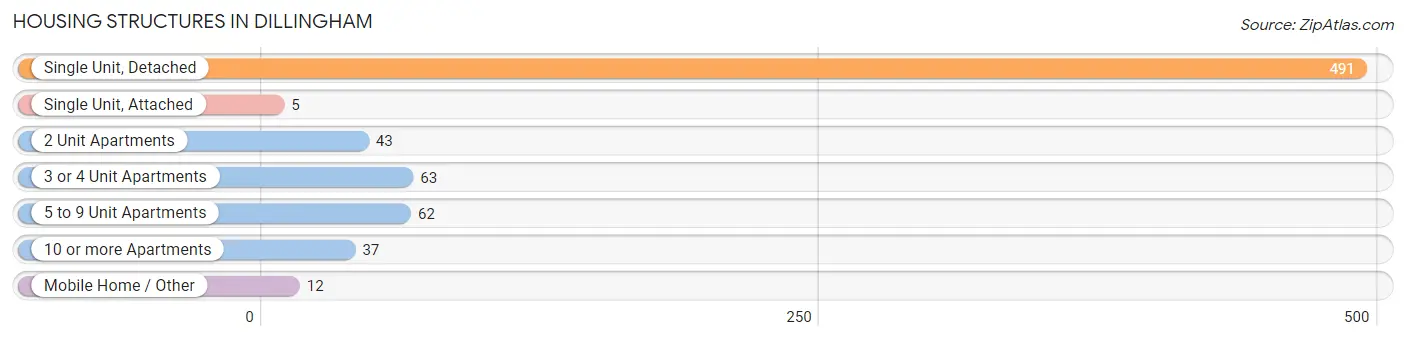
| Structure Type | # Housing Units | % Housing Units |
| Single Unit, Detached | 491 | 68.9% |
| Single Unit, Attached | 5 | 0.7% |
| 2 Unit Apartments | 43 | 6.0% |
| 3 or 4 Unit Apartments | 63 | 8.8% |
| 5 to 9 Unit Apartments | 62 | 8.7% |
| 10 or more Apartments | 37 | 5.2% |
| Mobile Home / Other | 12 | 1.7% |
| Total | 713 | 100.0% |
Housing Structures by Occupancy in Dillingham
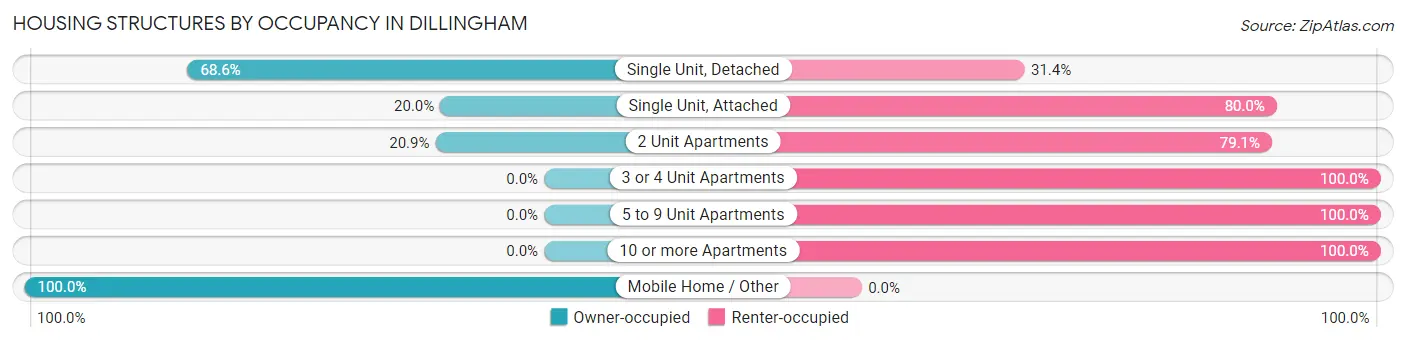
| Structure Type | Owner-occupied | Renter-occupied |
| Single Unit, Detached | 337 (68.6%) | 154 (31.4%) |
| Single Unit, Attached | 1 (20.0%) | 4 (80.0%) |
| 2 Unit Apartments | 9 (20.9%) | 34 (79.1%) |
| 3 or 4 Unit Apartments | 0 (0.0%) | 63 (100.0%) |
| 5 to 9 Unit Apartments | 0 (0.0%) | 62 (100.0%) |
| 10 or more Apartments | 0 (0.0%) | 37 (100.0%) |
| Mobile Home / Other | 12 (100.0%) | 0 (0.0%) |
| Total | 359 (50.3%) | 354 (49.6%) |
Housing Structures by Number of Rooms in Dillingham
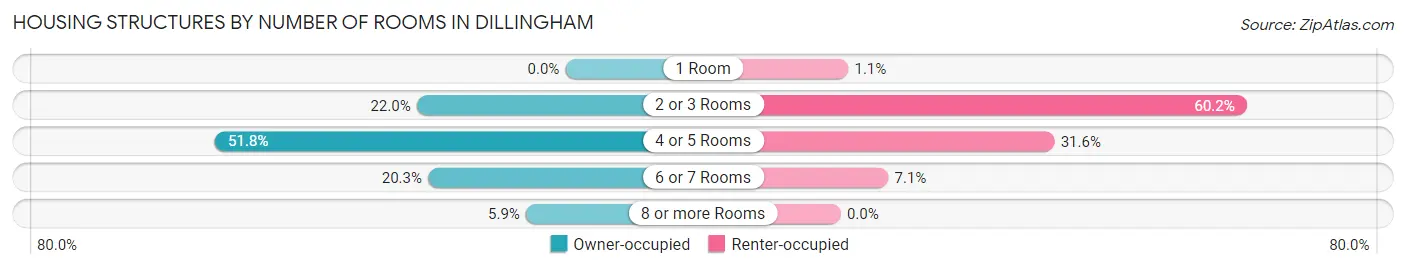
| Number of Rooms | Owner-occupied | Renter-occupied |
| 1 Room | 0 (0.0%) | 4 (1.1%) |
| 2 or 3 Rooms | 79 (22.0%) | 213 (60.2%) |
| 4 or 5 Rooms | 186 (51.8%) | 112 (31.6%) |
| 6 or 7 Rooms | 73 (20.3%) | 25 (7.1%) |
| 8 or more Rooms | 21 (5.9%) | 0 (0.0%) |
| Total | 359 (100.0%) | 354 (100.0%) |
Housing Structure by Heating Type in Dillingham
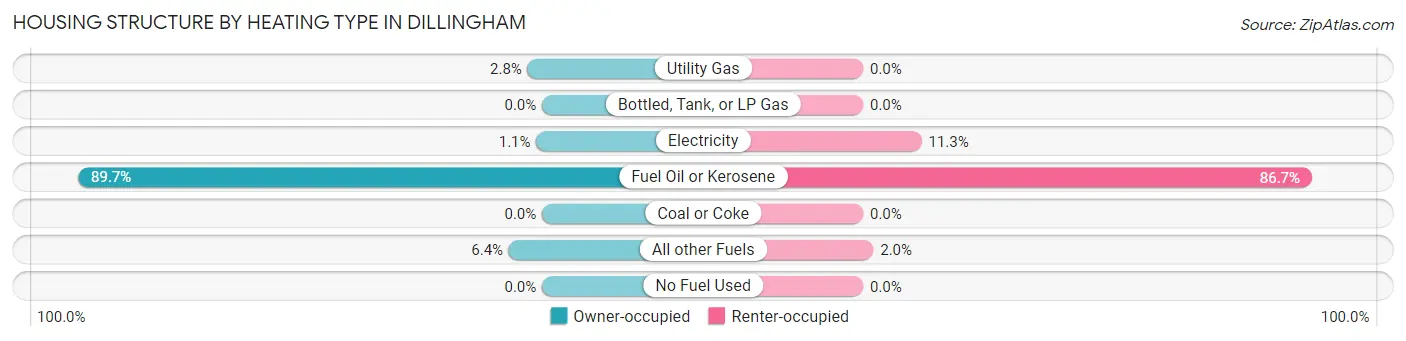
| Heating Type | Owner-occupied | Renter-occupied |
| Utility Gas | 10 (2.8%) | 0 (0.0%) |
| Bottled, Tank, or LP Gas | 0 (0.0%) | 0 (0.0%) |
| Electricity | 4 (1.1%) | 40 (11.3%) |
| Fuel Oil or Kerosene | 322 (89.7%) | 307 (86.7%) |
| Coal or Coke | 0 (0.0%) | 0 (0.0%) |
| All other Fuels | 23 (6.4%) | 7 (2.0%) |
| No Fuel Used | 0 (0.0%) | 0 (0.0%) |
| Total | 359 (100.0%) | 354 (100.0%) |
Household Vehicle Usage in Dillingham
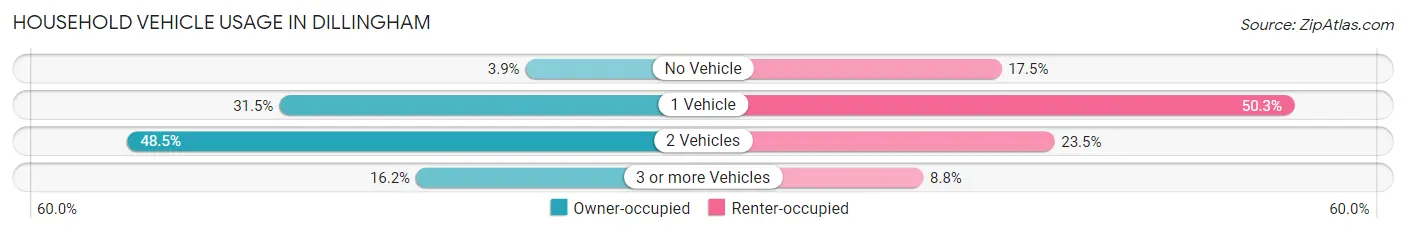
| Vehicles per Household | Owner-occupied | Renter-occupied |
| No Vehicle | 14 (3.9%) | 62 (17.5%) |
| 1 Vehicle | 113 (31.5%) | 178 (50.3%) |
| 2 Vehicles | 174 (48.5%) | 83 (23.4%) |
| 3 or more Vehicles | 58 (16.2%) | 31 (8.8%) |
| Total | 359 (100.0%) | 354 (100.0%) |
Real Estate & Mortgages in Dillingham
Real Estate and Mortgage Overview in Dillingham
| Characteristic | Without Mortgage | With Mortgage |
| Housing Units | 176 | 183 |
| Median Property Value | $196,700 | $332,700 |
| Median Household Income | $86,250 | $60 |
| Monthly Housing Costs | $659 | $8 |
| Real Estate Taxes | $1,450 | $38 |
Property Value by Mortgage Status in Dillingham
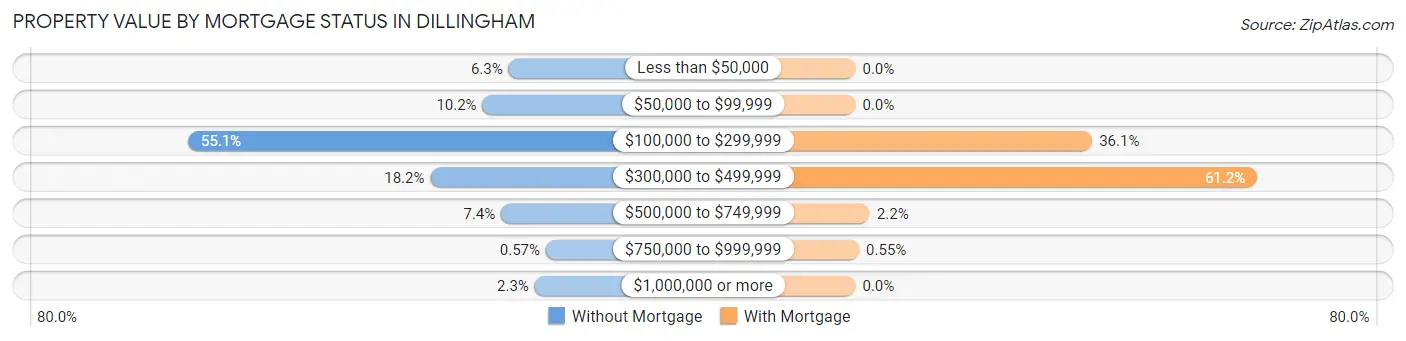
| Property Value | Without Mortgage | With Mortgage |
| Less than $50,000 | 11 (6.2%) | 0 (0.0%) |
| $50,000 to $99,999 | 18 (10.2%) | 0 (0.0%) |
| $100,000 to $299,999 | 97 (55.1%) | 66 (36.1%) |
| $300,000 to $499,999 | 32 (18.2%) | 112 (61.2%) |
| $500,000 to $749,999 | 13 (7.4%) | 4 (2.2%) |
| $750,000 to $999,999 | 1 (0.6%) | 1 (0.5%) |
| $1,000,000 or more | 4 (2.3%) | 0 (0.0%) |
| Total | 176 (100.0%) | 183 (100.0%) |
Household Income by Mortgage Status in Dillingham
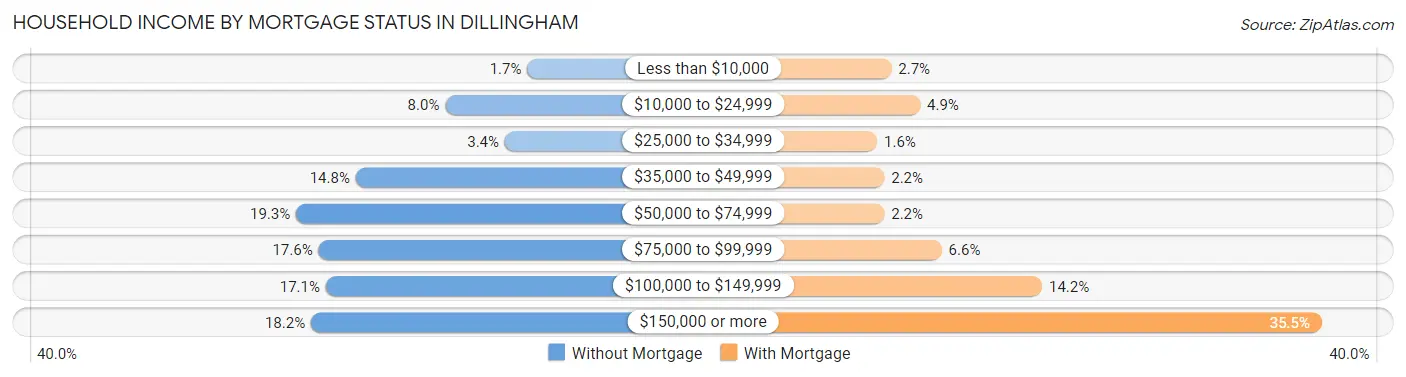
| Household Income | Without Mortgage | With Mortgage |
| Less than $10,000 | 3 (1.7%) | 5 (2.7%) |
| $10,000 to $24,999 | 14 (8.0%) | 9 (4.9%) |
| $25,000 to $34,999 | 6 (3.4%) | 3 (1.6%) |
| $35,000 to $49,999 | 26 (14.8%) | 4 (2.2%) |
| $50,000 to $74,999 | 34 (19.3%) | 4 (2.2%) |
| $75,000 to $99,999 | 31 (17.6%) | 12 (6.6%) |
| $100,000 to $149,999 | 30 (17.1%) | 26 (14.2%) |
| $150,000 or more | 32 (18.2%) | 65 (35.5%) |
| Total | 176 (100.0%) | 183 (100.0%) |
Property Value to Household Income Ratio in Dillingham
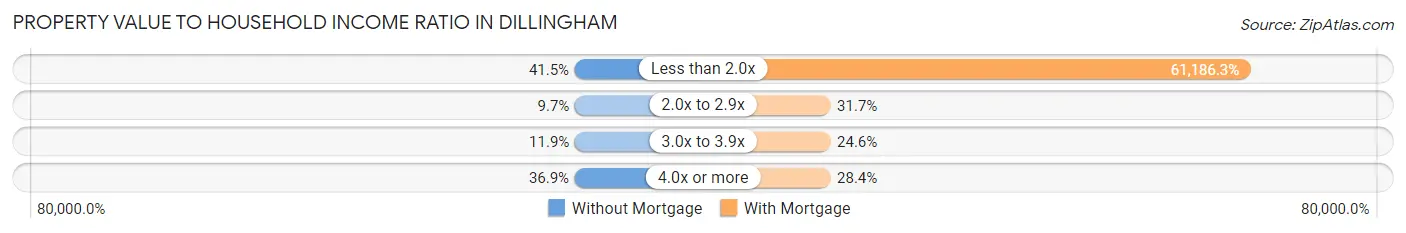
| Value-to-Income Ratio | Without Mortgage | With Mortgage |
| Less than 2.0x | 73 (41.5%) | 111,971 (61,186.3%) |
| 2.0x to 2.9x | 17 (9.7%) | 58 (31.7%) |
| 3.0x to 3.9x | 21 (11.9%) | 45 (24.6%) |
| 4.0x or more | 65 (36.9%) | 52 (28.4%) |
| Total | 176 (100.0%) | 183 (100.0%) |
Real Estate Taxes by Mortgage Status in Dillingham
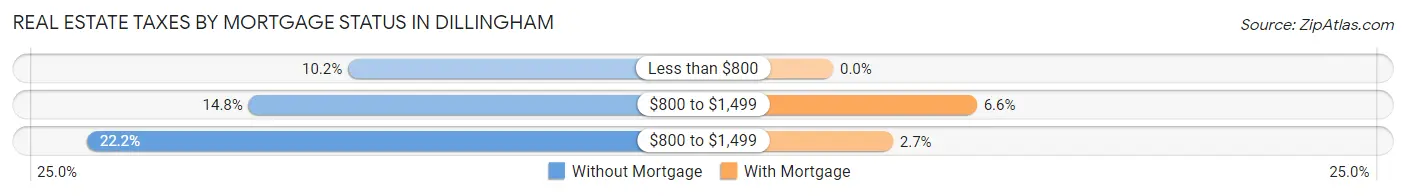
| Property Taxes | Without Mortgage | With Mortgage |
| Less than $800 | 18 (10.2%) | 0 (0.0%) |
| $800 to $1,499 | 26 (14.8%) | 12 (6.6%) |
| $800 to $1,499 | 39 (22.2%) | 5 (2.7%) |
| Total | 176 (100.0%) | 183 (100.0%) |
Health & Disability in Dillingham
Health Insurance Coverage by Age in Dillingham
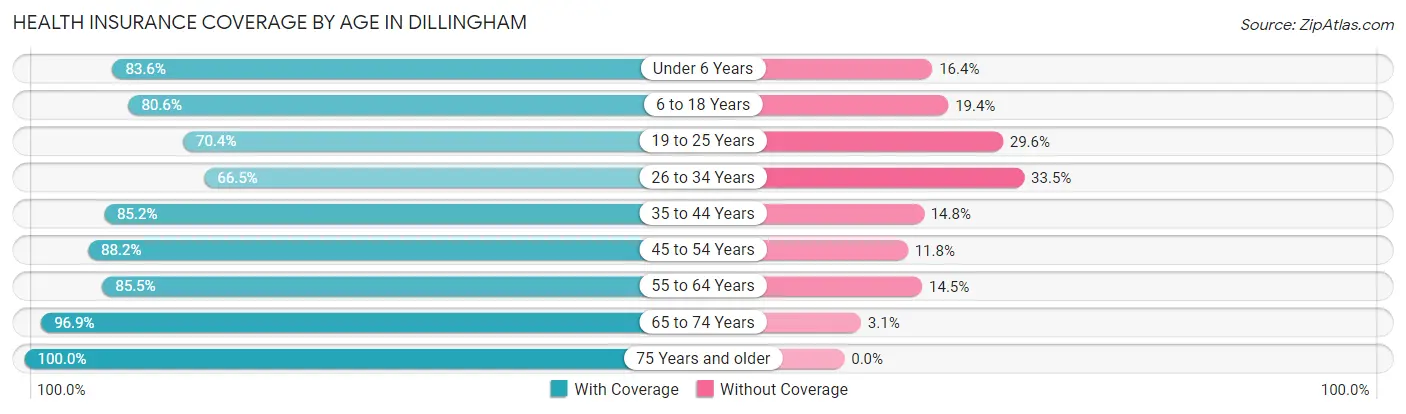
| Age Bracket | With Coverage | Without Coverage |
| Under 6 Years | 158 (83.6%) | 31 (16.4%) |
| 6 to 18 Years | 366 (80.6%) | 88 (19.4%) |
| 19 to 25 Years | 143 (70.4%) | 60 (29.6%) |
| 26 to 34 Years | 216 (66.5%) | 109 (33.5%) |
| 35 to 44 Years | 253 (85.2%) | 44 (14.8%) |
| 45 to 54 Years | 164 (88.2%) | 22 (11.8%) |
| 55 to 64 Years | 271 (85.5%) | 46 (14.5%) |
| 65 to 74 Years | 125 (96.9%) | 4 (3.1%) |
| 75 Years and older | 55 (100.0%) | 0 (0.0%) |
| Total | 1,751 (81.2%) | 404 (18.8%) |
Health Insurance Coverage by Citizenship Status in Dillingham
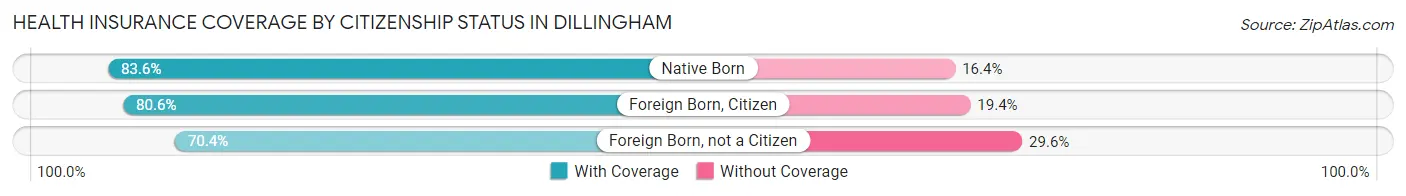
| Citizenship Status | With Coverage | Without Coverage |
| Native Born | 158 (83.6%) | 31 (16.4%) |
| Foreign Born, Citizen | 366 (80.6%) | 88 (19.4%) |
| Foreign Born, not a Citizen | 143 (70.4%) | 60 (29.6%) |
Health Insurance Coverage by Household Income in Dillingham
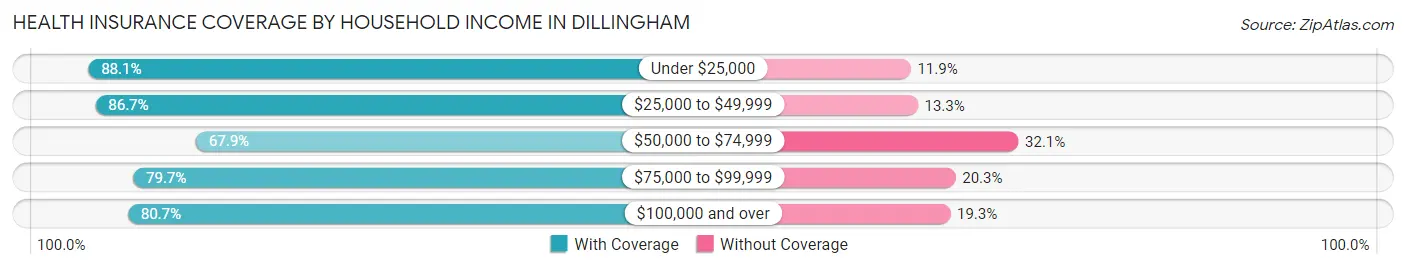
| Household Income | With Coverage | Without Coverage |
| Under $25,000 | 96 (88.1%) | 13 (11.9%) |
| $25,000 to $49,999 | 157 (86.7%) | 24 (13.3%) |
| $50,000 to $74,999 | 165 (67.9%) | 78 (32.1%) |
| $75,000 to $99,999 | 290 (79.7%) | 74 (20.3%) |
| $100,000 and over | 876 (80.7%) | 210 (19.3%) |
Public vs Private Health Insurance Coverage by Age in Dillingham
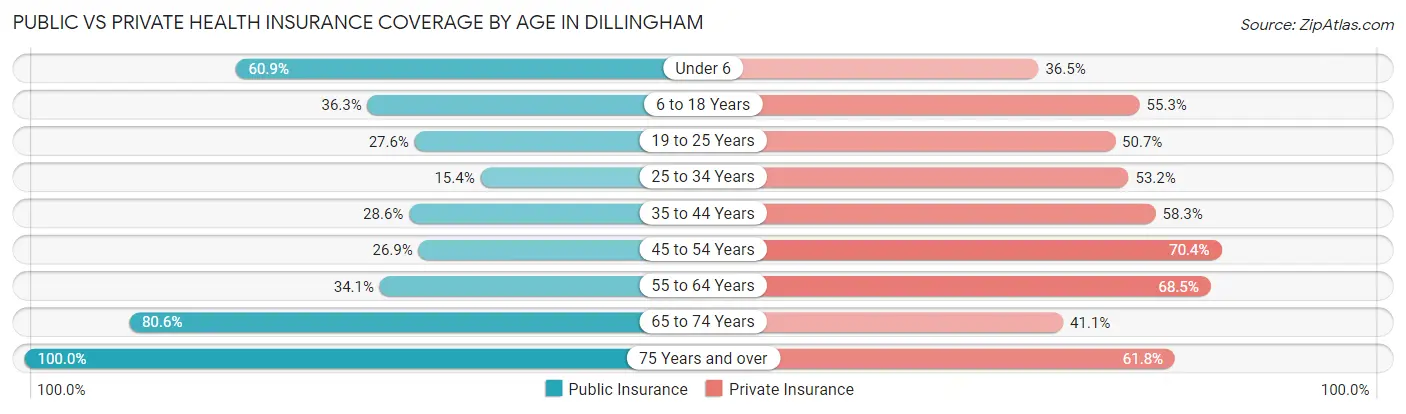
| Age Bracket | Public Insurance | Private Insurance |
| Under 6 | 115 (60.9%) | 69 (36.5%) |
| 6 to 18 Years | 165 (36.3%) | 251 (55.3%) |
| 19 to 25 Years | 56 (27.6%) | 103 (50.7%) |
| 25 to 34 Years | 50 (15.4%) | 173 (53.2%) |
| 35 to 44 Years | 85 (28.6%) | 173 (58.3%) |
| 45 to 54 Years | 50 (26.9%) | 131 (70.4%) |
| 55 to 64 Years | 108 (34.1%) | 217 (68.4%) |
| 65 to 74 Years | 104 (80.6%) | 53 (41.1%) |
| 75 Years and over | 55 (100.0%) | 34 (61.8%) |
| Total | 788 (36.6%) | 1,204 (55.9%) |
Disability Status by Sex by Age in Dillingham
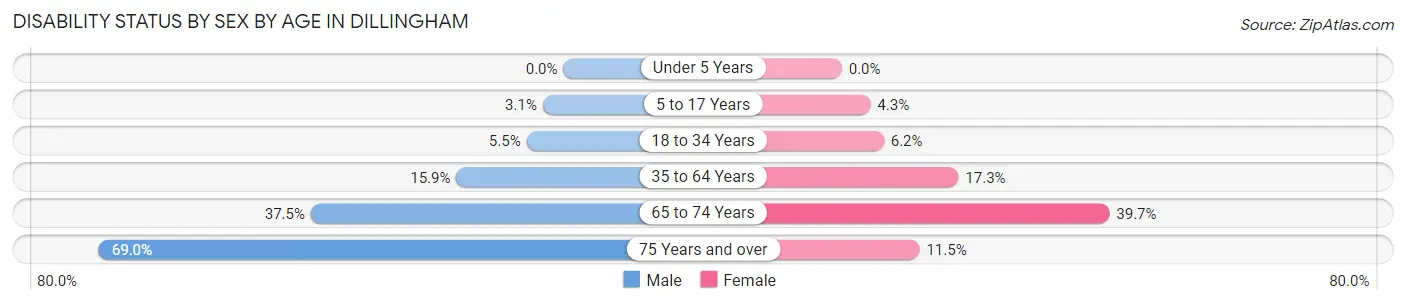
| Age Bracket | Male | Female |
| Under 5 Years | 0 (0.0%) | 0 (0.0%) |
| 5 to 17 Years | 7 (3.1%) | 9 (4.3%) |
| 18 to 34 Years | 15 (5.5%) | 18 (6.2%) |
| 35 to 64 Years | 62 (15.9%) | 71 (17.3%) |
| 65 to 74 Years | 21 (37.5%) | 29 (39.7%) |
| 75 Years and over | 20 (69.0%) | 3 (11.5%) |
Disability Class by Sex by Age in Dillingham
Disability Class: Hearing Difficulty
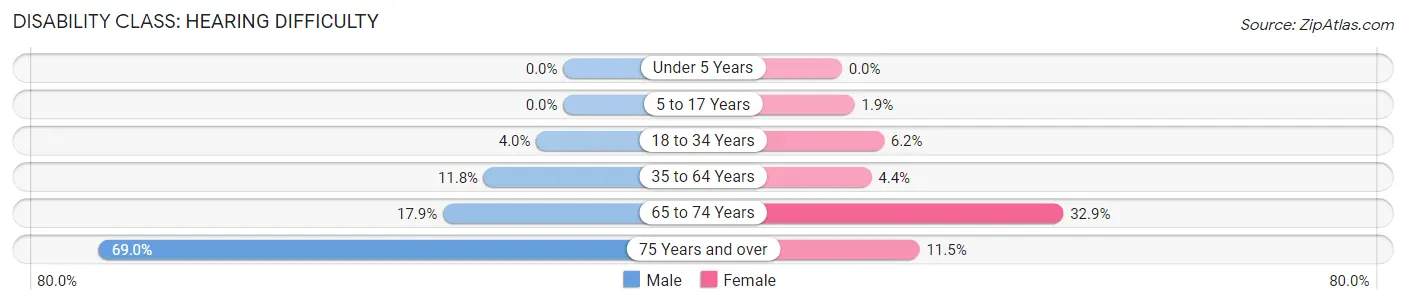
| Age Bracket | Male | Female |
| Under 5 Years | 0 (0.0%) | 0 (0.0%) |
| 5 to 17 Years | 0 (0.0%) | 4 (1.9%) |
| 18 to 34 Years | 11 (4.0%) | 18 (6.2%) |
| 35 to 64 Years | 46 (11.8%) | 18 (4.4%) |
| 65 to 74 Years | 10 (17.9%) | 24 (32.9%) |
| 75 Years and over | 20 (69.0%) | 3 (11.5%) |
Disability Class: Vision Difficulty
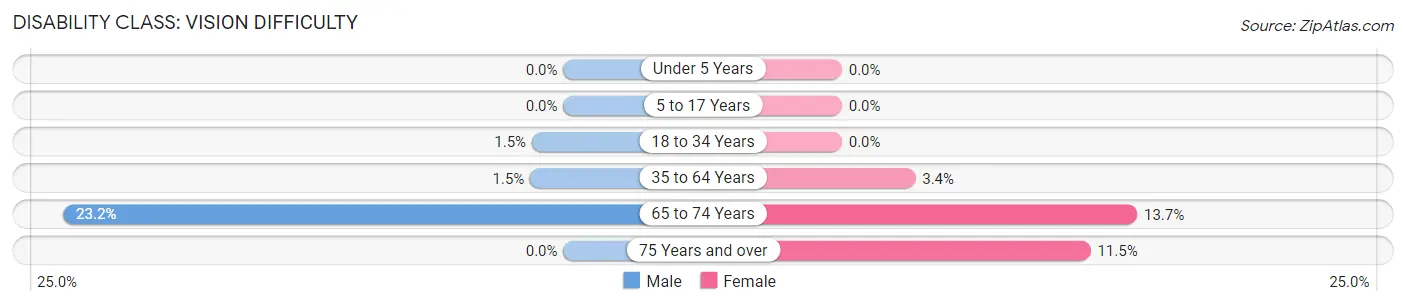
| Age Bracket | Male | Female |
| Under 5 Years | 0 (0.0%) | 0 (0.0%) |
| 5 to 17 Years | 0 (0.0%) | 0 (0.0%) |
| 18 to 34 Years | 4 (1.5%) | 0 (0.0%) |
| 35 to 64 Years | 6 (1.5%) | 14 (3.4%) |
| 65 to 74 Years | 13 (23.2%) | 10 (13.7%) |
| 75 Years and over | 0 (0.0%) | 3 (11.5%) |
Disability Class: Cognitive Difficulty
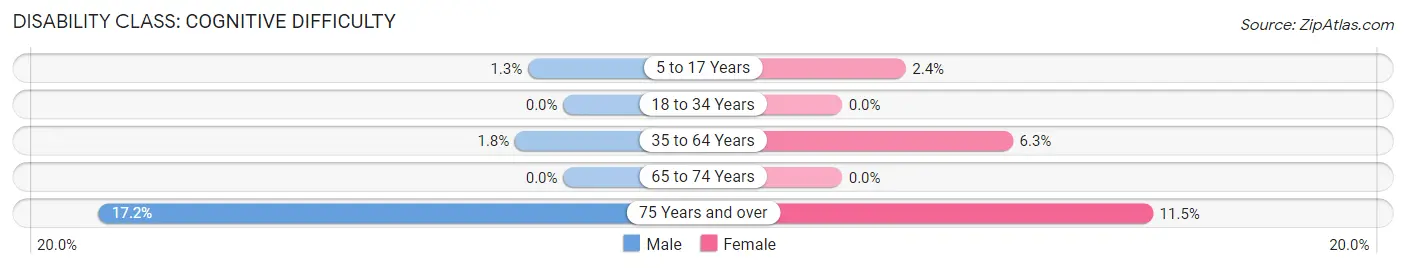
| Age Bracket | Male | Female |
| 5 to 17 Years | 3 (1.3%) | 5 (2.4%) |
| 18 to 34 Years | 0 (0.0%) | 0 (0.0%) |
| 35 to 64 Years | 7 (1.8%) | 26 (6.3%) |
| 65 to 74 Years | 0 (0.0%) | 0 (0.0%) |
| 75 Years and over | 5 (17.2%) | 3 (11.5%) |
Disability Class: Ambulatory Difficulty
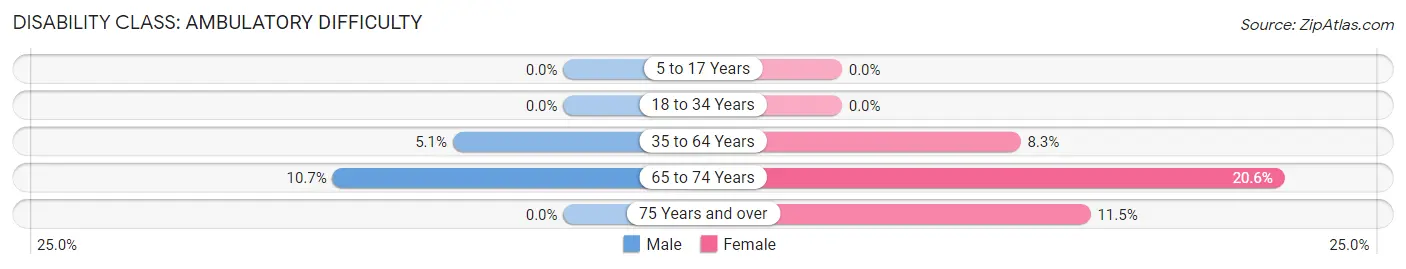
| Age Bracket | Male | Female |
| 5 to 17 Years | 0 (0.0%) | 0 (0.0%) |
| 18 to 34 Years | 0 (0.0%) | 0 (0.0%) |
| 35 to 64 Years | 20 (5.1%) | 34 (8.3%) |
| 65 to 74 Years | 6 (10.7%) | 15 (20.5%) |
| 75 Years and over | 0 (0.0%) | 3 (11.5%) |
Disability Class: Self-Care Difficulty
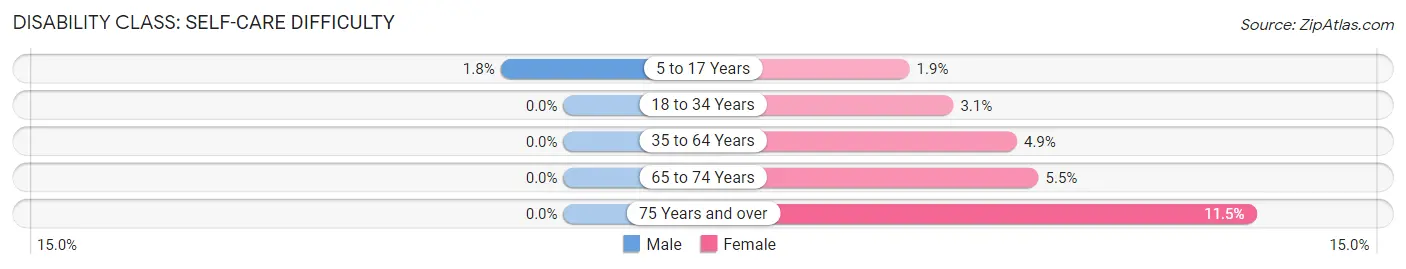
| Age Bracket | Male | Female |
| 5 to 17 Years | 4 (1.8%) | 4 (1.9%) |
| 18 to 34 Years | 0 (0.0%) | 9 (3.1%) |
| 35 to 64 Years | 0 (0.0%) | 20 (4.9%) |
| 65 to 74 Years | 0 (0.0%) | 4 (5.5%) |
| 75 Years and over | 0 (0.0%) | 3 (11.5%) |
Technology Access in Dillingham
Computing Device Access in Dillingham
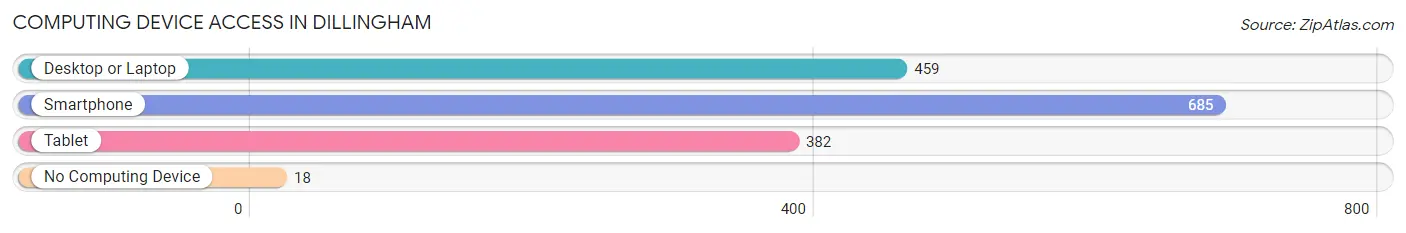
| Device Type | # Households | % Households |
| Desktop or Laptop | 459 | 64.4% |
| Smartphone | 685 | 96.1% |
| Tablet | 382 | 53.6% |
| No Computing Device | 18 | 2.5% |
| Total | 713 | 100.0% |
Internet Access in Dillingham
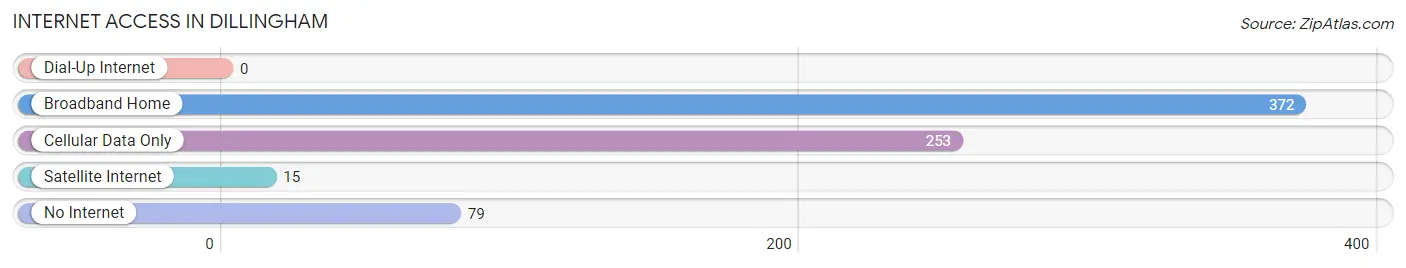
| Internet Type | # Households | % Households |
| Dial-Up Internet | 0 | 0.0% |
| Broadband Home | 372 | 52.2% |
| Cellular Data Only | 253 | 35.5% |
| Satellite Internet | 15 | 2.1% |
| No Internet | 79 | 11.1% |
| Total | 713 | 100.0% |
Dillingham Summary
Dillingham, Alaska is a small city located in the southwestern part of the state. It is the largest city in the Bristol Bay Borough and is the commercial and transportation hub for the region. The city is situated on the Nushagak River, which is part of the larger Bristol Bay watershed. The city is home to a diverse population of about 2,400 people, with a majority of the population being of Alaska Native descent.
History
The area around Dillingham has been inhabited for thousands of years by the Yup’ik and Dena’ina people. The first European settlers arrived in the area in the late 1800s, and the city was officially incorporated in 1901. The city was named after John Dillingham, a local businessman who was instrumental in the development of the area.
In the early 1900s, the city was a major hub for the commercial fishing industry, and it was also a major port for the Alaska Railroad. The city was also home to a large cannery, which processed salmon and other fish for export.
In the 1950s, the city began to experience a decline in its fishing industry, and the cannery closed in the 1960s. In the 1970s, the city began to experience a resurgence in its economy due to the development of the oil and gas industry in the region. The city has since become a major hub for the oil and gas industry, and it is also home to a large number of seafood processing plants.
Geography
Dillingham is located in the southwestern part of Alaska, in the Bristol Bay Borough. The city is situated on the Nushagak River, which is part of the larger Bristol Bay watershed. The city is surrounded by mountains and is located near the Bering Sea. The climate in the area is generally mild, with temperatures ranging from the mid-30s in the winter to the mid-60s in the summer.
Economy
The economy of Dillingham is largely based on the oil and gas industry, as well as the commercial fishing industry. The city is home to a number of seafood processing plants, which process salmon, crab, and other fish for export. The city is also home to a number of oil and gas companies, which are involved in exploration and production in the region.
The city is also home to a number of other businesses, including retail stores, restaurants, and hotels. The city is also home to a number of government offices, including the Alaska Department of Fish and Game, the Alaska Department of Transportation, and the Alaska Department of Natural Resources.
Demographics
As of the 2010 census, the population of Dillingham was 2,400. The population is largely of Alaska Native descent, with the majority of the population being of Yup’ik and Dena’ina descent. The city also has a small population of non-Native residents, including a small number of African Americans and Hispanics. The median household income in the city is $50,000, and the median home value is $150,000.
Common Questions
What is Per Capita Income in Dillingham?
Per Capita income in Dillingham is $40,299.
What is the Median Family Income in Dillingham?
Median Family Income in Dillingham is $94,375.
What is the Median Household income in Dillingham?
Median Household Income in Dillingham is $92,578.
What is Income or Wage Gap in Dillingham?
Income or Wage Gap in Dillingham is 20.5%.
Women in Dillingham earn 79.5 cents for every dollar earned by a man.
What is Family Income Deficit in Dillingham?
Family Income Deficit in Dillingham is $11,120.
Families that are below poverty line in Dillingham earn $11,120 less on average than the poverty threshold level.
What is Inequality or Gini Index in Dillingham?
Inequality or Gini Index in Dillingham is 0.38.
What is the Total Population of Dillingham?
Total Population of Dillingham is 2,175.
What is the Total Male Population of Dillingham?
Total Male Population of Dillingham is 1,072.
What is the Total Female Population of Dillingham?
Total Female Population of Dillingham is 1,103.
What is the Ratio of Males per 100 Females in Dillingham?
There are 97.19 Males per 100 Females in Dillingham.
What is the Ratio of Females per 100 Males in Dillingham?
There are 102.89 Females per 100 Males in Dillingham.
What is the Median Population Age in Dillingham?
Median Population Age in Dillingham is 32.3 Years.
What is the Average Family Size in Dillingham
Average Family Size in Dillingham is 3.2 People.
What is the Average Household Size in Dillingham
Average Household Size in Dillingham is 2.8 People.
How Large is the Labor Force in Dillingham?
There are 1,160 People in the Labor Forcein in Dillingham.
What is the Percentage of People in the Labor Force in Dillingham?
71.8% of People are in the Labor Force in Dillingham.
What is the Unemployment Rate in Dillingham?
Unemployment Rate in Dillingham is 7.1%.