Coffman Cove, AK Map & Demographics
Coffman Cove Map
Coffman Cove Overview
$38,886
PER CAPITA INCOME
$63,750
AVG HOUSEHOLD INCOME
0.39
INEQUALITY / GINI INDEX
201
TOTAL POPULATION
122
MALE POPULATION
79
FEMALE POPULATION
154.43
MALES / 100 FEMALES
64.75
FEMALES / 100 MALES
38.2
MEDIAN AGE
3.8
AVG FAMILY SIZE
2.5
AVG HOUSEHOLD SIZE
87
LABOR FORCE [ PEOPLE ]
68.5%
PERCENT IN LABOR FORCE
8.0%
UNEMPLOYMENT RATE
Coffman Cove Zip Codes
Coffman Cove Area Codes
Income in Coffman Cove
Income Overview in Coffman Cove
| Characteristic | Number | Measure |
| Per Capita Income | 201 | $38,886 |
| Median Family Income | 40 | $0 |
| Mean Family Income | 40 | $88,583 |
| Median Household Income | 82 | $63,750 |
| Mean Household Income | 82 | $93,285 |
| Income Deficit | 40 | $0 |
| Wage / Income Gap (%) | 201 | 0.00% |
| Wage / Income Gap ($) | 201 | 100.00¢ per $1 |
| Gini / Inequality Index | 201 | 0.39 |
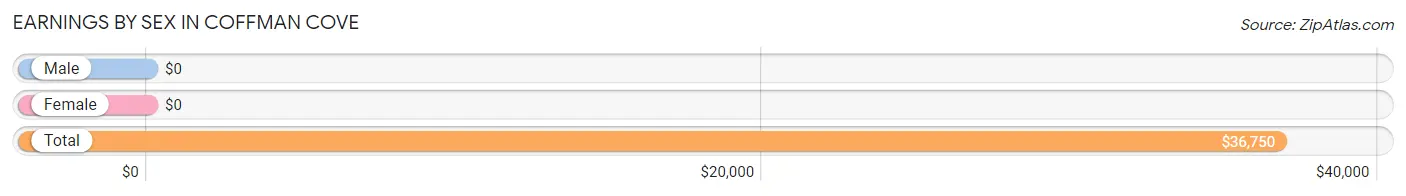
Earnings by Sex in Coffman Cove
| Sex | Number | Average Earnings |
| Male | 60 (69.0%) | $0 |
| Female | 27 (31.0%) | $0 |
| Total | 87 (100.0%) | $36,750 |
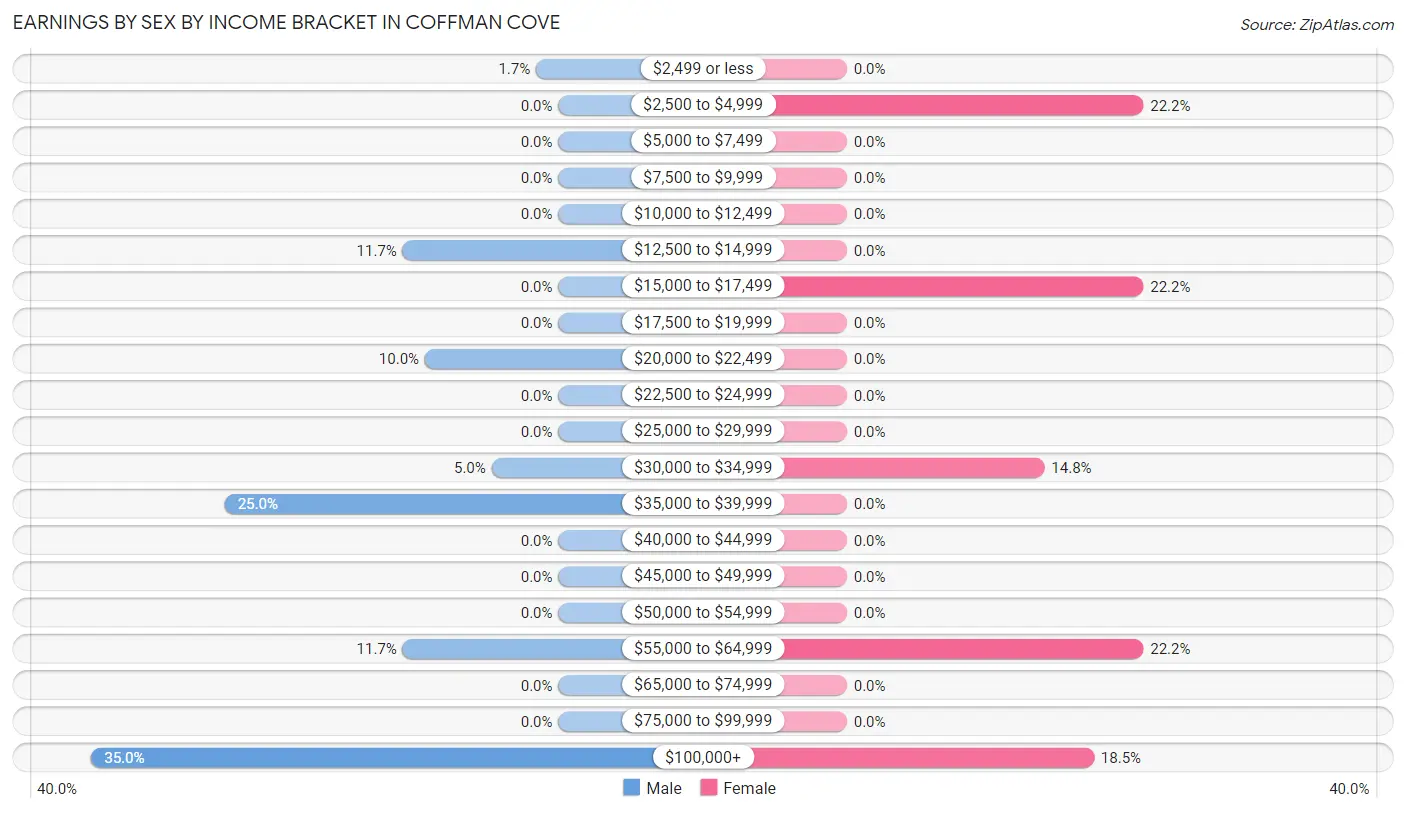
Earnings by Sex by Income Bracket in Coffman Cove
The most common earnings brackets in Coffman Cove are $100,000+ for men (21 | 35.0%) and $2,500 to $4,999 for women (6 | 22.2%).
| Income | Male | Female |
| $2,499 or less | 1 (1.7%) | 0 (0.0%) |
| $2,500 to $4,999 | 0 (0.0%) | 6 (22.2%) |
| $5,000 to $7,499 | 0 (0.0%) | 0 (0.0%) |
| $7,500 to $9,999 | 0 (0.0%) | 0 (0.0%) |
| $10,000 to $12,499 | 0 (0.0%) | 0 (0.0%) |
| $12,500 to $14,999 | 7 (11.7%) | 0 (0.0%) |
| $15,000 to $17,499 | 0 (0.0%) | 6 (22.2%) |
| $17,500 to $19,999 | 0 (0.0%) | 0 (0.0%) |
| $20,000 to $22,499 | 6 (10.0%) | 0 (0.0%) |
| $22,500 to $24,999 | 0 (0.0%) | 0 (0.0%) |
| $25,000 to $29,999 | 0 (0.0%) | 0 (0.0%) |
| $30,000 to $34,999 | 3 (5.0%) | 4 (14.8%) |
| $35,000 to $39,999 | 15 (25.0%) | 0 (0.0%) |
| $40,000 to $44,999 | 0 (0.0%) | 0 (0.0%) |
| $45,000 to $49,999 | 0 (0.0%) | 0 (0.0%) |
| $50,000 to $54,999 | 0 (0.0%) | 0 (0.0%) |
| $55,000 to $64,999 | 7 (11.7%) | 6 (22.2%) |
| $65,000 to $74,999 | 0 (0.0%) | 0 (0.0%) |
| $75,000 to $99,999 | 0 (0.0%) | 0 (0.0%) |
| $100,000+ | 21 (35.0%) | 5 (18.5%) |
| Total | 60 (100.0%) | 27 (100.0%) |
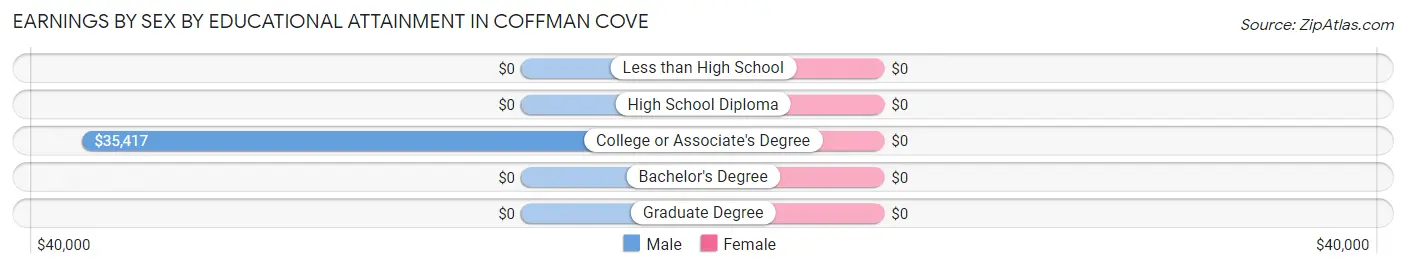
Earnings by Sex by Educational Attainment in Coffman Cove
| Educational Attainment | Male Income | Female Income |
| Less than High School | - | - |
| High School Diploma | - | - |
| College or Associate's Degree | $35,417 | $0 |
| Bachelor's Degree | - | - |
| Graduate Degree | - | - |
| Total | - | - |
Family Income in Coffman Cove
Family Income Brackets in Coffman Cove
According to the Coffman Cove family income data, there are 13 families falling into the $150,000 to $199,999 income range, which is the most common income bracket and makes up 32.5% of all families.
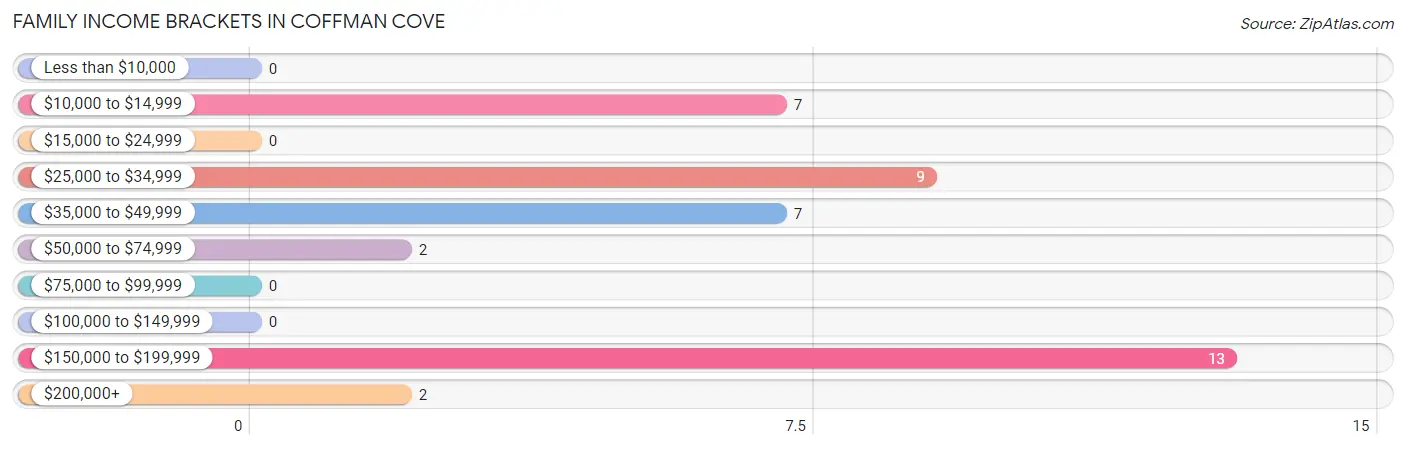
| Income Bracket | # Families | % Families |
| Less than $10,000 | 0 | 0.0% |
| $10,000 to $14,999 | 7 | 17.5% |
| $15,000 to $24,999 | 0 | 0.0% |
| $25,000 to $34,999 | 9 | 22.5% |
| $35,000 to $49,999 | 7 | 17.5% |
| $50,000 to $74,999 | 2 | 5.0% |
| $75,000 to $99,999 | 0 | 0.0% |
| $100,000 to $149,999 | 0 | 0.0% |
| $150,000 to $199,999 | 13 | 32.5% |
| $200,000+ | 2 | 5.0% |
Family Income by Famaliy Size in Coffman Cove
2-person families (20 | 50.0%) account for the highest median family income in Coffman Cove with $169,286 per family, while 2-person families (20 | 50.0%) have the highest median income of $84,643 per family member.
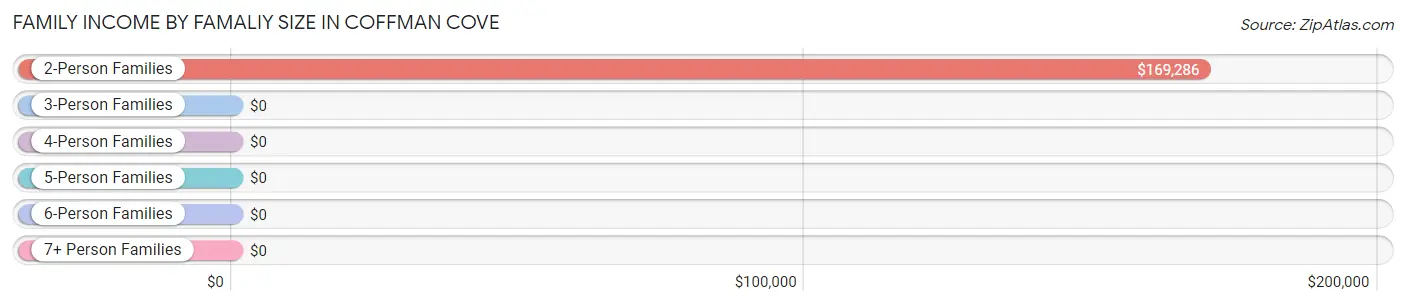
| Income Bracket | # Families | Median Income |
| 2-Person Families | 20 (50.0%) | $169,286 |
| 3-Person Families | 6 (15.0%) | $0 |
| 4-Person Families | 8 (20.0%) | $0 |
| 5-Person Families | 0 (0.0%) | $0 |
| 6-Person Families | 6 (15.0%) | $0 |
| 7+ Person Families | 0 (0.0%) | $0 |
| Total | 40 (100.0%) | $0 |
Family Income by Number of Earners in Coffman Cove
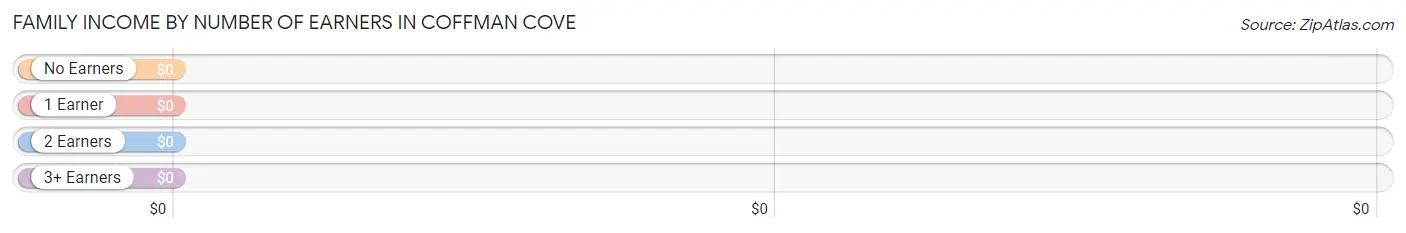
| Number of Earners | # Families | Median Income |
| No Earners | 4 (10.0%) | $0 |
| 1 Earner | 22 (55.0%) | $0 |
| 2 Earners | 14 (35.0%) | $0 |
| 3+ Earners | 0 (0.0%) | $0 |
| Total | 40 (100.0%) | $0 |
Household Income in Coffman Cove
Household Income Brackets in Coffman Cove
With 28 households falling in the category, the $150,000 to $199,999 income range is the most frequent in Coffman Cove, accounting for 34.2% of all households.
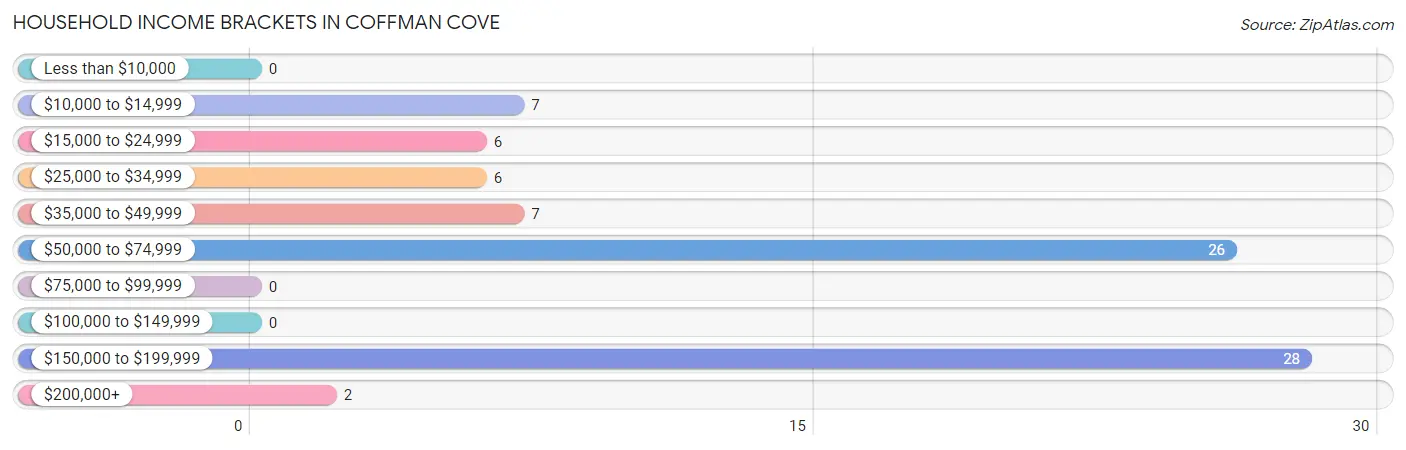
| Income Bracket | # Households | % Households |
| Less than $10,000 | 0 | 0.0% |
| $10,000 to $14,999 | 7 | 8.5% |
| $15,000 to $24,999 | 6 | 7.3% |
| $25,000 to $34,999 | 6 | 7.3% |
| $35,000 to $49,999 | 7 | 8.5% |
| $50,000 to $74,999 | 26 | 31.7% |
| $75,000 to $99,999 | 0 | 0.0% |
| $100,000 to $149,999 | 0 | 0.0% |
| $150,000 to $199,999 | 28 | 34.1% |
| $200,000+ | 2 | 2.4% |
Household Income by Householder Age in Coffman Cove
The median household income in Coffman Cove is $63,750, with the highest median household income of $175,500 found in the 65+ years age bracket for the primary householder. A total of 28 households (34.2%) fall into this category. Meanwhile, the 15 to 24 years age bracket for the primary householder has the lowest median household income of $0, with 6 households (7.3%) in this group.
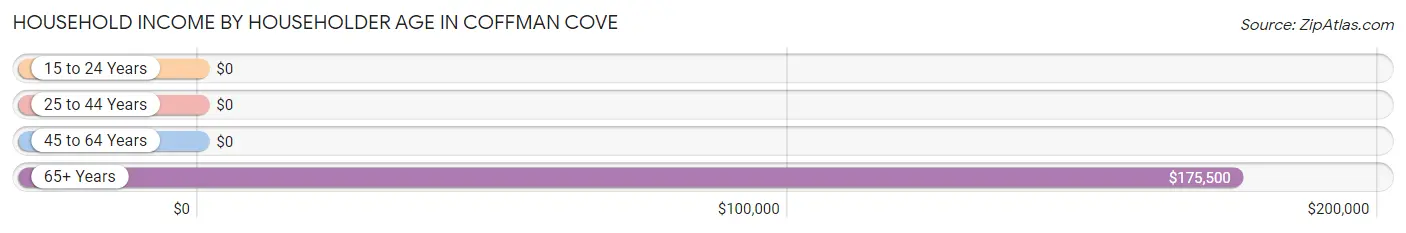
| Income Bracket | # Households | Median Income |
| 15 to 24 Years | 6 (7.3%) | $0 |
| 25 to 44 Years | 20 (24.4%) | $0 |
| 45 to 64 Years | 28 (34.2%) | $0 |
| 65+ Years | 28 (34.2%) | $175,500 |
| Total | 82 (100.0%) | $63,750 |
Poverty in Coffman Cove
Income Below Poverty by Sex and Age in Coffman Cove
With 10.7% poverty level for males and 13.9% for females among the residents of Coffman Cove, 12 to 14 year old males and 12 to 14 year old females are the most vulnerable to poverty, with 6 males (85.7%) and 6 females (100.0%) in their respective age groups living below the poverty level.
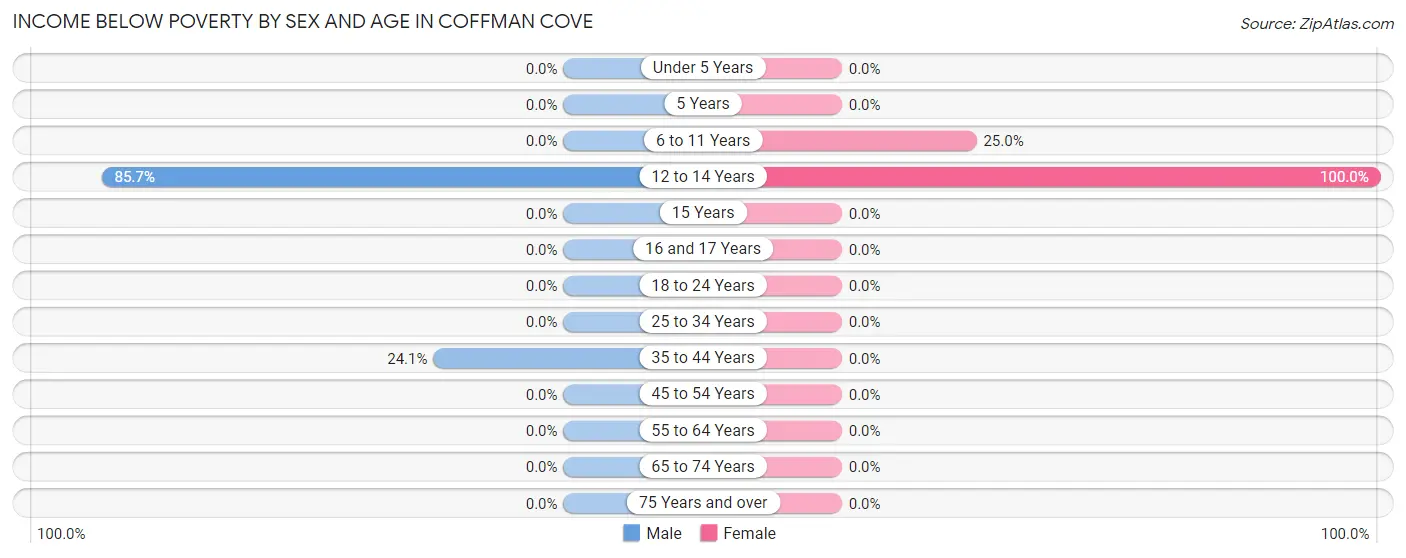
| Age Bracket | Male | Female |
| Under 5 Years | 0 (0.0%) | 0 (0.0%) |
| 5 Years | 0 (0.0%) | 0 (0.0%) |
| 6 to 11 Years | 0 (0.0%) | 5 (25.0%) |
| 12 to 14 Years | 6 (85.7%) | 6 (100.0%) |
| 15 Years | 0 (0.0%) | 0 (0.0%) |
| 16 and 17 Years | 0 (0.0%) | 0 (0.0%) |
| 18 to 24 Years | 0 (0.0%) | 0 (0.0%) |
| 25 to 34 Years | 0 (0.0%) | 0 (0.0%) |
| 35 to 44 Years | 7 (24.1%) | 0 (0.0%) |
| 45 to 54 Years | 0 (0.0%) | 0 (0.0%) |
| 55 to 64 Years | 0 (0.0%) | 0 (0.0%) |
| 65 to 74 Years | 0 (0.0%) | 0 (0.0%) |
| 75 Years and over | 0 (0.0%) | 0 (0.0%) |
| Total | 13 (10.7%) | 11 (13.9%) |
Income Above Poverty by Sex and Age in Coffman Cove
According to the poverty statistics in Coffman Cove, males aged under 5 years and females aged 18 to 24 years are the age groups that are most secure financially, with 100.0% of males and 100.0% of females in these age groups living above the poverty line.
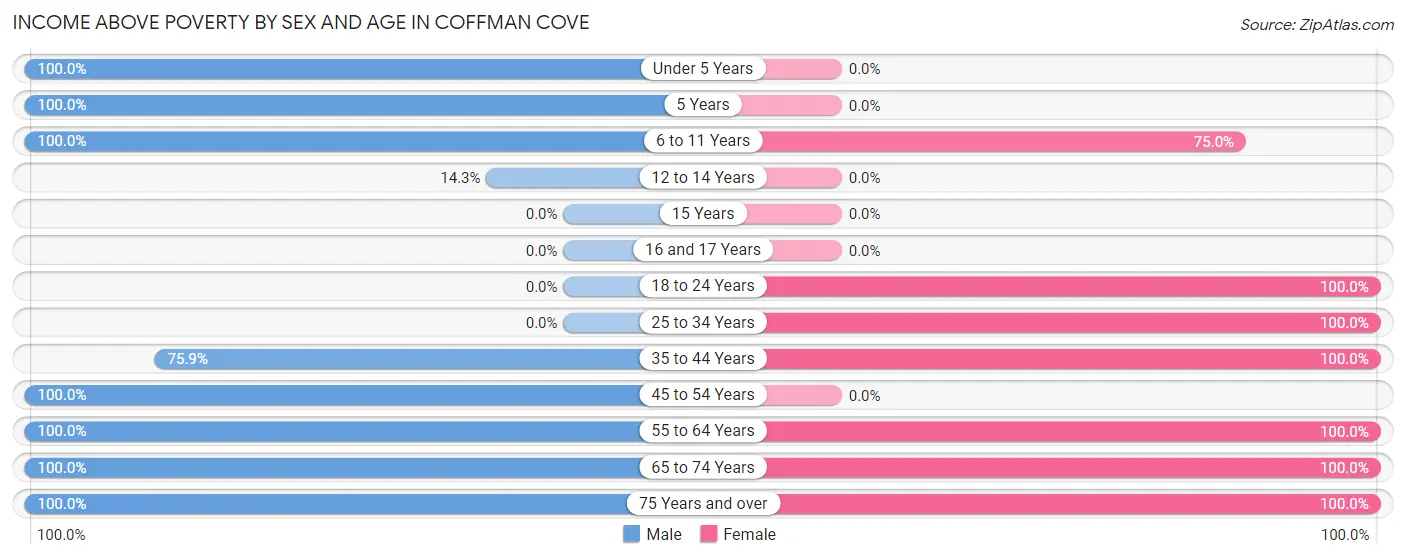
| Age Bracket | Male | Female |
| Under 5 Years | 36 (100.0%) | 0 (0.0%) |
| 5 Years | 4 (100.0%) | 0 (0.0%) |
| 6 to 11 Years | 1 (100.0%) | 15 (75.0%) |
| 12 to 14 Years | 1 (14.3%) | 0 (0.0%) |
| 15 Years | 0 (0.0%) | 0 (0.0%) |
| 16 and 17 Years | 0 (0.0%) | 0 (0.0%) |
| 18 to 24 Years | 0 (0.0%) | 6 (100.0%) |
| 25 to 34 Years | 0 (0.0%) | 10 (100.0%) |
| 35 to 44 Years | 22 (75.9%) | 3 (100.0%) |
| 45 to 54 Years | 6 (100.0%) | 0 (0.0%) |
| 55 to 64 Years | 10 (100.0%) | 24 (100.0%) |
| 65 to 74 Years | 26 (100.0%) | 4 (100.0%) |
| 75 Years and over | 3 (100.0%) | 6 (100.0%) |
| Total | 109 (89.3%) | 68 (86.1%) |
Income Below Poverty Among Married-Couple Families in Coffman Cove
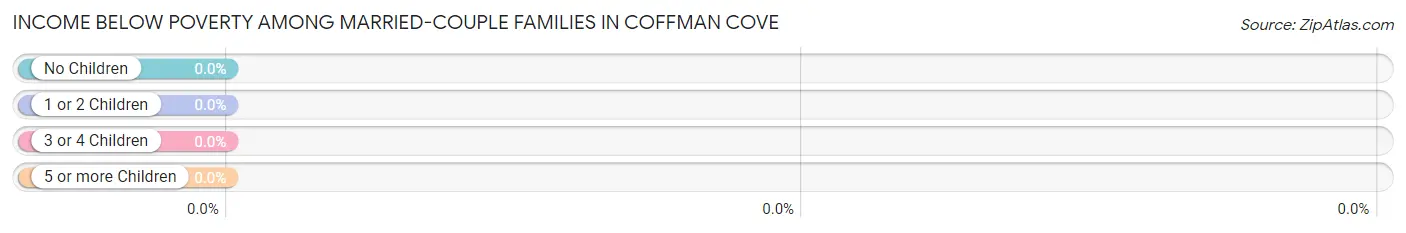
| Children | Above Poverty | Below Poverty |
| No Children | 17 (100.0%) | 0 (0.0%) |
| 1 or 2 Children | 7 (100.0%) | 0 (0.0%) |
| 3 or 4 Children | 6 (100.0%) | 0 (0.0%) |
| 5 or more Children | 0 (0.0%) | 0 (0.0%) |
| Total | 30 (100.0%) | 0 (0.0%) |
Income Below Poverty Among Single-Parent Households in Coffman Cove
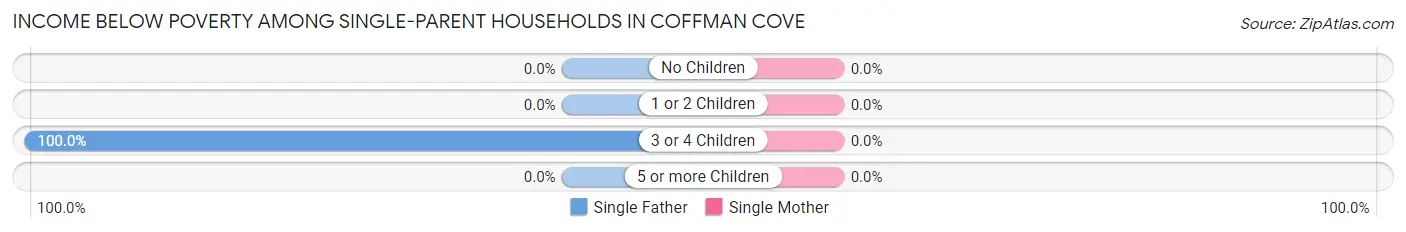
| Children | Single Father | Single Mother |
| No Children | 0 (0.0%) | 0 (0.0%) |
| 1 or 2 Children | 0 (0.0%) | 0 (0.0%) |
| 3 or 4 Children | 7 (100.0%) | 0 (0.0%) |
| 5 or more Children | 0 (0.0%) | 0 (0.0%) |
| Total | 7 (70.0%) | 0 (0.0%) |
Income Below Poverty Among Married-Couple vs Single-Parent Households in Coffman Cove
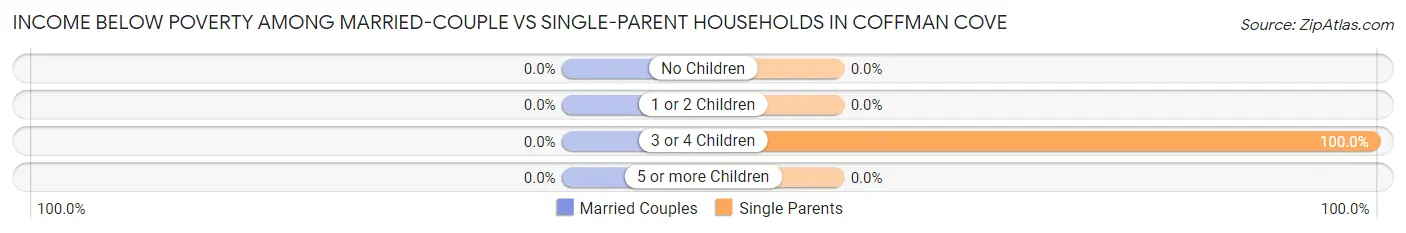
| Children | Married-Couple Families | Single-Parent Households |
| No Children | 0 (0.0%) | 0 (0.0%) |
| 1 or 2 Children | 0 (0.0%) | 0 (0.0%) |
| 3 or 4 Children | 0 (0.0%) | 7 (100.0%) |
| 5 or more Children | 0 (0.0%) | 0 (0.0%) |
| Total | 0 (0.0%) | 7 (70.0%) |
Race in Coffman Cove
The most populous races in Coffman Cove are White / Caucasian (198 | 98.5%), Hispanic or Latino (6 | 3.0%), and Two or more Races (3 | 1.5%).
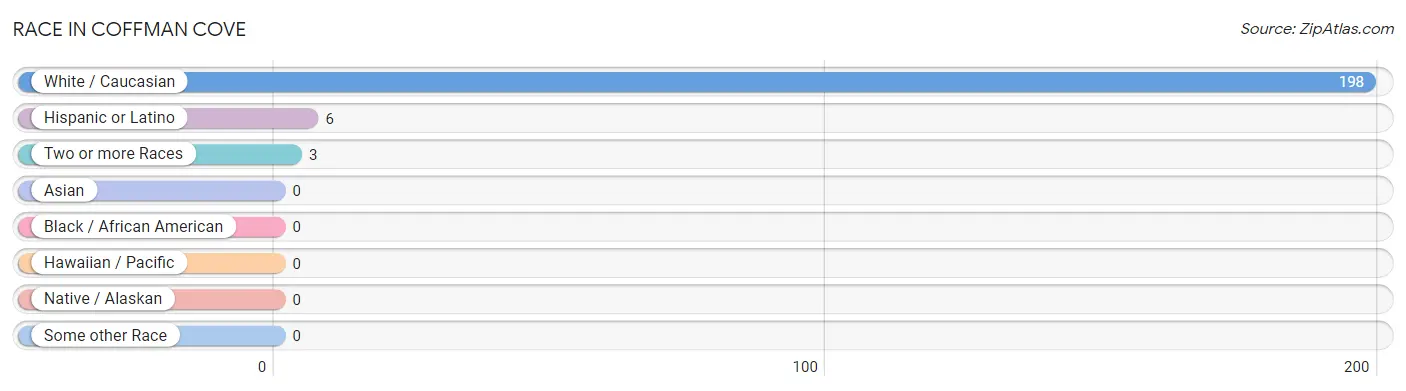
| Race | # Population | % Population |
| Asian | 0 | 0.0% |
| Black / African American | 0 | 0.0% |
| Hawaiian / Pacific | 0 | 0.0% |
| Hispanic or Latino | 6 | 3.0% |
| Native / Alaskan | 0 | 0.0% |
| White / Caucasian | 198 | 98.5% |
| Two or more Races | 3 | 1.5% |
| Some other Race | 0 | 0.0% |
| Total | 201 | 100.0% |
Ancestry in Coffman Cove
The most populous ancestries reported in Coffman Cove are German (119 | 59.2%), Irish (90 | 44.8%), Italian (30 | 14.9%), Scottish (9 | 4.5%), and French (8 | 4.0%), together accounting for 127.4% of all Coffman Cove residents.
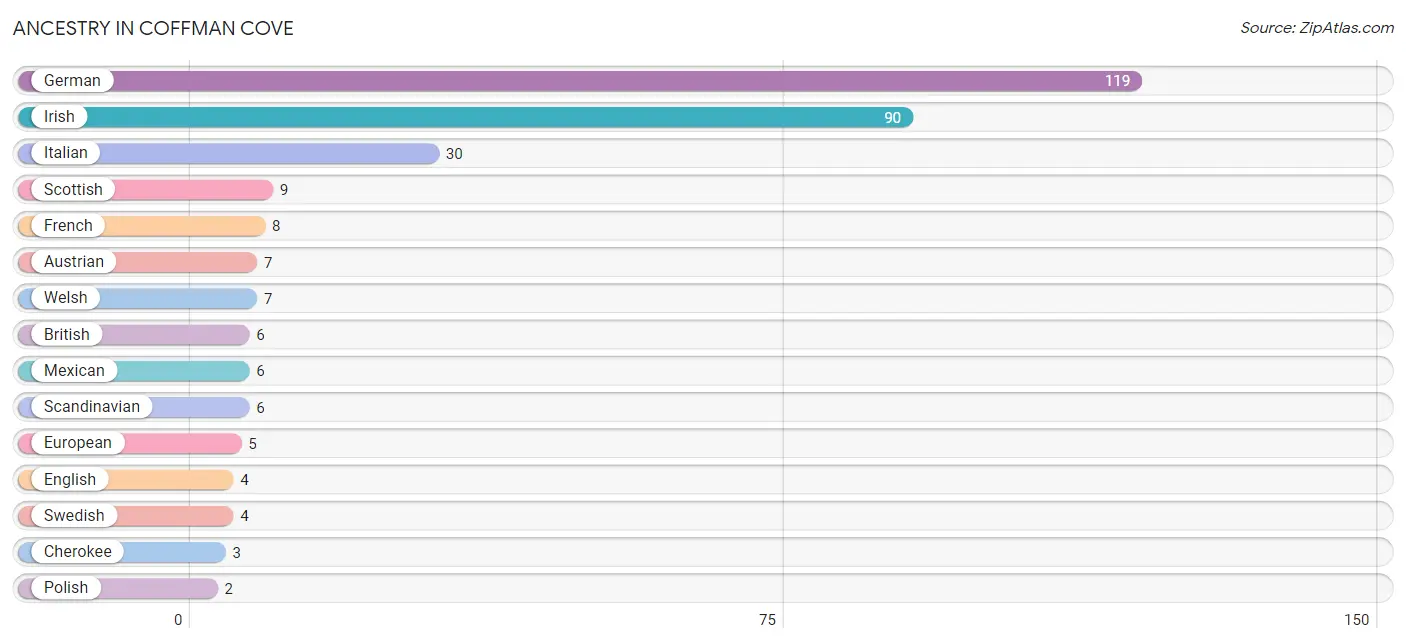
| Ancestry | # Population | % Population |
| Austrian | 7 | 3.5% |
| British | 6 | 3.0% |
| Cherokee | 3 | 1.5% |
| English | 4 | 2.0% |
| European | 5 | 2.5% |
| French | 8 | 4.0% |
| German | 119 | 59.2% |
| Irish | 90 | 44.8% |
| Italian | 30 | 14.9% |
| Mexican | 6 | 3.0% |
| Polish | 2 | 1.0% |
| Portuguese | 2 | 1.0% |
| Scandinavian | 6 | 3.0% |
| Scottish | 9 | 4.5% |
| Swedish | 4 | 2.0% |
| Welsh | 7 | 3.5% | View All 16 Rows |
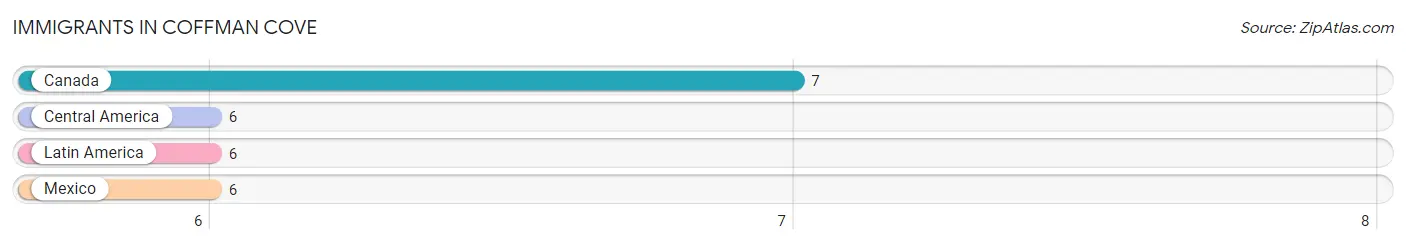
Immigrants in Coffman Cove
The most numerous immigrant groups reported in Coffman Cove came from Canada (7 | 3.5%), Central America (6 | 3.0%), Latin America (6 | 3.0%), and Mexico (6 | 3.0%), together accounting for 12.4% of all Coffman Cove residents.
| Immigration Origin | # Population | % Population |
| Canada | 7 | 3.5% |
| Central America | 6 | 3.0% |
| Latin America | 6 | 3.0% |
| Mexico | 6 | 3.0% | View All 4 Rows |
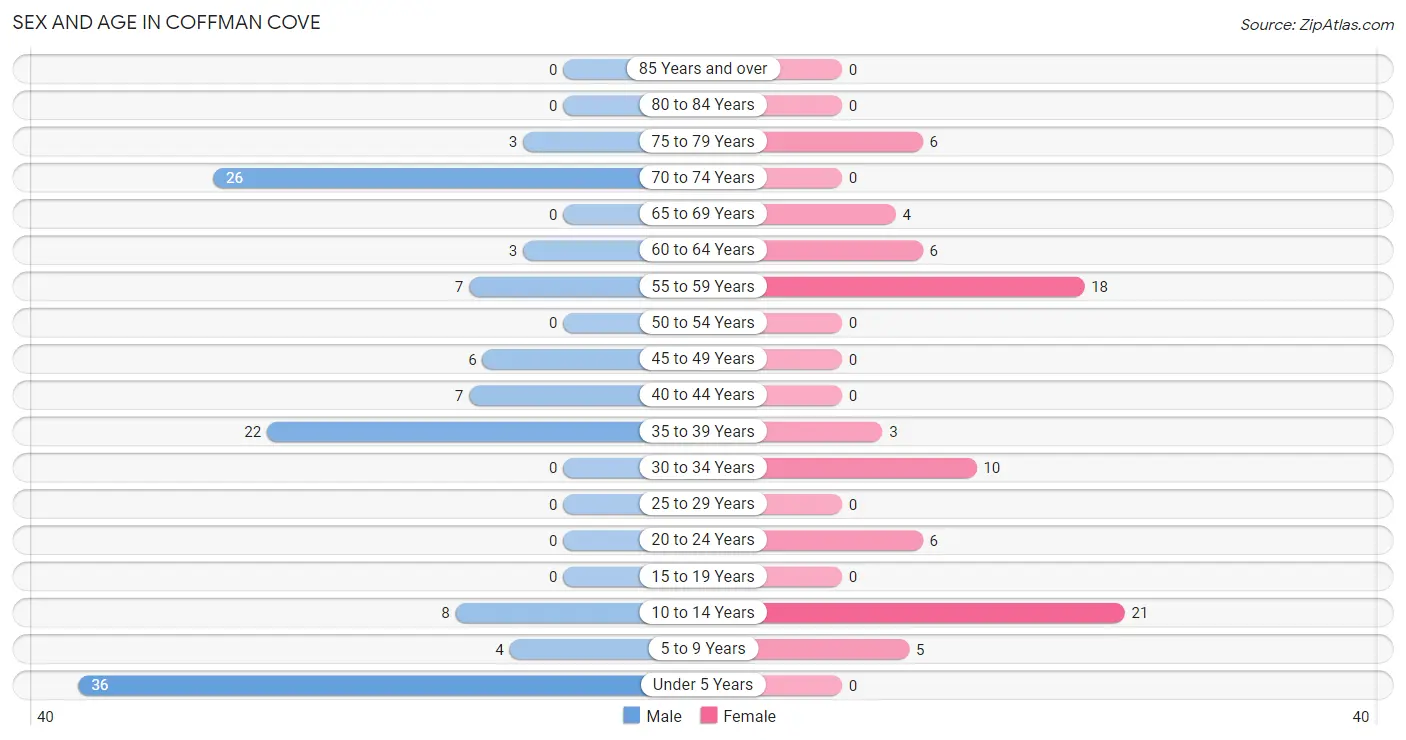
Sex and Age in Coffman Cove
Sex and Age in Coffman Cove
The most populous age groups in Coffman Cove are Under 5 Years (36 | 29.5%) for men and 10 to 14 Years (21 | 26.6%) for women.
| Age Bracket | Male | Female |
| Under 5 Years | 36 (29.5%) | 0 (0.0%) |
| 5 to 9 Years | 4 (3.3%) | 5 (6.3%) |
| 10 to 14 Years | 8 (6.6%) | 21 (26.6%) |
| 15 to 19 Years | 0 (0.0%) | 0 (0.0%) |
| 20 to 24 Years | 0 (0.0%) | 6 (7.6%) |
| 25 to 29 Years | 0 (0.0%) | 0 (0.0%) |
| 30 to 34 Years | 0 (0.0%) | 10 (12.7%) |
| 35 to 39 Years | 22 (18.0%) | 3 (3.8%) |
| 40 to 44 Years | 7 (5.7%) | 0 (0.0%) |
| 45 to 49 Years | 6 (4.9%) | 0 (0.0%) |
| 50 to 54 Years | 0 (0.0%) | 0 (0.0%) |
| 55 to 59 Years | 7 (5.7%) | 18 (22.8%) |
| 60 to 64 Years | 3 (2.5%) | 6 (7.6%) |
| 65 to 69 Years | 0 (0.0%) | 4 (5.1%) |
| 70 to 74 Years | 26 (21.3%) | 0 (0.0%) |
| 75 to 79 Years | 3 (2.5%) | 6 (7.6%) |
| 80 to 84 Years | 0 (0.0%) | 0 (0.0%) |
| 85 Years and over | 0 (0.0%) | 0 (0.0%) |
| Total | 122 (100.0%) | 79 (100.0%) |
Families and Households in Coffman Cove
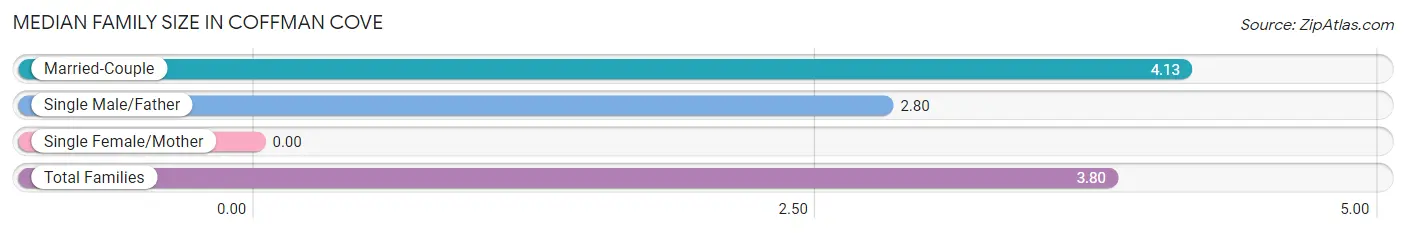
Median Family Size in Coffman Cove
| Family Type | # Families | Family Size |
| Married-Couple | 30 (75.0%) | 4.13 |
| Single Male/Father | 10 (25.0%) | 2.80 |
| Single Female/Mother | 0 (0.0%) | - |
| Total Families | 40 (100.0%) | 3.80 |
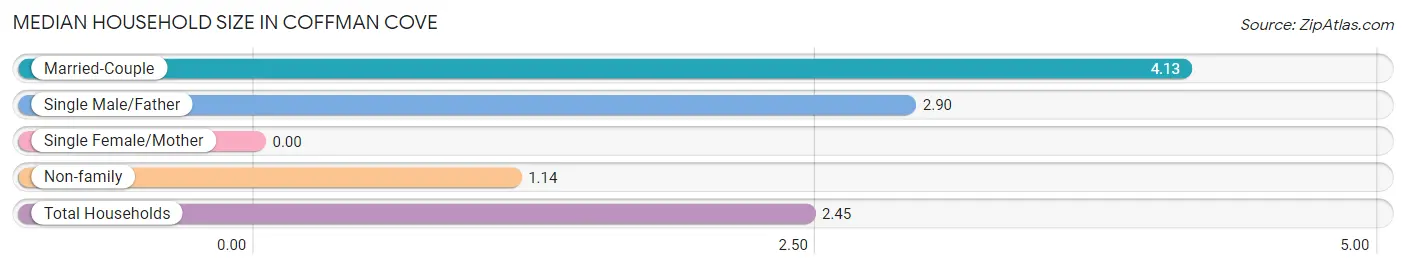
Median Household Size in Coffman Cove
| Household Type | # Households | Household Size |
| Married-Couple | 30 (36.6%) | 4.13 |
| Single Male/Father | 10 (12.2%) | 2.90 |
| Single Female/Mother | 0 (0.0%) | - |
| Non-family | 42 (51.2%) | 1.14 |
| Total Households | 82 (100.0%) | 2.45 |
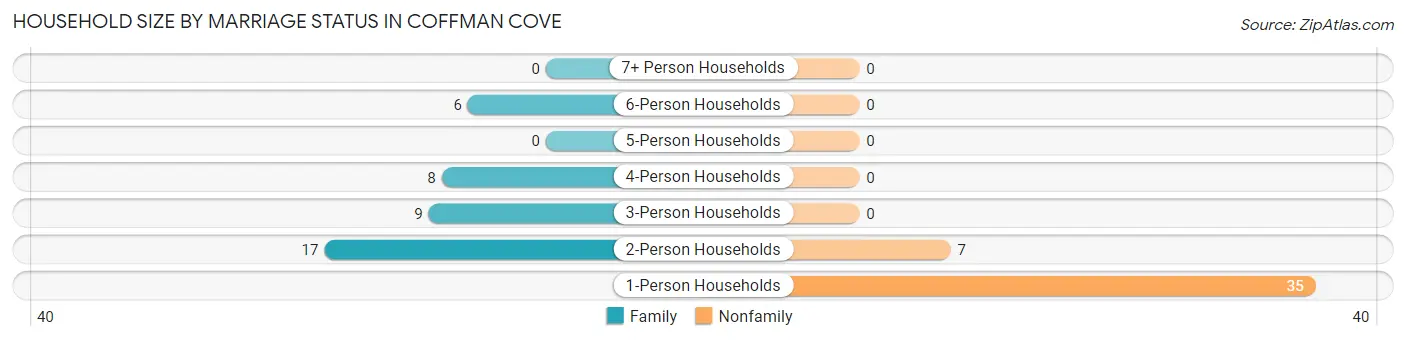
Household Size by Marriage Status in Coffman Cove
Out of a total of 82 households in Coffman Cove, 40 (48.8%) are family households, while 42 (51.2%) are nonfamily households. The most numerous type of family households are 2-person households, comprising 17, and the most common type of nonfamily households are 1-person households, comprising 35.
| Household Size | Family Households | Nonfamily Households |
| 1-Person Households | - | 35 (42.7%) |
| 2-Person Households | 17 (20.7%) | 7 (8.5%) |
| 3-Person Households | 9 (11.0%) | 0 (0.0%) |
| 4-Person Households | 8 (9.8%) | 0 (0.0%) |
| 5-Person Households | 0 (0.0%) | 0 (0.0%) |
| 6-Person Households | 6 (7.3%) | 0 (0.0%) |
| 7+ Person Households | 0 (0.0%) | 0 (0.0%) |
| Total | 40 (48.8%) | 42 (51.2%) |
Female Fertility in Coffman Cove
Fertility by Age in Coffman Cove
| Age Bracket | Women with Births | Births / 1,000 Women |
| 15 to 19 years | 0 (0.0%) | 0.0 |
| 20 to 34 years | 0 (0.0%) | 0.0 |
| 35 to 50 years | 0 (0.0%) | 0.0 |
| Total | 0 (0.0%) | 0.0 |
Fertility by Age by Marriage Status in Coffman Cove
| Age Bracket | Married | Unmarried |
| 15 to 19 years | 0 (0.0%) | 0 (0.0%) |
| 20 to 34 years | 0 (0.0%) | 0 (0.0%) |
| 35 to 50 years | 0 (0.0%) | 0 (0.0%) |
| Total | 0 (0.0%) | 0 (0.0%) |
Fertility by Education in Coffman Cove
| Educational Attainment | Women with Births | Births / 1,000 Women |
| Less than High School | 0 (0.0%) | 0.0 |
| High School Diploma | 0 (0.0%) | 0.0 |
| College or Associate's Degree | 0 (0.0%) | 0.0 |
| Bachelor's Degree | 0 (0.0%) | 0.0 |
| Graduate Degree | 0 (0.0%) | 0.0 |
| Total | 0 (0.0%) | 0.0 |
Fertility by Education by Marriage Status in Coffman Cove
| Educational Attainment | Married | Unmarried |
| Less than High School | 0 (0.0%) | 0 (0.0%) |
| High School Diploma | 0 (0.0%) | 0 (0.0%) |
| College or Associate's Degree | 0 (0.0%) | 0 (0.0%) |
| Bachelor's Degree | 0 (0.0%) | 0 (0.0%) |
| Graduate Degree | 0 (0.0%) | 0 (0.0%) |
| Total | 0 (0.0%) | 0 (0.0%) |
Employment Characteristics in Coffman Cove
Employment by Class of Employer in Coffman Cove
Among the 80 employed individuals in Coffman Cove, private company employees (33 | 41.2%), local government employees (20 | 25.0%), and self-employed (incorporated) (15 | 18.8%) make up the most common classes of employment.
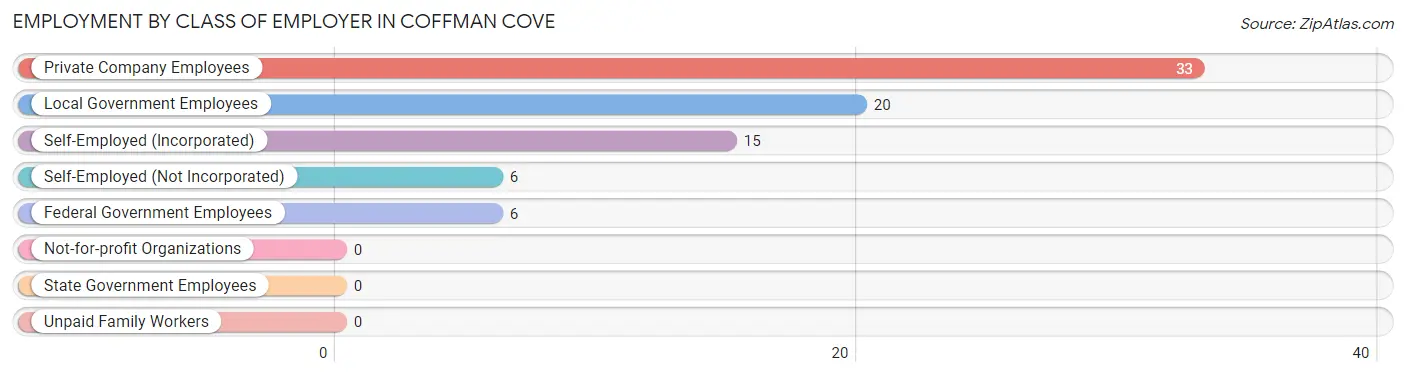
| Employer Class | # Employees | % Employees |
| Private Company Employees | 33 | 41.2% |
| Self-Employed (Incorporated) | 15 | 18.8% |
| Self-Employed (Not Incorporated) | 6 | 7.5% |
| Not-for-profit Organizations | 0 | 0.0% |
| Local Government Employees | 20 | 25.0% |
| State Government Employees | 0 | 0.0% |
| Federal Government Employees | 6 | 7.5% |
| Unpaid Family Workers | 0 | 0.0% |
| Total | 80 | 100.0% |
Employment Status by Age in Coffman Cove
According to the labor force statistics for Coffman Cove, out of the total population over 16 years of age (127), 68.5% or 87 individuals are in the labor force, with 8.0% or 7 of them unemployed. The age group with the highest labor force participation rate is 20 to 24 years, with 100.0% or 6 individuals in the labor force. Within the labor force, the 55 to 59 years age range has the highest percentage of unemployed individuals, with 36.8% or 7 of them being unemployed.
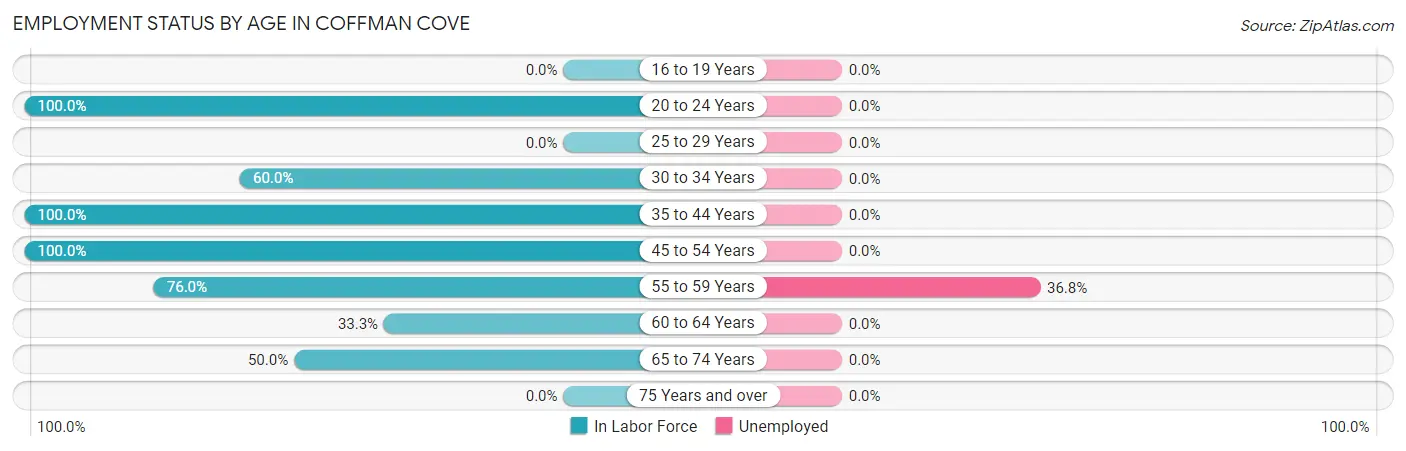
| Age Bracket | In Labor Force | Unemployed |
| 16 to 19 Years | 0 (0.0%) | 0 (0.0%) |
| 20 to 24 Years | 6 (100.0%) | 0 (0.0%) |
| 25 to 29 Years | 0 (0.0%) | 0 (0.0%) |
| 30 to 34 Years | 6 (60.0%) | 0 (0.0%) |
| 35 to 44 Years | 32 (100.0%) | 0 (0.0%) |
| 45 to 54 Years | 6 (100.0%) | 0 (0.0%) |
| 55 to 59 Years | 19 (76.0%) | 7 (36.8%) |
| 60 to 64 Years | 3 (33.3%) | 0 (0.0%) |
| 65 to 74 Years | 15 (50.0%) | 0 (0.0%) |
| 75 Years and over | 0 (0.0%) | 0 (0.0%) |
| Total | 87 (68.5%) | 7 (8.0%) |
Employment Status by Educational Attainment in Coffman Cove
According to labor force statistics for Coffman Cove, 80.5% of individuals (66) out of the total population between 25 and 64 years of age (82) are in the labor force, with 10.6% or 7 of them being unemployed. The group with the highest labor force participation rate are those with the educational attainment of less than high school, with 100.0% or 6 individuals in the labor force. Within the labor force, individuals with college / associate degree education have the highest percentage of unemployment, with 14.6% or 7 of them being unemployed.
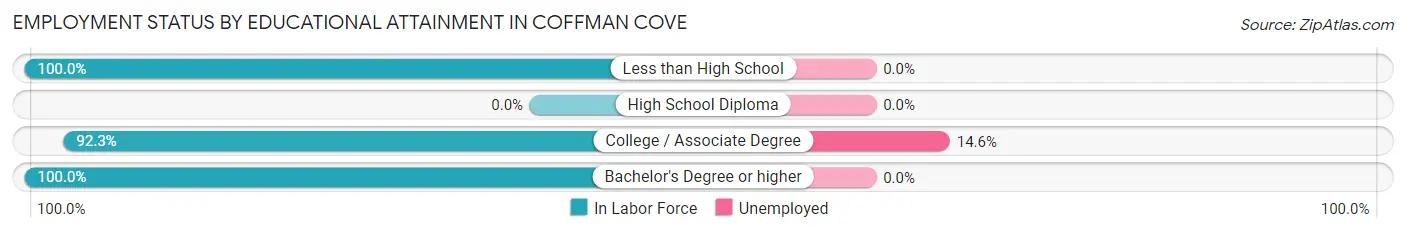
| Educational Attainment | In Labor Force | Unemployed |
| Less than High School | 6 (100.0%) | 0 (0.0%) |
| High School Diploma | 0 (0.0%) | 0 (0.0%) |
| College / Associate Degree | 48 (92.3%) | 8 (14.6%) |
| Bachelor's Degree or higher | 12 (100.0%) | 0 (0.0%) |
| Total | 66 (80.5%) | 9 (10.6%) |
Employment Occupations by Sex in Coffman Cove
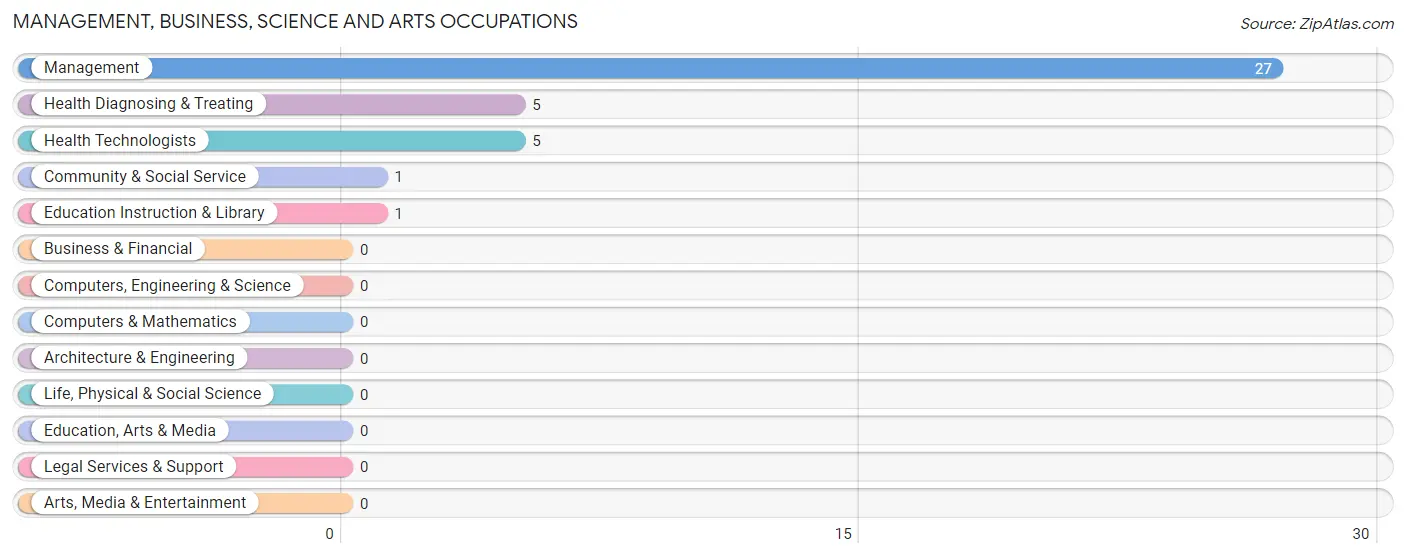
Management, Business, Science and Arts Occupations
The most common Management, Business, Science and Arts occupations in Coffman Cove are Management (27 | 33.8%), Health Diagnosing & Treating (5 | 6.2%), Health Technologists (5 | 6.2%), Community & Social Service (1 | 1.3%), and Education Instruction & Library (1 | 1.3%).
Management, Business, Science and Arts Occupations by Sex
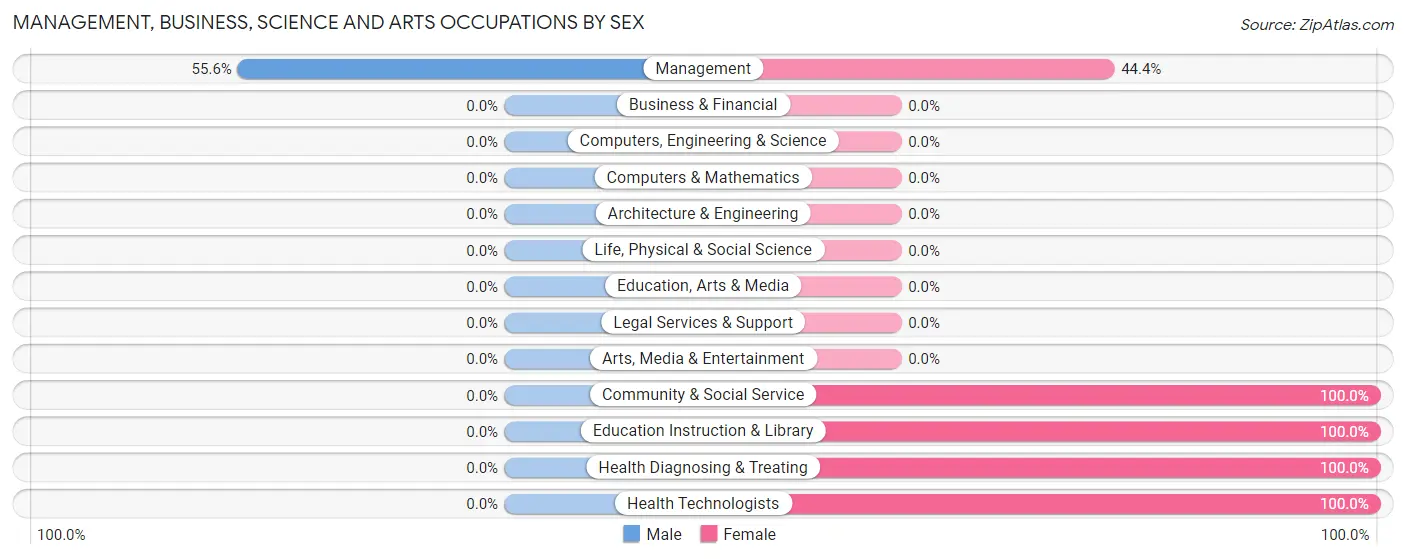
| Occupation | Male | Female |
| Management | 15 (55.6%) | 12 (44.4%) |
| Business & Financial | 0 (0.0%) | 0 (0.0%) |
| Computers, Engineering & Science | 0 (0.0%) | 0 (0.0%) |
| Computers & Mathematics | 0 (0.0%) | 0 (0.0%) |
| Architecture & Engineering | 0 (0.0%) | 0 (0.0%) |
| Life, Physical & Social Science | 0 (0.0%) | 0 (0.0%) |
| Community & Social Service | 0 (0.0%) | 1 (100.0%) |
| Education, Arts & Media | 0 (0.0%) | 0 (0.0%) |
| Legal Services & Support | 0 (0.0%) | 0 (0.0%) |
| Education Instruction & Library | 0 (0.0%) | 1 (100.0%) |
| Arts, Media & Entertainment | 0 (0.0%) | 0 (0.0%) |
| Health Diagnosing & Treating | 0 (0.0%) | 5 (100.0%) |
| Health Technologists | 0 (0.0%) | 5 (100.0%) |
| Total (Category) | 15 (45.5%) | 18 (54.5%) |
| Total (Overall) | 53 (66.2%) | 27 (33.8%) |
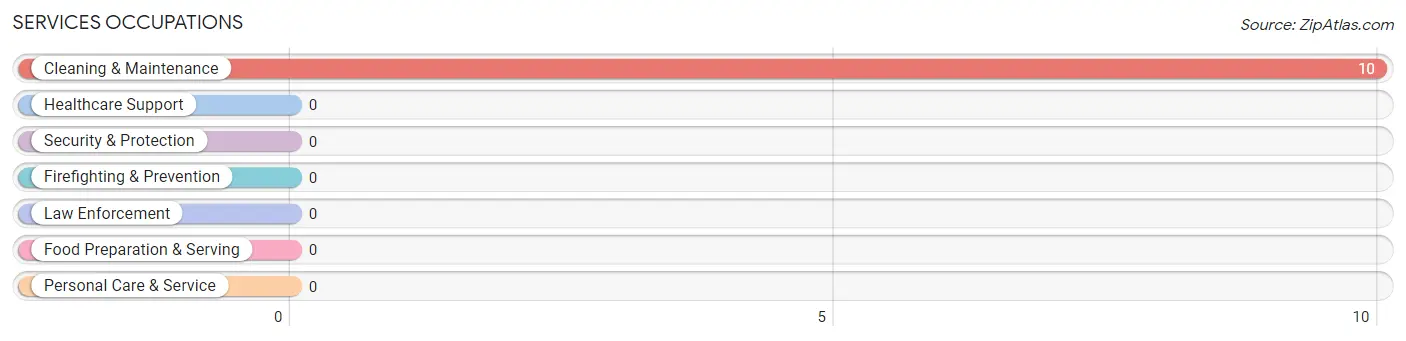
Services Occupations
The most common Services occupations in Coffman Cove are , and Cleaning & Maintenance (10 | 12.5%).
Services Occupations by Sex
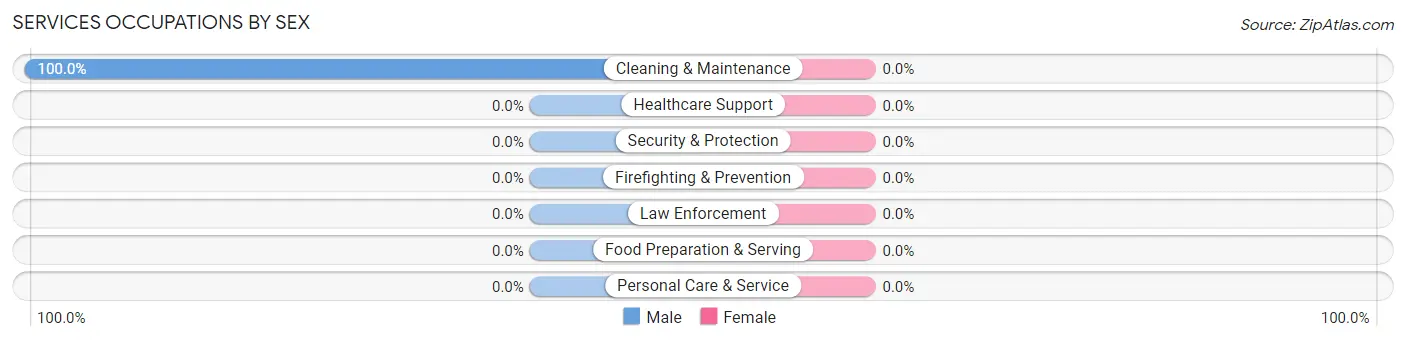
| Occupation | Male | Female |
| Healthcare Support | 0 (0.0%) | 0 (0.0%) |
| Security & Protection | 0 (0.0%) | 0 (0.0%) |
| Firefighting & Prevention | 0 (0.0%) | 0 (0.0%) |
| Law Enforcement | 0 (0.0%) | 0 (0.0%) |
| Food Preparation & Serving | 0 (0.0%) | 0 (0.0%) |
| Cleaning & Maintenance | 10 (100.0%) | 0 (0.0%) |
| Personal Care & Service | 0 (0.0%) | 0 (0.0%) |
| Total (Category) | 10 (100.0%) | 0 (0.0%) |
| Total (Overall) | 53 (66.2%) | 27 (33.8%) |
Sales and Office Occupations
The most common Sales and Office occupations in Coffman Cove are , and Office & Administration (13 | 16.3%).
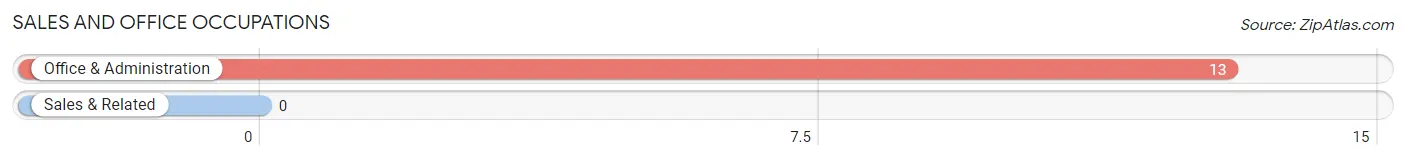
Sales and Office Occupations by Sex
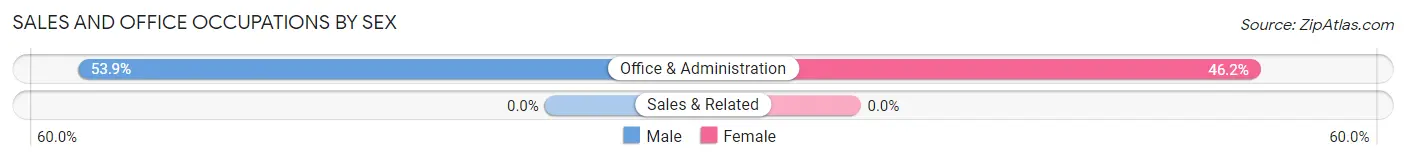
| Occupation | Male | Female |
| Sales & Related | 0 (0.0%) | 0 (0.0%) |
| Office & Administration | 7 (53.8%) | 6 (46.2%) |
| Total (Category) | 7 (53.8%) | 6 (46.2%) |
| Total (Overall) | 53 (66.2%) | 27 (33.8%) |
Natural Resources, Construction and Maintenance Occupations
The most common Natural Resources, Construction and Maintenance occupations in Coffman Cove are Installation, Maintenance & Repair (15 | 18.8%), Construction & Extraction (6 | 7.5%), and Farming, Fishing & Forestry (3 | 3.7%).
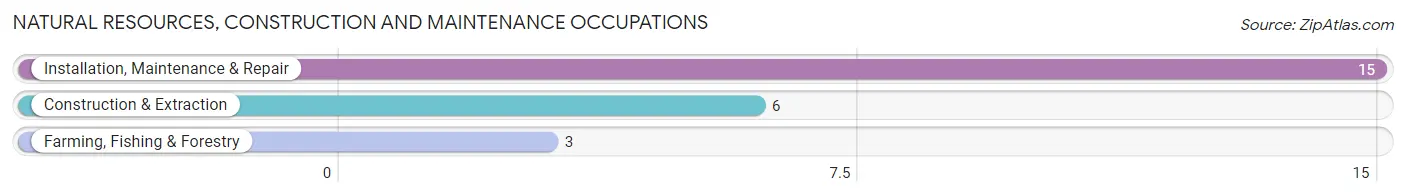
Natural Resources, Construction and Maintenance Occupations by Sex
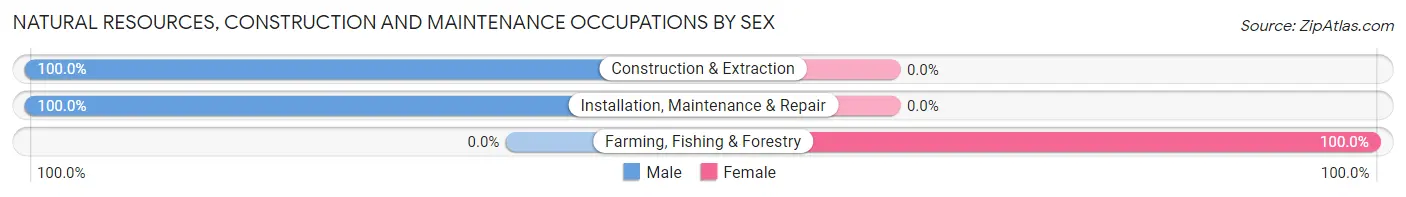
| Occupation | Male | Female |
| Farming, Fishing & Forestry | 0 (0.0%) | 3 (100.0%) |
| Construction & Extraction | 6 (100.0%) | 0 (0.0%) |
| Installation, Maintenance & Repair | 15 (100.0%) | 0 (0.0%) |
| Total (Category) | 21 (87.5%) | 3 (12.5%) |
| Total (Overall) | 53 (66.2%) | 27 (33.8%) |
Production, Transportation and Moving Occupations
Production, Transportation and Moving Occupations by Sex
| Occupation | Male | Female |
| Production | 0 (0.0%) | 0 (0.0%) |
| Transportation | 0 (0.0%) | 0 (0.0%) |
| Material Moving | 0 (0.0%) | 0 (0.0%) |
| Total (Category) | 0 (0.0%) | 0 (0.0%) |
| Total (Overall) | 53 (66.2%) | 27 (33.8%) |
Employment Industries by Sex in Coffman Cove
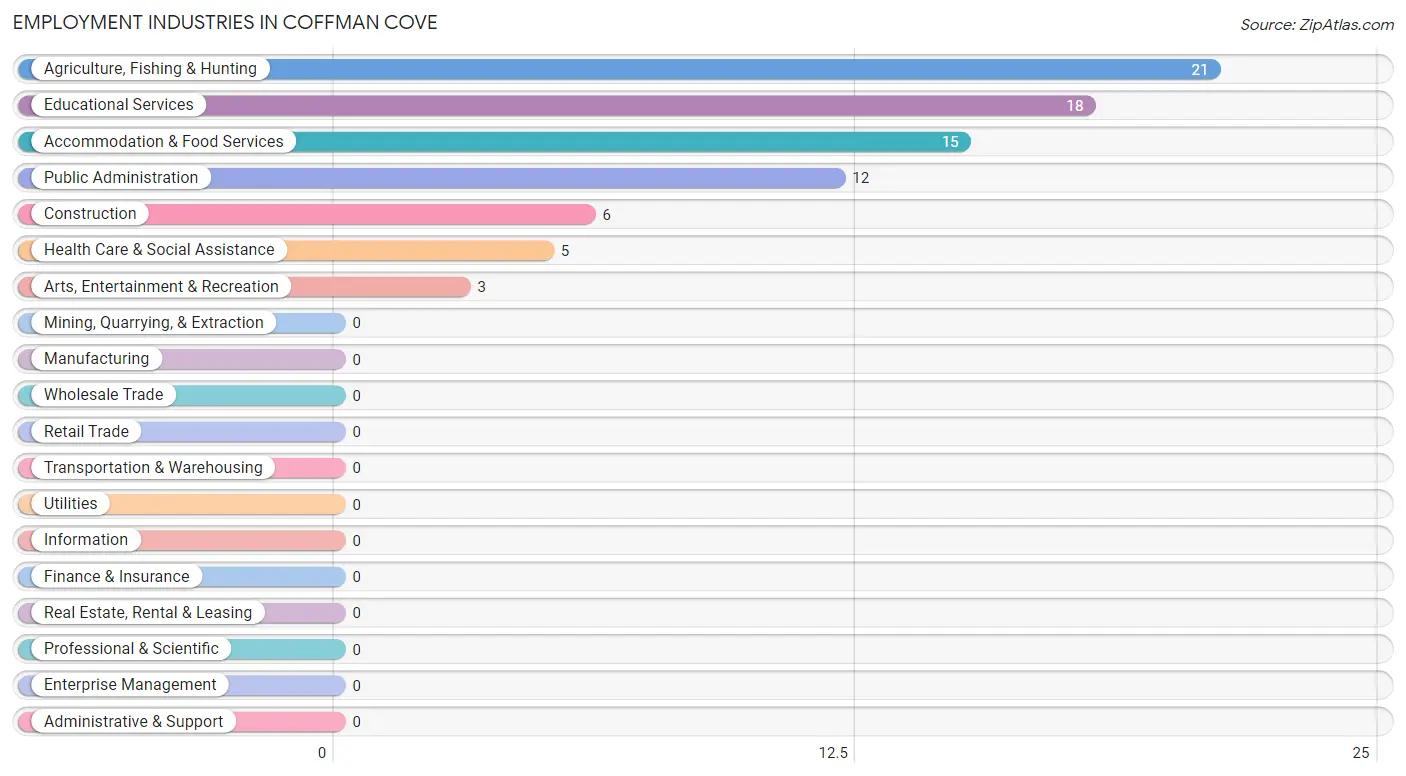
Employment Industries in Coffman Cove
The major employment industries in Coffman Cove include Agriculture, Fishing & Hunting (21 | 26.3%), Educational Services (18 | 22.5%), Accommodation & Food Services (15 | 18.8%), Public Administration (12 | 15.0%), and Construction (6 | 7.5%).
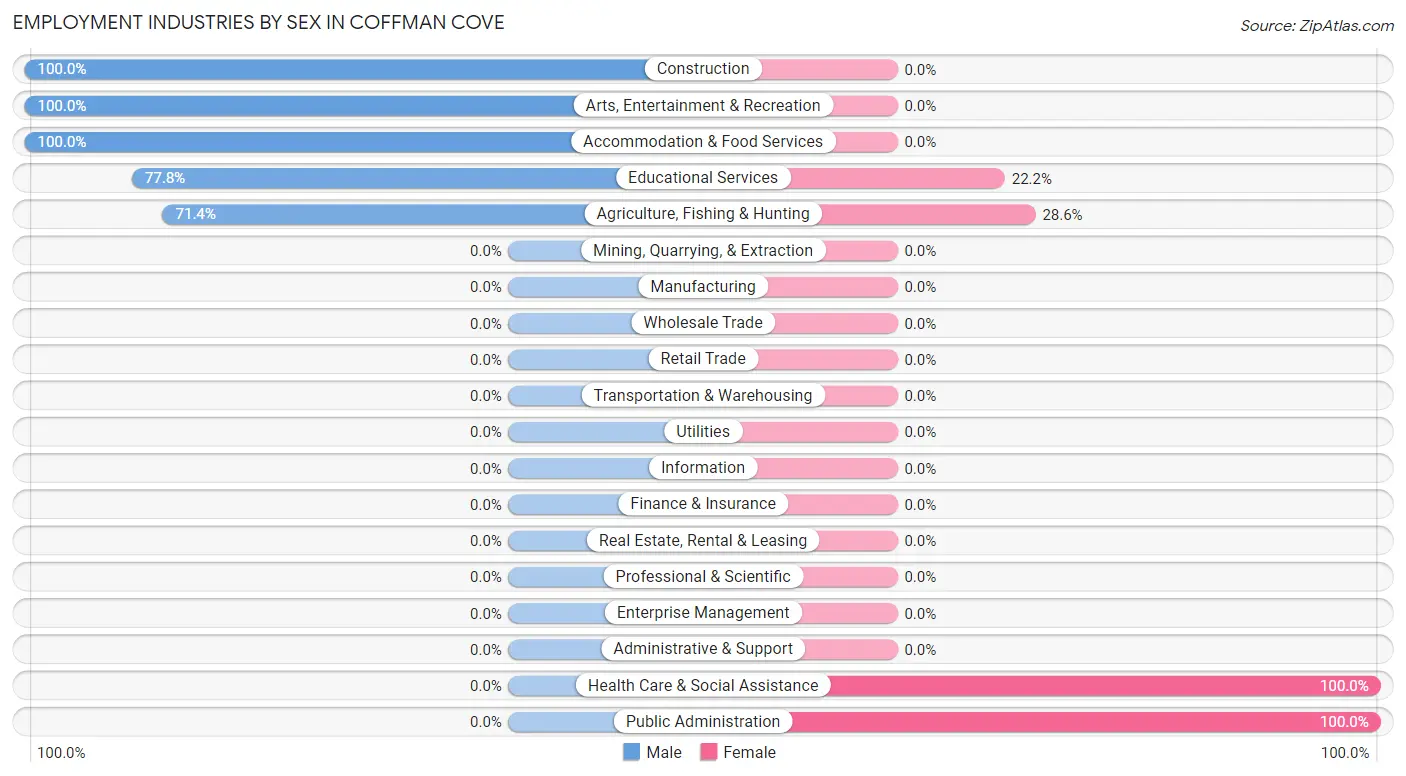
Employment Industries by Sex in Coffman Cove
The Coffman Cove industries that see more men than women are Construction (100.0%), Arts, Entertainment & Recreation (100.0%), and Accommodation & Food Services (100.0%), whereas the industries that tend to have a higher number of women are Health Care & Social Assistance (100.0%), Public Administration (100.0%), and Agriculture, Fishing & Hunting (28.6%).
| Industry | Male | Female |
| Agriculture, Fishing & Hunting | 15 (71.4%) | 6 (28.6%) |
| Mining, Quarrying, & Extraction | 0 (0.0%) | 0 (0.0%) |
| Construction | 6 (100.0%) | 0 (0.0%) |
| Manufacturing | 0 (0.0%) | 0 (0.0%) |
| Wholesale Trade | 0 (0.0%) | 0 (0.0%) |
| Retail Trade | 0 (0.0%) | 0 (0.0%) |
| Transportation & Warehousing | 0 (0.0%) | 0 (0.0%) |
| Utilities | 0 (0.0%) | 0 (0.0%) |
| Information | 0 (0.0%) | 0 (0.0%) |
| Finance & Insurance | 0 (0.0%) | 0 (0.0%) |
| Real Estate, Rental & Leasing | 0 (0.0%) | 0 (0.0%) |
| Professional & Scientific | 0 (0.0%) | 0 (0.0%) |
| Enterprise Management | 0 (0.0%) | 0 (0.0%) |
| Administrative & Support | 0 (0.0%) | 0 (0.0%) |
| Educational Services | 14 (77.8%) | 4 (22.2%) |
| Health Care & Social Assistance | 0 (0.0%) | 5 (100.0%) |
| Arts, Entertainment & Recreation | 3 (100.0%) | 0 (0.0%) |
| Accommodation & Food Services | 15 (100.0%) | 0 (0.0%) |
| Public Administration | 0 (0.0%) | 12 (100.0%) |
| Total | 53 (66.2%) | 27 (33.8%) |
Education in Coffman Cove
School Enrollment in Coffman Cove
The most common levels of schooling among the 53 students in Coffman Cove are middle school (16 | 30.2%), nursery / preschool (15 | 28.3%), and elementary school (11 | 20.7%).
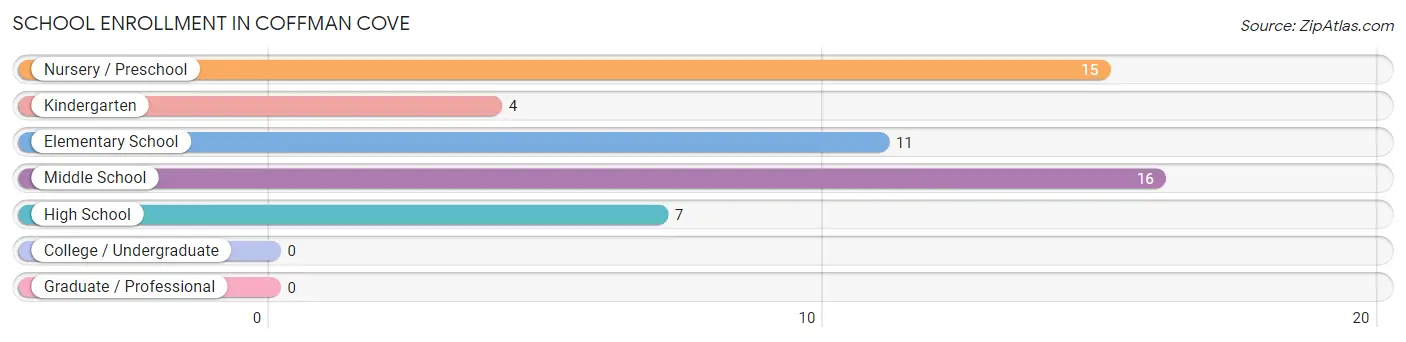
| School Level | # Students | % Students |
| Nursery / Preschool | 15 | 28.3% |
| Kindergarten | 4 | 7.5% |
| Elementary School | 11 | 20.7% |
| Middle School | 16 | 30.2% |
| High School | 7 | 13.2% |
| College / Undergraduate | 0 | 0.0% |
| Graduate / Professional | 0 | 0.0% |
| Total | 53 | 100.0% |
School Enrollment by Age by Funding Source in Coffman Cove
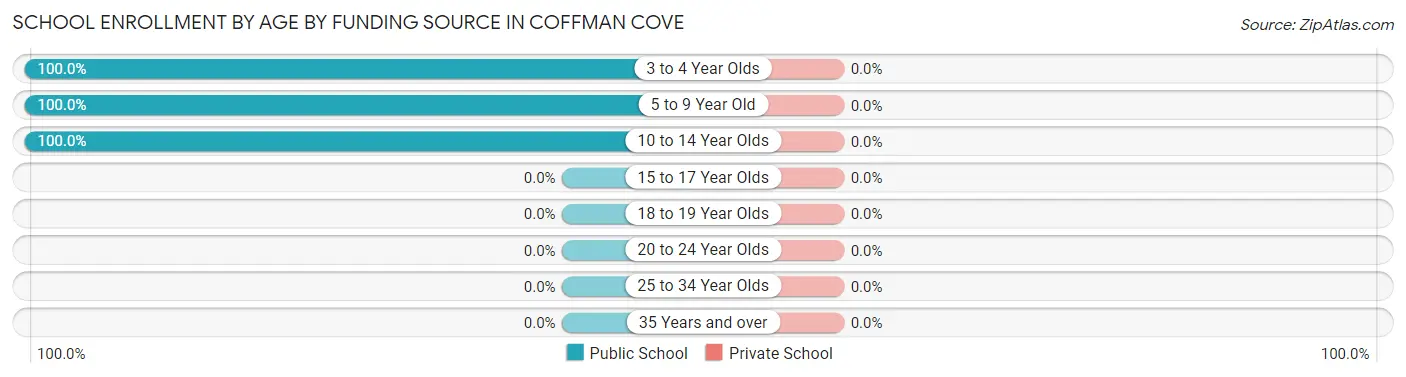
| Age Bracket | Public School | Private School |
| 3 to 4 Year Olds | 15 (100.0%) | 0 (0.0%) |
| 5 to 9 Year Old | 9 (100.0%) | 0 (0.0%) |
| 10 to 14 Year Olds | 29 (100.0%) | 0 (0.0%) |
| 15 to 17 Year Olds | 0 (0.0%) | 0 (0.0%) |
| 18 to 19 Year Olds | 0 (0.0%) | 0 (0.0%) |
| 20 to 24 Year Olds | 0 (0.0%) | 0 (0.0%) |
| 25 to 34 Year Olds | 0 (0.0%) | 0 (0.0%) |
| 35 Years and over | 0 (0.0%) | 0 (0.0%) |
| Total | 53 (100.0%) | 0 (0.0%) |
Educational Attainment by Field of Study in Coffman Cove
Business (8 | 34.8%), liberal arts & history (7 | 30.4%), engineering (5 | 21.7%), social sciences (2 | 8.7%), and literature & languages (1 | 4.3%) are the most common fields of study among 23 individuals in Coffman Cove who have obtained a bachelor's degree or higher.
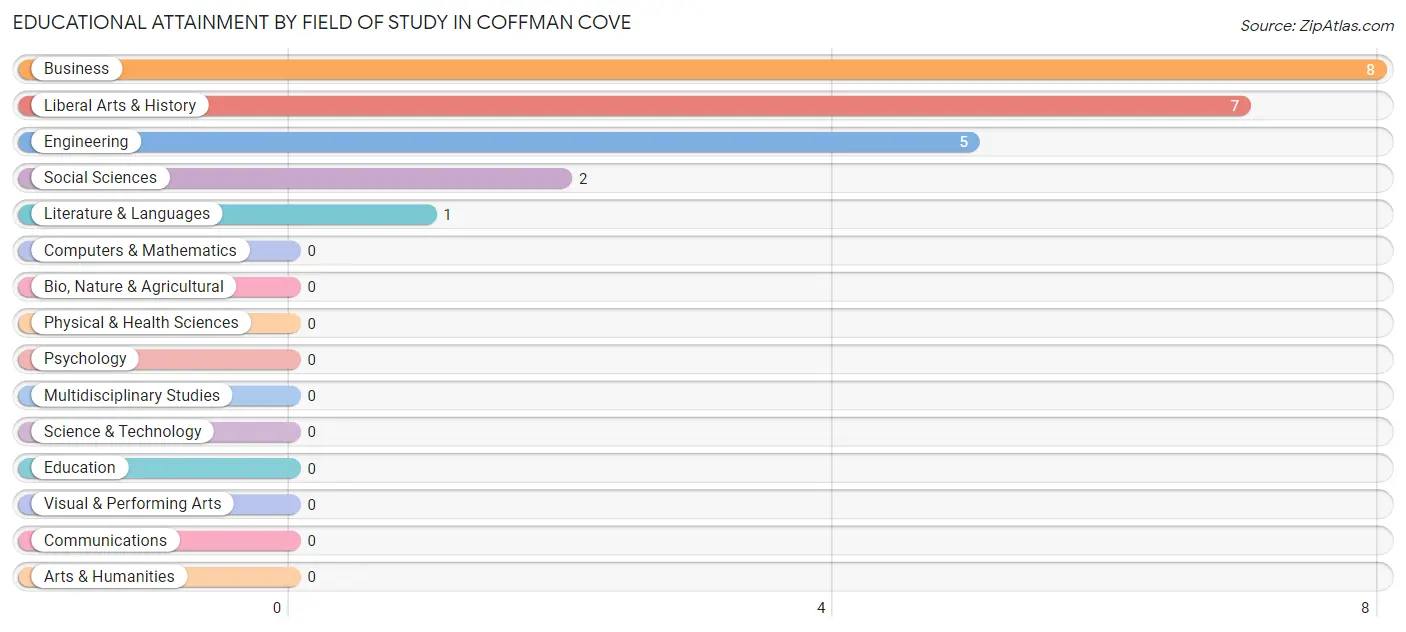
| Field of Study | # Graduates | % Graduates |
| Computers & Mathematics | 0 | 0.0% |
| Bio, Nature & Agricultural | 0 | 0.0% |
| Physical & Health Sciences | 0 | 0.0% |
| Psychology | 0 | 0.0% |
| Social Sciences | 2 | 8.7% |
| Engineering | 5 | 21.7% |
| Multidisciplinary Studies | 0 | 0.0% |
| Science & Technology | 0 | 0.0% |
| Business | 8 | 34.8% |
| Education | 0 | 0.0% |
| Literature & Languages | 1 | 4.3% |
| Liberal Arts & History | 7 | 30.4% |
| Visual & Performing Arts | 0 | 0.0% |
| Communications | 0 | 0.0% |
| Arts & Humanities | 0 | 0.0% |
| Total | 23 | 100.0% |
Transportation & Commute in Coffman Cove
Vehicle Availability by Sex in Coffman Cove
The most prevalent vehicle ownership categories in Coffman Cove are males with 2 vehicles (30, accounting for 56.6%) and females with 2 vehicles (6, making up 111.1%).
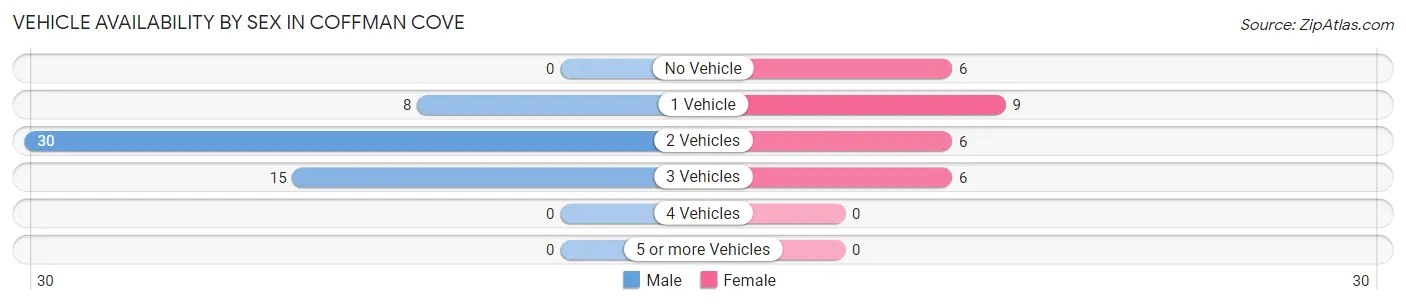
| Vehicles Available | Male | Female |
| No Vehicle | 0 (0.0%) | 6 (22.2%) |
| 1 Vehicle | 8 (15.1%) | 9 (33.3%) |
| 2 Vehicles | 30 (56.6%) | 6 (22.2%) |
| 3 Vehicles | 15 (28.3%) | 6 (22.2%) |
| 4 Vehicles | 0 (0.0%) | 0 (0.0%) |
| 5 or more Vehicles | 0 (0.0%) | 0 (0.0%) |
| Total | 53 (100.0%) | 27 (100.0%) |
Commute Time in Coffman Cove
The most frequently occuring commute durations in Coffman Cove are 5 to 9 minutes (32 commuters, 43.2%), 60 to 89 minutes (21 commuters, 28.4%), and less than 5 minutes (15 commuters, 20.3%).
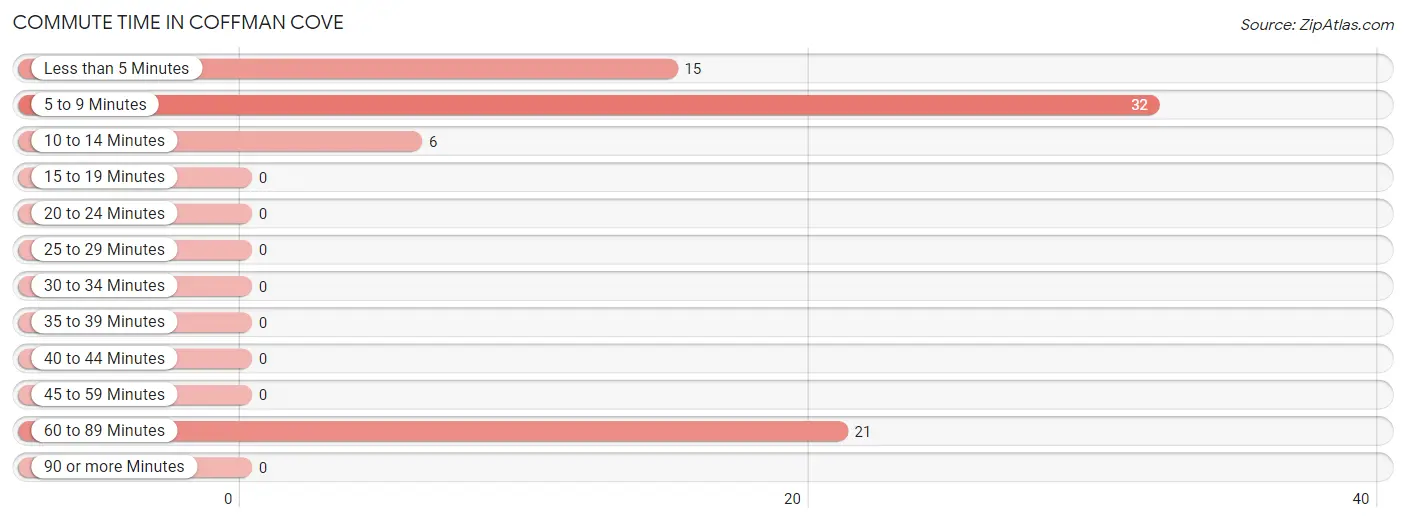
| Commute Time | # Commuters | % Commuters |
| Less than 5 Minutes | 15 | 20.3% |
| 5 to 9 Minutes | 32 | 43.2% |
| 10 to 14 Minutes | 6 | 8.1% |
| 15 to 19 Minutes | 0 | 0.0% |
| 20 to 24 Minutes | 0 | 0.0% |
| 25 to 29 Minutes | 0 | 0.0% |
| 30 to 34 Minutes | 0 | 0.0% |
| 35 to 39 Minutes | 0 | 0.0% |
| 40 to 44 Minutes | 0 | 0.0% |
| 45 to 59 Minutes | 0 | 0.0% |
| 60 to 89 Minutes | 21 | 28.4% |
| 90 or more Minutes | 0 | 0.0% |
Commute Time by Sex in Coffman Cove
The most common commute times in Coffman Cove are 60 to 89 minutes (21 commuters, 39.6%) for males and 5 to 9 minutes (15 commuters, 71.4%) for females.
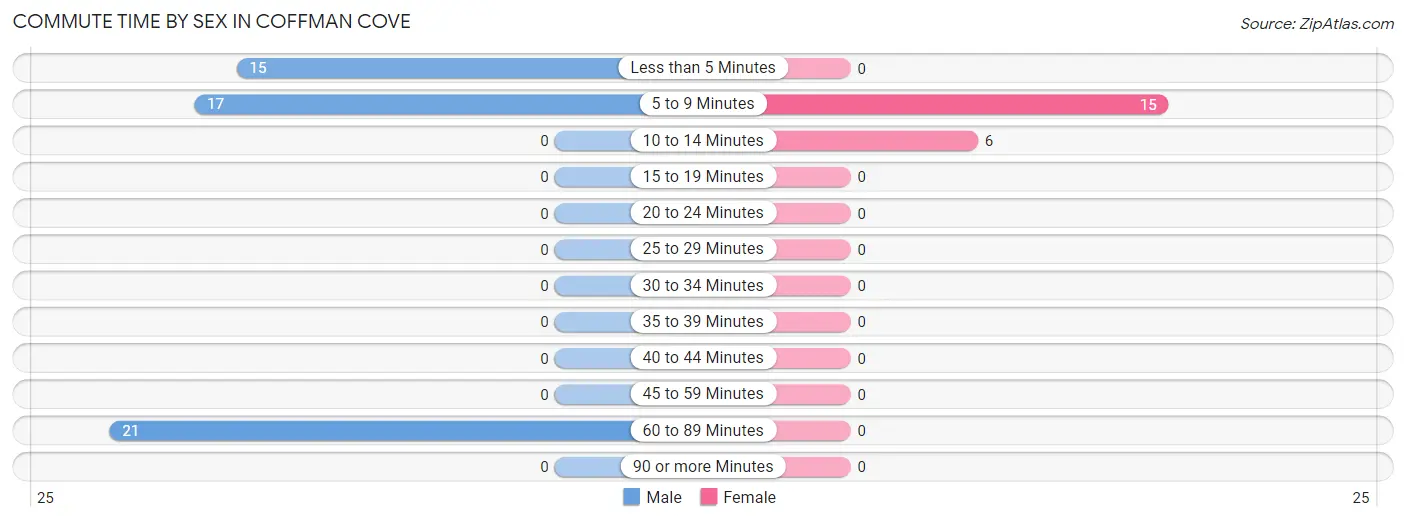
| Commute Time | Male | Female |
| Less than 5 Minutes | 15 (28.3%) | 0 (0.0%) |
| 5 to 9 Minutes | 17 (32.1%) | 15 (71.4%) |
| 10 to 14 Minutes | 0 (0.0%) | 6 (28.6%) |
| 15 to 19 Minutes | 0 (0.0%) | 0 (0.0%) |
| 20 to 24 Minutes | 0 (0.0%) | 0 (0.0%) |
| 25 to 29 Minutes | 0 (0.0%) | 0 (0.0%) |
| 30 to 34 Minutes | 0 (0.0%) | 0 (0.0%) |
| 35 to 39 Minutes | 0 (0.0%) | 0 (0.0%) |
| 40 to 44 Minutes | 0 (0.0%) | 0 (0.0%) |
| 45 to 59 Minutes | 0 (0.0%) | 0 (0.0%) |
| 60 to 89 Minutes | 21 (39.6%) | 0 (0.0%) |
| 90 or more Minutes | 0 (0.0%) | 0 (0.0%) |
Time of Departure to Work by Sex in Coffman Cove
The most frequent times of departure to work in Coffman Cove are 12:00 AM to 4:59 AM (21, 39.6%) for males and 7:30 AM to 7:59 AM (11, 52.4%) for females.
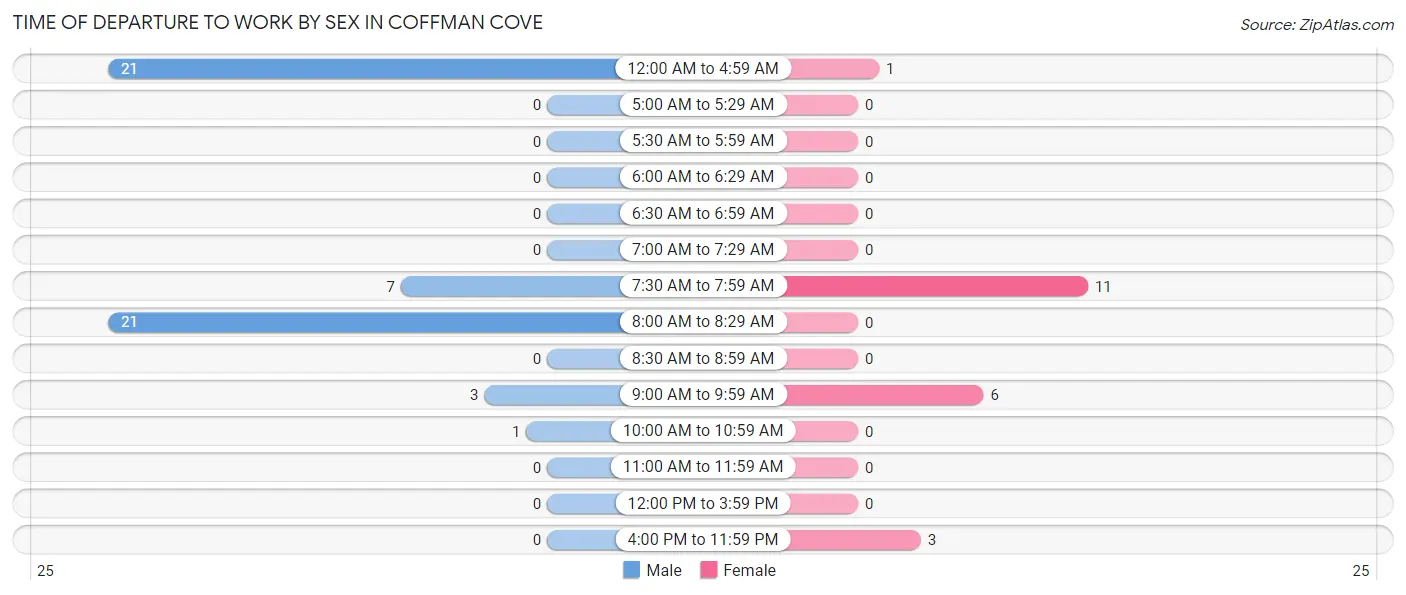
| Time of Departure | Male | Female |
| 12:00 AM to 4:59 AM | 21 (39.6%) | 1 (4.8%) |
| 5:00 AM to 5:29 AM | 0 (0.0%) | 0 (0.0%) |
| 5:30 AM to 5:59 AM | 0 (0.0%) | 0 (0.0%) |
| 6:00 AM to 6:29 AM | 0 (0.0%) | 0 (0.0%) |
| 6:30 AM to 6:59 AM | 0 (0.0%) | 0 (0.0%) |
| 7:00 AM to 7:29 AM | 0 (0.0%) | 0 (0.0%) |
| 7:30 AM to 7:59 AM | 7 (13.2%) | 11 (52.4%) |
| 8:00 AM to 8:29 AM | 21 (39.6%) | 0 (0.0%) |
| 8:30 AM to 8:59 AM | 0 (0.0%) | 0 (0.0%) |
| 9:00 AM to 9:59 AM | 3 (5.7%) | 6 (28.6%) |
| 10:00 AM to 10:59 AM | 1 (1.9%) | 0 (0.0%) |
| 11:00 AM to 11:59 AM | 0 (0.0%) | 0 (0.0%) |
| 12:00 PM to 3:59 PM | 0 (0.0%) | 0 (0.0%) |
| 4:00 PM to 11:59 PM | 0 (0.0%) | 3 (14.3%) |
| Total | 53 (100.0%) | 21 (100.0%) |
Housing Occupancy in Coffman Cove
Occupancy by Ownership in Coffman Cove
Of the total 82 dwellings in Coffman Cove, owner-occupied units account for 73 (89.0%), while renter-occupied units make up 9 (11.0%).
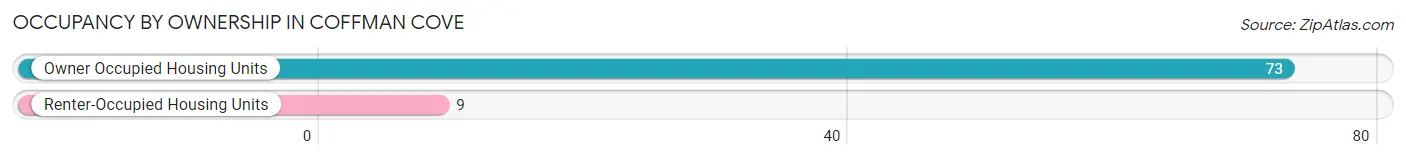
| Occupancy | # Housing Units | % Housing Units |
| Owner Occupied Housing Units | 73 | 89.0% |
| Renter-Occupied Housing Units | 9 | 11.0% |
| Total Occupied Housing Units | 82 | 100.0% |
Occupancy by Household Size in Coffman Cove
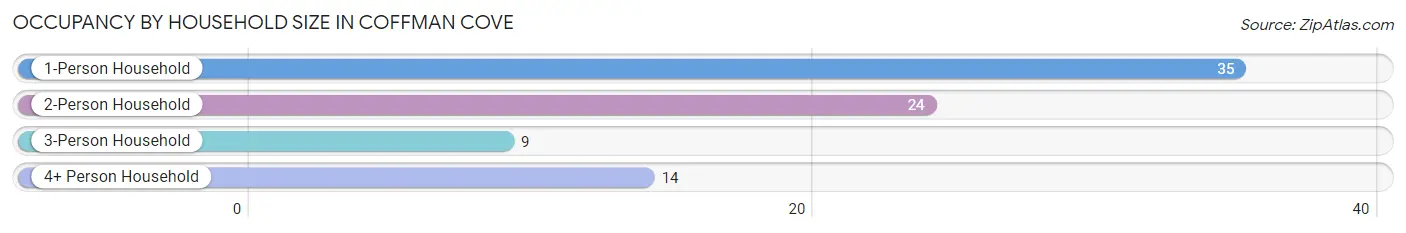
| Household Size | # Housing Units | % Housing Units |
| 1-Person Household | 35 | 42.7% |
| 2-Person Household | 24 | 29.3% |
| 3-Person Household | 9 | 11.0% |
| 4+ Person Household | 14 | 17.1% |
| Total Housing Units | 82 | 100.0% |
Occupancy by Ownership by Household Size in Coffman Cove
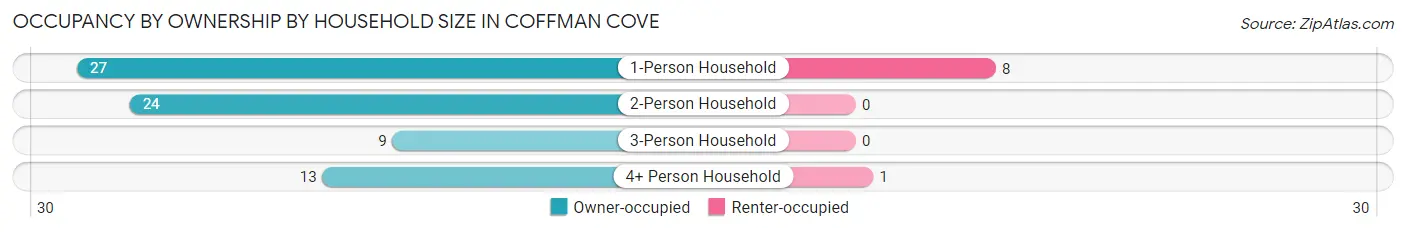
| Household Size | Owner-occupied | Renter-occupied |
| 1-Person Household | 27 (77.1%) | 8 (22.9%) |
| 2-Person Household | 24 (100.0%) | 0 (0.0%) |
| 3-Person Household | 9 (100.0%) | 0 (0.0%) |
| 4+ Person Household | 13 (92.9%) | 1 (7.1%) |
| Total Housing Units | 73 (89.0%) | 9 (11.0%) |
Occupancy by Educational Attainment in Coffman Cove
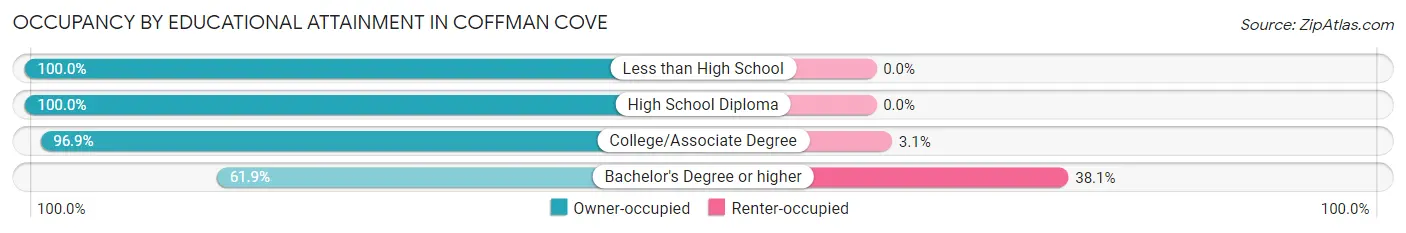
| Household Size | Owner-occupied | Renter-occupied |
| Less than High School | 6 (100.0%) | 0 (0.0%) |
| High School Diploma | 23 (100.0%) | 0 (0.0%) |
| College/Associate Degree | 31 (96.9%) | 1 (3.1%) |
| Bachelor's Degree or higher | 13 (61.9%) | 8 (38.1%) |
Occupancy by Age of Householder in Coffman Cove
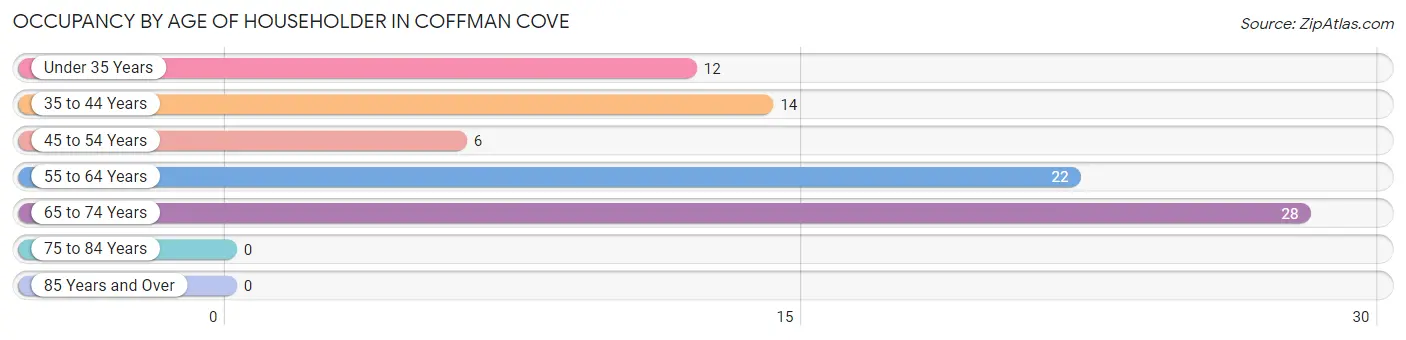
| Age Bracket | # Households | % Households |
| Under 35 Years | 12 | 14.6% |
| 35 to 44 Years | 14 | 17.1% |
| 45 to 54 Years | 6 | 7.3% |
| 55 to 64 Years | 22 | 26.8% |
| 65 to 74 Years | 28 | 34.2% |
| 75 to 84 Years | 0 | 0.0% |
| 85 Years and Over | 0 | 0.0% |
| Total | 82 | 100.0% |
Housing Finances in Coffman Cove
Median Income by Occupancy in Coffman Cove
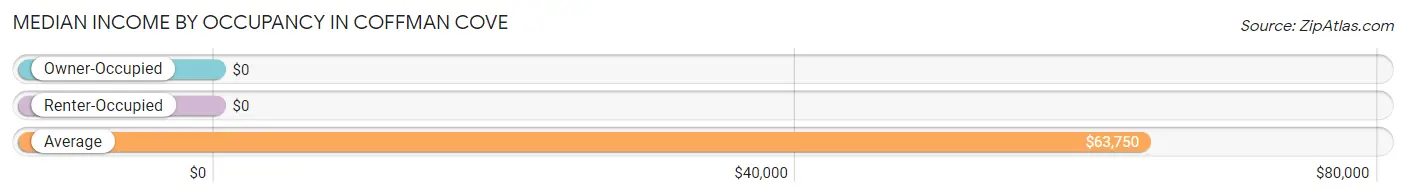
| Occupancy Type | # Households | Median Income |
| Owner-Occupied | 73 (89.0%) | $0 |
| Renter-Occupied | 9 (11.0%) | $0 |
| Average | 82 (100.0%) | $63,750 |
Occupancy by Householder Income Bracket in Coffman Cove
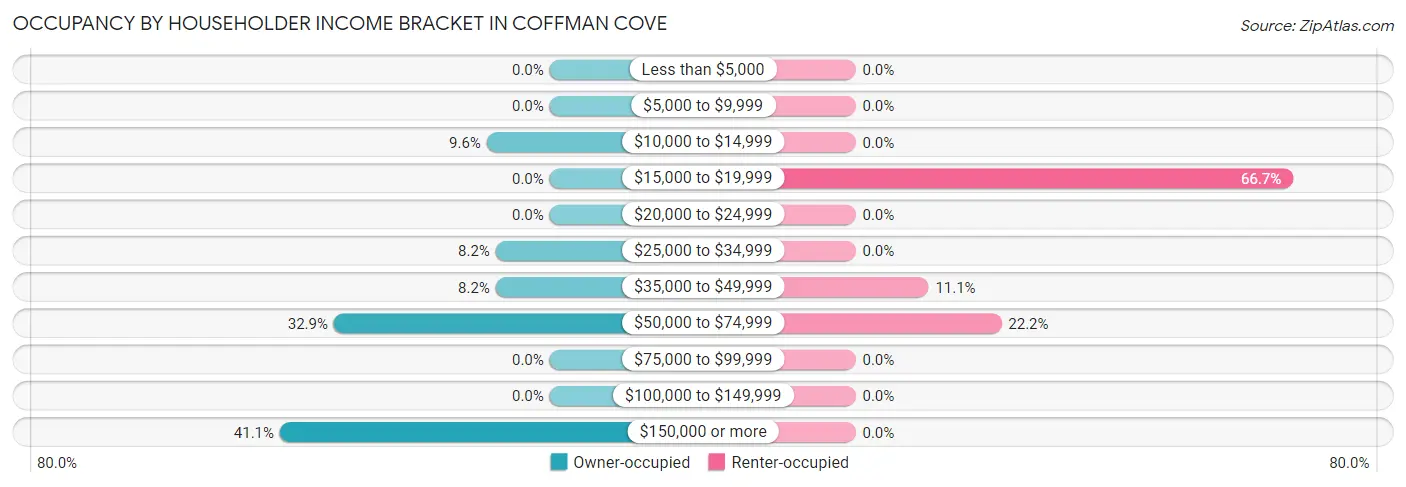
| Income Bracket | Owner-occupied | Renter-occupied |
| Less than $5,000 | 0 (0.0%) | 0 (0.0%) |
| $5,000 to $9,999 | 0 (0.0%) | 0 (0.0%) |
| $10,000 to $14,999 | 7 (9.6%) | 0 (0.0%) |
| $15,000 to $19,999 | 0 (0.0%) | 6 (66.7%) |
| $20,000 to $24,999 | 0 (0.0%) | 0 (0.0%) |
| $25,000 to $34,999 | 6 (8.2%) | 0 (0.0%) |
| $35,000 to $49,999 | 6 (8.2%) | 1 (11.1%) |
| $50,000 to $74,999 | 24 (32.9%) | 2 (22.2%) |
| $75,000 to $99,999 | 0 (0.0%) | 0 (0.0%) |
| $100,000 to $149,999 | 0 (0.0%) | 0 (0.0%) |
| $150,000 or more | 30 (41.1%) | 0 (0.0%) |
| Total | 73 (100.0%) | 9 (100.0%) |
Monthly Housing Cost Tiers in Coffman Cove
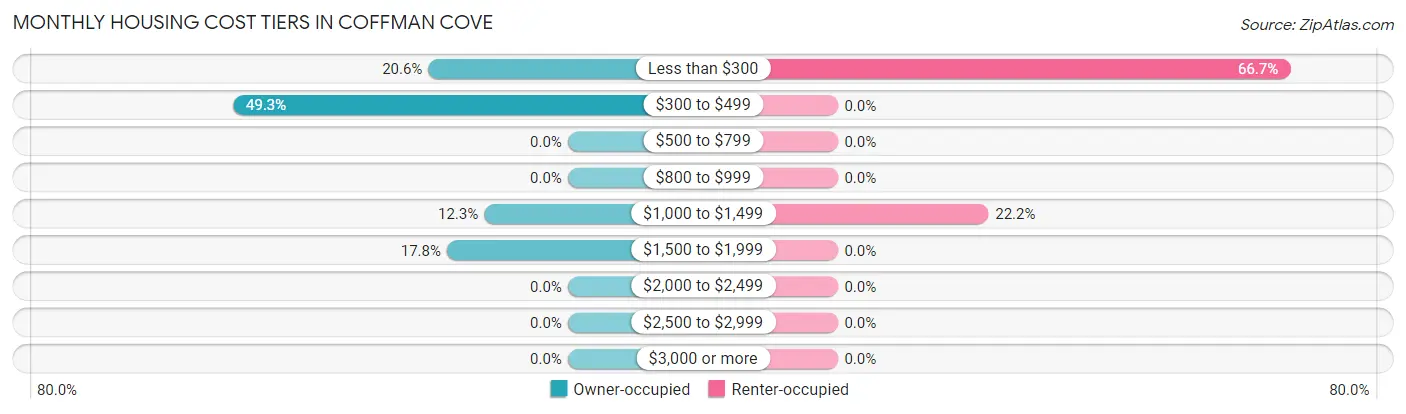
| Monthly Cost | Owner-occupied | Renter-occupied |
| Less than $300 | 15 (20.5%) | 6 (66.7%) |
| $300 to $499 | 36 (49.3%) | 0 (0.0%) |
| $500 to $799 | 0 (0.0%) | 0 (0.0%) |
| $800 to $999 | 0 (0.0%) | 0 (0.0%) |
| $1,000 to $1,499 | 9 (12.3%) | 2 (22.2%) |
| $1,500 to $1,999 | 13 (17.8%) | 0 (0.0%) |
| $2,000 to $2,499 | 0 (0.0%) | 0 (0.0%) |
| $2,500 to $2,999 | 0 (0.0%) | 0 (0.0%) |
| $3,000 or more | 0 (0.0%) | 0 (0.0%) |
| Total | 73 (100.0%) | 9 (100.0%) |
Physical Housing Characteristics in Coffman Cove
Housing Structures in Coffman Cove
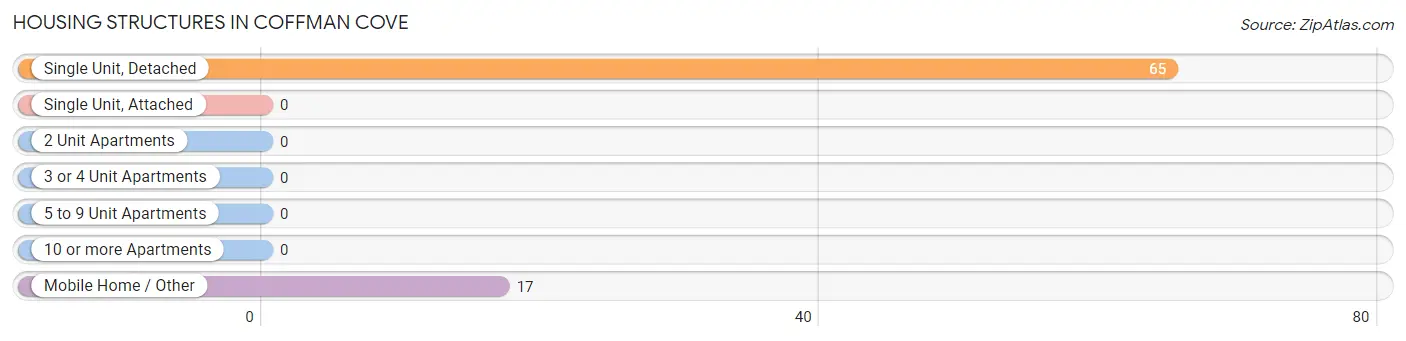
| Structure Type | # Housing Units | % Housing Units |
| Single Unit, Detached | 65 | 79.3% |
| Single Unit, Attached | 0 | 0.0% |
| 2 Unit Apartments | 0 | 0.0% |
| 3 or 4 Unit Apartments | 0 | 0.0% |
| 5 to 9 Unit Apartments | 0 | 0.0% |
| 10 or more Apartments | 0 | 0.0% |
| Mobile Home / Other | 17 | 20.7% |
| Total | 82 | 100.0% |
Housing Structures by Occupancy in Coffman Cove
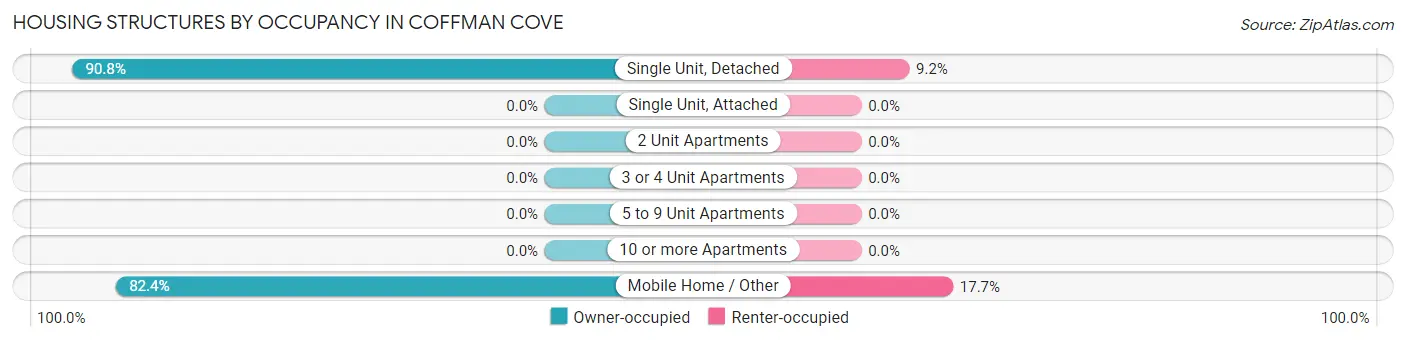
| Structure Type | Owner-occupied | Renter-occupied |
| Single Unit, Detached | 59 (90.8%) | 6 (9.2%) |
| Single Unit, Attached | 0 (0.0%) | 0 (0.0%) |
| 2 Unit Apartments | 0 (0.0%) | 0 (0.0%) |
| 3 or 4 Unit Apartments | 0 (0.0%) | 0 (0.0%) |
| 5 to 9 Unit Apartments | 0 (0.0%) | 0 (0.0%) |
| 10 or more Apartments | 0 (0.0%) | 0 (0.0%) |
| Mobile Home / Other | 14 (82.4%) | 3 (17.6%) |
| Total | 73 (89.0%) | 9 (11.0%) |
Housing Structures by Number of Rooms in Coffman Cove
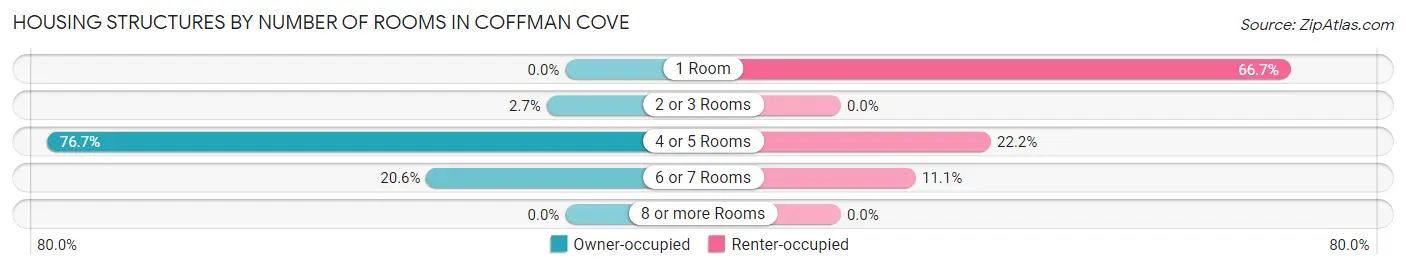
| Number of Rooms | Owner-occupied | Renter-occupied |
| 1 Room | 0 (0.0%) | 6 (66.7%) |
| 2 or 3 Rooms | 2 (2.7%) | 0 (0.0%) |
| 4 or 5 Rooms | 56 (76.7%) | 2 (22.2%) |
| 6 or 7 Rooms | 15 (20.5%) | 1 (11.1%) |
| 8 or more Rooms | 0 (0.0%) | 0 (0.0%) |
| Total | 73 (100.0%) | 9 (100.0%) |
Housing Structure by Heating Type in Coffman Cove
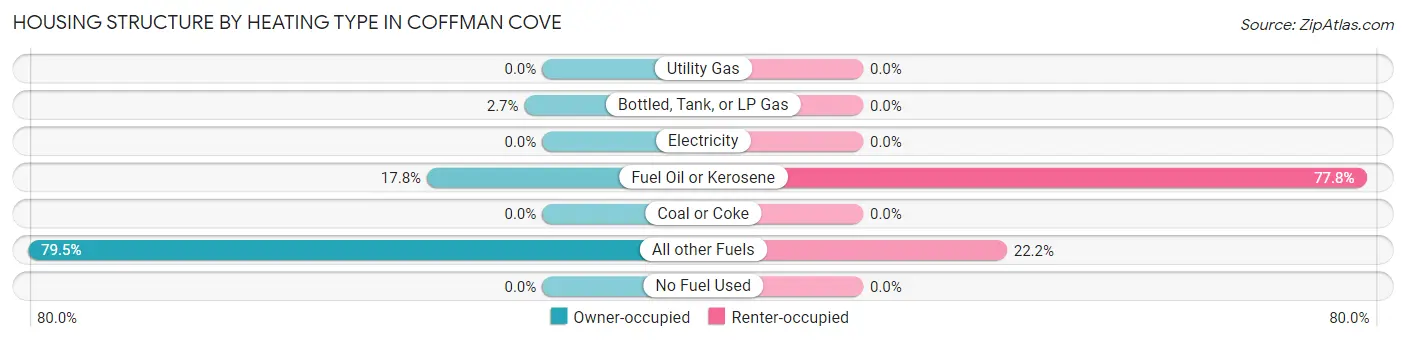
| Heating Type | Owner-occupied | Renter-occupied |
| Utility Gas | 0 (0.0%) | 0 (0.0%) |
| Bottled, Tank, or LP Gas | 2 (2.7%) | 0 (0.0%) |
| Electricity | 0 (0.0%) | 0 (0.0%) |
| Fuel Oil or Kerosene | 13 (17.8%) | 7 (77.8%) |
| Coal or Coke | 0 (0.0%) | 0 (0.0%) |
| All other Fuels | 58 (79.4%) | 2 (22.2%) |
| No Fuel Used | 0 (0.0%) | 0 (0.0%) |
| Total | 73 (100.0%) | 9 (100.0%) |
Household Vehicle Usage in Coffman Cove
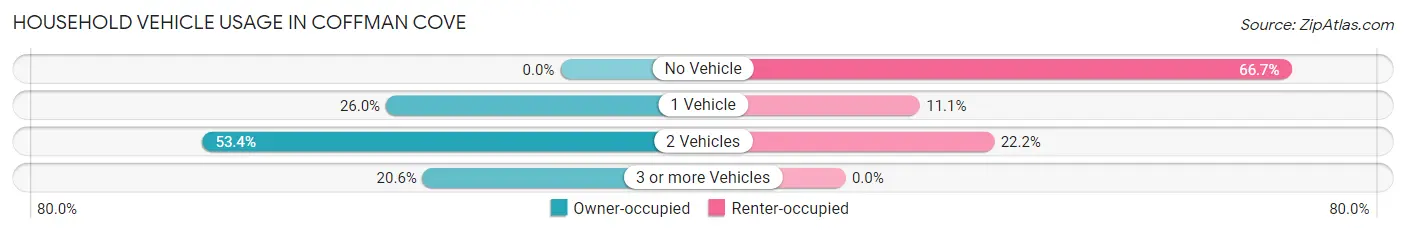
| Vehicles per Household | Owner-occupied | Renter-occupied |
| No Vehicle | 0 (0.0%) | 6 (66.7%) |
| 1 Vehicle | 19 (26.0%) | 1 (11.1%) |
| 2 Vehicles | 39 (53.4%) | 2 (22.2%) |
| 3 or more Vehicles | 15 (20.5%) | 0 (0.0%) |
| Total | 73 (100.0%) | 9 (100.0%) |
Real Estate & Mortgages in Coffman Cove
Real Estate and Mortgage Overview in Coffman Cove
| Characteristic | Without Mortgage | With Mortgage |
| Housing Units | 53 | 20 |
| Median Property Value | $167,100 | $278,600 |
| Median Household Income | - | - |
| Monthly Housing Costs | $348 | $0 |
| Real Estate Taxes | - | - |
Property Value by Mortgage Status in Coffman Cove
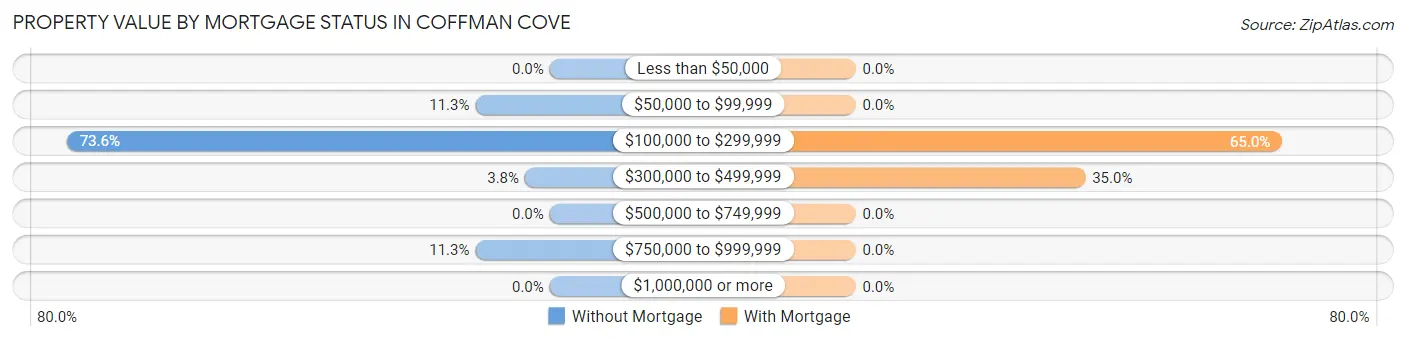
| Property Value | Without Mortgage | With Mortgage |
| Less than $50,000 | 0 (0.0%) | 0 (0.0%) |
| $50,000 to $99,999 | 6 (11.3%) | 0 (0.0%) |
| $100,000 to $299,999 | 39 (73.6%) | 13 (65.0%) |
| $300,000 to $499,999 | 2 (3.8%) | 7 (35.0%) |
| $500,000 to $749,999 | 0 (0.0%) | 0 (0.0%) |
| $750,000 to $999,999 | 6 (11.3%) | 0 (0.0%) |
| $1,000,000 or more | 0 (0.0%) | 0 (0.0%) |
| Total | 53 (100.0%) | 20 (100.0%) |
Household Income by Mortgage Status in Coffman Cove
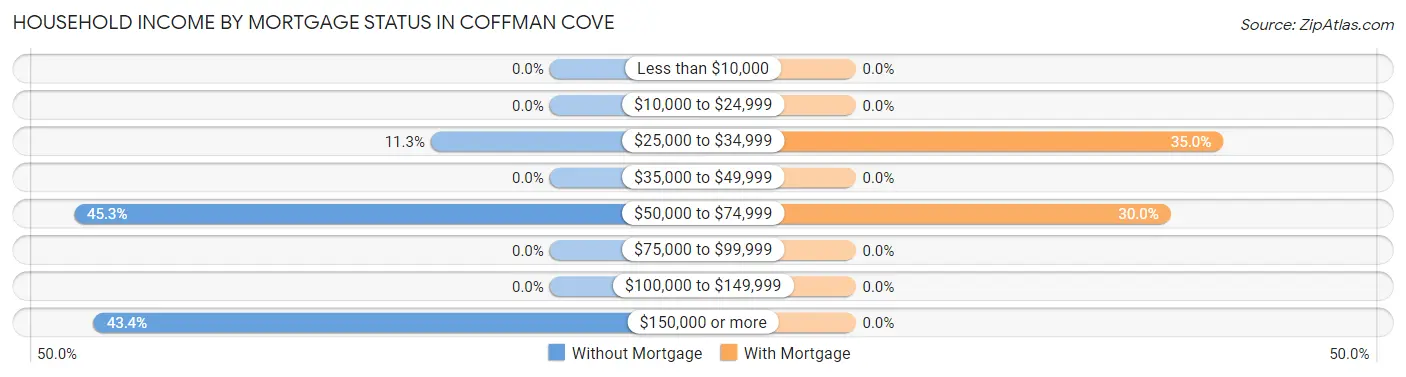
| Household Income | Without Mortgage | With Mortgage |
| Less than $10,000 | 0 (0.0%) | 0 (0.0%) |
| $10,000 to $24,999 | 0 (0.0%) | 0 (0.0%) |
| $25,000 to $34,999 | 6 (11.3%) | 7 (35.0%) |
| $35,000 to $49,999 | 0 (0.0%) | 0 (0.0%) |
| $50,000 to $74,999 | 24 (45.3%) | 6 (30.0%) |
| $75,000 to $99,999 | 0 (0.0%) | 0 (0.0%) |
| $100,000 to $149,999 | 0 (0.0%) | 0 (0.0%) |
| $150,000 or more | 23 (43.4%) | 0 (0.0%) |
| Total | 53 (100.0%) | 20 (100.0%) |
Property Value to Household Income Ratio in Coffman Cove
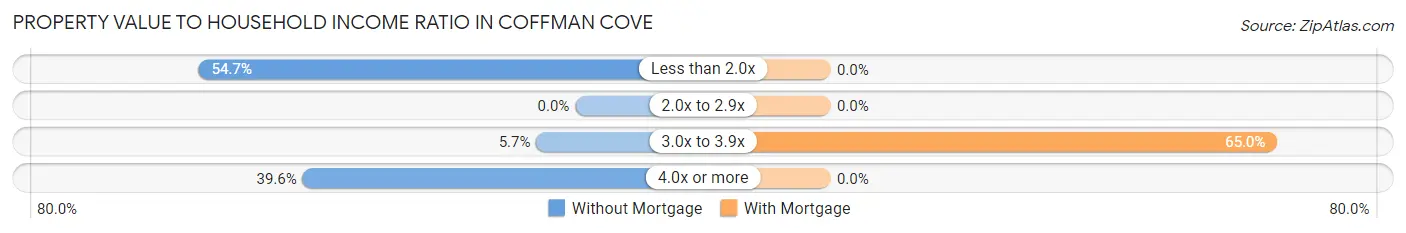
| Value-to-Income Ratio | Without Mortgage | With Mortgage |
| Less than 2.0x | 29 (54.7%) | 0 (0.0%) |
| 2.0x to 2.9x | 0 (0.0%) | 0 (0.0%) |
| 3.0x to 3.9x | 3 (5.7%) | 13 (65.0%) |
| 4.0x or more | 21 (39.6%) | 0 (0.0%) |
| Total | 53 (100.0%) | 20 (100.0%) |
Real Estate Taxes by Mortgage Status in Coffman Cove
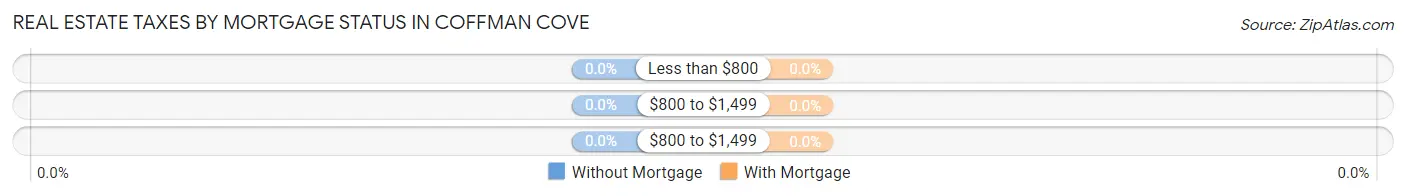
| Property Taxes | Without Mortgage | With Mortgage |
| Less than $800 | 0 (0.0%) | 0 (0.0%) |
| $800 to $1,499 | 0 (0.0%) | 0 (0.0%) |
| $800 to $1,499 | 0 (0.0%) | 0 (0.0%) |
| Total | 53 (100.0%) | 20 (100.0%) |
Health & Disability in Coffman Cove
Health Insurance Coverage by Age in Coffman Cove
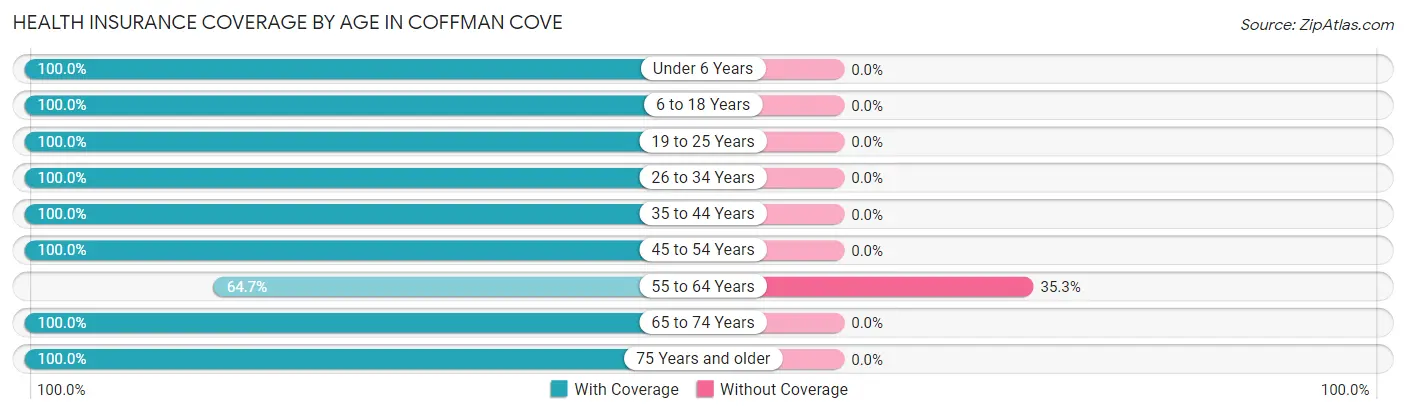
| Age Bracket | With Coverage | Without Coverage |
| Under 6 Years | 40 (100.0%) | 0 (0.0%) |
| 6 to 18 Years | 34 (100.0%) | 0 (0.0%) |
| 19 to 25 Years | 6 (100.0%) | 0 (0.0%) |
| 26 to 34 Years | 10 (100.0%) | 0 (0.0%) |
| 35 to 44 Years | 32 (100.0%) | 0 (0.0%) |
| 45 to 54 Years | 6 (100.0%) | 0 (0.0%) |
| 55 to 64 Years | 22 (64.7%) | 12 (35.3%) |
| 65 to 74 Years | 30 (100.0%) | 0 (0.0%) |
| 75 Years and older | 9 (100.0%) | 0 (0.0%) |
| Total | 189 (94.0%) | 12 (6.0%) |
Health Insurance Coverage by Citizenship Status in Coffman Cove
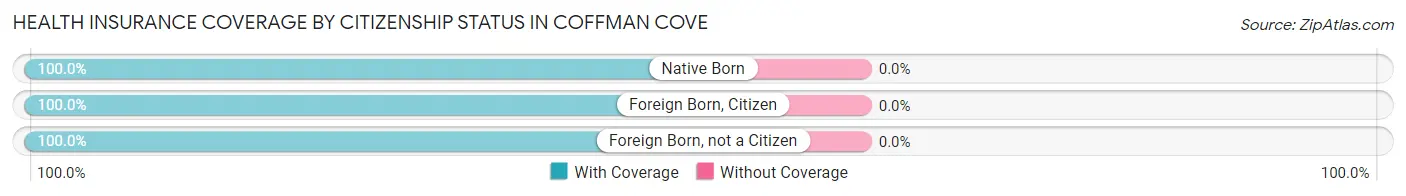
| Citizenship Status | With Coverage | Without Coverage |
| Native Born | 40 (100.0%) | 0 (0.0%) |
| Foreign Born, Citizen | 34 (100.0%) | 0 (0.0%) |
| Foreign Born, not a Citizen | 6 (100.0%) | 0 (0.0%) |
Health Insurance Coverage by Household Income in Coffman Cove
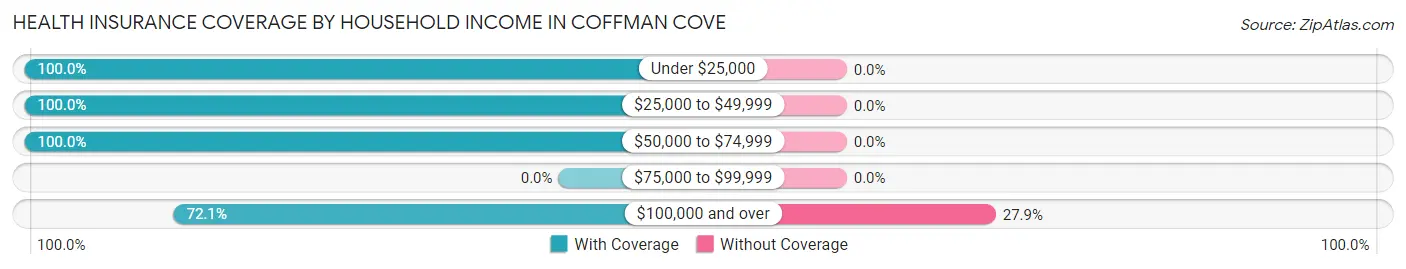
| Household Income | With Coverage | Without Coverage |
| Under $25,000 | 30 (100.0%) | 0 (0.0%) |
| $25,000 to $49,999 | 91 (100.0%) | 0 (0.0%) |
| $50,000 to $74,999 | 37 (100.0%) | 0 (0.0%) |
| $75,000 to $99,999 | 0 (0.0%) | 0 (0.0%) |
| $100,000 and over | 31 (72.1%) | 12 (27.9%) |
Public vs Private Health Insurance Coverage by Age in Coffman Cove
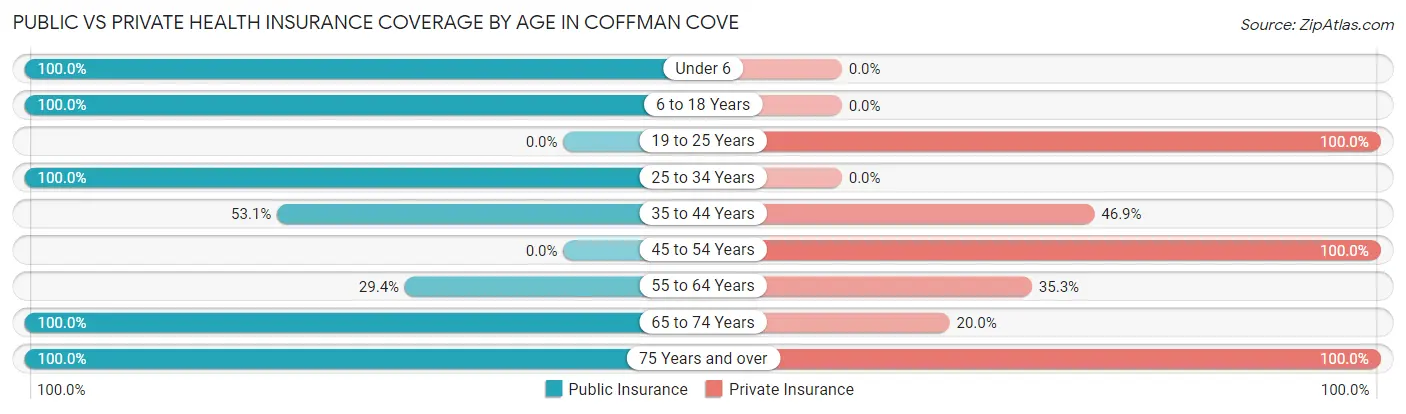
| Age Bracket | Public Insurance | Private Insurance |
| Under 6 | 40 (100.0%) | 0 (0.0%) |
| 6 to 18 Years | 34 (100.0%) | 0 (0.0%) |
| 19 to 25 Years | 0 (0.0%) | 6 (100.0%) |
| 25 to 34 Years | 10 (100.0%) | 0 (0.0%) |
| 35 to 44 Years | 17 (53.1%) | 15 (46.9%) |
| 45 to 54 Years | 0 (0.0%) | 6 (100.0%) |
| 55 to 64 Years | 10 (29.4%) | 12 (35.3%) |
| 65 to 74 Years | 30 (100.0%) | 6 (20.0%) |
| 75 Years and over | 9 (100.0%) | 9 (100.0%) |
| Total | 150 (74.6%) | 54 (26.9%) |
Disability Status by Sex by Age in Coffman Cove
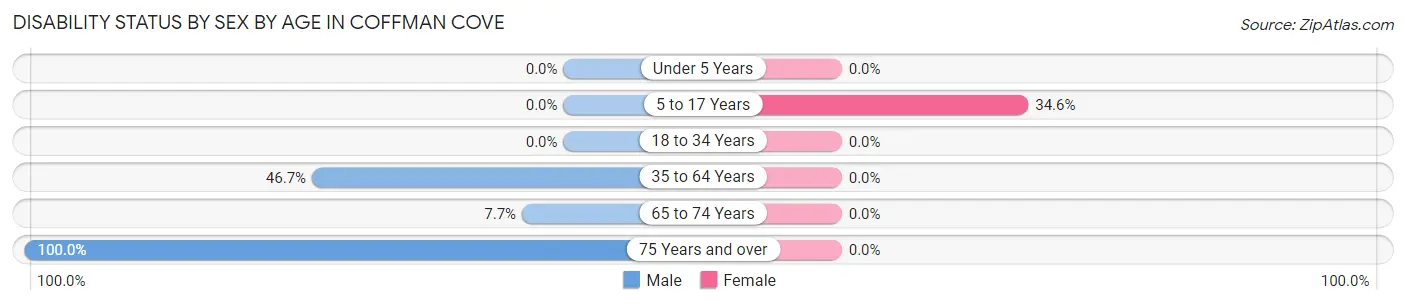
| Age Bracket | Male | Female |
| Under 5 Years | 0 (0.0%) | 0 (0.0%) |
| 5 to 17 Years | 0 (0.0%) | 9 (34.6%) |
| 18 to 34 Years | 0 (0.0%) | 0 (0.0%) |
| 35 to 64 Years | 21 (46.7%) | 0 (0.0%) |
| 65 to 74 Years | 2 (7.7%) | 0 (0.0%) |
| 75 Years and over | 3 (100.0%) | 0 (0.0%) |
Disability Class by Sex by Age in Coffman Cove
Disability Class: Hearing Difficulty
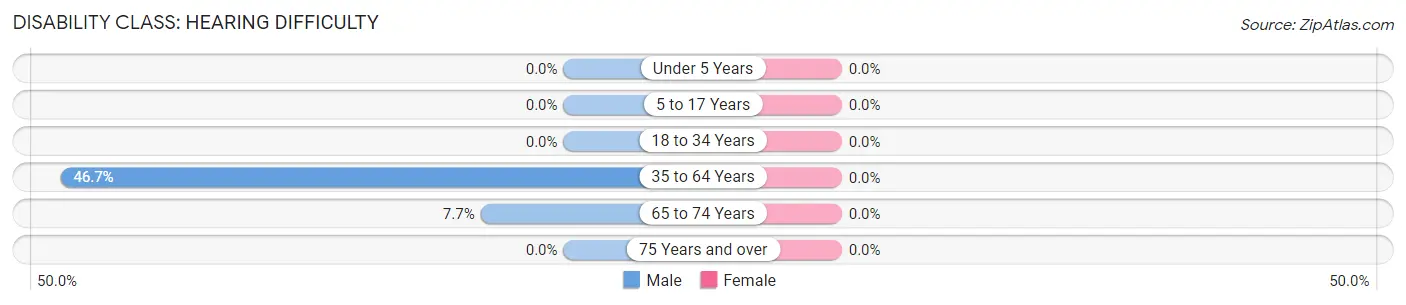
| Age Bracket | Male | Female |
| Under 5 Years | 0 (0.0%) | 0 (0.0%) |
| 5 to 17 Years | 0 (0.0%) | 0 (0.0%) |
| 18 to 34 Years | 0 (0.0%) | 0 (0.0%) |
| 35 to 64 Years | 21 (46.7%) | 0 (0.0%) |
| 65 to 74 Years | 2 (7.7%) | 0 (0.0%) |
| 75 Years and over | 0 (0.0%) | 0 (0.0%) |
Disability Class: Vision Difficulty
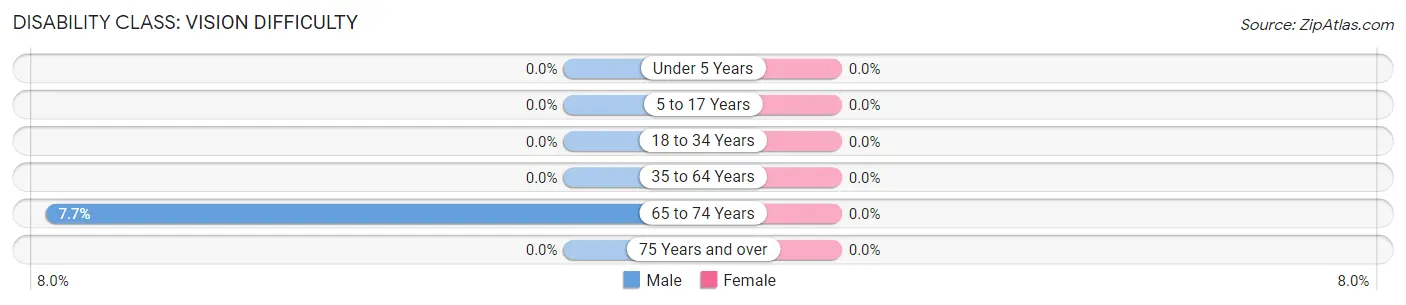
| Age Bracket | Male | Female |
| Under 5 Years | 0 (0.0%) | 0 (0.0%) |
| 5 to 17 Years | 0 (0.0%) | 0 (0.0%) |
| 18 to 34 Years | 0 (0.0%) | 0 (0.0%) |
| 35 to 64 Years | 0 (0.0%) | 0 (0.0%) |
| 65 to 74 Years | 2 (7.7%) | 0 (0.0%) |
| 75 Years and over | 0 (0.0%) | 0 (0.0%) |
Disability Class: Cognitive Difficulty
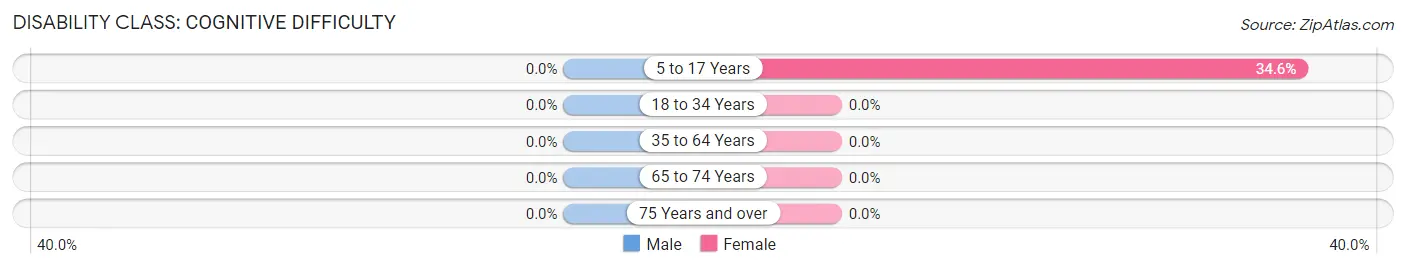
| Age Bracket | Male | Female |
| 5 to 17 Years | 0 (0.0%) | 9 (34.6%) |
| 18 to 34 Years | 0 (0.0%) | 0 (0.0%) |
| 35 to 64 Years | 0 (0.0%) | 0 (0.0%) |
| 65 to 74 Years | 0 (0.0%) | 0 (0.0%) |
| 75 Years and over | 0 (0.0%) | 0 (0.0%) |
Disability Class: Ambulatory Difficulty
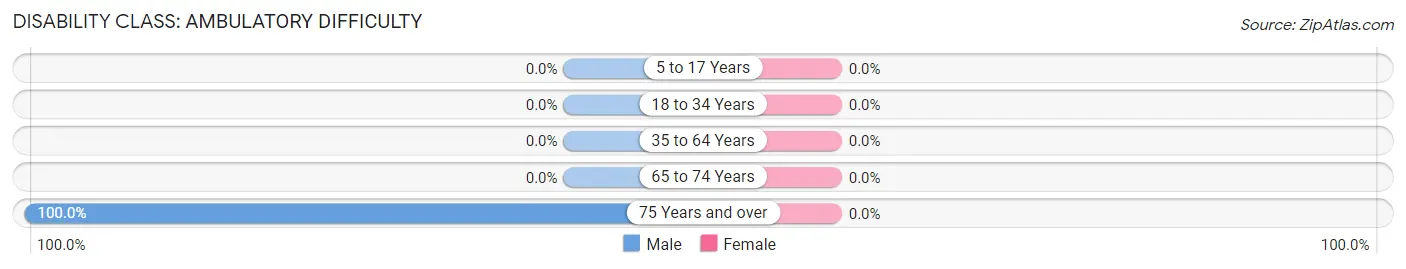
| Age Bracket | Male | Female |
| 5 to 17 Years | 0 (0.0%) | 0 (0.0%) |
| 18 to 34 Years | 0 (0.0%) | 0 (0.0%) |
| 35 to 64 Years | 0 (0.0%) | 0 (0.0%) |
| 65 to 74 Years | 0 (0.0%) | 0 (0.0%) |
| 75 Years and over | 3 (100.0%) | 0 (0.0%) |
Disability Class: Self-Care Difficulty
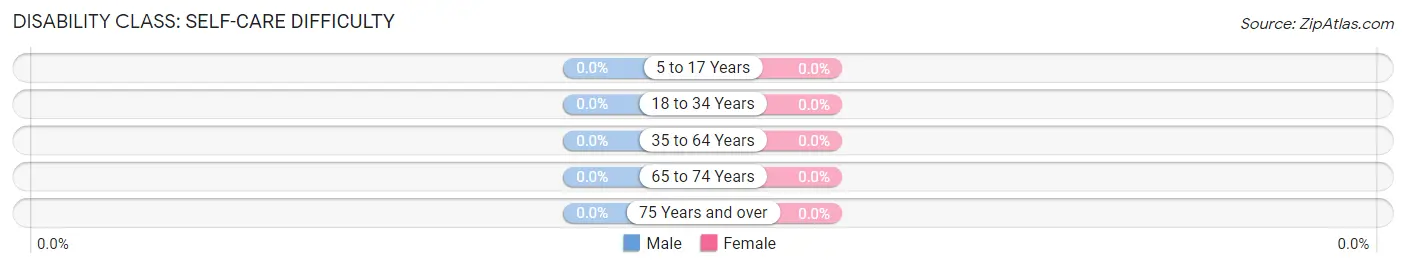
| Age Bracket | Male | Female |
| 5 to 17 Years | 0 (0.0%) | 0 (0.0%) |
| 18 to 34 Years | 0 (0.0%) | 0 (0.0%) |
| 35 to 64 Years | 0 (0.0%) | 0 (0.0%) |
| 65 to 74 Years | 0 (0.0%) | 0 (0.0%) |
| 75 Years and over | 0 (0.0%) | 0 (0.0%) |
Technology Access in Coffman Cove
Computing Device Access in Coffman Cove
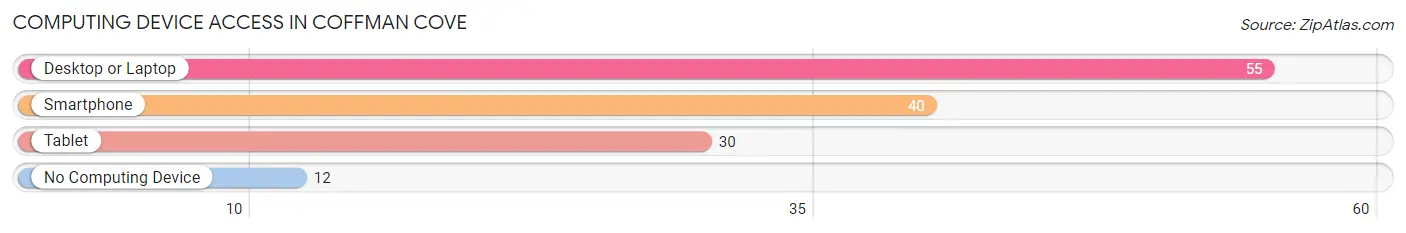
| Device Type | # Households | % Households |
| Desktop or Laptop | 55 | 67.1% |
| Smartphone | 40 | 48.8% |
| Tablet | 30 | 36.6% |
| No Computing Device | 12 | 14.6% |
| Total | 82 | 100.0% |
Internet Access in Coffman Cove
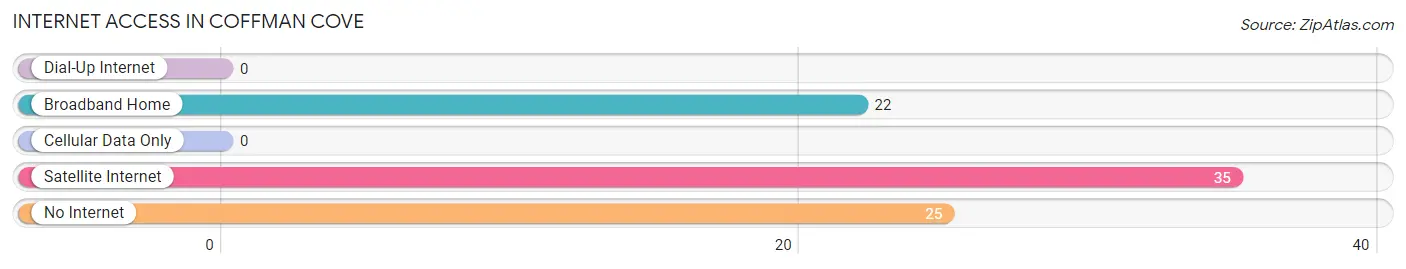
| Internet Type | # Households | % Households |
| Dial-Up Internet | 0 | 0.0% |
| Broadband Home | 22 | 26.8% |
| Cellular Data Only | 0 | 0.0% |
| Satellite Internet | 35 | 42.7% |
| No Internet | 25 | 30.5% |
| Total | 82 | 100.0% |
Coffman Cove Summary
Coffman Cove is a small city located in the southeastern corner of Alaska, on the eastern shore of Prince of Wales Island. It is part of the Prince of Wales-Hyder Census Area and has a population of approximately 300 people. The city is named after the first settler, John Coffman, who arrived in the area in 1883.
Geography
Coffman Cove is located on the eastern shore of Prince of Wales Island, which is the fourth largest island in the United States. The city is situated on a narrow strip of land between the Pacific Ocean and the Tongass National Forest. The city is surrounded by mountains and is home to a variety of wildlife, including bald eagles, black bears, and Sitka black-tailed deer. The climate in Coffman Cove is mild and humid, with temperatures ranging from the mid-30s in the winter to the mid-60s in the summer.
Economy
Coffman Cove’s economy is largely based on fishing and logging. The city is home to several commercial fishing operations, and the local economy is heavily reliant on the seafood industry. Logging is also an important part of the local economy, and the city is home to several sawmills and wood-processing plants. Tourism is also an important part of the local economy, and the city is home to several lodges and resorts.
Demographics
As of the 2010 census, the population of Coffman Cove was 294 people. The racial makeup of the city was 95.3% White, 0.7% Native American, 0.3% Asian, 0.3% Pacific Islander, and 3.4% from other races. The median household income in Coffman Cove was $41,250, and the median family income was $45,625. The per capita income in the city was $19,845.
History
Coffman Cove was first settled in 1883 by John Coffman, who arrived in the area from Oregon. He established a homestead and began to farm the land. In the early 1900s, the area began to attract more settlers, and the town was officially incorporated in 1912. The city was named after John Coffman, and it quickly became a hub for the local fishing and logging industries. In the 1950s, the city began to attract more tourists, and several lodges and resorts were built in the area. Today, Coffman Cove is a popular destination for fishing, hunting, and outdoor recreation.
Common Questions
What is Per Capita Income in Coffman Cove?
Per Capita income in Coffman Cove is $38,886.
What is the Median Household income in Coffman Cove?
Median Household Income in Coffman Cove is $63,750.
What is Inequality or Gini Index in Coffman Cove?
Inequality or Gini Index in Coffman Cove is 0.39.
What is the Total Population of Coffman Cove?
Total Population of Coffman Cove is 201.
What is the Total Male Population of Coffman Cove?
Total Male Population of Coffman Cove is 122.
What is the Total Female Population of Coffman Cove?
Total Female Population of Coffman Cove is 79.
What is the Ratio of Males per 100 Females in Coffman Cove?
There are 154.43 Males per 100 Females in Coffman Cove.
What is the Ratio of Females per 100 Males in Coffman Cove?
There are 64.75 Females per 100 Males in Coffman Cove.
What is the Median Population Age in Coffman Cove?
Median Population Age in Coffman Cove is 38.2 Years.
What is the Average Family Size in Coffman Cove
Average Family Size in Coffman Cove is 3.8 People.
What is the Average Household Size in Coffman Cove
Average Household Size in Coffman Cove is 2.5 People.
How Large is the Labor Force in Coffman Cove?
There are 87 People in the Labor Forcein in Coffman Cove.
What is the Percentage of People in the Labor Force in Coffman Cove?
68.5% of People are in the Labor Force in Coffman Cove.
What is the Unemployment Rate in Coffman Cove?
Unemployment Rate in Coffman Cove is 8.0%.