Clam Gulch, AK Map & Demographics
Clam Gulch Map
Clam Gulch Overview
$32,806
PER CAPITA INCOME
$92,917
AVG FAMILY INCOME
$90,156
AVG HOUSEHOLD INCOME
56.3%
WAGE / INCOME GAP [ % ]
43.7¢/ $1
WAGE / INCOME GAP [ $ ]
0.38
INEQUALITY / GINI INDEX
279
TOTAL POPULATION
158
MALE POPULATION
121
FEMALE POPULATION
130.58
MALES / 100 FEMALES
76.58
FEMALES / 100 MALES
42.1
MEDIAN AGE
4.3
AVG FAMILY SIZE
2.9
AVG HOUSEHOLD SIZE
147
LABOR FORCE [ PEOPLE ]
60.0%
PERCENT IN LABOR FORCE
13.6%
UNEMPLOYMENT RATE
Clam Gulch Zip Codes
Clam Gulch Area Codes
Income in Clam Gulch
Income Overview in Clam Gulch
Per Capita Income in Clam Gulch is $32,806, while median incomes of families and households are $92,917 and $90,156 respectively.
| Characteristic | Number | Measure |
| Per Capita Income | 279 | $32,806 |
| Median Family Income | 49 | $92,917 |
| Mean Family Income | 49 | $105,763 |
| Median Household Income | 97 | $90,156 |
| Mean Household Income | 97 | $83,302 |
| Income Deficit | 49 | $0 |
| Wage / Income Gap (%) | 279 | 56.31% |
| Wage / Income Gap ($) | 279 | 43.69¢ per $1 |
| Gini / Inequality Index | 279 | 0.38 |
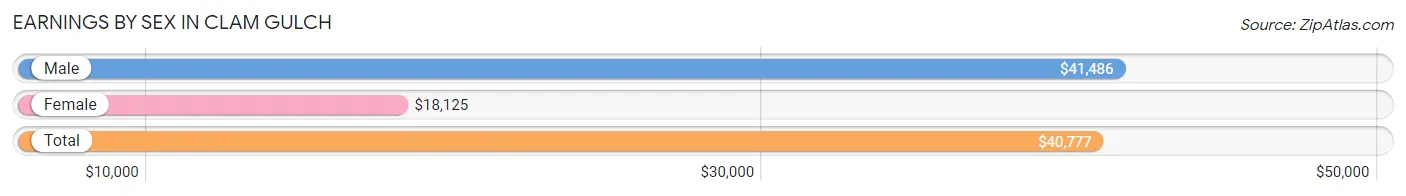
Earnings by Sex in Clam Gulch
Average Earnings in Clam Gulch are $40,777, $41,486 for men and $18,125 for women, a difference of 56.3%.
| Sex | Number | Average Earnings |
| Male | 106 (71.1%) | $41,486 |
| Female | 43 (28.9%) | $18,125 |
| Total | 149 (100.0%) | $40,777 |
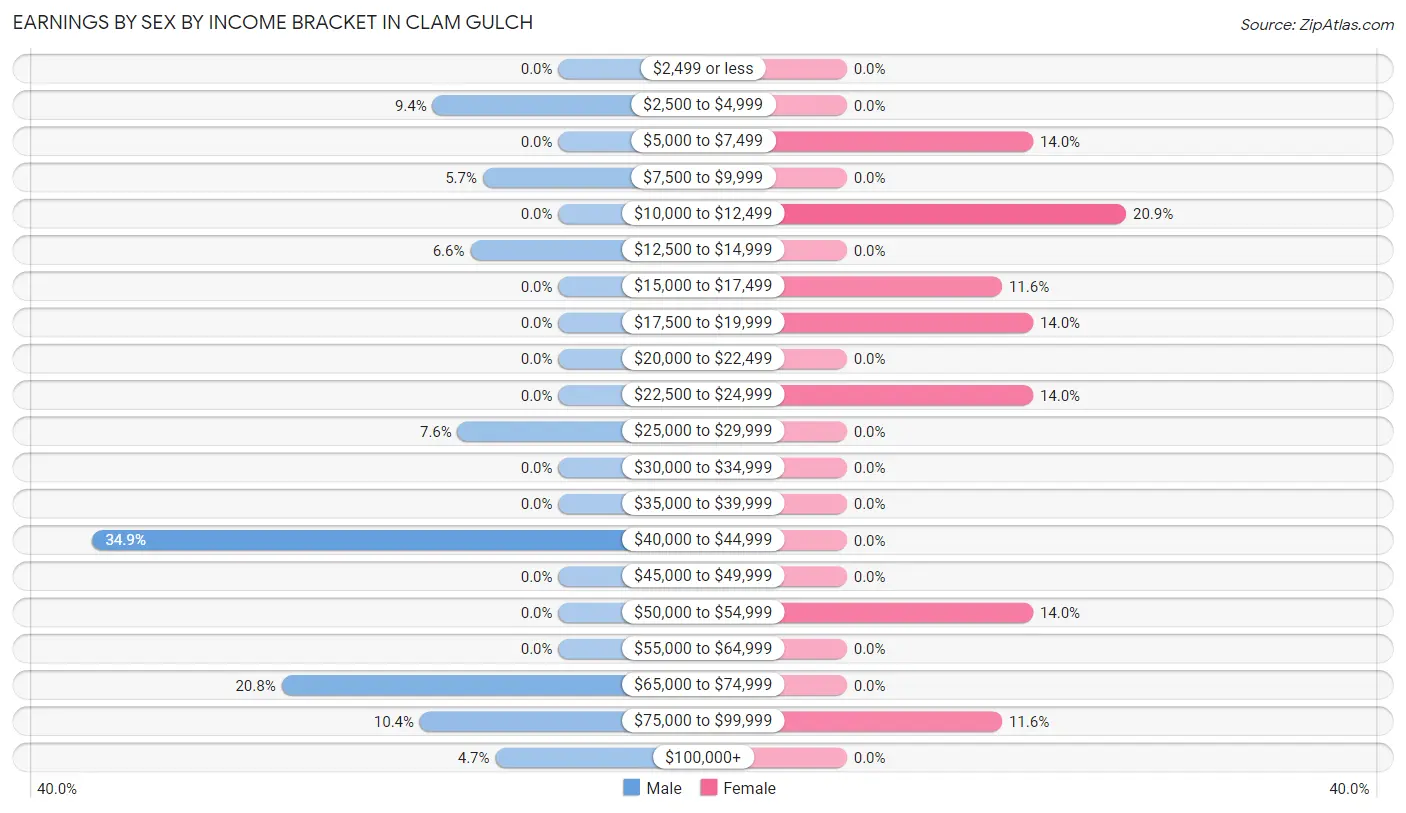
Earnings by Sex by Income Bracket in Clam Gulch
The most common earnings brackets in Clam Gulch are $40,000 to $44,999 for men (37 | 34.9%) and $10,000 to $12,499 for women (9 | 20.9%).
| Income | Male | Female |
| $2,499 or less | 0 (0.0%) | 0 (0.0%) |
| $2,500 to $4,999 | 10 (9.4%) | 0 (0.0%) |
| $5,000 to $7,499 | 0 (0.0%) | 6 (14.0%) |
| $7,500 to $9,999 | 6 (5.7%) | 0 (0.0%) |
| $10,000 to $12,499 | 0 (0.0%) | 9 (20.9%) |
| $12,500 to $14,999 | 7 (6.6%) | 0 (0.0%) |
| $15,000 to $17,499 | 0 (0.0%) | 5 (11.6%) |
| $17,500 to $19,999 | 0 (0.0%) | 6 (14.0%) |
| $20,000 to $22,499 | 0 (0.0%) | 0 (0.0%) |
| $22,500 to $24,999 | 0 (0.0%) | 6 (14.0%) |
| $25,000 to $29,999 | 8 (7.5%) | 0 (0.0%) |
| $30,000 to $34,999 | 0 (0.0%) | 0 (0.0%) |
| $35,000 to $39,999 | 0 (0.0%) | 0 (0.0%) |
| $40,000 to $44,999 | 37 (34.9%) | 0 (0.0%) |
| $45,000 to $49,999 | 0 (0.0%) | 0 (0.0%) |
| $50,000 to $54,999 | 0 (0.0%) | 6 (14.0%) |
| $55,000 to $64,999 | 0 (0.0%) | 0 (0.0%) |
| $65,000 to $74,999 | 22 (20.7%) | 0 (0.0%) |
| $75,000 to $99,999 | 11 (10.4%) | 5 (11.6%) |
| $100,000+ | 5 (4.7%) | 0 (0.0%) |
| Total | 106 (100.0%) | 43 (100.0%) |
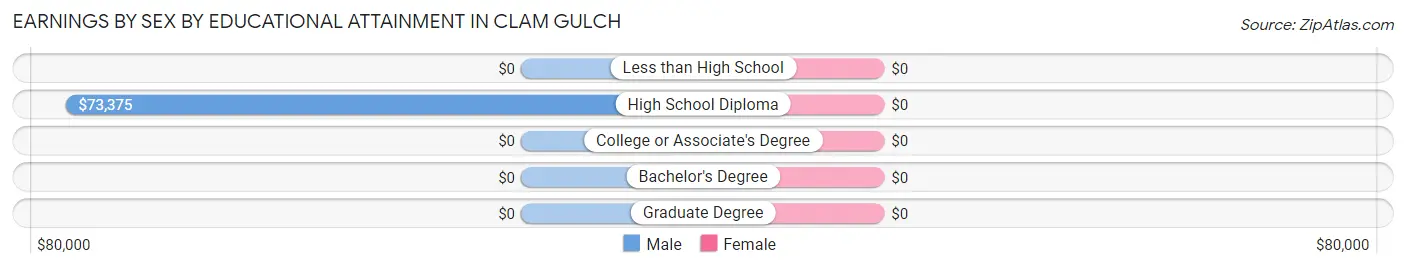
Earnings by Sex by Educational Attainment in Clam Gulch
| Educational Attainment | Male Income | Female Income |
| Less than High School | - | - |
| High School Diploma | $73,375 | $0 |
| College or Associate's Degree | - | - |
| Bachelor's Degree | - | - |
| Graduate Degree | - | - |
| Total | $68,333 | $16,750 |
Family Income in Clam Gulch
Family Income Brackets in Clam Gulch
According to the Clam Gulch family income data, there are 17 families falling into the $100,000 to $149,999 income range, which is the most common income bracket and makes up 34.7% of all families.
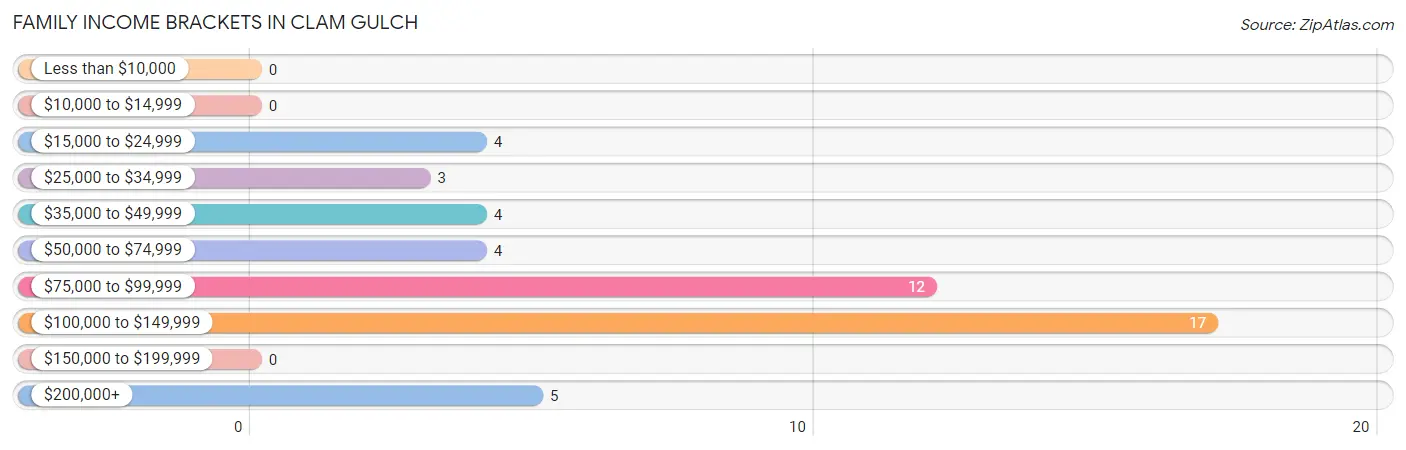
| Income Bracket | # Families | % Families |
| Less than $10,000 | 0 | 0.0% |
| $10,000 to $14,999 | 0 | 0.0% |
| $15,000 to $24,999 | 4 | 8.2% |
| $25,000 to $34,999 | 3 | 6.1% |
| $35,000 to $49,999 | 4 | 8.2% |
| $50,000 to $74,999 | 4 | 8.2% |
| $75,000 to $99,999 | 12 | 24.5% |
| $100,000 to $149,999 | 17 | 34.7% |
| $150,000 to $199,999 | 0 | 0.0% |
| $200,000+ | 5 | 10.2% |
Family Income by Famaliy Size in Clam Gulch
2-person families (32 | 65.3%) account for the highest median family income in Clam Gulch with $92,188 per family, while 2-person families (32 | 65.3%) have the highest median income of $46,094 per family member.
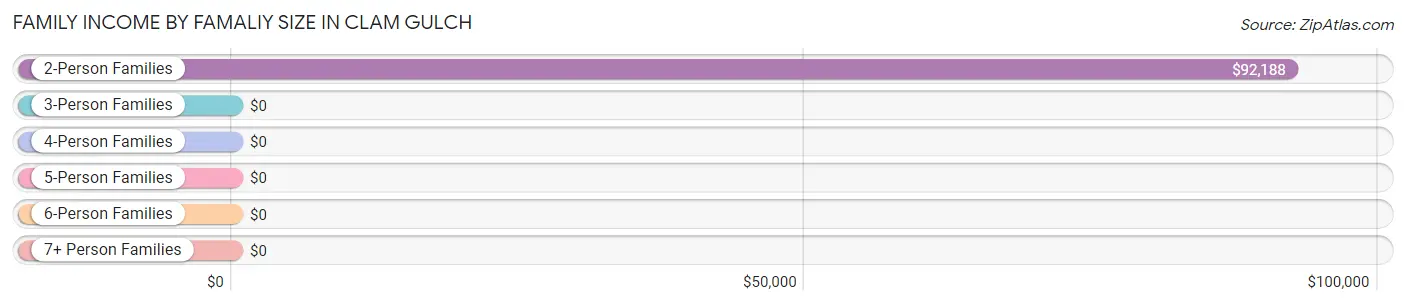
| Income Bracket | # Families | Median Income |
| 2-Person Families | 32 (65.3%) | $92,188 |
| 3-Person Families | 3 (6.1%) | $0 |
| 4-Person Families | 9 (18.4%) | $0 |
| 5-Person Families | 0 (0.0%) | $0 |
| 6-Person Families | 0 (0.0%) | $0 |
| 7+ Person Families | 5 (10.2%) | $0 |
| Total | 49 (100.0%) | $92,917 |
Family Income by Number of Earners in Clam Gulch
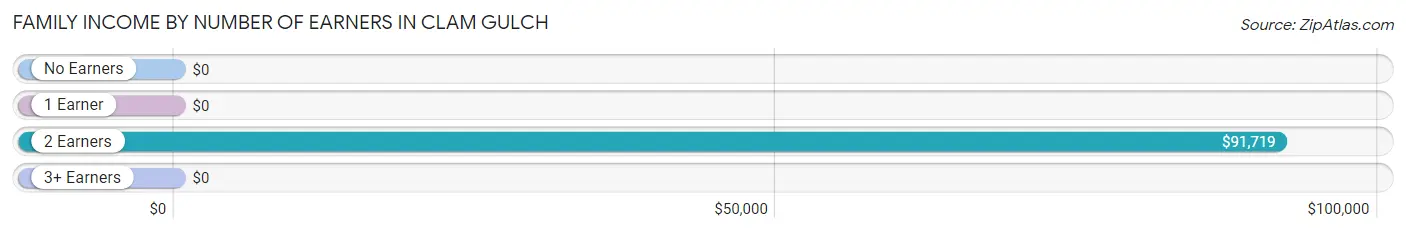
| Number of Earners | # Families | Median Income |
| No Earners | 12 (24.5%) | $0 |
| 1 Earner | 10 (20.4%) | $0 |
| 2 Earners | 17 (34.7%) | $91,719 |
| 3+ Earners | 10 (20.4%) | $0 |
| Total | 49 (100.0%) | $92,917 |
Household Income in Clam Gulch
Household Income Brackets in Clam Gulch
With 27 households falling in the category, the $100,000 to $149,999 income range is the most frequent in Clam Gulch, accounting for 27.8% of all households.
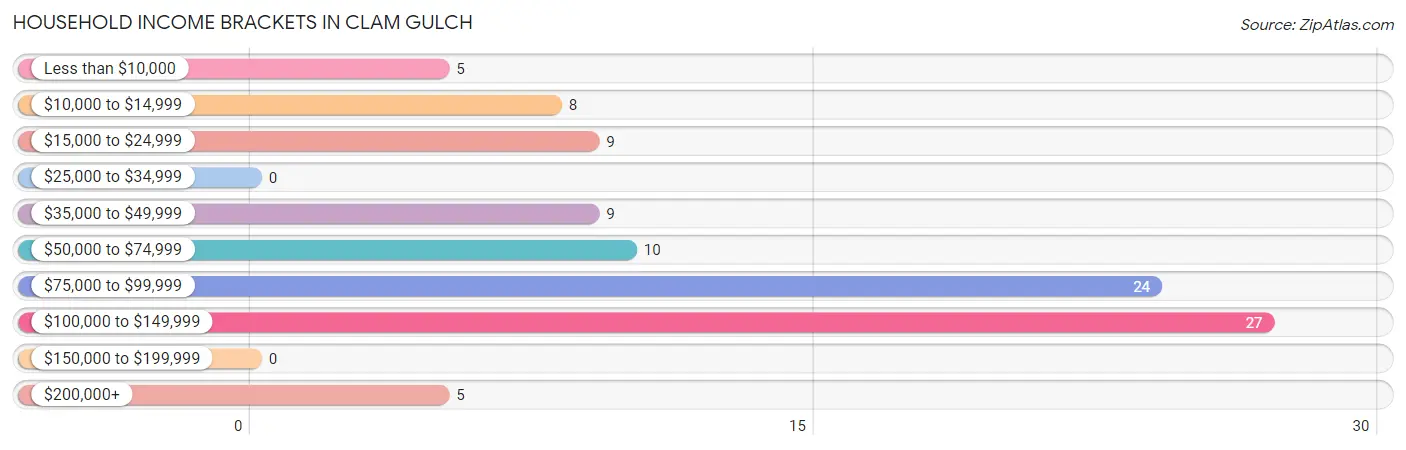
| Income Bracket | # Households | % Households |
| Less than $10,000 | 5 | 5.2% |
| $10,000 to $14,999 | 8 | 8.2% |
| $15,000 to $24,999 | 9 | 9.3% |
| $25,000 to $34,999 | 0 | 0.0% |
| $35,000 to $49,999 | 9 | 9.3% |
| $50,000 to $74,999 | 10 | 10.3% |
| $75,000 to $99,999 | 24 | 24.7% |
| $100,000 to $149,999 | 27 | 27.8% |
| $150,000 to $199,999 | 0 | 0.0% |
| $200,000+ | 5 | 5.2% |
Household Income by Householder Age in Clam Gulch
The median household income in Clam Gulch is $90,156, with the highest median household income of $91,563 found in the 45 to 64 years age bracket for the primary householder. A total of 28 households (28.9%) fall into this category.
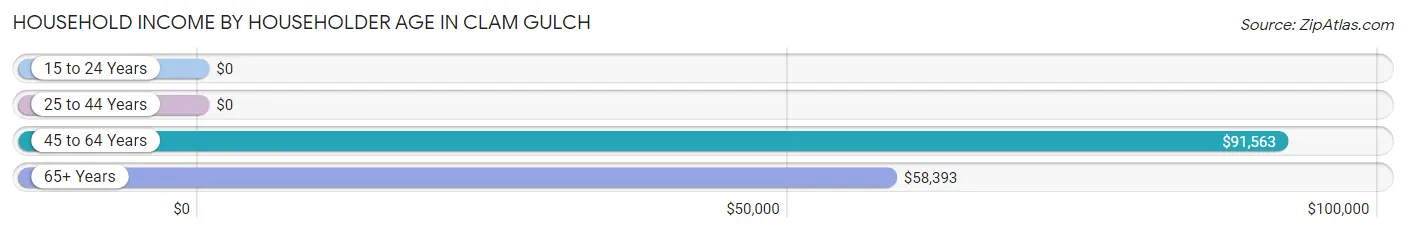
| Income Bracket | # Households | Median Income |
| 15 to 24 Years | 0 (0.0%) | $0 |
| 25 to 44 Years | 12 (12.4%) | $0 |
| 45 to 64 Years | 28 (28.9%) | $91,563 |
| 65+ Years | 57 (58.8%) | $58,393 |
| Total | 97 (100.0%) | $90,156 |
Poverty in Clam Gulch
Income Below Poverty by Sex and Age in Clam Gulch
With 6.3% poverty level for males and 14.1% for females among the residents of Clam Gulch, 75 year old and over males and 75 year old and over females are the most vulnerable to poverty, with 3 males (100.0%) and 5 females (55.6%) in their respective age groups living below the poverty level.
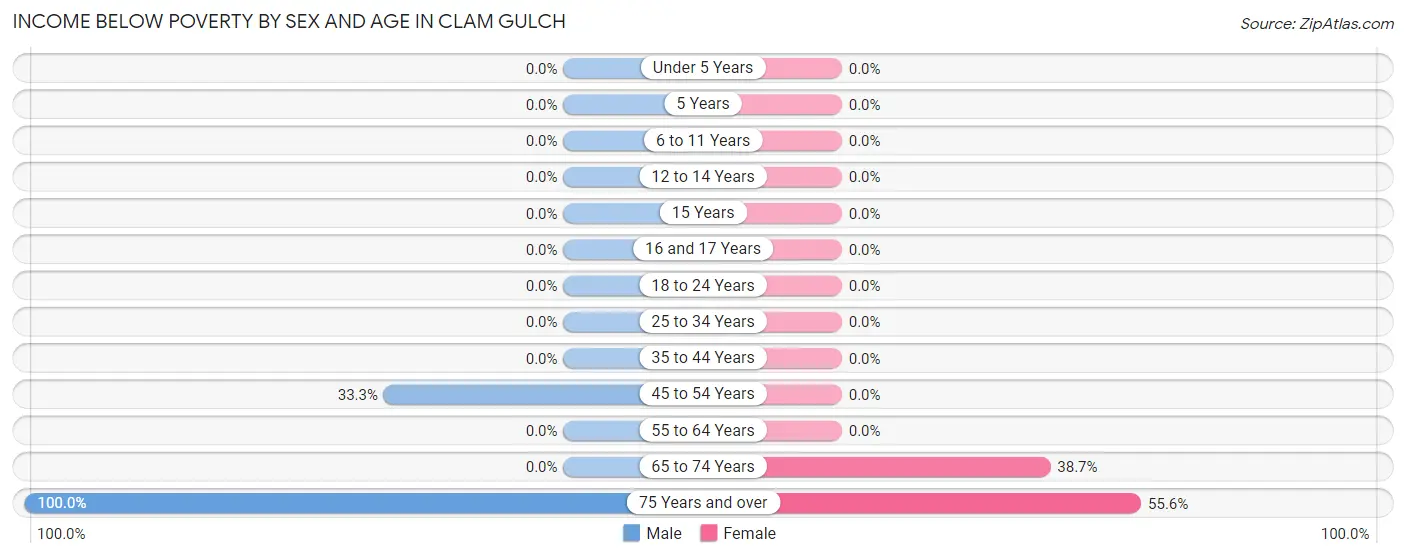
| Age Bracket | Male | Female |
| Under 5 Years | 0 (0.0%) | 0 (0.0%) |
| 5 Years | 0 (0.0%) | 0 (0.0%) |
| 6 to 11 Years | 0 (0.0%) | 0 (0.0%) |
| 12 to 14 Years | 0 (0.0%) | 0 (0.0%) |
| 15 Years | 0 (0.0%) | 0 (0.0%) |
| 16 and 17 Years | 0 (0.0%) | 0 (0.0%) |
| 18 to 24 Years | 0 (0.0%) | 0 (0.0%) |
| 25 to 34 Years | 0 (0.0%) | 0 (0.0%) |
| 35 to 44 Years | 0 (0.0%) | 0 (0.0%) |
| 45 to 54 Years | 7 (33.3%) | 0 (0.0%) |
| 55 to 64 Years | 0 (0.0%) | 0 (0.0%) |
| 65 to 74 Years | 0 (0.0%) | 12 (38.7%) |
| 75 Years and over | 3 (100.0%) | 5 (55.6%) |
| Total | 10 (6.3%) | 17 (14.1%) |
Income Above Poverty by Sex and Age in Clam Gulch
According to the poverty statistics in Clam Gulch, males aged under 5 years and females aged under 5 years are the age groups that are most secure financially, with 100.0% of males and 100.0% of females in these age groups living above the poverty line.
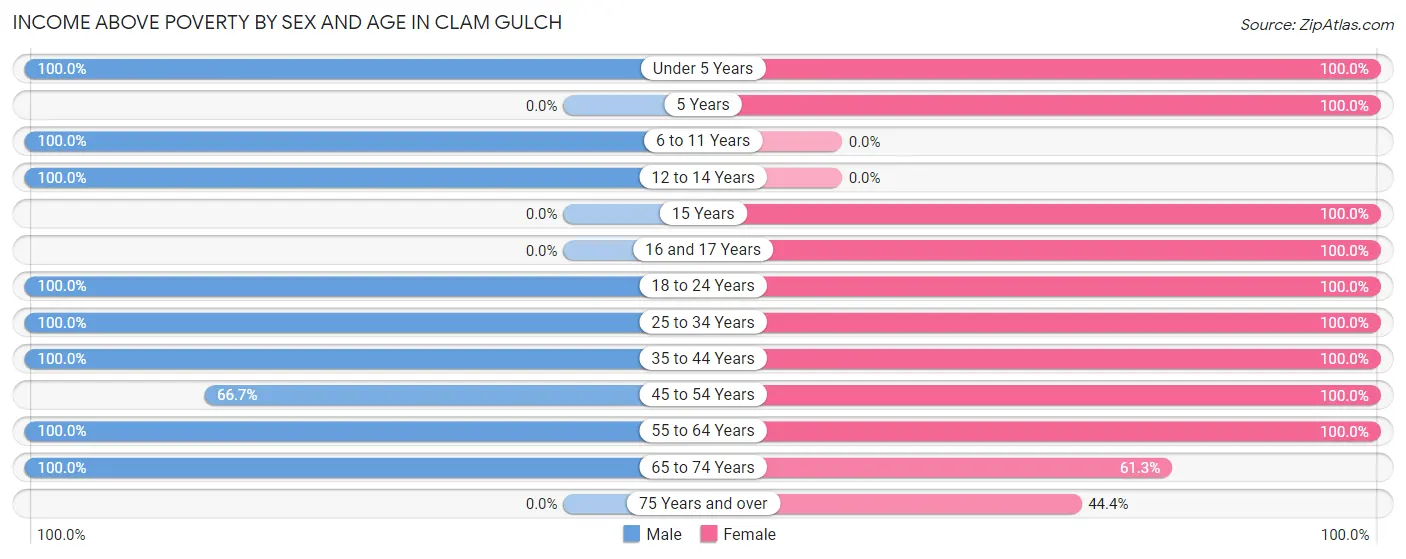
| Age Bracket | Male | Female |
| Under 5 Years | 6 (100.0%) | 5 (100.0%) |
| 5 Years | 0 (0.0%) | 6 (100.0%) |
| 6 to 11 Years | 6 (100.0%) | 0 (0.0%) |
| 12 to 14 Years | 6 (100.0%) | 0 (0.0%) |
| 15 Years | 0 (0.0%) | 5 (100.0%) |
| 16 and 17 Years | 0 (0.0%) | 6 (100.0%) |
| 18 to 24 Years | 38 (100.0%) | 6 (100.0%) |
| 25 to 34 Years | 18 (100.0%) | 17 (100.0%) |
| 35 to 44 Years | 18 (100.0%) | 15 (100.0%) |
| 45 to 54 Years | 14 (66.7%) | 15 (100.0%) |
| 55 to 64 Years | 13 (100.0%) | 6 (100.0%) |
| 65 to 74 Years | 29 (100.0%) | 19 (61.3%) |
| 75 Years and over | 0 (0.0%) | 4 (44.4%) |
| Total | 148 (93.7%) | 104 (86.0%) |
Income Below Poverty Among Married-Couple Families in Clam Gulch
The poverty statistics for married-couple families in Clam Gulch show that 12.5% or 4 of the total 32 families live below the poverty line. Families with no children have the highest poverty rate of 14.8%, comprising of 4 families. On the other hand, families with 5 or more children have the lowest poverty rate of 0.0%, which includes 0 families.
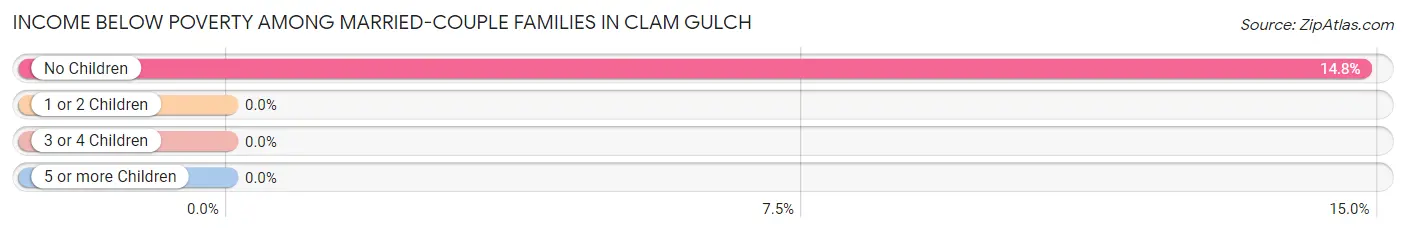
| Children | Above Poverty | Below Poverty |
| No Children | 23 (85.2%) | 4 (14.8%) |
| 1 or 2 Children | 0 (0.0%) | 0 (0.0%) |
| 3 or 4 Children | 0 (0.0%) | 0 (0.0%) |
| 5 or more Children | 5 (100.0%) | 0 (0.0%) |
| Total | 28 (87.5%) | 4 (12.5%) |
Income Below Poverty Among Single-Parent Households in Clam Gulch
| Children | Single Father | Single Mother |
| No Children | 0 (0.0%) | 0 (0.0%) |
| 1 or 2 Children | 0 (0.0%) | 0 (0.0%) |
| 3 or 4 Children | 0 (0.0%) | 0 (0.0%) |
| 5 or more Children | 0 (0.0%) | 0 (0.0%) |
| Total | 0 (0.0%) | 0 (0.0%) |
Income Below Poverty Among Married-Couple vs Single-Parent Households in Clam Gulch
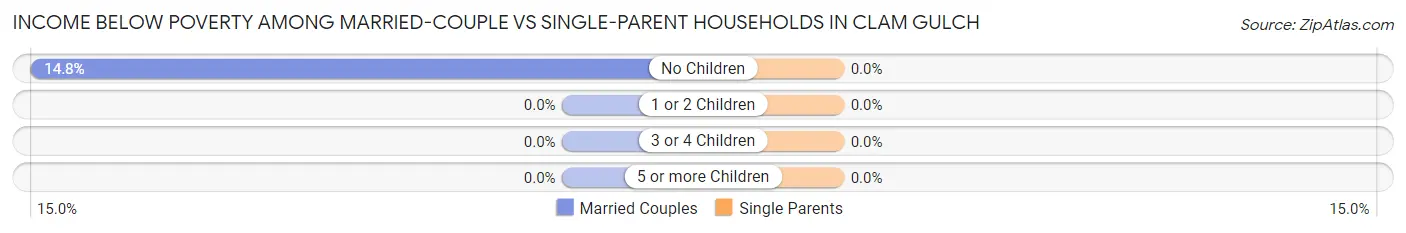
| Children | Married-Couple Families | Single-Parent Households |
| No Children | 4 (14.8%) | 0 (0.0%) |
| 1 or 2 Children | 0 (0.0%) | 0 (0.0%) |
| 3 or 4 Children | 0 (0.0%) | 0 (0.0%) |
| 5 or more Children | 0 (0.0%) | 0 (0.0%) |
| Total | 4 (12.5%) | 0 (0.0%) |
Race in Clam Gulch
The most populous races in Clam Gulch are White / Caucasian (255 | 91.4%), and Native / Alaskan (24 | 8.6%).
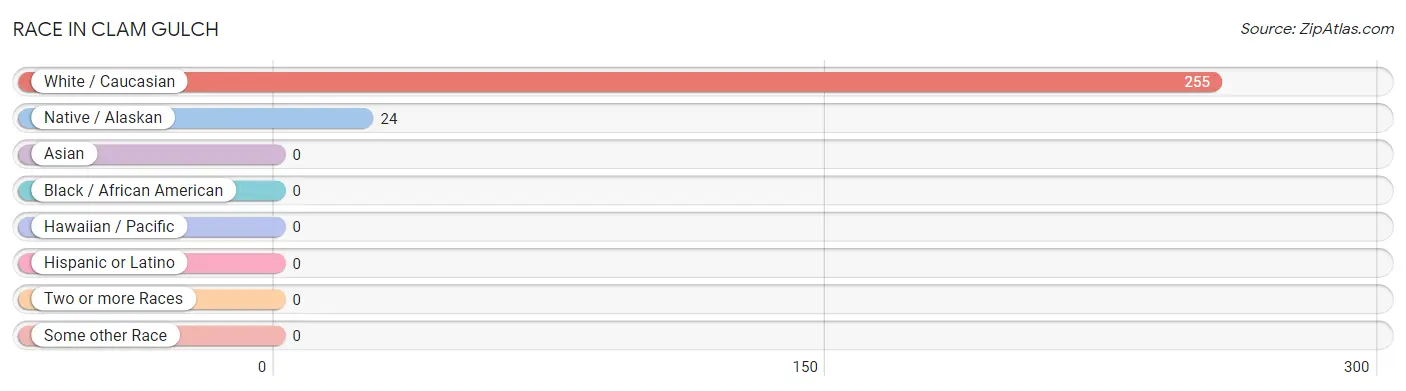
| Race | # Population | % Population |
| Asian | 0 | 0.0% |
| Black / African American | 0 | 0.0% |
| Hawaiian / Pacific | 0 | 0.0% |
| Hispanic or Latino | 0 | 0.0% |
| Native / Alaskan | 24 | 8.6% |
| White / Caucasian | 255 | 91.4% |
| Two or more Races | 0 | 0.0% |
| Some other Race | 0 | 0.0% |
| Total | 279 | 100.0% |
Ancestry in Clam Gulch
The most populous ancestries reported in Clam Gulch are Irish (53 | 19.0%), English (47 | 16.9%), German (47 | 16.9%), Scottish (29 | 10.4%), and French (23 | 8.2%), together accounting for 71.3% of all Clam Gulch residents.
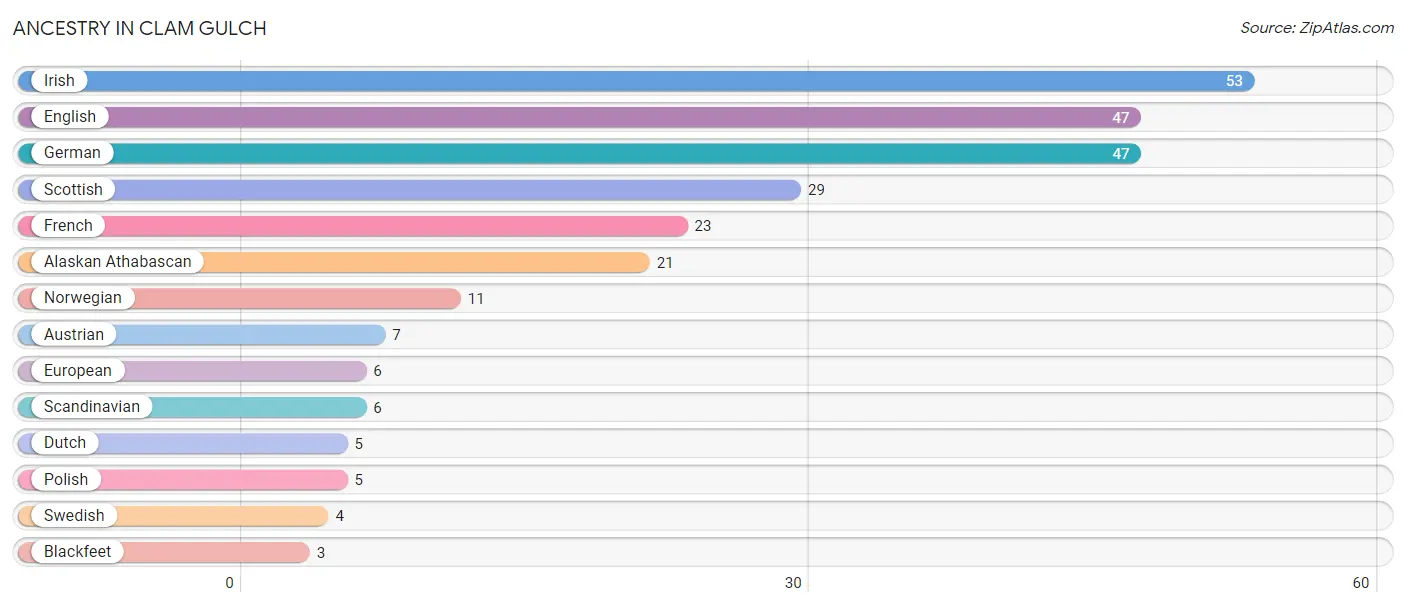
| Ancestry | # Population | % Population |
| Alaskan Athabascan | 21 | 7.5% |
| Austrian | 7 | 2.5% |
| Blackfeet | 3 | 1.1% |
| Dutch | 5 | 1.8% |
| English | 47 | 16.9% |
| European | 6 | 2.1% |
| French | 23 | 8.2% |
| German | 47 | 16.9% |
| Irish | 53 | 19.0% |
| Norwegian | 11 | 3.9% |
| Polish | 5 | 1.8% |
| Scandinavian | 6 | 2.1% |
| Scottish | 29 | 10.4% |
| Swedish | 4 | 1.4% | View All 14 Rows |
Immigrants in Clam Gulch
The most numerous immigrant groups reported in Clam Gulch came from , and Canada (3 | 1.1%), together accounting for 1.1% of all Clam Gulch residents.

| Immigration Origin | # Population | % Population |
| Canada | 3 | 1.1% | View All 1 Rows |
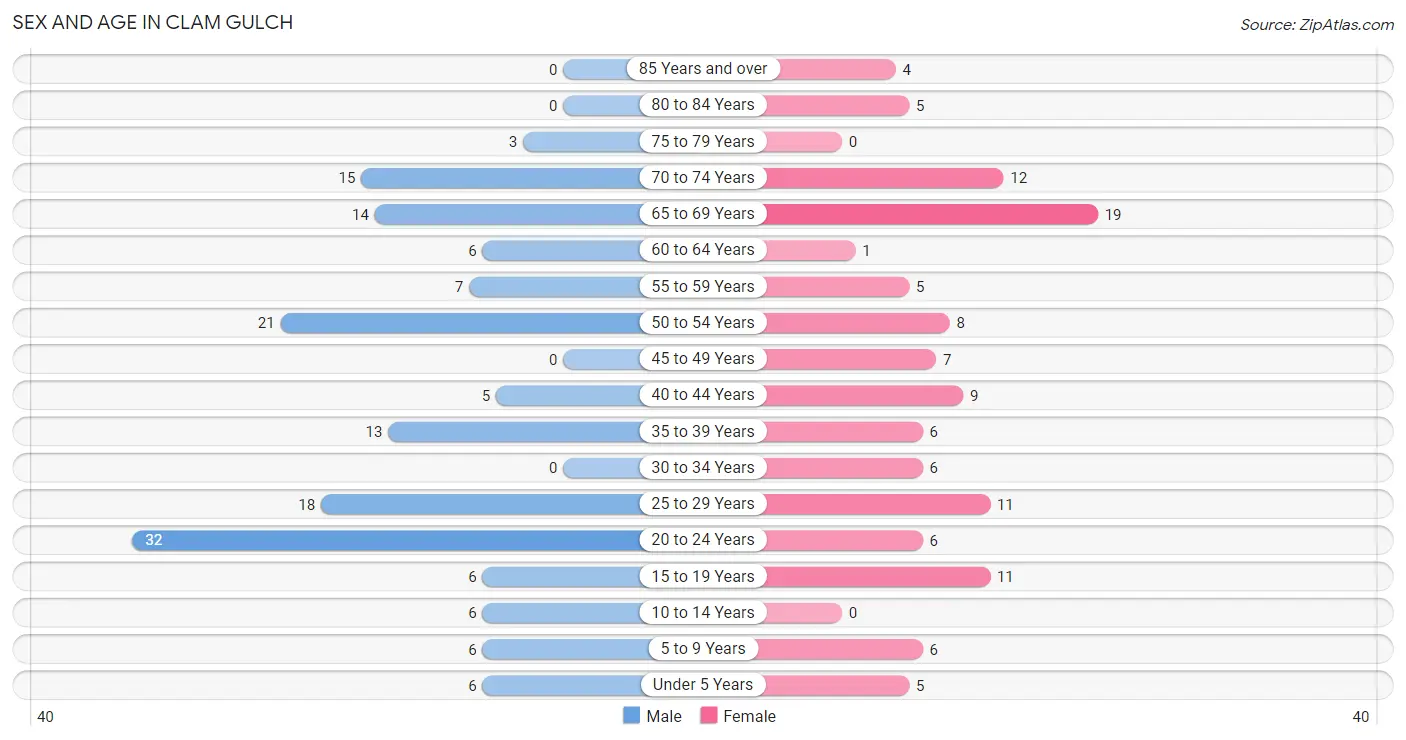
Sex and Age in Clam Gulch
Sex and Age in Clam Gulch
The most populous age groups in Clam Gulch are 20 to 24 Years (32 | 20.3%) for men and 65 to 69 Years (19 | 15.7%) for women.
| Age Bracket | Male | Female |
| Under 5 Years | 6 (3.8%) | 5 (4.1%) |
| 5 to 9 Years | 6 (3.8%) | 6 (5.0%) |
| 10 to 14 Years | 6 (3.8%) | 0 (0.0%) |
| 15 to 19 Years | 6 (3.8%) | 11 (9.1%) |
| 20 to 24 Years | 32 (20.3%) | 6 (5.0%) |
| 25 to 29 Years | 18 (11.4%) | 11 (9.1%) |
| 30 to 34 Years | 0 (0.0%) | 6 (5.0%) |
| 35 to 39 Years | 13 (8.2%) | 6 (5.0%) |
| 40 to 44 Years | 5 (3.2%) | 9 (7.4%) |
| 45 to 49 Years | 0 (0.0%) | 7 (5.8%) |
| 50 to 54 Years | 21 (13.3%) | 8 (6.6%) |
| 55 to 59 Years | 7 (4.4%) | 5 (4.1%) |
| 60 to 64 Years | 6 (3.8%) | 1 (0.8%) |
| 65 to 69 Years | 14 (8.9%) | 19 (15.7%) |
| 70 to 74 Years | 15 (9.5%) | 12 (9.9%) |
| 75 to 79 Years | 3 (1.9%) | 0 (0.0%) |
| 80 to 84 Years | 0 (0.0%) | 5 (4.1%) |
| 85 Years and over | 0 (0.0%) | 4 (3.3%) |
| Total | 158 (100.0%) | 121 (100.0%) |
Families and Households in Clam Gulch
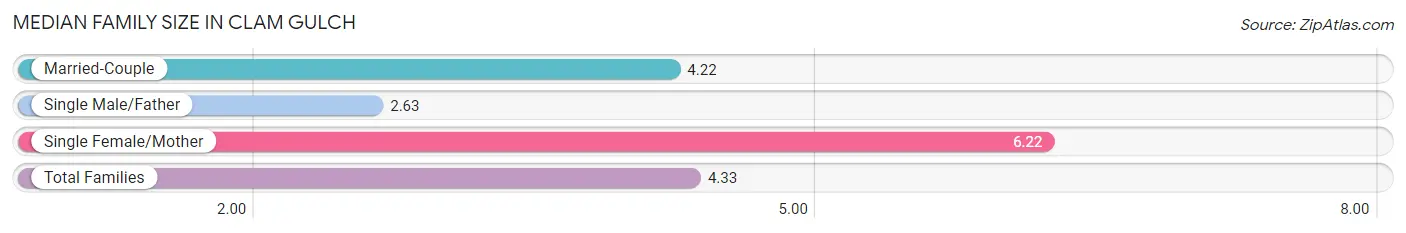
Median Family Size in Clam Gulch
The median family size in Clam Gulch is 4.33 persons per family, with single female/mother families (9 | 18.4%) accounting for the largest median family size of 6.22 persons per family. On the other hand, single male/father families (8 | 16.3%) represent the smallest median family size with 2.63 persons per family.
| Family Type | # Families | Family Size |
| Married-Couple | 32 (65.3%) | 4.22 |
| Single Male/Father | 8 (16.3%) | 2.63 |
| Single Female/Mother | 9 (18.4%) | 6.22 |
| Total Families | 49 (100.0%) | 4.33 |
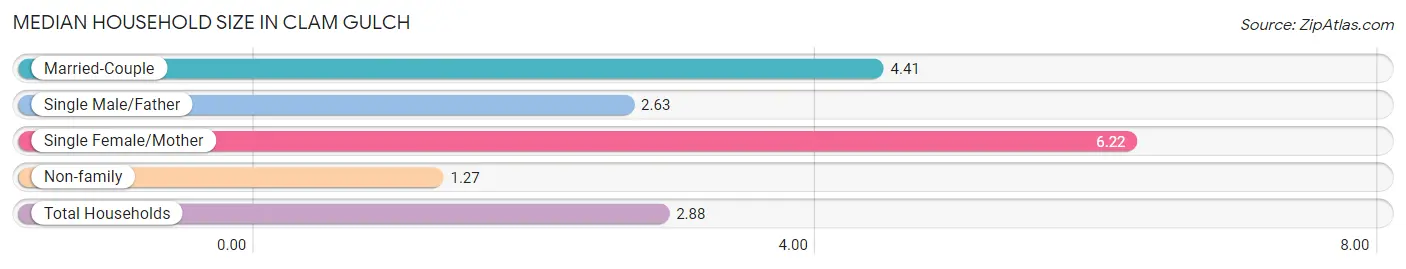
Median Household Size in Clam Gulch
The median household size in Clam Gulch is 2.88 persons per household, with single female/mother households (9 | 9.3%) accounting for the largest median household size of 6.22 persons per household. non-family households (48 | 49.5%) represent the smallest median household size with 1.27 persons per household.
| Household Type | # Households | Household Size |
| Married-Couple | 32 (33.0%) | 4.41 |
| Single Male/Father | 8 (8.3%) | 2.63 |
| Single Female/Mother | 9 (9.3%) | 6.22 |
| Non-family | 48 (49.5%) | 1.27 |
| Total Households | 97 (100.0%) | 2.88 |
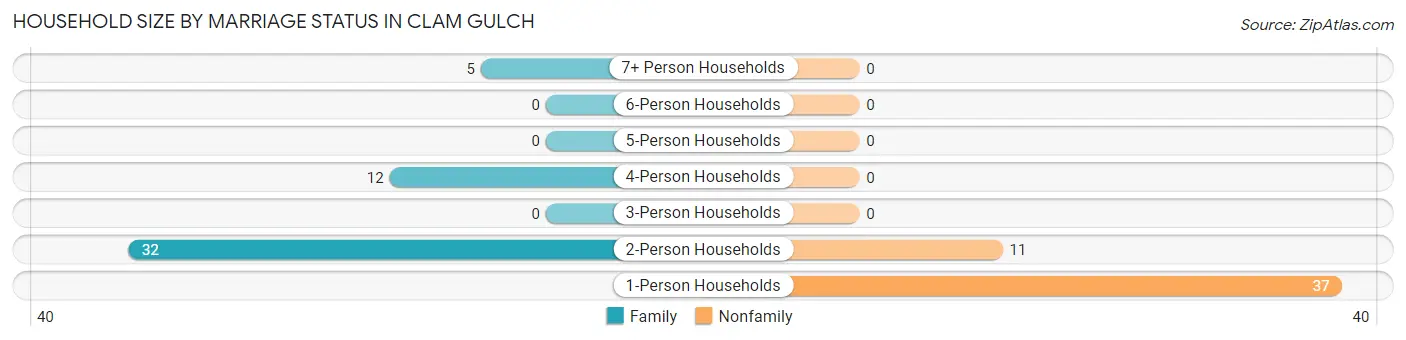
Household Size by Marriage Status in Clam Gulch
Out of a total of 97 households in Clam Gulch, 49 (50.5%) are family households, while 48 (49.5%) are nonfamily households. The most numerous type of family households are 2-person households, comprising 32, and the most common type of nonfamily households are 1-person households, comprising 37.
| Household Size | Family Households | Nonfamily Households |
| 1-Person Households | - | 37 (38.1%) |
| 2-Person Households | 32 (33.0%) | 11 (11.3%) |
| 3-Person Households | 0 (0.0%) | 0 (0.0%) |
| 4-Person Households | 12 (12.4%) | 0 (0.0%) |
| 5-Person Households | 0 (0.0%) | 0 (0.0%) |
| 6-Person Households | 0 (0.0%) | 0 (0.0%) |
| 7+ Person Households | 5 (5.1%) | 0 (0.0%) |
| Total | 49 (50.5%) | 48 (49.5%) |
Female Fertility in Clam Gulch
Fertility by Age in Clam Gulch
| Age Bracket | Women with Births | Births / 1,000 Women |
| 15 to 19 years | 0 (0.0%) | 0.0 |
| 20 to 34 years | 0 (0.0%) | 0.0 |
| 35 to 50 years | 0 (0.0%) | 0.0 |
| Total | 0 (0.0%) | 0.0 |
Fertility by Age by Marriage Status in Clam Gulch
| Age Bracket | Married | Unmarried |
| 15 to 19 years | 0 (0.0%) | 0 (0.0%) |
| 20 to 34 years | 0 (0.0%) | 0 (0.0%) |
| 35 to 50 years | 0 (0.0%) | 0 (0.0%) |
| Total | 0 (0.0%) | 0 (0.0%) |
Fertility by Education in Clam Gulch
| Educational Attainment | Women with Births | Births / 1,000 Women |
| Less than High School | 0 (0.0%) | 0.0 |
| High School Diploma | 0 (0.0%) | 0.0 |
| College or Associate's Degree | 0 (0.0%) | 0.0 |
| Bachelor's Degree | 0 (0.0%) | 0.0 |
| Graduate Degree | 0 (0.0%) | 0.0 |
| Total | 0 (0.0%) | 0.0 |
Fertility by Education by Marriage Status in Clam Gulch
| Educational Attainment | Married | Unmarried |
| Less than High School | 0 (0.0%) | 0 (0.0%) |
| High School Diploma | 0 (0.0%) | 0 (0.0%) |
| College or Associate's Degree | 0 (0.0%) | 0 (0.0%) |
| Bachelor's Degree | 0 (0.0%) | 0 (0.0%) |
| Graduate Degree | 0 (0.0%) | 0 (0.0%) |
| Total | 0 (0.0%) | 0 (0.0%) |
Employment Characteristics in Clam Gulch
Employment by Class of Employer in Clam Gulch
Among the 127 employed individuals in Clam Gulch, private company employees (83 | 65.3%), local government employees (26 | 20.5%), and federal government employees (7 | 5.5%) make up the most common classes of employment.
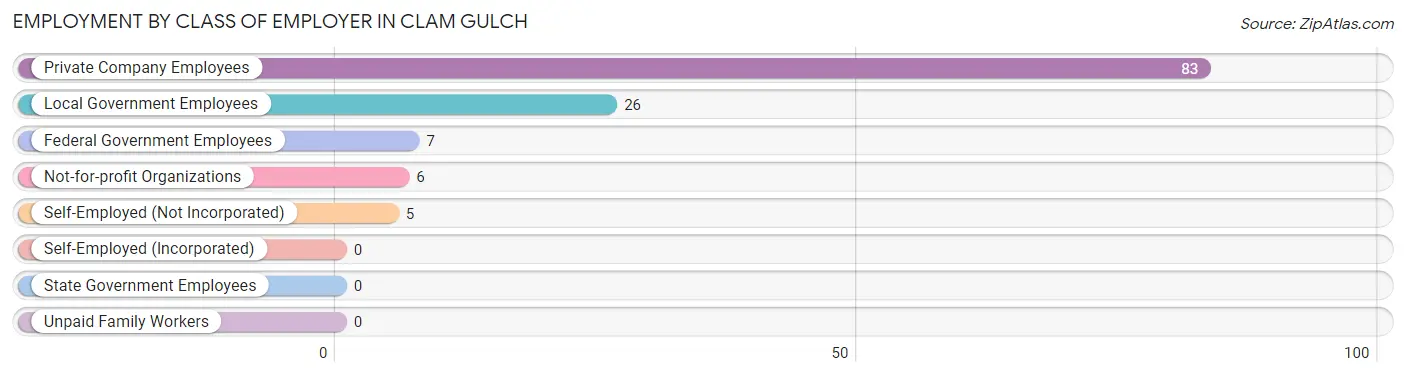
| Employer Class | # Employees | % Employees |
| Private Company Employees | 83 | 65.3% |
| Self-Employed (Incorporated) | 0 | 0.0% |
| Self-Employed (Not Incorporated) | 5 | 3.9% |
| Not-for-profit Organizations | 6 | 4.7% |
| Local Government Employees | 26 | 20.5% |
| State Government Employees | 0 | 0.0% |
| Federal Government Employees | 7 | 5.5% |
| Unpaid Family Workers | 0 | 0.0% |
| Total | 127 | 100.0% |
Employment Status by Age in Clam Gulch
According to the labor force statistics for Clam Gulch, out of the total population over 16 years of age (245), 60.0% or 147 individuals are in the labor force, with 13.6% or 20 of them unemployed. The age group with the highest labor force participation rate is 20 to 24 years, with 100.0% or 38 individuals in the labor force. Within the labor force, the 45 to 54 years age range has the highest percentage of unemployed individuals, with 33.3% or 7 of them being unemployed.
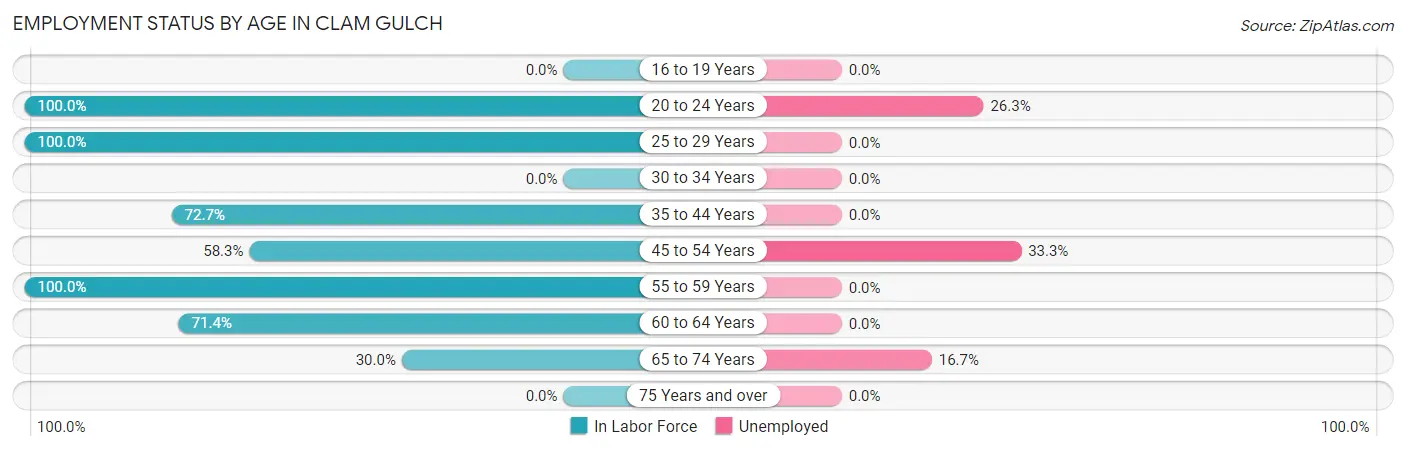
| Age Bracket | In Labor Force | Unemployed |
| 16 to 19 Years | 0 (0.0%) | 0 (0.0%) |
| 20 to 24 Years | 38 (100.0%) | 10 (26.3%) |
| 25 to 29 Years | 29 (100.0%) | 0 (0.0%) |
| 30 to 34 Years | 0 (0.0%) | 0 (0.0%) |
| 35 to 44 Years | 24 (72.7%) | 0 (0.0%) |
| 45 to 54 Years | 21 (58.3%) | 7 (33.3%) |
| 55 to 59 Years | 12 (100.0%) | 0 (0.0%) |
| 60 to 64 Years | 5 (71.4%) | 0 (0.0%) |
| 65 to 74 Years | 18 (30.0%) | 3 (16.7%) |
| 75 Years and over | 0 (0.0%) | 0 (0.0%) |
| Total | 147 (60.0%) | 20 (13.6%) |
Employment Status by Educational Attainment in Clam Gulch
According to labor force statistics for Clam Gulch, 74.0% of individuals (91) out of the total population between 25 and 64 years of age (123) are in the labor force, with 7.7% or 7 of them being unemployed. The group with the highest labor force participation rate are those with the educational attainment of college / associate degree, with 75.4% or 46 individuals in the labor force. Within the labor force, individuals with college / associate degree education have the highest percentage of unemployment, with 15.2% or 7 of them being unemployed.
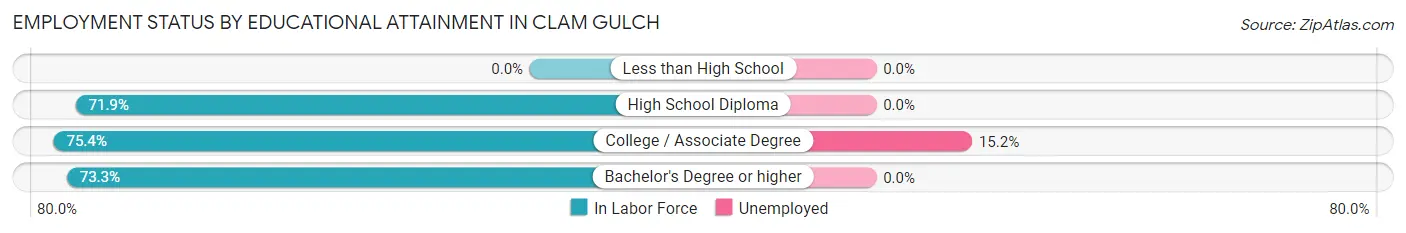
| Educational Attainment | In Labor Force | Unemployed |
| Less than High School | 0 (0.0%) | 0 (0.0%) |
| High School Diploma | 23 (71.9%) | 0 (0.0%) |
| College / Associate Degree | 46 (75.4%) | 9 (15.2%) |
| Bachelor's Degree or higher | 22 (73.3%) | 0 (0.0%) |
| Total | 91 (74.0%) | 9 (7.7%) |
Employment Occupations by Sex in Clam Gulch
Management, Business, Science and Arts Occupations
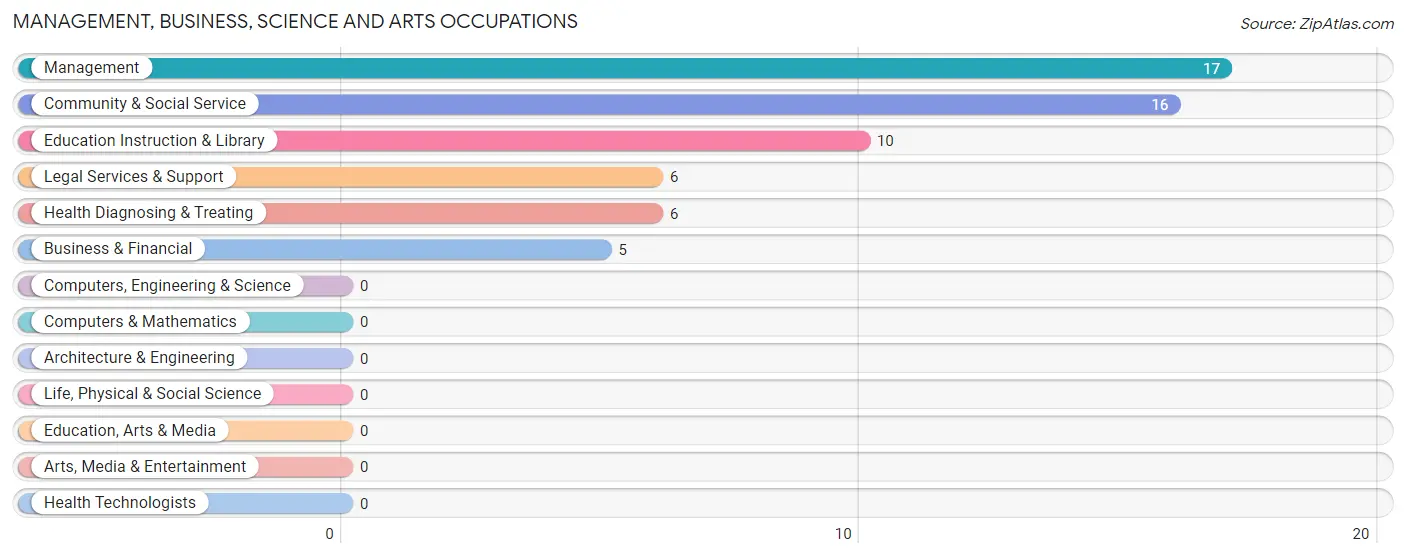
The most common Management, Business, Science and Arts occupations in Clam Gulch are Management (17 | 13.4%), Community & Social Service (16 | 12.6%), Education Instruction & Library (10 | 7.9%), Legal Services & Support (6 | 4.7%), and Health Diagnosing & Treating (6 | 4.7%).
Management, Business, Science and Arts Occupations by Sex
Within the Management, Business, Science and Arts occupations in Clam Gulch, the most male-oriented occupations are Legal Services & Support (100.0%), Health Diagnosing & Treating (100.0%), and Community & Social Service (68.8%), while the most female-oriented occupations are Business & Financial (100.0%), Management (58.8%), and Education Instruction & Library (50.0%).
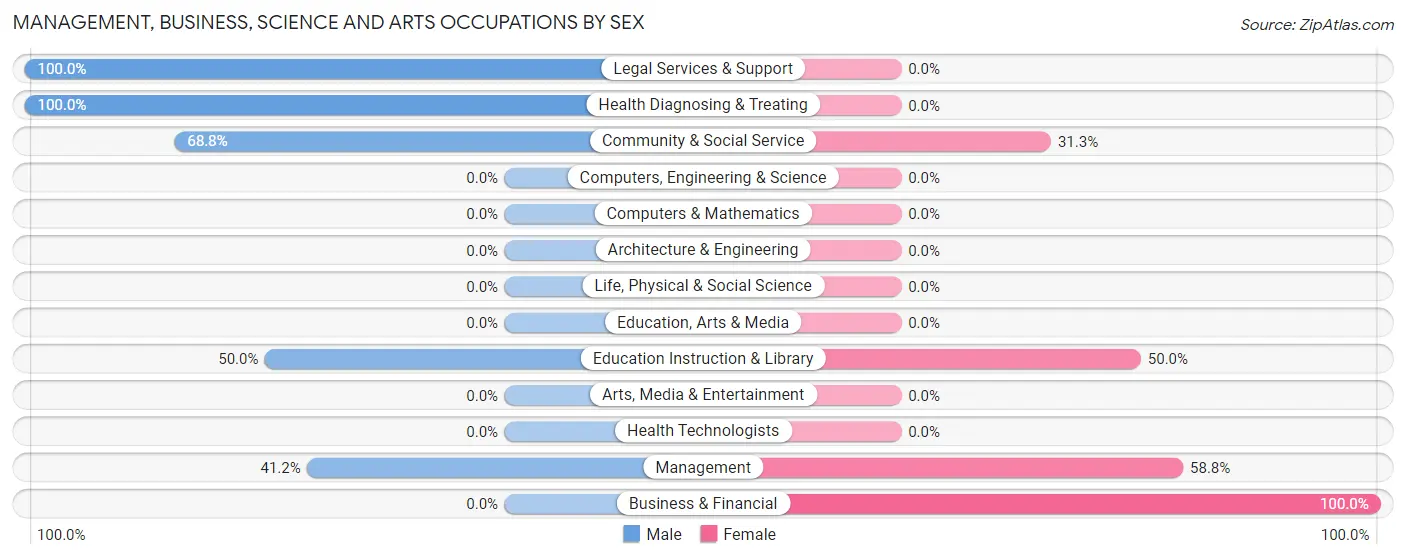
| Occupation | Male | Female |
| Management | 7 (41.2%) | 10 (58.8%) |
| Business & Financial | 0 (0.0%) | 5 (100.0%) |
| Computers, Engineering & Science | 0 (0.0%) | 0 (0.0%) |
| Computers & Mathematics | 0 (0.0%) | 0 (0.0%) |
| Architecture & Engineering | 0 (0.0%) | 0 (0.0%) |
| Life, Physical & Social Science | 0 (0.0%) | 0 (0.0%) |
| Community & Social Service | 11 (68.8%) | 5 (31.2%) |
| Education, Arts & Media | 0 (0.0%) | 0 (0.0%) |
| Legal Services & Support | 6 (100.0%) | 0 (0.0%) |
| Education Instruction & Library | 5 (50.0%) | 5 (50.0%) |
| Arts, Media & Entertainment | 0 (0.0%) | 0 (0.0%) |
| Health Diagnosing & Treating | 6 (100.0%) | 0 (0.0%) |
| Health Technologists | 0 (0.0%) | 0 (0.0%) |
| Total (Category) | 24 (54.5%) | 20 (45.5%) |
| Total (Overall) | 90 (70.9%) | 37 (29.1%) |
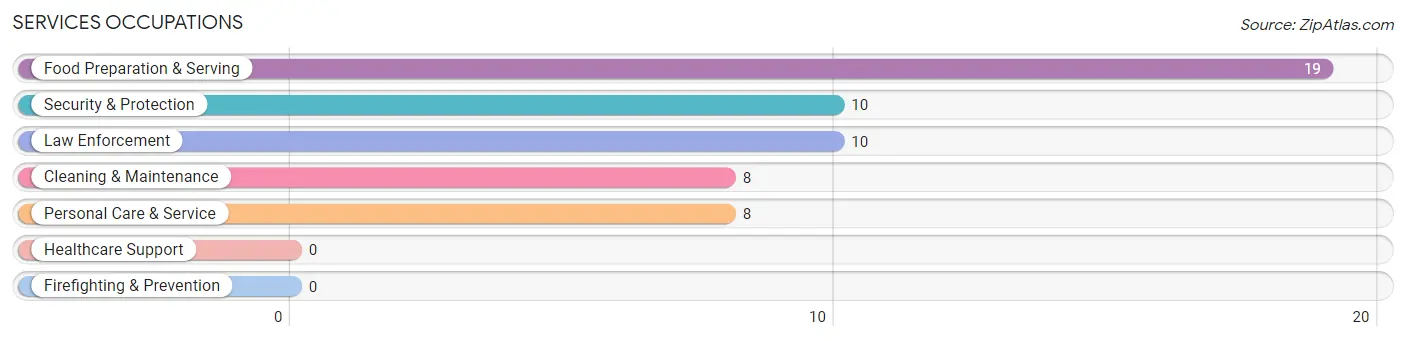
Services Occupations
The most common Services occupations in Clam Gulch are Food Preparation & Serving (19 | 15.0%), Security & Protection (10 | 7.9%), Law Enforcement (10 | 7.9%), Cleaning & Maintenance (8 | 6.3%), and Personal Care & Service (8 | 6.3%).
Services Occupations by Sex
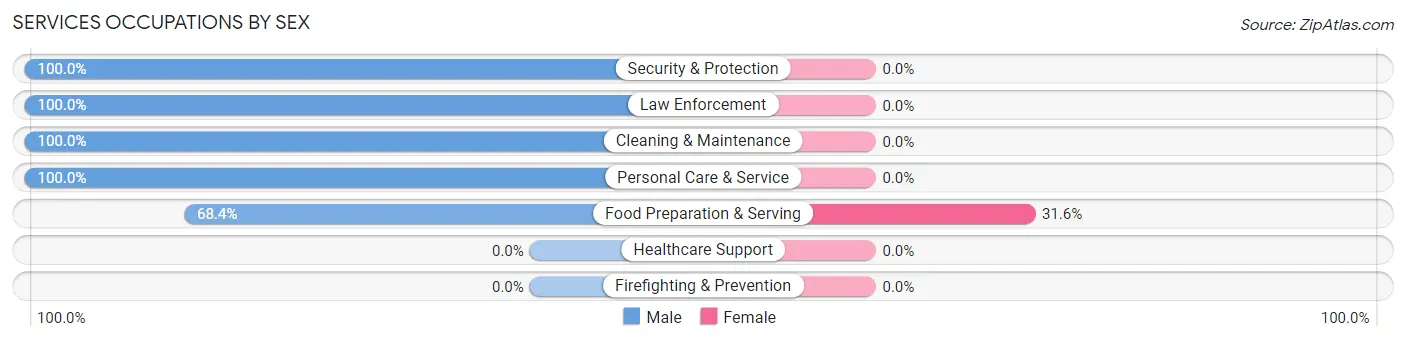
| Occupation | Male | Female |
| Healthcare Support | 0 (0.0%) | 0 (0.0%) |
| Security & Protection | 10 (100.0%) | 0 (0.0%) |
| Firefighting & Prevention | 0 (0.0%) | 0 (0.0%) |
| Law Enforcement | 10 (100.0%) | 0 (0.0%) |
| Food Preparation & Serving | 13 (68.4%) | 6 (31.6%) |
| Cleaning & Maintenance | 8 (100.0%) | 0 (0.0%) |
| Personal Care & Service | 8 (100.0%) | 0 (0.0%) |
| Total (Category) | 39 (86.7%) | 6 (13.3%) |
| Total (Overall) | 90 (70.9%) | 37 (29.1%) |
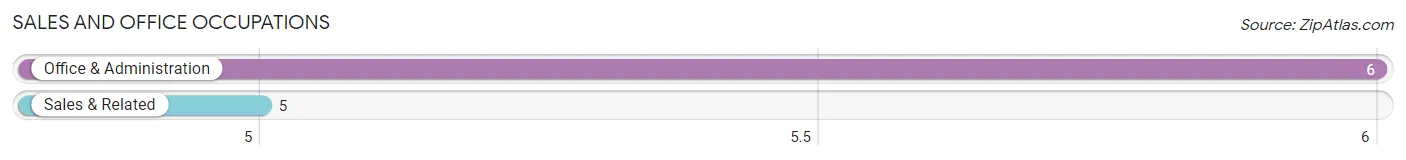
Sales and Office Occupations
The most common Sales and Office occupations in Clam Gulch are Office & Administration (6 | 4.7%), and Sales & Related (5 | 3.9%).
Sales and Office Occupations by Sex
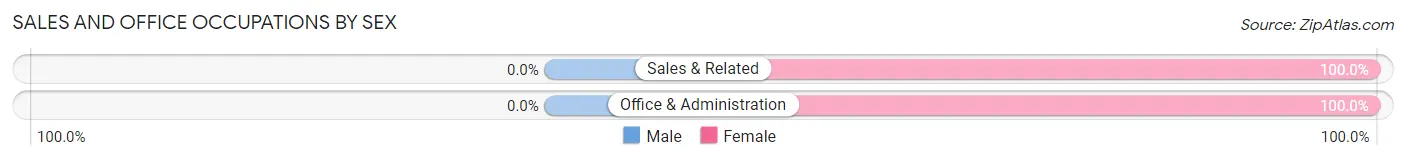
| Occupation | Male | Female |
| Sales & Related | 0 (0.0%) | 5 (100.0%) |
| Office & Administration | 0 (0.0%) | 6 (100.0%) |
| Total (Category) | 0 (0.0%) | 11 (100.0%) |
| Total (Overall) | 90 (70.9%) | 37 (29.1%) |
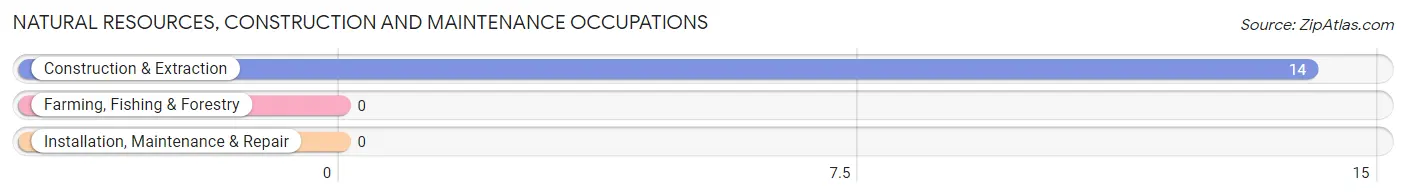
Natural Resources, Construction and Maintenance Occupations
The most common Natural Resources, Construction and Maintenance occupations in Clam Gulch are , and Construction & Extraction (14 | 11.0%).
Natural Resources, Construction and Maintenance Occupations by Sex
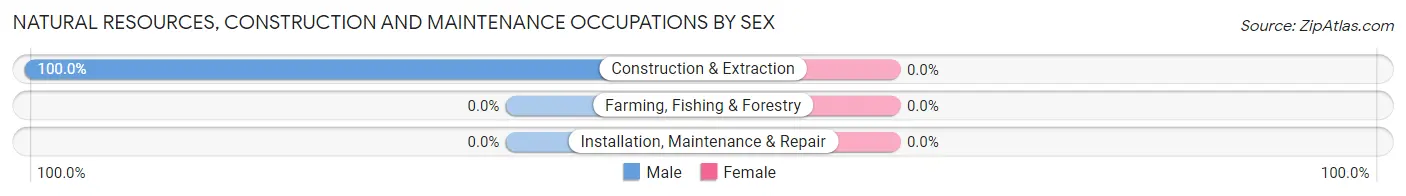
| Occupation | Male | Female |
| Farming, Fishing & Forestry | 0 (0.0%) | 0 (0.0%) |
| Construction & Extraction | 14 (100.0%) | 0 (0.0%) |
| Installation, Maintenance & Repair | 0 (0.0%) | 0 (0.0%) |
| Total (Category) | 14 (100.0%) | 0 (0.0%) |
| Total (Overall) | 90 (70.9%) | 37 (29.1%) |
Production, Transportation and Moving Occupations
The most common Production, Transportation and Moving occupations in Clam Gulch are Production (7 | 5.5%), and Transportation (6 | 4.7%).
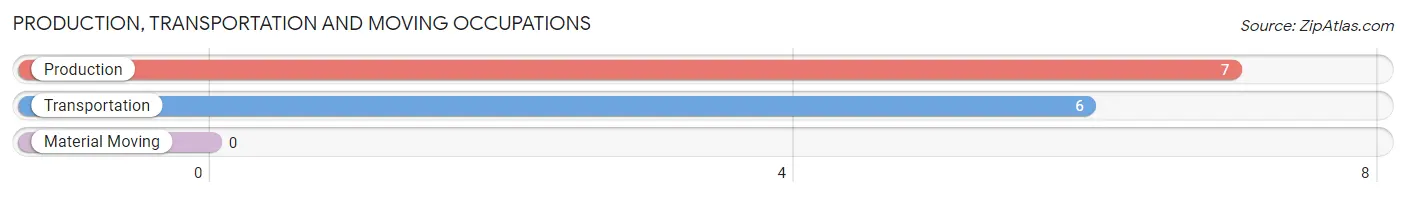
Production, Transportation and Moving Occupations by Sex
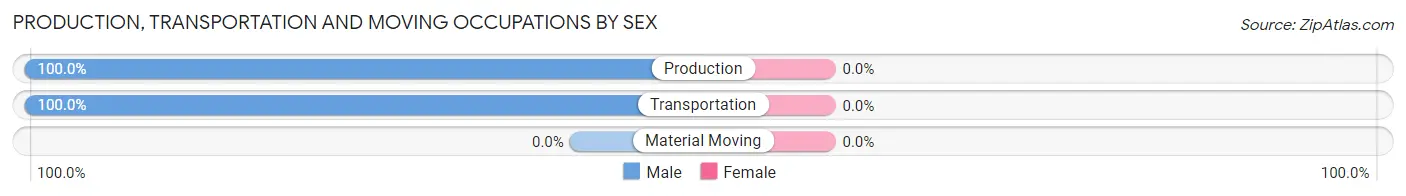
| Occupation | Male | Female |
| Production | 7 (100.0%) | 0 (0.0%) |
| Transportation | 6 (100.0%) | 0 (0.0%) |
| Material Moving | 0 (0.0%) | 0 (0.0%) |
| Total (Category) | 13 (100.0%) | 0 (0.0%) |
| Total (Overall) | 90 (70.9%) | 37 (29.1%) |
Employment Industries by Sex in Clam Gulch
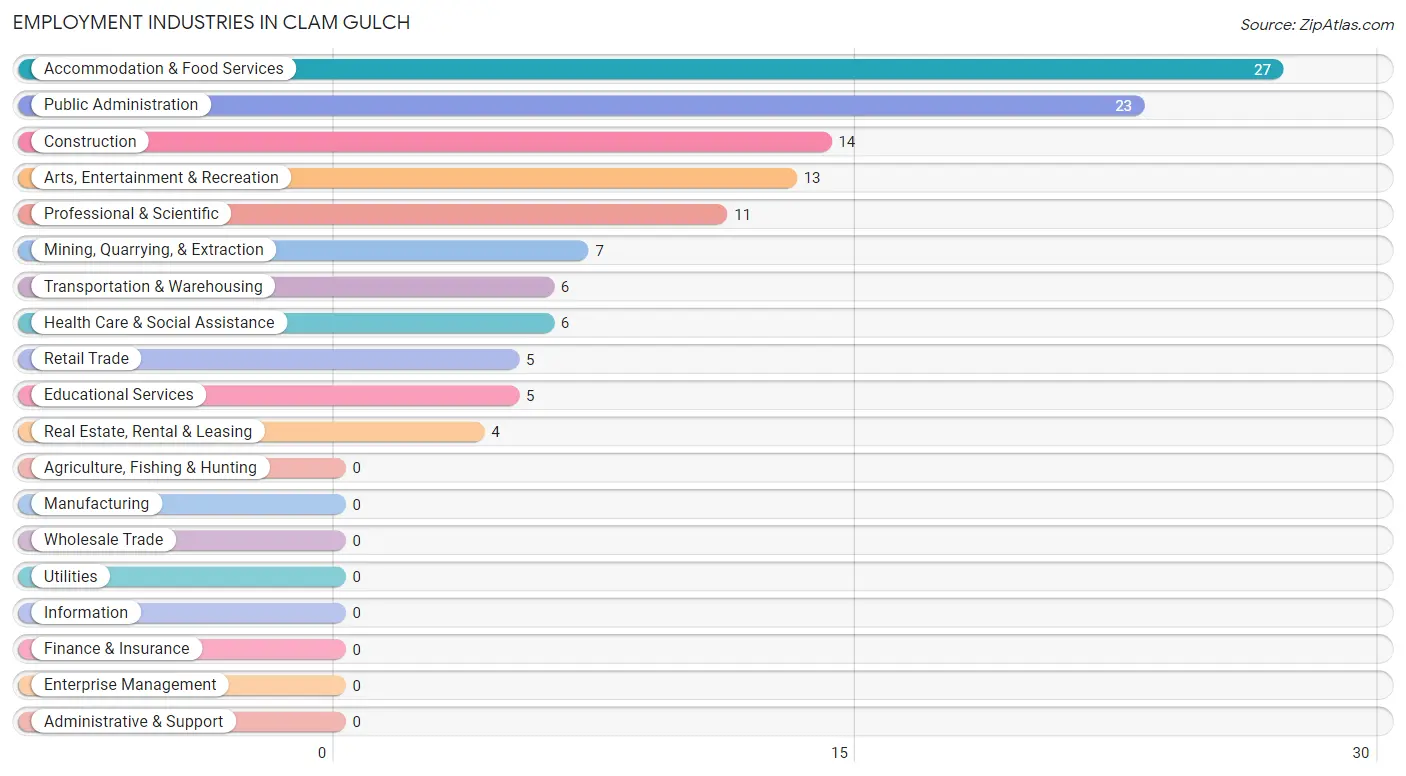
Employment Industries in Clam Gulch
The major employment industries in Clam Gulch include Accommodation & Food Services (27 | 21.3%), Public Administration (23 | 18.1%), Construction (14 | 11.0%), Arts, Entertainment & Recreation (13 | 10.2%), and Professional & Scientific (11 | 8.7%).
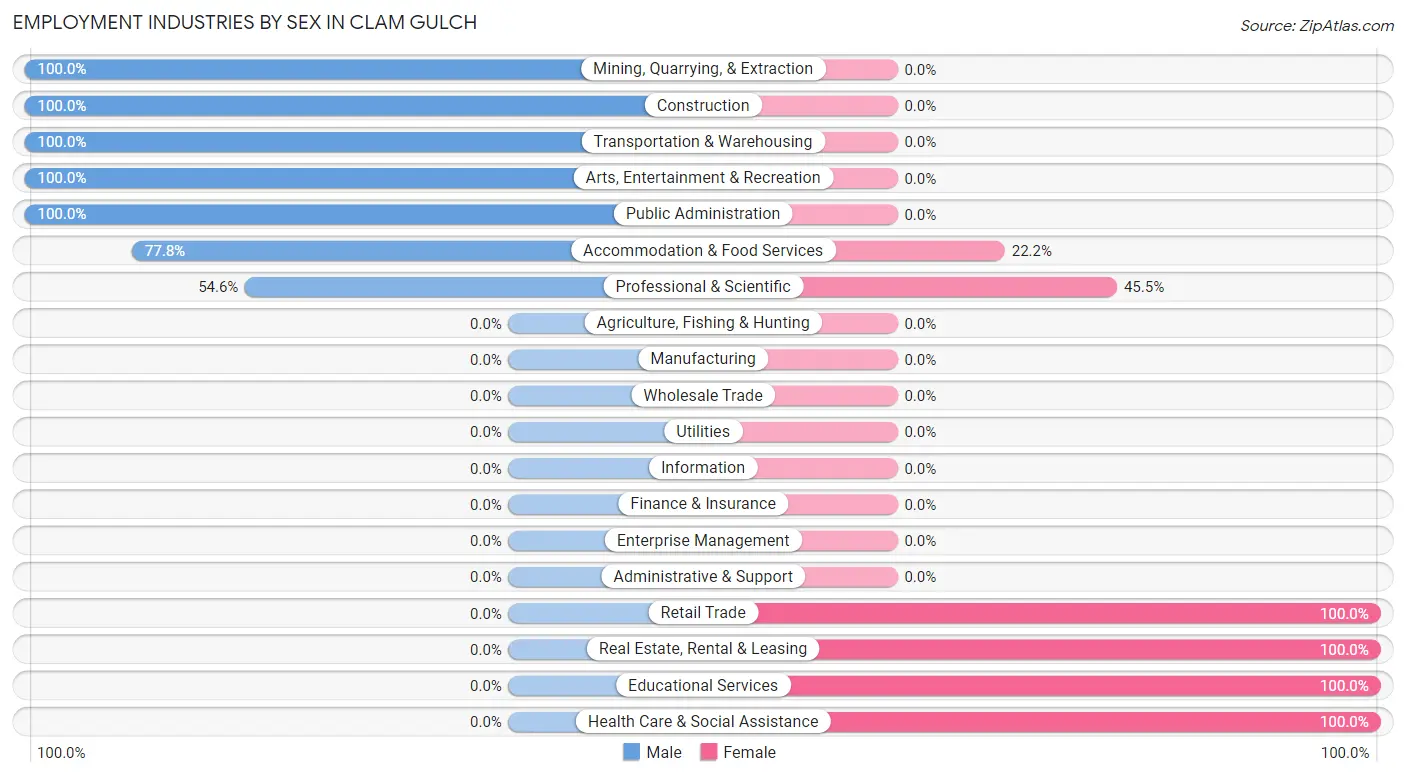
Employment Industries by Sex in Clam Gulch
The Clam Gulch industries that see more men than women are Mining, Quarrying, & Extraction (100.0%), Construction (100.0%), and Transportation & Warehousing (100.0%), whereas the industries that tend to have a higher number of women are Retail Trade (100.0%), Real Estate, Rental & Leasing (100.0%), and Educational Services (100.0%).
| Industry | Male | Female |
| Agriculture, Fishing & Hunting | 0 (0.0%) | 0 (0.0%) |
| Mining, Quarrying, & Extraction | 7 (100.0%) | 0 (0.0%) |
| Construction | 14 (100.0%) | 0 (0.0%) |
| Manufacturing | 0 (0.0%) | 0 (0.0%) |
| Wholesale Trade | 0 (0.0%) | 0 (0.0%) |
| Retail Trade | 0 (0.0%) | 5 (100.0%) |
| Transportation & Warehousing | 6 (100.0%) | 0 (0.0%) |
| Utilities | 0 (0.0%) | 0 (0.0%) |
| Information | 0 (0.0%) | 0 (0.0%) |
| Finance & Insurance | 0 (0.0%) | 0 (0.0%) |
| Real Estate, Rental & Leasing | 0 (0.0%) | 4 (100.0%) |
| Professional & Scientific | 6 (54.5%) | 5 (45.5%) |
| Enterprise Management | 0 (0.0%) | 0 (0.0%) |
| Administrative & Support | 0 (0.0%) | 0 (0.0%) |
| Educational Services | 0 (0.0%) | 5 (100.0%) |
| Health Care & Social Assistance | 0 (0.0%) | 6 (100.0%) |
| Arts, Entertainment & Recreation | 13 (100.0%) | 0 (0.0%) |
| Accommodation & Food Services | 21 (77.8%) | 6 (22.2%) |
| Public Administration | 23 (100.0%) | 0 (0.0%) |
| Total | 90 (70.9%) | 37 (29.1%) |
Education in Clam Gulch
School Enrollment in Clam Gulch
The most common levels of schooling among the 42 students in Clam Gulch are high school (17 | 40.5%), college / undergraduate (13 | 30.9%), and kindergarten (6 | 14.3%).
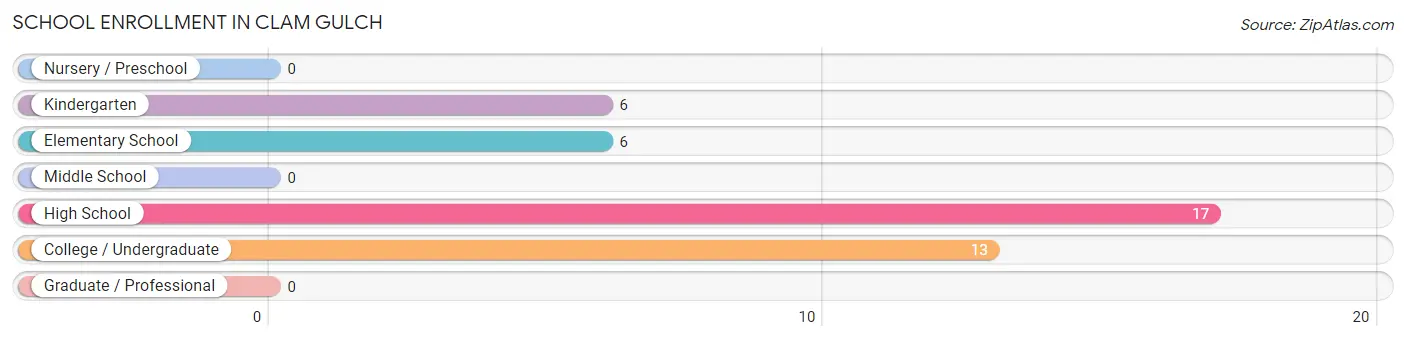
| School Level | # Students | % Students |
| Nursery / Preschool | 0 | 0.0% |
| Kindergarten | 6 | 14.3% |
| Elementary School | 6 | 14.3% |
| Middle School | 0 | 0.0% |
| High School | 17 | 40.5% |
| College / Undergraduate | 13 | 30.9% |
| Graduate / Professional | 0 | 0.0% |
| Total | 42 | 100.0% |
School Enrollment by Age by Funding Source in Clam Gulch
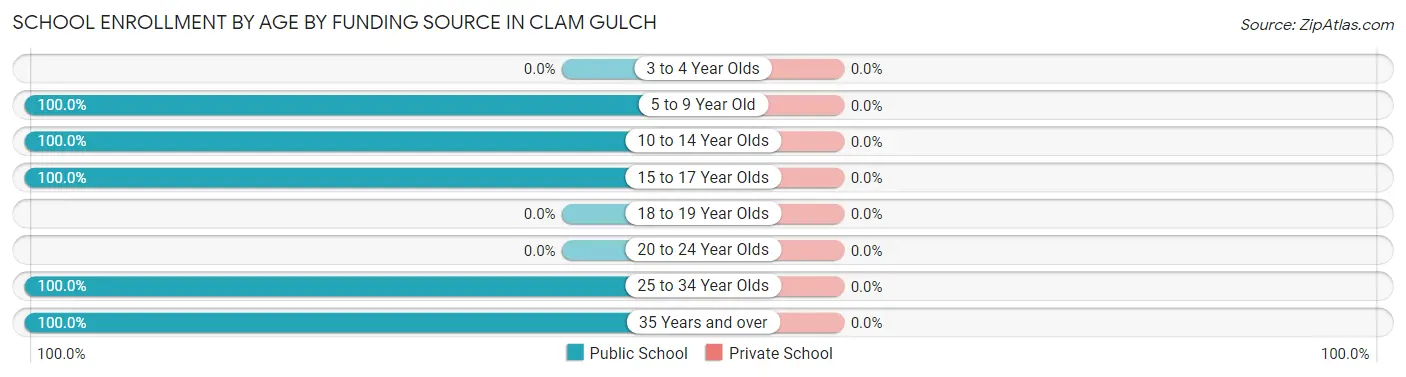
| Age Bracket | Public School | Private School |
| 3 to 4 Year Olds | 0 (0.0%) | 0 (0.0%) |
| 5 to 9 Year Old | 12 (100.0%) | 0 (0.0%) |
| 10 to 14 Year Olds | 6 (100.0%) | 0 (0.0%) |
| 15 to 17 Year Olds | 11 (100.0%) | 0 (0.0%) |
| 18 to 19 Year Olds | 0 (0.0%) | 0 (0.0%) |
| 20 to 24 Year Olds | 0 (0.0%) | 0 (0.0%) |
| 25 to 34 Year Olds | 6 (100.0%) | 0 (0.0%) |
| 35 Years and over | 7 (100.0%) | 0 (0.0%) |
| Total | 42 (100.0%) | 0 (0.0%) |
Educational Attainment by Field of Study in Clam Gulch
Social sciences (12 | 24.5%), physical & health sciences (6 | 12.2%), liberal arts & history (6 | 12.2%), communications (6 | 12.2%), and education (5 | 10.2%) are the most common fields of study among 49 individuals in Clam Gulch who have obtained a bachelor's degree or higher.
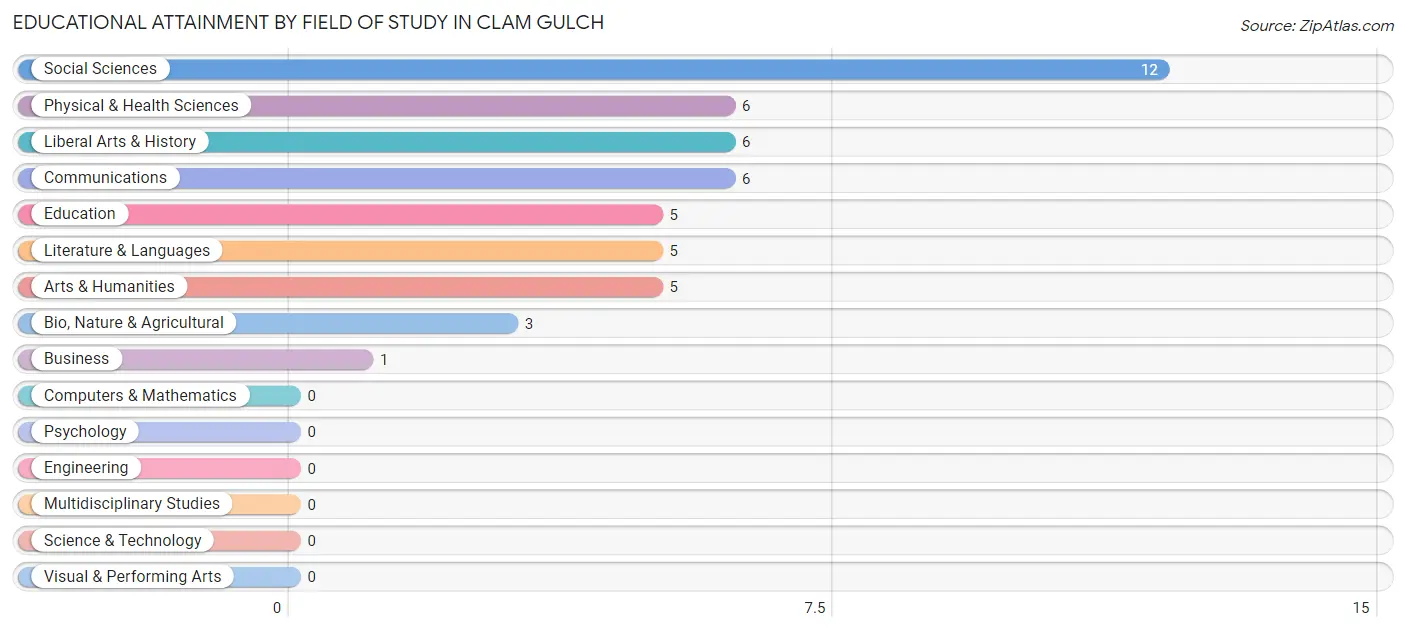
| Field of Study | # Graduates | % Graduates |
| Computers & Mathematics | 0 | 0.0% |
| Bio, Nature & Agricultural | 3 | 6.1% |
| Physical & Health Sciences | 6 | 12.2% |
| Psychology | 0 | 0.0% |
| Social Sciences | 12 | 24.5% |
| Engineering | 0 | 0.0% |
| Multidisciplinary Studies | 0 | 0.0% |
| Science & Technology | 0 | 0.0% |
| Business | 1 | 2.0% |
| Education | 5 | 10.2% |
| Literature & Languages | 5 | 10.2% |
| Liberal Arts & History | 6 | 12.2% |
| Visual & Performing Arts | 0 | 0.0% |
| Communications | 6 | 12.2% |
| Arts & Humanities | 5 | 10.2% |
| Total | 49 | 100.0% |
Transportation & Commute in Clam Gulch
Vehicle Availability by Sex in Clam Gulch
The most prevalent vehicle ownership categories in Clam Gulch are males with 2 vehicles (32, accounting for 35.6%) and females with 2 vehicles (6, making up 86.5%).
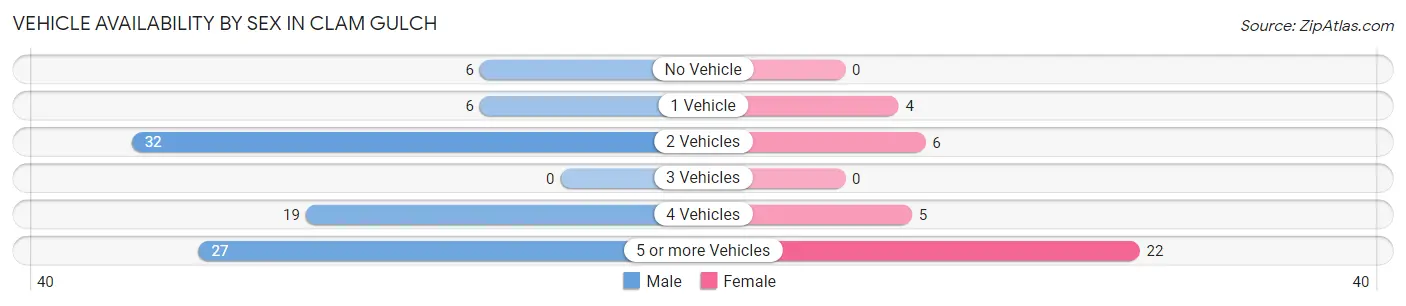
| Vehicles Available | Male | Female |
| No Vehicle | 6 (6.7%) | 0 (0.0%) |
| 1 Vehicle | 6 (6.7%) | 4 (10.8%) |
| 2 Vehicles | 32 (35.6%) | 6 (16.2%) |
| 3 Vehicles | 0 (0.0%) | 0 (0.0%) |
| 4 Vehicles | 19 (21.1%) | 5 (13.5%) |
| 5 or more Vehicles | 27 (30.0%) | 22 (59.5%) |
| Total | 90 (100.0%) | 37 (100.0%) |
Commute Time in Clam Gulch
The most frequently occuring commute durations in Clam Gulch are 30 to 34 minutes (33 commuters, 26.0%), 45 to 59 minutes (21 commuters, 16.5%), and 35 to 39 minutes (19 commuters, 15.0%).
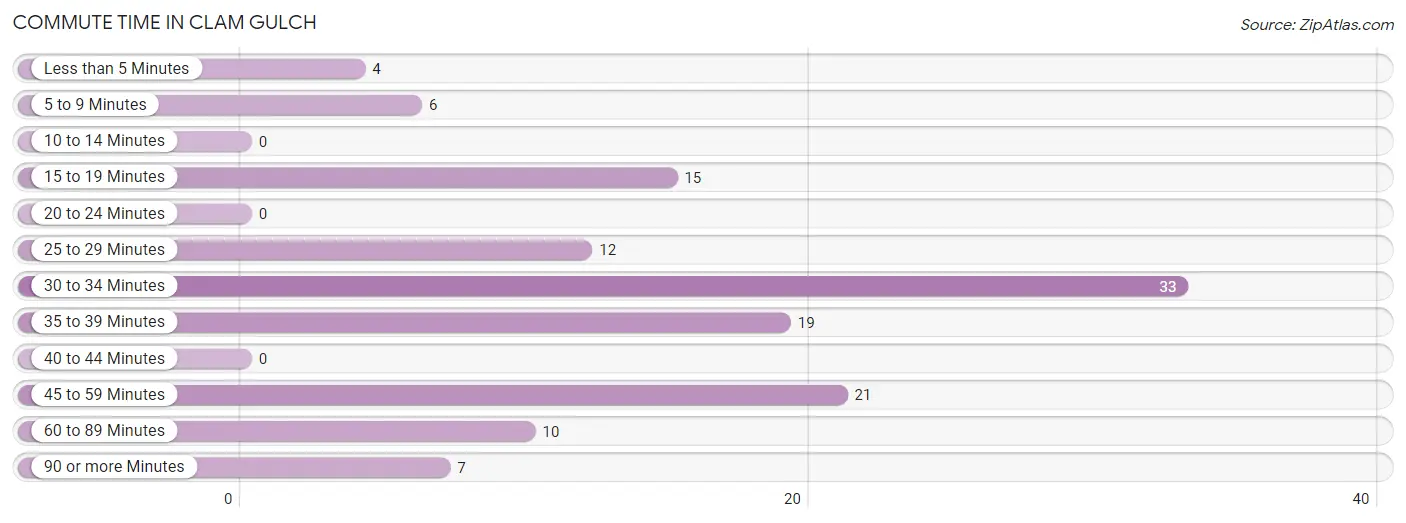
| Commute Time | # Commuters | % Commuters |
| Less than 5 Minutes | 4 | 3.2% |
| 5 to 9 Minutes | 6 | 4.7% |
| 10 to 14 Minutes | 0 | 0.0% |
| 15 to 19 Minutes | 15 | 11.8% |
| 20 to 24 Minutes | 0 | 0.0% |
| 25 to 29 Minutes | 12 | 9.5% |
| 30 to 34 Minutes | 33 | 26.0% |
| 35 to 39 Minutes | 19 | 15.0% |
| 40 to 44 Minutes | 0 | 0.0% |
| 45 to 59 Minutes | 21 | 16.5% |
| 60 to 89 Minutes | 10 | 7.9% |
| 90 or more Minutes | 7 | 5.5% |
Commute Time by Sex in Clam Gulch
The most common commute times in Clam Gulch are 30 to 34 minutes (21 commuters, 23.3%) for males and 15 to 19 minutes (15 commuters, 40.5%) for females.
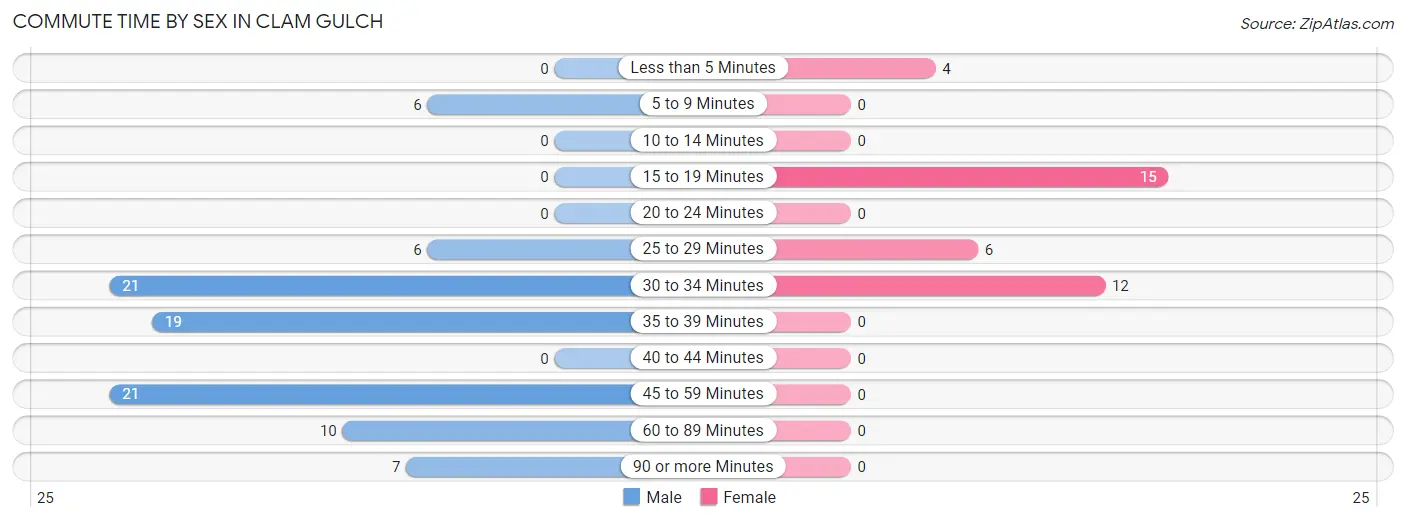
| Commute Time | Male | Female |
| Less than 5 Minutes | 0 (0.0%) | 4 (10.8%) |
| 5 to 9 Minutes | 6 (6.7%) | 0 (0.0%) |
| 10 to 14 Minutes | 0 (0.0%) | 0 (0.0%) |
| 15 to 19 Minutes | 0 (0.0%) | 15 (40.5%) |
| 20 to 24 Minutes | 0 (0.0%) | 0 (0.0%) |
| 25 to 29 Minutes | 6 (6.7%) | 6 (16.2%) |
| 30 to 34 Minutes | 21 (23.3%) | 12 (32.4%) |
| 35 to 39 Minutes | 19 (21.1%) | 0 (0.0%) |
| 40 to 44 Minutes | 0 (0.0%) | 0 (0.0%) |
| 45 to 59 Minutes | 21 (23.3%) | 0 (0.0%) |
| 60 to 89 Minutes | 10 (11.1%) | 0 (0.0%) |
| 90 or more Minutes | 7 (7.8%) | 0 (0.0%) |
Time of Departure to Work by Sex in Clam Gulch
The most frequent times of departure to work in Clam Gulch are 9:00 AM to 9:59 AM (21, 23.3%) for males and 7:30 AM to 7:59 AM (12, 32.4%) for females.
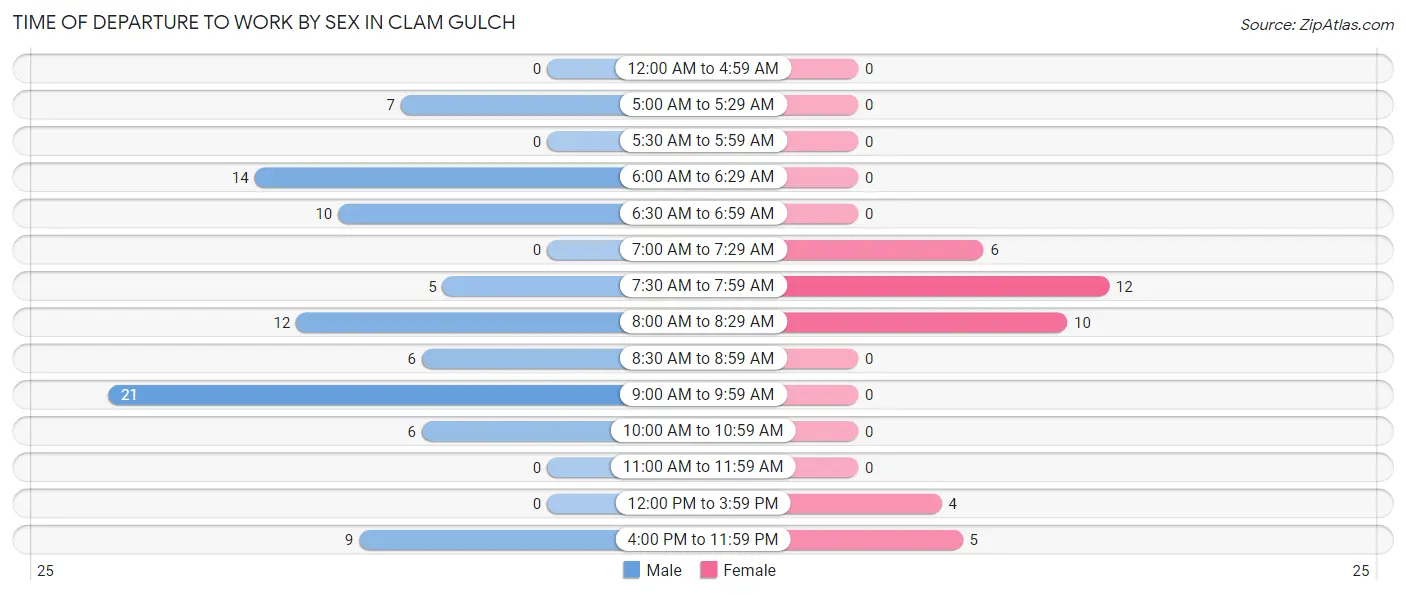
| Time of Departure | Male | Female |
| 12:00 AM to 4:59 AM | 0 (0.0%) | 0 (0.0%) |
| 5:00 AM to 5:29 AM | 7 (7.8%) | 0 (0.0%) |
| 5:30 AM to 5:59 AM | 0 (0.0%) | 0 (0.0%) |
| 6:00 AM to 6:29 AM | 14 (15.6%) | 0 (0.0%) |
| 6:30 AM to 6:59 AM | 10 (11.1%) | 0 (0.0%) |
| 7:00 AM to 7:29 AM | 0 (0.0%) | 6 (16.2%) |
| 7:30 AM to 7:59 AM | 5 (5.6%) | 12 (32.4%) |
| 8:00 AM to 8:29 AM | 12 (13.3%) | 10 (27.0%) |
| 8:30 AM to 8:59 AM | 6 (6.7%) | 0 (0.0%) |
| 9:00 AM to 9:59 AM | 21 (23.3%) | 0 (0.0%) |
| 10:00 AM to 10:59 AM | 6 (6.7%) | 0 (0.0%) |
| 11:00 AM to 11:59 AM | 0 (0.0%) | 0 (0.0%) |
| 12:00 PM to 3:59 PM | 0 (0.0%) | 4 (10.8%) |
| 4:00 PM to 11:59 PM | 9 (10.0%) | 5 (13.5%) |
| Total | 90 (100.0%) | 37 (100.0%) |
Housing Occupancy in Clam Gulch
Occupancy by Ownership in Clam Gulch
Of the total 97 dwellings in Clam Gulch, owner-occupied units account for 92 (94.9%), while renter-occupied units make up 5 (5.1%).
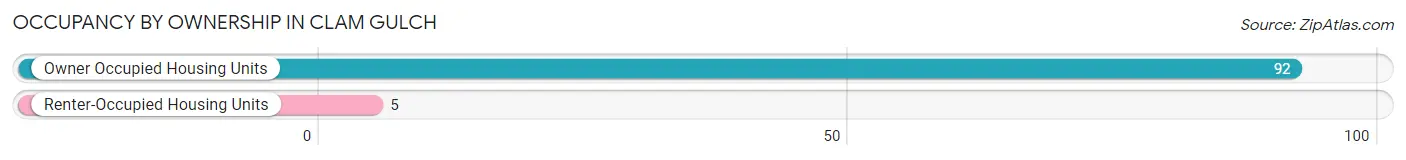
| Occupancy | # Housing Units | % Housing Units |
| Owner Occupied Housing Units | 92 | 94.9% |
| Renter-Occupied Housing Units | 5 | 5.1% |
| Total Occupied Housing Units | 97 | 100.0% |
Occupancy by Household Size in Clam Gulch
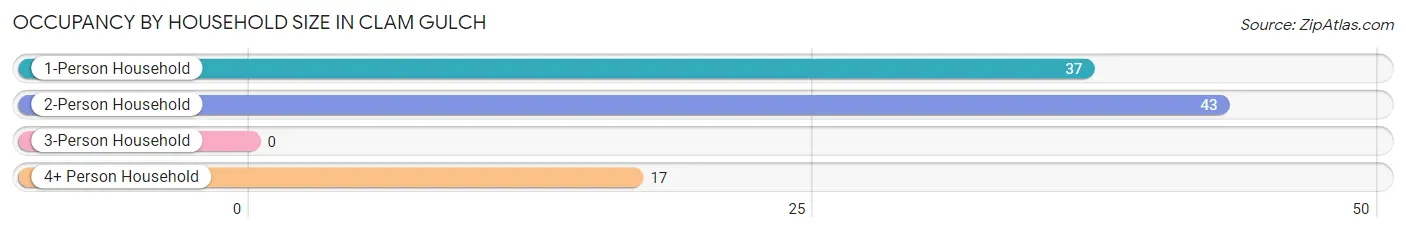
| Household Size | # Housing Units | % Housing Units |
| 1-Person Household | 37 | 38.1% |
| 2-Person Household | 43 | 44.3% |
| 3-Person Household | 0 | 0.0% |
| 4+ Person Household | 17 | 17.5% |
| Total Housing Units | 97 | 100.0% |
Occupancy by Ownership by Household Size in Clam Gulch
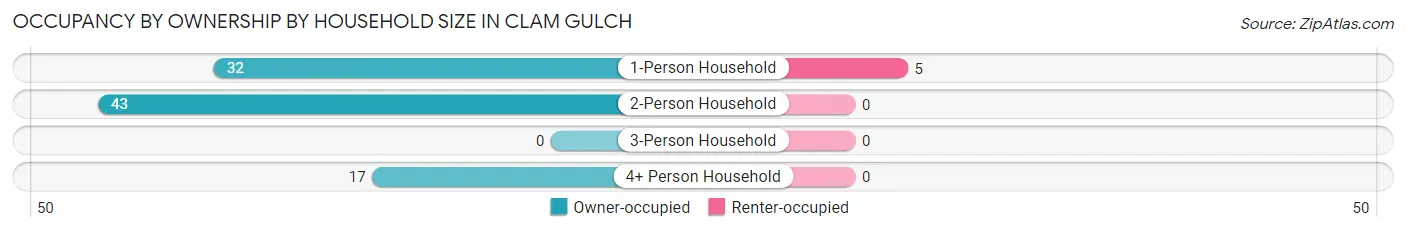
| Household Size | Owner-occupied | Renter-occupied |
| 1-Person Household | 32 (86.5%) | 5 (13.5%) |
| 2-Person Household | 43 (100.0%) | 0 (0.0%) |
| 3-Person Household | 0 (0.0%) | 0 (0.0%) |
| 4+ Person Household | 17 (100.0%) | 0 (0.0%) |
| Total Housing Units | 92 (94.9%) | 5 (5.1%) |
Occupancy by Educational Attainment in Clam Gulch
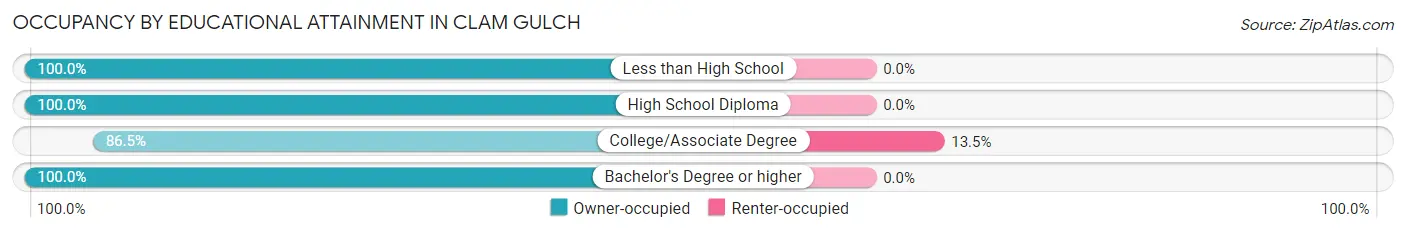
| Household Size | Owner-occupied | Renter-occupied |
| Less than High School | 5 (100.0%) | 0 (0.0%) |
| High School Diploma | 24 (100.0%) | 0 (0.0%) |
| College/Associate Degree | 32 (86.5%) | 5 (13.5%) |
| Bachelor's Degree or higher | 31 (100.0%) | 0 (0.0%) |
Occupancy by Age of Householder in Clam Gulch
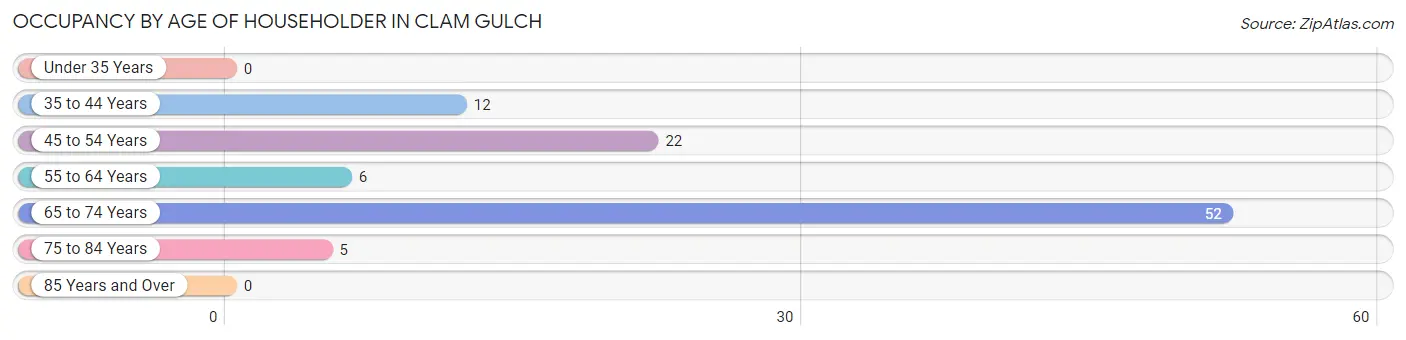
| Age Bracket | # Households | % Households |
| Under 35 Years | 0 | 0.0% |
| 35 to 44 Years | 12 | 12.4% |
| 45 to 54 Years | 22 | 22.7% |
| 55 to 64 Years | 6 | 6.2% |
| 65 to 74 Years | 52 | 53.6% |
| 75 to 84 Years | 5 | 5.1% |
| 85 Years and Over | 0 | 0.0% |
| Total | 97 | 100.0% |
Housing Finances in Clam Gulch
Median Income by Occupancy in Clam Gulch
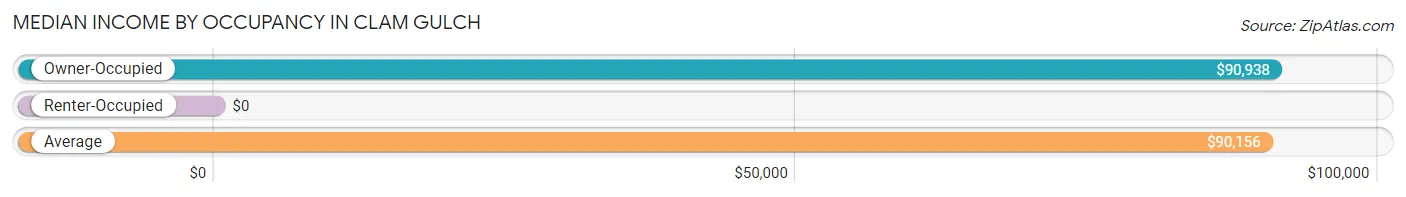
| Occupancy Type | # Households | Median Income |
| Owner-Occupied | 92 (94.9%) | $90,938 |
| Renter-Occupied | 5 (5.1%) | $0 |
| Average | 97 (100.0%) | $90,156 |
Occupancy by Householder Income Bracket in Clam Gulch
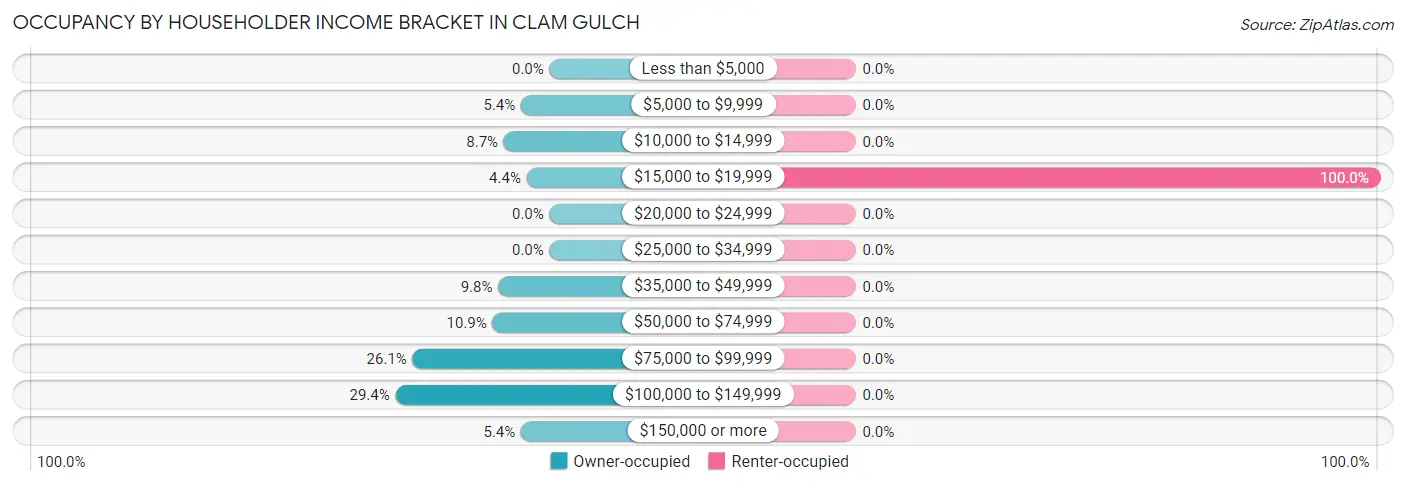
| Income Bracket | Owner-occupied | Renter-occupied |
| Less than $5,000 | 0 (0.0%) | 0 (0.0%) |
| $5,000 to $9,999 | 5 (5.4%) | 0 (0.0%) |
| $10,000 to $14,999 | 8 (8.7%) | 0 (0.0%) |
| $15,000 to $19,999 | 4 (4.3%) | 5 (100.0%) |
| $20,000 to $24,999 | 0 (0.0%) | 0 (0.0%) |
| $25,000 to $34,999 | 0 (0.0%) | 0 (0.0%) |
| $35,000 to $49,999 | 9 (9.8%) | 0 (0.0%) |
| $50,000 to $74,999 | 10 (10.9%) | 0 (0.0%) |
| $75,000 to $99,999 | 24 (26.1%) | 0 (0.0%) |
| $100,000 to $149,999 | 27 (29.3%) | 0 (0.0%) |
| $150,000 or more | 5 (5.4%) | 0 (0.0%) |
| Total | 92 (100.0%) | 5 (100.0%) |
Monthly Housing Cost Tiers in Clam Gulch
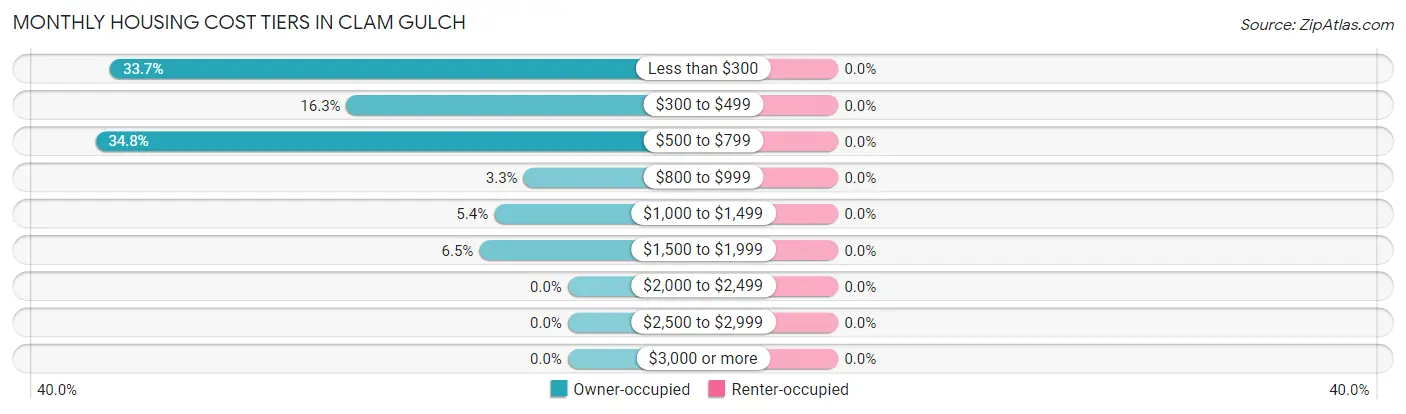
| Monthly Cost | Owner-occupied | Renter-occupied |
| Less than $300 | 31 (33.7%) | 0 (0.0%) |
| $300 to $499 | 15 (16.3%) | 0 (0.0%) |
| $500 to $799 | 32 (34.8%) | 0 (0.0%) |
| $800 to $999 | 3 (3.3%) | 0 (0.0%) |
| $1,000 to $1,499 | 5 (5.4%) | 0 (0.0%) |
| $1,500 to $1,999 | 6 (6.5%) | 0 (0.0%) |
| $2,000 to $2,499 | 0 (0.0%) | 0 (0.0%) |
| $2,500 to $2,999 | 0 (0.0%) | 0 (0.0%) |
| $3,000 or more | 0 (0.0%) | 0 (0.0%) |
| Total | 92 (100.0%) | 5 (100.0%) |
Physical Housing Characteristics in Clam Gulch
Housing Structures in Clam Gulch
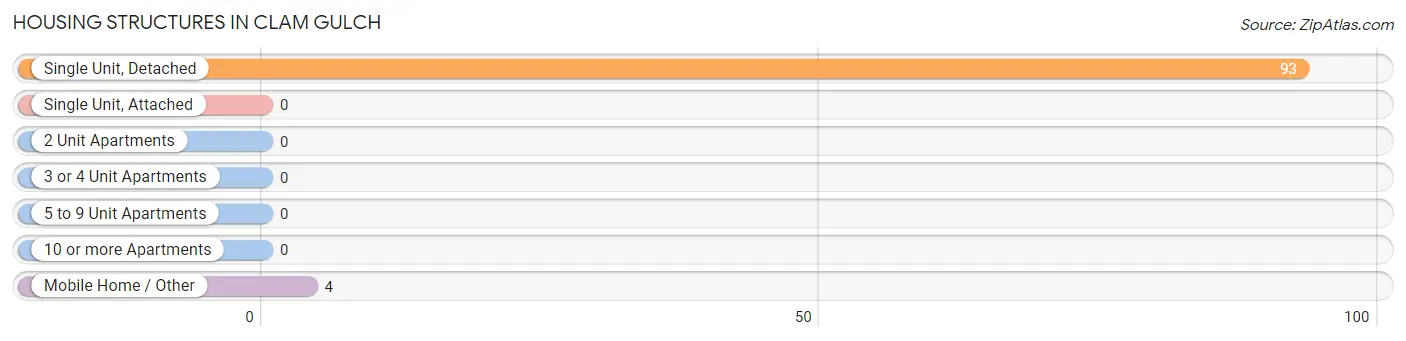
| Structure Type | # Housing Units | % Housing Units |
| Single Unit, Detached | 93 | 95.9% |
| Single Unit, Attached | 0 | 0.0% |
| 2 Unit Apartments | 0 | 0.0% |
| 3 or 4 Unit Apartments | 0 | 0.0% |
| 5 to 9 Unit Apartments | 0 | 0.0% |
| 10 or more Apartments | 0 | 0.0% |
| Mobile Home / Other | 4 | 4.1% |
| Total | 97 | 100.0% |
Housing Structures by Occupancy in Clam Gulch
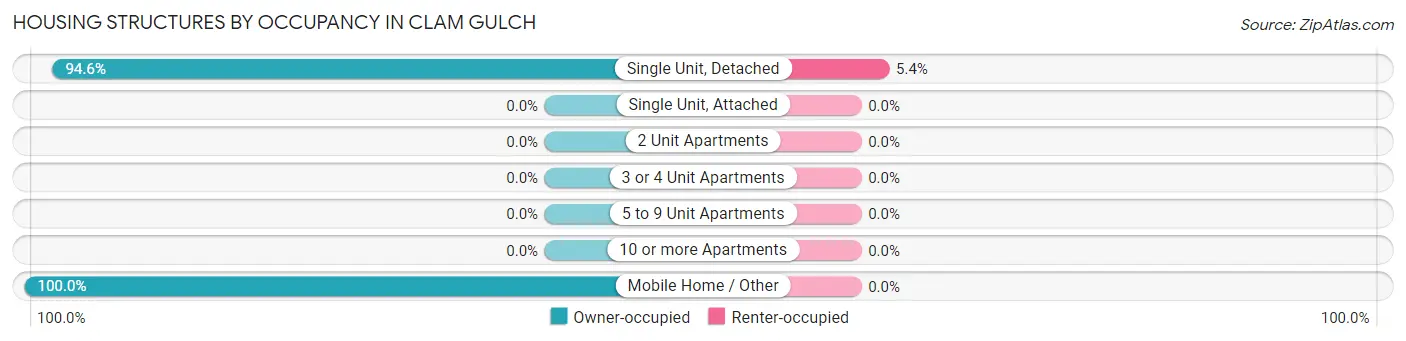
| Structure Type | Owner-occupied | Renter-occupied |
| Single Unit, Detached | 88 (94.6%) | 5 (5.4%) |
| Single Unit, Attached | 0 (0.0%) | 0 (0.0%) |
| 2 Unit Apartments | 0 (0.0%) | 0 (0.0%) |
| 3 or 4 Unit Apartments | 0 (0.0%) | 0 (0.0%) |
| 5 to 9 Unit Apartments | 0 (0.0%) | 0 (0.0%) |
| 10 or more Apartments | 0 (0.0%) | 0 (0.0%) |
| Mobile Home / Other | 4 (100.0%) | 0 (0.0%) |
| Total | 92 (94.9%) | 5 (5.1%) |
Housing Structures by Number of Rooms in Clam Gulch
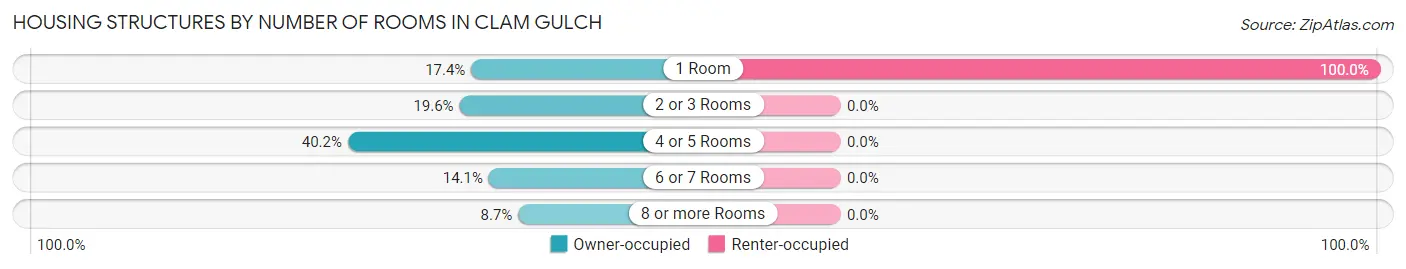
| Number of Rooms | Owner-occupied | Renter-occupied |
| 1 Room | 16 (17.4%) | 5 (100.0%) |
| 2 or 3 Rooms | 18 (19.6%) | 0 (0.0%) |
| 4 or 5 Rooms | 37 (40.2%) | 0 (0.0%) |
| 6 or 7 Rooms | 13 (14.1%) | 0 (0.0%) |
| 8 or more Rooms | 8 (8.7%) | 0 (0.0%) |
| Total | 92 (100.0%) | 5 (100.0%) |
Housing Structure by Heating Type in Clam Gulch
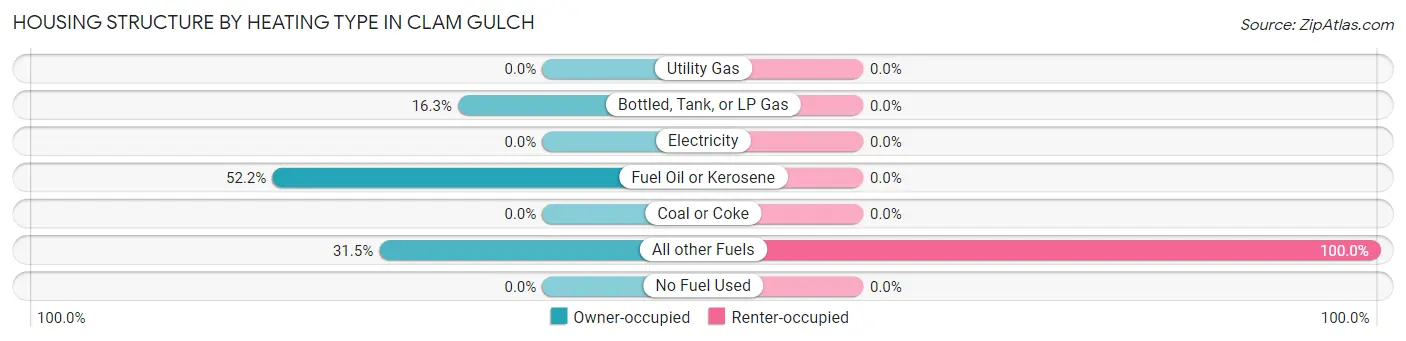
| Heating Type | Owner-occupied | Renter-occupied |
| Utility Gas | 0 (0.0%) | 0 (0.0%) |
| Bottled, Tank, or LP Gas | 15 (16.3%) | 0 (0.0%) |
| Electricity | 0 (0.0%) | 0 (0.0%) |
| Fuel Oil or Kerosene | 48 (52.2%) | 0 (0.0%) |
| Coal or Coke | 0 (0.0%) | 0 (0.0%) |
| All other Fuels | 29 (31.5%) | 5 (100.0%) |
| No Fuel Used | 0 (0.0%) | 0 (0.0%) |
| Total | 92 (100.0%) | 5 (100.0%) |
Household Vehicle Usage in Clam Gulch
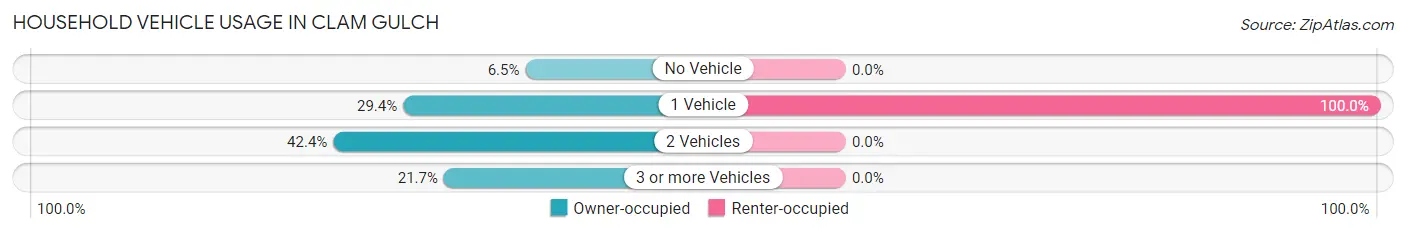
| Vehicles per Household | Owner-occupied | Renter-occupied |
| No Vehicle | 6 (6.5%) | 0 (0.0%) |
| 1 Vehicle | 27 (29.3%) | 5 (100.0%) |
| 2 Vehicles | 39 (42.4%) | 0 (0.0%) |
| 3 or more Vehicles | 20 (21.7%) | 0 (0.0%) |
| Total | 92 (100.0%) | 5 (100.0%) |
Real Estate & Mortgages in Clam Gulch
Real Estate and Mortgage Overview in Clam Gulch
| Characteristic | Without Mortgage | With Mortgage |
| Housing Units | 68 | 24 |
| Median Property Value | $166,700 | $320,000 |
| Median Household Income | $90,000 | $0 |
| Monthly Housing Costs | $400 | $0 |
| Real Estate Taxes | - | - |
Property Value by Mortgage Status in Clam Gulch
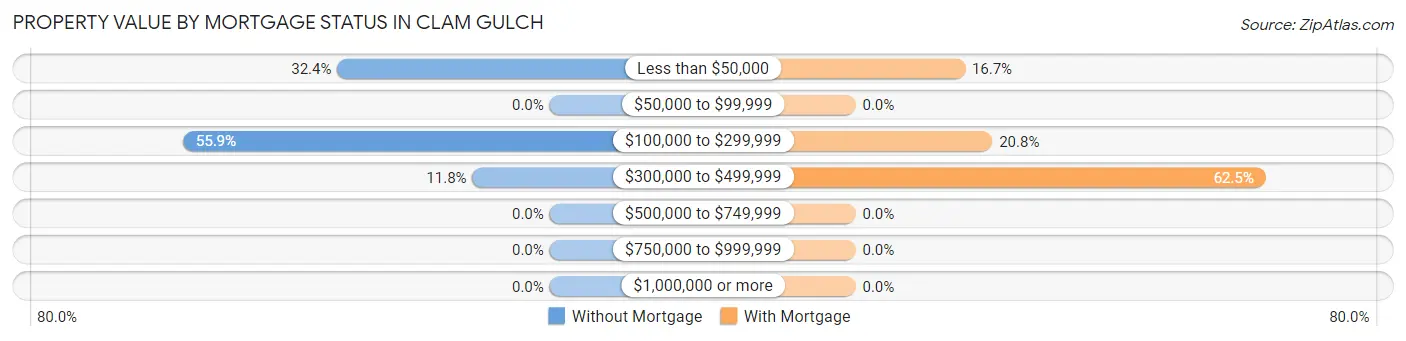
| Property Value | Without Mortgage | With Mortgage |
| Less than $50,000 | 22 (32.4%) | 4 (16.7%) |
| $50,000 to $99,999 | 0 (0.0%) | 0 (0.0%) |
| $100,000 to $299,999 | 38 (55.9%) | 5 (20.8%) |
| $300,000 to $499,999 | 8 (11.8%) | 15 (62.5%) |
| $500,000 to $749,999 | 0 (0.0%) | 0 (0.0%) |
| $750,000 to $999,999 | 0 (0.0%) | 0 (0.0%) |
| $1,000,000 or more | 0 (0.0%) | 0 (0.0%) |
| Total | 68 (100.0%) | 24 (100.0%) |
Household Income by Mortgage Status in Clam Gulch
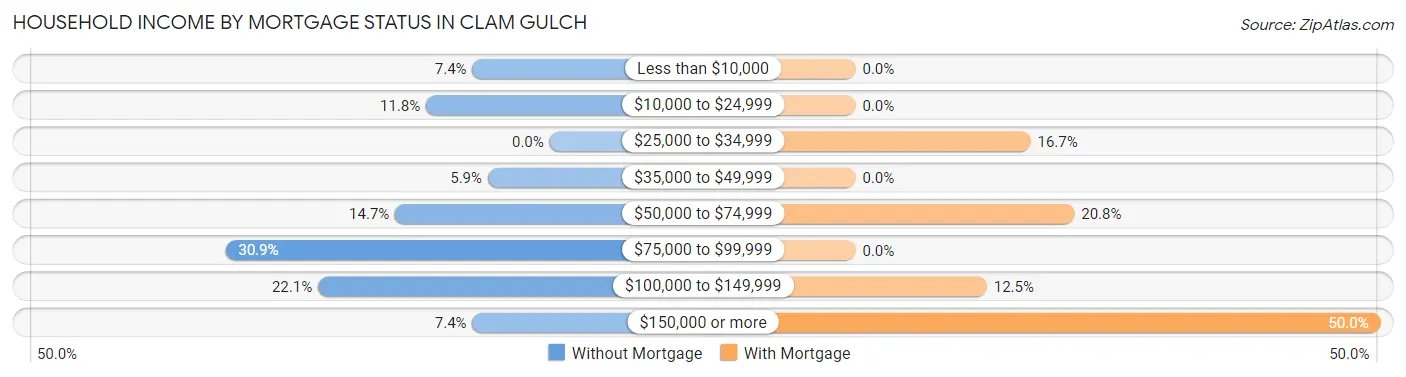
| Household Income | Without Mortgage | With Mortgage |
| Less than $10,000 | 5 (7.3%) | 0 (0.0%) |
| $10,000 to $24,999 | 8 (11.8%) | 0 (0.0%) |
| $25,000 to $34,999 | 0 (0.0%) | 4 (16.7%) |
| $35,000 to $49,999 | 4 (5.9%) | 0 (0.0%) |
| $50,000 to $74,999 | 10 (14.7%) | 5 (20.8%) |
| $75,000 to $99,999 | 21 (30.9%) | 0 (0.0%) |
| $100,000 to $149,999 | 15 (22.1%) | 3 (12.5%) |
| $150,000 or more | 5 (7.3%) | 12 (50.0%) |
| Total | 68 (100.0%) | 24 (100.0%) |
Property Value to Household Income Ratio in Clam Gulch
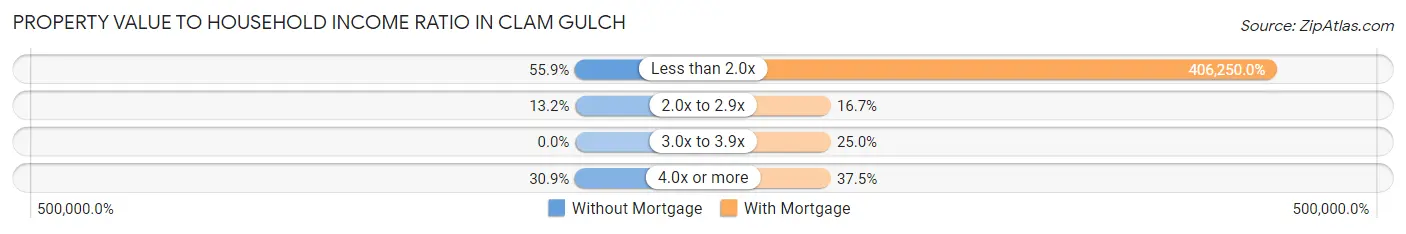
| Value-to-Income Ratio | Without Mortgage | With Mortgage |
| Less than 2.0x | 38 (55.9%) | 97,500 (406,250.0%) |
| 2.0x to 2.9x | 9 (13.2%) | 4 (16.7%) |
| 3.0x to 3.9x | 0 (0.0%) | 6 (25.0%) |
| 4.0x or more | 21 (30.9%) | 9 (37.5%) |
| Total | 68 (100.0%) | 24 (100.0%) |
Real Estate Taxes by Mortgage Status in Clam Gulch
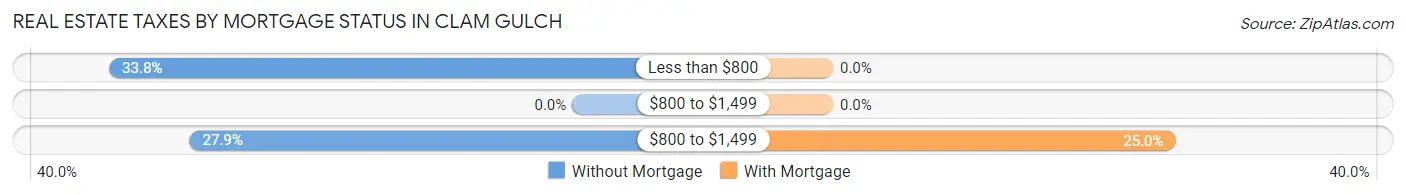
| Property Taxes | Without Mortgage | With Mortgage |
| Less than $800 | 23 (33.8%) | 0 (0.0%) |
| $800 to $1,499 | 0 (0.0%) | 0 (0.0%) |
| $800 to $1,499 | 19 (27.9%) | 6 (25.0%) |
| Total | 68 (100.0%) | 24 (100.0%) |
Health & Disability in Clam Gulch
Health Insurance Coverage by Age in Clam Gulch
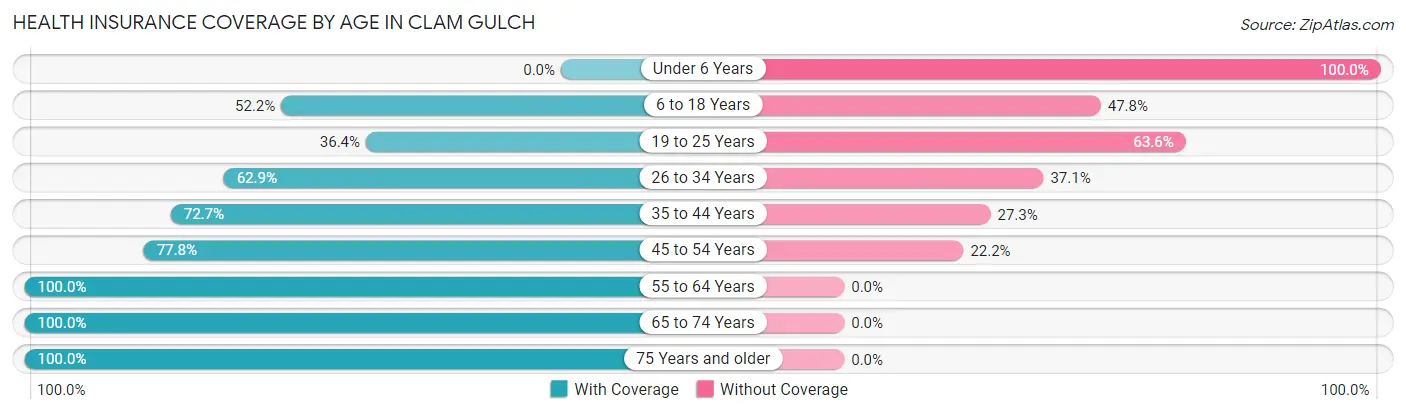
| Age Bracket | With Coverage | Without Coverage |
| Under 6 Years | 0 (0.0%) | 17 (100.0%) |
| 6 to 18 Years | 12 (52.2%) | 11 (47.8%) |
| 19 to 25 Years | 16 (36.4%) | 28 (63.6%) |
| 26 to 34 Years | 22 (62.9%) | 13 (37.1%) |
| 35 to 44 Years | 24 (72.7%) | 9 (27.3%) |
| 45 to 54 Years | 28 (77.8%) | 8 (22.2%) |
| 55 to 64 Years | 19 (100.0%) | 0 (0.0%) |
| 65 to 74 Years | 60 (100.0%) | 0 (0.0%) |
| 75 Years and older | 12 (100.0%) | 0 (0.0%) |
| Total | 193 (69.2%) | 86 (30.8%) |
Health Insurance Coverage by Citizenship Status in Clam Gulch
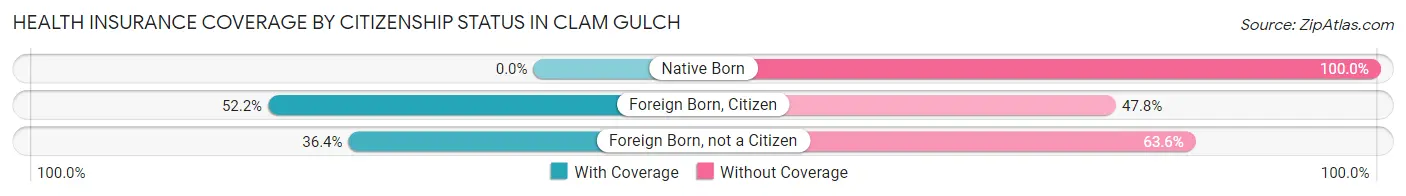
| Citizenship Status | With Coverage | Without Coverage |
| Native Born | 0 (0.0%) | 17 (100.0%) |
| Foreign Born, Citizen | 12 (52.2%) | 11 (47.8%) |
| Foreign Born, not a Citizen | 16 (36.4%) | 28 (63.6%) |
Health Insurance Coverage by Household Income in Clam Gulch
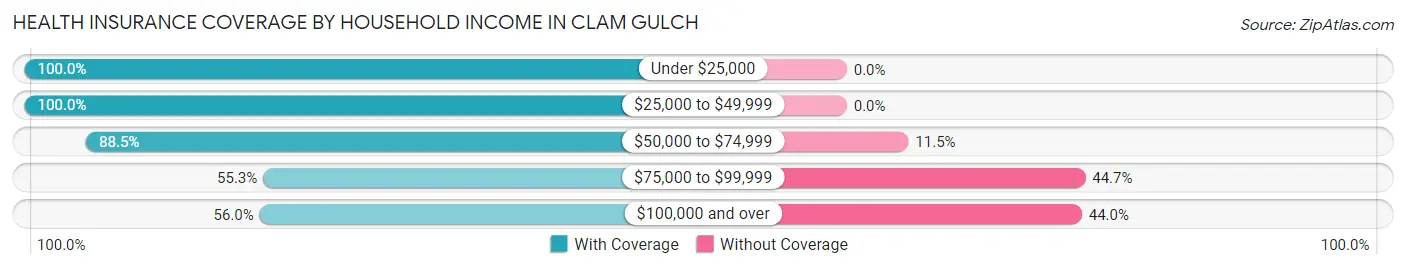
| Household Income | With Coverage | Without Coverage |
| Under $25,000 | 25 (100.0%) | 0 (0.0%) |
| $25,000 to $49,999 | 21 (100.0%) | 0 (0.0%) |
| $50,000 to $74,999 | 46 (88.5%) | 6 (11.5%) |
| $75,000 to $99,999 | 26 (55.3%) | 21 (44.7%) |
| $100,000 and over | 75 (56.0%) | 59 (44.0%) |
Public vs Private Health Insurance Coverage by Age in Clam Gulch
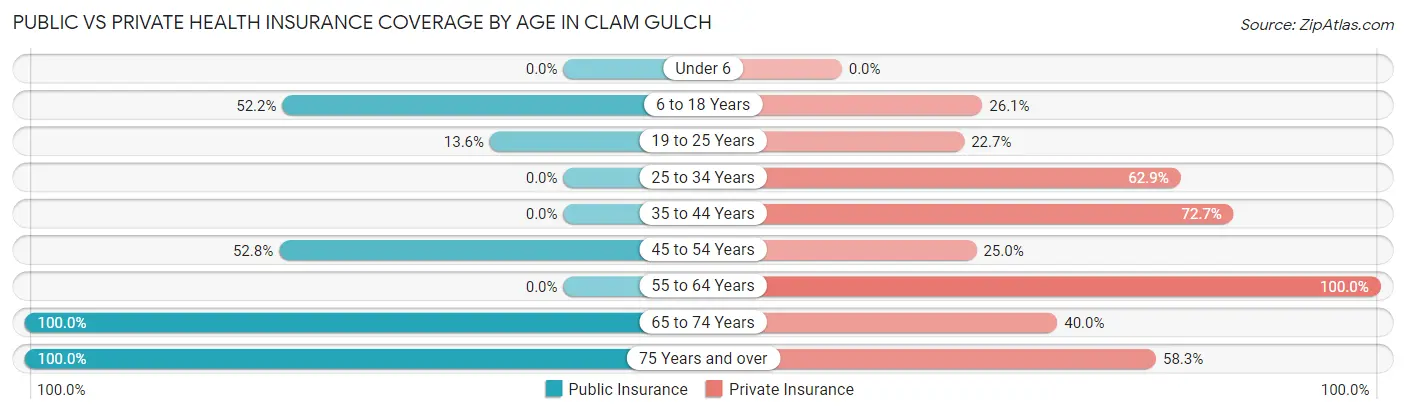
| Age Bracket | Public Insurance | Private Insurance |
| Under 6 | 0 (0.0%) | 0 (0.0%) |
| 6 to 18 Years | 12 (52.2%) | 6 (26.1%) |
| 19 to 25 Years | 6 (13.6%) | 10 (22.7%) |
| 25 to 34 Years | 0 (0.0%) | 22 (62.9%) |
| 35 to 44 Years | 0 (0.0%) | 24 (72.7%) |
| 45 to 54 Years | 19 (52.8%) | 9 (25.0%) |
| 55 to 64 Years | 0 (0.0%) | 19 (100.0%) |
| 65 to 74 Years | 60 (100.0%) | 24 (40.0%) |
| 75 Years and over | 12 (100.0%) | 7 (58.3%) |
| Total | 109 (39.1%) | 121 (43.4%) |
Disability Status by Sex by Age in Clam Gulch
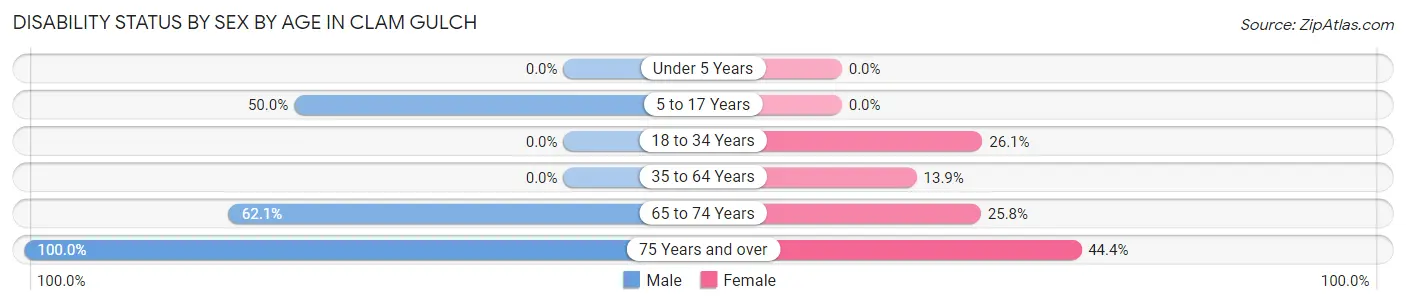
| Age Bracket | Male | Female |
| Under 5 Years | 0 (0.0%) | 0 (0.0%) |
| 5 to 17 Years | 6 (50.0%) | 0 (0.0%) |
| 18 to 34 Years | 0 (0.0%) | 6 (26.1%) |
| 35 to 64 Years | 0 (0.0%) | 5 (13.9%) |
| 65 to 74 Years | 18 (62.1%) | 8 (25.8%) |
| 75 Years and over | 3 (100.0%) | 4 (44.4%) |
Disability Class by Sex by Age in Clam Gulch
Disability Class: Hearing Difficulty
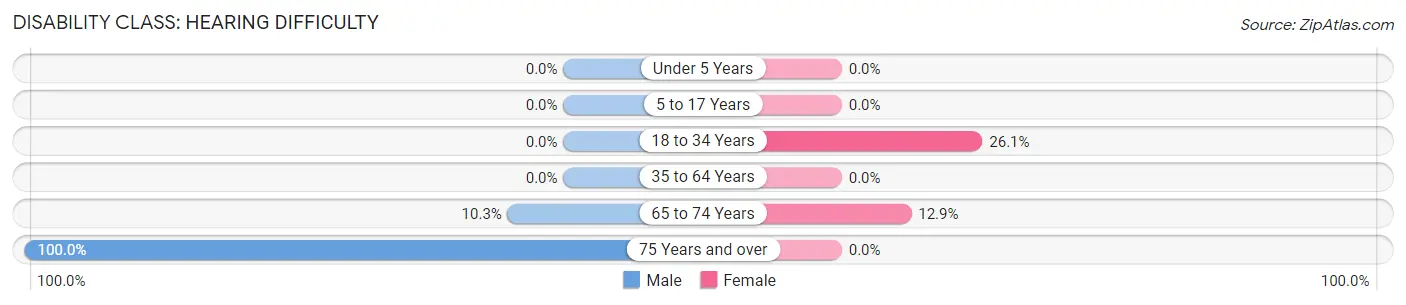
| Age Bracket | Male | Female |
| Under 5 Years | 0 (0.0%) | 0 (0.0%) |
| 5 to 17 Years | 0 (0.0%) | 0 (0.0%) |
| 18 to 34 Years | 0 (0.0%) | 6 (26.1%) |
| 35 to 64 Years | 0 (0.0%) | 0 (0.0%) |
| 65 to 74 Years | 3 (10.3%) | 4 (12.9%) |
| 75 Years and over | 3 (100.0%) | 0 (0.0%) |
Disability Class: Vision Difficulty
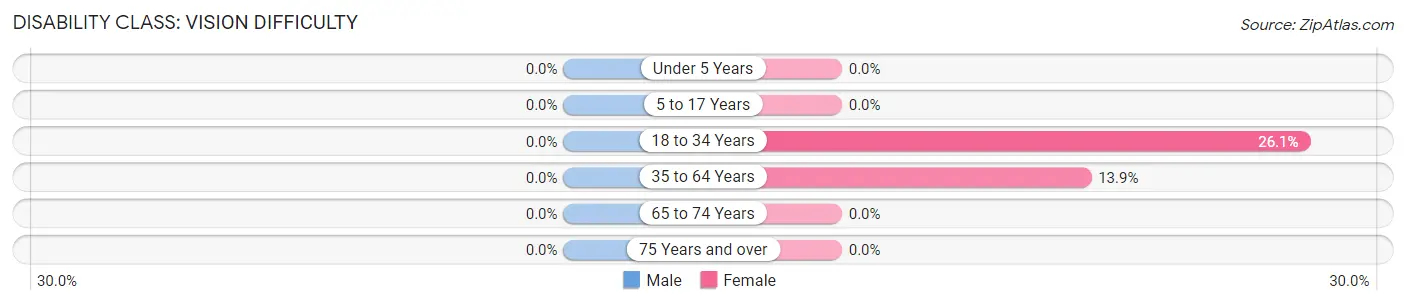
| Age Bracket | Male | Female |
| Under 5 Years | 0 (0.0%) | 0 (0.0%) |
| 5 to 17 Years | 0 (0.0%) | 0 (0.0%) |
| 18 to 34 Years | 0 (0.0%) | 6 (26.1%) |
| 35 to 64 Years | 0 (0.0%) | 5 (13.9%) |
| 65 to 74 Years | 0 (0.0%) | 0 (0.0%) |
| 75 Years and over | 0 (0.0%) | 0 (0.0%) |
Disability Class: Cognitive Difficulty
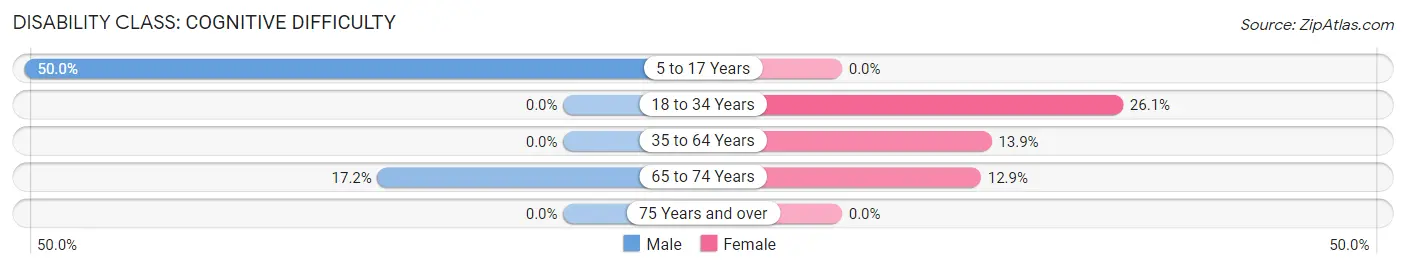
| Age Bracket | Male | Female |
| 5 to 17 Years | 6 (50.0%) | 0 (0.0%) |
| 18 to 34 Years | 0 (0.0%) | 6 (26.1%) |
| 35 to 64 Years | 0 (0.0%) | 5 (13.9%) |
| 65 to 74 Years | 5 (17.2%) | 4 (12.9%) |
| 75 Years and over | 0 (0.0%) | 0 (0.0%) |
Disability Class: Ambulatory Difficulty
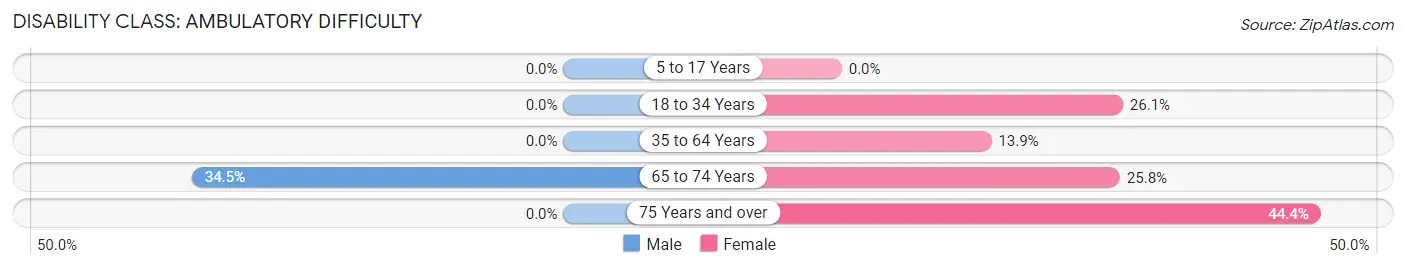
| Age Bracket | Male | Female |
| 5 to 17 Years | 0 (0.0%) | 0 (0.0%) |
| 18 to 34 Years | 0 (0.0%) | 6 (26.1%) |
| 35 to 64 Years | 0 (0.0%) | 5 (13.9%) |
| 65 to 74 Years | 10 (34.5%) | 8 (25.8%) |
| 75 Years and over | 0 (0.0%) | 4 (44.4%) |
Disability Class: Self-Care Difficulty
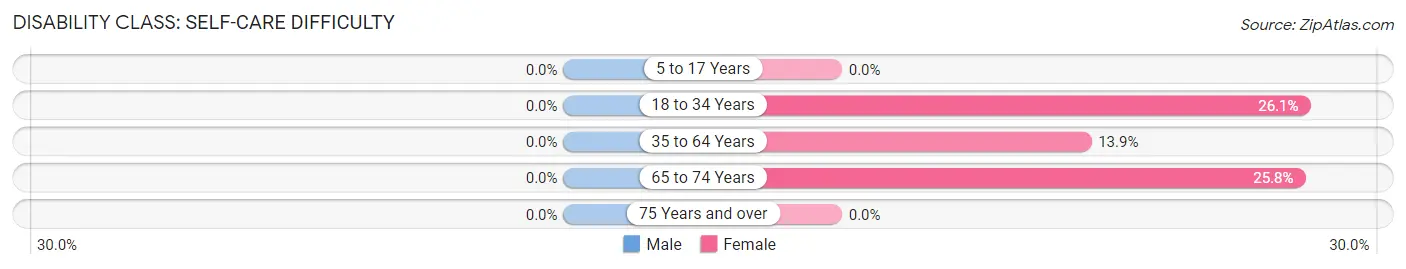
| Age Bracket | Male | Female |
| 5 to 17 Years | 0 (0.0%) | 0 (0.0%) |
| 18 to 34 Years | 0 (0.0%) | 6 (26.1%) |
| 35 to 64 Years | 0 (0.0%) | 5 (13.9%) |
| 65 to 74 Years | 0 (0.0%) | 8 (25.8%) |
| 75 Years and over | 0 (0.0%) | 0 (0.0%) |
Technology Access in Clam Gulch
Computing Device Access in Clam Gulch
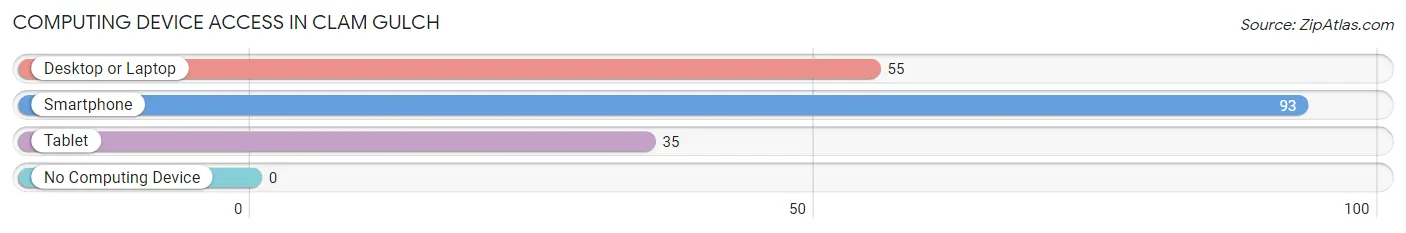
| Device Type | # Households | % Households |
| Desktop or Laptop | 55 | 56.7% |
| Smartphone | 93 | 95.9% |
| Tablet | 35 | 36.1% |
| No Computing Device | 0 | 0.0% |
| Total | 97 | 100.0% |
Internet Access in Clam Gulch
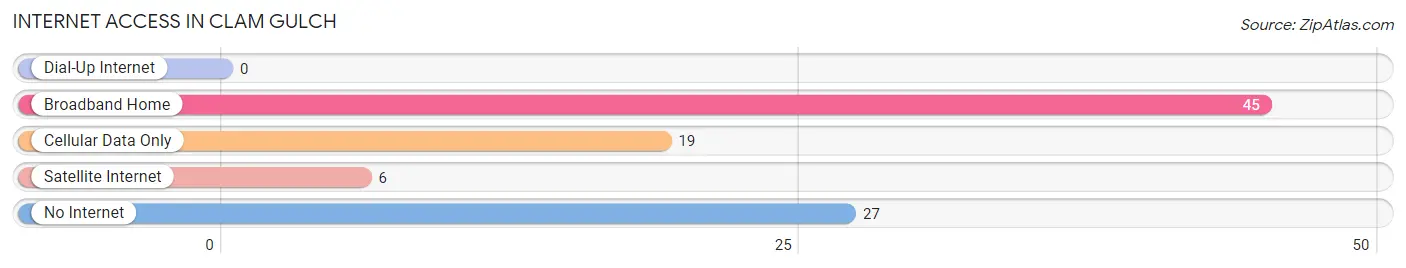
| Internet Type | # Households | % Households |
| Dial-Up Internet | 0 | 0.0% |
| Broadband Home | 45 | 46.4% |
| Cellular Data Only | 19 | 19.6% |
| Satellite Internet | 6 | 6.2% |
| No Internet | 27 | 27.8% |
| Total | 97 | 100.0% |
Clam Gulch Summary
Clam Gulch is a small unincorporated community located in the Kenai Peninsula Borough of Alaska. It is situated on the west side of the Kenai Peninsula, approximately 40 miles southwest of the city of Kenai. The community is located on the shores of Cook Inlet, and is surrounded by the Chugach National Forest. The population of Clam Gulch was estimated to be around 200 people in 2020.
Geography
Clam Gulch is located in the Kenai Peninsula Borough of Alaska, approximately 40 miles southwest of the city of Kenai. The community is situated on the west side of the Kenai Peninsula, on the shores of Cook Inlet. The area is surrounded by the Chugach National Forest, and is home to a variety of wildlife, including moose, bear, and bald eagles. The climate in Clam Gulch is mild, with temperatures ranging from the mid-30s in the winter to the mid-60s in the summer.
History
Clam Gulch was first settled in the late 1800s by a group of fishermen from the nearby village of Ninilchik. The fishermen were attracted to the area due to its abundance of clams, which were a major source of food for the local population. The community was officially established in the early 1900s, and the first post office was established in 1910.
Economy
The economy of Clam Gulch is largely based on fishing and tourism. The area is home to a variety of commercial fishing operations, including salmon, halibut, and crab. The community is also a popular destination for sport fishing, and is home to several charter fishing companies. In addition, the area is home to several small businesses, including a general store, a gas station, and a restaurant.
Demographics
The population of Clam Gulch was estimated to be around 200 people in 2020. The majority of the population is of white descent, with a small percentage of Native American and Hispanic residents. The median household income in Clam Gulch is approximately $50,000, and the median home value is around $200,000.
Conclusion
Clam Gulch is a small unincorporated community located in the Kenai Peninsula Borough of Alaska. The community is situated on the west side of the Kenai Peninsula, on the shores of Cook Inlet, and is surrounded by the Chugach National Forest. The economy of Clam Gulch is largely based on fishing and tourism, and the population of the community was estimated to be around 200 people in 2020. The majority of the population is of white descent, with a small percentage of Native American and Hispanic residents.
Common Questions
What is Per Capita Income in Clam Gulch?
Per Capita income in Clam Gulch is $32,806.
What is the Median Family Income in Clam Gulch?
Median Family Income in Clam Gulch is $92,917.
What is the Median Household income in Clam Gulch?
Median Household Income in Clam Gulch is $90,156.
What is Income or Wage Gap in Clam Gulch?
Income or Wage Gap in Clam Gulch is 56.3%.
Women in Clam Gulch earn 43.7 cents for every dollar earned by a man.
What is Inequality or Gini Index in Clam Gulch?
Inequality or Gini Index in Clam Gulch is 0.38.
What is the Total Population of Clam Gulch?
Total Population of Clam Gulch is 279.
What is the Total Male Population of Clam Gulch?
Total Male Population of Clam Gulch is 158.
What is the Total Female Population of Clam Gulch?
Total Female Population of Clam Gulch is 121.
What is the Ratio of Males per 100 Females in Clam Gulch?
There are 130.58 Males per 100 Females in Clam Gulch.
What is the Ratio of Females per 100 Males in Clam Gulch?
There are 76.58 Females per 100 Males in Clam Gulch.
What is the Median Population Age in Clam Gulch?
Median Population Age in Clam Gulch is 42.1 Years.
What is the Average Family Size in Clam Gulch
Average Family Size in Clam Gulch is 4.3 People.
What is the Average Household Size in Clam Gulch
Average Household Size in Clam Gulch is 2.9 People.
How Large is the Labor Force in Clam Gulch?
There are 147 People in the Labor Forcein in Clam Gulch.
What is the Percentage of People in the Labor Force in Clam Gulch?
60.0% of People are in the Labor Force in Clam Gulch.
What is the Unemployment Rate in Clam Gulch?
Unemployment Rate in Clam Gulch is 13.6%.