Chitina, AK Map & Demographics
Chitina Map
Chitina Overview
$26,383
PER CAPITA INCOME
0.64
INEQUALITY / GINI INDEX
71
TOTAL POPULATION
46
MALE POPULATION
25
FEMALE POPULATION
184.00
MALES / 100 FEMALES
54.35
FEMALES / 100 MALES
46.5
MEDIAN AGE
2.5
AVG FAMILY SIZE
1.6
AVG HOUSEHOLD SIZE
19
LABOR FORCE [ PEOPLE ]
35.8%
PERCENT IN LABOR FORCE
Chitina Zip Codes
Chitina Area Codes
Income in Chitina
Income Overview in Chitina
| Characteristic | Number | Measure |
| Per Capita Income | 71 | $26,383 |
| Median Family Income | 15 | $0 |
| Mean Family Income | 15 | $55,840 |
| Median Household Income | 45 | $0 |
| Mean Household Income | 45 | $52,853 |
| Income Deficit | 15 | $0 |
| Wage / Income Gap (%) | 71 | 0.00% |
| Wage / Income Gap ($) | 71 | 100.00¢ per $1 |
| Gini / Inequality Index | 71 | 0.64 |
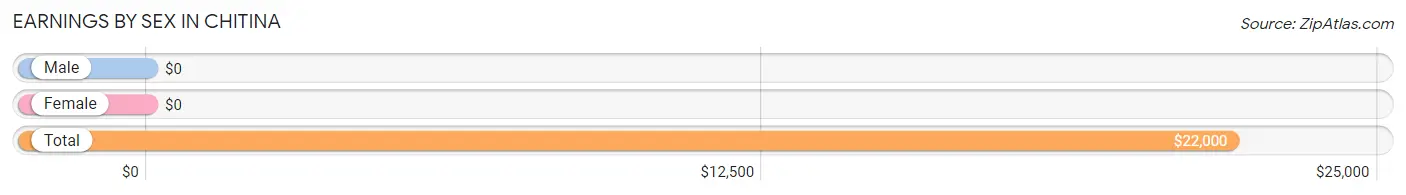
Earnings by Sex in Chitina
| Sex | Number | Average Earnings |
| Male | 27 (79.4%) | $0 |
| Female | 7 (20.6%) | $0 |
| Total | 34 (100.0%) | $22,000 |
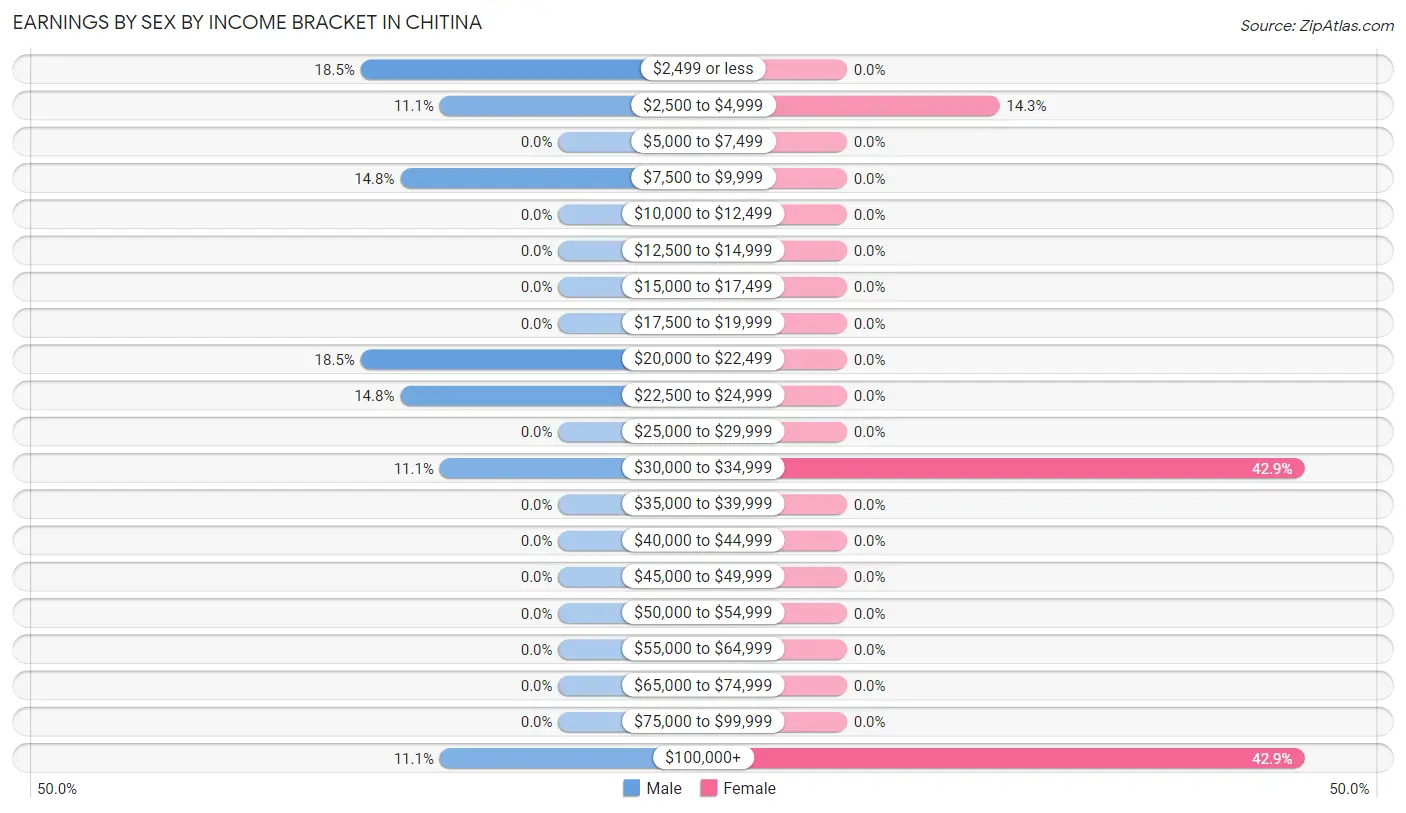
Earnings by Sex by Income Bracket in Chitina
The most common earnings brackets in Chitina are $2,499 or less for men (5 | 18.5%) and $30,000 to $34,999 for women (3 | 42.9%).
| Income | Male | Female |
| $2,499 or less | 5 (18.5%) | 0 (0.0%) |
| $2,500 to $4,999 | 3 (11.1%) | 1 (14.3%) |
| $5,000 to $7,499 | 0 (0.0%) | 0 (0.0%) |
| $7,500 to $9,999 | 4 (14.8%) | 0 (0.0%) |
| $10,000 to $12,499 | 0 (0.0%) | 0 (0.0%) |
| $12,500 to $14,999 | 0 (0.0%) | 0 (0.0%) |
| $15,000 to $17,499 | 0 (0.0%) | 0 (0.0%) |
| $17,500 to $19,999 | 0 (0.0%) | 0 (0.0%) |
| $20,000 to $22,499 | 5 (18.5%) | 0 (0.0%) |
| $22,500 to $24,999 | 4 (14.8%) | 0 (0.0%) |
| $25,000 to $29,999 | 0 (0.0%) | 0 (0.0%) |
| $30,000 to $34,999 | 3 (11.1%) | 3 (42.9%) |
| $35,000 to $39,999 | 0 (0.0%) | 0 (0.0%) |
| $40,000 to $44,999 | 0 (0.0%) | 0 (0.0%) |
| $45,000 to $49,999 | 0 (0.0%) | 0 (0.0%) |
| $50,000 to $54,999 | 0 (0.0%) | 0 (0.0%) |
| $55,000 to $64,999 | 0 (0.0%) | 0 (0.0%) |
| $65,000 to $74,999 | 0 (0.0%) | 0 (0.0%) |
| $75,000 to $99,999 | 0 (0.0%) | 0 (0.0%) |
| $100,000+ | 3 (11.1%) | 3 (42.9%) |
| Total | 27 (100.0%) | 7 (100.0%) |
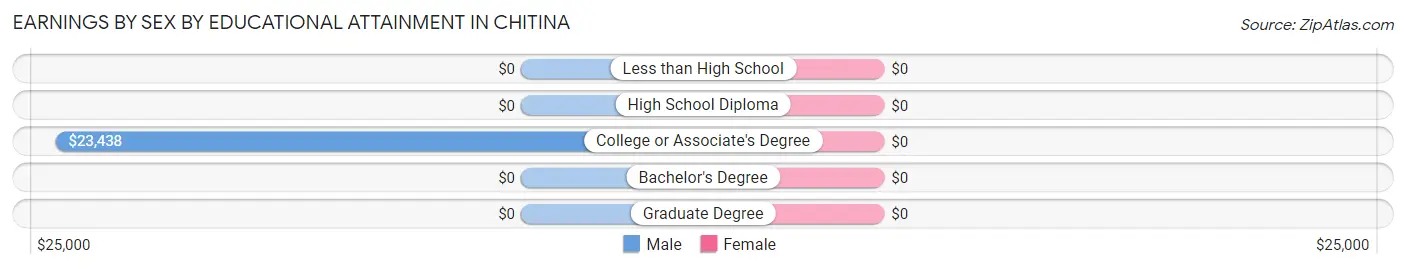
Earnings by Sex by Educational Attainment in Chitina
| Educational Attainment | Male Income | Female Income |
| Less than High School | - | - |
| High School Diploma | - | - |
| College or Associate's Degree | $23,438 | $0 |
| Bachelor's Degree | - | - |
| Graduate Degree | - | - |
| Total | - | - |
Family Income in Chitina
Family Income Brackets in Chitina
According to the Chitina family income data, there are 8 families falling into the $100,000 to $149,999 income range, which is the most common income bracket and makes up 53.3% of all families.
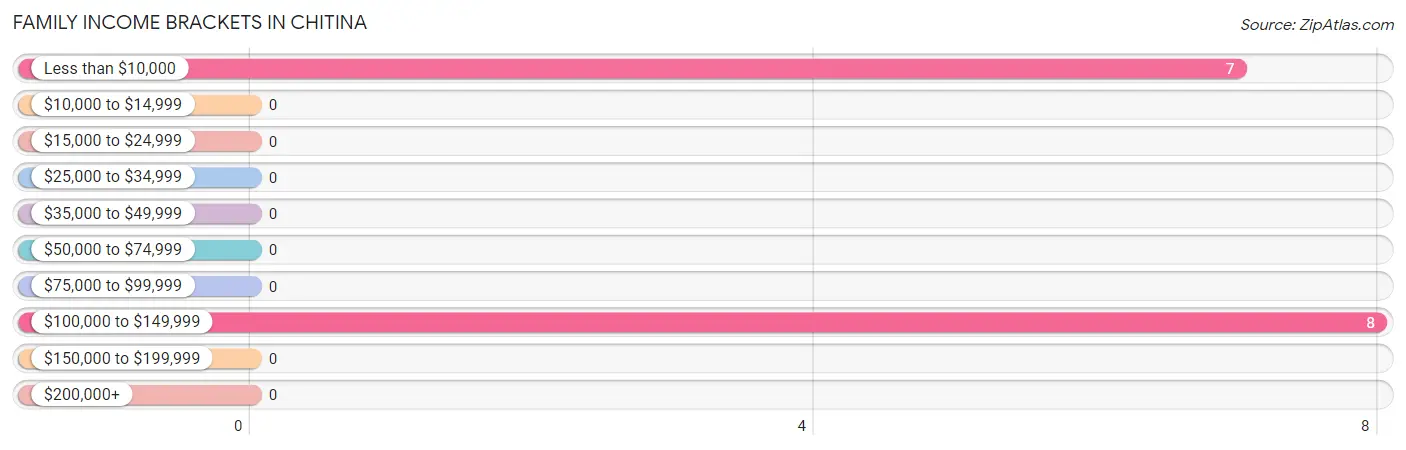
| Income Bracket | # Families | % Families |
| Less than $10,000 | 7 | 46.7% |
| $10,000 to $14,999 | 0 | 0.0% |
| $15,000 to $24,999 | 0 | 0.0% |
| $25,000 to $34,999 | 0 | 0.0% |
| $35,000 to $49,999 | 0 | 0.0% |
| $50,000 to $74,999 | 0 | 0.0% |
| $75,000 to $99,999 | 0 | 0.0% |
| $100,000 to $149,999 | 8 | 53.3% |
| $150,000 to $199,999 | 0 | 0.0% |
| $200,000+ | 0 | 0.0% |
Family Income by Famaliy Size in Chitina
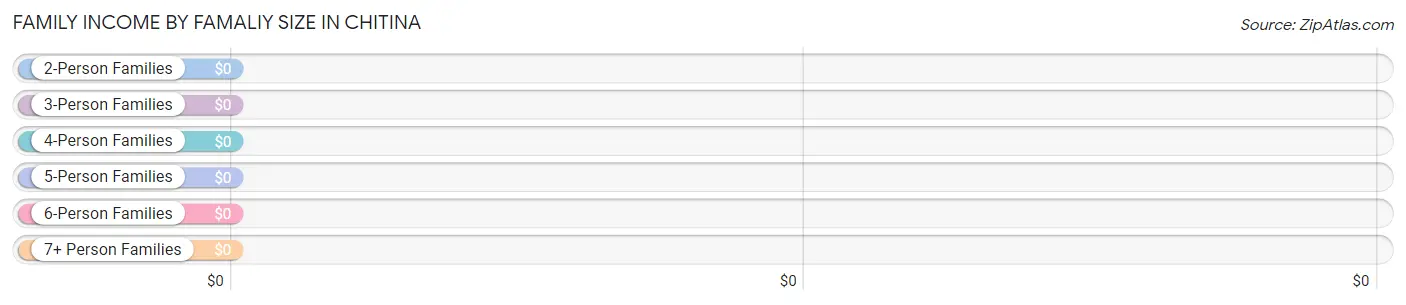
| Income Bracket | # Families | Median Income |
| 2-Person Families | 1 (6.7%) | $0 |
| 3-Person Families | 14 (93.3%) | $0 |
| 4-Person Families | 0 (0.0%) | $0 |
| 5-Person Families | 0 (0.0%) | $0 |
| 6-Person Families | 0 (0.0%) | $0 |
| 7+ Person Families | 0 (0.0%) | $0 |
| Total | 15 (100.0%) | $0 |
Family Income by Number of Earners in Chitina
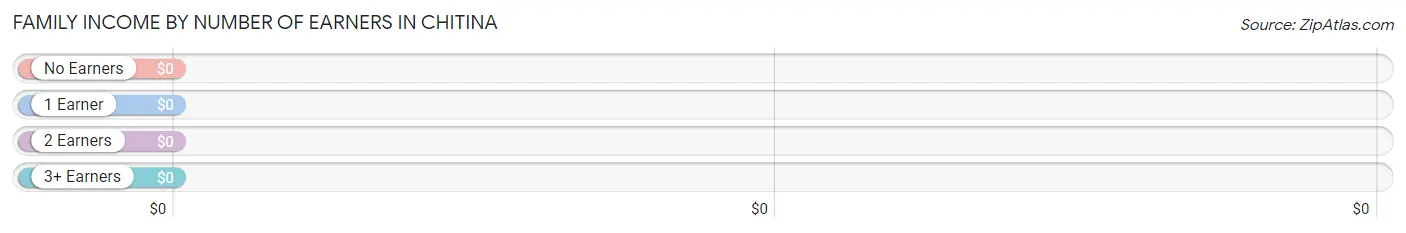
| Number of Earners | # Families | Median Income |
| No Earners | 6 (40.0%) | $0 |
| 1 Earner | 9 (60.0%) | $0 |
| 2 Earners | 0 (0.0%) | $0 |
| 3+ Earners | 0 (0.0%) | $0 |
| Total | 15 (100.0%) | $0 |
Household Income in Chitina
Household Income Brackets in Chitina
With 18 households falling in the category, the less than $10,000 income range is the most frequent in Chitina, accounting for 40.0% of all households.
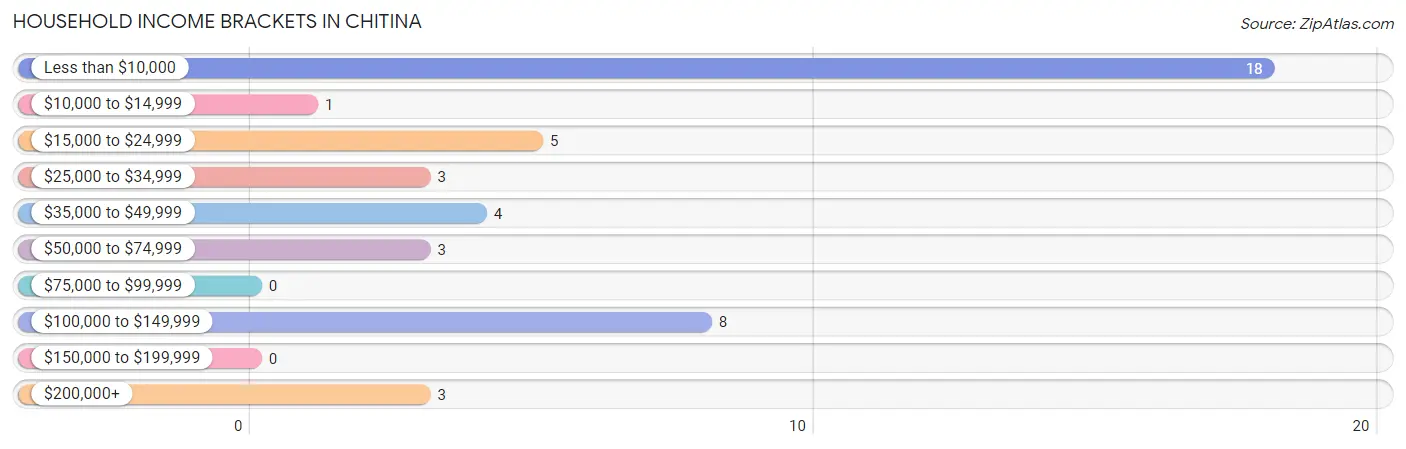
| Income Bracket | # Households | % Households |
| Less than $10,000 | 18 | 40.0% |
| $10,000 to $14,999 | 1 | 2.2% |
| $15,000 to $24,999 | 5 | 11.1% |
| $25,000 to $34,999 | 3 | 6.7% |
| $35,000 to $49,999 | 4 | 8.9% |
| $50,000 to $74,999 | 3 | 6.7% |
| $75,000 to $99,999 | 0 | 0.0% |
| $100,000 to $149,999 | 8 | 17.8% |
| $150,000 to $199,999 | 0 | 0.0% |
| $200,000+ | 3 | 6.7% |
Household Income by Householder Age in Chitina
| Income Bracket | # Households | Median Income |
| 15 to 24 Years | 6 (13.3%) | $0 |
| 25 to 44 Years | 3 (6.7%) | $0 |
| 45 to 64 Years | 26 (57.8%) | $0 |
| 65+ Years | 10 (22.2%) | $0 |
| Total | 45 (100.0%) | $0 |
Poverty in Chitina
Income Below Poverty by Sex and Age in Chitina
With 50.0% poverty level for males and 60.0% for females among the residents of Chitina, under 5 year old males and under 5 year old females are the most vulnerable to poverty, with 7 males (100.0%) and 7 females (100.0%) in their respective age groups living below the poverty level.
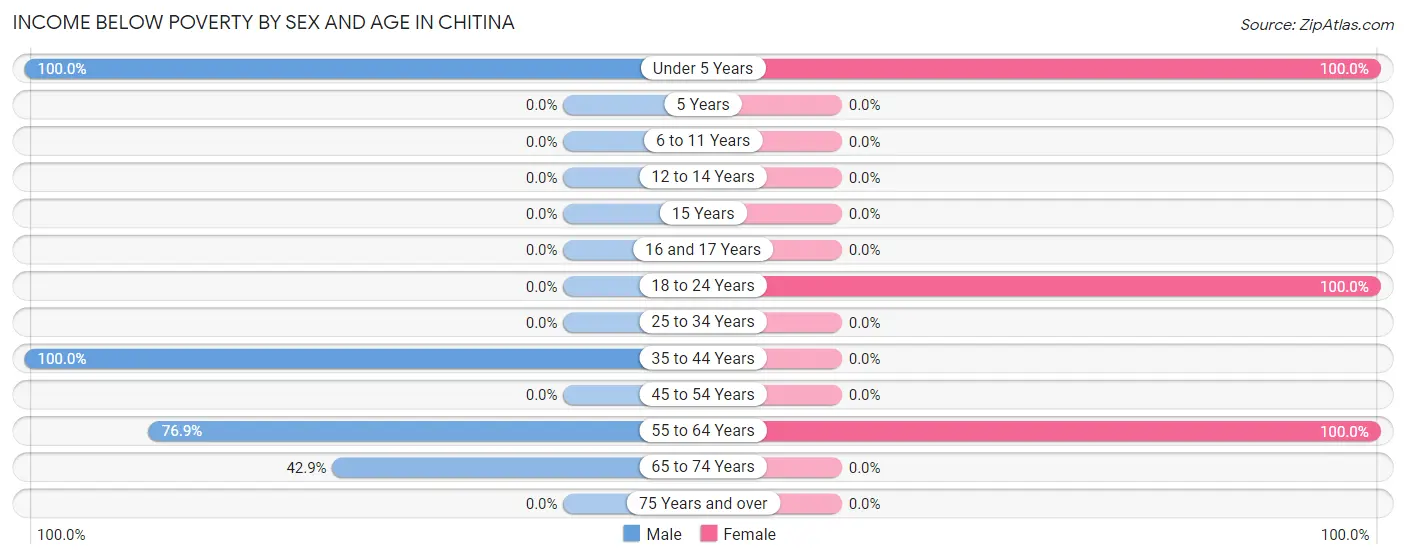
| Age Bracket | Male | Female |
| Under 5 Years | 7 (100.0%) | 7 (100.0%) |
| 5 Years | 0 (0.0%) | 0 (0.0%) |
| 6 to 11 Years | 0 (0.0%) | 0 (0.0%) |
| 12 to 14 Years | 0 (0.0%) | 0 (0.0%) |
| 15 Years | 0 (0.0%) | 0 (0.0%) |
| 16 and 17 Years | 0 (0.0%) | 0 (0.0%) |
| 18 to 24 Years | 0 (0.0%) | 6 (100.0%) |
| 25 to 34 Years | 0 (0.0%) | 0 (0.0%) |
| 35 to 44 Years | 3 (100.0%) | 0 (0.0%) |
| 45 to 54 Years | 0 (0.0%) | 0 (0.0%) |
| 55 to 64 Years | 10 (76.9%) | 2 (100.0%) |
| 65 to 74 Years | 3 (42.9%) | 0 (0.0%) |
| 75 Years and over | 0 (0.0%) | 0 (0.0%) |
| Total | 23 (50.0%) | 15 (60.0%) |
Income Above Poverty by Sex and Age in Chitina
According to the poverty statistics in Chitina, males aged 45 to 54 years and females aged 15 years are the age groups that are most secure financially, with 100.0% of males and 100.0% of females in these age groups living above the poverty line.
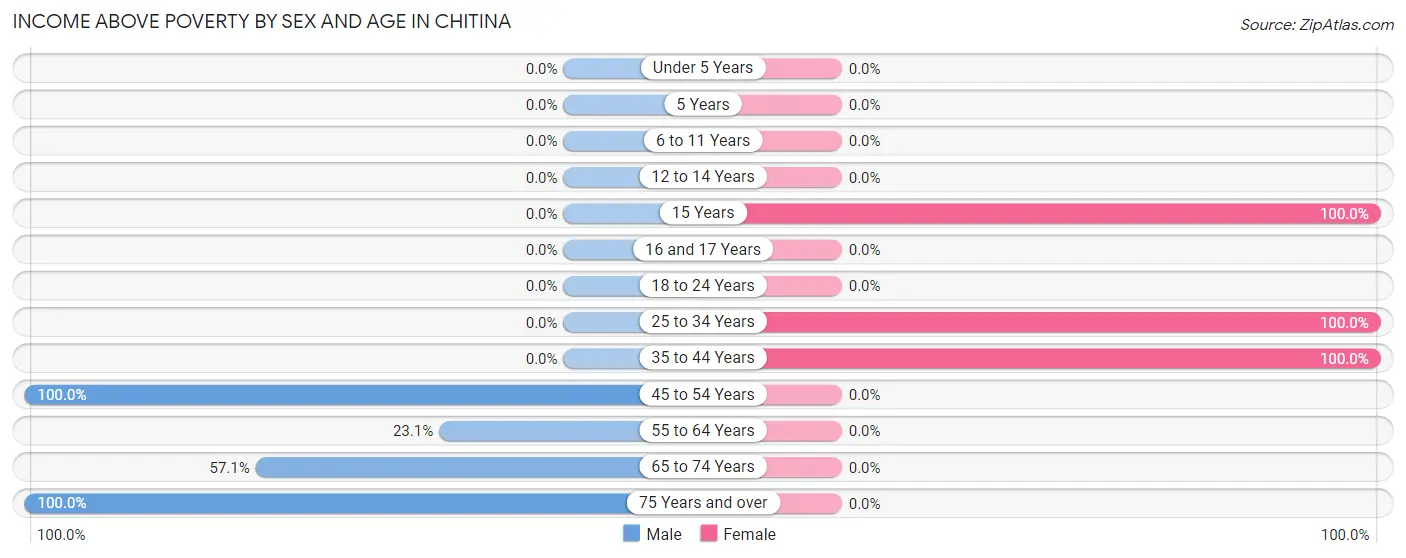
| Age Bracket | Male | Female |
| Under 5 Years | 0 (0.0%) | 0 (0.0%) |
| 5 Years | 0 (0.0%) | 0 (0.0%) |
| 6 to 11 Years | 0 (0.0%) | 0 (0.0%) |
| 12 to 14 Years | 0 (0.0%) | 0 (0.0%) |
| 15 Years | 0 (0.0%) | 4 (100.0%) |
| 16 and 17 Years | 0 (0.0%) | 0 (0.0%) |
| 18 to 24 Years | 0 (0.0%) | 0 (0.0%) |
| 25 to 34 Years | 0 (0.0%) | 3 (100.0%) |
| 35 to 44 Years | 0 (0.0%) | 3 (100.0%) |
| 45 to 54 Years | 13 (100.0%) | 0 (0.0%) |
| 55 to 64 Years | 3 (23.1%) | 0 (0.0%) |
| 65 to 74 Years | 4 (57.1%) | 0 (0.0%) |
| 75 Years and over | 3 (100.0%) | 0 (0.0%) |
| Total | 23 (50.0%) | 10 (40.0%) |
Income Below Poverty Among Married-Couple Families in Chitina
The poverty statistics for married-couple families in Chitina show that 11.1% or 1 of the total 9 families live below the poverty line. Families with no children have the highest poverty rate of 100.0%, comprising of 1 families. On the other hand, families with 1 or 2 children have the lowest poverty rate of 0.0%, which includes 0 families.
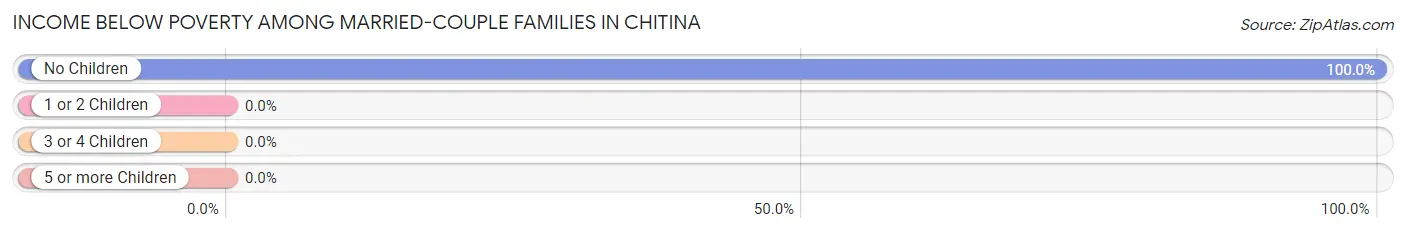
| Children | Above Poverty | Below Poverty |
| No Children | 0 (0.0%) | 1 (100.0%) |
| 1 or 2 Children | 8 (100.0%) | 0 (0.0%) |
| 3 or 4 Children | 0 (0.0%) | 0 (0.0%) |
| 5 or more Children | 0 (0.0%) | 0 (0.0%) |
| Total | 8 (88.9%) | 1 (11.1%) |
Income Below Poverty Among Single-Parent Households in Chitina
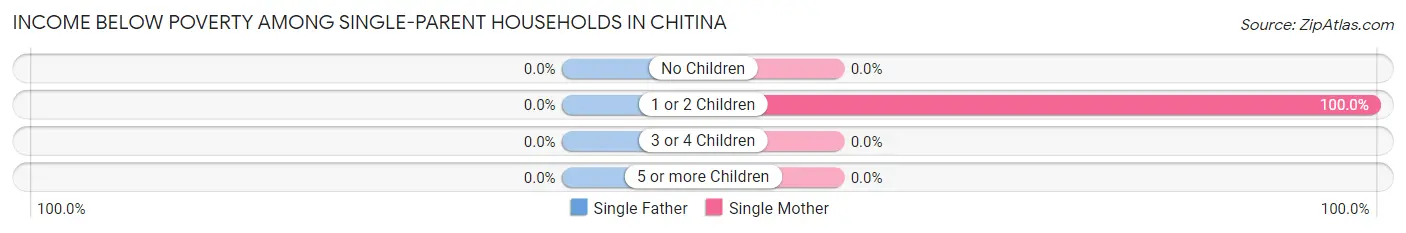
| Children | Single Father | Single Mother |
| No Children | 0 (0.0%) | 0 (0.0%) |
| 1 or 2 Children | 0 (0.0%) | 6 (100.0%) |
| 3 or 4 Children | 0 (0.0%) | 0 (0.0%) |
| 5 or more Children | 0 (0.0%) | 0 (0.0%) |
| Total | 0 (0.0%) | 6 (100.0%) |
Income Below Poverty Among Married-Couple vs Single-Parent Households in Chitina
The poverty data for Chitina shows that 1 of the married-couple family households (11.1%) and 6 of the single-parent households (100.0%) are living below the poverty level. Within the married-couple family households, those with no children have the highest poverty rate, with 1 households (100.0%) falling below the poverty line. Among the single-parent households, those with 1 or 2 children have the highest poverty rate, with 6 household (100.0%) living below poverty.
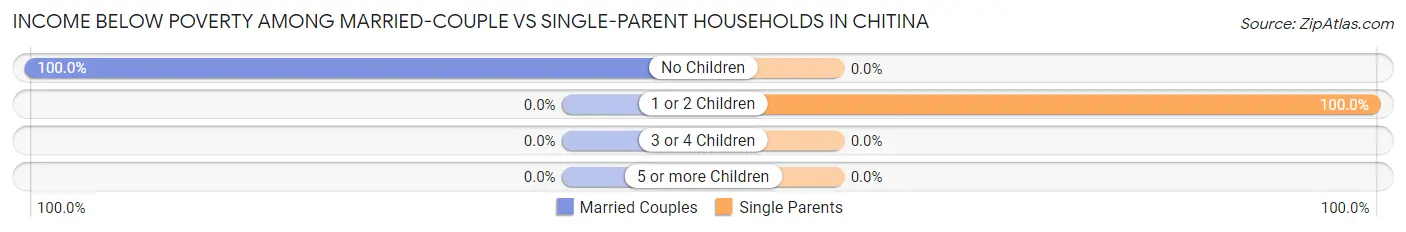
| Children | Married-Couple Families | Single-Parent Households |
| No Children | 1 (100.0%) | 0 (0.0%) |
| 1 or 2 Children | 0 (0.0%) | 6 (100.0%) |
| 3 or 4 Children | 0 (0.0%) | 0 (0.0%) |
| 5 or more Children | 0 (0.0%) | 0 (0.0%) |
| Total | 1 (11.1%) | 6 (100.0%) |
Race in Chitina
The most populous races in Chitina are White / Caucasian (33 | 46.5%), Two or more Races (27 | 38.0%), and Native / Alaskan (11 | 15.5%).
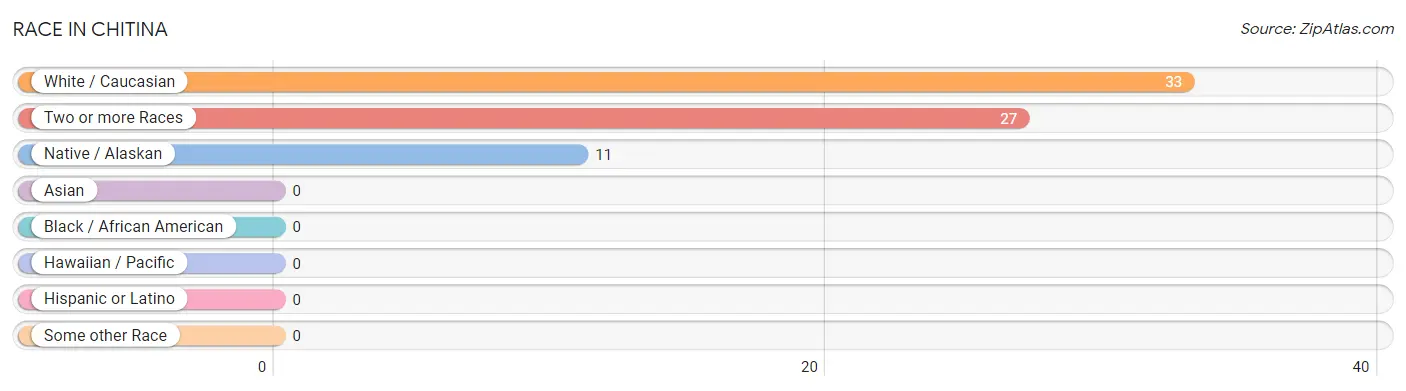
| Race | # Population | % Population |
| Asian | 0 | 0.0% |
| Black / African American | 0 | 0.0% |
| Hawaiian / Pacific | 0 | 0.0% |
| Hispanic or Latino | 0 | 0.0% |
| Native / Alaskan | 11 | 15.5% |
| White / Caucasian | 33 | 46.5% |
| Two or more Races | 27 | 38.0% |
| Some other Race | 0 | 0.0% |
| Total | 71 | 100.0% |
Ancestry in Chitina
The most populous ancestries reported in Chitina are Alaskan Athabascan (28 | 39.4%), German (16 | 22.5%), Cherokee (7 | 9.9%), English (3 | 4.2%), and Irish (3 | 4.2%), together accounting for 80.3% of all Chitina residents.
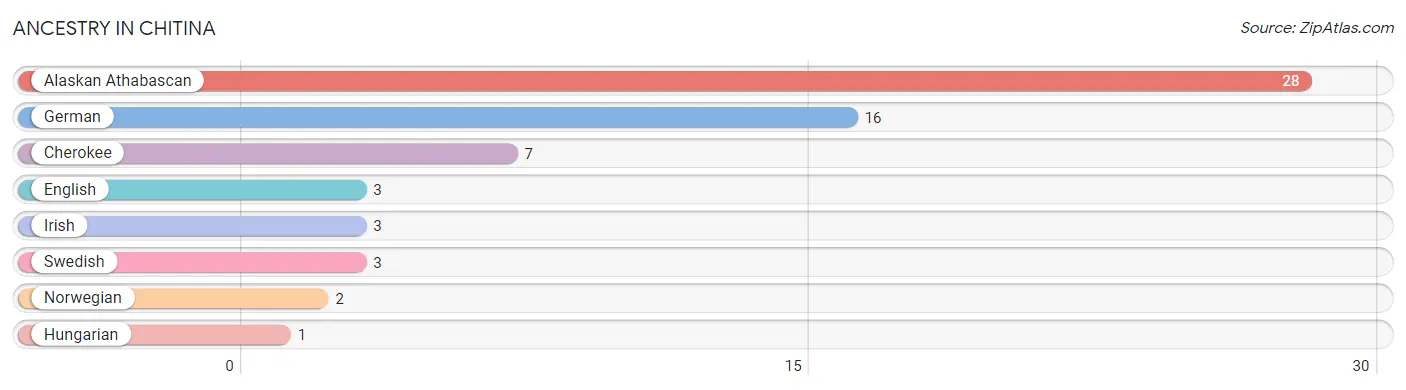
| Ancestry | # Population | % Population |
| Alaskan Athabascan | 28 | 39.4% |
| Cherokee | 7 | 9.9% |
| English | 3 | 4.2% |
| German | 16 | 22.5% |
| Hungarian | 1 | 1.4% |
| Irish | 3 | 4.2% |
| Norwegian | 2 | 2.8% |
| Swedish | 3 | 4.2% | View All 8 Rows |
Immigrants in Chitina

| Immigration Origin | # Population | % Population | View All 0 Rows |
Sex and Age in Chitina
Sex and Age in Chitina
The most populous age groups in Chitina are 45 to 49 Years (13 | 28.3%) for men and Under 5 Years (7 | 28.0%) for women.
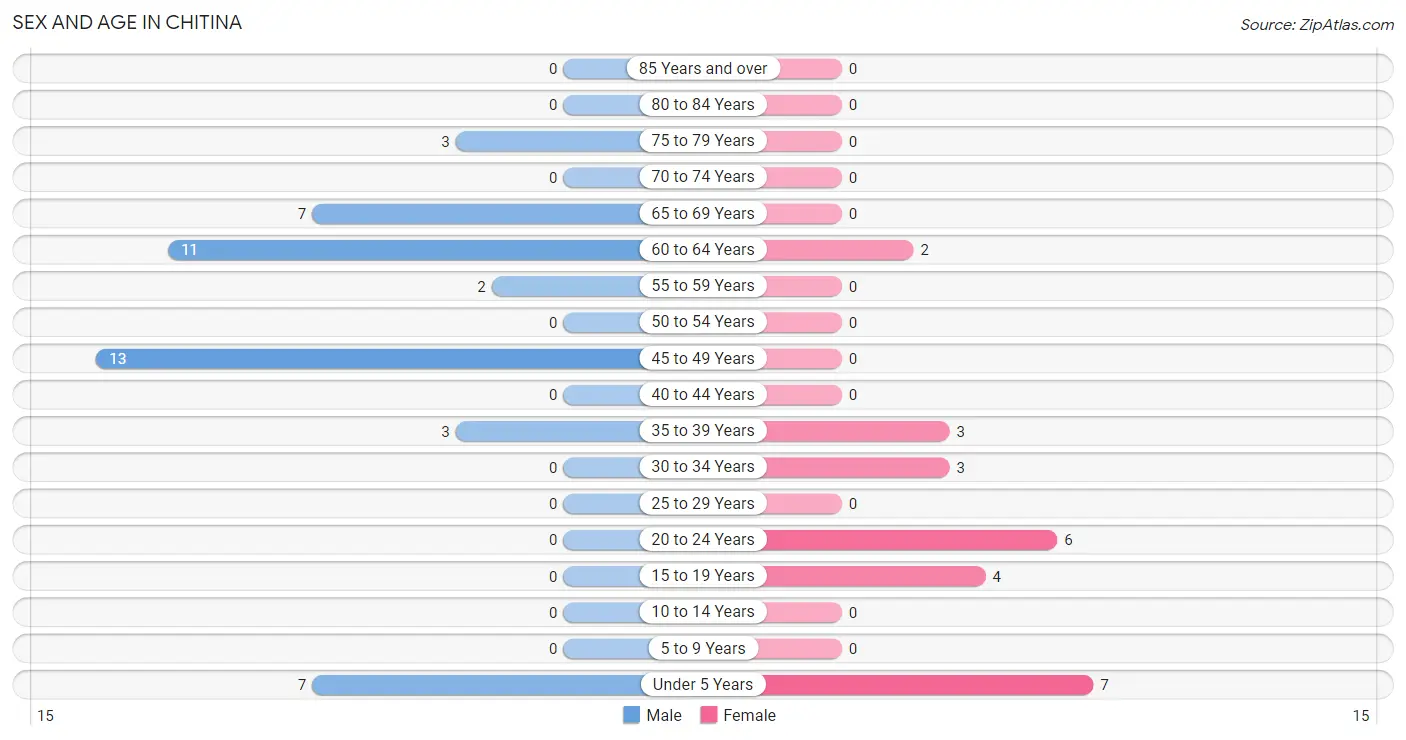
| Age Bracket | Male | Female |
| Under 5 Years | 7 (15.2%) | 7 (28.0%) |
| 5 to 9 Years | 0 (0.0%) | 0 (0.0%) |
| 10 to 14 Years | 0 (0.0%) | 0 (0.0%) |
| 15 to 19 Years | 0 (0.0%) | 4 (16.0%) |
| 20 to 24 Years | 0 (0.0%) | 6 (24.0%) |
| 25 to 29 Years | 0 (0.0%) | 0 (0.0%) |
| 30 to 34 Years | 0 (0.0%) | 3 (12.0%) |
| 35 to 39 Years | 3 (6.5%) | 3 (12.0%) |
| 40 to 44 Years | 0 (0.0%) | 0 (0.0%) |
| 45 to 49 Years | 13 (28.3%) | 0 (0.0%) |
| 50 to 54 Years | 0 (0.0%) | 0 (0.0%) |
| 55 to 59 Years | 2 (4.3%) | 0 (0.0%) |
| 60 to 64 Years | 11 (23.9%) | 2 (8.0%) |
| 65 to 69 Years | 7 (15.2%) | 0 (0.0%) |
| 70 to 74 Years | 0 (0.0%) | 0 (0.0%) |
| 75 to 79 Years | 3 (6.5%) | 0 (0.0%) |
| 80 to 84 Years | 0 (0.0%) | 0 (0.0%) |
| 85 Years and over | 0 (0.0%) | 0 (0.0%) |
| Total | 46 (100.0%) | 25 (100.0%) |
Families and Households in Chitina
Median Family Size in Chitina
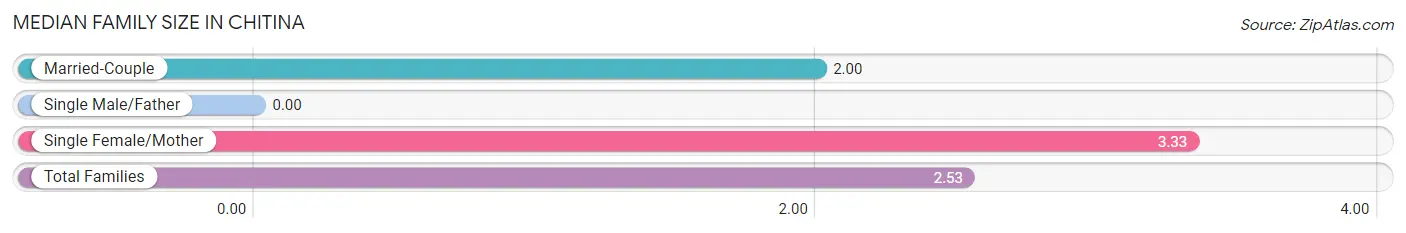
| Family Type | # Families | Family Size |
| Married-Couple | 9 (60.0%) | 2.00 |
| Single Male/Father | 0 (0.0%) | - |
| Single Female/Mother | 6 (40.0%) | 3.33 |
| Total Families | 15 (100.0%) | 2.53 |
Median Household Size in Chitina
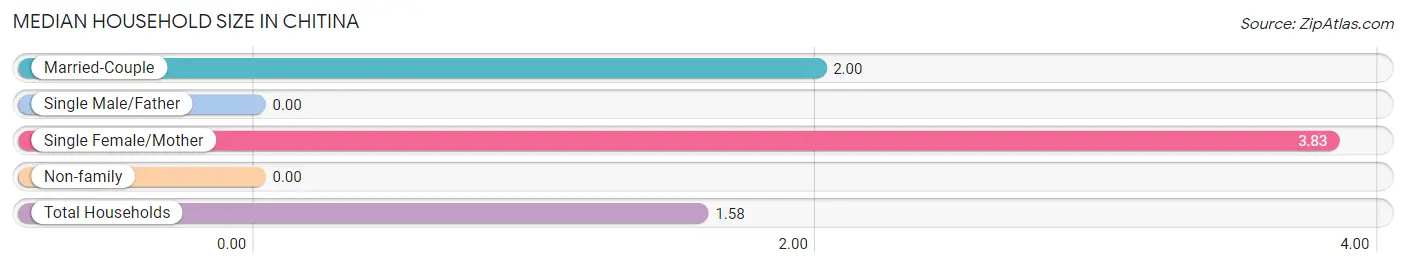
| Household Type | # Households | Household Size |
| Married-Couple | 9 (20.0%) | 2.00 |
| Single Male/Father | 0 (0.0%) | - |
| Single Female/Mother | 6 (13.3%) | 3.83 |
| Non-family | 30 (66.7%) | - |
| Total Households | 45 (100.0%) | 1.58 |
Household Size by Marriage Status in Chitina
Out of a total of 45 households in Chitina, 15 (33.3%) are family households, while 30 (66.7%) are nonfamily households. The most numerous type of family households are 3-person households, comprising 8, and the most common type of nonfamily households are 1-person households, comprising 30.
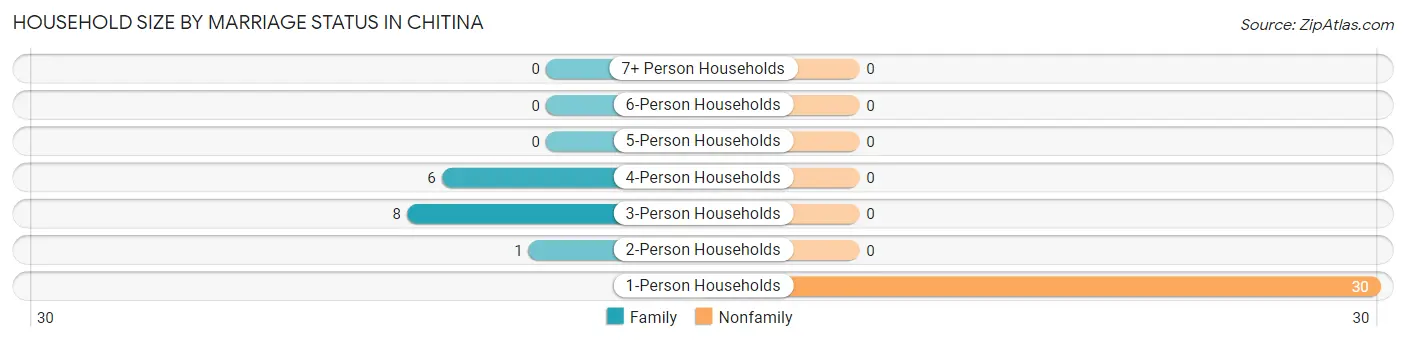
| Household Size | Family Households | Nonfamily Households |
| 1-Person Households | - | 30 (66.7%) |
| 2-Person Households | 1 (2.2%) | 0 (0.0%) |
| 3-Person Households | 8 (17.8%) | 0 (0.0%) |
| 4-Person Households | 6 (13.3%) | 0 (0.0%) |
| 5-Person Households | 0 (0.0%) | 0 (0.0%) |
| 6-Person Households | 0 (0.0%) | 0 (0.0%) |
| 7+ Person Households | 0 (0.0%) | 0 (0.0%) |
| Total | 15 (33.3%) | 30 (66.7%) |
Female Fertility in Chitina
Fertility by Age in Chitina
Average fertility rate in Chitina is 375.0 births per 1,000 women. Women in the age bracket of 20 to 34 years have the highest fertility rate with 667.0 births per 1,000 women. Women in the age bracket of 20 to 34 years acount for 100.0% of all women with births.
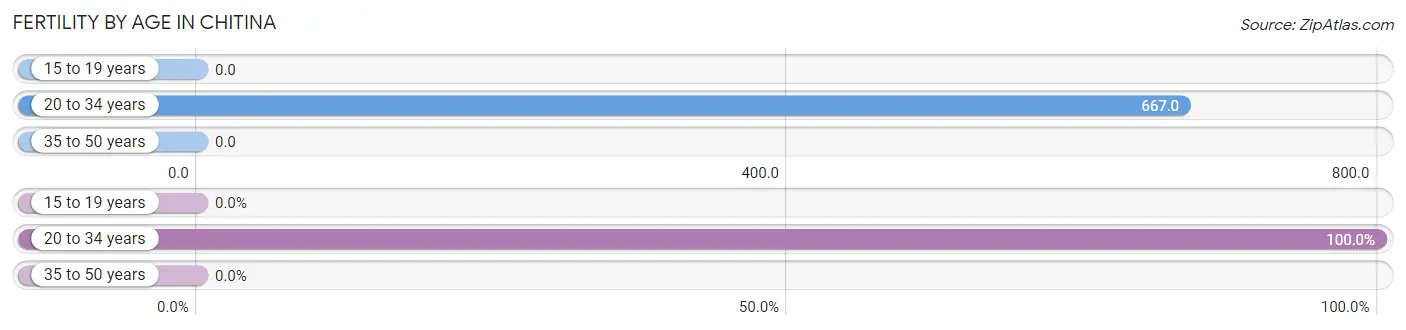
| Age Bracket | Women with Births | Births / 1,000 Women |
| 15 to 19 years | 0 (0.0%) | 0.0 |
| 20 to 34 years | 6 (100.0%) | 667.0 |
| 35 to 50 years | 0 (0.0%) | 0.0 |
| Total | 6 (100.0%) | 375.0 |
Fertility by Age by Marriage Status in Chitina
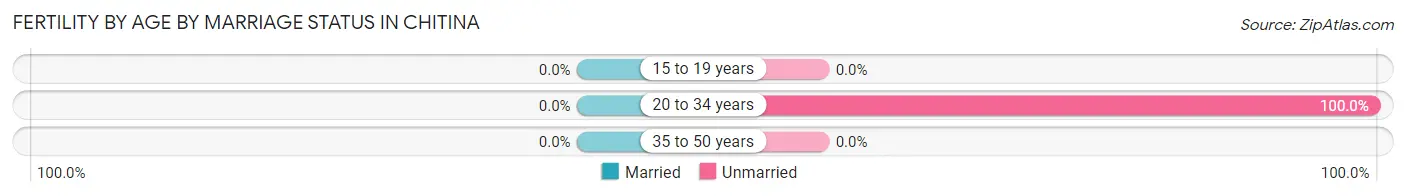
| Age Bracket | Married | Unmarried |
| 15 to 19 years | 0 (0.0%) | 0 (0.0%) |
| 20 to 34 years | 0 (0.0%) | 6 (100.0%) |
| 35 to 50 years | 0 (0.0%) | 0 (0.0%) |
| Total | 0 (0.0%) | 6 (100.0%) |
Fertility by Education in Chitina
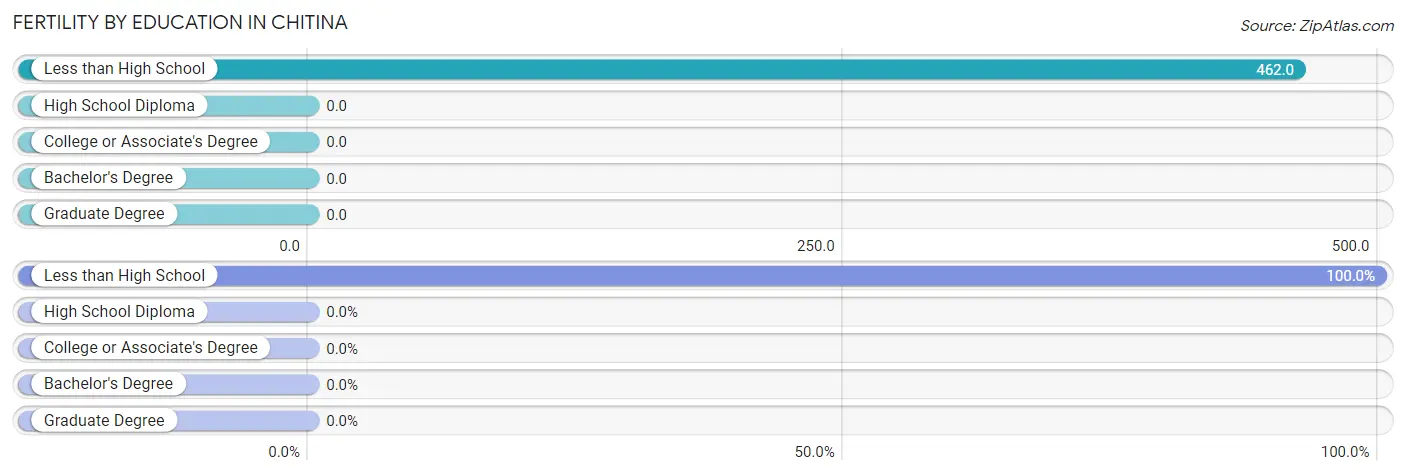
| Educational Attainment | Women with Births | Births / 1,000 Women |
| Less than High School | 6 (100.0%) | 462.0 |
| High School Diploma | 0 (0.0%) | 0.0 |
| College or Associate's Degree | 0 (0.0%) | 0.0 |
| Bachelor's Degree | 0 (0.0%) | 0.0 |
| Graduate Degree | 0 (0.0%) | 0.0 |
| Total | 6 (100.0%) | 375.0 |
Fertility by Education by Marriage Status in Chitina
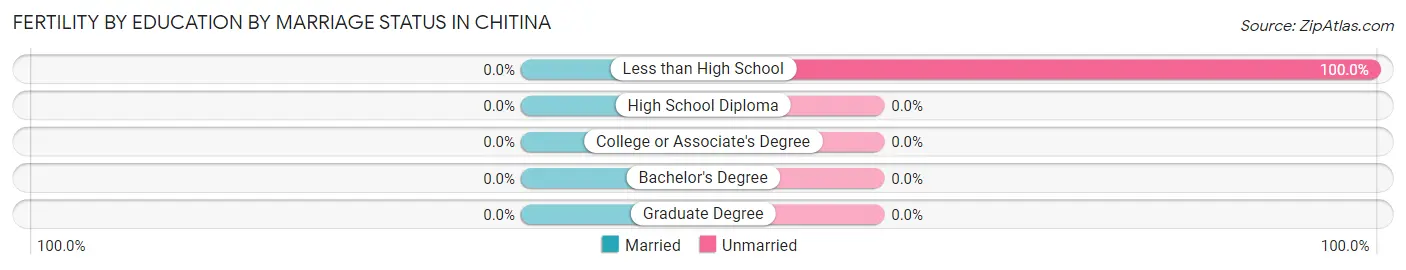
| Educational Attainment | Married | Unmarried |
| Less than High School | 0 (0.0%) | 6 (100.0%) |
| High School Diploma | 0 (0.0%) | 0 (0.0%) |
| College or Associate's Degree | 0 (0.0%) | 0 (0.0%) |
| Bachelor's Degree | 0 (0.0%) | 0 (0.0%) |
| Graduate Degree | 0 (0.0%) | 0 (0.0%) |
| Total | 0 (0.0%) | 6 (100.0%) |
Employment Characteristics in Chitina
Employment by Class of Employer in Chitina
Among the 19 employed individuals in Chitina, private company employees (7 | 36.8%), self-employed (not incorporated) (6 | 31.6%), and not-for-profit organizations (3 | 15.8%) make up the most common classes of employment.
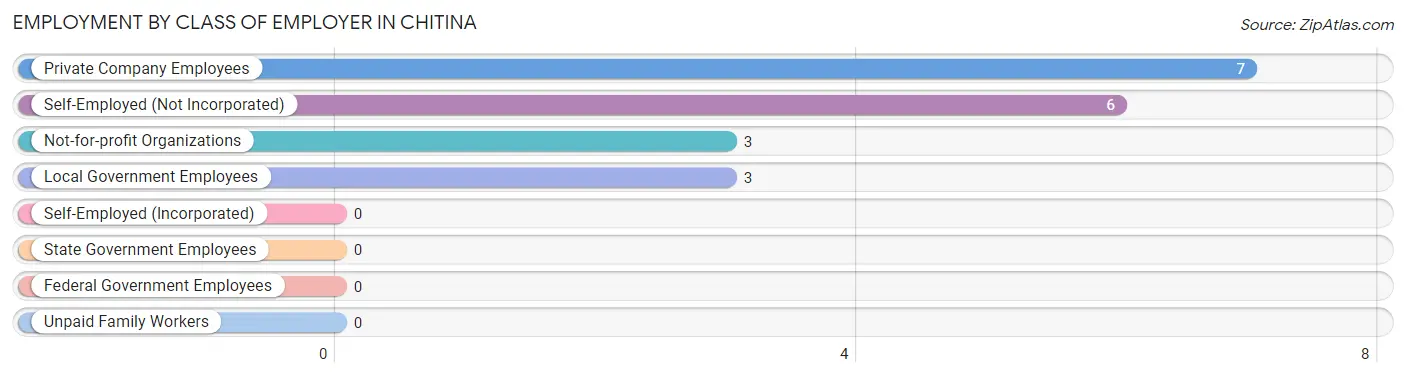
| Employer Class | # Employees | % Employees |
| Private Company Employees | 7 | 36.8% |
| Self-Employed (Incorporated) | 0 | 0.0% |
| Self-Employed (Not Incorporated) | 6 | 31.6% |
| Not-for-profit Organizations | 3 | 15.8% |
| Local Government Employees | 3 | 15.8% |
| State Government Employees | 0 | 0.0% |
| Federal Government Employees | 0 | 0.0% |
| Unpaid Family Workers | 0 | 0.0% |
| Total | 19 | 100.0% |
Employment Status by Age in Chitina
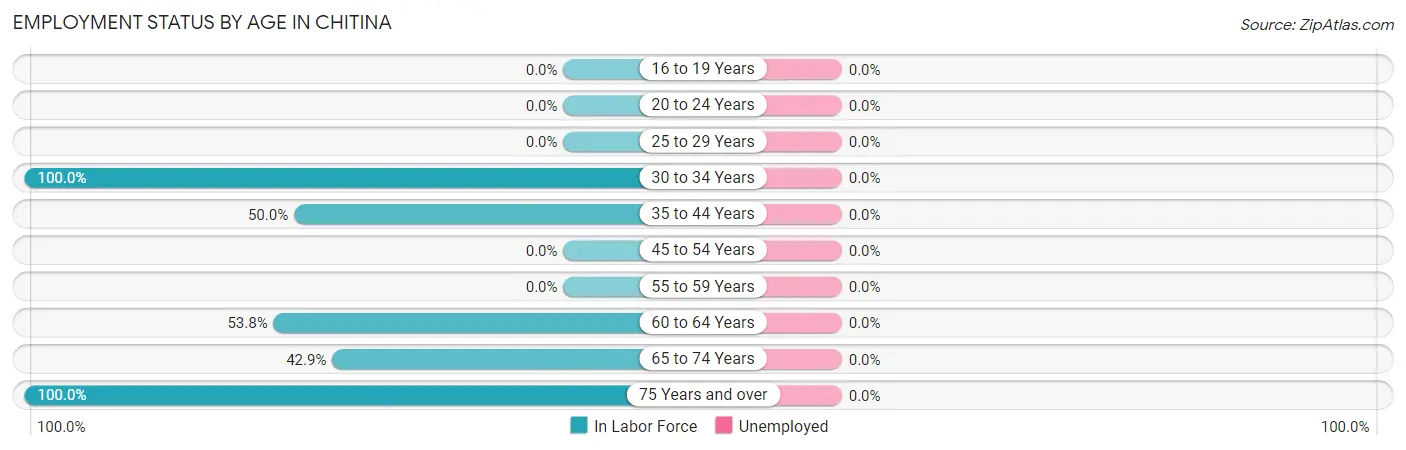
| Age Bracket | In Labor Force | Unemployed |
| 16 to 19 Years | 0 (0.0%) | 0 (0.0%) |
| 20 to 24 Years | 0 (0.0%) | 0 (0.0%) |
| 25 to 29 Years | 0 (0.0%) | 0 (0.0%) |
| 30 to 34 Years | 3 (100.0%) | 0 (0.0%) |
| 35 to 44 Years | 3 (50.0%) | 0 (0.0%) |
| 45 to 54 Years | 0 (0.0%) | 0 (0.0%) |
| 55 to 59 Years | 0 (0.0%) | 0 (0.0%) |
| 60 to 64 Years | 7 (53.8%) | 0 (0.0%) |
| 65 to 74 Years | 3 (42.9%) | 0 (0.0%) |
| 75 Years and over | 3 (100.0%) | 0 (0.0%) |
| Total | 19 (35.8%) | 0 (0.0%) |
Employment Status by Educational Attainment in Chitina
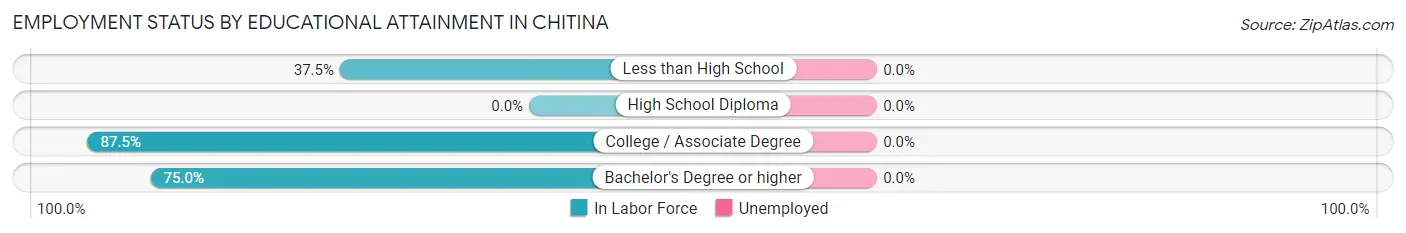
| Educational Attainment | In Labor Force | Unemployed |
| Less than High School | 3 (37.5%) | 0 (0.0%) |
| High School Diploma | 0 (0.0%) | 0 (0.0%) |
| College / Associate Degree | 7 (87.5%) | 0 (0.0%) |
| Bachelor's Degree or higher | 3 (75.0%) | 0 (0.0%) |
| Total | 13 (35.1%) | 0 (0.0%) |
Employment Occupations by Sex in Chitina
Management, Business, Science and Arts Occupations
The most common Management, Business, Science and Arts occupations in Chitina are Computers, Engineering & Science (6 | 31.6%), Architecture & Engineering (3 | 15.8%), Life, Physical & Social Science (3 | 15.8%), and Health Diagnosing & Treating (3 | 15.8%).
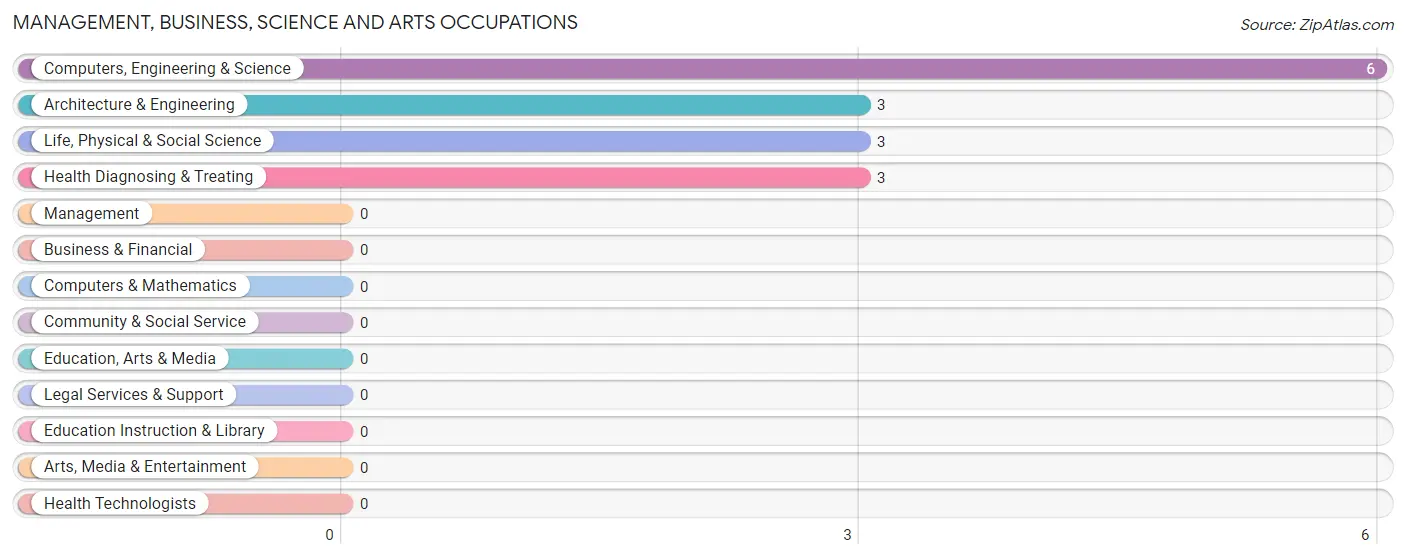
Management, Business, Science and Arts Occupations by Sex
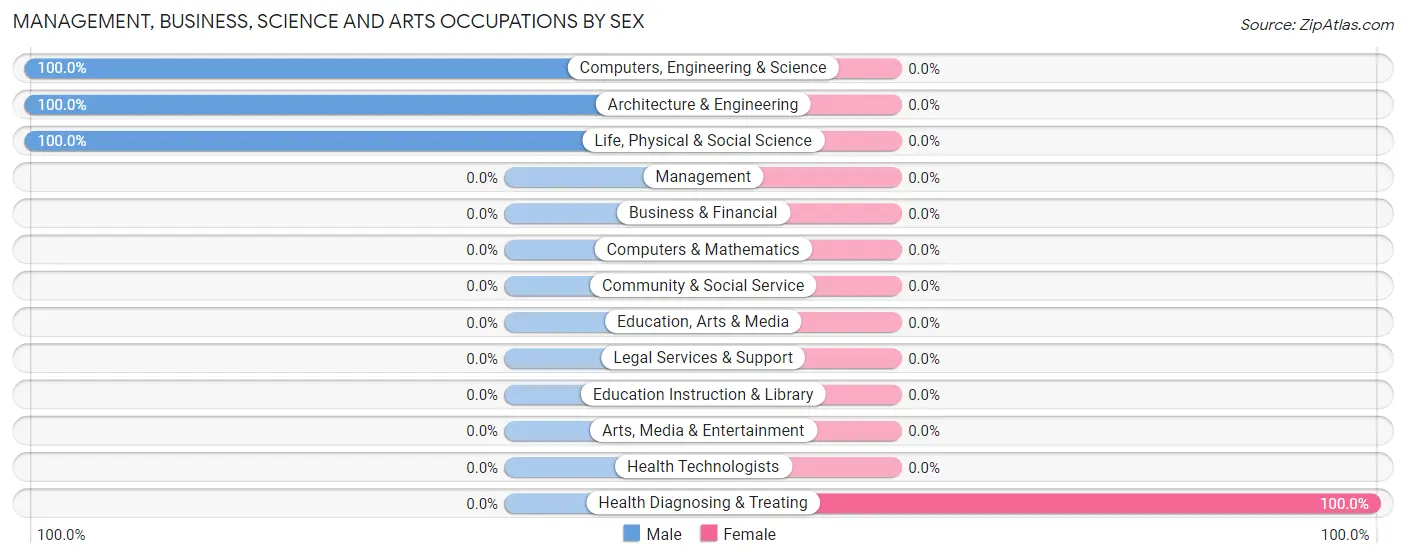
| Occupation | Male | Female |
| Management | 0 (0.0%) | 0 (0.0%) |
| Business & Financial | 0 (0.0%) | 0 (0.0%) |
| Computers, Engineering & Science | 6 (100.0%) | 0 (0.0%) |
| Computers & Mathematics | 0 (0.0%) | 0 (0.0%) |
| Architecture & Engineering | 3 (100.0%) | 0 (0.0%) |
| Life, Physical & Social Science | 3 (100.0%) | 0 (0.0%) |
| Community & Social Service | 0 (0.0%) | 0 (0.0%) |
| Education, Arts & Media | 0 (0.0%) | 0 (0.0%) |
| Legal Services & Support | 0 (0.0%) | 0 (0.0%) |
| Education Instruction & Library | 0 (0.0%) | 0 (0.0%) |
| Arts, Media & Entertainment | 0 (0.0%) | 0 (0.0%) |
| Health Diagnosing & Treating | 0 (0.0%) | 3 (100.0%) |
| Health Technologists | 0 (0.0%) | 0 (0.0%) |
| Total (Category) | 6 (66.7%) | 3 (33.3%) |
| Total (Overall) | 13 (68.4%) | 6 (31.6%) |
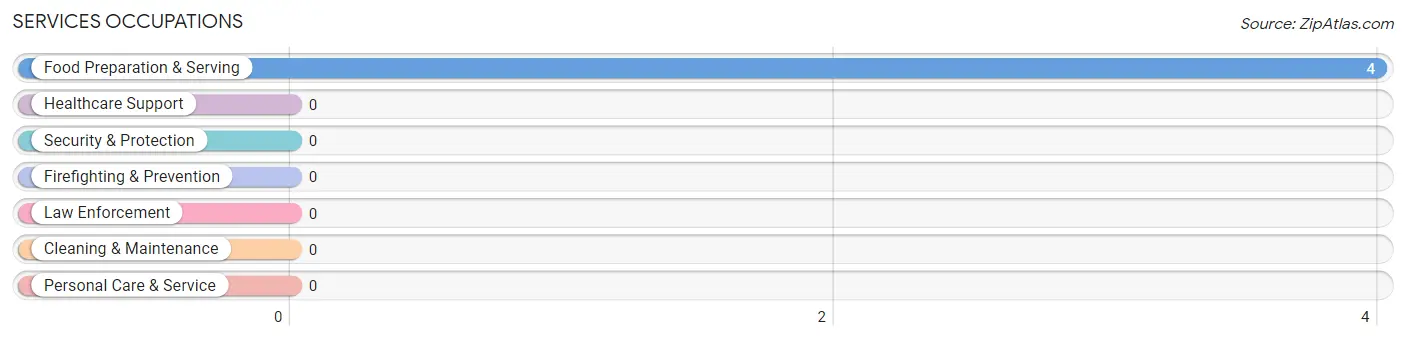
Services Occupations
The most common Services occupations in Chitina are , and Food Preparation & Serving (4 | 21.0%).
Services Occupations by Sex
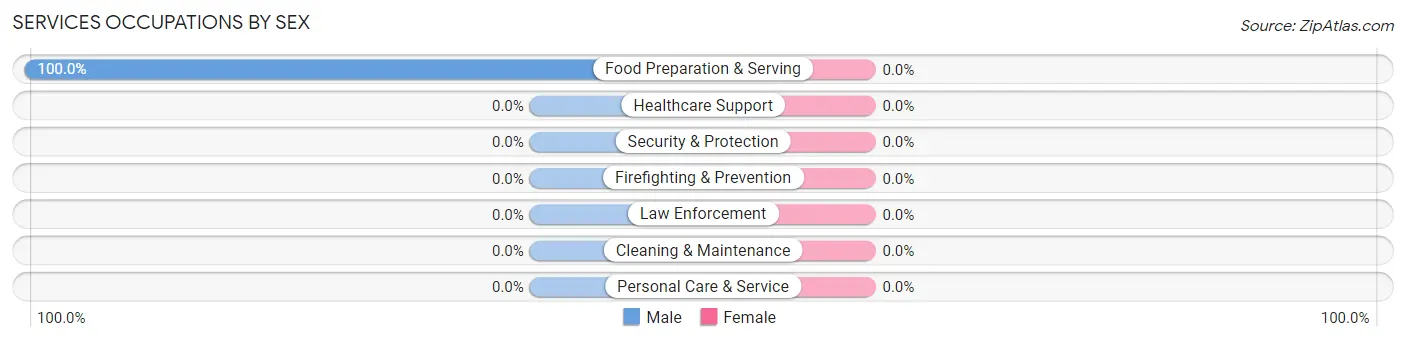
| Occupation | Male | Female |
| Healthcare Support | 0 (0.0%) | 0 (0.0%) |
| Security & Protection | 0 (0.0%) | 0 (0.0%) |
| Firefighting & Prevention | 0 (0.0%) | 0 (0.0%) |
| Law Enforcement | 0 (0.0%) | 0 (0.0%) |
| Food Preparation & Serving | 4 (100.0%) | 0 (0.0%) |
| Cleaning & Maintenance | 0 (0.0%) | 0 (0.0%) |
| Personal Care & Service | 0 (0.0%) | 0 (0.0%) |
| Total (Category) | 4 (100.0%) | 0 (0.0%) |
| Total (Overall) | 13 (68.4%) | 6 (31.6%) |
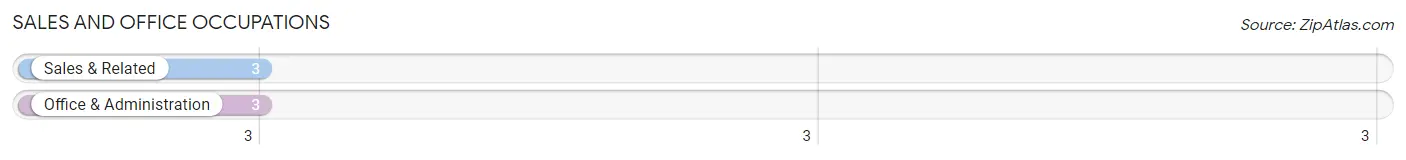
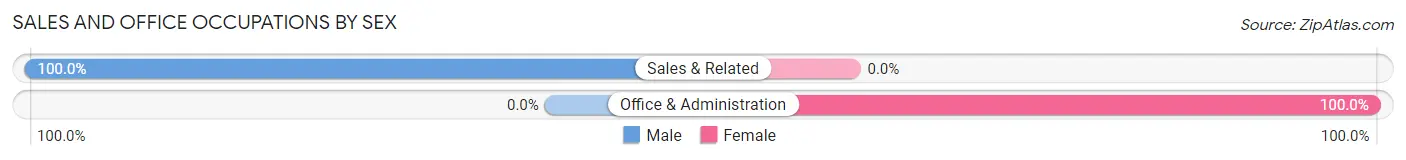
Sales and Office Occupations
The most common Sales and Office occupations in Chitina are Sales & Related (3 | 15.8%), and Office & Administration (3 | 15.8%).
Sales and Office Occupations by Sex
| Occupation | Male | Female |
| Sales & Related | 3 (100.0%) | 0 (0.0%) |
| Office & Administration | 0 (0.0%) | 3 (100.0%) |
| Total (Category) | 3 (50.0%) | 3 (50.0%) |
| Total (Overall) | 13 (68.4%) | 6 (31.6%) |
Natural Resources, Construction and Maintenance Occupations
Natural Resources, Construction and Maintenance Occupations by Sex
| Occupation | Male | Female |
| Farming, Fishing & Forestry | 0 (0.0%) | 0 (0.0%) |
| Construction & Extraction | 0 (0.0%) | 0 (0.0%) |
| Installation, Maintenance & Repair | 0 (0.0%) | 0 (0.0%) |
| Total (Category) | 0 (0.0%) | 0 (0.0%) |
| Total (Overall) | 13 (68.4%) | 6 (31.6%) |
Production, Transportation and Moving Occupations
Production, Transportation and Moving Occupations by Sex
| Occupation | Male | Female |
| Production | 0 (0.0%) | 0 (0.0%) |
| Transportation | 0 (0.0%) | 0 (0.0%) |
| Material Moving | 0 (0.0%) | 0 (0.0%) |
| Total (Category) | 0 (0.0%) | 0 (0.0%) |
| Total (Overall) | 13 (68.4%) | 6 (31.6%) |
Employment Industries by Sex in Chitina
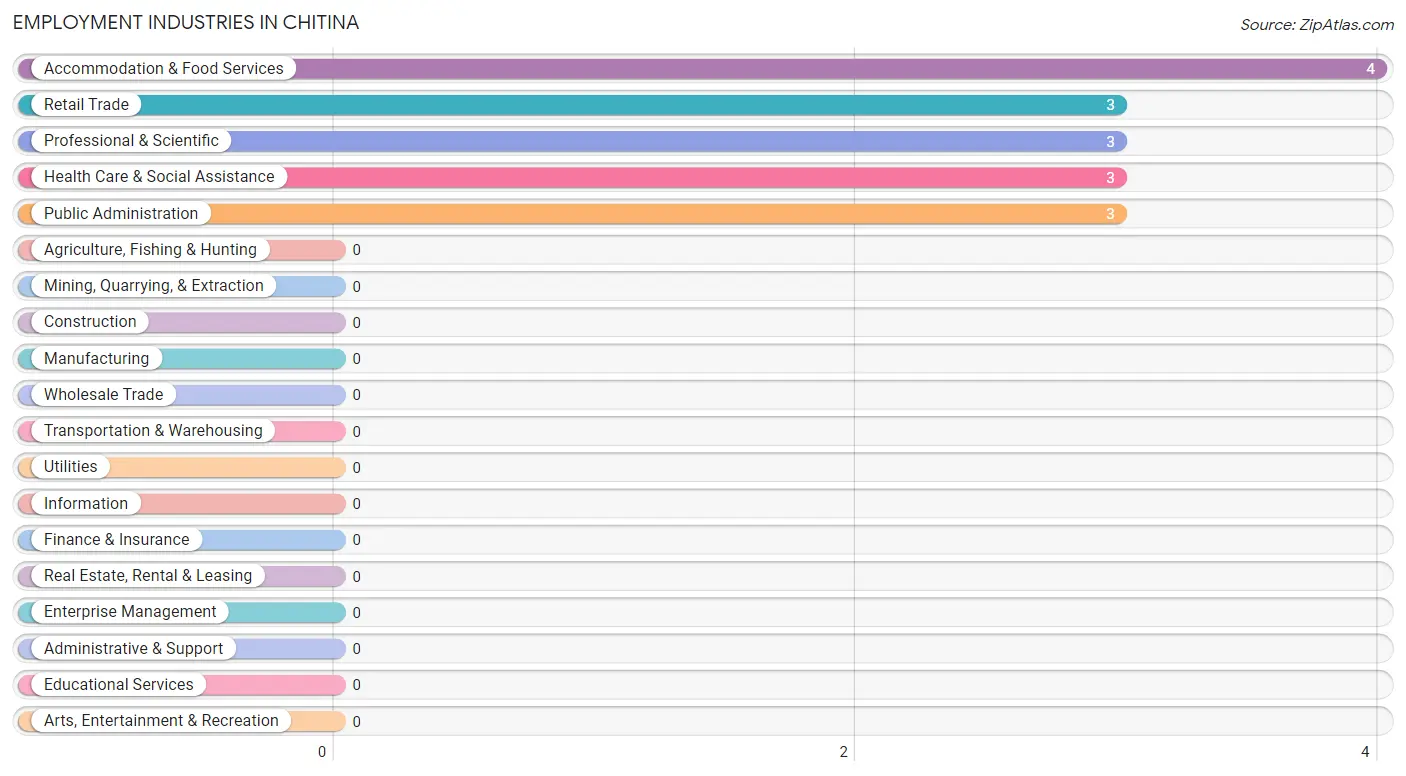
Employment Industries in Chitina
The major employment industries in Chitina include Accommodation & Food Services (4 | 21.0%), Retail Trade (3 | 15.8%), Professional & Scientific (3 | 15.8%), Health Care & Social Assistance (3 | 15.8%), and Public Administration (3 | 15.8%).
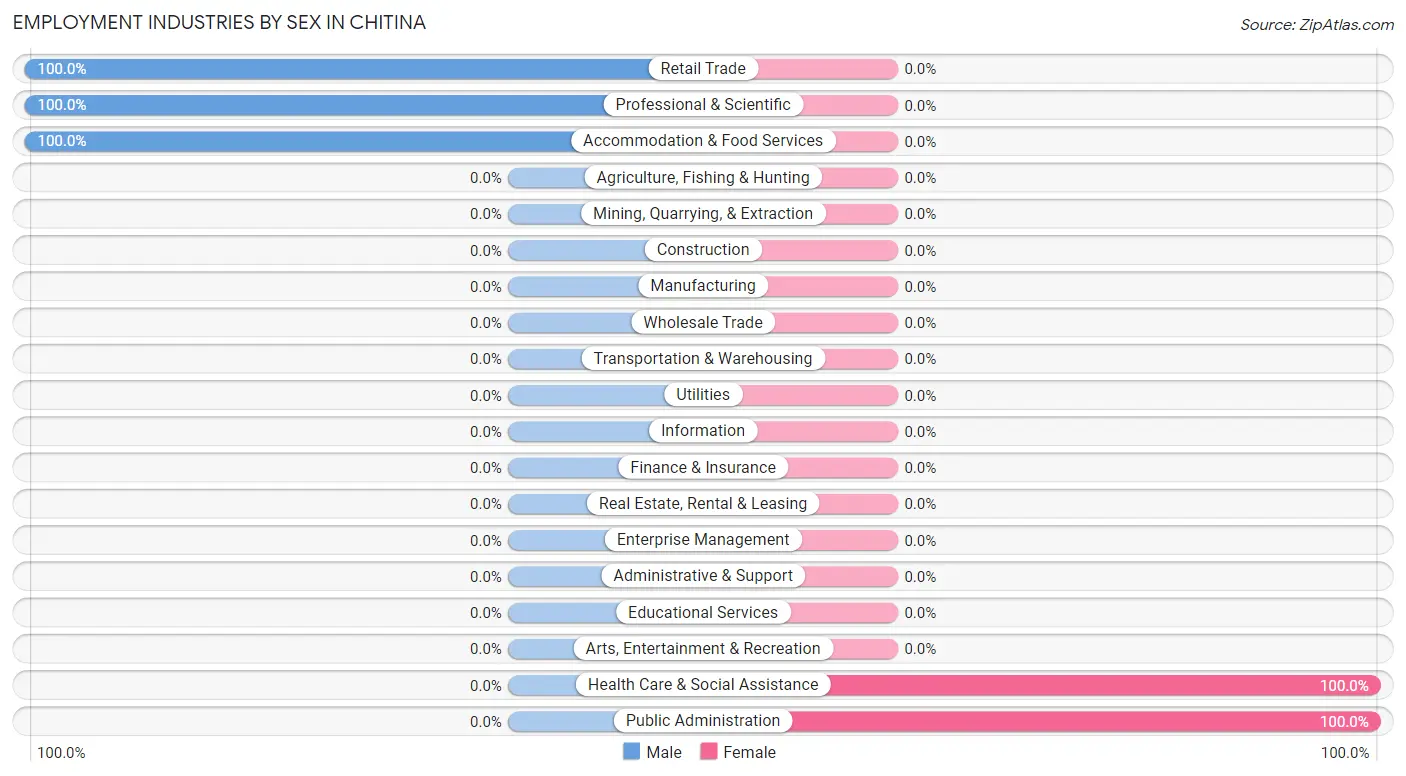
Employment Industries by Sex in Chitina
The Chitina industries that see more men than women are Retail Trade (100.0%), Professional & Scientific (100.0%), and Accommodation & Food Services (100.0%), whereas the industries that tend to have a higher number of women are Health Care & Social Assistance (100.0%), and Public Administration (100.0%).
| Industry | Male | Female |
| Agriculture, Fishing & Hunting | 0 (0.0%) | 0 (0.0%) |
| Mining, Quarrying, & Extraction | 0 (0.0%) | 0 (0.0%) |
| Construction | 0 (0.0%) | 0 (0.0%) |
| Manufacturing | 0 (0.0%) | 0 (0.0%) |
| Wholesale Trade | 0 (0.0%) | 0 (0.0%) |
| Retail Trade | 3 (100.0%) | 0 (0.0%) |
| Transportation & Warehousing | 0 (0.0%) | 0 (0.0%) |
| Utilities | 0 (0.0%) | 0 (0.0%) |
| Information | 0 (0.0%) | 0 (0.0%) |
| Finance & Insurance | 0 (0.0%) | 0 (0.0%) |
| Real Estate, Rental & Leasing | 0 (0.0%) | 0 (0.0%) |
| Professional & Scientific | 3 (100.0%) | 0 (0.0%) |
| Enterprise Management | 0 (0.0%) | 0 (0.0%) |
| Administrative & Support | 0 (0.0%) | 0 (0.0%) |
| Educational Services | 0 (0.0%) | 0 (0.0%) |
| Health Care & Social Assistance | 0 (0.0%) | 3 (100.0%) |
| Arts, Entertainment & Recreation | 0 (0.0%) | 0 (0.0%) |
| Accommodation & Food Services | 4 (100.0%) | 0 (0.0%) |
| Public Administration | 0 (0.0%) | 3 (100.0%) |
| Total | 13 (68.4%) | 6 (31.6%) |
Education in Chitina
School Enrollment in Chitina
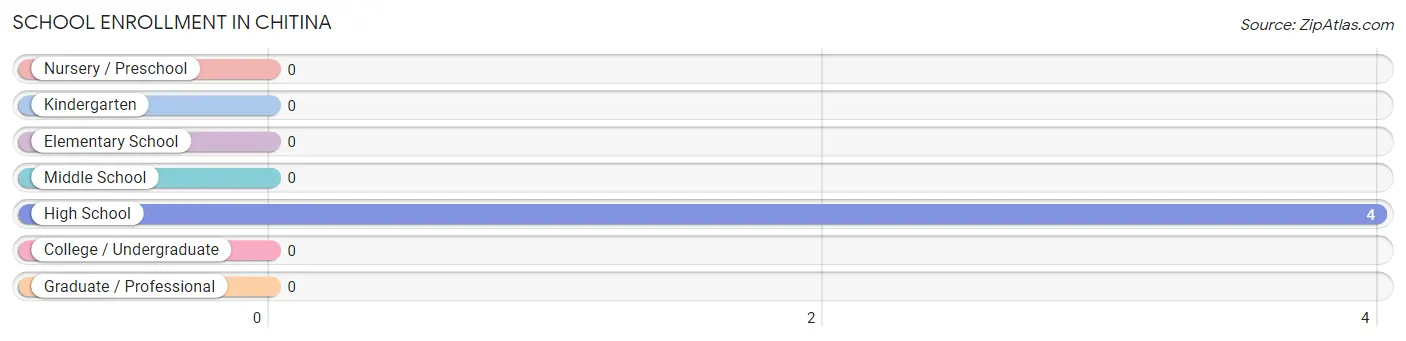
| School Level | # Students | % Students |
| Nursery / Preschool | 0 | 0.0% |
| Kindergarten | 0 | 0.0% |
| Elementary School | 0 | 0.0% |
| Middle School | 0 | 0.0% |
| High School | 4 | 100.0% |
| College / Undergraduate | 0 | 0.0% |
| Graduate / Professional | 0 | 0.0% |
| Total | 4 | 100.0% |
School Enrollment by Age by Funding Source in Chitina
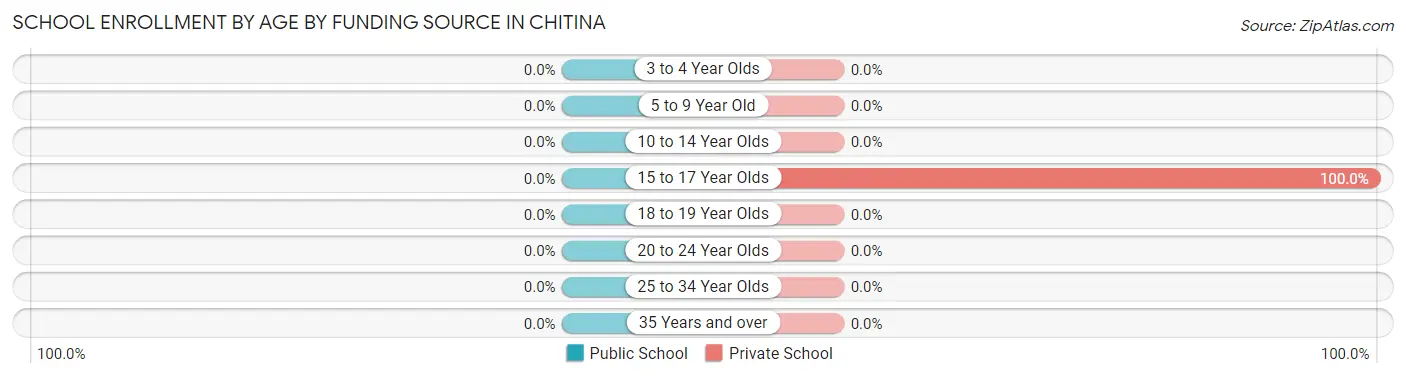
| Age Bracket | Public School | Private School |
| 3 to 4 Year Olds | 0 (0.0%) | 0 (0.0%) |
| 5 to 9 Year Old | 0 (0.0%) | 0 (0.0%) |
| 10 to 14 Year Olds | 0 (0.0%) | 0 (0.0%) |
| 15 to 17 Year Olds | 0 (0.0%) | 4 (100.0%) |
| 18 to 19 Year Olds | 0 (0.0%) | 0 (0.0%) |
| 20 to 24 Year Olds | 0 (0.0%) | 0 (0.0%) |
| 25 to 34 Year Olds | 0 (0.0%) | 0 (0.0%) |
| 35 Years and over | 0 (0.0%) | 0 (0.0%) |
| Total | 0 (0.0%) | 4 (100.0%) |
Educational Attainment by Field of Study in Chitina
Liberal arts & history (3 | 75.0%), and psychology (1 | 25.0%) are the most common fields of study among 4 individuals in Chitina who have obtained a bachelor's degree or higher.
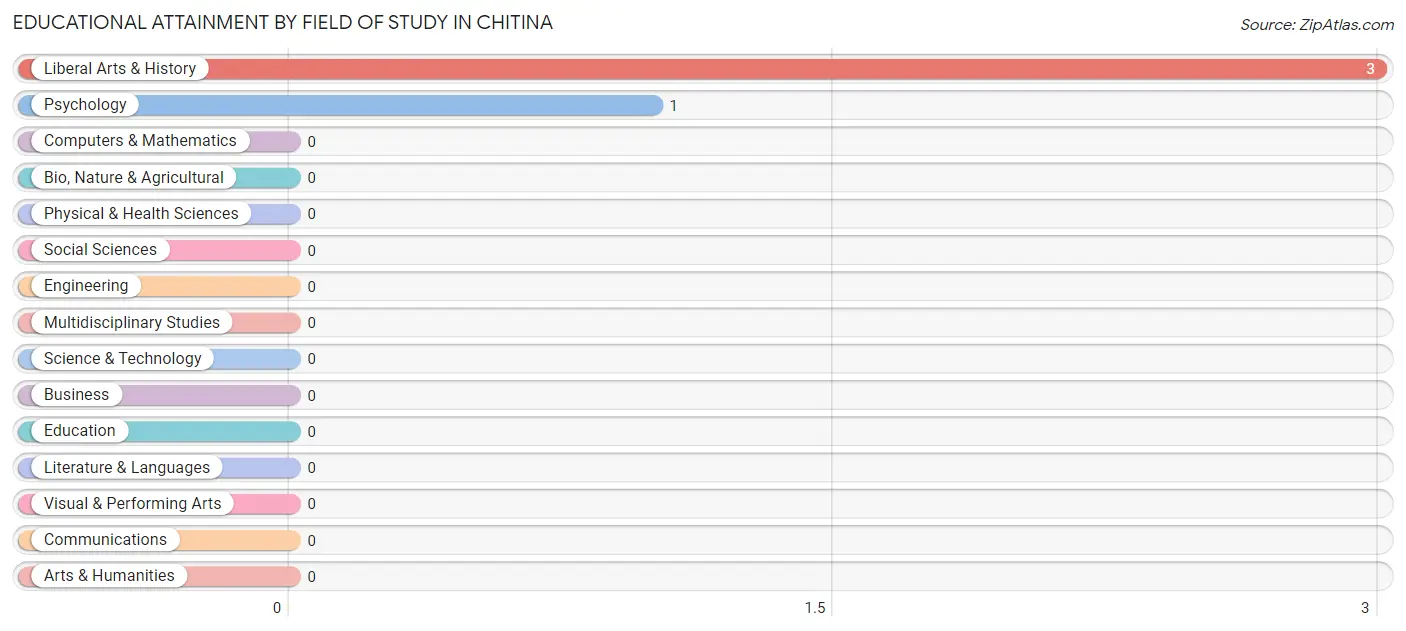
| Field of Study | # Graduates | % Graduates |
| Computers & Mathematics | 0 | 0.0% |
| Bio, Nature & Agricultural | 0 | 0.0% |
| Physical & Health Sciences | 0 | 0.0% |
| Psychology | 1 | 25.0% |
| Social Sciences | 0 | 0.0% |
| Engineering | 0 | 0.0% |
| Multidisciplinary Studies | 0 | 0.0% |
| Science & Technology | 0 | 0.0% |
| Business | 0 | 0.0% |
| Education | 0 | 0.0% |
| Literature & Languages | 0 | 0.0% |
| Liberal Arts & History | 3 | 75.0% |
| Visual & Performing Arts | 0 | 0.0% |
| Communications | 0 | 0.0% |
| Arts & Humanities | 0 | 0.0% |
| Total | 4 | 100.0% |
Transportation & Commute in Chitina
Vehicle Availability by Sex in Chitina
The most prevalent vehicle ownership categories in Chitina are males with 1 vehicle (10, accounting for 76.9%) and females with 1 vehicle (0, making up 166.7%).
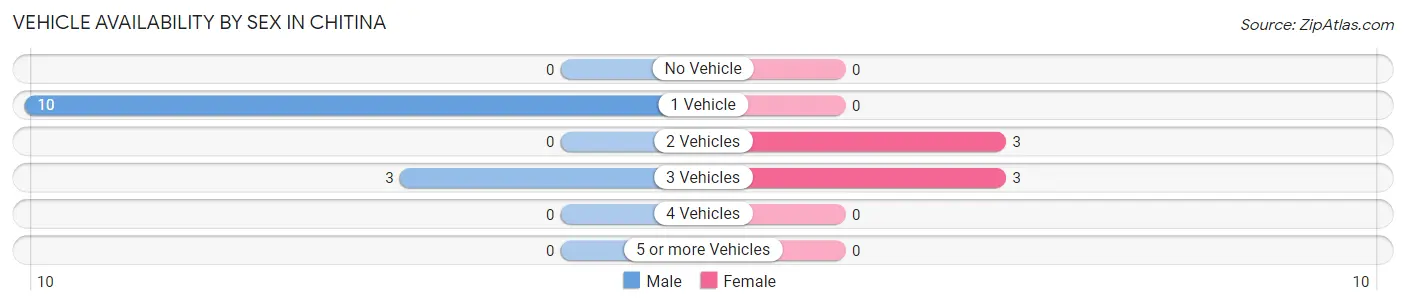
| Vehicles Available | Male | Female |
| No Vehicle | 0 (0.0%) | 0 (0.0%) |
| 1 Vehicle | 10 (76.9%) | 0 (0.0%) |
| 2 Vehicles | 0 (0.0%) | 3 (50.0%) |
| 3 Vehicles | 3 (23.1%) | 3 (50.0%) |
| 4 Vehicles | 0 (0.0%) | 0 (0.0%) |
| 5 or more Vehicles | 0 (0.0%) | 0 (0.0%) |
| Total | 13 (100.0%) | 6 (100.0%) |
Commute Time in Chitina
The most frequently occuring commute durations in Chitina are 5 to 9 minutes (7 commuters, 53.8%), less than 5 minutes (3 commuters, 23.1%), and 10 to 14 minutes (3 commuters, 23.1%).
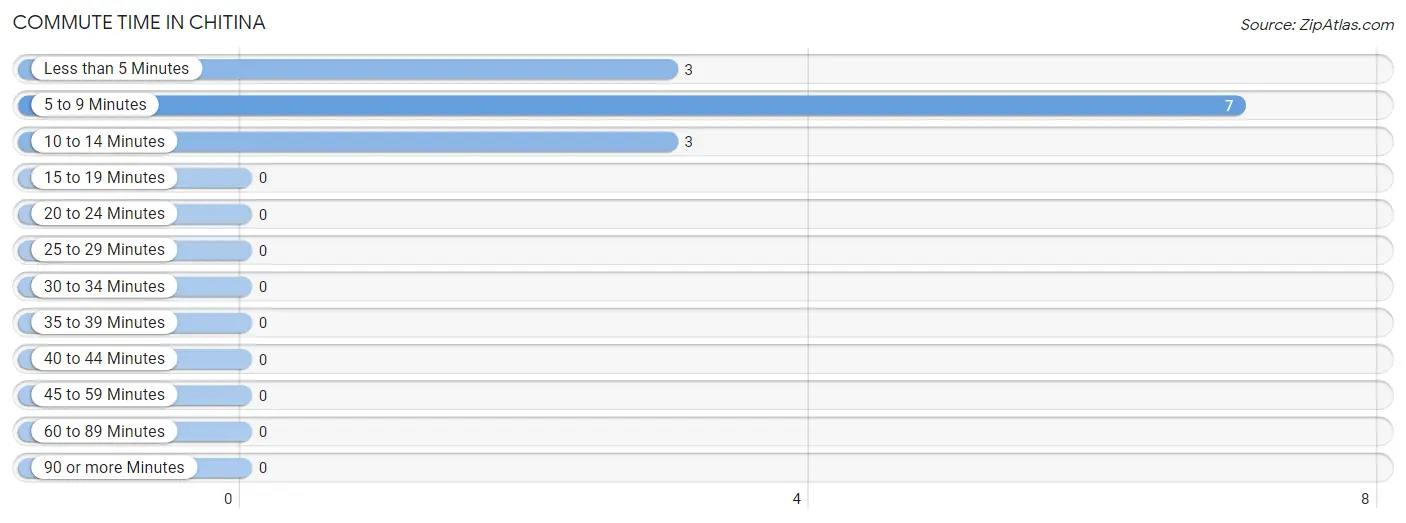
| Commute Time | # Commuters | % Commuters |
| Less than 5 Minutes | 3 | 23.1% |
| 5 to 9 Minutes | 7 | 53.8% |
| 10 to 14 Minutes | 3 | 23.1% |
| 15 to 19 Minutes | 0 | 0.0% |
| 20 to 24 Minutes | 0 | 0.0% |
| 25 to 29 Minutes | 0 | 0.0% |
| 30 to 34 Minutes | 0 | 0.0% |
| 35 to 39 Minutes | 0 | 0.0% |
| 40 to 44 Minutes | 0 | 0.0% |
| 45 to 59 Minutes | 0 | 0.0% |
| 60 to 89 Minutes | 0 | 0.0% |
| 90 or more Minutes | 0 | 0.0% |
Commute Time by Sex in Chitina
The most common commute times in Chitina are 5 to 9 minutes (4 commuters, 57.1%) for males and 5 to 9 minutes (3 commuters, 50.0%) for females.
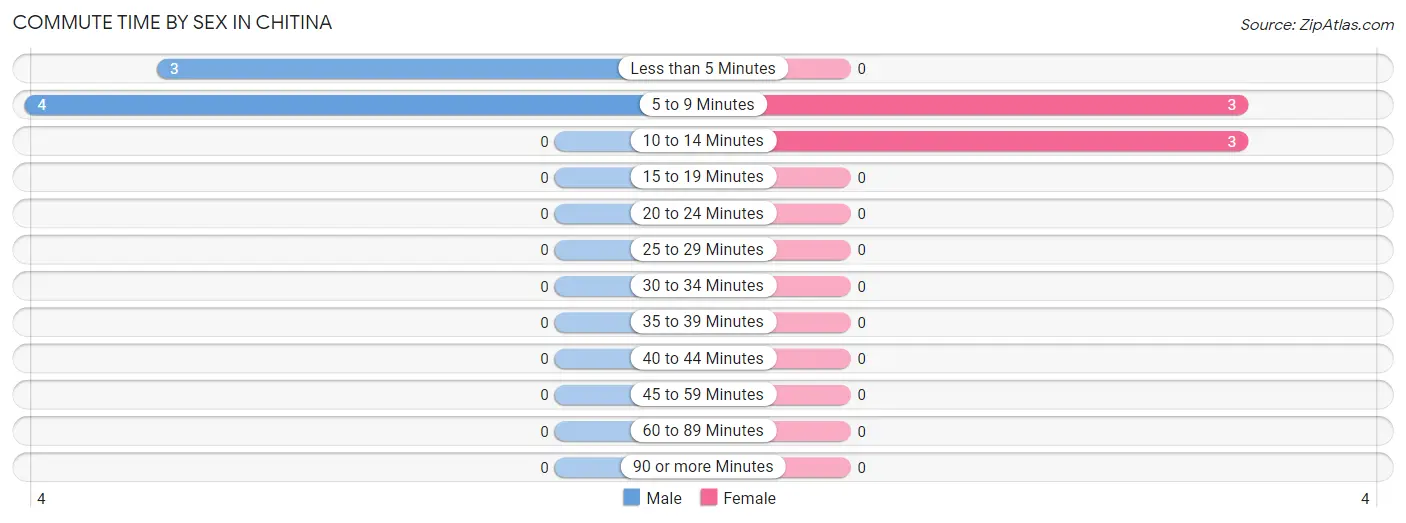
| Commute Time | Male | Female |
| Less than 5 Minutes | 3 (42.9%) | 0 (0.0%) |
| 5 to 9 Minutes | 4 (57.1%) | 3 (50.0%) |
| 10 to 14 Minutes | 0 (0.0%) | 3 (50.0%) |
| 15 to 19 Minutes | 0 (0.0%) | 0 (0.0%) |
| 20 to 24 Minutes | 0 (0.0%) | 0 (0.0%) |
| 25 to 29 Minutes | 0 (0.0%) | 0 (0.0%) |
| 30 to 34 Minutes | 0 (0.0%) | 0 (0.0%) |
| 35 to 39 Minutes | 0 (0.0%) | 0 (0.0%) |
| 40 to 44 Minutes | 0 (0.0%) | 0 (0.0%) |
| 45 to 59 Minutes | 0 (0.0%) | 0 (0.0%) |
| 60 to 89 Minutes | 0 (0.0%) | 0 (0.0%) |
| 90 or more Minutes | 0 (0.0%) | 0 (0.0%) |
Time of Departure to Work by Sex in Chitina
The most frequent times of departure to work in Chitina are 9:00 AM to 9:59 AM (7, 100.0%) for males and 12:00 AM to 4:59 AM (3, 50.0%) for females.
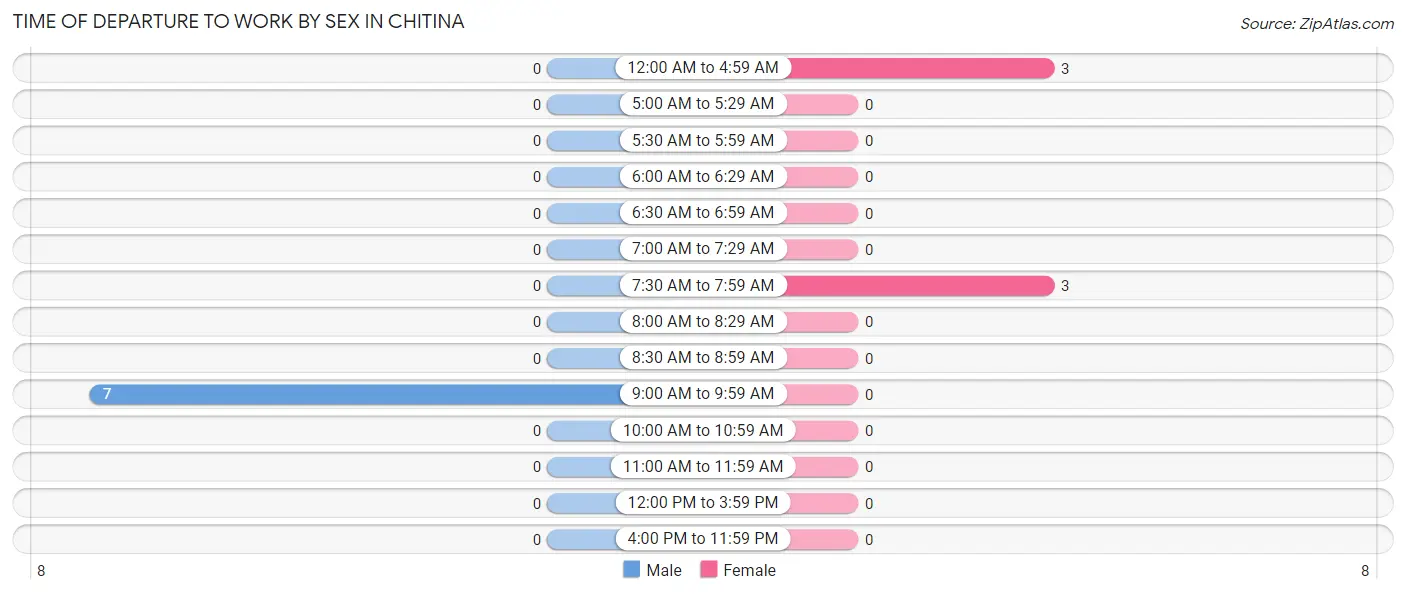
| Time of Departure | Male | Female |
| 12:00 AM to 4:59 AM | 0 (0.0%) | 3 (50.0%) |
| 5:00 AM to 5:29 AM | 0 (0.0%) | 0 (0.0%) |
| 5:30 AM to 5:59 AM | 0 (0.0%) | 0 (0.0%) |
| 6:00 AM to 6:29 AM | 0 (0.0%) | 0 (0.0%) |
| 6:30 AM to 6:59 AM | 0 (0.0%) | 0 (0.0%) |
| 7:00 AM to 7:29 AM | 0 (0.0%) | 0 (0.0%) |
| 7:30 AM to 7:59 AM | 0 (0.0%) | 3 (50.0%) |
| 8:00 AM to 8:29 AM | 0 (0.0%) | 0 (0.0%) |
| 8:30 AM to 8:59 AM | 0 (0.0%) | 0 (0.0%) |
| 9:00 AM to 9:59 AM | 7 (100.0%) | 0 (0.0%) |
| 10:00 AM to 10:59 AM | 0 (0.0%) | 0 (0.0%) |
| 11:00 AM to 11:59 AM | 0 (0.0%) | 0 (0.0%) |
| 12:00 PM to 3:59 PM | 0 (0.0%) | 0 (0.0%) |
| 4:00 PM to 11:59 PM | 0 (0.0%) | 0 (0.0%) |
| Total | 7 (100.0%) | 6 (100.0%) |
Housing Occupancy in Chitina
Occupancy by Ownership in Chitina
Of the total 45 dwellings in Chitina, owner-occupied units account for 22 (48.9%), while renter-occupied units make up 23 (51.1%).
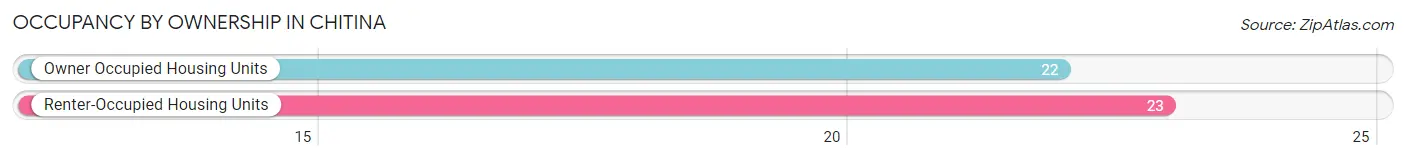
| Occupancy | # Housing Units | % Housing Units |
| Owner Occupied Housing Units | 22 | 48.9% |
| Renter-Occupied Housing Units | 23 | 51.1% |
| Total Occupied Housing Units | 45 | 100.0% |
Occupancy by Household Size in Chitina
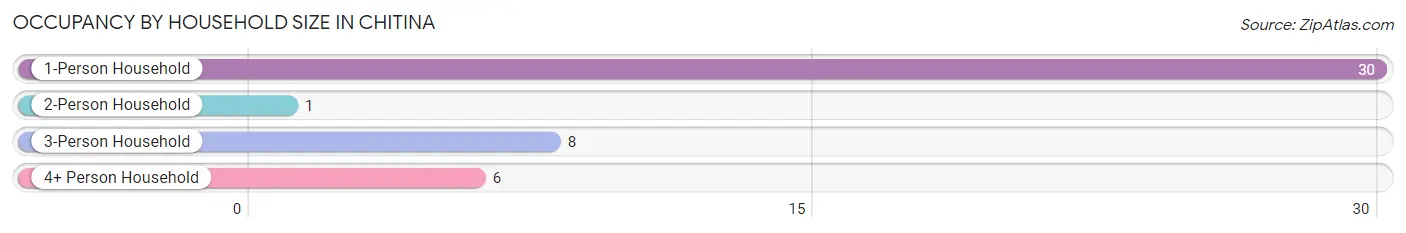
| Household Size | # Housing Units | % Housing Units |
| 1-Person Household | 30 | 66.7% |
| 2-Person Household | 1 | 2.2% |
| 3-Person Household | 8 | 17.8% |
| 4+ Person Household | 6 | 13.3% |
| Total Housing Units | 45 | 100.0% |
Occupancy by Ownership by Household Size in Chitina
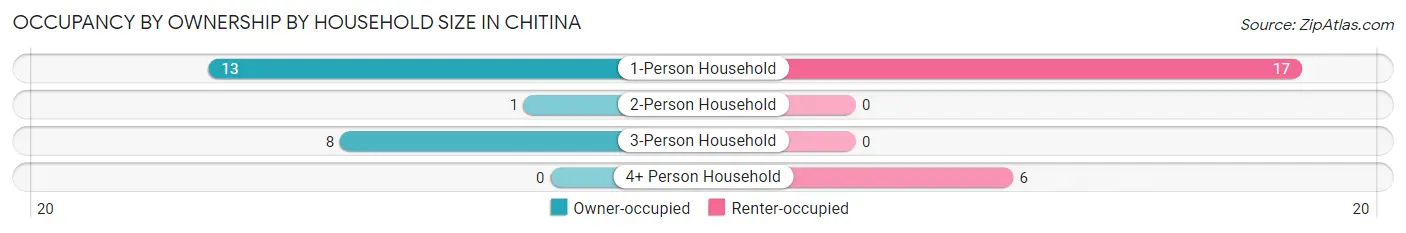
| Household Size | Owner-occupied | Renter-occupied |
| 1-Person Household | 13 (43.3%) | 17 (56.7%) |
| 2-Person Household | 1 (100.0%) | 0 (0.0%) |
| 3-Person Household | 8 (100.0%) | 0 (0.0%) |
| 4+ Person Household | 0 (0.0%) | 6 (100.0%) |
| Total Housing Units | 22 (48.9%) | 23 (51.1%) |
Occupancy by Educational Attainment in Chitina
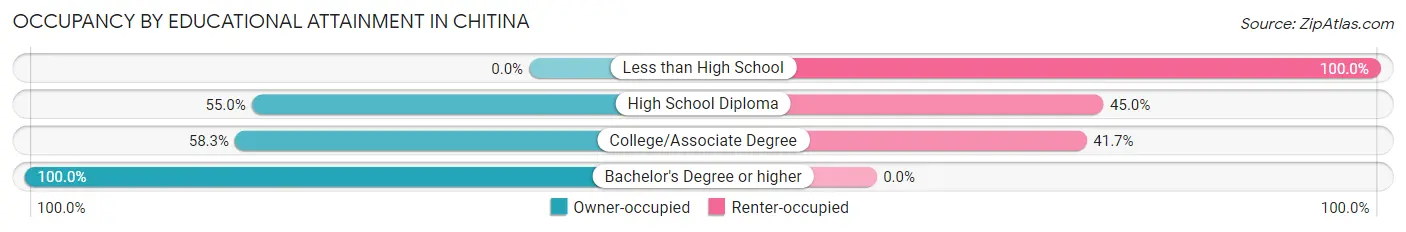
| Household Size | Owner-occupied | Renter-occupied |
| Less than High School | 0 (0.0%) | 9 (100.0%) |
| High School Diploma | 11 (55.0%) | 9 (45.0%) |
| College/Associate Degree | 7 (58.3%) | 5 (41.7%) |
| Bachelor's Degree or higher | 4 (100.0%) | 0 (0.0%) |
Occupancy by Age of Householder in Chitina
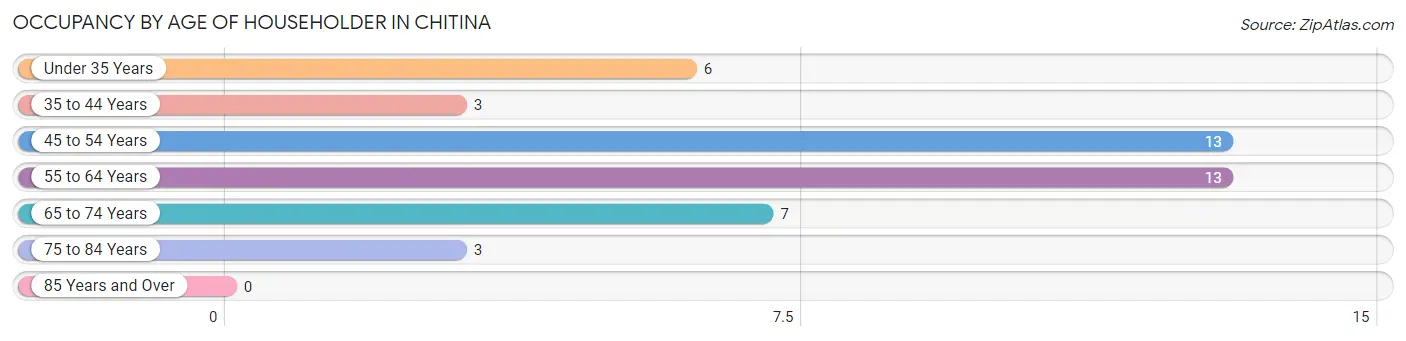
| Age Bracket | # Households | % Households |
| Under 35 Years | 6 | 13.3% |
| 35 to 44 Years | 3 | 6.7% |
| 45 to 54 Years | 13 | 28.9% |
| 55 to 64 Years | 13 | 28.9% |
| 65 to 74 Years | 7 | 15.6% |
| 75 to 84 Years | 3 | 6.7% |
| 85 Years and Over | 0 | 0.0% |
| Total | 45 | 100.0% |
Housing Finances in Chitina
Median Income by Occupancy in Chitina
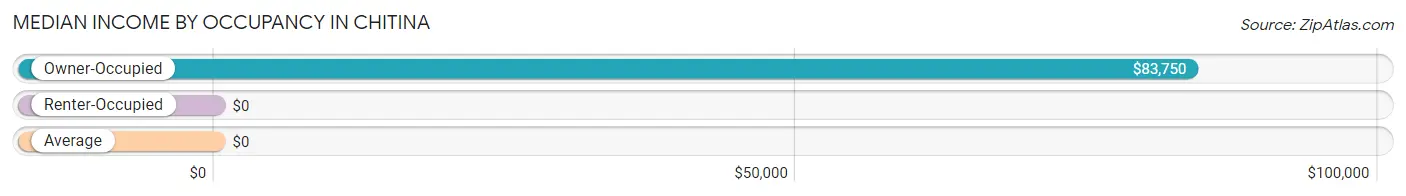
| Occupancy Type | # Households | Median Income |
| Owner-Occupied | 22 (48.9%) | $83,750 |
| Renter-Occupied | 23 (51.1%) | $0 |
| Average | 45 (100.0%) | $0 |
Occupancy by Householder Income Bracket in Chitina
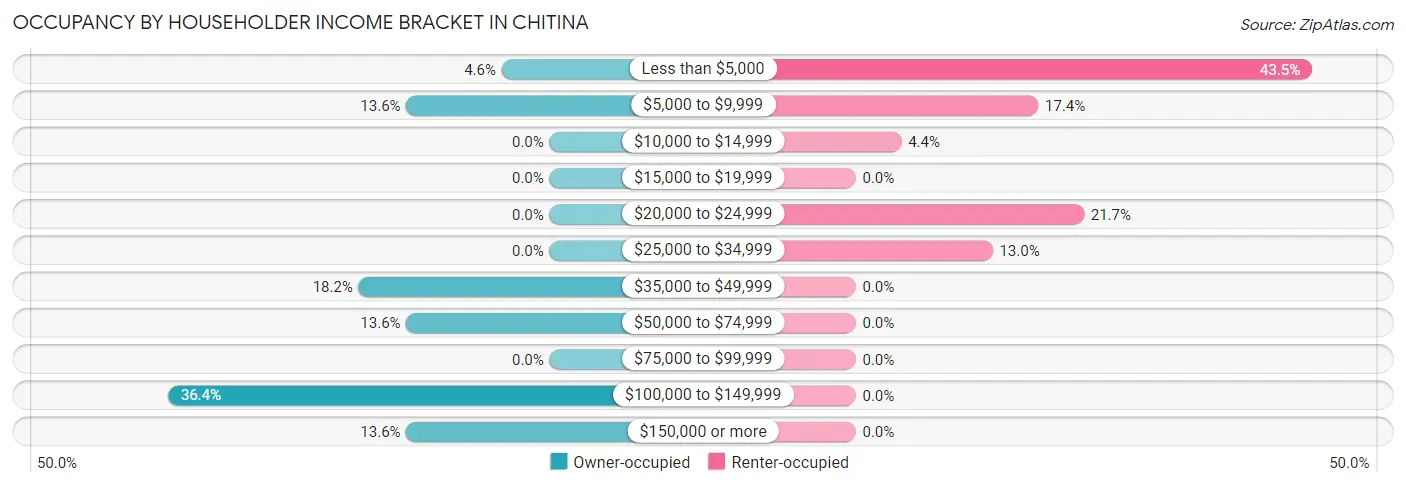
| Income Bracket | Owner-occupied | Renter-occupied |
| Less than $5,000 | 1 (4.5%) | 10 (43.5%) |
| $5,000 to $9,999 | 3 (13.6%) | 4 (17.4%) |
| $10,000 to $14,999 | 0 (0.0%) | 1 (4.3%) |
| $15,000 to $19,999 | 0 (0.0%) | 0 (0.0%) |
| $20,000 to $24,999 | 0 (0.0%) | 5 (21.7%) |
| $25,000 to $34,999 | 0 (0.0%) | 3 (13.0%) |
| $35,000 to $49,999 | 4 (18.2%) | 0 (0.0%) |
| $50,000 to $74,999 | 3 (13.6%) | 0 (0.0%) |
| $75,000 to $99,999 | 0 (0.0%) | 0 (0.0%) |
| $100,000 to $149,999 | 8 (36.4%) | 0 (0.0%) |
| $150,000 or more | 3 (13.6%) | 0 (0.0%) |
| Total | 22 (100.0%) | 23 (100.0%) |
Monthly Housing Cost Tiers in Chitina
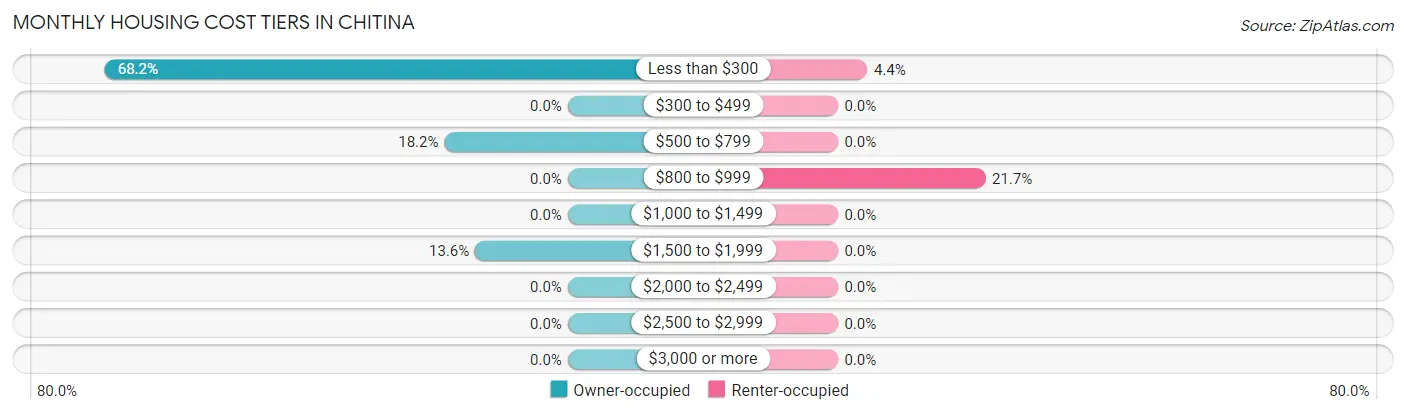
| Monthly Cost | Owner-occupied | Renter-occupied |
| Less than $300 | 15 (68.2%) | 1 (4.3%) |
| $300 to $499 | 0 (0.0%) | 0 (0.0%) |
| $500 to $799 | 4 (18.2%) | 0 (0.0%) |
| $800 to $999 | 0 (0.0%) | 5 (21.7%) |
| $1,000 to $1,499 | 0 (0.0%) | 0 (0.0%) |
| $1,500 to $1,999 | 3 (13.6%) | 0 (0.0%) |
| $2,000 to $2,499 | 0 (0.0%) | 0 (0.0%) |
| $2,500 to $2,999 | 0 (0.0%) | 0 (0.0%) |
| $3,000 or more | 0 (0.0%) | 0 (0.0%) |
| Total | 22 (100.0%) | 23 (100.0%) |
Physical Housing Characteristics in Chitina
Housing Structures in Chitina
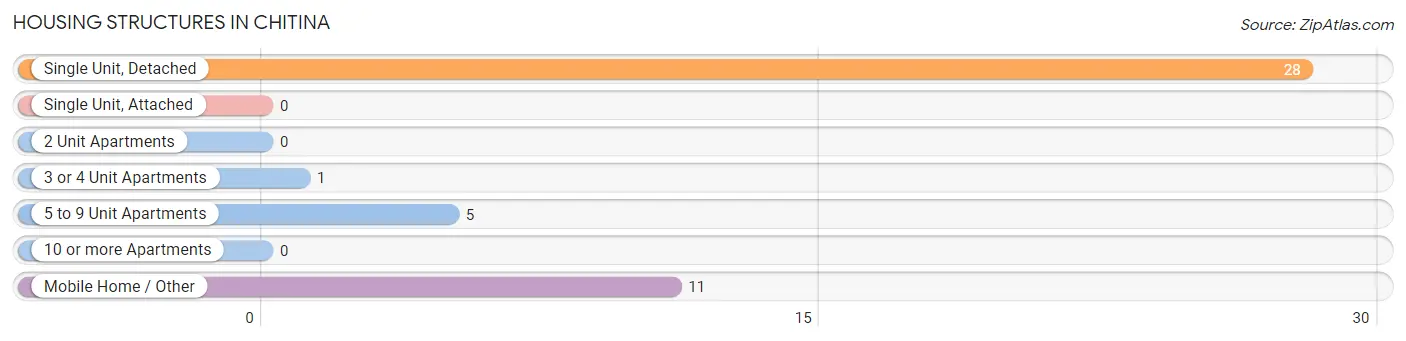
| Structure Type | # Housing Units | % Housing Units |
| Single Unit, Detached | 28 | 62.2% |
| Single Unit, Attached | 0 | 0.0% |
| 2 Unit Apartments | 0 | 0.0% |
| 3 or 4 Unit Apartments | 1 | 2.2% |
| 5 to 9 Unit Apartments | 5 | 11.1% |
| 10 or more Apartments | 0 | 0.0% |
| Mobile Home / Other | 11 | 24.4% |
| Total | 45 | 100.0% |
Housing Structures by Occupancy in Chitina
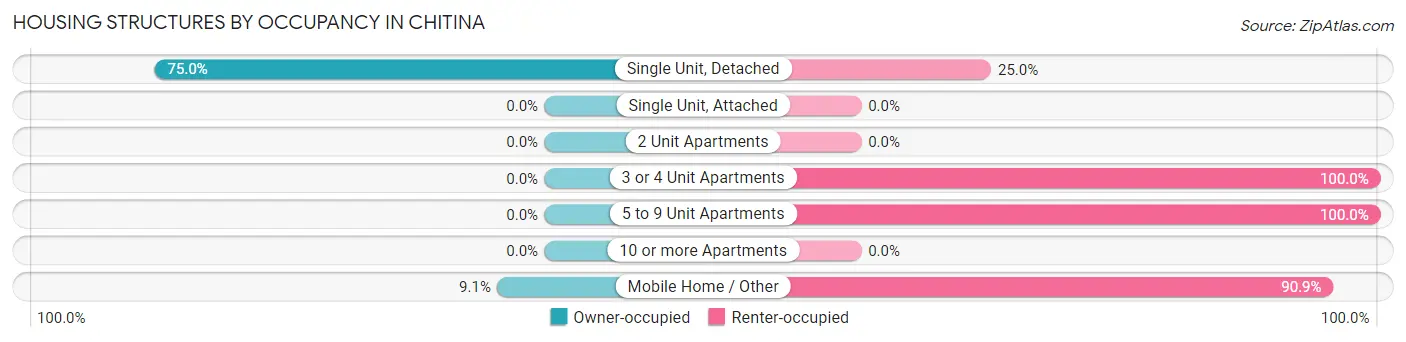
| Structure Type | Owner-occupied | Renter-occupied |
| Single Unit, Detached | 21 (75.0%) | 7 (25.0%) |
| Single Unit, Attached | 0 (0.0%) | 0 (0.0%) |
| 2 Unit Apartments | 0 (0.0%) | 0 (0.0%) |
| 3 or 4 Unit Apartments | 0 (0.0%) | 1 (100.0%) |
| 5 to 9 Unit Apartments | 0 (0.0%) | 5 (100.0%) |
| 10 or more Apartments | 0 (0.0%) | 0 (0.0%) |
| Mobile Home / Other | 1 (9.1%) | 10 (90.9%) |
| Total | 22 (48.9%) | 23 (51.1%) |
Housing Structures by Number of Rooms in Chitina
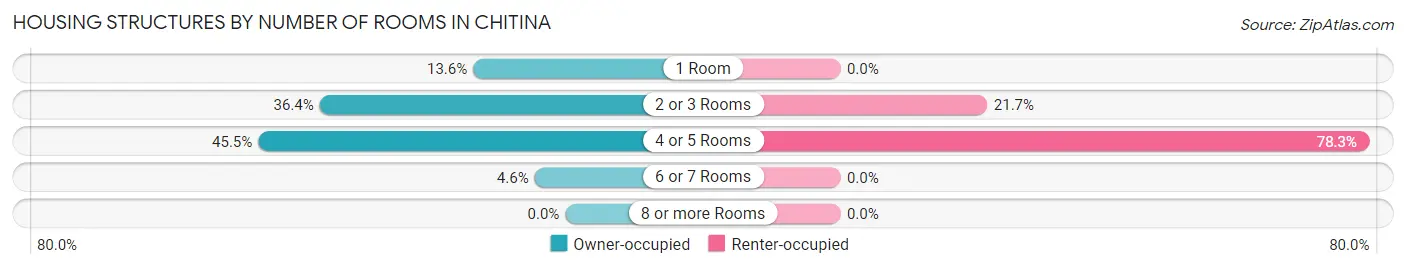
| Number of Rooms | Owner-occupied | Renter-occupied |
| 1 Room | 3 (13.6%) | 0 (0.0%) |
| 2 or 3 Rooms | 8 (36.4%) | 5 (21.7%) |
| 4 or 5 Rooms | 10 (45.5%) | 18 (78.3%) |
| 6 or 7 Rooms | 1 (4.5%) | 0 (0.0%) |
| 8 or more Rooms | 0 (0.0%) | 0 (0.0%) |
| Total | 22 (100.0%) | 23 (100.0%) |
Housing Structure by Heating Type in Chitina
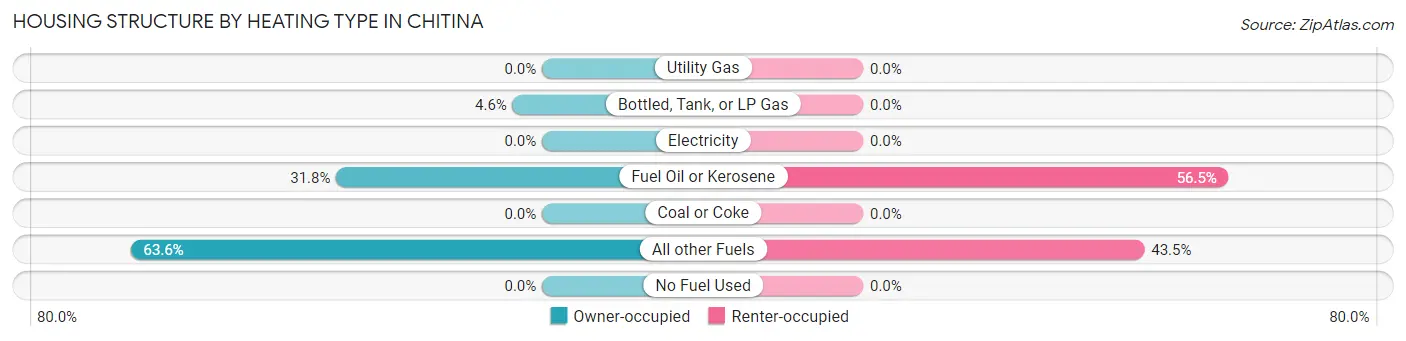
| Heating Type | Owner-occupied | Renter-occupied |
| Utility Gas | 0 (0.0%) | 0 (0.0%) |
| Bottled, Tank, or LP Gas | 1 (4.5%) | 0 (0.0%) |
| Electricity | 0 (0.0%) | 0 (0.0%) |
| Fuel Oil or Kerosene | 7 (31.8%) | 13 (56.5%) |
| Coal or Coke | 0 (0.0%) | 0 (0.0%) |
| All other Fuels | 14 (63.6%) | 10 (43.5%) |
| No Fuel Used | 0 (0.0%) | 0 (0.0%) |
| Total | 22 (100.0%) | 23 (100.0%) |
Household Vehicle Usage in Chitina
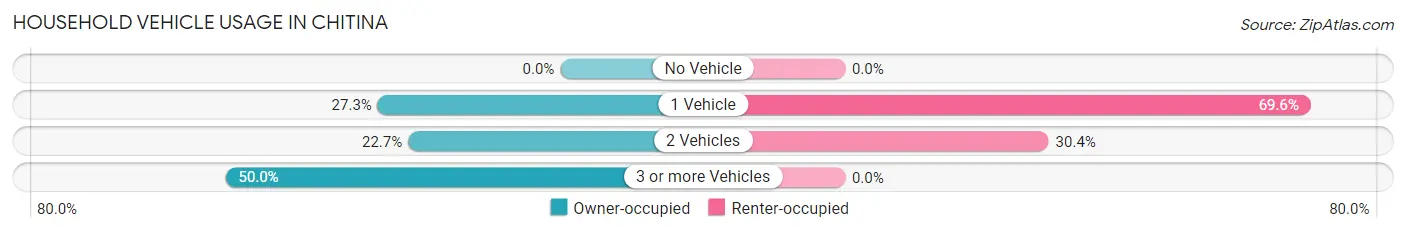
| Vehicles per Household | Owner-occupied | Renter-occupied |
| No Vehicle | 0 (0.0%) | 0 (0.0%) |
| 1 Vehicle | 6 (27.3%) | 16 (69.6%) |
| 2 Vehicles | 5 (22.7%) | 7 (30.4%) |
| 3 or more Vehicles | 11 (50.0%) | 0 (0.0%) |
| Total | 22 (100.0%) | 23 (100.0%) |
Real Estate & Mortgages in Chitina
Real Estate and Mortgage Overview in Chitina
| Characteristic | Without Mortgage | With Mortgage |
| Housing Units | 19 | 3 |
| Median Property Value | $93,800 | $0 |
| Median Household Income | $100,469 | $0 |
| Monthly Housing Costs | $225 | $0 |
| Real Estate Taxes | - | - |
Property Value by Mortgage Status in Chitina
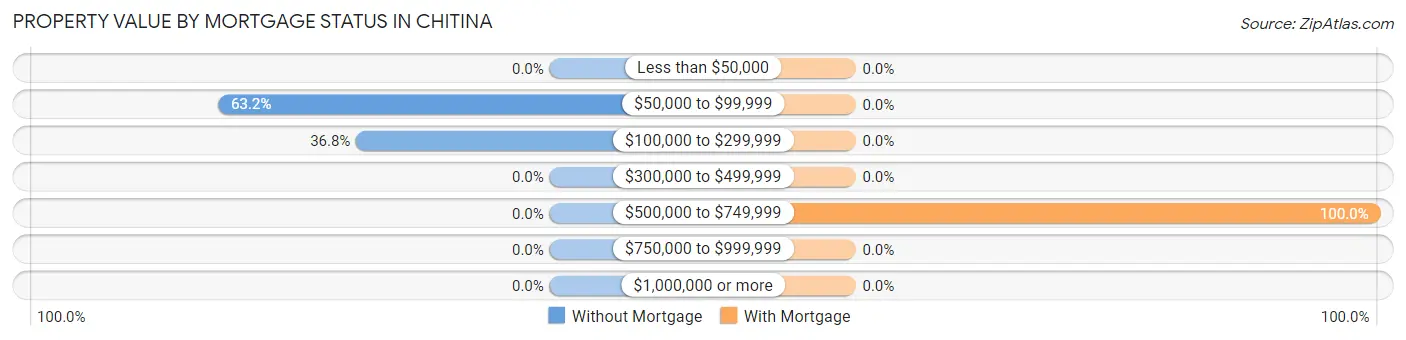
| Property Value | Without Mortgage | With Mortgage |
| Less than $50,000 | 0 (0.0%) | 0 (0.0%) |
| $50,000 to $99,999 | 12 (63.2%) | 0 (0.0%) |
| $100,000 to $299,999 | 7 (36.8%) | 0 (0.0%) |
| $300,000 to $499,999 | 0 (0.0%) | 0 (0.0%) |
| $500,000 to $749,999 | 0 (0.0%) | 3 (100.0%) |
| $750,000 to $999,999 | 0 (0.0%) | 0 (0.0%) |
| $1,000,000 or more | 0 (0.0%) | 0 (0.0%) |
| Total | 19 (100.0%) | 3 (100.0%) |
Household Income by Mortgage Status in Chitina
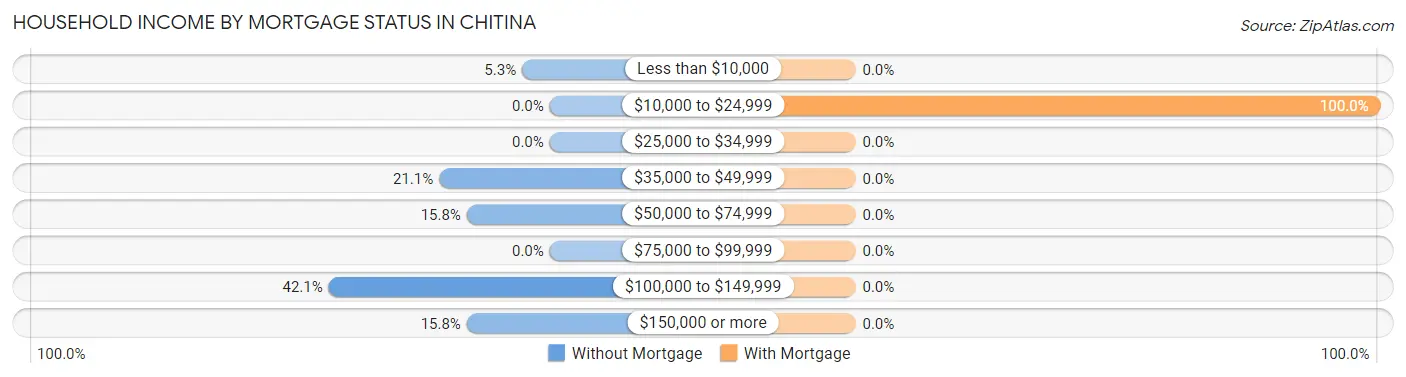
| Household Income | Without Mortgage | With Mortgage |
| Less than $10,000 | 1 (5.3%) | 0 (0.0%) |
| $10,000 to $24,999 | 0 (0.0%) | 3 (100.0%) |
| $25,000 to $34,999 | 0 (0.0%) | 0 (0.0%) |
| $35,000 to $49,999 | 4 (21.0%) | 0 (0.0%) |
| $50,000 to $74,999 | 3 (15.8%) | 0 (0.0%) |
| $75,000 to $99,999 | 0 (0.0%) | 0 (0.0%) |
| $100,000 to $149,999 | 8 (42.1%) | 0 (0.0%) |
| $150,000 or more | 3 (15.8%) | 0 (0.0%) |
| Total | 19 (100.0%) | 3 (100.0%) |
Property Value to Household Income Ratio in Chitina
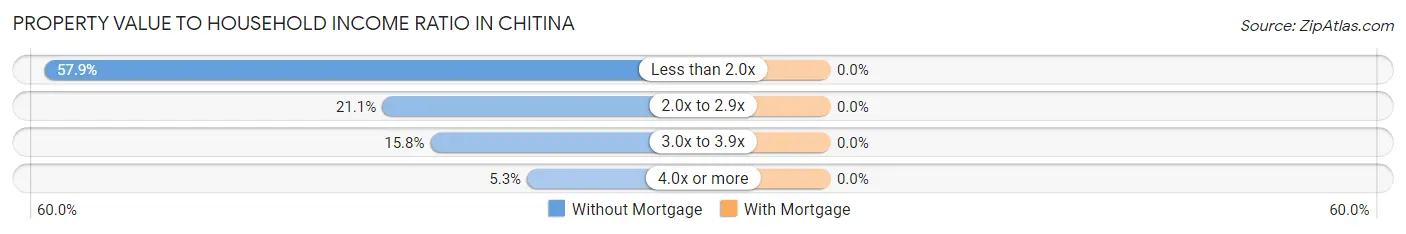
| Value-to-Income Ratio | Without Mortgage | With Mortgage |
| Less than 2.0x | 11 (57.9%) | 0 (0.0%) |
| 2.0x to 2.9x | 4 (21.0%) | 0 (0.0%) |
| 3.0x to 3.9x | 3 (15.8%) | 0 (0.0%) |
| 4.0x or more | 1 (5.3%) | 0 (0.0%) |
| Total | 19 (100.0%) | 3 (100.0%) |
Real Estate Taxes by Mortgage Status in Chitina
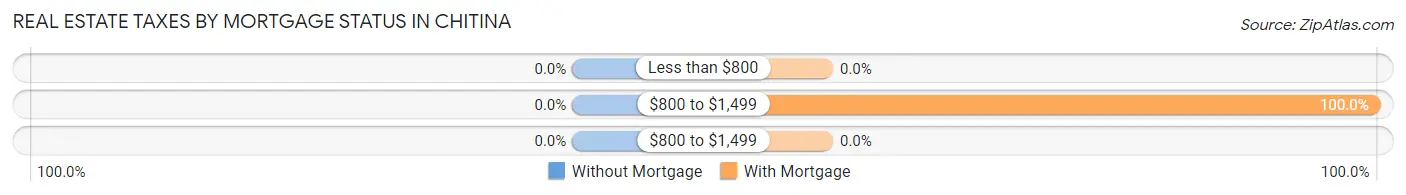
| Property Taxes | Without Mortgage | With Mortgage |
| Less than $800 | 0 (0.0%) | 0 (0.0%) |
| $800 to $1,499 | 0 (0.0%) | 3 (100.0%) |
| $800 to $1,499 | 0 (0.0%) | 0 (0.0%) |
| Total | 19 (100.0%) | 3 (100.0%) |
Health & Disability in Chitina
Health Insurance Coverage by Age in Chitina
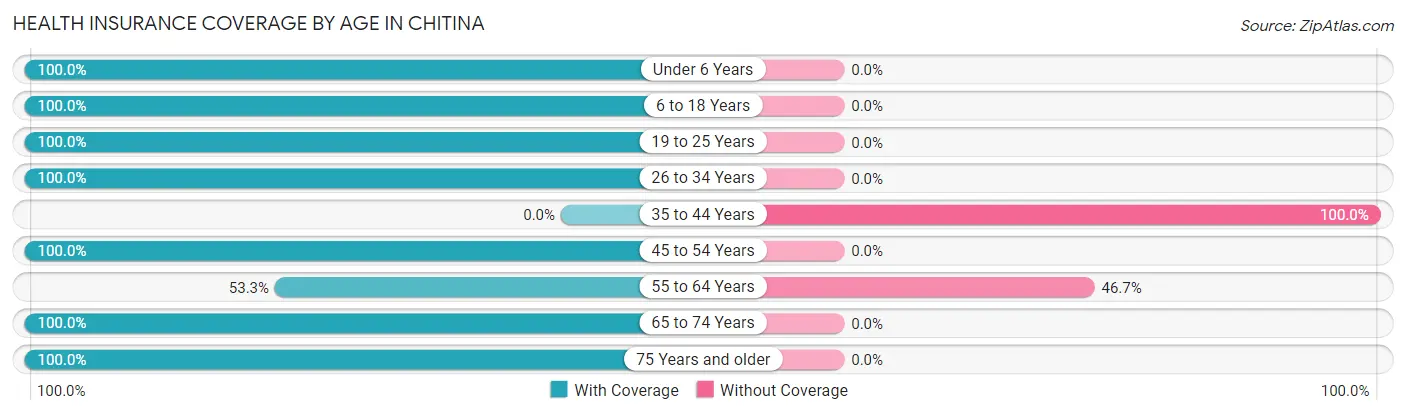
| Age Bracket | With Coverage | Without Coverage |
| Under 6 Years | 14 (100.0%) | 0 (0.0%) |
| 6 to 18 Years | 4 (100.0%) | 0 (0.0%) |
| 19 to 25 Years | 6 (100.0%) | 0 (0.0%) |
| 26 to 34 Years | 3 (100.0%) | 0 (0.0%) |
| 35 to 44 Years | 0 (0.0%) | 6 (100.0%) |
| 45 to 54 Years | 13 (100.0%) | 0 (0.0%) |
| 55 to 64 Years | 8 (53.3%) | 7 (46.7%) |
| 65 to 74 Years | 7 (100.0%) | 0 (0.0%) |
| 75 Years and older | 3 (100.0%) | 0 (0.0%) |
| Total | 58 (81.7%) | 13 (18.3%) |
Health Insurance Coverage by Citizenship Status in Chitina
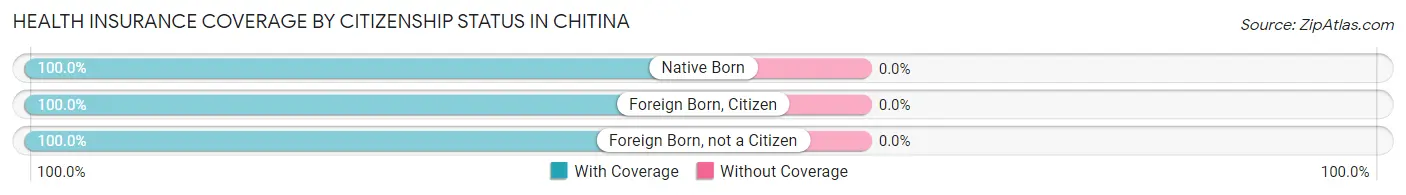
| Citizenship Status | With Coverage | Without Coverage |
| Native Born | 14 (100.0%) | 0 (0.0%) |
| Foreign Born, Citizen | 4 (100.0%) | 0 (0.0%) |
| Foreign Born, not a Citizen | 6 (100.0%) | 0 (0.0%) |
Health Insurance Coverage by Household Income in Chitina
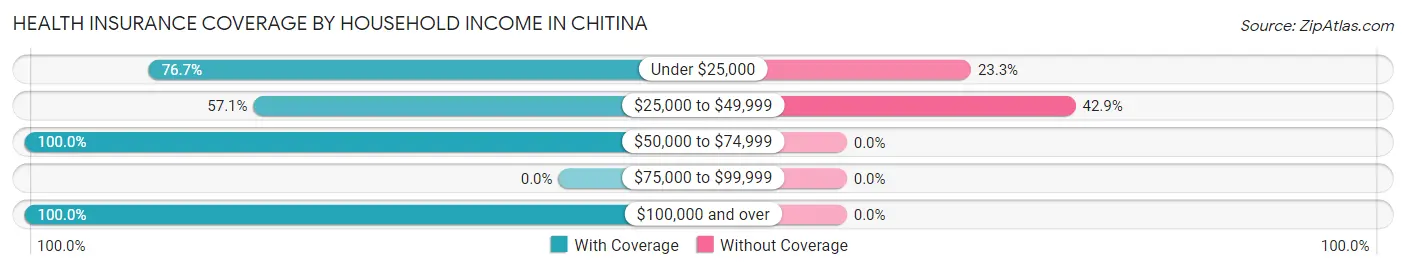
| Household Income | With Coverage | Without Coverage |
| Under $25,000 | 33 (76.7%) | 10 (23.3%) |
| $25,000 to $49,999 | 4 (57.1%) | 3 (42.9%) |
| $50,000 to $74,999 | 3 (100.0%) | 0 (0.0%) |
| $75,000 to $99,999 | 0 (0.0%) | 0 (0.0%) |
| $100,000 and over | 18 (100.0%) | 0 (0.0%) |
Public vs Private Health Insurance Coverage by Age in Chitina
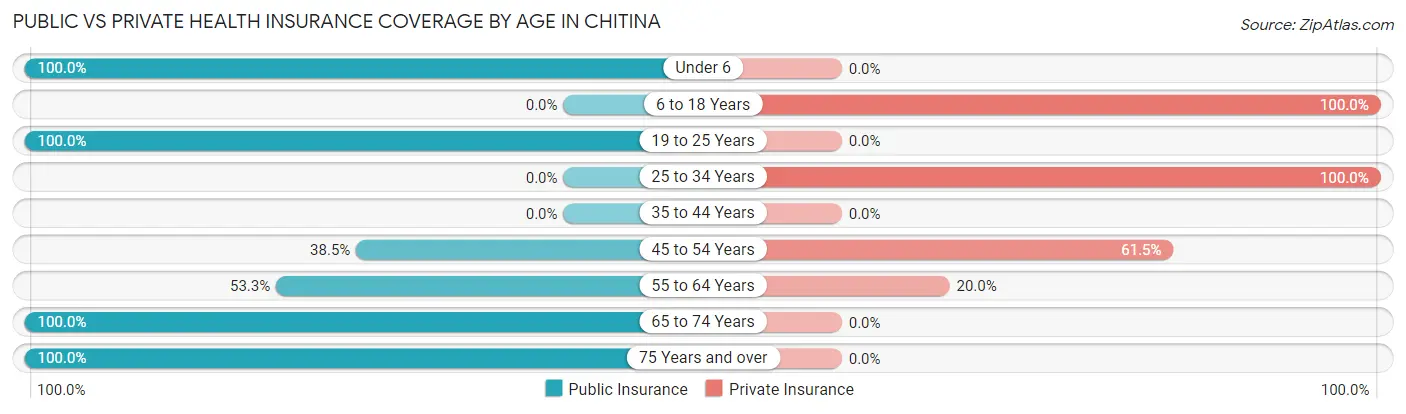
| Age Bracket | Public Insurance | Private Insurance |
| Under 6 | 14 (100.0%) | 0 (0.0%) |
| 6 to 18 Years | 0 (0.0%) | 4 (100.0%) |
| 19 to 25 Years | 6 (100.0%) | 0 (0.0%) |
| 25 to 34 Years | 0 (0.0%) | 3 (100.0%) |
| 35 to 44 Years | 0 (0.0%) | 0 (0.0%) |
| 45 to 54 Years | 5 (38.5%) | 8 (61.5%) |
| 55 to 64 Years | 8 (53.3%) | 3 (20.0%) |
| 65 to 74 Years | 7 (100.0%) | 0 (0.0%) |
| 75 Years and over | 3 (100.0%) | 0 (0.0%) |
| Total | 43 (60.6%) | 18 (25.4%) |
Disability Status by Sex by Age in Chitina
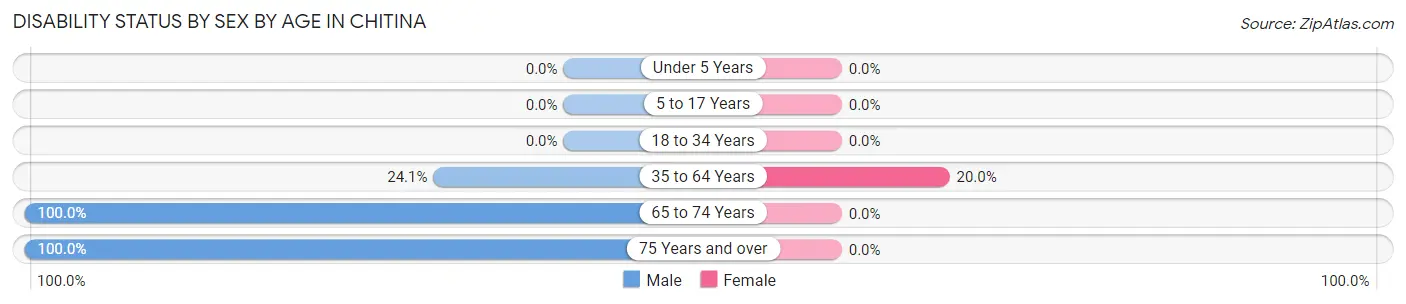
| Age Bracket | Male | Female |
| Under 5 Years | 0 (0.0%) | 0 (0.0%) |
| 5 to 17 Years | 0 (0.0%) | 0 (0.0%) |
| 18 to 34 Years | 0 (0.0%) | 0 (0.0%) |
| 35 to 64 Years | 7 (24.1%) | 1 (20.0%) |
| 65 to 74 Years | 7 (100.0%) | 0 (0.0%) |
| 75 Years and over | 3 (100.0%) | 0 (0.0%) |
Disability Class by Sex by Age in Chitina
Disability Class: Hearing Difficulty
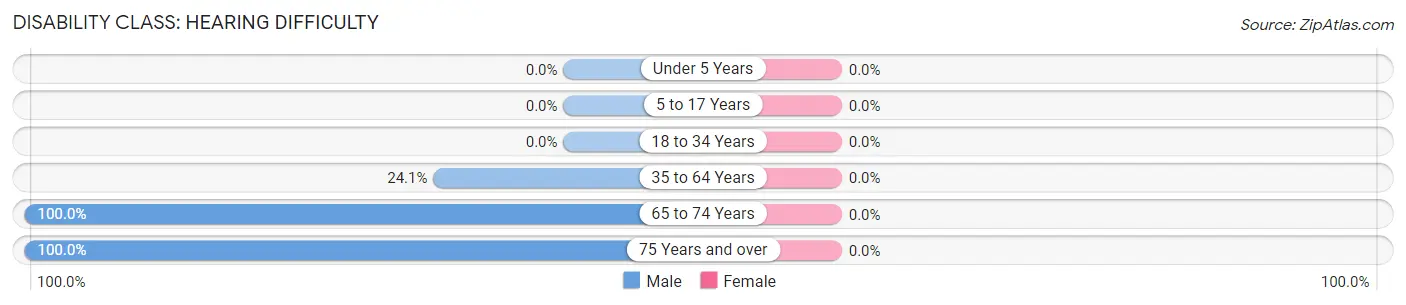
| Age Bracket | Male | Female |
| Under 5 Years | 0 (0.0%) | 0 (0.0%) |
| 5 to 17 Years | 0 (0.0%) | 0 (0.0%) |
| 18 to 34 Years | 0 (0.0%) | 0 (0.0%) |
| 35 to 64 Years | 7 (24.1%) | 0 (0.0%) |
| 65 to 74 Years | 7 (100.0%) | 0 (0.0%) |
| 75 Years and over | 3 (100.0%) | 0 (0.0%) |
Disability Class: Vision Difficulty
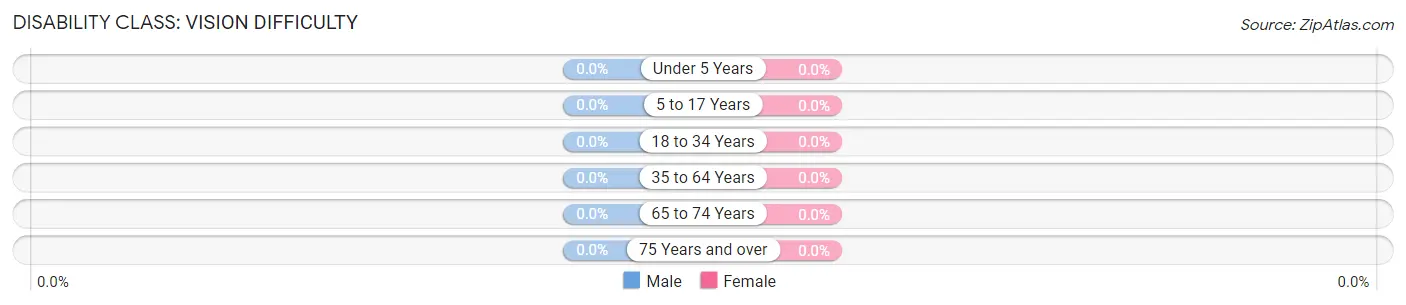
| Age Bracket | Male | Female |
| Under 5 Years | 0 (0.0%) | 0 (0.0%) |
| 5 to 17 Years | 0 (0.0%) | 0 (0.0%) |
| 18 to 34 Years | 0 (0.0%) | 0 (0.0%) |
| 35 to 64 Years | 0 (0.0%) | 0 (0.0%) |
| 65 to 74 Years | 0 (0.0%) | 0 (0.0%) |
| 75 Years and over | 0 (0.0%) | 0 (0.0%) |
Disability Class: Cognitive Difficulty
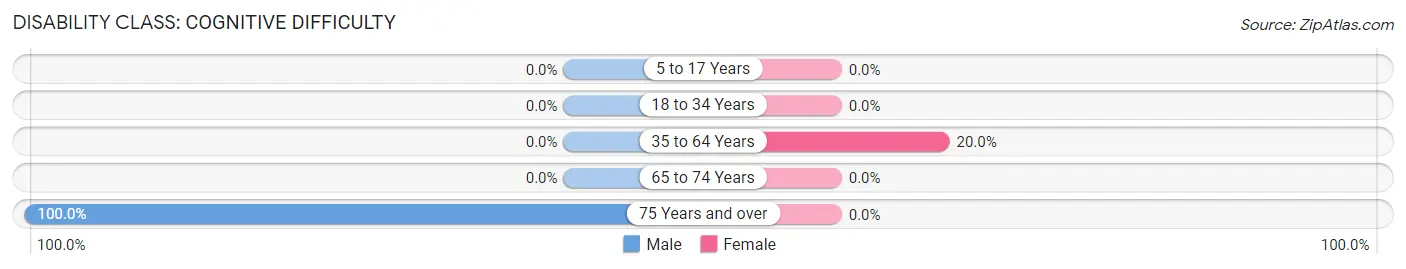
| Age Bracket | Male | Female |
| 5 to 17 Years | 0 (0.0%) | 0 (0.0%) |
| 18 to 34 Years | 0 (0.0%) | 0 (0.0%) |
| 35 to 64 Years | 0 (0.0%) | 1 (20.0%) |
| 65 to 74 Years | 0 (0.0%) | 0 (0.0%) |
| 75 Years and over | 3 (100.0%) | 0 (0.0%) |
Disability Class: Ambulatory Difficulty
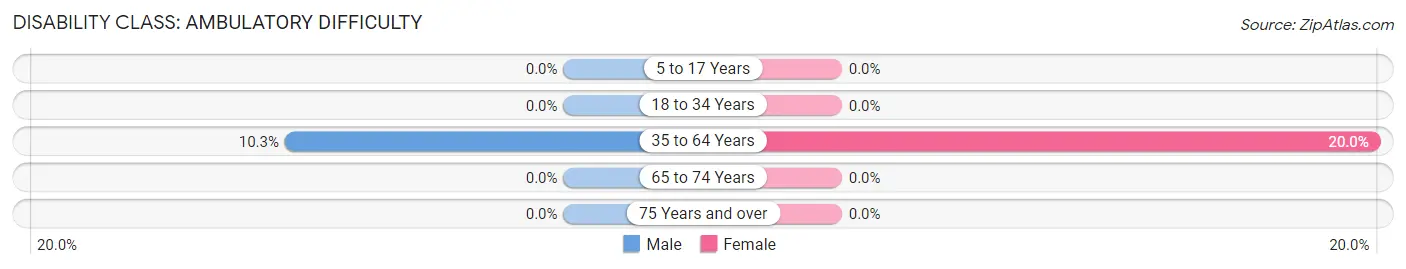
| Age Bracket | Male | Female |
| 5 to 17 Years | 0 (0.0%) | 0 (0.0%) |
| 18 to 34 Years | 0 (0.0%) | 0 (0.0%) |
| 35 to 64 Years | 3 (10.3%) | 1 (20.0%) |
| 65 to 74 Years | 0 (0.0%) | 0 (0.0%) |
| 75 Years and over | 0 (0.0%) | 0 (0.0%) |
Disability Class: Self-Care Difficulty
| Age Bracket | Male | Female |
| 5 to 17 Years | 0 (0.0%) | 0 (0.0%) |
| 18 to 34 Years | 0 (0.0%) | 0 (0.0%) |
| 35 to 64 Years | 0 (0.0%) | 0 (0.0%) |
| 65 to 74 Years | 0 (0.0%) | 0 (0.0%) |
| 75 Years and over | 0 (0.0%) | 0 (0.0%) |
Technology Access in Chitina
Computing Device Access in Chitina
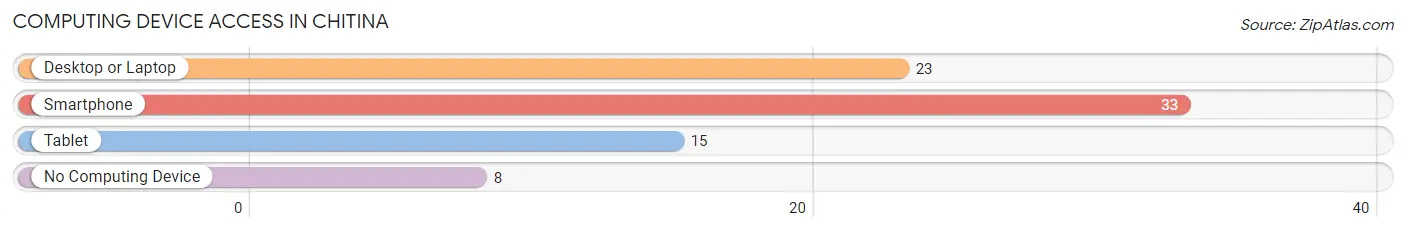
| Device Type | # Households | % Households |
| Desktop or Laptop | 23 | 51.1% |
| Smartphone | 33 | 73.3% |
| Tablet | 15 | 33.3% |
| No Computing Device | 8 | 17.8% |
| Total | 45 | 100.0% |
Internet Access in Chitina
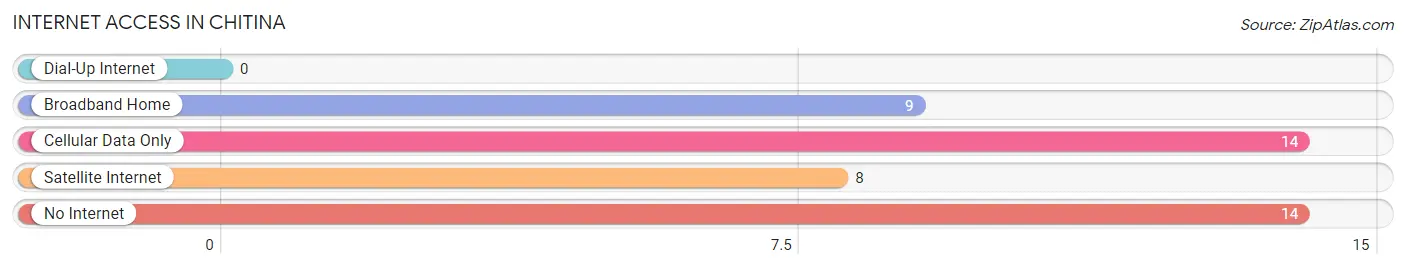
| Internet Type | # Households | % Households |
| Dial-Up Internet | 0 | 0.0% |
| Broadband Home | 9 | 20.0% |
| Cellular Data Only | 14 | 31.1% |
| Satellite Internet | 8 | 17.8% |
| No Internet | 14 | 31.1% |
| Total | 45 | 100.0% |
Chitina Summary
Chitina is a small unincorporated community located in the Copper River Valley of the Wrangell-St. Elias National Park and Preserve in Alaska. It is located at the confluence of the Copper and Chitina Rivers, approximately 100 miles east of the city of Glennallen. The population of Chitina was estimated to be around 100 people in 2020.
History
The area around Chitina has been inhabited by the Ahtna Athabascan people for thousands of years. The Ahtna people have a long history of fishing, hunting, and trading in the Copper River Valley. The first non-Native settlers arrived in the area in the late 1800s, when prospectors began to search for gold and other minerals in the area. The town of Chitina was established in 1902 as a supply center for the miners.
The town grew rapidly in the early 1900s, and by 1910 it had a population of over 500 people. The town was home to a number of businesses, including a general store, a hotel, a saloon, and a post office. The town also had a school, a church, and a hospital.
In the 1920s, the town began to decline as the mining industry in the area began to decline. By the 1940s, the population had dropped to around 100 people. In the 1950s, the town was almost abandoned, but it was revived in the 1960s when the Trans-Alaska Pipeline was built nearby. The pipeline brought new jobs and economic opportunities to the area, and the population of Chitina began to grow again.
Geography
Chitina is located in the Copper River Valley of the Wrangell-St. Elias National Park and Preserve in Alaska. The town is situated at the confluence of the Copper and Chitina Rivers, approximately 100 miles east of the city of Glennallen. The town is surrounded by mountains and is located in a valley that is approximately 10 miles wide and 20 miles long.
The climate in Chitina is generally cold and dry, with temperatures ranging from -20°F in the winter to 70°F in the summer. The area receives an average of 20 inches of precipitation per year, mostly in the form of snow.
Economy
The economy of Chitina is largely based on tourism and subsistence activities. The town is a popular destination for tourists who come to visit the nearby Wrangell-St. Elias National Park and Preserve. The park is home to a variety of wildlife, including bears, moose, caribou, and Dall sheep.
The town is also home to a number of subsistence activities, such as fishing, hunting, and berry picking. The Copper River is a popular destination for fishing, and the area is also home to a number of hunting and trapping opportunities.
Demographics
The population of Chitina was estimated to be around 100 people in 2020. The town is predominantly white, with a small Native American population. The median household income in Chitina is $45,000, and the median home value is $150,000. The town has a high rate of poverty, with over 25% of the population living below the poverty line.
Common Questions
What is Per Capita Income in Chitina?
Per Capita income in Chitina is $26,383.
What is Inequality or Gini Index in Chitina?
Inequality or Gini Index in Chitina is 0.64.
What is the Total Population of Chitina?
Total Population of Chitina is 71.
What is the Total Male Population of Chitina?
Total Male Population of Chitina is 46.
What is the Total Female Population of Chitina?
Total Female Population of Chitina is 25.
What is the Ratio of Males per 100 Females in Chitina?
There are 184.00 Males per 100 Females in Chitina.
What is the Ratio of Females per 100 Males in Chitina?
There are 54.35 Females per 100 Males in Chitina.
What is the Median Population Age in Chitina?
Median Population Age in Chitina is 46.5 Years.
What is the Average Family Size in Chitina
Average Family Size in Chitina is 2.5 People.
What is the Average Household Size in Chitina
Average Household Size in Chitina is 1.6 People.
How Large is the Labor Force in Chitina?
There are 19 People in the Labor Forcein in Chitina.
What is the Percentage of People in the Labor Force in Chitina?
35.8% of People are in the Labor Force in Chitina.