Central, AK Map & Demographics
Central Map
Central Overview
$21,601
PER CAPITA INCOME
$16,379
AVG HOUSEHOLD INCOME
0.54
INEQUALITY / GINI INDEX
105
TOTAL POPULATION
57
MALE POPULATION
48
FEMALE POPULATION
118.75
MALES / 100 FEMALES
84.21
FEMALES / 100 MALES
56.7
MEDIAN AGE
8.0
AVG FAMILY SIZE
1.9
AVG HOUSEHOLD SIZE
33
LABOR FORCE [ PEOPLE ]
39.3%
PERCENT IN LABOR FORCE
Central Zip Codes
Central Area Codes
Income in Central
Income Overview in Central
| Characteristic | Number | Measure |
| Per Capita Income | 105 | $21,601 |
| Median Family Income | 7 | $0 |
| Mean Family Income | 7 | $0 |
| Median Household Income | 56 | $16,379 |
| Mean Household Income | 56 | $33,684 |
| Income Deficit | 7 | $0 |
| Wage / Income Gap (%) | 105 | 0.00% |
| Wage / Income Gap ($) | 105 | 100.00¢ per $1 |
| Gini / Inequality Index | 105 | 0.54 |
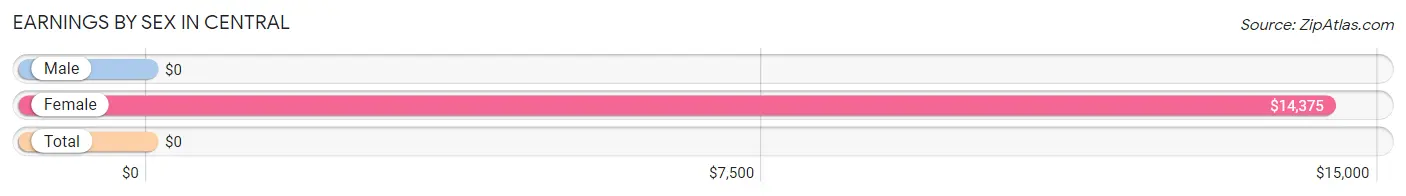
Earnings by Sex in Central
| Sex | Number | Average Earnings |
| Male | 5 (15.1%) | $0 |
| Female | 28 (84.9%) | $14,375 |
| Total | 33 (100.0%) | $0 |
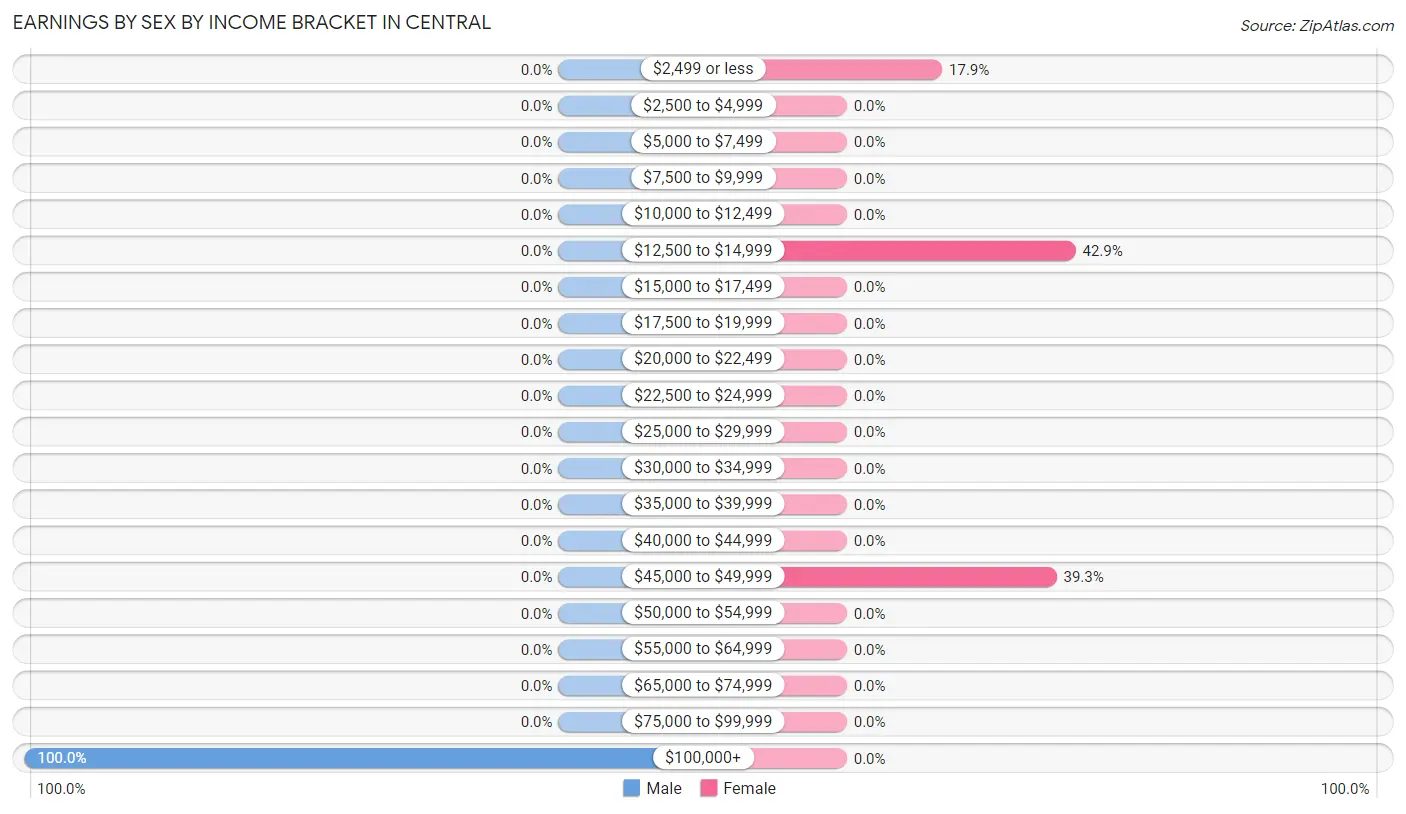
Earnings by Sex by Income Bracket in Central
The most common earnings brackets in Central are $100,000+ for men (5 | 100.0%) and $12,500 to $14,999 for women (12 | 42.9%).
| Income | Male | Female |
| $2,499 or less | 0 (0.0%) | 5 (17.9%) |
| $2,500 to $4,999 | 0 (0.0%) | 0 (0.0%) |
| $5,000 to $7,499 | 0 (0.0%) | 0 (0.0%) |
| $7,500 to $9,999 | 0 (0.0%) | 0 (0.0%) |
| $10,000 to $12,499 | 0 (0.0%) | 0 (0.0%) |
| $12,500 to $14,999 | 0 (0.0%) | 12 (42.9%) |
| $15,000 to $17,499 | 0 (0.0%) | 0 (0.0%) |
| $17,500 to $19,999 | 0 (0.0%) | 0 (0.0%) |
| $20,000 to $22,499 | 0 (0.0%) | 0 (0.0%) |
| $22,500 to $24,999 | 0 (0.0%) | 0 (0.0%) |
| $25,000 to $29,999 | 0 (0.0%) | 0 (0.0%) |
| $30,000 to $34,999 | 0 (0.0%) | 0 (0.0%) |
| $35,000 to $39,999 | 0 (0.0%) | 0 (0.0%) |
| $40,000 to $44,999 | 0 (0.0%) | 0 (0.0%) |
| $45,000 to $49,999 | 0 (0.0%) | 11 (39.3%) |
| $50,000 to $54,999 | 0 (0.0%) | 0 (0.0%) |
| $55,000 to $64,999 | 0 (0.0%) | 0 (0.0%) |
| $65,000 to $74,999 | 0 (0.0%) | 0 (0.0%) |
| $75,000 to $99,999 | 0 (0.0%) | 0 (0.0%) |
| $100,000+ | 5 (100.0%) | 0 (0.0%) |
| Total | 5 (100.0%) | 28 (100.0%) |
Earnings by Sex by Educational Attainment in Central
| Educational Attainment | Male Income | Female Income |
| Less than High School | - | - |
| High School Diploma | - | - |
| College or Associate's Degree | - | - |
| Bachelor's Degree | - | - |
| Graduate Degree | - | - |
| Total | - | - |
Family Income in Central
Family Income Brackets in Central
According to the Central family income data, there are 5 families falling into the $150,000 to $199,999 income range, which is the most common income bracket and makes up 71.4% of all families.
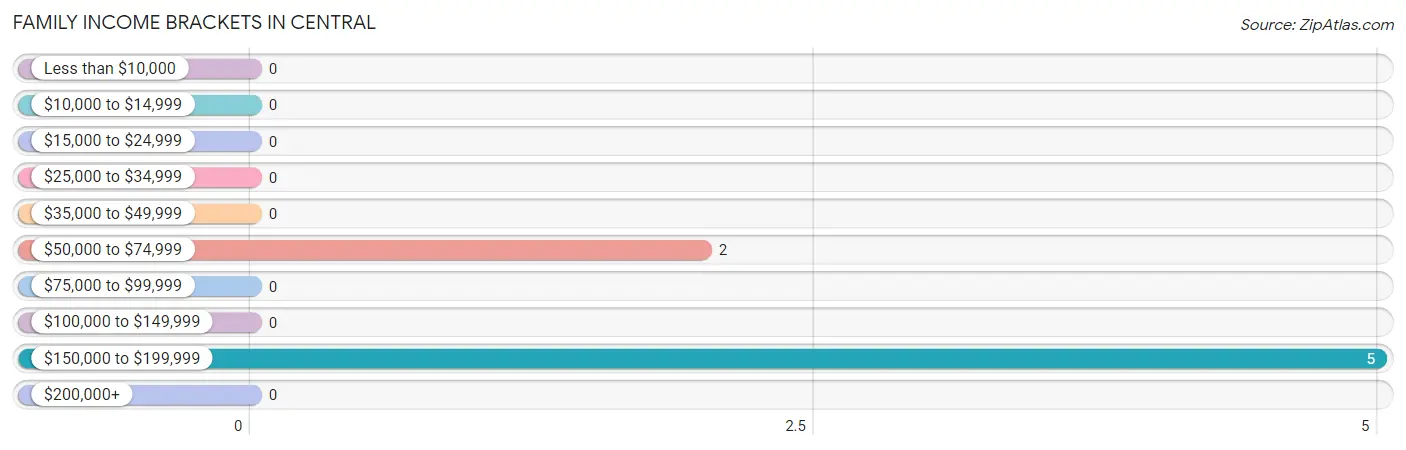
| Income Bracket | # Families | % Families |
| Less than $10,000 | 0 | 0.0% |
| $10,000 to $14,999 | 0 | 0.0% |
| $15,000 to $24,999 | 0 | 0.0% |
| $25,000 to $34,999 | 0 | 0.0% |
| $35,000 to $49,999 | 0 | 0.0% |
| $50,000 to $74,999 | 2 | 28.6% |
| $75,000 to $99,999 | 0 | 0.0% |
| $100,000 to $149,999 | 0 | 0.0% |
| $150,000 to $199,999 | 5 | 71.4% |
| $200,000+ | 0 | 0.0% |
Family Income by Famaliy Size in Central
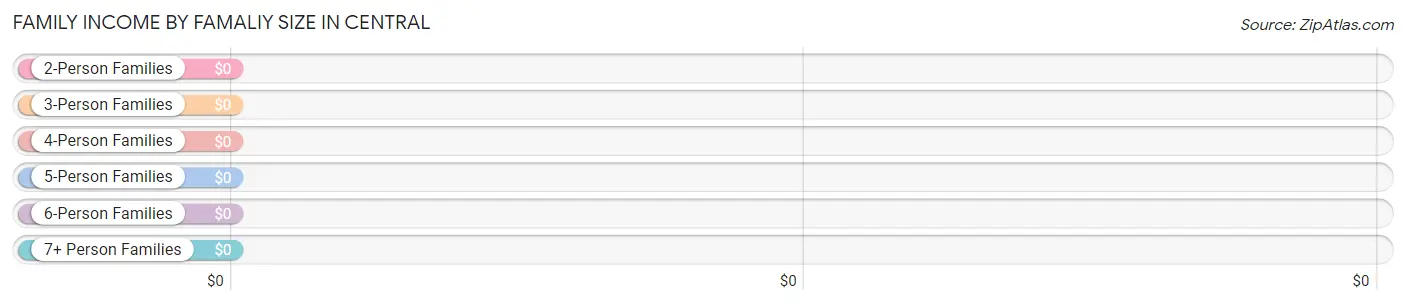
| Income Bracket | # Families | Median Income |
| 2-Person Families | 2 (28.6%) | $0 |
| 3-Person Families | 0 (0.0%) | $0 |
| 4-Person Families | 0 (0.0%) | $0 |
| 5-Person Families | 5 (71.4%) | $0 |
| 6-Person Families | 0 (0.0%) | $0 |
| 7+ Person Families | 0 (0.0%) | $0 |
| Total | 7 (100.0%) | $0 |
Family Income by Number of Earners in Central
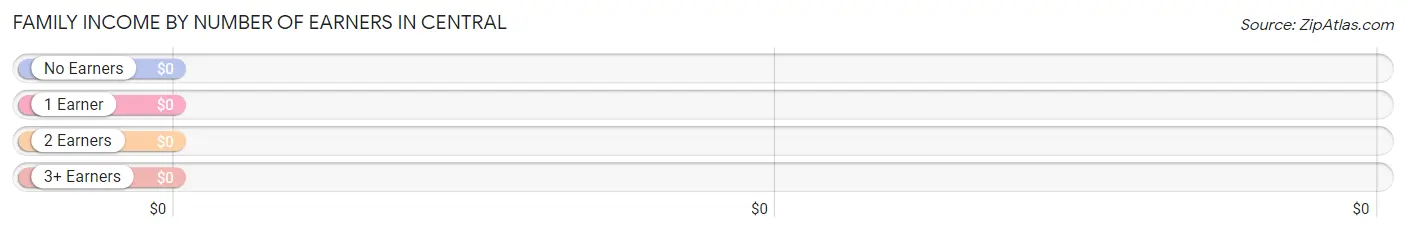
| Number of Earners | # Families | Median Income |
| No Earners | 0 (0.0%) | $0 |
| 1 Earner | 2 (28.6%) | $0 |
| 2 Earners | 0 (0.0%) | $0 |
| 3+ Earners | 5 (71.4%) | $0 |
| Total | 7 (100.0%) | $0 |
Household Income in Central
Household Income Brackets in Central
With 32 households falling in the category, the $15,000 to $24,999 income range is the most frequent in Central, accounting for 57.1% of all households.
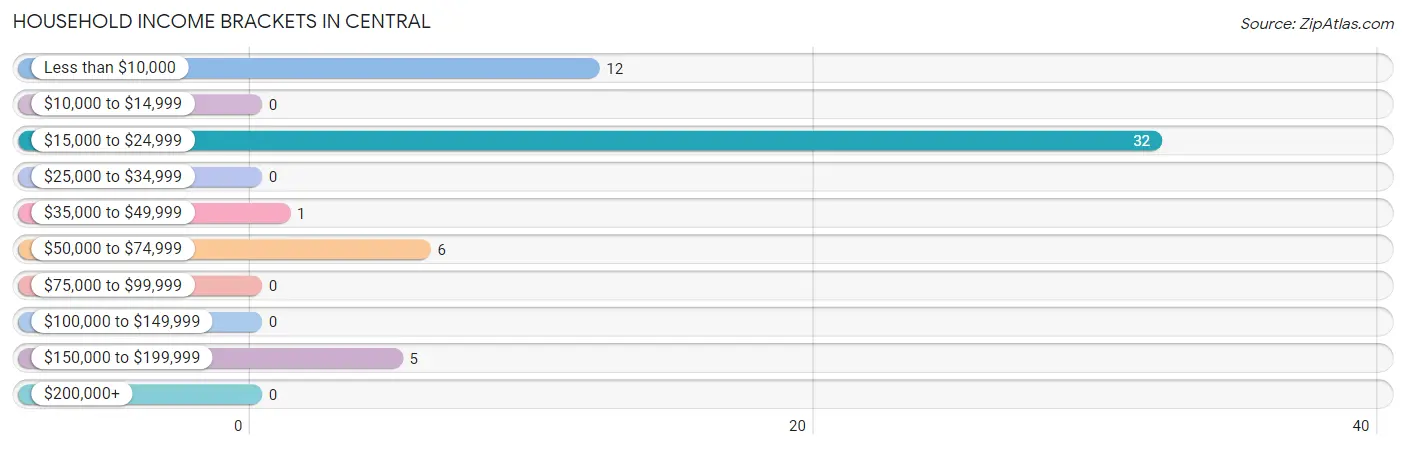
| Income Bracket | # Households | % Households |
| Less than $10,000 | 12 | 21.4% |
| $10,000 to $14,999 | 0 | 0.0% |
| $15,000 to $24,999 | 32 | 57.1% |
| $25,000 to $34,999 | 0 | 0.0% |
| $35,000 to $49,999 | 1 | 1.8% |
| $50,000 to $74,999 | 6 | 10.7% |
| $75,000 to $99,999 | 0 | 0.0% |
| $100,000 to $149,999 | 0 | 0.0% |
| $150,000 to $199,999 | 5 | 8.9% |
| $200,000+ | 0 | 0.0% |
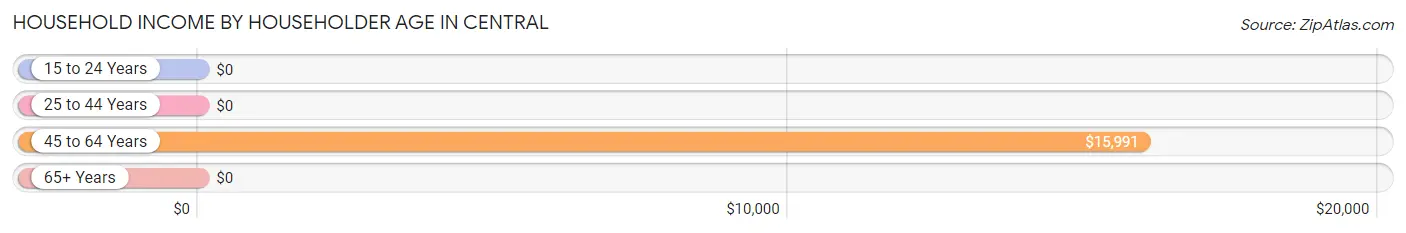
Household Income by Householder Age in Central
The median household income in Central is $16,379, with the highest median household income of $15,991 found in the 45 to 64 years age bracket for the primary householder. A total of 39 households (69.6%) fall into this category.
| Income Bracket | # Households | Median Income |
| 15 to 24 Years | 0 (0.0%) | $0 |
| 25 to 44 Years | 5 (8.9%) | $0 |
| 45 to 64 Years | 39 (69.6%) | $15,991 |
| 65+ Years | 12 (21.4%) | $0 |
| Total | 56 (100.0%) | $16,379 |
Poverty in Central
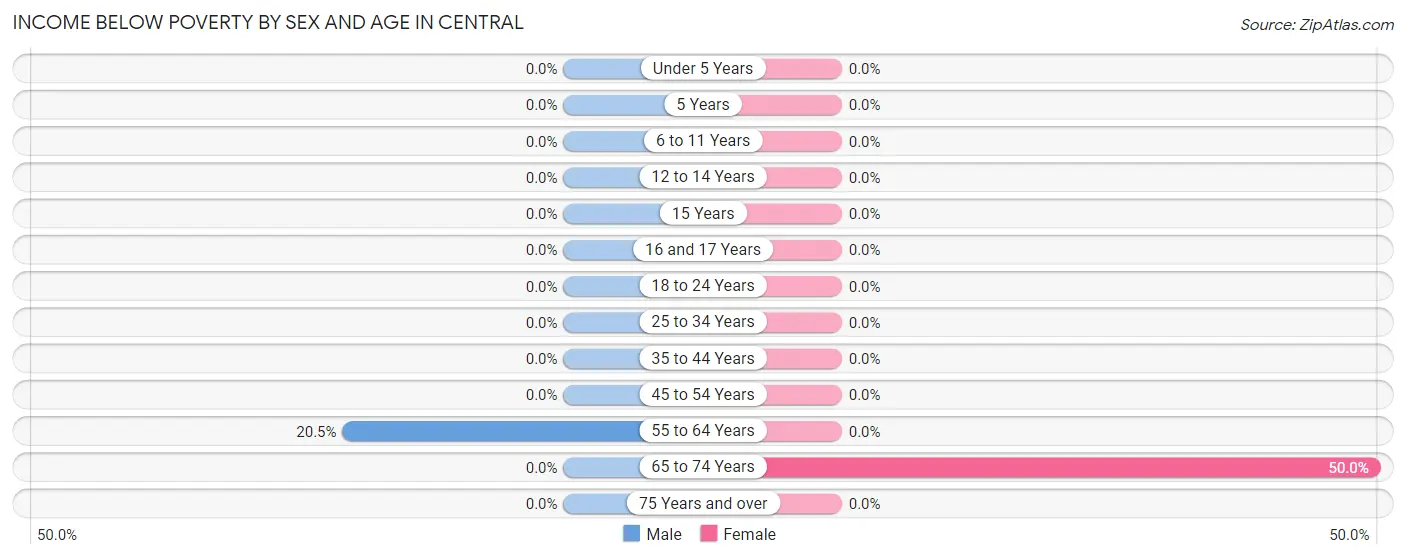
Income Below Poverty by Sex and Age in Central
With 14.0% poverty level for males and 8.3% for females among the residents of Central, 55 to 64 year old males and 65 to 74 year old females are the most vulnerable to poverty, with 8 males (20.5%) and 4 females (50.0%) in their respective age groups living below the poverty level.
| Age Bracket | Male | Female |
| Under 5 Years | 0 (0.0%) | 0 (0.0%) |
| 5 Years | 0 (0.0%) | 0 (0.0%) |
| 6 to 11 Years | 0 (0.0%) | 0 (0.0%) |
| 12 to 14 Years | 0 (0.0%) | 0 (0.0%) |
| 15 Years | 0 (0.0%) | 0 (0.0%) |
| 16 and 17 Years | 0 (0.0%) | 0 (0.0%) |
| 18 to 24 Years | 0 (0.0%) | 0 (0.0%) |
| 25 to 34 Years | 0 (0.0%) | 0 (0.0%) |
| 35 to 44 Years | 0 (0.0%) | 0 (0.0%) |
| 45 to 54 Years | 0 (0.0%) | 0 (0.0%) |
| 55 to 64 Years | 8 (20.5%) | 0 (0.0%) |
| 65 to 74 Years | 0 (0.0%) | 4 (50.0%) |
| 75 Years and over | 0 (0.0%) | 0 (0.0%) |
| Total | 8 (14.0%) | 4 (8.3%) |
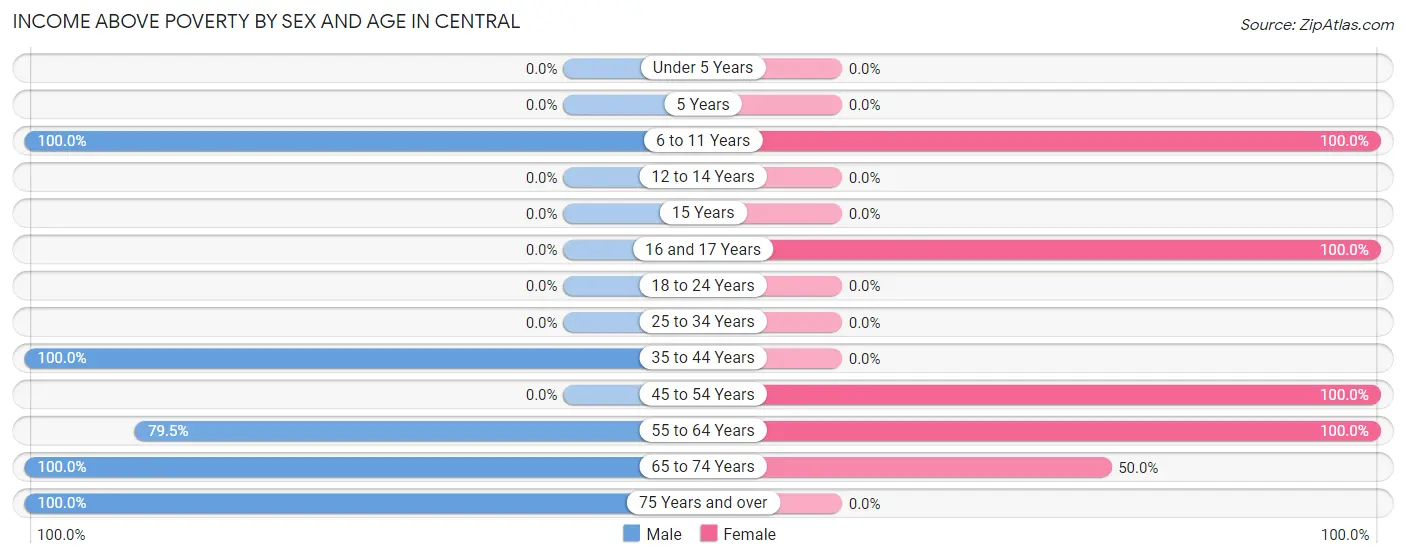
Income Above Poverty by Sex and Age in Central
According to the poverty statistics in Central, males aged 6 to 11 years and females aged 6 to 11 years are the age groups that are most secure financially, with 100.0% of males and 100.0% of females in these age groups living above the poverty line.
| Age Bracket | Male | Female |
| Under 5 Years | 0 (0.0%) | 0 (0.0%) |
| 5 Years | 0 (0.0%) | 0 (0.0%) |
| 6 to 11 Years | 9 (100.0%) | 12 (100.0%) |
| 12 to 14 Years | 0 (0.0%) | 0 (0.0%) |
| 15 Years | 0 (0.0%) | 0 (0.0%) |
| 16 and 17 Years | 0 (0.0%) | 12 (100.0%) |
| 18 to 24 Years | 0 (0.0%) | 0 (0.0%) |
| 25 to 34 Years | 0 (0.0%) | 0 (0.0%) |
| 35 to 44 Years | 5 (100.0%) | 0 (0.0%) |
| 45 to 54 Years | 0 (0.0%) | 11 (100.0%) |
| 55 to 64 Years | 31 (79.5%) | 5 (100.0%) |
| 65 to 74 Years | 2 (100.0%) | 4 (50.0%) |
| 75 Years and over | 2 (100.0%) | 0 (0.0%) |
| Total | 49 (86.0%) | 44 (91.7%) |
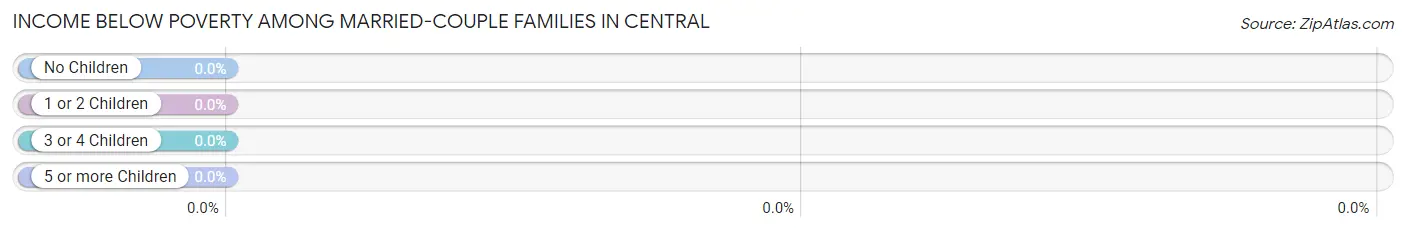
Income Below Poverty Among Married-Couple Families in Central
| Children | Above Poverty | Below Poverty |
| No Children | 2 (100.0%) | 0 (0.0%) |
| 1 or 2 Children | 0 (0.0%) | 0 (0.0%) |
| 3 or 4 Children | 5 (100.0%) | 0 (0.0%) |
| 5 or more Children | 0 (0.0%) | 0 (0.0%) |
| Total | 7 (100.0%) | 0 (0.0%) |
Income Below Poverty Among Single-Parent Households in Central
| Children | Single Father | Single Mother |
| No Children | 0 (0.0%) | 0 (0.0%) |
| 1 or 2 Children | 0 (0.0%) | 0 (0.0%) |
| 3 or 4 Children | 0 (0.0%) | 0 (0.0%) |
| 5 or more Children | 0 (0.0%) | 0 (0.0%) |
| Total | 0 (0.0%) | 0 (0.0%) |
Income Below Poverty Among Married-Couple vs Single-Parent Households in Central
| Children | Married-Couple Families | Single-Parent Households |
| No Children | 0 (0.0%) | 0 (0.0%) |
| 1 or 2 Children | 0 (0.0%) | 0 (0.0%) |
| 3 or 4 Children | 0 (0.0%) | 0 (0.0%) |
| 5 or more Children | 0 (0.0%) | 0 (0.0%) |
| Total | 0 (0.0%) | 0 (0.0%) |
Race in Central
The most populous races in Central are , and White / Caucasian (105 | 100.0%).
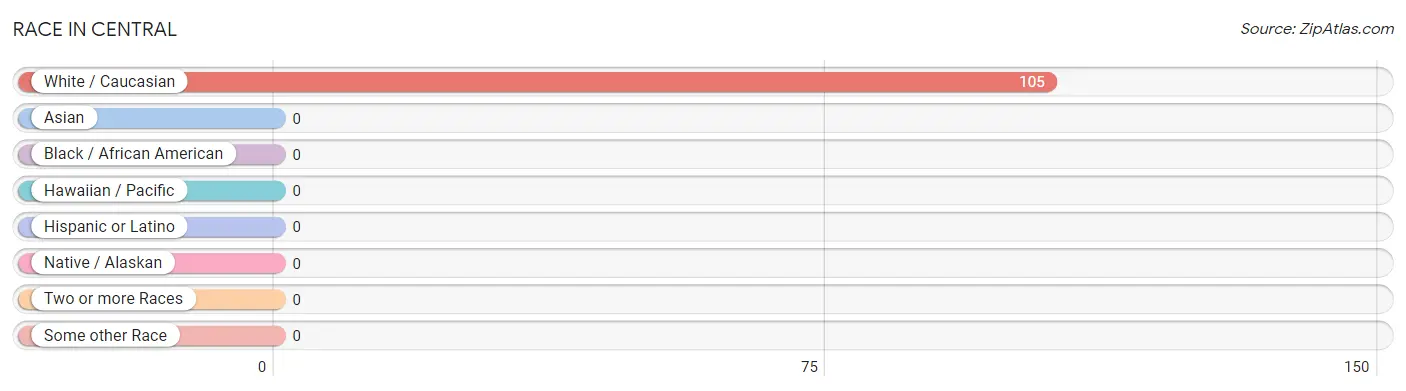
| Race | # Population | % Population |
| Asian | 0 | 0.0% |
| Black / African American | 0 | 0.0% |
| Hawaiian / Pacific | 0 | 0.0% |
| Hispanic or Latino | 0 | 0.0% |
| Native / Alaskan | 0 | 0.0% |
| White / Caucasian | 105 | 100.0% |
| Two or more Races | 0 | 0.0% |
| Some other Race | 0 | 0.0% |
| Total | 105 | 100.0% |
Ancestry in Central
The most populous ancestries reported in Central are German (60 | 57.1%), Dutch (37 | 35.2%), Swedish (29 | 27.6%), and Irish (5 | 4.8%), together accounting for 124.8% of all Central residents.
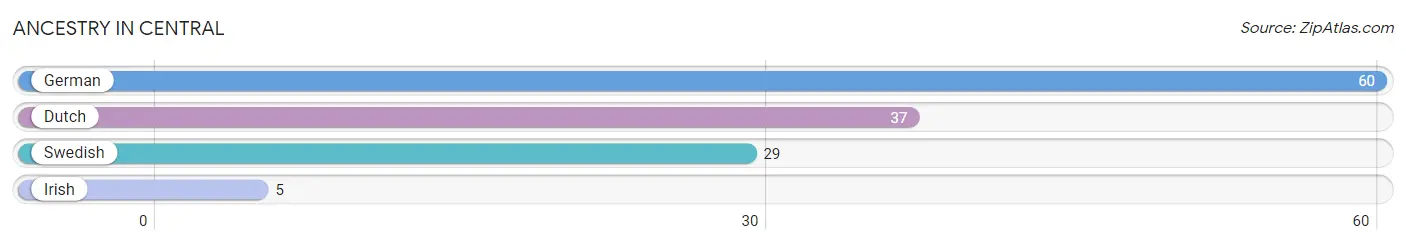
| Ancestry | # Population | % Population |
| Dutch | 37 | 35.2% |
| German | 60 | 57.1% |
| Irish | 5 | 4.8% |
| Swedish | 29 | 27.6% | View All 4 Rows |
Immigrants in Central

| Immigration Origin | # Population | % Population | View All 0 Rows |
Sex and Age in Central
Sex and Age in Central
The most populous age groups in Central are 60 to 64 Years (37 | 64.9%) for men and 10 to 14 Years (12 | 25.0%) for women.
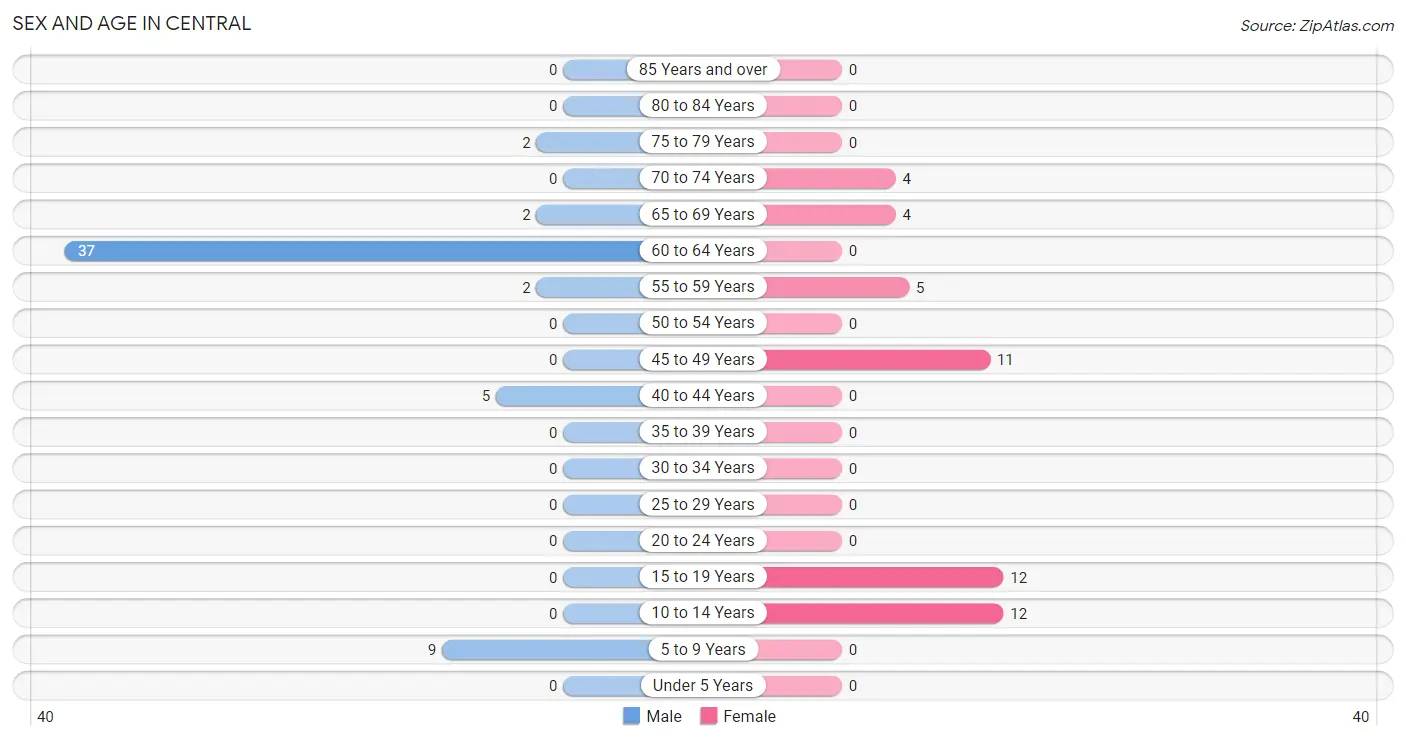
| Age Bracket | Male | Female |
| Under 5 Years | 0 (0.0%) | 0 (0.0%) |
| 5 to 9 Years | 9 (15.8%) | 0 (0.0%) |
| 10 to 14 Years | 0 (0.0%) | 12 (25.0%) |
| 15 to 19 Years | 0 (0.0%) | 12 (25.0%) |
| 20 to 24 Years | 0 (0.0%) | 0 (0.0%) |
| 25 to 29 Years | 0 (0.0%) | 0 (0.0%) |
| 30 to 34 Years | 0 (0.0%) | 0 (0.0%) |
| 35 to 39 Years | 0 (0.0%) | 0 (0.0%) |
| 40 to 44 Years | 5 (8.8%) | 0 (0.0%) |
| 45 to 49 Years | 0 (0.0%) | 11 (22.9%) |
| 50 to 54 Years | 0 (0.0%) | 0 (0.0%) |
| 55 to 59 Years | 2 (3.5%) | 5 (10.4%) |
| 60 to 64 Years | 37 (64.9%) | 0 (0.0%) |
| 65 to 69 Years | 2 (3.5%) | 4 (8.3%) |
| 70 to 74 Years | 0 (0.0%) | 4 (8.3%) |
| 75 to 79 Years | 2 (3.5%) | 0 (0.0%) |
| 80 to 84 Years | 0 (0.0%) | 0 (0.0%) |
| 85 Years and over | 0 (0.0%) | 0 (0.0%) |
| Total | 57 (100.0%) | 48 (100.0%) |
Families and Households in Central
Median Family Size in Central
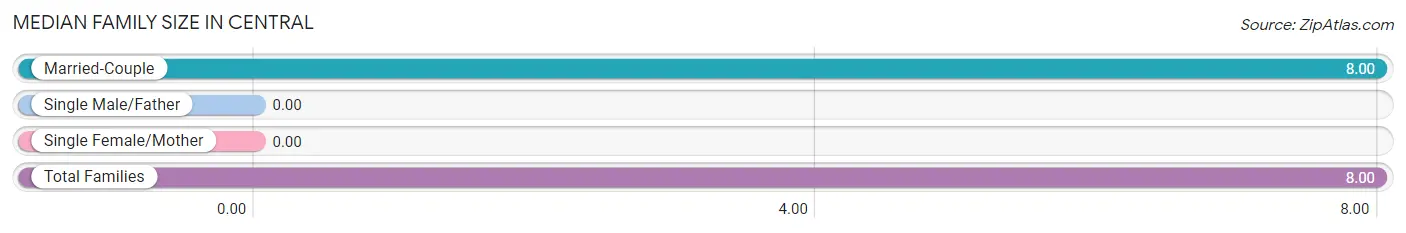
| Family Type | # Families | Family Size |
| Married-Couple | 7 (100.0%) | 8.00 |
| Single Male/Father | 0 (0.0%) | - |
| Single Female/Mother | 0 (0.0%) | - |
| Total Families | 7 (100.0%) | 8.00 |
Median Household Size in Central
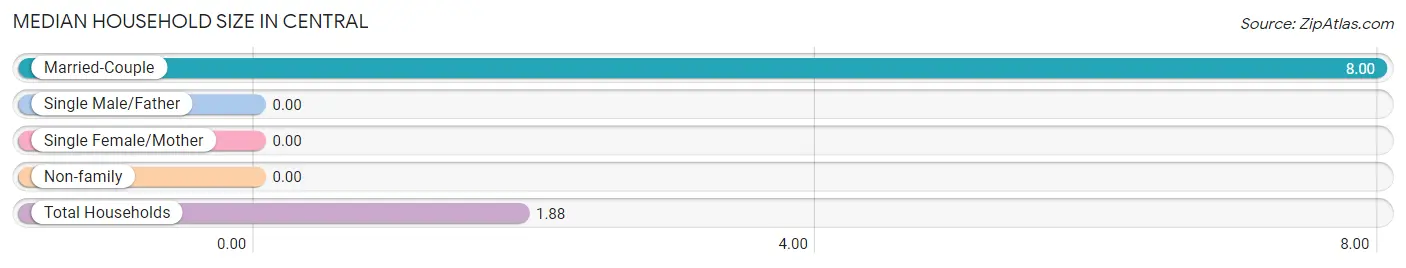
| Household Type | # Households | Household Size |
| Married-Couple | 7 (12.5%) | 8.00 |
| Single Male/Father | 0 (0.0%) | - |
| Single Female/Mother | 0 (0.0%) | - |
| Non-family | 49 (87.5%) | - |
| Total Households | 56 (100.0%) | 1.88 |
Household Size by Marriage Status in Central
Out of a total of 56 households in Central, 7 (12.5%) are family households, while 49 (87.5%) are nonfamily households. The most numerous type of family households are 5-person households, comprising 5, and the most common type of nonfamily households are 1-person households, comprising 49.
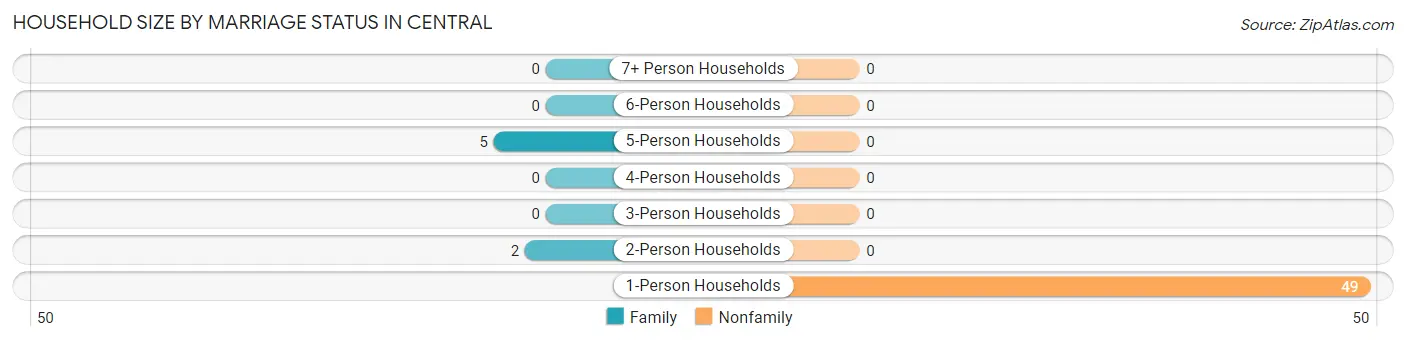
| Household Size | Family Households | Nonfamily Households |
| 1-Person Households | - | 49 (87.5%) |
| 2-Person Households | 2 (3.6%) | 0 (0.0%) |
| 3-Person Households | 0 (0.0%) | 0 (0.0%) |
| 4-Person Households | 0 (0.0%) | 0 (0.0%) |
| 5-Person Households | 5 (8.9%) | 0 (0.0%) |
| 6-Person Households | 0 (0.0%) | 0 (0.0%) |
| 7+ Person Households | 0 (0.0%) | 0 (0.0%) |
| Total | 7 (12.5%) | 49 (87.5%) |
Female Fertility in Central
Fertility by Age in Central
| Age Bracket | Women with Births | Births / 1,000 Women |
| 15 to 19 years | 0 (0.0%) | 0.0 |
| 20 to 34 years | 0 (0.0%) | 0.0 |
| 35 to 50 years | 0 (0.0%) | 0.0 |
| Total | 0 (0.0%) | 0.0 |
Fertility by Age by Marriage Status in Central
| Age Bracket | Married | Unmarried |
| 15 to 19 years | 0 (0.0%) | 0 (0.0%) |
| 20 to 34 years | 0 (0.0%) | 0 (0.0%) |
| 35 to 50 years | 0 (0.0%) | 0 (0.0%) |
| Total | 0 (0.0%) | 0 (0.0%) |
Fertility by Education in Central
| Educational Attainment | Women with Births | Births / 1,000 Women |
| Less than High School | 0 (0.0%) | 0.0 |
| High School Diploma | 0 (0.0%) | 0.0 |
| College or Associate's Degree | 0 (0.0%) | 0.0 |
| Bachelor's Degree | 0 (0.0%) | 0.0 |
| Graduate Degree | 0 (0.0%) | 0.0 |
| Total | 0 (0.0%) | 0.0 |
Fertility by Education by Marriage Status in Central
| Educational Attainment | Married | Unmarried |
| Less than High School | 0 (0.0%) | 0 (0.0%) |
| High School Diploma | 0 (0.0%) | 0 (0.0%) |
| College or Associate's Degree | 0 (0.0%) | 0 (0.0%) |
| Bachelor's Degree | 0 (0.0%) | 0 (0.0%) |
| Graduate Degree | 0 (0.0%) | 0 (0.0%) |
| Total | 0 (0.0%) | 0 (0.0%) |
Employment Characteristics in Central
Employment by Class of Employer in Central
Among the 33 employed individuals in Central, self-employed (incorporated) (16 | 48.5%), unpaid family workers (12 | 36.4%), and state government employees (5 | 15.1%) make up the most common classes of employment.
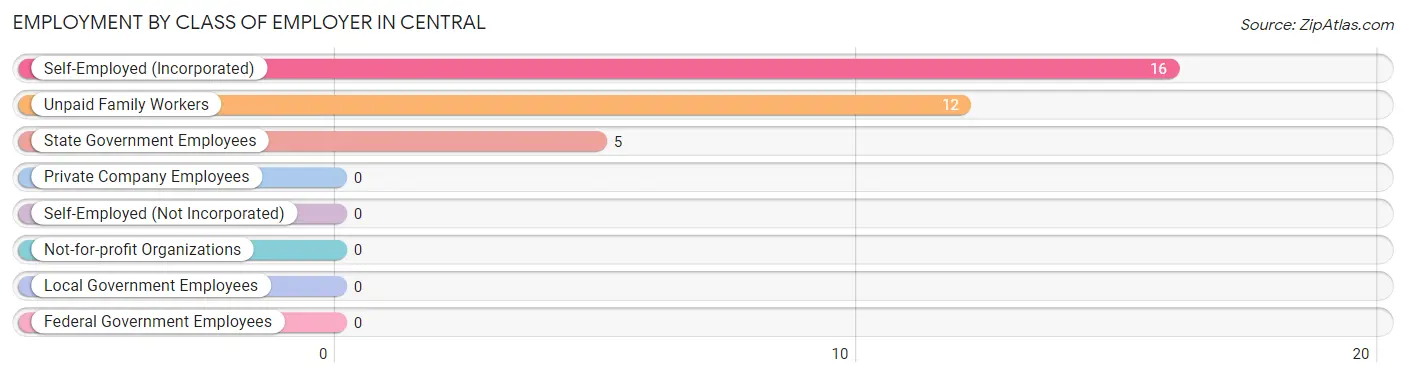
| Employer Class | # Employees | % Employees |
| Private Company Employees | 0 | 0.0% |
| Self-Employed (Incorporated) | 16 | 48.5% |
| Self-Employed (Not Incorporated) | 0 | 0.0% |
| Not-for-profit Organizations | 0 | 0.0% |
| Local Government Employees | 0 | 0.0% |
| State Government Employees | 5 | 15.1% |
| Federal Government Employees | 0 | 0.0% |
| Unpaid Family Workers | 12 | 36.4% |
| Total | 33 | 100.0% |
Employment Status by Age in Central
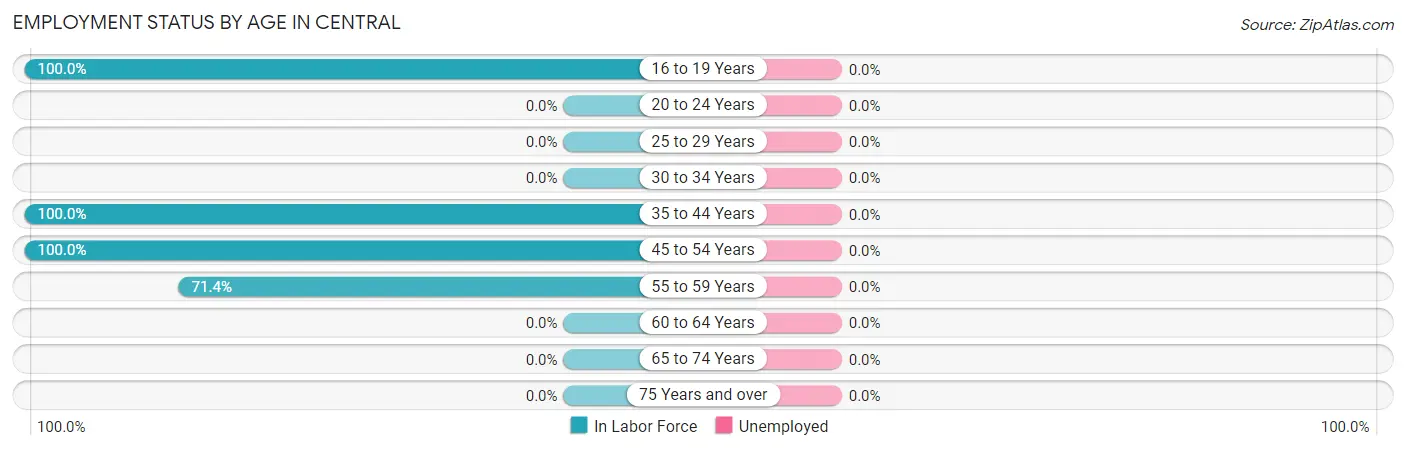
| Age Bracket | In Labor Force | Unemployed |
| 16 to 19 Years | 12 (100.0%) | 0 (0.0%) |
| 20 to 24 Years | 0 (0.0%) | 0 (0.0%) |
| 25 to 29 Years | 0 (0.0%) | 0 (0.0%) |
| 30 to 34 Years | 0 (0.0%) | 0 (0.0%) |
| 35 to 44 Years | 5 (100.0%) | 0 (0.0%) |
| 45 to 54 Years | 11 (100.0%) | 0 (0.0%) |
| 55 to 59 Years | 5 (71.4%) | 0 (0.0%) |
| 60 to 64 Years | 0 (0.0%) | 0 (0.0%) |
| 65 to 74 Years | 0 (0.0%) | 0 (0.0%) |
| 75 Years and over | 0 (0.0%) | 0 (0.0%) |
| Total | 33 (39.3%) | 0 (0.0%) |
Employment Status by Educational Attainment in Central
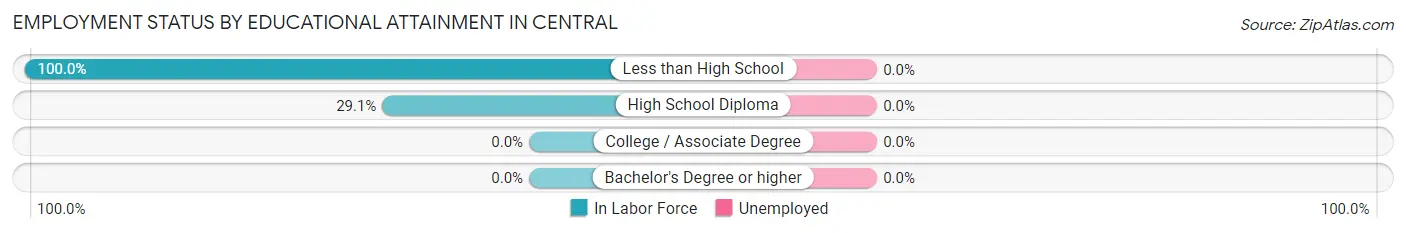
| Educational Attainment | In Labor Force | Unemployed |
| Less than High School | 5 (100.0%) | 0 (0.0%) |
| High School Diploma | 16 (29.1%) | 0 (0.0%) |
| College / Associate Degree | 0 (0.0%) | 0 (0.0%) |
| Bachelor's Degree or higher | 0 (0.0%) | 0 (0.0%) |
| Total | 21 (35.0%) | 0 (0.0%) |
Employment Occupations by Sex in Central
Management, Business, Science and Arts Occupations
The most common Management, Business, Science and Arts occupations in Central are , and Management (5 | 15.1%).
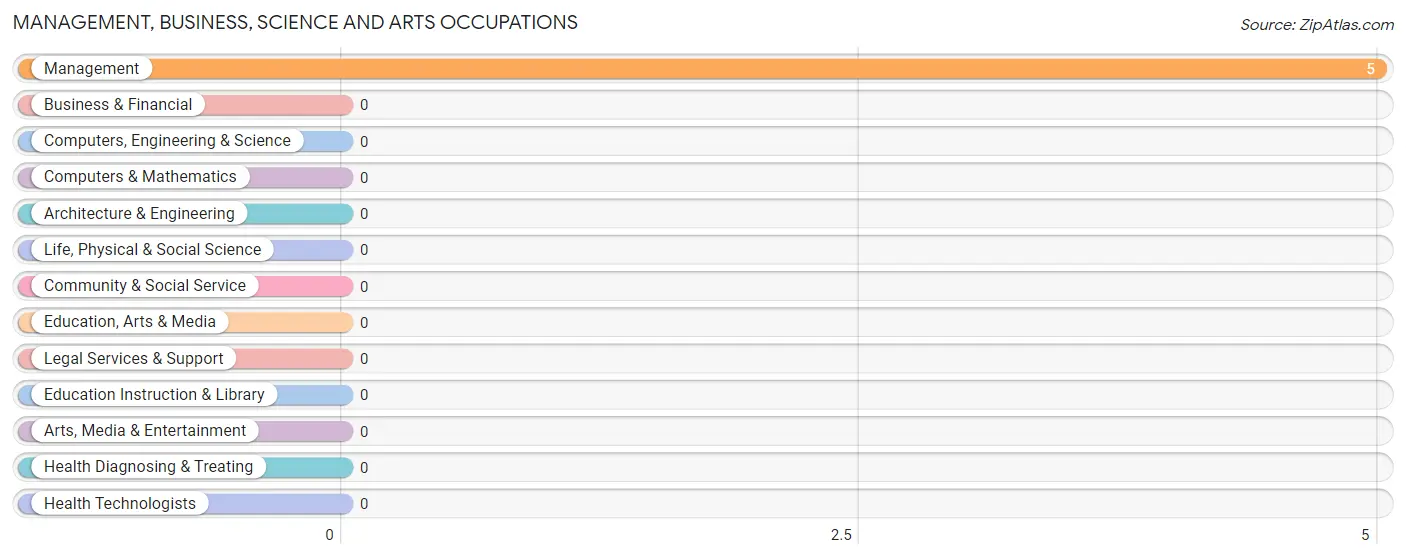
Management, Business, Science and Arts Occupations by Sex
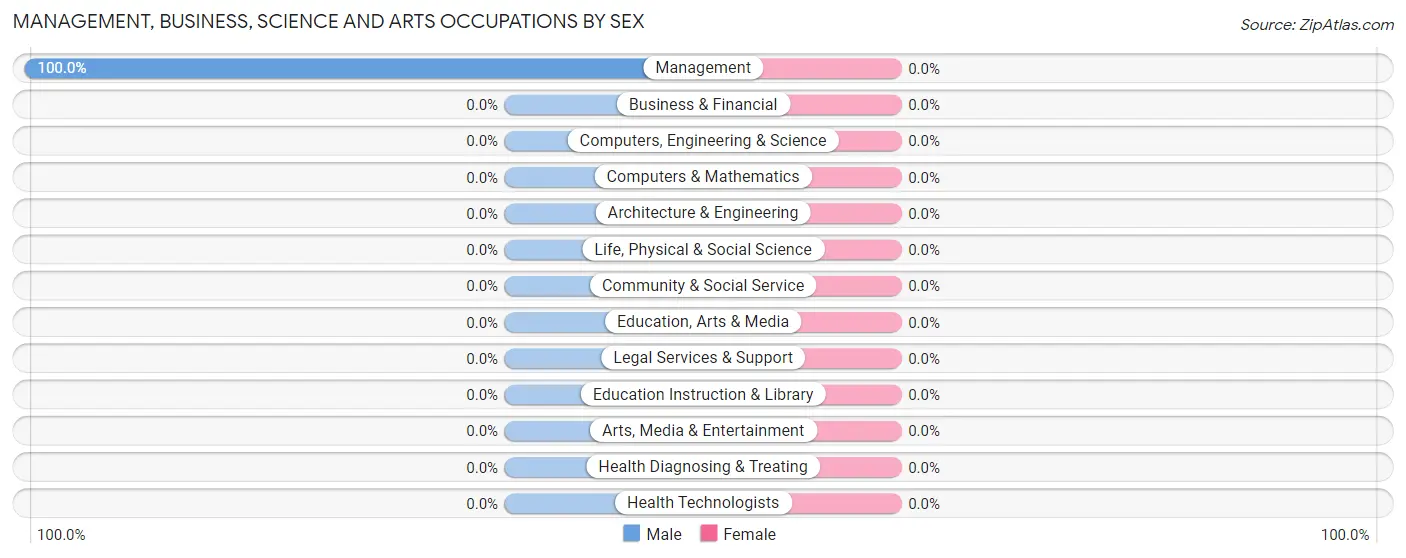
| Occupation | Male | Female |
| Management | 5 (100.0%) | 0 (0.0%) |
| Business & Financial | 0 (0.0%) | 0 (0.0%) |
| Computers, Engineering & Science | 0 (0.0%) | 0 (0.0%) |
| Computers & Mathematics | 0 (0.0%) | 0 (0.0%) |
| Architecture & Engineering | 0 (0.0%) | 0 (0.0%) |
| Life, Physical & Social Science | 0 (0.0%) | 0 (0.0%) |
| Community & Social Service | 0 (0.0%) | 0 (0.0%) |
| Education, Arts & Media | 0 (0.0%) | 0 (0.0%) |
| Legal Services & Support | 0 (0.0%) | 0 (0.0%) |
| Education Instruction & Library | 0 (0.0%) | 0 (0.0%) |
| Arts, Media & Entertainment | 0 (0.0%) | 0 (0.0%) |
| Health Diagnosing & Treating | 0 (0.0%) | 0 (0.0%) |
| Health Technologists | 0 (0.0%) | 0 (0.0%) |
| Total (Category) | 5 (100.0%) | 0 (0.0%) |
| Total (Overall) | 5 (15.1%) | 28 (84.9%) |
Services Occupations
The most common Services occupations in Central are , and Food Preparation & Serving (5 | 15.1%).
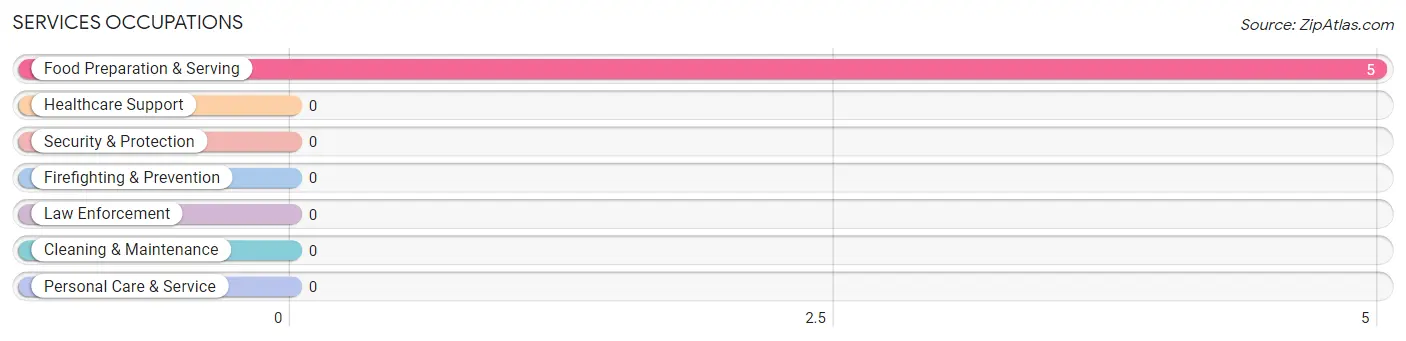
Services Occupations by Sex
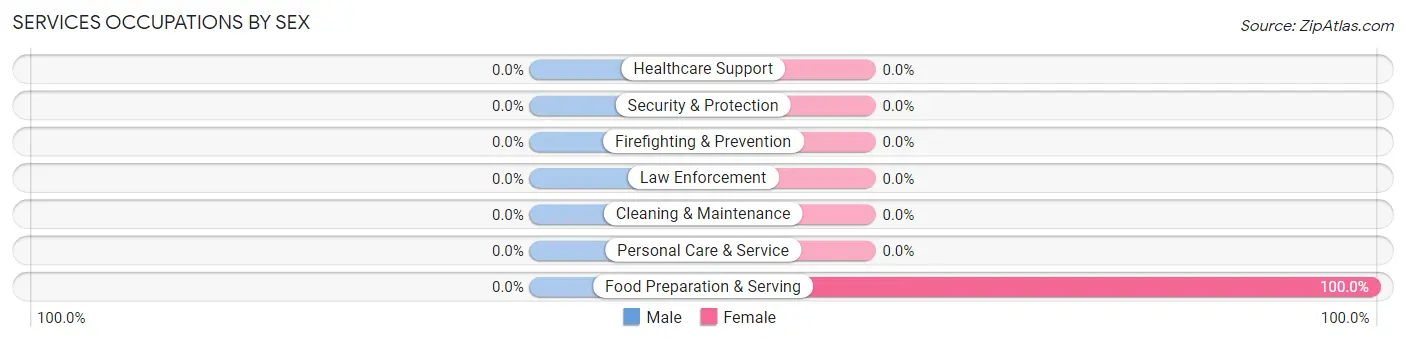
| Occupation | Male | Female |
| Healthcare Support | 0 (0.0%) | 0 (0.0%) |
| Security & Protection | 0 (0.0%) | 0 (0.0%) |
| Firefighting & Prevention | 0 (0.0%) | 0 (0.0%) |
| Law Enforcement | 0 (0.0%) | 0 (0.0%) |
| Food Preparation & Serving | 0 (0.0%) | 5 (100.0%) |
| Cleaning & Maintenance | 0 (0.0%) | 0 (0.0%) |
| Personal Care & Service | 0 (0.0%) | 0 (0.0%) |
| Total (Category) | 0 (0.0%) | 5 (100.0%) |
| Total (Overall) | 5 (15.1%) | 28 (84.9%) |
Sales and Office Occupations
The most common Sales and Office occupations in Central are , and Sales & Related (11 | 33.3%).
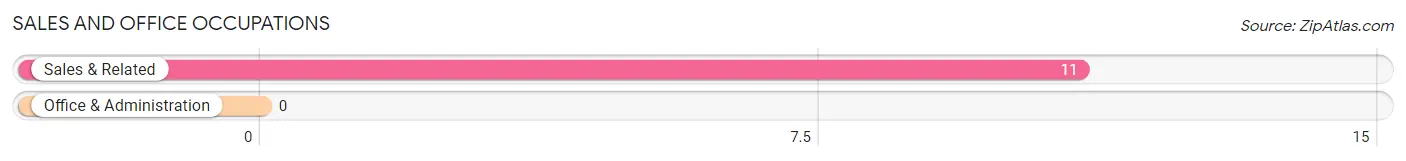
Sales and Office Occupations by Sex
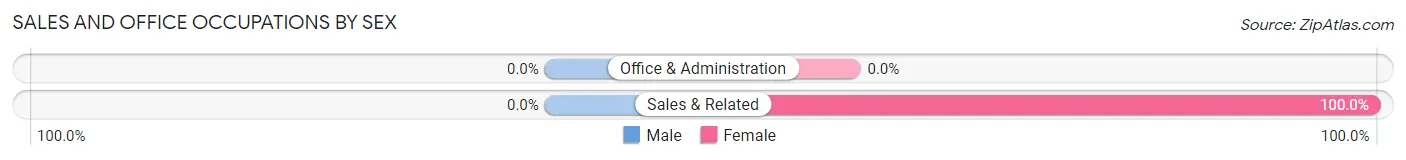
| Occupation | Male | Female |
| Sales & Related | 0 (0.0%) | 11 (100.0%) |
| Office & Administration | 0 (0.0%) | 0 (0.0%) |
| Total (Category) | 0 (0.0%) | 11 (100.0%) |
| Total (Overall) | 5 (15.1%) | 28 (84.9%) |
Natural Resources, Construction and Maintenance Occupations
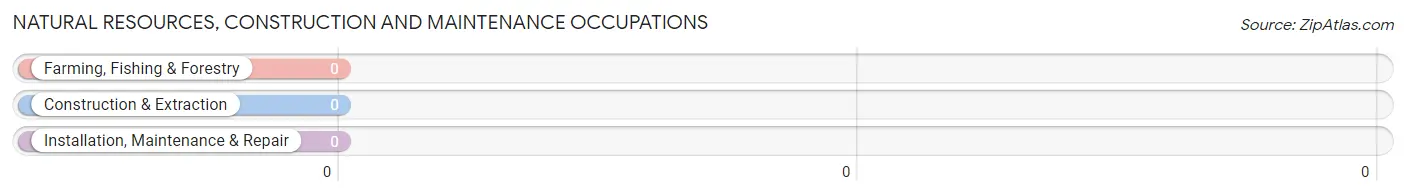
Natural Resources, Construction and Maintenance Occupations by Sex
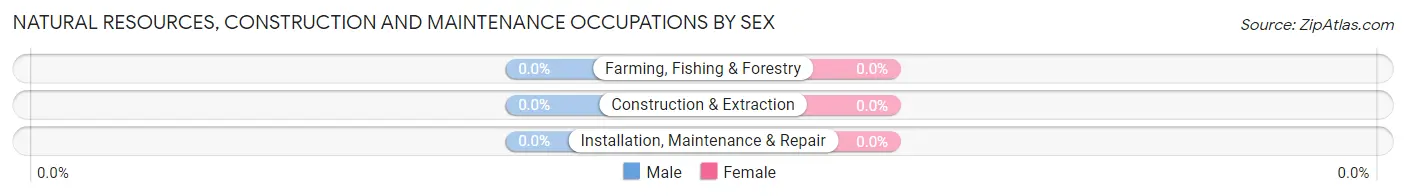
| Occupation | Male | Female |
| Farming, Fishing & Forestry | 0 (0.0%) | 0 (0.0%) |
| Construction & Extraction | 0 (0.0%) | 0 (0.0%) |
| Installation, Maintenance & Repair | 0 (0.0%) | 0 (0.0%) |
| Total (Category) | 0 (0.0%) | 0 (0.0%) |
| Total (Overall) | 5 (15.1%) | 28 (84.9%) |
Production, Transportation and Moving Occupations
The most common Production, Transportation and Moving occupations in Central are , and Material Moving (12 | 36.4%).
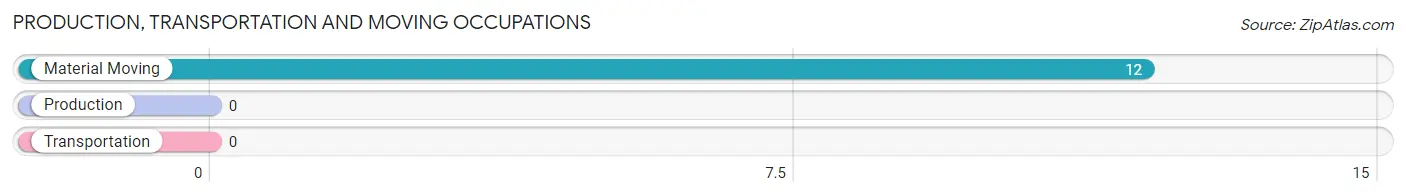
Production, Transportation and Moving Occupations by Sex
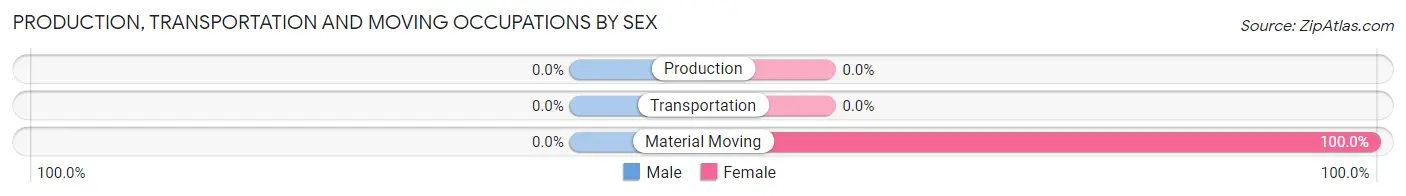
| Occupation | Male | Female |
| Production | 0 (0.0%) | 0 (0.0%) |
| Transportation | 0 (0.0%) | 0 (0.0%) |
| Material Moving | 0 (0.0%) | 12 (100.0%) |
| Total (Category) | 0 (0.0%) | 12 (100.0%) |
| Total (Overall) | 5 (15.1%) | 28 (84.9%) |
Employment Industries by Sex in Central
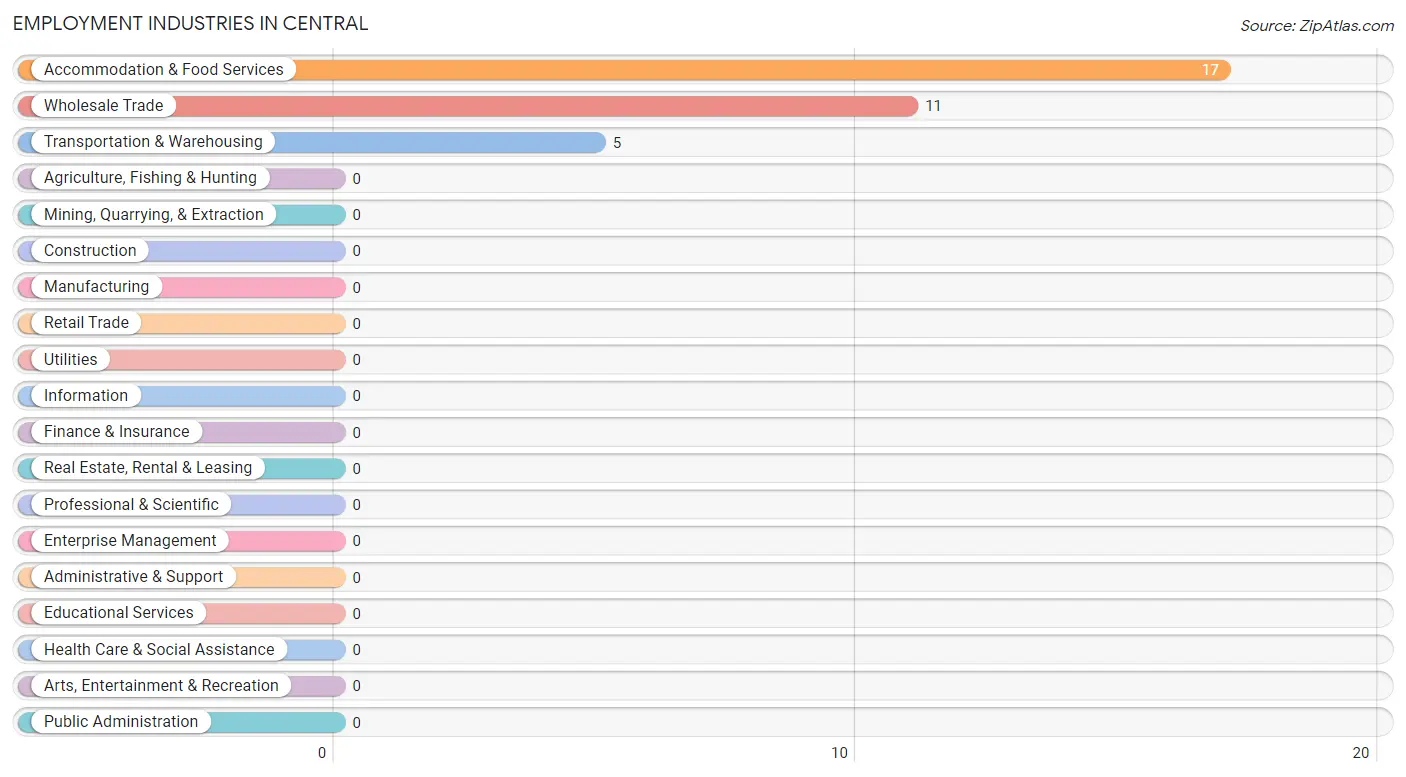
Employment Industries in Central
The major employment industries in Central include Accommodation & Food Services (17 | 51.5%), Wholesale Trade (11 | 33.3%), and Transportation & Warehousing (5 | 15.1%).
Employment Industries by Sex in Central
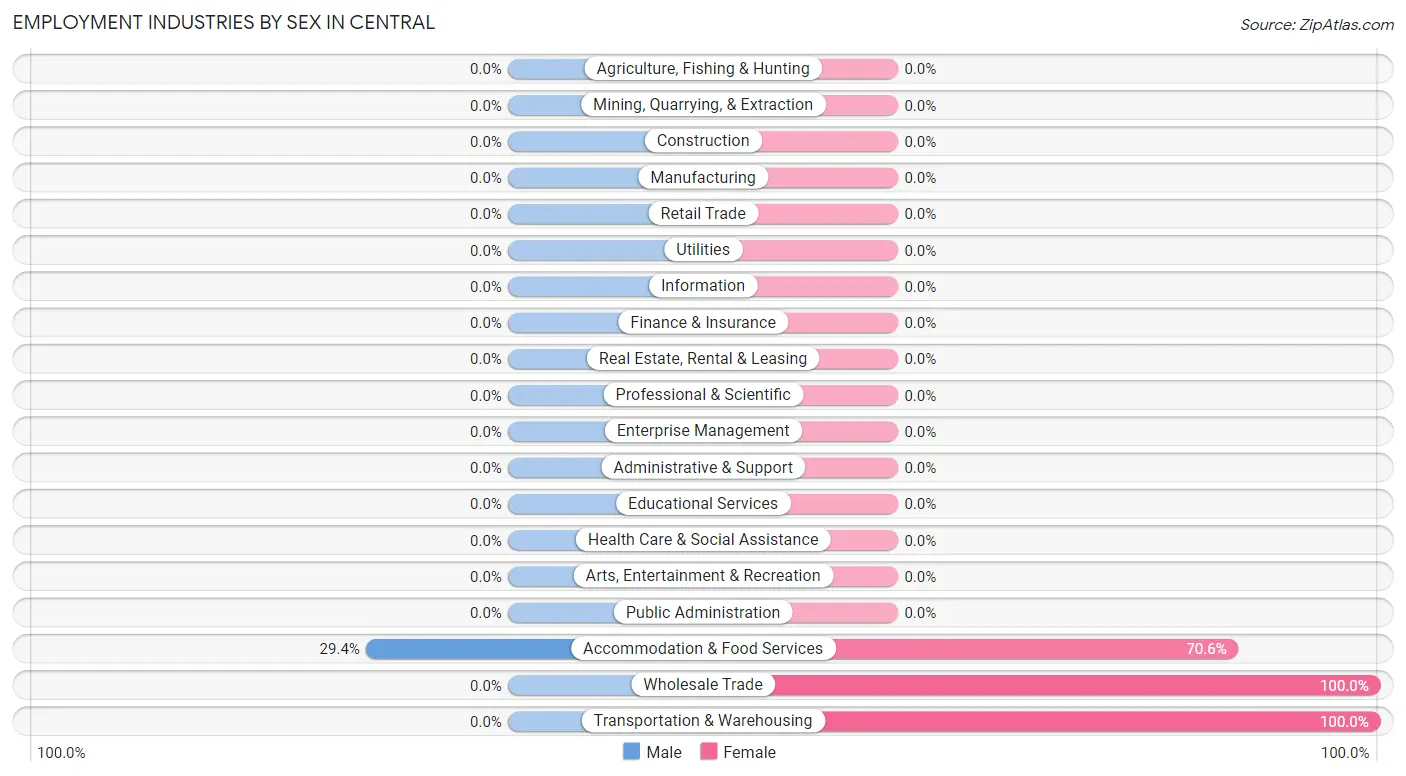
| Industry | Male | Female |
| Agriculture, Fishing & Hunting | 0 (0.0%) | 0 (0.0%) |
| Mining, Quarrying, & Extraction | 0 (0.0%) | 0 (0.0%) |
| Construction | 0 (0.0%) | 0 (0.0%) |
| Manufacturing | 0 (0.0%) | 0 (0.0%) |
| Wholesale Trade | 0 (0.0%) | 11 (100.0%) |
| Retail Trade | 0 (0.0%) | 0 (0.0%) |
| Transportation & Warehousing | 0 (0.0%) | 5 (100.0%) |
| Utilities | 0 (0.0%) | 0 (0.0%) |
| Information | 0 (0.0%) | 0 (0.0%) |
| Finance & Insurance | 0 (0.0%) | 0 (0.0%) |
| Real Estate, Rental & Leasing | 0 (0.0%) | 0 (0.0%) |
| Professional & Scientific | 0 (0.0%) | 0 (0.0%) |
| Enterprise Management | 0 (0.0%) | 0 (0.0%) |
| Administrative & Support | 0 (0.0%) | 0 (0.0%) |
| Educational Services | 0 (0.0%) | 0 (0.0%) |
| Health Care & Social Assistance | 0 (0.0%) | 0 (0.0%) |
| Arts, Entertainment & Recreation | 0 (0.0%) | 0 (0.0%) |
| Accommodation & Food Services | 5 (29.4%) | 12 (70.6%) |
| Public Administration | 0 (0.0%) | 0 (0.0%) |
| Total | 5 (15.1%) | 28 (84.9%) |
Education in Central
School Enrollment in Central
The most common levels of schooling among the 33 students in Central are middle school (12 | 36.4%), high school (12 | 36.4%), and elementary school (9 | 27.3%).
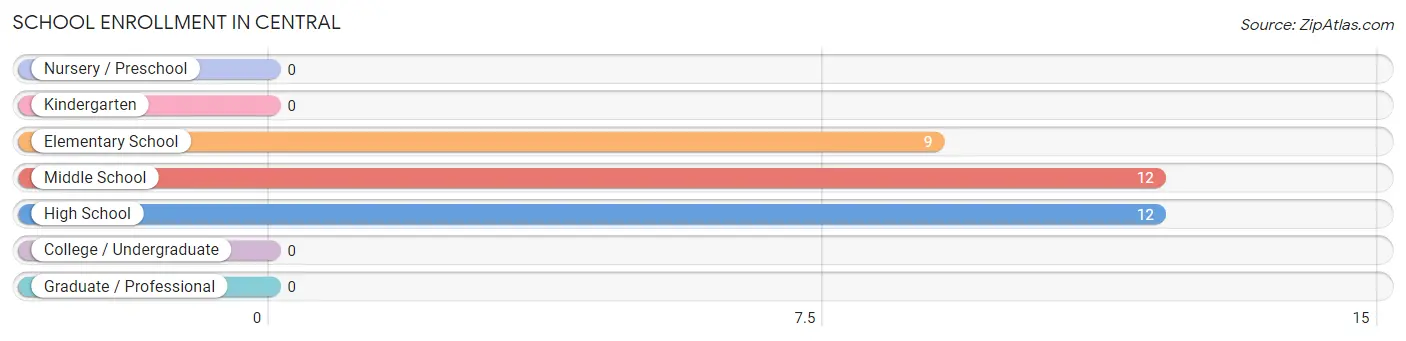
| School Level | # Students | % Students |
| Nursery / Preschool | 0 | 0.0% |
| Kindergarten | 0 | 0.0% |
| Elementary School | 9 | 27.3% |
| Middle School | 12 | 36.4% |
| High School | 12 | 36.4% |
| College / Undergraduate | 0 | 0.0% |
| Graduate / Professional | 0 | 0.0% |
| Total | 33 | 100.0% |
School Enrollment by Age by Funding Source in Central
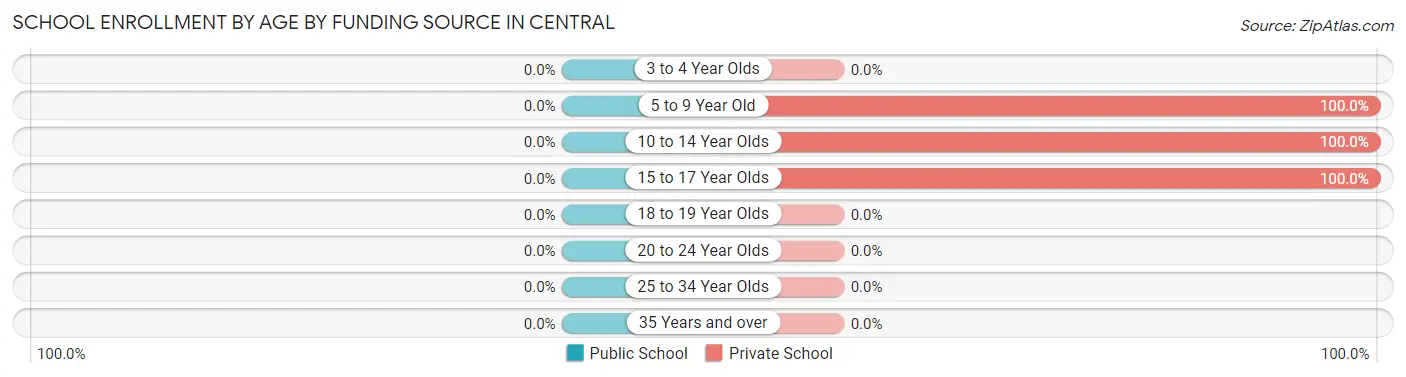
| Age Bracket | Public School | Private School |
| 3 to 4 Year Olds | 0 (0.0%) | 0 (0.0%) |
| 5 to 9 Year Old | 0 (0.0%) | 9 (100.0%) |
| 10 to 14 Year Olds | 0 (0.0%) | 12 (100.0%) |
| 15 to 17 Year Olds | 0 (0.0%) | 12 (100.0%) |
| 18 to 19 Year Olds | 0 (0.0%) | 0 (0.0%) |
| 20 to 24 Year Olds | 0 (0.0%) | 0 (0.0%) |
| 25 to 34 Year Olds | 0 (0.0%) | 0 (0.0%) |
| 35 Years and over | 0 (0.0%) | 0 (0.0%) |
| Total | 0 (0.0%) | 33 (100.0%) |
Educational Attainment by Field of Study in Central
Business (4 | 66.7%), engineering (1 | 16.7%), and liberal arts & history (1 | 16.7%) are the most common fields of study among 6 individuals in Central who have obtained a bachelor's degree or higher.
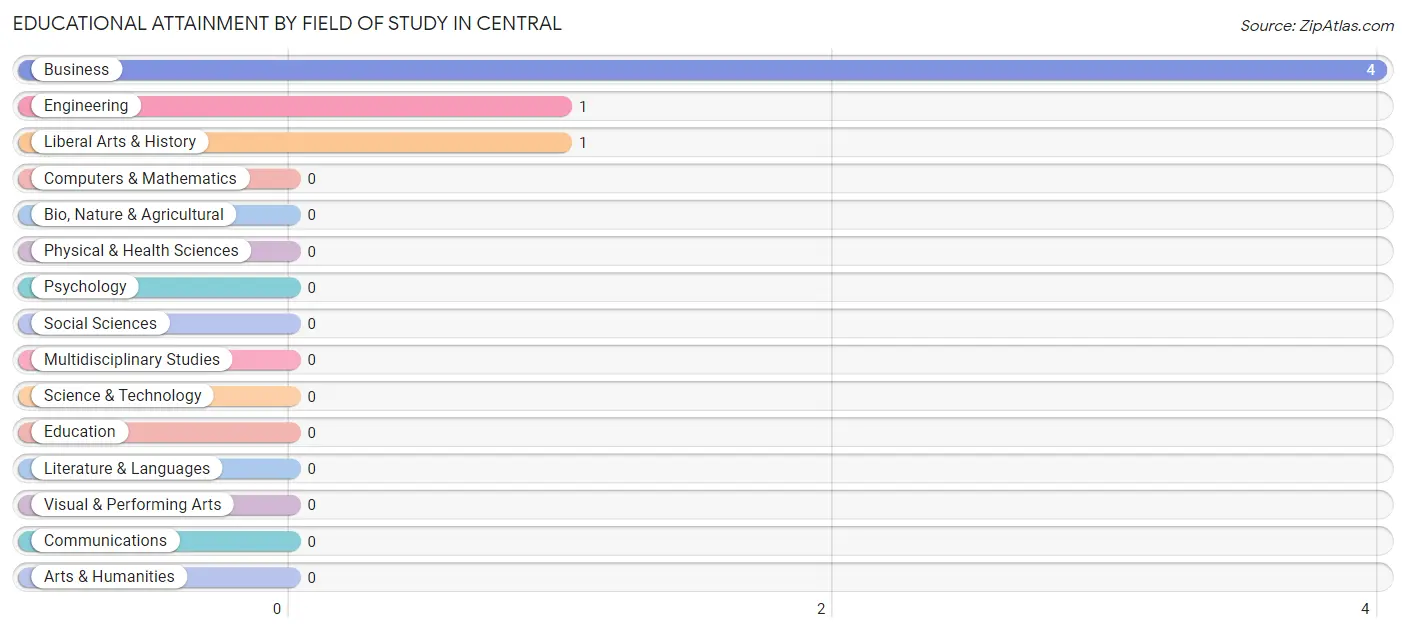
| Field of Study | # Graduates | % Graduates |
| Computers & Mathematics | 0 | 0.0% |
| Bio, Nature & Agricultural | 0 | 0.0% |
| Physical & Health Sciences | 0 | 0.0% |
| Psychology | 0 | 0.0% |
| Social Sciences | 0 | 0.0% |
| Engineering | 1 | 16.7% |
| Multidisciplinary Studies | 0 | 0.0% |
| Science & Technology | 0 | 0.0% |
| Business | 4 | 66.7% |
| Education | 0 | 0.0% |
| Literature & Languages | 0 | 0.0% |
| Liberal Arts & History | 1 | 16.7% |
| Visual & Performing Arts | 0 | 0.0% |
| Communications | 0 | 0.0% |
| Arts & Humanities | 0 | 0.0% |
| Total | 6 | 100.0% |
Transportation & Commute in Central
Vehicle Availability by Sex in Central
The most prevalent vehicle ownership categories in Central are males with no vehicle (5, accounting for 100.0%) and females with no vehicle (23, making up 17.9%).
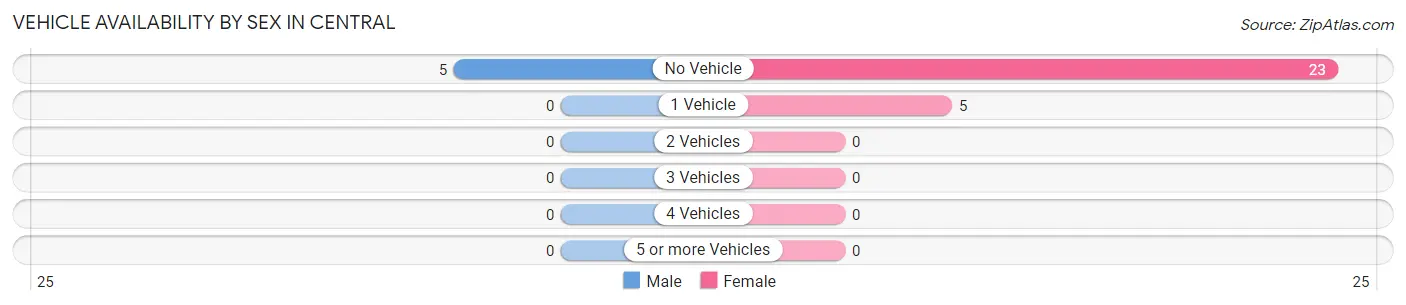
| Vehicles Available | Male | Female |
| No Vehicle | 5 (100.0%) | 23 (82.1%) |
| 1 Vehicle | 0 (0.0%) | 5 (17.9%) |
| 2 Vehicles | 0 (0.0%) | 0 (0.0%) |
| 3 Vehicles | 0 (0.0%) | 0 (0.0%) |
| 4 Vehicles | 0 (0.0%) | 0 (0.0%) |
| 5 or more Vehicles | 0 (0.0%) | 0 (0.0%) |
| Total | 5 (100.0%) | 28 (100.0%) |
Commute Time in Central
The most frequently occuring commute durations in Central are less than 5 minutes (28 commuters, 100.0%), 5 to 9 minutes (0 commuters, 0.0%), and 10 to 14 minutes (0 commuters, 0.0%).
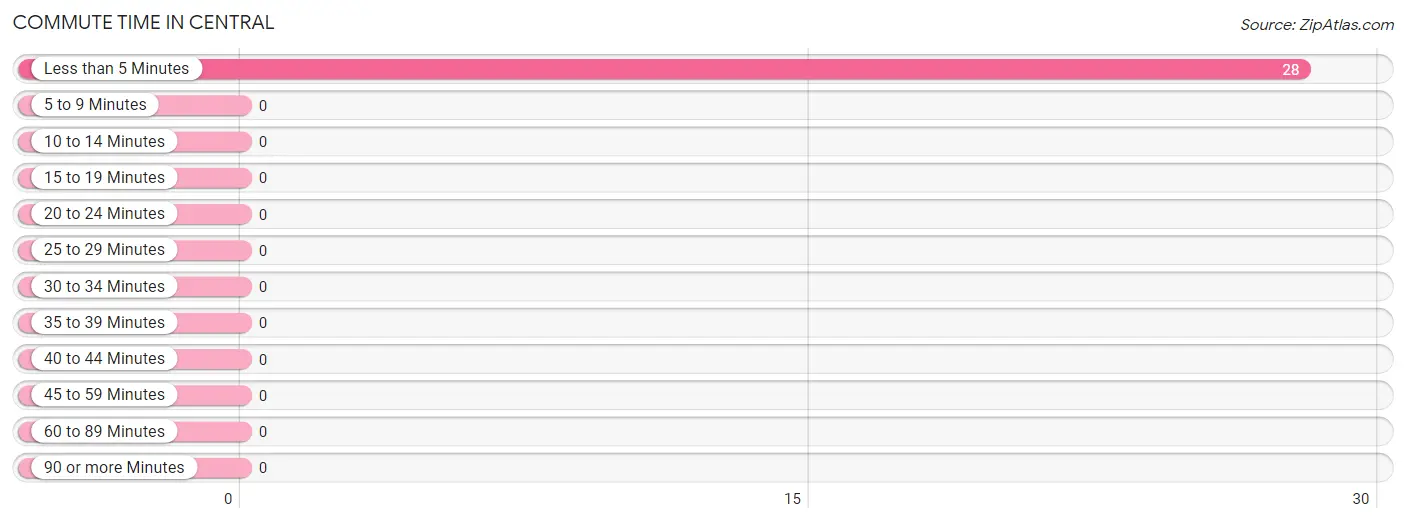
| Commute Time | # Commuters | % Commuters |
| Less than 5 Minutes | 28 | 100.0% |
| 5 to 9 Minutes | 0 | 0.0% |
| 10 to 14 Minutes | 0 | 0.0% |
| 15 to 19 Minutes | 0 | 0.0% |
| 20 to 24 Minutes | 0 | 0.0% |
| 25 to 29 Minutes | 0 | 0.0% |
| 30 to 34 Minutes | 0 | 0.0% |
| 35 to 39 Minutes | 0 | 0.0% |
| 40 to 44 Minutes | 0 | 0.0% |
| 45 to 59 Minutes | 0 | 0.0% |
| 60 to 89 Minutes | 0 | 0.0% |
| 90 or more Minutes | 0 | 0.0% |
Commute Time by Sex in Central
The most common commute times in Central are less than 5 minutes (5 commuters, 100.0%) for males and less than 5 minutes (23 commuters, 100.0%) for females.
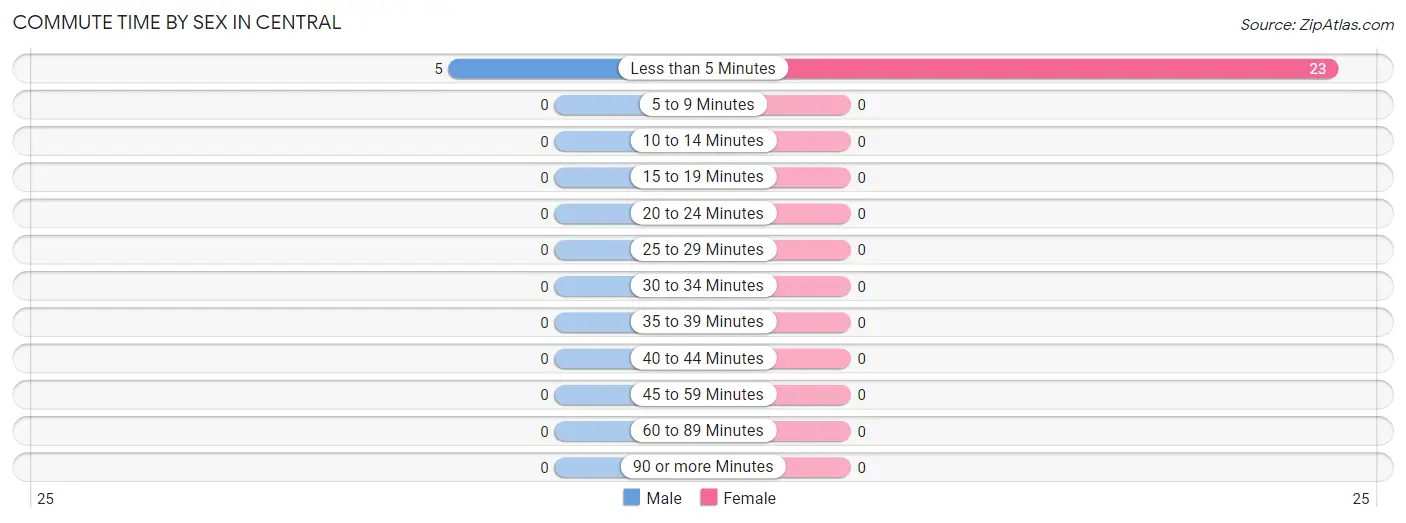
| Commute Time | Male | Female |
| Less than 5 Minutes | 5 (100.0%) | 23 (100.0%) |
| 5 to 9 Minutes | 0 (0.0%) | 0 (0.0%) |
| 10 to 14 Minutes | 0 (0.0%) | 0 (0.0%) |
| 15 to 19 Minutes | 0 (0.0%) | 0 (0.0%) |
| 20 to 24 Minutes | 0 (0.0%) | 0 (0.0%) |
| 25 to 29 Minutes | 0 (0.0%) | 0 (0.0%) |
| 30 to 34 Minutes | 0 (0.0%) | 0 (0.0%) |
| 35 to 39 Minutes | 0 (0.0%) | 0 (0.0%) |
| 40 to 44 Minutes | 0 (0.0%) | 0 (0.0%) |
| 45 to 59 Minutes | 0 (0.0%) | 0 (0.0%) |
| 60 to 89 Minutes | 0 (0.0%) | 0 (0.0%) |
| 90 or more Minutes | 0 (0.0%) | 0 (0.0%) |
Time of Departure to Work by Sex in Central
The most frequent times of departure to work in Central are 9:00 AM to 9:59 AM (5, 100.0%) for males and 8:30 AM to 8:59 AM (12, 52.2%) for females.
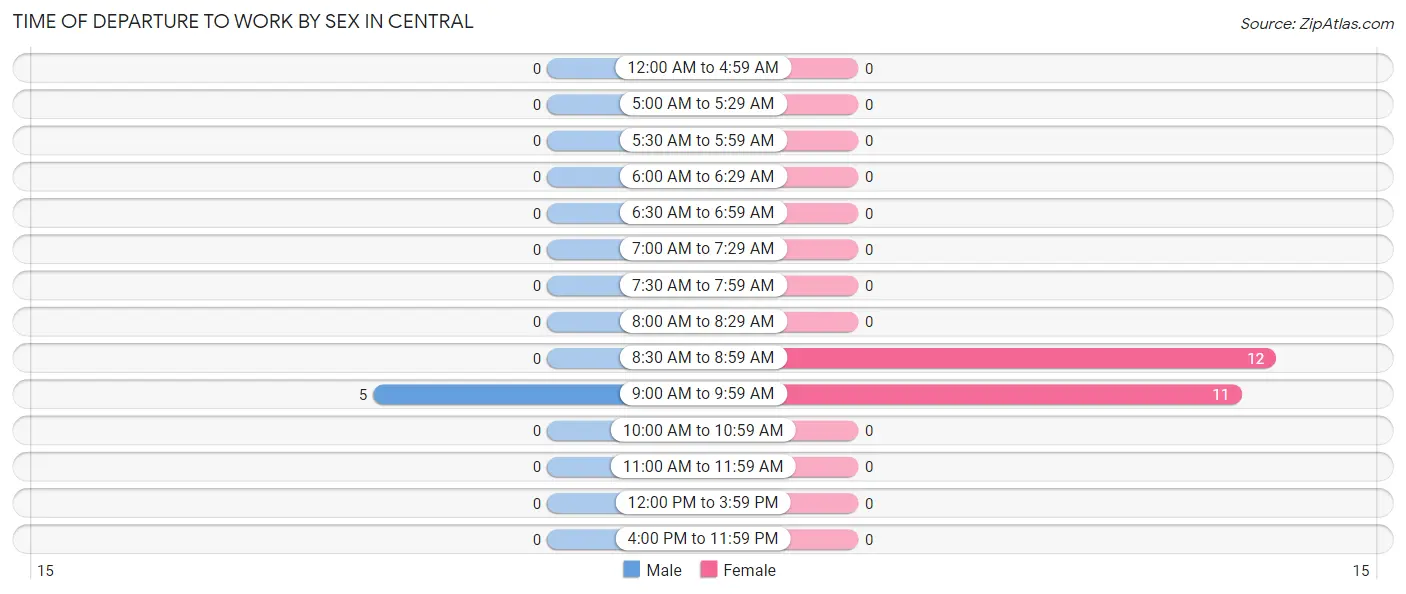
| Time of Departure | Male | Female |
| 12:00 AM to 4:59 AM | 0 (0.0%) | 0 (0.0%) |
| 5:00 AM to 5:29 AM | 0 (0.0%) | 0 (0.0%) |
| 5:30 AM to 5:59 AM | 0 (0.0%) | 0 (0.0%) |
| 6:00 AM to 6:29 AM | 0 (0.0%) | 0 (0.0%) |
| 6:30 AM to 6:59 AM | 0 (0.0%) | 0 (0.0%) |
| 7:00 AM to 7:29 AM | 0 (0.0%) | 0 (0.0%) |
| 7:30 AM to 7:59 AM | 0 (0.0%) | 0 (0.0%) |
| 8:00 AM to 8:29 AM | 0 (0.0%) | 0 (0.0%) |
| 8:30 AM to 8:59 AM | 0 (0.0%) | 12 (52.2%) |
| 9:00 AM to 9:59 AM | 5 (100.0%) | 11 (47.8%) |
| 10:00 AM to 10:59 AM | 0 (0.0%) | 0 (0.0%) |
| 11:00 AM to 11:59 AM | 0 (0.0%) | 0 (0.0%) |
| 12:00 PM to 3:59 PM | 0 (0.0%) | 0 (0.0%) |
| 4:00 PM to 11:59 PM | 0 (0.0%) | 0 (0.0%) |
| Total | 5 (100.0%) | 23 (100.0%) |
Housing Occupancy in Central
Occupancy by Ownership in Central
Of the total 56 dwellings in Central, owner-occupied units account for 56 (100.0%), while renter-occupied units make up 0 (0.0%).
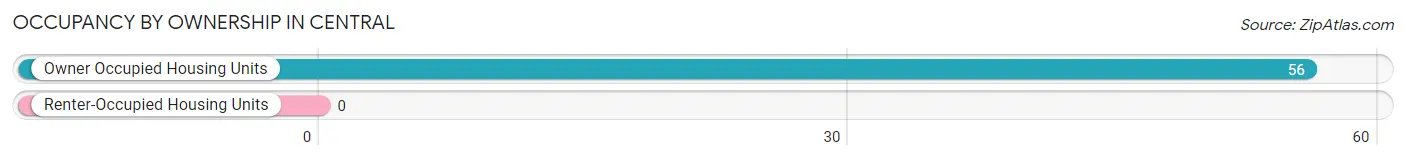
| Occupancy | # Housing Units | % Housing Units |
| Owner Occupied Housing Units | 56 | 100.0% |
| Renter-Occupied Housing Units | 0 | 0.0% |
| Total Occupied Housing Units | 56 | 100.0% |
Occupancy by Household Size in Central
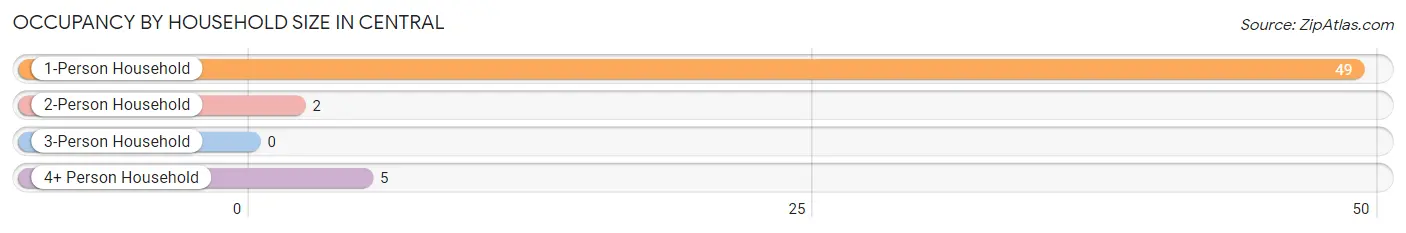
| Household Size | # Housing Units | % Housing Units |
| 1-Person Household | 49 | 87.5% |
| 2-Person Household | 2 | 3.6% |
| 3-Person Household | 0 | 0.0% |
| 4+ Person Household | 5 | 8.9% |
| Total Housing Units | 56 | 100.0% |
Occupancy by Ownership by Household Size in Central
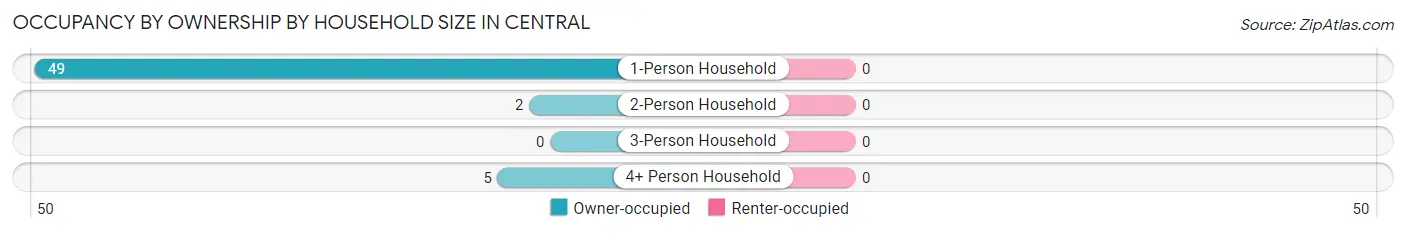
| Household Size | Owner-occupied | Renter-occupied |
| 1-Person Household | 49 (100.0%) | 0 (0.0%) |
| 2-Person Household | 2 (100.0%) | 0 (0.0%) |
| 3-Person Household | 0 (0.0%) | 0 (0.0%) |
| 4+ Person Household | 5 (100.0%) | 0 (0.0%) |
| Total Housing Units | 56 (100.0%) | 0 (0.0%) |
Occupancy by Educational Attainment in Central
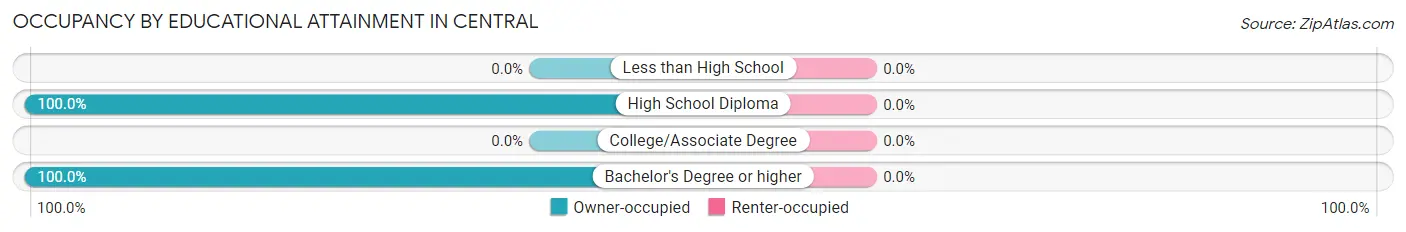
| Household Size | Owner-occupied | Renter-occupied |
| Less than High School | 0 (0.0%) | 0 (0.0%) |
| High School Diploma | 50 (100.0%) | 0 (0.0%) |
| College/Associate Degree | 0 (0.0%) | 0 (0.0%) |
| Bachelor's Degree or higher | 6 (100.0%) | 0 (0.0%) |
Occupancy by Age of Householder in Central
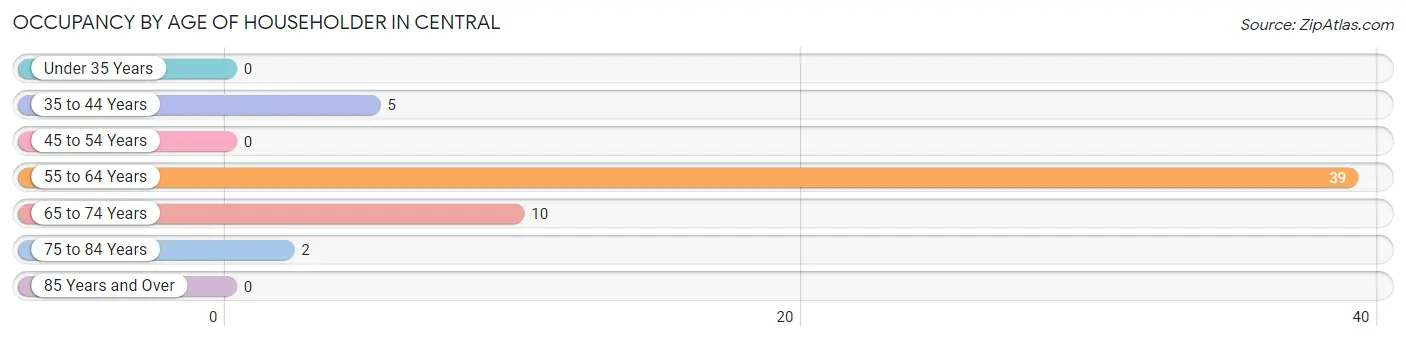
| Age Bracket | # Households | % Households |
| Under 35 Years | 0 | 0.0% |
| 35 to 44 Years | 5 | 8.9% |
| 45 to 54 Years | 0 | 0.0% |
| 55 to 64 Years | 39 | 69.6% |
| 65 to 74 Years | 10 | 17.9% |
| 75 to 84 Years | 2 | 3.6% |
| 85 Years and Over | 0 | 0.0% |
| Total | 56 | 100.0% |
Housing Finances in Central
Median Income by Occupancy in Central
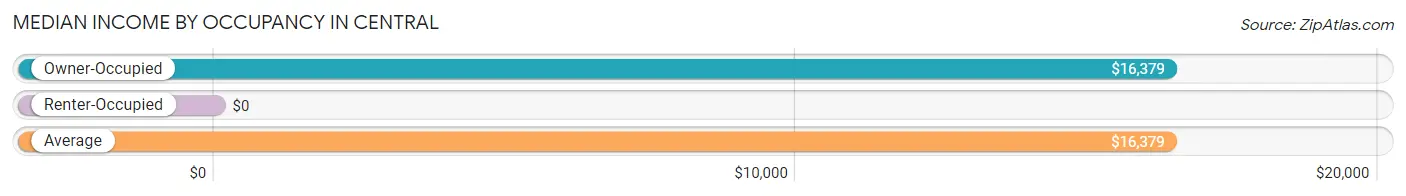
| Occupancy Type | # Households | Median Income |
| Owner-Occupied | 56 (100.0%) | $16,379 |
| Renter-Occupied | 0 (0.0%) | $0 |
| Average | 56 (100.0%) | $16,379 |
Occupancy by Householder Income Bracket in Central
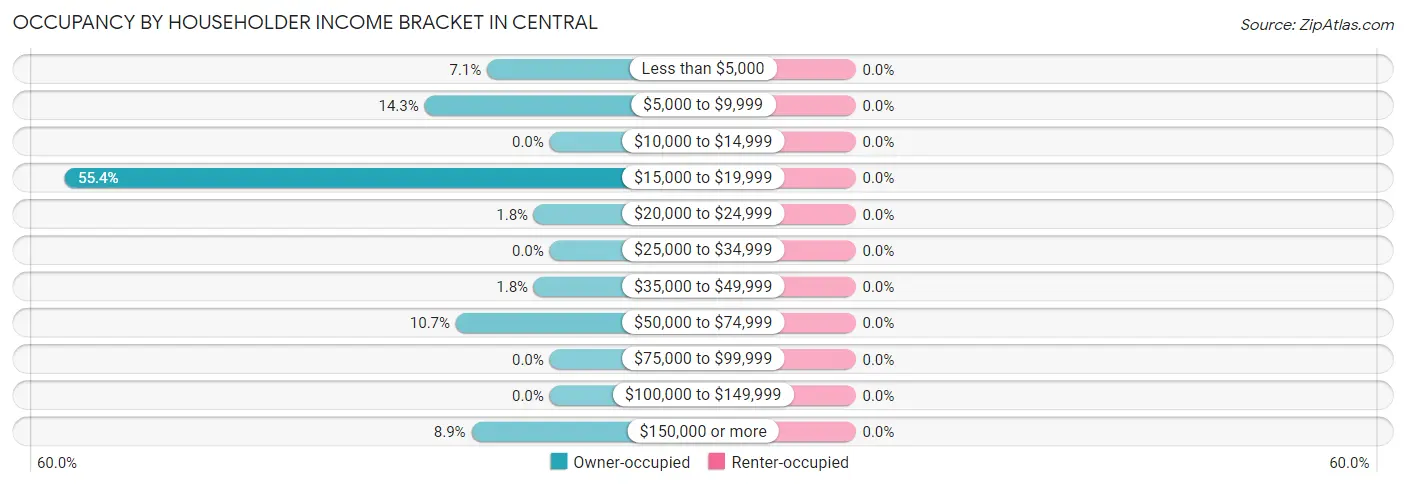
| Income Bracket | Owner-occupied | Renter-occupied |
| Less than $5,000 | 4 (7.1%) | 0 (0.0%) |
| $5,000 to $9,999 | 8 (14.3%) | 0 (0.0%) |
| $10,000 to $14,999 | 0 (0.0%) | 0 (0.0%) |
| $15,000 to $19,999 | 31 (55.4%) | 0 (0.0%) |
| $20,000 to $24,999 | 1 (1.8%) | 0 (0.0%) |
| $25,000 to $34,999 | 0 (0.0%) | 0 (0.0%) |
| $35,000 to $49,999 | 1 (1.8%) | 0 (0.0%) |
| $50,000 to $74,999 | 6 (10.7%) | 0 (0.0%) |
| $75,000 to $99,999 | 0 (0.0%) | 0 (0.0%) |
| $100,000 to $149,999 | 0 (0.0%) | 0 (0.0%) |
| $150,000 or more | 5 (8.9%) | 0 (0.0%) |
| Total | 56 (100.0%) | 0 (0.0%) |
Monthly Housing Cost Tiers in Central
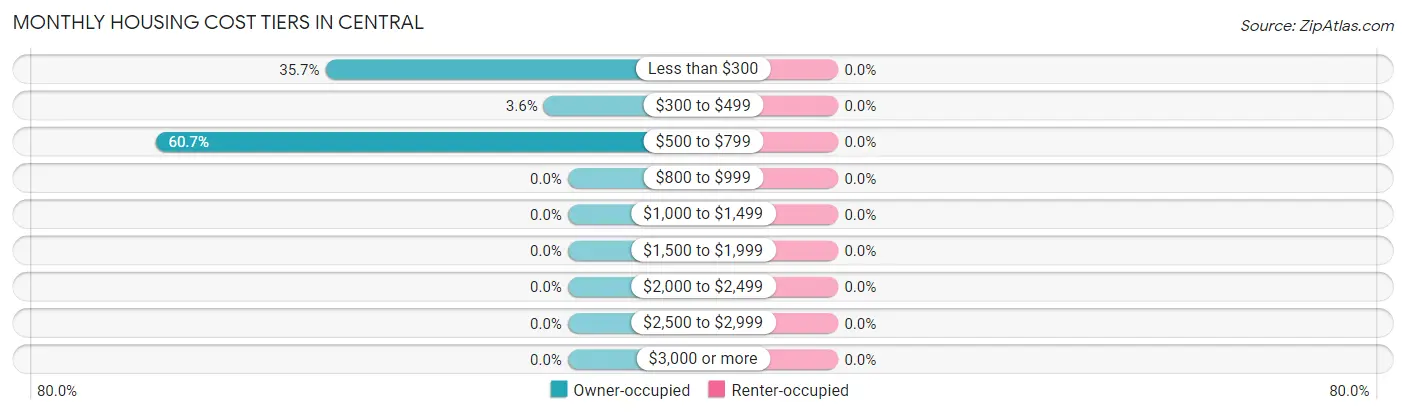
| Monthly Cost | Owner-occupied | Renter-occupied |
| Less than $300 | 20 (35.7%) | 0 (0.0%) |
| $300 to $499 | 2 (3.6%) | 0 (0.0%) |
| $500 to $799 | 34 (60.7%) | 0 (0.0%) |
| $800 to $999 | 0 (0.0%) | 0 (0.0%) |
| $1,000 to $1,499 | 0 (0.0%) | 0 (0.0%) |
| $1,500 to $1,999 | 0 (0.0%) | 0 (0.0%) |
| $2,000 to $2,499 | 0 (0.0%) | 0 (0.0%) |
| $2,500 to $2,999 | 0 (0.0%) | 0 (0.0%) |
| $3,000 or more | 0 (0.0%) | 0 (0.0%) |
| Total | 56 (100.0%) | 0 (0.0%) |
Physical Housing Characteristics in Central
Housing Structures in Central
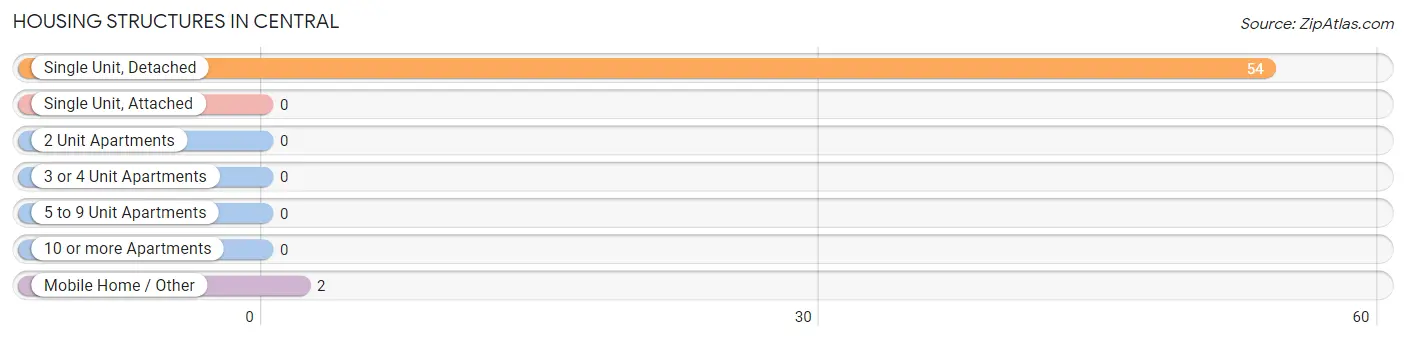
| Structure Type | # Housing Units | % Housing Units |
| Single Unit, Detached | 54 | 96.4% |
| Single Unit, Attached | 0 | 0.0% |
| 2 Unit Apartments | 0 | 0.0% |
| 3 or 4 Unit Apartments | 0 | 0.0% |
| 5 to 9 Unit Apartments | 0 | 0.0% |
| 10 or more Apartments | 0 | 0.0% |
| Mobile Home / Other | 2 | 3.6% |
| Total | 56 | 100.0% |
Housing Structures by Occupancy in Central
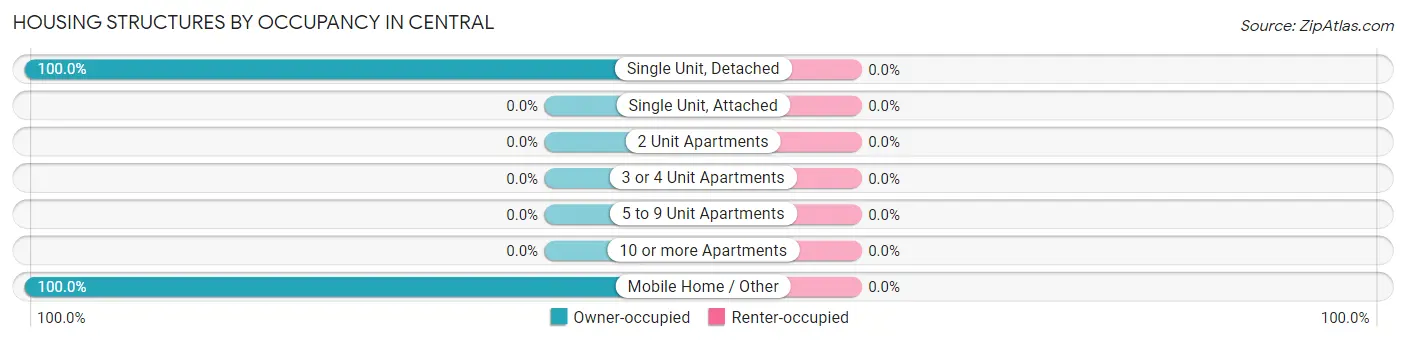
| Structure Type | Owner-occupied | Renter-occupied |
| Single Unit, Detached | 54 (100.0%) | 0 (0.0%) |
| Single Unit, Attached | 0 (0.0%) | 0 (0.0%) |
| 2 Unit Apartments | 0 (0.0%) | 0 (0.0%) |
| 3 or 4 Unit Apartments | 0 (0.0%) | 0 (0.0%) |
| 5 to 9 Unit Apartments | 0 (0.0%) | 0 (0.0%) |
| 10 or more Apartments | 0 (0.0%) | 0 (0.0%) |
| Mobile Home / Other | 2 (100.0%) | 0 (0.0%) |
| Total | 56 (100.0%) | 0 (0.0%) |
Housing Structures by Number of Rooms in Central
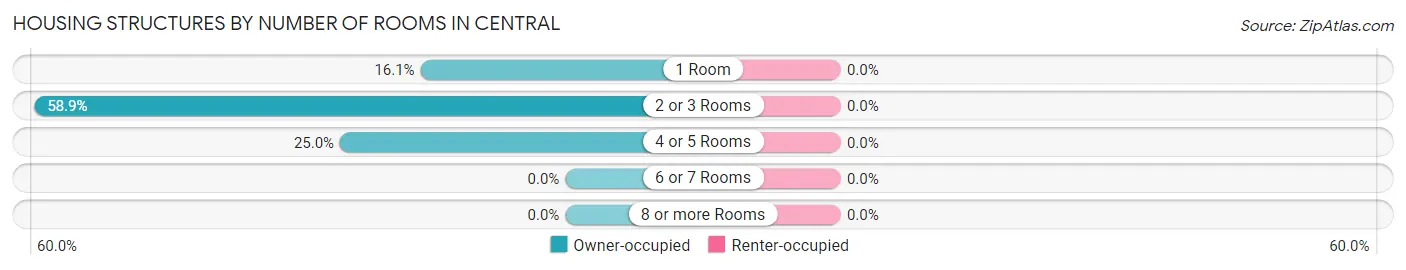
| Number of Rooms | Owner-occupied | Renter-occupied |
| 1 Room | 9 (16.1%) | 0 (0.0%) |
| 2 or 3 Rooms | 33 (58.9%) | 0 (0.0%) |
| 4 or 5 Rooms | 14 (25.0%) | 0 (0.0%) |
| 6 or 7 Rooms | 0 (0.0%) | 0 (0.0%) |
| 8 or more Rooms | 0 (0.0%) | 0 (0.0%) |
| Total | 56 (100.0%) | 0 (0.0%) |
Housing Structure by Heating Type in Central
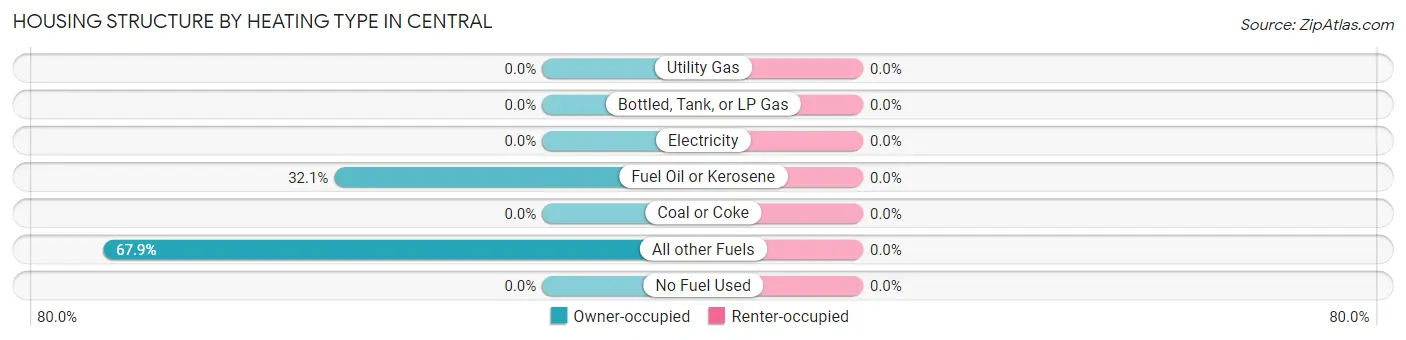
| Heating Type | Owner-occupied | Renter-occupied |
| Utility Gas | 0 (0.0%) | 0 (0.0%) |
| Bottled, Tank, or LP Gas | 0 (0.0%) | 0 (0.0%) |
| Electricity | 0 (0.0%) | 0 (0.0%) |
| Fuel Oil or Kerosene | 18 (32.1%) | 0 (0.0%) |
| Coal or Coke | 0 (0.0%) | 0 (0.0%) |
| All other Fuels | 38 (67.9%) | 0 (0.0%) |
| No Fuel Used | 0 (0.0%) | 0 (0.0%) |
| Total | 56 (100.0%) | 0 (0.0%) |
Household Vehicle Usage in Central
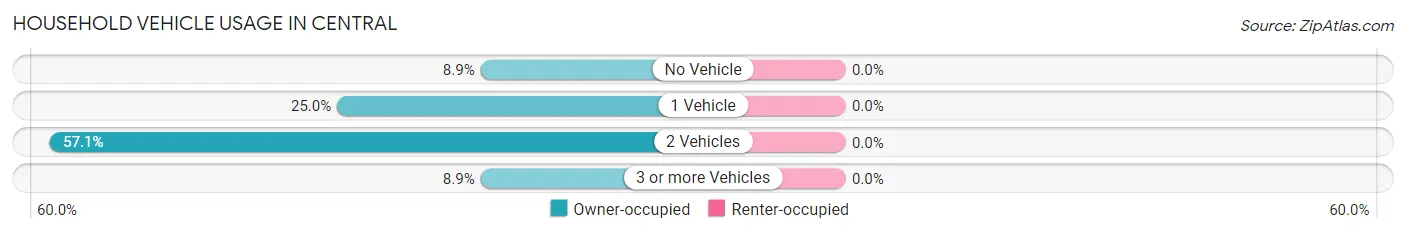
| Vehicles per Household | Owner-occupied | Renter-occupied |
| No Vehicle | 5 (8.9%) | 0 (0.0%) |
| 1 Vehicle | 14 (25.0%) | 0 (0.0%) |
| 2 Vehicles | 32 (57.1%) | 0 (0.0%) |
| 3 or more Vehicles | 5 (8.9%) | 0 (0.0%) |
| Total | 56 (100.0%) | 0 (0.0%) |
Real Estate & Mortgages in Central
Real Estate and Mortgage Overview in Central
| Characteristic | Without Mortgage | With Mortgage |
| Housing Units | 51 | 5 |
| Median Property Value | $56,700 | $0 |
| Median Household Income | $16,164 | $5 |
| Monthly Housing Costs | - | - |
| Real Estate Taxes | - | - |
Property Value by Mortgage Status in Central
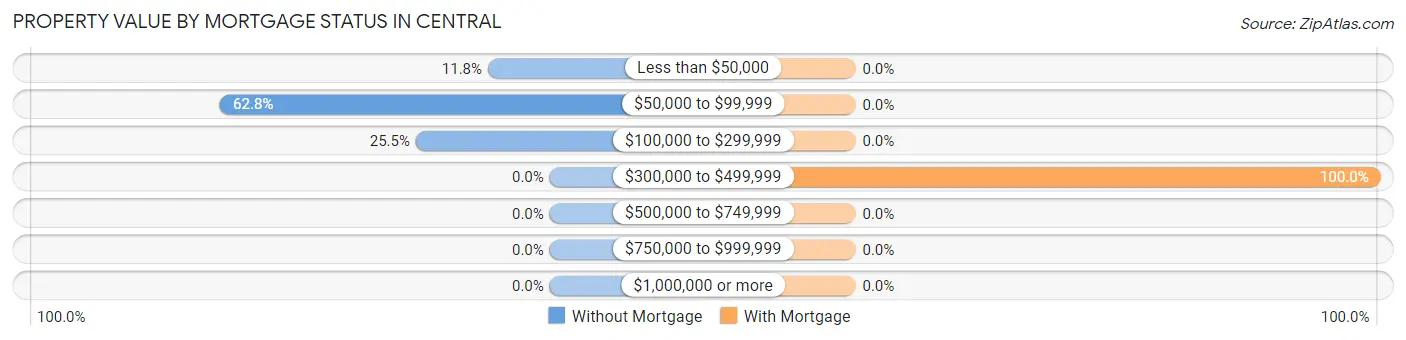
| Property Value | Without Mortgage | With Mortgage |
| Less than $50,000 | 6 (11.8%) | 0 (0.0%) |
| $50,000 to $99,999 | 32 (62.7%) | 0 (0.0%) |
| $100,000 to $299,999 | 13 (25.5%) | 0 (0.0%) |
| $300,000 to $499,999 | 0 (0.0%) | 5 (100.0%) |
| $500,000 to $749,999 | 0 (0.0%) | 0 (0.0%) |
| $750,000 to $999,999 | 0 (0.0%) | 0 (0.0%) |
| $1,000,000 or more | 0 (0.0%) | 0 (0.0%) |
| Total | 51 (100.0%) | 5 (100.0%) |
Household Income by Mortgage Status in Central
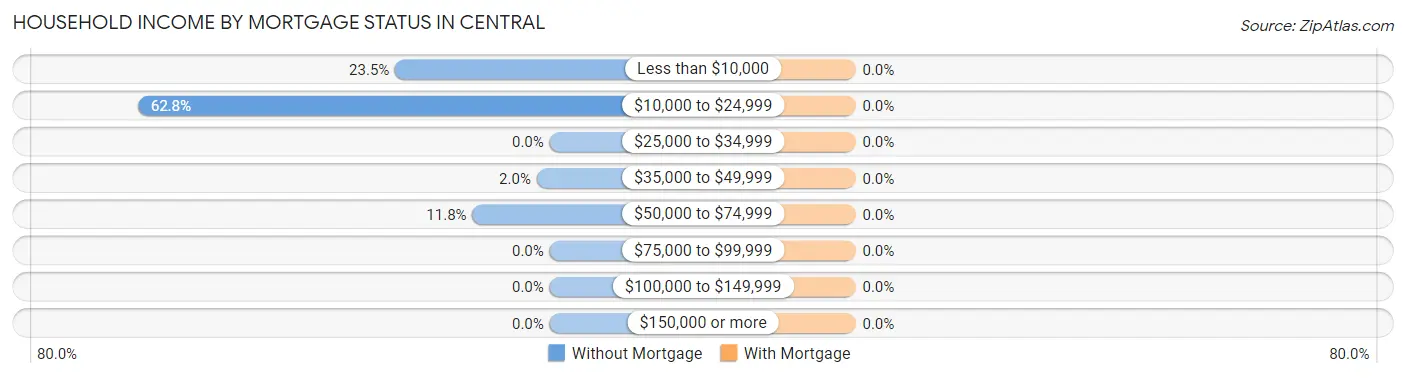
| Household Income | Without Mortgage | With Mortgage |
| Less than $10,000 | 12 (23.5%) | 0 (0.0%) |
| $10,000 to $24,999 | 32 (62.7%) | 0 (0.0%) |
| $25,000 to $34,999 | 0 (0.0%) | 0 (0.0%) |
| $35,000 to $49,999 | 1 (2.0%) | 0 (0.0%) |
| $50,000 to $74,999 | 6 (11.8%) | 0 (0.0%) |
| $75,000 to $99,999 | 0 (0.0%) | 0 (0.0%) |
| $100,000 to $149,999 | 0 (0.0%) | 0 (0.0%) |
| $150,000 or more | 0 (0.0%) | 0 (0.0%) |
| Total | 51 (100.0%) | 5 (100.0%) |
Property Value to Household Income Ratio in Central
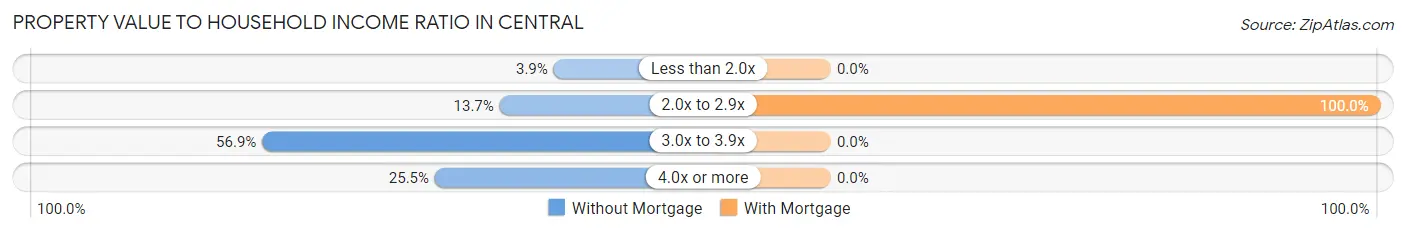
| Value-to-Income Ratio | Without Mortgage | With Mortgage |
| Less than 2.0x | 2 (3.9%) | 0 (0.0%) |
| 2.0x to 2.9x | 7 (13.7%) | 5 (100.0%) |
| 3.0x to 3.9x | 29 (56.9%) | 0 (0.0%) |
| 4.0x or more | 13 (25.5%) | 0 (0.0%) |
| Total | 51 (100.0%) | 5 (100.0%) |
Real Estate Taxes by Mortgage Status in Central
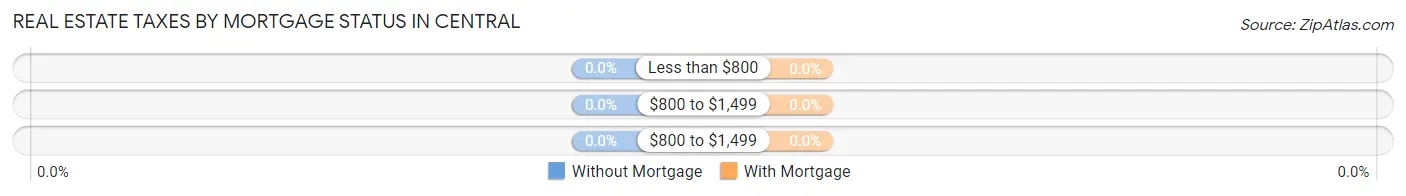
| Property Taxes | Without Mortgage | With Mortgage |
| Less than $800 | 0 (0.0%) | 0 (0.0%) |
| $800 to $1,499 | 0 (0.0%) | 0 (0.0%) |
| $800 to $1,499 | 0 (0.0%) | 0 (0.0%) |
| Total | 51 (100.0%) | 5 (100.0%) |
Health & Disability in Central
Health Insurance Coverage by Age in Central
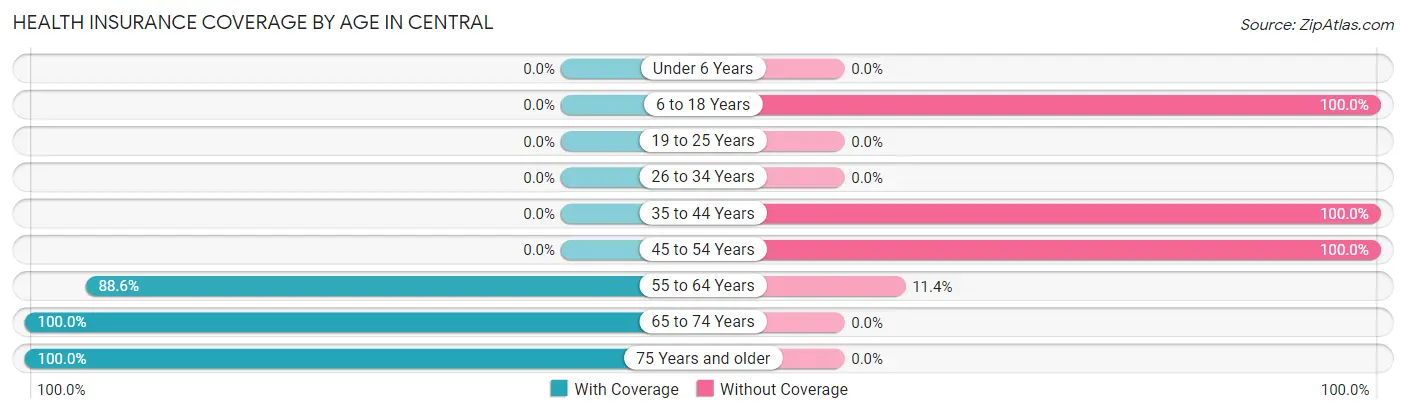
| Age Bracket | With Coverage | Without Coverage |
| Under 6 Years | 0 (0.0%) | 0 (0.0%) |
| 6 to 18 Years | 0 (0.0%) | 33 (100.0%) |
| 19 to 25 Years | 0 (0.0%) | 0 (0.0%) |
| 26 to 34 Years | 0 (0.0%) | 0 (0.0%) |
| 35 to 44 Years | 0 (0.0%) | 5 (100.0%) |
| 45 to 54 Years | 0 (0.0%) | 11 (100.0%) |
| 55 to 64 Years | 39 (88.6%) | 5 (11.4%) |
| 65 to 74 Years | 10 (100.0%) | 0 (0.0%) |
| 75 Years and older | 2 (100.0%) | 0 (0.0%) |
| Total | 51 (48.6%) | 54 (51.4%) |
Health Insurance Coverage by Citizenship Status in Central
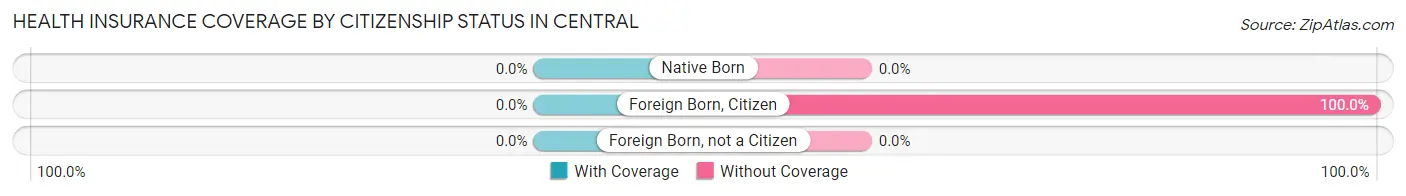
| Citizenship Status | With Coverage | Without Coverage |
| Native Born | 0 (0.0%) | 0 (0.0%) |
| Foreign Born, Citizen | 0 (0.0%) | 33 (100.0%) |
| Foreign Born, not a Citizen | 0 (0.0%) | 0 (0.0%) |
Health Insurance Coverage by Household Income in Central
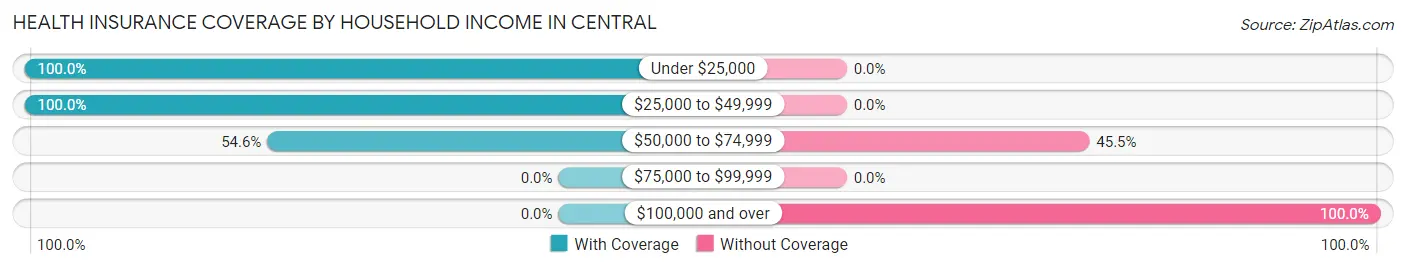
| Household Income | With Coverage | Without Coverage |
| Under $25,000 | 44 (100.0%) | 0 (0.0%) |
| $25,000 to $49,999 | 1 (100.0%) | 0 (0.0%) |
| $50,000 to $74,999 | 6 (54.5%) | 5 (45.5%) |
| $75,000 to $99,999 | 0 (0.0%) | 0 (0.0%) |
| $100,000 and over | 0 (0.0%) | 49 (100.0%) |
Public vs Private Health Insurance Coverage by Age in Central
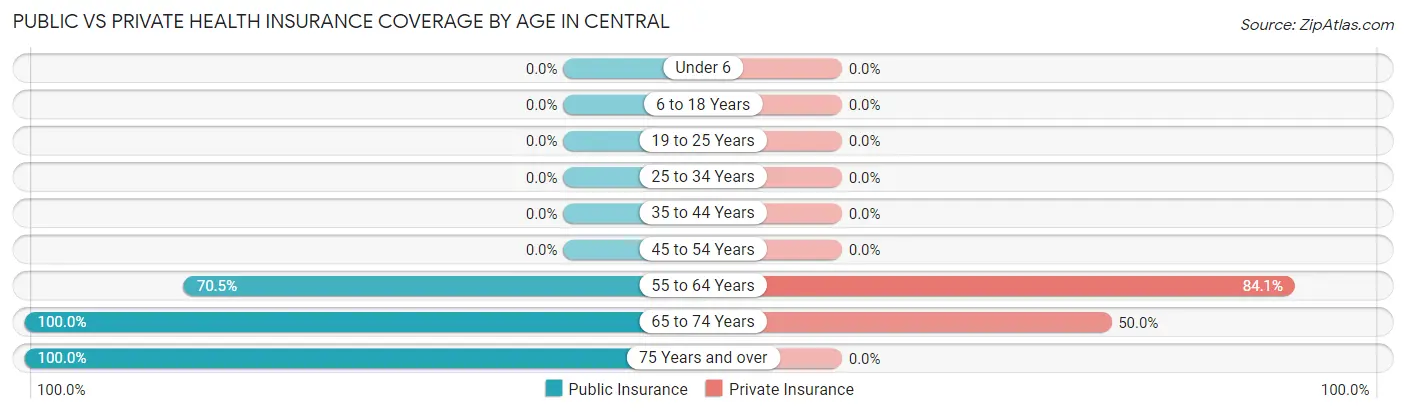
| Age Bracket | Public Insurance | Private Insurance |
| Under 6 | 0 (0.0%) | 0 (0.0%) |
| 6 to 18 Years | 0 (0.0%) | 0 (0.0%) |
| 19 to 25 Years | 0 (0.0%) | 0 (0.0%) |
| 25 to 34 Years | 0 (0.0%) | 0 (0.0%) |
| 35 to 44 Years | 0 (0.0%) | 0 (0.0%) |
| 45 to 54 Years | 0 (0.0%) | 0 (0.0%) |
| 55 to 64 Years | 31 (70.5%) | 37 (84.1%) |
| 65 to 74 Years | 10 (100.0%) | 5 (50.0%) |
| 75 Years and over | 2 (100.0%) | 0 (0.0%) |
| Total | 43 (40.9%) | 42 (40.0%) |
Disability Status by Sex by Age in Central
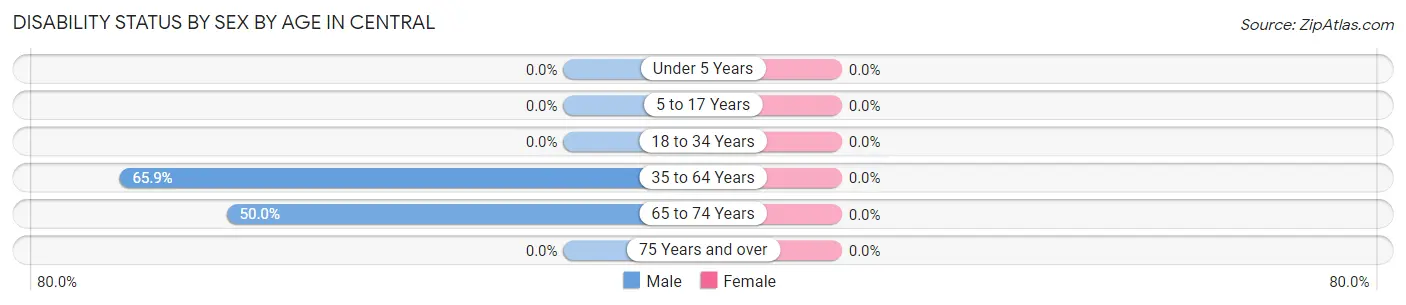
| Age Bracket | Male | Female |
| Under 5 Years | 0 (0.0%) | 0 (0.0%) |
| 5 to 17 Years | 0 (0.0%) | 0 (0.0%) |
| 18 to 34 Years | 0 (0.0%) | 0 (0.0%) |
| 35 to 64 Years | 29 (65.9%) | 0 (0.0%) |
| 65 to 74 Years | 1 (50.0%) | 0 (0.0%) |
| 75 Years and over | 0 (0.0%) | 0 (0.0%) |
Disability Class by Sex by Age in Central
Disability Class: Hearing Difficulty
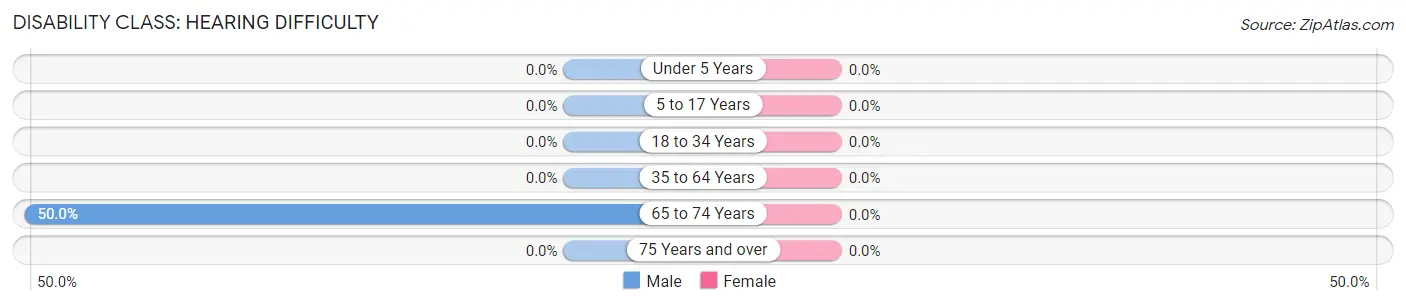
| Age Bracket | Male | Female |
| Under 5 Years | 0 (0.0%) | 0 (0.0%) |
| 5 to 17 Years | 0 (0.0%) | 0 (0.0%) |
| 18 to 34 Years | 0 (0.0%) | 0 (0.0%) |
| 35 to 64 Years | 0 (0.0%) | 0 (0.0%) |
| 65 to 74 Years | 1 (50.0%) | 0 (0.0%) |
| 75 Years and over | 0 (0.0%) | 0 (0.0%) |
Disability Class: Vision Difficulty
| Age Bracket | Male | Female |
| Under 5 Years | 0 (0.0%) | 0 (0.0%) |
| 5 to 17 Years | 0 (0.0%) | 0 (0.0%) |
| 18 to 34 Years | 0 (0.0%) | 0 (0.0%) |
| 35 to 64 Years | 0 (0.0%) | 0 (0.0%) |
| 65 to 74 Years | 0 (0.0%) | 0 (0.0%) |
| 75 Years and over | 0 (0.0%) | 0 (0.0%) |
Disability Class: Cognitive Difficulty

| Age Bracket | Male | Female |
| 5 to 17 Years | 0 (0.0%) | 0 (0.0%) |
| 18 to 34 Years | 0 (0.0%) | 0 (0.0%) |
| 35 to 64 Years | 0 (0.0%) | 0 (0.0%) |
| 65 to 74 Years | 0 (0.0%) | 0 (0.0%) |
| 75 Years and over | 0 (0.0%) | 0 (0.0%) |
Disability Class: Ambulatory Difficulty
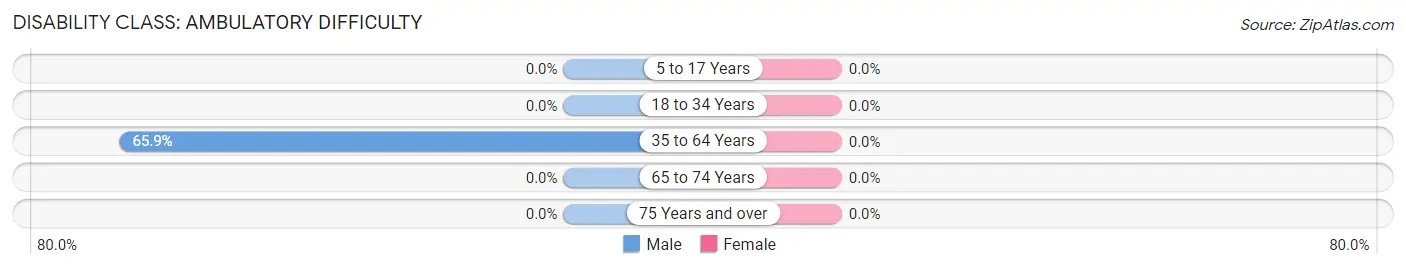
| Age Bracket | Male | Female |
| 5 to 17 Years | 0 (0.0%) | 0 (0.0%) |
| 18 to 34 Years | 0 (0.0%) | 0 (0.0%) |
| 35 to 64 Years | 29 (65.9%) | 0 (0.0%) |
| 65 to 74 Years | 0 (0.0%) | 0 (0.0%) |
| 75 Years and over | 0 (0.0%) | 0 (0.0%) |
Disability Class: Self-Care Difficulty
| Age Bracket | Male | Female |
| 5 to 17 Years | 0 (0.0%) | 0 (0.0%) |
| 18 to 34 Years | 0 (0.0%) | 0 (0.0%) |
| 35 to 64 Years | 0 (0.0%) | 0 (0.0%) |
| 65 to 74 Years | 0 (0.0%) | 0 (0.0%) |
| 75 Years and over | 0 (0.0%) | 0 (0.0%) |
Technology Access in Central
Computing Device Access in Central
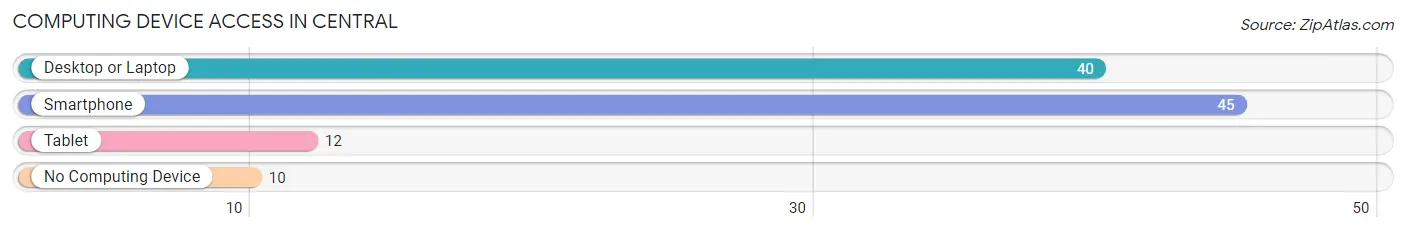
| Device Type | # Households | % Households |
| Desktop or Laptop | 40 | 71.4% |
| Smartphone | 45 | 80.4% |
| Tablet | 12 | 21.4% |
| No Computing Device | 10 | 17.9% |
| Total | 56 | 100.0% |
Internet Access in Central
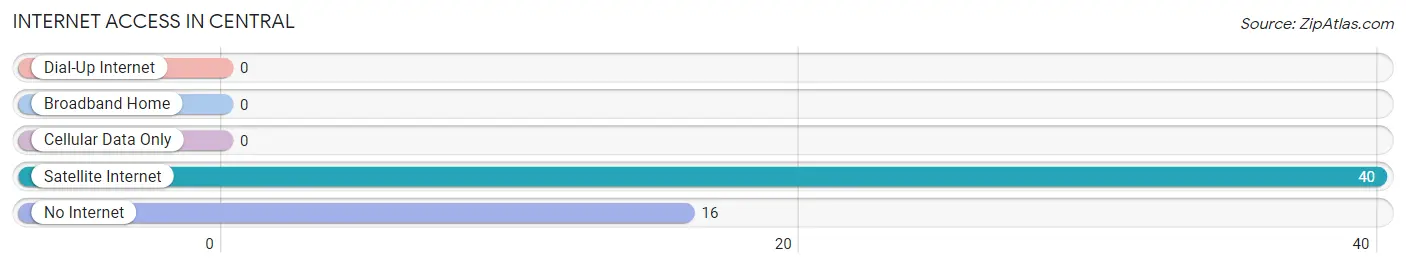
| Internet Type | # Households | % Households |
| Dial-Up Internet | 0 | 0.0% |
| Broadband Home | 0 | 0.0% |
| Cellular Data Only | 0 | 0.0% |
| Satellite Internet | 40 | 71.4% |
| No Internet | 16 | 28.6% |
| Total | 56 | 100.0% |
Central Summary
Central Alaska is a region of the U.S. state of Alaska located in the center of the state. It is bordered by the Alaska Range to the east, the Chugach Mountains to the south, the Alaska Peninsula to the west, and the Arctic Ocean to the north. The region is home to some of the most spectacular scenery in the world, with towering mountains, vast glaciers, and pristine rivers and lakes.
History
The history of Central Alaska is closely tied to the history of the Alaska Native people who have lived in the region for thousands of years. The Dena’ina, Ahtna, and Deg Hit’an Athabascan peoples have all called Central Alaska home for centuries. The region was also home to the Inupiat people, who lived in the area for thousands of years before the arrival of Europeans.
The first Europeans to explore Central Alaska were Russian fur traders, who arrived in the region in the late 18th century. The Russians established trading posts and settlements in the region, and the area became part of the Russian Empire. In 1867, the United States purchased Alaska from Russia, and the region became part of the United States.
In the late 19th century, gold was discovered in Central Alaska, and the region became a major center of the Alaska Gold Rush. Thousands of prospectors flocked to the region in search of gold, and the population of Central Alaska grew rapidly. The gold rush also brought an influx of settlers to the region, and many of the towns and cities in Central Alaska were founded during this period.
Geography
Central Alaska is a vast region, covering an area of over 200,000 square miles. The region is dominated by the Alaska Range, a mountain range that stretches for over 500 miles from the Alaska Peninsula to the Arctic Ocean. The Alaska Range is home to some of the highest peaks in North America, including Mount McKinley (now Denali), which is the highest peak in the United States.
The region is also home to numerous glaciers, including the massive Bering Glacier, which is the largest glacier in North America. The region is also home to numerous rivers and lakes, including the Yukon River, which is the longest river in Alaska.
Economy
The economy of Central Alaska is largely based on natural resources. The region is home to some of the largest oil and gas reserves in the United States, and oil and gas production is a major industry in the region. Mining is also an important industry in the region, with gold, silver, and other minerals being mined in the region.
The region is also home to a thriving tourism industry, with visitors coming to the region to experience the spectacular scenery and outdoor activities. Fishing is also an important industry in the region, with salmon, halibut, and other fish being harvested from the region’s rivers and lakes.
Demographics
As of the 2010 census, the population of Central Alaska was approximately 77,000. The region is home to a diverse population, with the largest ethnic groups being Native Americans, whites, and Asians. The region is also home to a large number of immigrants, with the largest immigrant groups being from Mexico, the Philippines, and India.
The region is also home to a large number of Alaska Native people, with the largest groups being the Dena’ina, Ahtna, and Deg Hit’an Athabascan peoples. The region is also home to a large number of military personnel, with the largest military bases being located in Fairbanks and Anchorage.
Common Questions
What is Per Capita Income in Central?
Per Capita income in Central is $21,601.
What is the Median Household income in Central?
Median Household Income in Central is $16,379.
What is Inequality or Gini Index in Central?
Inequality or Gini Index in Central is 0.54.
What is the Total Population of Central?
Total Population of Central is 105.
What is the Total Male Population of Central?
Total Male Population of Central is 57.
What is the Total Female Population of Central?
Total Female Population of Central is 48.
What is the Ratio of Males per 100 Females in Central?
There are 118.75 Males per 100 Females in Central.
What is the Ratio of Females per 100 Males in Central?
There are 84.21 Females per 100 Males in Central.
What is the Median Population Age in Central?
Median Population Age in Central is 56.7 Years.
What is the Average Family Size in Central
Average Family Size in Central is 8.0 People.
What is the Average Household Size in Central
Average Household Size in Central is 1.9 People.
How Large is the Labor Force in Central?
There are 33 People in the Labor Forcein in Central.
What is the Percentage of People in the Labor Force in Central?
39.3% of People are in the Labor Force in Central.