Arctic Village, AK Map & Demographics
Arctic Village Map
Arctic Village Overview
$13,427
PER CAPITA INCOME
$35,313
AVG HOUSEHOLD INCOME
38.4%
WAGE / INCOME GAP [ % ]
61.6¢/ $1
WAGE / INCOME GAP [ $ ]
0.45
INEQUALITY / GINI INDEX
199
TOTAL POPULATION
102
MALE POPULATION
97
FEMALE POPULATION
105.15
MALES / 100 FEMALES
95.10
FEMALES / 100 MALES
20.9
MEDIAN AGE
3.7
AVG FAMILY SIZE
3.0
AVG HOUSEHOLD SIZE
38
LABOR FORCE [ PEOPLE ]
29.7%
PERCENT IN LABOR FORCE
5.3%
UNEMPLOYMENT RATE
Arctic Village Zip Codes
Arctic Village Area Codes
Income in Arctic Village
Income Overview in Arctic Village
| Characteristic | Number | Measure |
| Per Capita Income | 199 | $13,427 |
| Median Family Income | 44 | $0 |
| Mean Family Income | 44 | $41,691 |
| Median Household Income | 65 | $35,313 |
| Mean Household Income | 65 | $39,748 |
| Income Deficit | 44 | $0 |
| Wage / Income Gap (%) | 199 | 38.39% |
| Wage / Income Gap ($) | 199 | 61.61¢ per $1 |
| Gini / Inequality Index | 199 | 0.45 |
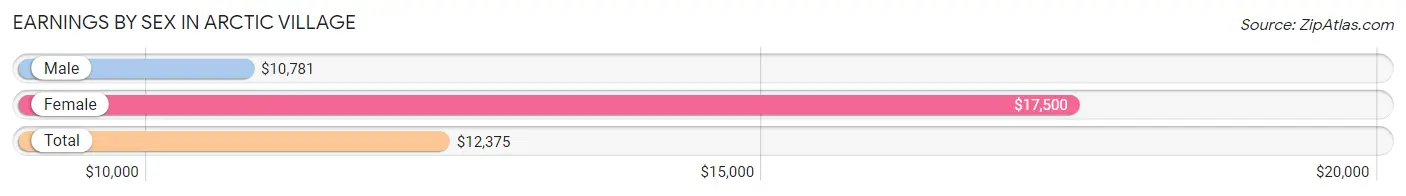
Earnings by Sex in Arctic Village
Average Earnings in Arctic Village are $12,375, $10,781 for men and $17,500 for women, a difference of 38.4%.
| Sex | Number | Average Earnings |
| Male | 45 (52.9%) | $10,781 |
| Female | 40 (47.1%) | $17,500 |
| Total | 85 (100.0%) | $12,375 |
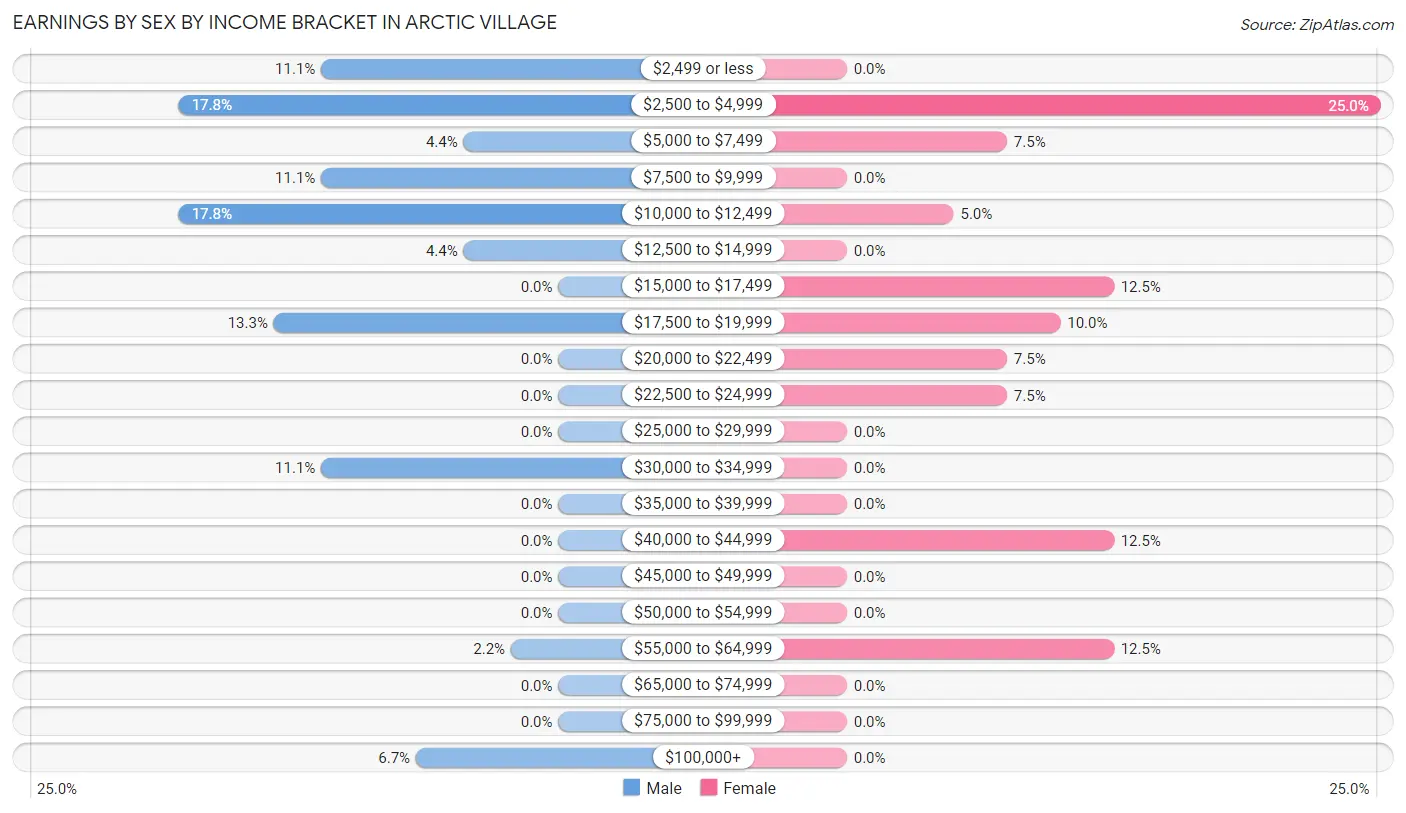
Earnings by Sex by Income Bracket in Arctic Village
The most common earnings brackets in Arctic Village are $2,500 to $4,999 for men (8 | 17.8%) and $2,500 to $4,999 for women (10 | 25.0%).
| Income | Male | Female |
| $2,499 or less | 5 (11.1%) | 0 (0.0%) |
| $2,500 to $4,999 | 8 (17.8%) | 10 (25.0%) |
| $5,000 to $7,499 | 2 (4.4%) | 3 (7.5%) |
| $7,500 to $9,999 | 5 (11.1%) | 0 (0.0%) |
| $10,000 to $12,499 | 8 (17.8%) | 2 (5.0%) |
| $12,500 to $14,999 | 2 (4.4%) | 0 (0.0%) |
| $15,000 to $17,499 | 0 (0.0%) | 5 (12.5%) |
| $17,500 to $19,999 | 6 (13.3%) | 4 (10.0%) |
| $20,000 to $22,499 | 0 (0.0%) | 3 (7.5%) |
| $22,500 to $24,999 | 0 (0.0%) | 3 (7.5%) |
| $25,000 to $29,999 | 0 (0.0%) | 0 (0.0%) |
| $30,000 to $34,999 | 5 (11.1%) | 0 (0.0%) |
| $35,000 to $39,999 | 0 (0.0%) | 0 (0.0%) |
| $40,000 to $44,999 | 0 (0.0%) | 5 (12.5%) |
| $45,000 to $49,999 | 0 (0.0%) | 0 (0.0%) |
| $50,000 to $54,999 | 0 (0.0%) | 0 (0.0%) |
| $55,000 to $64,999 | 1 (2.2%) | 5 (12.5%) |
| $65,000 to $74,999 | 0 (0.0%) | 0 (0.0%) |
| $75,000 to $99,999 | 0 (0.0%) | 0 (0.0%) |
| $100,000+ | 3 (6.7%) | 0 (0.0%) |
| Total | 45 (100.0%) | 40 (100.0%) |
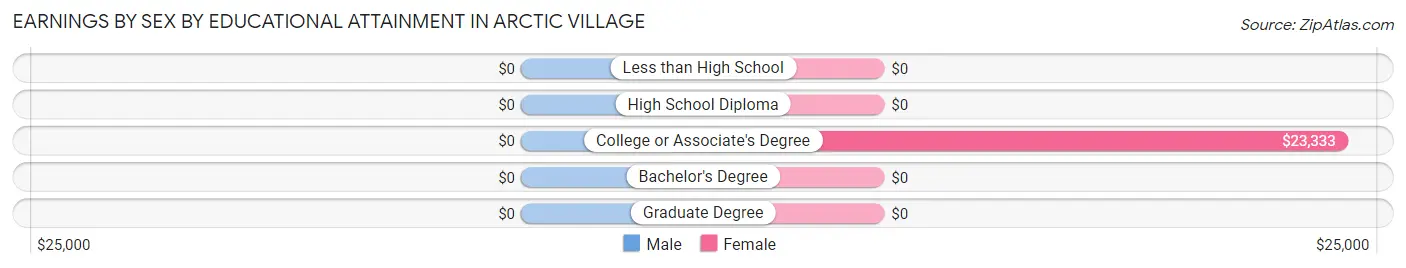
Earnings by Sex by Educational Attainment in Arctic Village
| Educational Attainment | Male Income | Female Income |
| Less than High School | - | - |
| High School Diploma | - | - |
| College or Associate's Degree | - | - |
| Bachelor's Degree | - | - |
| Graduate Degree | - | - |
| Total | $12,083 | $20,833 |
Family Income in Arctic Village
Family Income Brackets in Arctic Village
According to the Arctic Village family income data, there are 13 families falling into the $15,000 to $24,999 income range, which is the most common income bracket and makes up 29.5% of all families.
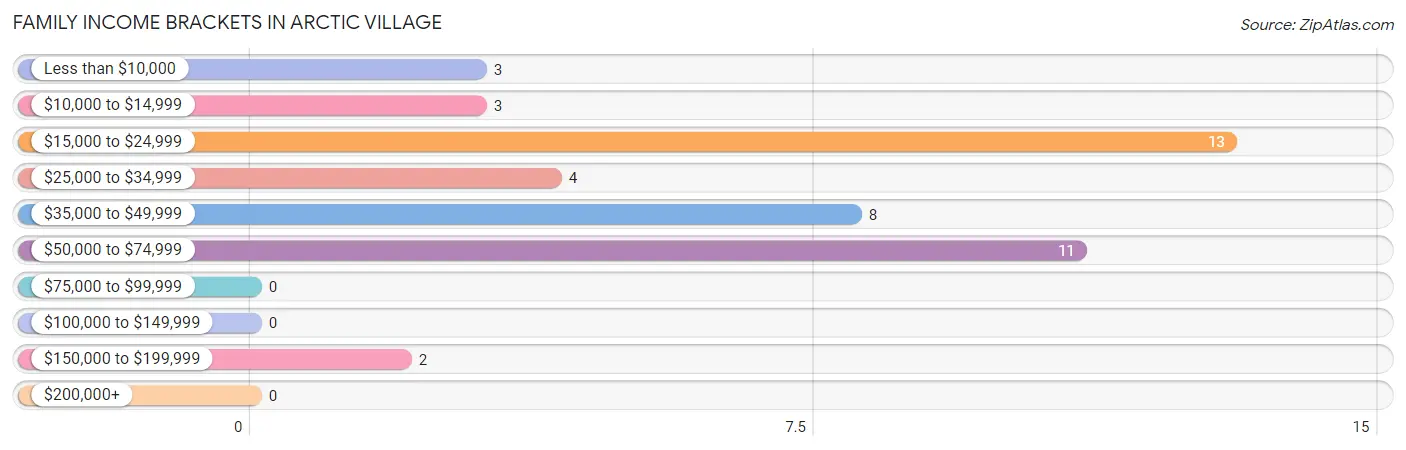
| Income Bracket | # Families | % Families |
| Less than $10,000 | 3 | 6.8% |
| $10,000 to $14,999 | 3 | 6.8% |
| $15,000 to $24,999 | 13 | 29.5% |
| $25,000 to $34,999 | 4 | 9.1% |
| $35,000 to $49,999 | 8 | 18.2% |
| $50,000 to $74,999 | 11 | 25.0% |
| $75,000 to $99,999 | 0 | 0.0% |
| $100,000 to $149,999 | 0 | 0.0% |
| $150,000 to $199,999 | 2 | 4.5% |
| $200,000+ | 0 | 0.0% |
Family Income by Famaliy Size in Arctic Village
5-person families (17 | 38.6%) account for the highest median family income in Arctic Village with $58,250 per family, while 3-person families (9 | 20.4%) have the highest median income of $14,583 per family member.
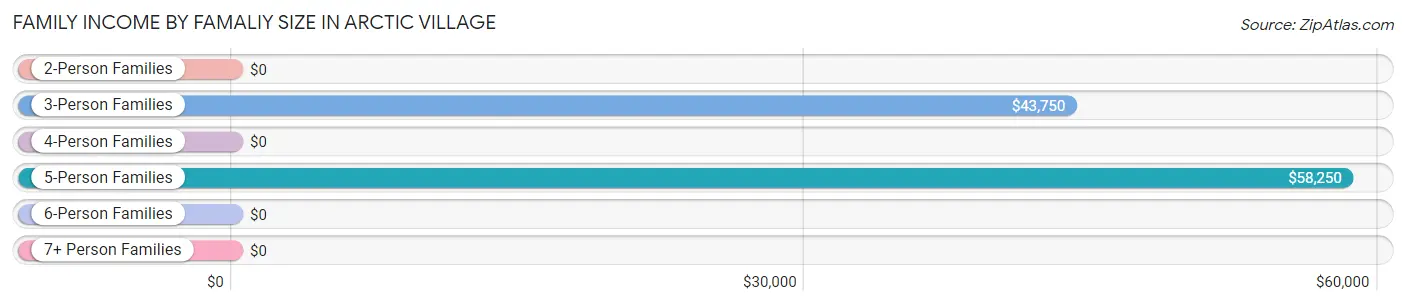
| Income Bracket | # Families | Median Income |
| 2-Person Families | 18 (40.9%) | $0 |
| 3-Person Families | 9 (20.4%) | $43,750 |
| 4-Person Families | 0 (0.0%) | $0 |
| 5-Person Families | 17 (38.6%) | $58,250 |
| 6-Person Families | 0 (0.0%) | $0 |
| 7+ Person Families | 0 (0.0%) | $0 |
| Total | 44 (100.0%) | $0 |
Family Income by Number of Earners in Arctic Village
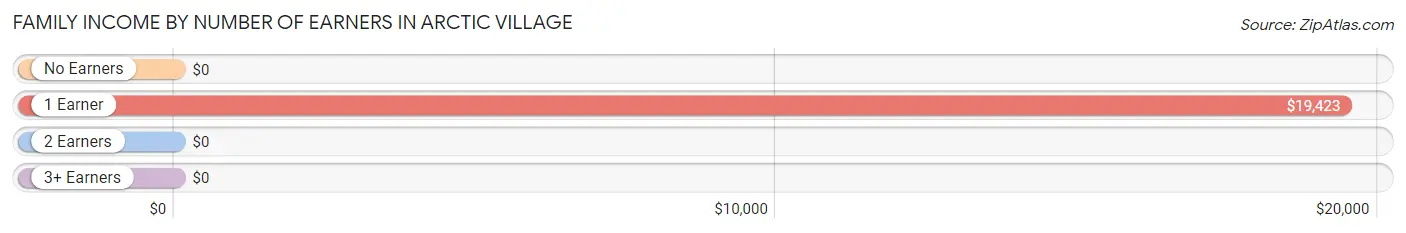
| Number of Earners | # Families | Median Income |
| No Earners | 3 (6.8%) | $0 |
| 1 Earner | 32 (72.7%) | $19,423 |
| 2 Earners | 3 (6.8%) | $0 |
| 3+ Earners | 6 (13.6%) | $0 |
| Total | 44 (100.0%) | $0 |
Household Income in Arctic Village
Household Income Brackets in Arctic Village
With 17 households falling in the category, the $35,000 to $49,999 income range is the most frequent in Arctic Village, accounting for 26.2% of all households.
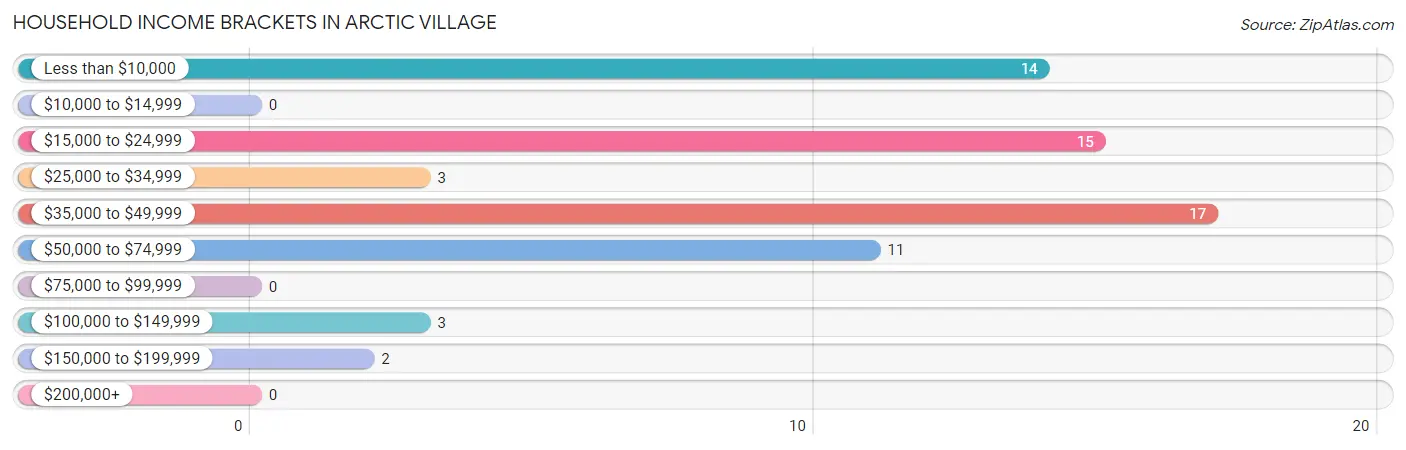
| Income Bracket | # Households | % Households |
| Less than $10,000 | 14 | 21.5% |
| $10,000 to $14,999 | 0 | 0.0% |
| $15,000 to $24,999 | 15 | 23.1% |
| $25,000 to $34,999 | 3 | 4.6% |
| $35,000 to $49,999 | 17 | 26.2% |
| $50,000 to $74,999 | 11 | 16.9% |
| $75,000 to $99,999 | 0 | 0.0% |
| $100,000 to $149,999 | 3 | 4.6% |
| $150,000 to $199,999 | 2 | 3.1% |
| $200,000+ | 0 | 0.0% |
Household Income by Householder Age in Arctic Village
The median household income in Arctic Village is $35,313, with the highest median household income of $43,125 found in the 25 to 44 years age bracket for the primary householder. A total of 30 households (46.2%) fall into this category.
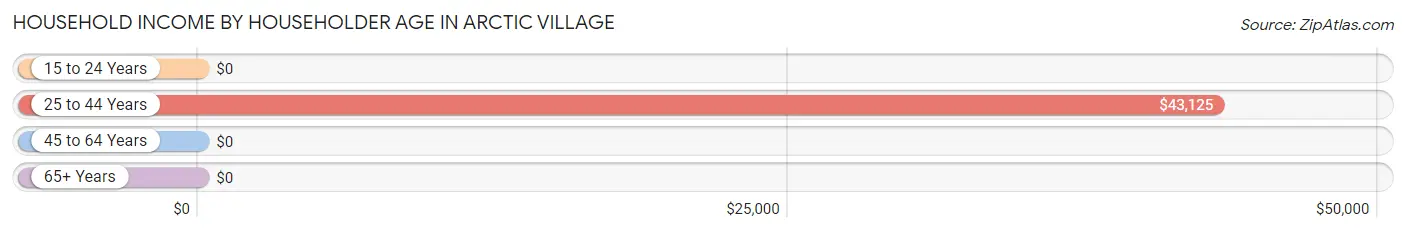
| Income Bracket | # Households | Median Income |
| 15 to 24 Years | 0 (0.0%) | $0 |
| 25 to 44 Years | 30 (46.2%) | $43,125 |
| 45 to 64 Years | 27 (41.5%) | $0 |
| 65+ Years | 8 (12.3%) | $0 |
| Total | 65 (100.0%) | $35,313 |
Poverty in Arctic Village
Income Below Poverty by Sex and Age in Arctic Village
With 46.1% poverty level for males and 45.4% for females among the residents of Arctic Village, 12 to 14 year old males and under 5 year old females are the most vulnerable to poverty, with 4 males (100.0%) and 8 females (100.0%) in their respective age groups living below the poverty level.
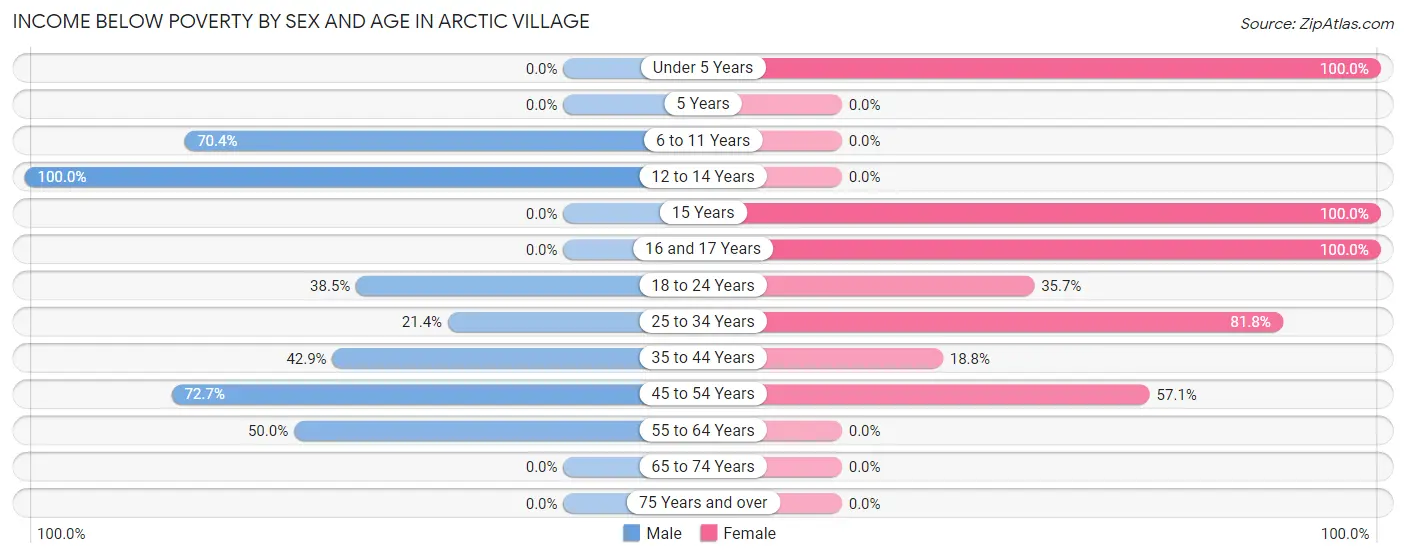
| Age Bracket | Male | Female |
| Under 5 Years | 0 (0.0%) | 8 (100.0%) |
| 5 Years | 0 (0.0%) | 0 (0.0%) |
| 6 to 11 Years | 19 (70.4%) | 0 (0.0%) |
| 12 to 14 Years | 4 (100.0%) | 0 (0.0%) |
| 15 Years | 0 (0.0%) | 8 (100.0%) |
| 16 and 17 Years | 0 (0.0%) | 3 (100.0%) |
| 18 to 24 Years | 5 (38.5%) | 5 (35.7%) |
| 25 to 34 Years | 3 (21.4%) | 9 (81.8%) |
| 35 to 44 Years | 3 (42.9%) | 3 (18.8%) |
| 45 to 54 Years | 8 (72.7%) | 8 (57.1%) |
| 55 to 64 Years | 5 (50.0%) | 0 (0.0%) |
| 65 to 74 Years | 0 (0.0%) | 0 (0.0%) |
| 75 Years and over | 0 (0.0%) | 0 (0.0%) |
| Total | 47 (46.1%) | 44 (45.4%) |
Income Above Poverty by Sex and Age in Arctic Village
According to the poverty statistics in Arctic Village, males aged under 5 years and females aged 6 to 11 years are the age groups that are most secure financially, with 100.0% of males and 100.0% of females in these age groups living above the poverty line.
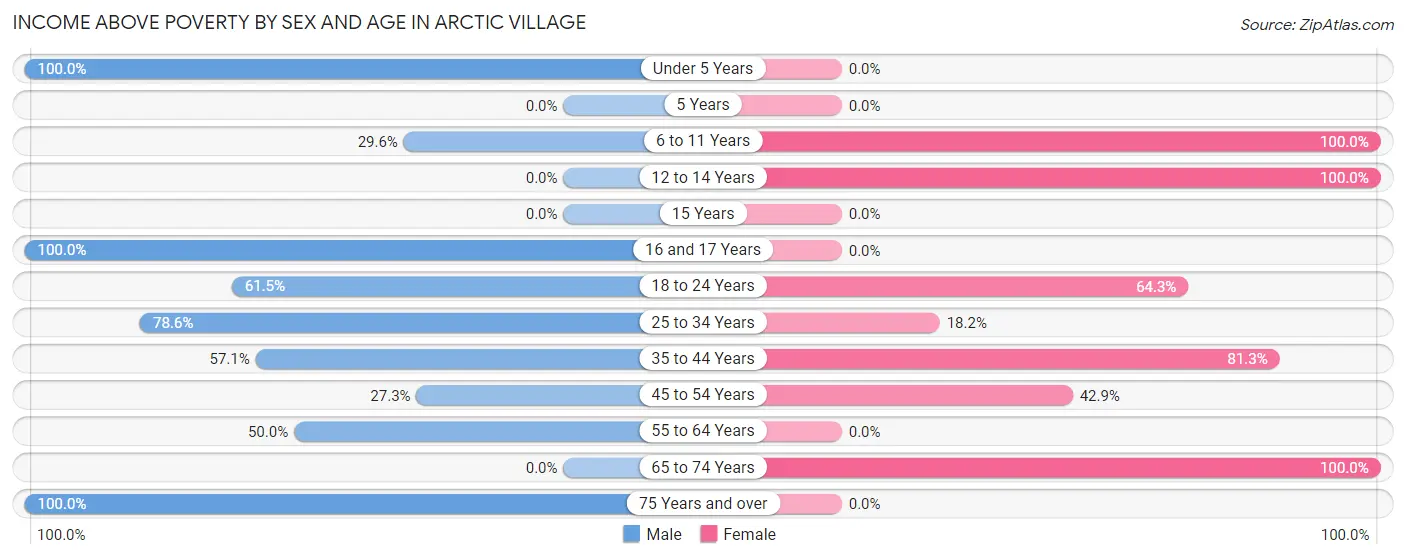
| Age Bracket | Male | Female |
| Under 5 Years | 6 (100.0%) | 0 (0.0%) |
| 5 Years | 0 (0.0%) | 0 (0.0%) |
| 6 to 11 Years | 8 (29.6%) | 13 (100.0%) |
| 12 to 14 Years | 0 (0.0%) | 5 (100.0%) |
| 15 Years | 0 (0.0%) | 0 (0.0%) |
| 16 and 17 Years | 7 (100.0%) | 0 (0.0%) |
| 18 to 24 Years | 8 (61.5%) | 9 (64.3%) |
| 25 to 34 Years | 11 (78.6%) | 2 (18.2%) |
| 35 to 44 Years | 4 (57.1%) | 13 (81.2%) |
| 45 to 54 Years | 3 (27.3%) | 6 (42.9%) |
| 55 to 64 Years | 5 (50.0%) | 0 (0.0%) |
| 65 to 74 Years | 0 (0.0%) | 5 (100.0%) |
| 75 Years and over | 3 (100.0%) | 0 (0.0%) |
| Total | 55 (53.9%) | 53 (54.6%) |
Income Below Poverty Among Married-Couple Families in Arctic Village
The poverty statistics for married-couple families in Arctic Village show that 60.0% or 3 of the total 5 families live below the poverty line. Families with 1 or 2 children have the highest poverty rate of 100.0%, comprising of 3 families. On the other hand, families with 3 or 4 children have the lowest poverty rate of 0.0%, which includes 0 families.
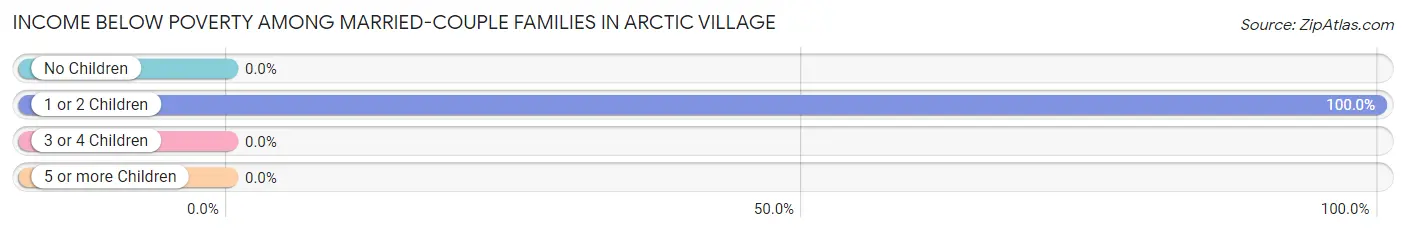
| Children | Above Poverty | Below Poverty |
| No Children | 0 (0.0%) | 0 (0.0%) |
| 1 or 2 Children | 0 (0.0%) | 3 (100.0%) |
| 3 or 4 Children | 2 (100.0%) | 0 (0.0%) |
| 5 or more Children | 0 (0.0%) | 0 (0.0%) |
| Total | 2 (40.0%) | 3 (60.0%) |
Income Below Poverty Among Single-Parent Households in Arctic Village
According to the poverty data in Arctic Village, 50.0% or 3 single-father households and 36.4% or 12 single-mother households are living below the poverty line. Among single-father households, those with 1 or 2 children have the highest poverty rate, with 3 households (100.0%) experiencing poverty. Likewise, among single-mother households, those with 3 or 4 children have the highest poverty rate, with 7 households (58.3%) falling below the poverty line.
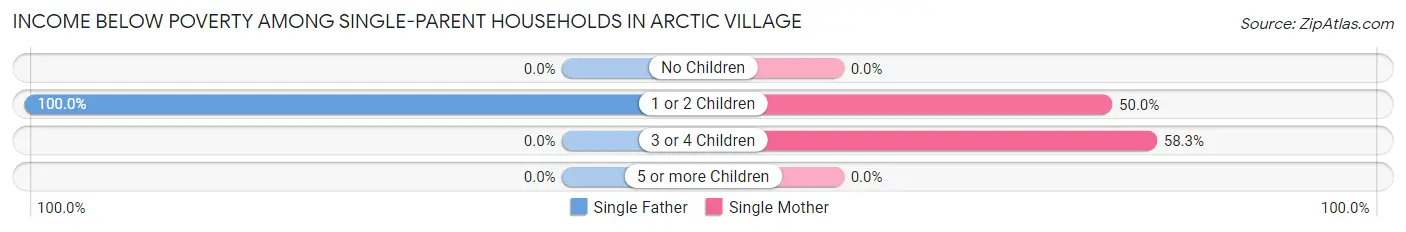
| Children | Single Father | Single Mother |
| No Children | 0 (0.0%) | 0 (0.0%) |
| 1 or 2 Children | 3 (100.0%) | 5 (50.0%) |
| 3 or 4 Children | 0 (0.0%) | 7 (58.3%) |
| 5 or more Children | 0 (0.0%) | 0 (0.0%) |
| Total | 3 (50.0%) | 12 (36.4%) |
Income Below Poverty Among Married-Couple vs Single-Parent Households in Arctic Village
The poverty data for Arctic Village shows that 3 of the married-couple family households (60.0%) and 15 of the single-parent households (38.5%) are living below the poverty level. Within the married-couple family households, those with 1 or 2 children have the highest poverty rate, with 3 households (100.0%) falling below the poverty line. Among the single-parent households, those with 1 or 2 children have the highest poverty rate, with 8 household (61.5%) living below poverty.
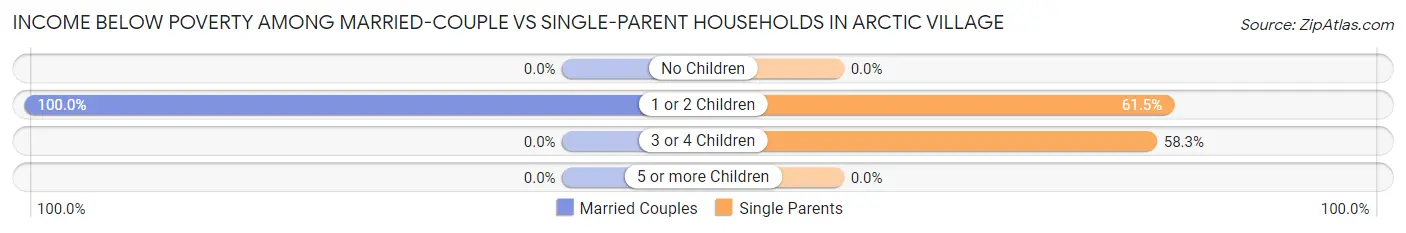
| Children | Married-Couple Families | Single-Parent Households |
| No Children | 0 (0.0%) | 0 (0.0%) |
| 1 or 2 Children | 3 (100.0%) | 8 (61.5%) |
| 3 or 4 Children | 0 (0.0%) | 7 (58.3%) |
| 5 or more Children | 0 (0.0%) | 0 (0.0%) |
| Total | 3 (60.0%) | 15 (38.5%) |
Race in Arctic Village
The most populous races in Arctic Village are Native / Alaskan (196 | 98.5%), and White / Caucasian (3 | 1.5%).
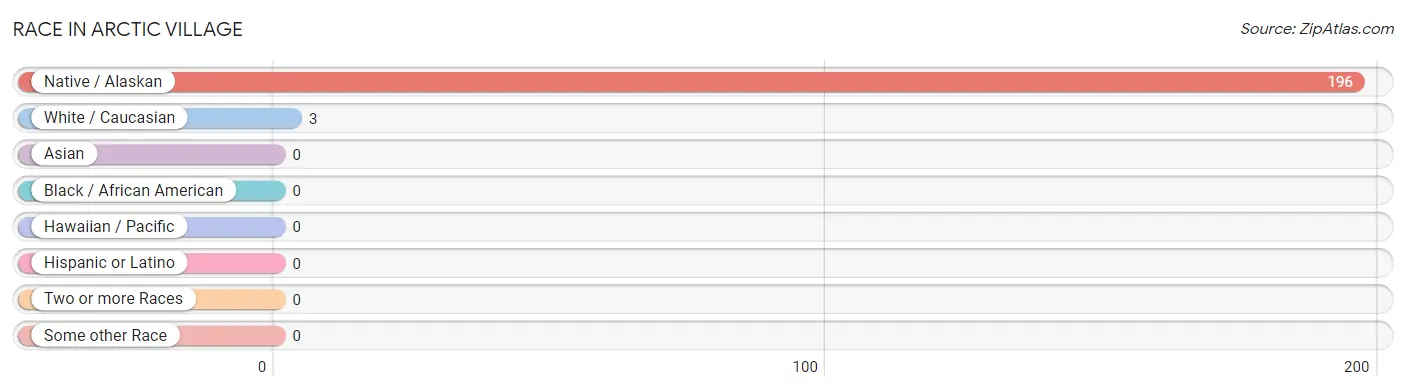
| Race | # Population | % Population |
| Asian | 0 | 0.0% |
| Black / African American | 0 | 0.0% |
| Hawaiian / Pacific | 0 | 0.0% |
| Hispanic or Latino | 0 | 0.0% |
| Native / Alaskan | 196 | 98.5% |
| White / Caucasian | 3 | 1.5% |
| Two or more Races | 0 | 0.0% |
| Some other Race | 0 | 0.0% |
| Total | 199 | 100.0% |
Ancestry in Arctic Village
The most populous ancestries reported in Arctic Village are Alaskan Athabascan (181 | 90.9%), Alaska Native (11 | 5.5%), Italian (4 | 2.0%), Inupiat (3 | 1.5%), and Irish (3 | 1.5%), together accounting for 101.5% of all Arctic Village residents.
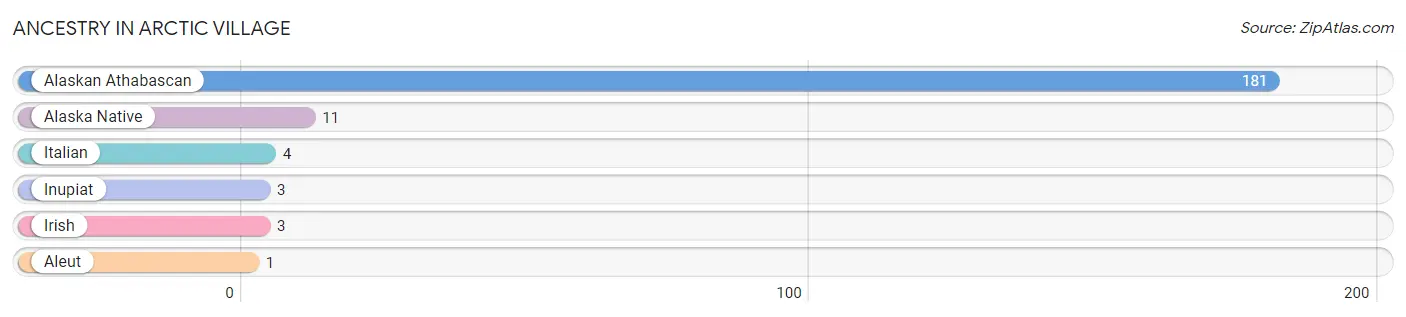
| Ancestry | # Population | % Population |
| Alaska Native | 11 | 5.5% |
| Alaskan Athabascan | 181 | 90.9% |
| Aleut | 1 | 0.5% |
| Inupiat | 3 | 1.5% |
| Irish | 3 | 1.5% |
| Italian | 4 | 2.0% | View All 6 Rows |
Immigrants in Arctic Village

| Immigration Origin | # Population | % Population | View All 0 Rows |
Sex and Age in Arctic Village
Sex and Age in Arctic Village
The most populous age groups in Arctic Village are 5 to 9 Years (18 | 17.6%) for men and 15 to 19 Years (21 | 21.6%) for women.
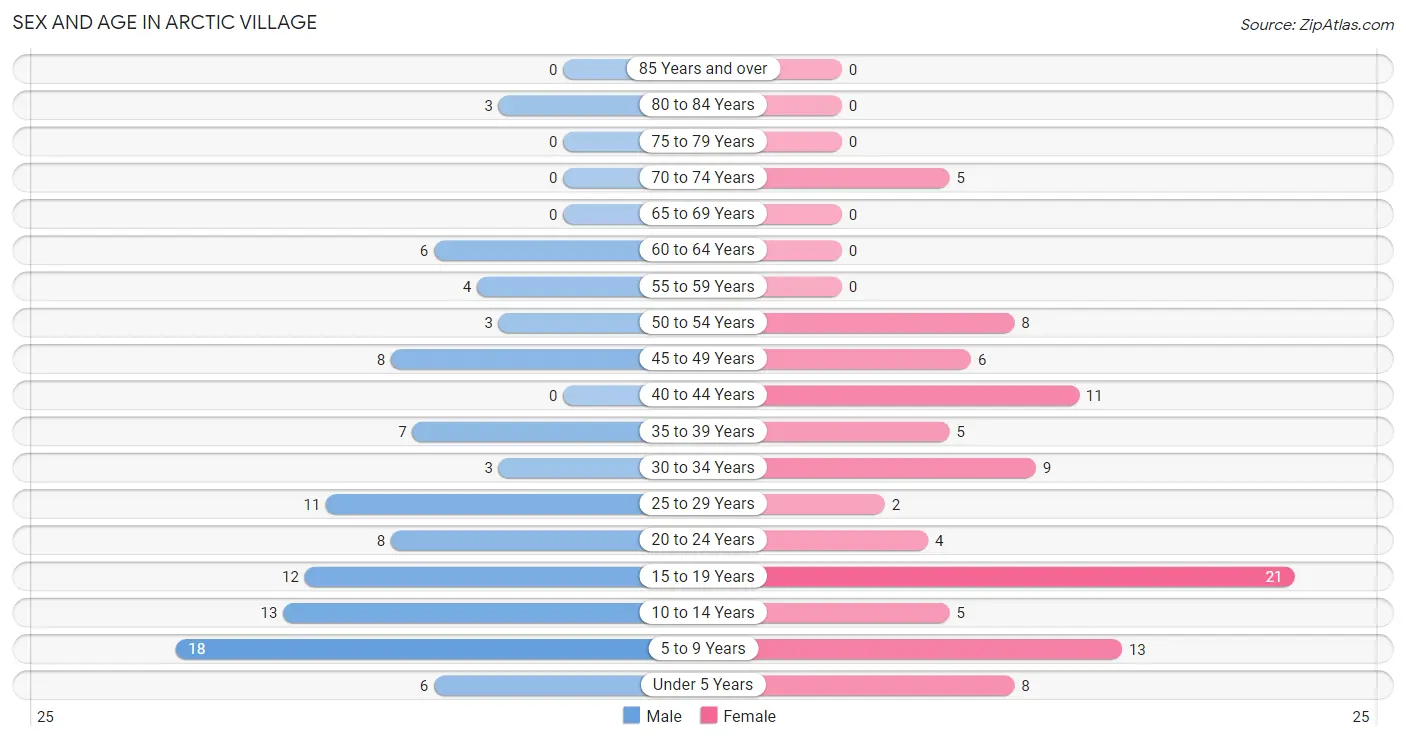
| Age Bracket | Male | Female |
| Under 5 Years | 6 (5.9%) | 8 (8.3%) |
| 5 to 9 Years | 18 (17.6%) | 13 (13.4%) |
| 10 to 14 Years | 13 (12.8%) | 5 (5.1%) |
| 15 to 19 Years | 12 (11.8%) | 21 (21.6%) |
| 20 to 24 Years | 8 (7.8%) | 4 (4.1%) |
| 25 to 29 Years | 11 (10.8%) | 2 (2.1%) |
| 30 to 34 Years | 3 (2.9%) | 9 (9.3%) |
| 35 to 39 Years | 7 (6.9%) | 5 (5.1%) |
| 40 to 44 Years | 0 (0.0%) | 11 (11.3%) |
| 45 to 49 Years | 8 (7.8%) | 6 (6.2%) |
| 50 to 54 Years | 3 (2.9%) | 8 (8.3%) |
| 55 to 59 Years | 4 (3.9%) | 0 (0.0%) |
| 60 to 64 Years | 6 (5.9%) | 0 (0.0%) |
| 65 to 69 Years | 0 (0.0%) | 0 (0.0%) |
| 70 to 74 Years | 0 (0.0%) | 5 (5.1%) |
| 75 to 79 Years | 0 (0.0%) | 0 (0.0%) |
| 80 to 84 Years | 3 (2.9%) | 0 (0.0%) |
| 85 Years and over | 0 (0.0%) | 0 (0.0%) |
| Total | 102 (100.0%) | 97 (100.0%) |
Families and Households in Arctic Village
Median Family Size in Arctic Village
The median family size in Arctic Village is 3.70 persons per family, with married-couple families (5 | 11.4%) accounting for the largest median family size of 6.4 persons per family. On the other hand, single male/father families (6 | 13.6%) represent the smallest median family size with 1.67 persons per family.
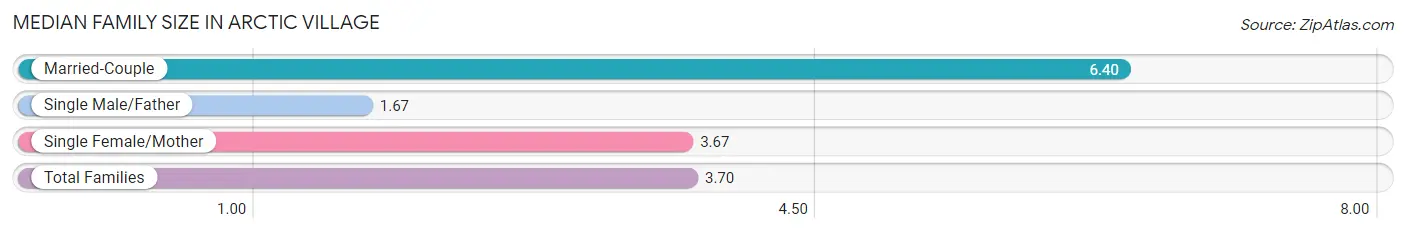
| Family Type | # Families | Family Size |
| Married-Couple | 5 (11.4%) | 6.40 |
| Single Male/Father | 6 (13.6%) | 1.67 |
| Single Female/Mother | 33 (75.0%) | 3.67 |
| Total Families | 44 (100.0%) | 3.70 |
Median Household Size in Arctic Village
The median household size in Arctic Village is 3.05 persons per household, with married-couple households (5 | 7.7%) accounting for the largest median household size of 6.4 persons per household. non-family households (21 | 32.3%) represent the smallest median household size with 1.24 persons per household.
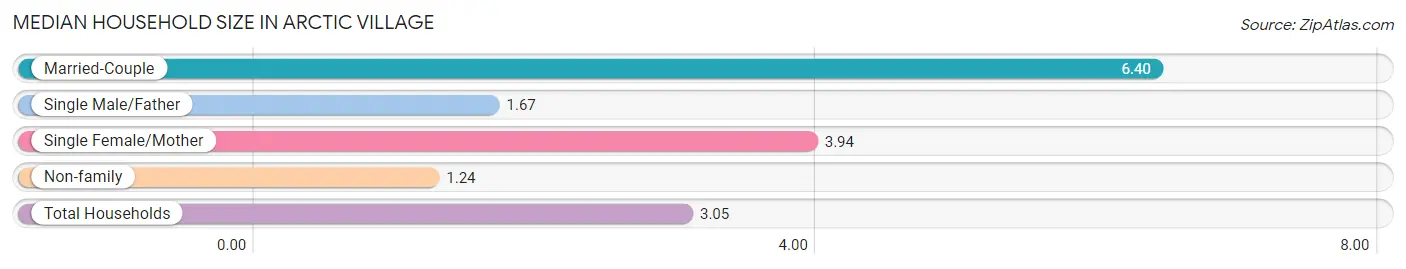
| Household Type | # Households | Household Size |
| Married-Couple | 5 (7.7%) | 6.40 |
| Single Male/Father | 6 (9.2%) | 1.67 |
| Single Female/Mother | 33 (50.8%) | 3.94 |
| Non-family | 21 (32.3%) | 1.24 |
| Total Households | 65 (100.0%) | 3.05 |
Household Size by Marriage Status in Arctic Village
Out of a total of 65 households in Arctic Village, 44 (67.7%) are family households, while 21 (32.3%) are nonfamily households. The most numerous type of family households are 2-person households, comprising 18, and the most common type of nonfamily households are 1-person households, comprising 16.
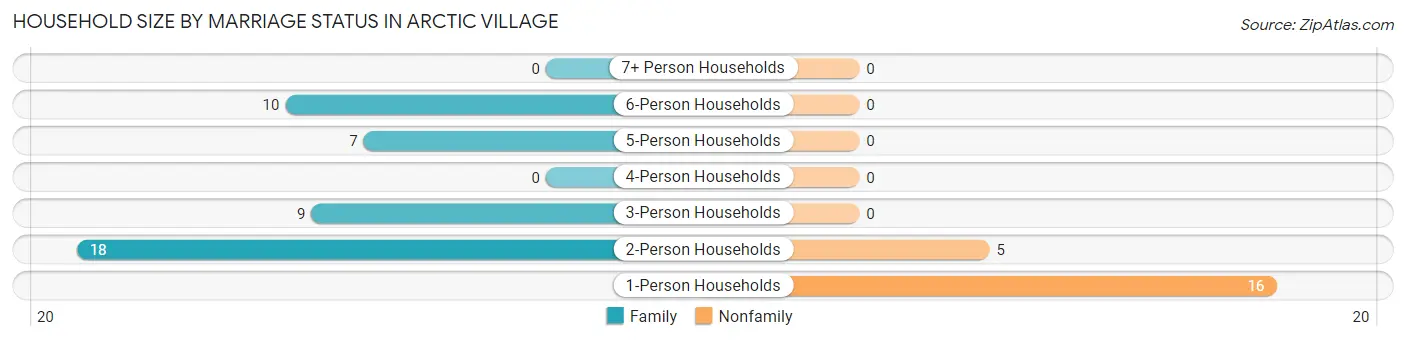
| Household Size | Family Households | Nonfamily Households |
| 1-Person Households | - | 16 (24.6%) |
| 2-Person Households | 18 (27.7%) | 5 (7.7%) |
| 3-Person Households | 9 (13.9%) | 0 (0.0%) |
| 4-Person Households | 0 (0.0%) | 0 (0.0%) |
| 5-Person Households | 7 (10.8%) | 0 (0.0%) |
| 6-Person Households | 10 (15.4%) | 0 (0.0%) |
| 7+ Person Households | 0 (0.0%) | 0 (0.0%) |
| Total | 44 (67.7%) | 21 (32.3%) |
Female Fertility in Arctic Village
Fertility by Age in Arctic Village
| Age Bracket | Women with Births | Births / 1,000 Women |
| 15 to 19 years | 0 (0.0%) | 0.0 |
| 20 to 34 years | 0 (0.0%) | 0.0 |
| 35 to 50 years | 0 (0.0%) | 0.0 |
| Total | 0 (0.0%) | 0.0 |
Fertility by Age by Marriage Status in Arctic Village
| Age Bracket | Married | Unmarried |
| 15 to 19 years | 0 (0.0%) | 0 (0.0%) |
| 20 to 34 years | 0 (0.0%) | 0 (0.0%) |
| 35 to 50 years | 0 (0.0%) | 0 (0.0%) |
| Total | 0 (0.0%) | 0 (0.0%) |
Fertility by Education in Arctic Village
| Educational Attainment | Women with Births | Births / 1,000 Women |
| Less than High School | 0 (0.0%) | 0.0 |
| High School Diploma | 0 (0.0%) | 0.0 |
| College or Associate's Degree | 0 (0.0%) | 0.0 |
| Bachelor's Degree | 0 (0.0%) | 0.0 |
| Graduate Degree | 0 (0.0%) | 0.0 |
| Total | 0 (0.0%) | 0.0 |
Fertility by Education by Marriage Status in Arctic Village
| Educational Attainment | Married | Unmarried |
| Less than High School | 0 (0.0%) | 0 (0.0%) |
| High School Diploma | 0 (0.0%) | 0 (0.0%) |
| College or Associate's Degree | 0 (0.0%) | 0 (0.0%) |
| Bachelor's Degree | 0 (0.0%) | 0 (0.0%) |
| Graduate Degree | 0 (0.0%) | 0 (0.0%) |
| Total | 0 (0.0%) | 0 (0.0%) |
Employment Characteristics in Arctic Village
Employment by Class of Employer in Arctic Village
Among the 32 employed individuals in Arctic Village, local government employees (25 | 78.1%), state government employees (3 | 9.4%), and federal government employees (3 | 9.4%) make up the most common classes of employment.
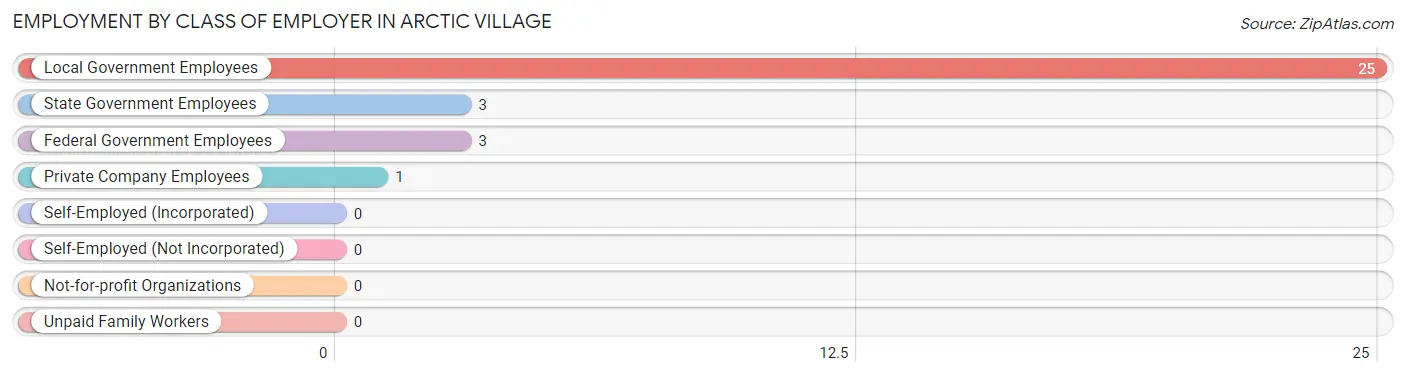
| Employer Class | # Employees | % Employees |
| Private Company Employees | 1 | 3.1% |
| Self-Employed (Incorporated) | 0 | 0.0% |
| Self-Employed (Not Incorporated) | 0 | 0.0% |
| Not-for-profit Organizations | 0 | 0.0% |
| Local Government Employees | 25 | 78.1% |
| State Government Employees | 3 | 9.4% |
| Federal Government Employees | 3 | 9.4% |
| Unpaid Family Workers | 0 | 0.0% |
| Total | 32 | 100.0% |
Employment Status by Age in Arctic Village
According to the labor force statistics for Arctic Village, out of the total population over 16 years of age (128), 29.7% or 38 individuals are in the labor force, with 5.3% or 2 of them unemployed. The age group with the highest labor force participation rate is 35 to 44 years, with 56.5% or 13 individuals in the labor force. Within the labor force, the 30 to 34 years age range has the highest percentage of unemployed individuals, with 33.3% or 2 of them being unemployed.
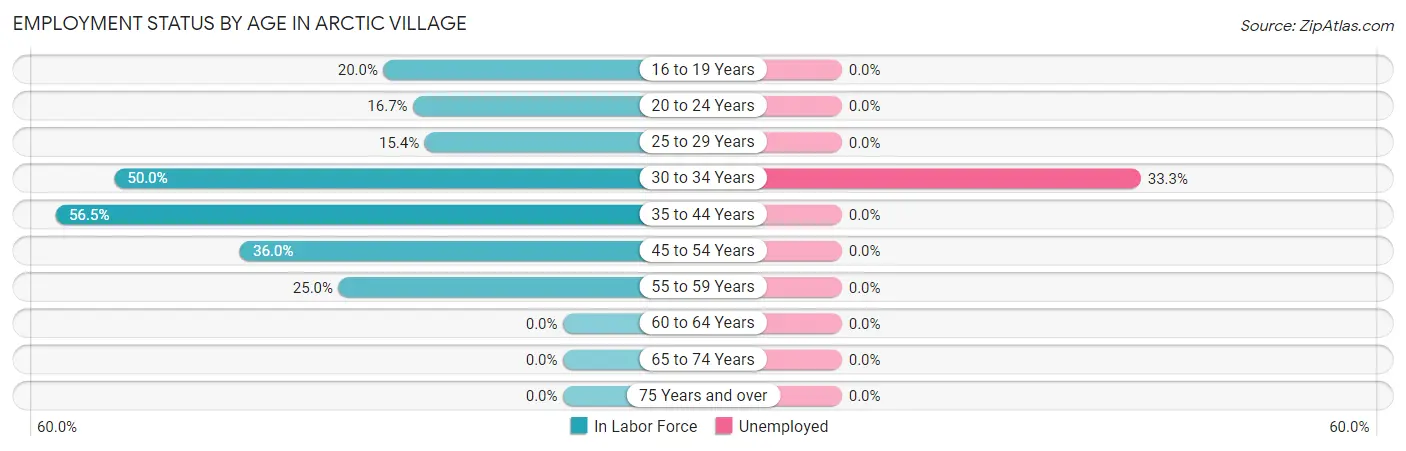
| Age Bracket | In Labor Force | Unemployed |
| 16 to 19 Years | 5 (20.0%) | 0 (0.0%) |
| 20 to 24 Years | 2 (16.7%) | 0 (0.0%) |
| 25 to 29 Years | 2 (15.4%) | 0 (0.0%) |
| 30 to 34 Years | 6 (50.0%) | 2 (33.3%) |
| 35 to 44 Years | 13 (56.5%) | 0 (0.0%) |
| 45 to 54 Years | 9 (36.0%) | 0 (0.0%) |
| 55 to 59 Years | 1 (25.0%) | 0 (0.0%) |
| 60 to 64 Years | 0 (0.0%) | 0 (0.0%) |
| 65 to 74 Years | 0 (0.0%) | 0 (0.0%) |
| 75 Years and over | 0 (0.0%) | 0 (0.0%) |
| Total | 38 (29.7%) | 2 (5.3%) |
Employment Status by Educational Attainment in Arctic Village
According to labor force statistics for Arctic Village, 37.3% of individuals (31) out of the total population between 25 and 64 years of age (83) are in the labor force, with 6.5% or 2 of them being unemployed. The group with the highest labor force participation rate are those with the educational attainment of bachelor's degree or higher, with 100.0% or 3 individuals in the labor force. Within the labor force, individuals with high school diploma education have the highest percentage of unemployment, with 50.0% or 2 of them being unemployed.
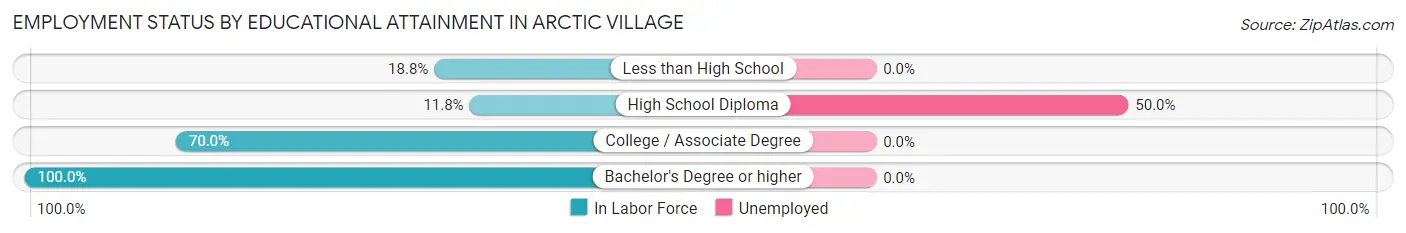
| Educational Attainment | In Labor Force | Unemployed |
| Less than High School | 3 (18.8%) | 0 (0.0%) |
| High School Diploma | 4 (11.8%) | 17 (50.0%) |
| College / Associate Degree | 21 (70.0%) | 0 (0.0%) |
| Bachelor's Degree or higher | 3 (100.0%) | 0 (0.0%) |
| Total | 31 (37.3%) | 5 (6.5%) |
Employment Occupations by Sex in Arctic Village
Management, Business, Science and Arts Occupations
The most common Management, Business, Science and Arts occupations in Arctic Village are Community & Social Service (14 | 38.9%), Education, Arts & Media (9 | 25.0%), Education Instruction & Library (5 | 13.9%), Management (3 | 8.3%), and Business & Financial (2 | 5.6%).
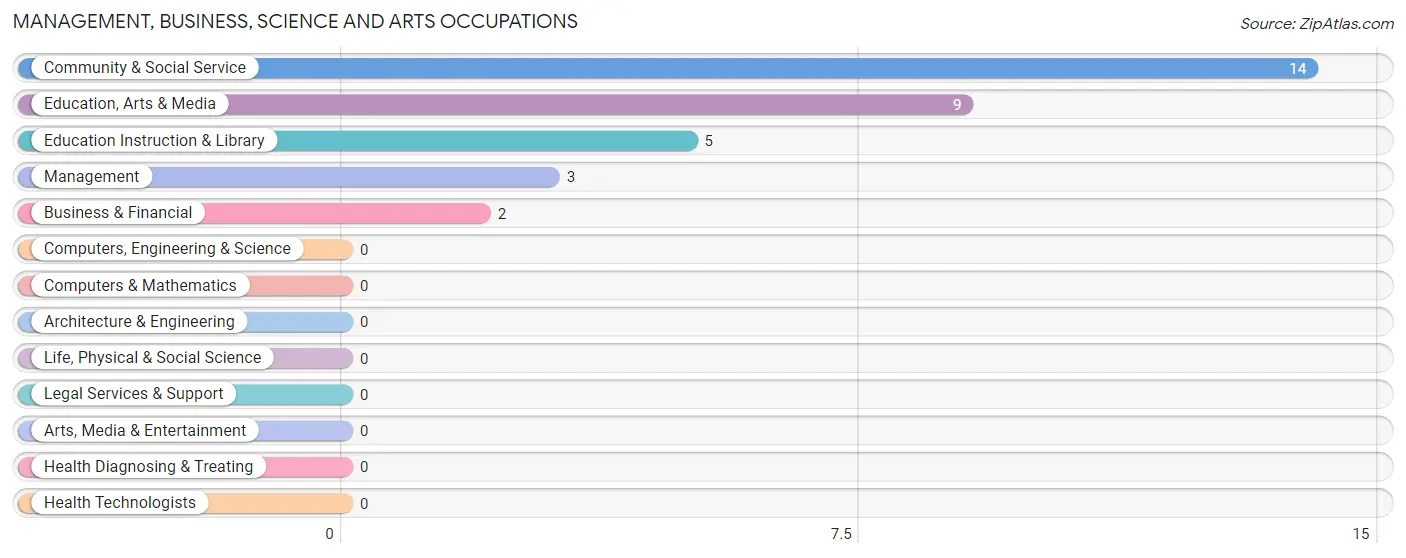
Management, Business, Science and Arts Occupations by Sex
Within the Management, Business, Science and Arts occupations in Arctic Village, the most male-oriented occupations are Education Instruction & Library (100.0%), and Community & Social Service (35.7%), while the most female-oriented occupations are Management (100.0%), Business & Financial (100.0%), and Education, Arts & Media (100.0%).
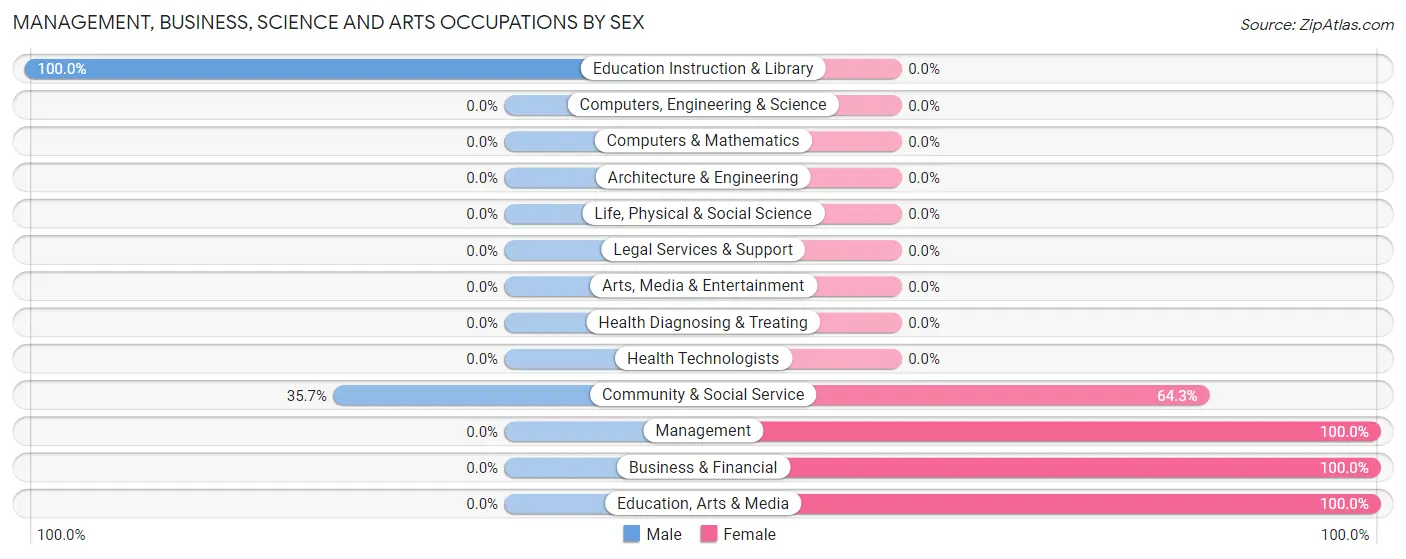
| Occupation | Male | Female |
| Management | 0 (0.0%) | 3 (100.0%) |
| Business & Financial | 0 (0.0%) | 2 (100.0%) |
| Computers, Engineering & Science | 0 (0.0%) | 0 (0.0%) |
| Computers & Mathematics | 0 (0.0%) | 0 (0.0%) |
| Architecture & Engineering | 0 (0.0%) | 0 (0.0%) |
| Life, Physical & Social Science | 0 (0.0%) | 0 (0.0%) |
| Community & Social Service | 5 (35.7%) | 9 (64.3%) |
| Education, Arts & Media | 0 (0.0%) | 9 (100.0%) |
| Legal Services & Support | 0 (0.0%) | 0 (0.0%) |
| Education Instruction & Library | 5 (100.0%) | 0 (0.0%) |
| Arts, Media & Entertainment | 0 (0.0%) | 0 (0.0%) |
| Health Diagnosing & Treating | 0 (0.0%) | 0 (0.0%) |
| Health Technologists | 0 (0.0%) | 0 (0.0%) |
| Total (Category) | 5 (26.3%) | 14 (73.7%) |
| Total (Overall) | 11 (30.6%) | 25 (69.4%) |
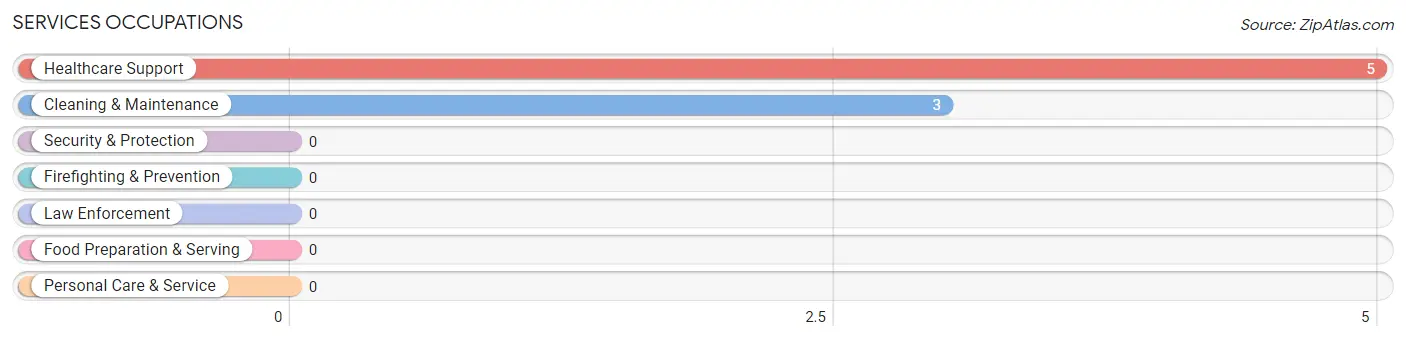
Services Occupations
The most common Services occupations in Arctic Village are Healthcare Support (5 | 13.9%), and Cleaning & Maintenance (3 | 8.3%).
Services Occupations by Sex
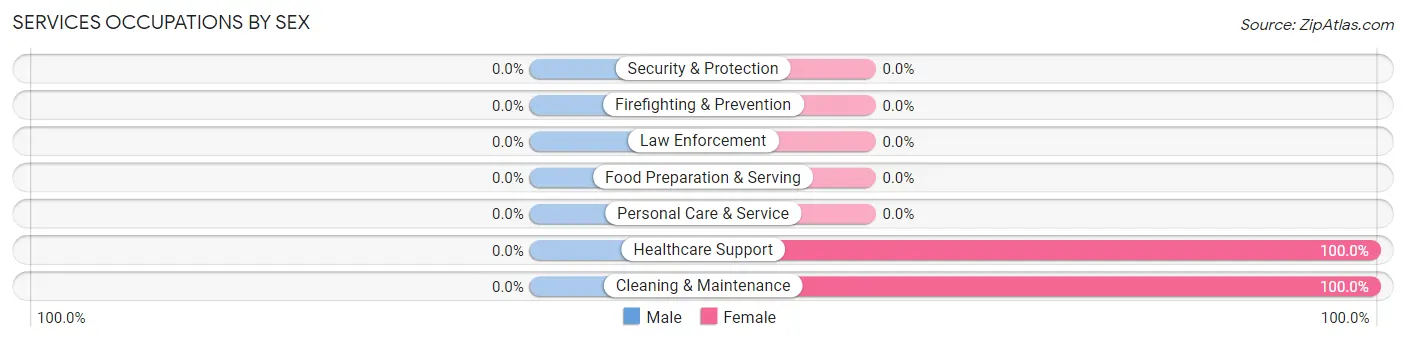
| Occupation | Male | Female |
| Healthcare Support | 0 (0.0%) | 5 (100.0%) |
| Security & Protection | 0 (0.0%) | 0 (0.0%) |
| Firefighting & Prevention | 0 (0.0%) | 0 (0.0%) |
| Law Enforcement | 0 (0.0%) | 0 (0.0%) |
| Food Preparation & Serving | 0 (0.0%) | 0 (0.0%) |
| Cleaning & Maintenance | 0 (0.0%) | 3 (100.0%) |
| Personal Care & Service | 0 (0.0%) | 0 (0.0%) |
| Total (Category) | 0 (0.0%) | 8 (100.0%) |
| Total (Overall) | 11 (30.6%) | 25 (69.4%) |
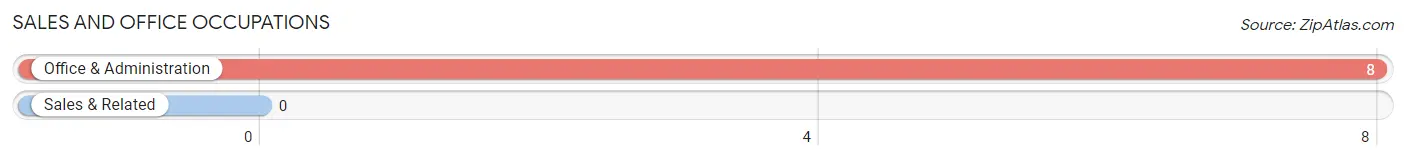
Sales and Office Occupations
The most common Sales and Office occupations in Arctic Village are , and Office & Administration (8 | 22.2%).
Sales and Office Occupations by Sex
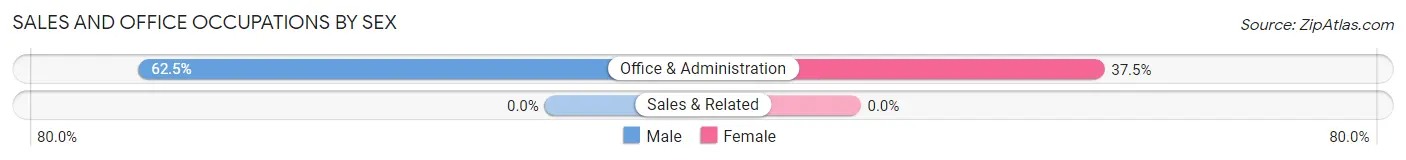
| Occupation | Male | Female |
| Sales & Related | 0 (0.0%) | 0 (0.0%) |
| Office & Administration | 5 (62.5%) | 3 (37.5%) |
| Total (Category) | 5 (62.5%) | 3 (37.5%) |
| Total (Overall) | 11 (30.6%) | 25 (69.4%) |
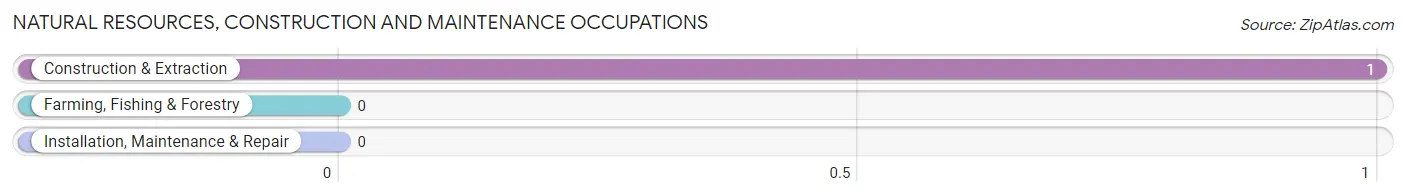
Natural Resources, Construction and Maintenance Occupations
The most common Natural Resources, Construction and Maintenance occupations in Arctic Village are , and Construction & Extraction (1 | 2.8%).
Natural Resources, Construction and Maintenance Occupations by Sex
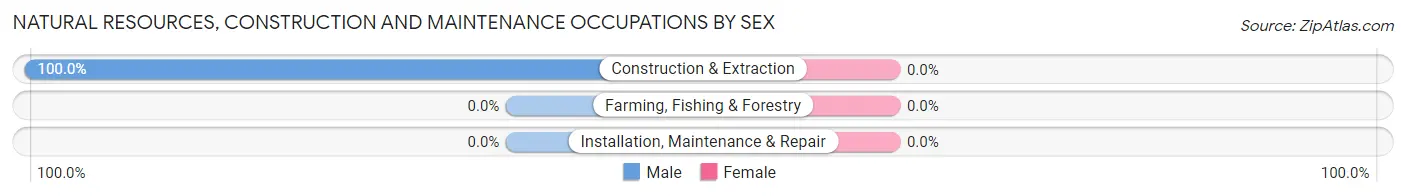
| Occupation | Male | Female |
| Farming, Fishing & Forestry | 0 (0.0%) | 0 (0.0%) |
| Construction & Extraction | 1 (100.0%) | 0 (0.0%) |
| Installation, Maintenance & Repair | 0 (0.0%) | 0 (0.0%) |
| Total (Category) | 1 (100.0%) | 0 (0.0%) |
| Total (Overall) | 11 (30.6%) | 25 (69.4%) |
Production, Transportation and Moving Occupations
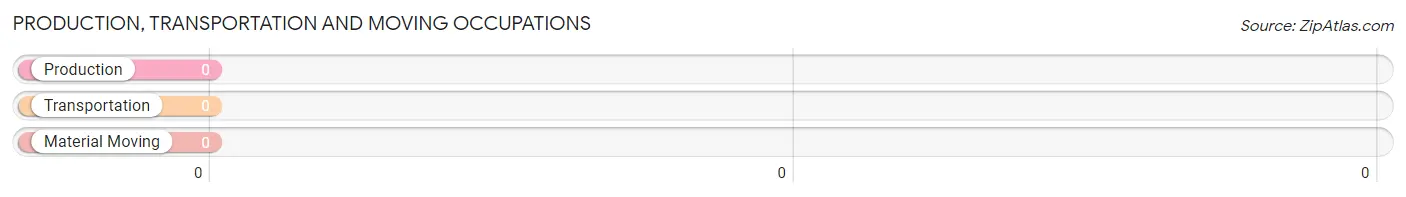
Production, Transportation and Moving Occupations by Sex
| Occupation | Male | Female |
| Production | 0 (0.0%) | 0 (0.0%) |
| Transportation | 0 (0.0%) | 0 (0.0%) |
| Material Moving | 0 (0.0%) | 0 (0.0%) |
| Total (Category) | 0 (0.0%) | 0 (0.0%) |
| Total (Overall) | 11 (30.6%) | 25 (69.4%) |
Employment Industries by Sex in Arctic Village
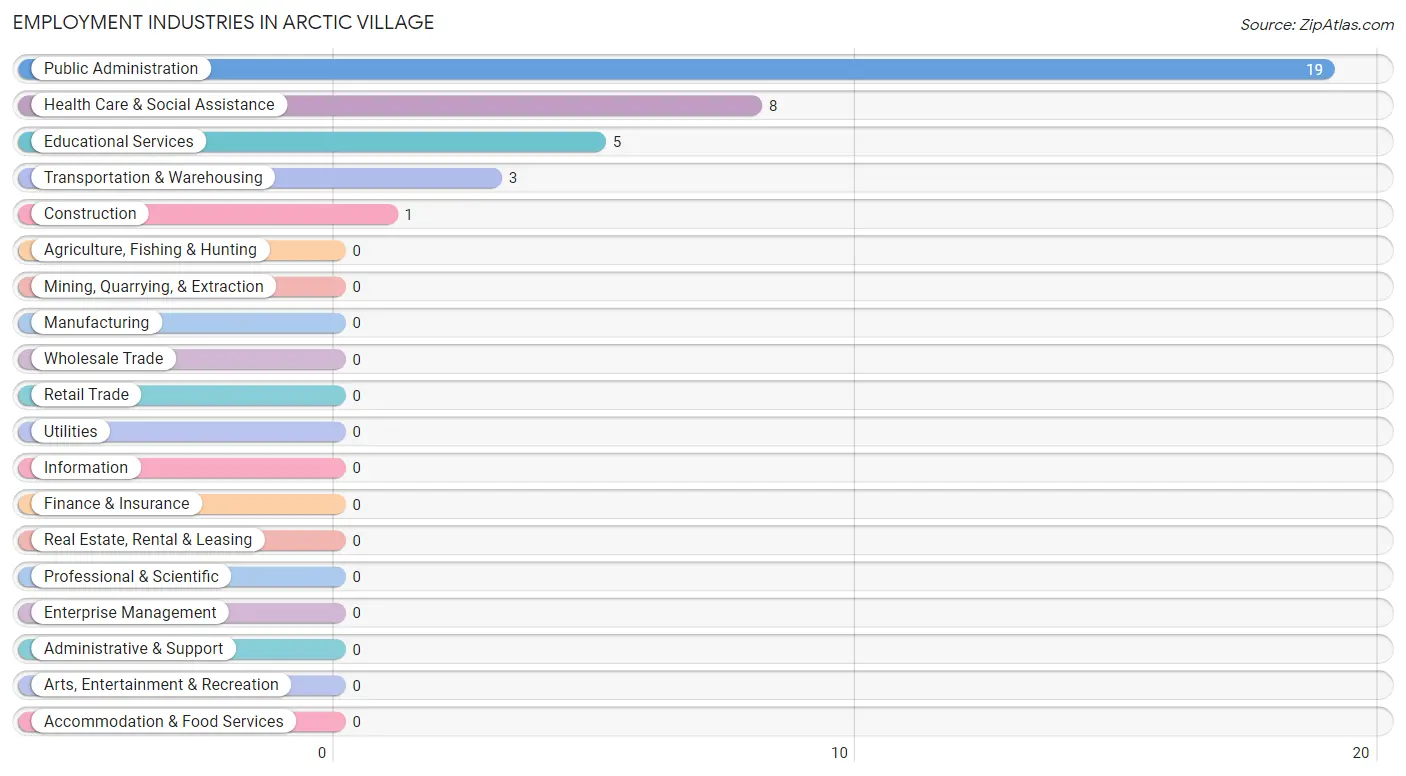
Employment Industries in Arctic Village
The major employment industries in Arctic Village include Public Administration (19 | 52.8%), Health Care & Social Assistance (8 | 22.2%), Educational Services (5 | 13.9%), Transportation & Warehousing (3 | 8.3%), and Construction (1 | 2.8%).
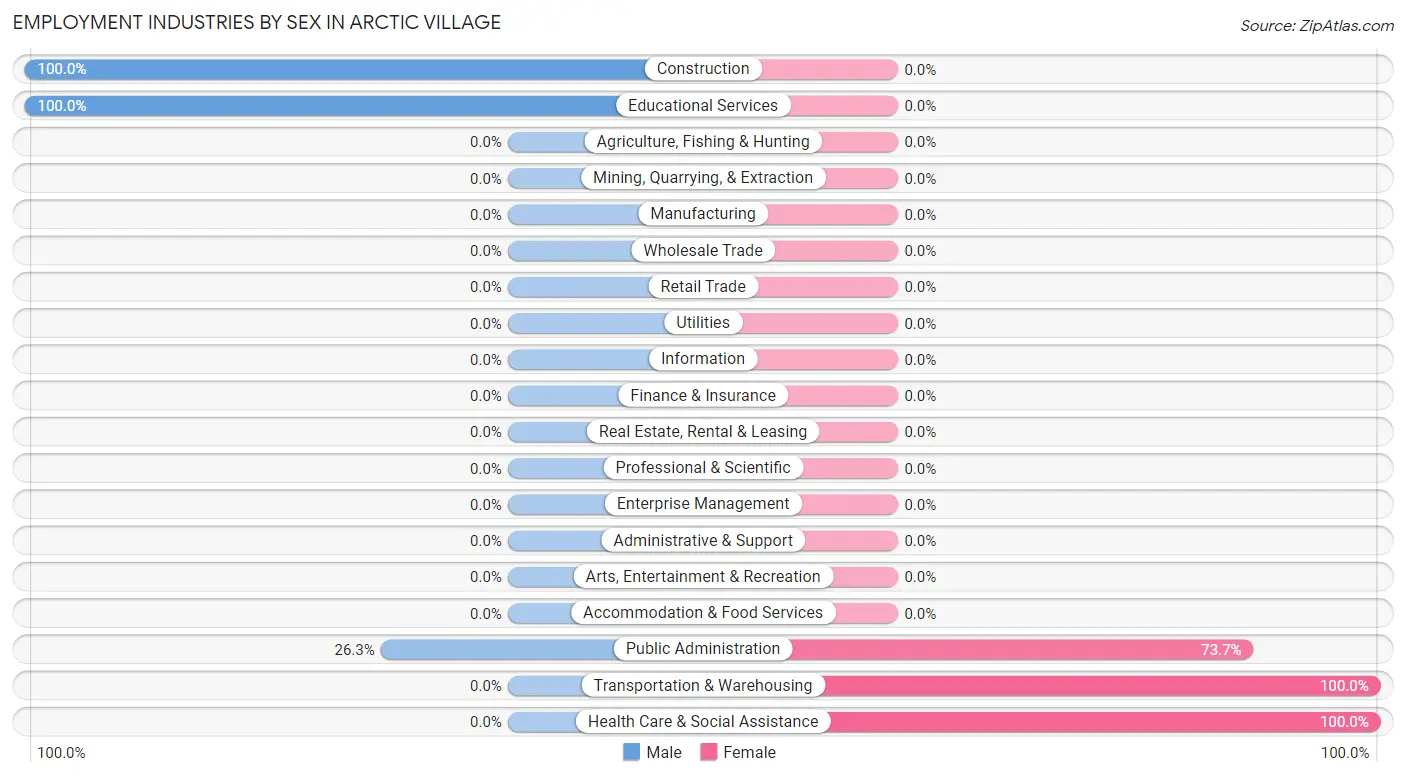
Employment Industries by Sex in Arctic Village
The Arctic Village industries that see more men than women are Construction (100.0%), Educational Services (100.0%), and Public Administration (26.3%), whereas the industries that tend to have a higher number of women are Transportation & Warehousing (100.0%), Health Care & Social Assistance (100.0%), and Public Administration (73.7%).
| Industry | Male | Female |
| Agriculture, Fishing & Hunting | 0 (0.0%) | 0 (0.0%) |
| Mining, Quarrying, & Extraction | 0 (0.0%) | 0 (0.0%) |
| Construction | 1 (100.0%) | 0 (0.0%) |
| Manufacturing | 0 (0.0%) | 0 (0.0%) |
| Wholesale Trade | 0 (0.0%) | 0 (0.0%) |
| Retail Trade | 0 (0.0%) | 0 (0.0%) |
| Transportation & Warehousing | 0 (0.0%) | 3 (100.0%) |
| Utilities | 0 (0.0%) | 0 (0.0%) |
| Information | 0 (0.0%) | 0 (0.0%) |
| Finance & Insurance | 0 (0.0%) | 0 (0.0%) |
| Real Estate, Rental & Leasing | 0 (0.0%) | 0 (0.0%) |
| Professional & Scientific | 0 (0.0%) | 0 (0.0%) |
| Enterprise Management | 0 (0.0%) | 0 (0.0%) |
| Administrative & Support | 0 (0.0%) | 0 (0.0%) |
| Educational Services | 5 (100.0%) | 0 (0.0%) |
| Health Care & Social Assistance | 0 (0.0%) | 8 (100.0%) |
| Arts, Entertainment & Recreation | 0 (0.0%) | 0 (0.0%) |
| Accommodation & Food Services | 0 (0.0%) | 0 (0.0%) |
| Public Administration | 5 (26.3%) | 14 (73.7%) |
| Total | 11 (30.6%) | 25 (69.4%) |
Education in Arctic Village
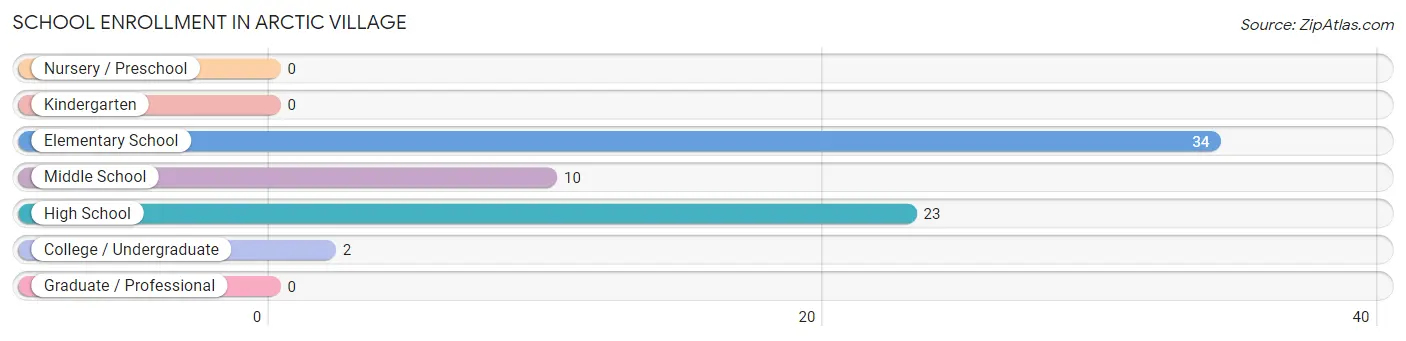
School Enrollment in Arctic Village
The most common levels of schooling among the 69 students in Arctic Village are elementary school (34 | 49.3%), high school (23 | 33.3%), and middle school (10 | 14.5%).
| School Level | # Students | % Students |
| Nursery / Preschool | 0 | 0.0% |
| Kindergarten | 0 | 0.0% |
| Elementary School | 34 | 49.3% |
| Middle School | 10 | 14.5% |
| High School | 23 | 33.3% |
| College / Undergraduate | 2 | 2.9% |
| Graduate / Professional | 0 | 0.0% |
| Total | 69 | 100.0% |
School Enrollment by Age by Funding Source in Arctic Village
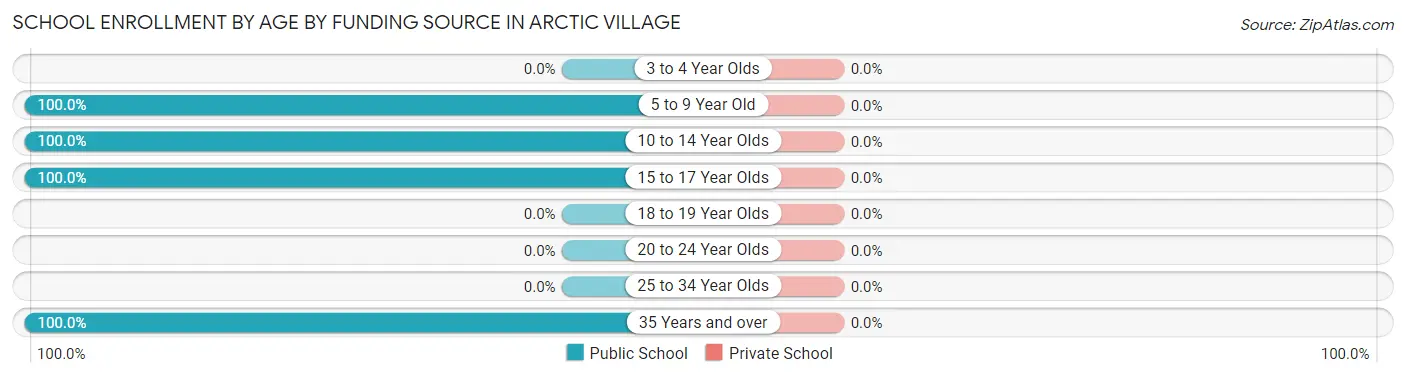
| Age Bracket | Public School | Private School |
| 3 to 4 Year Olds | 0 (0.0%) | 0 (0.0%) |
| 5 to 9 Year Old | 31 (100.0%) | 0 (0.0%) |
| 10 to 14 Year Olds | 18 (100.0%) | 0 (0.0%) |
| 15 to 17 Year Olds | 18 (100.0%) | 0 (0.0%) |
| 18 to 19 Year Olds | 0 (0.0%) | 0 (0.0%) |
| 20 to 24 Year Olds | 0 (0.0%) | 0 (0.0%) |
| 25 to 34 Year Olds | 0 (0.0%) | 0 (0.0%) |
| 35 Years and over | 2 (100.0%) | 0 (0.0%) |
| Total | 69 (100.0%) | 0 (0.0%) |
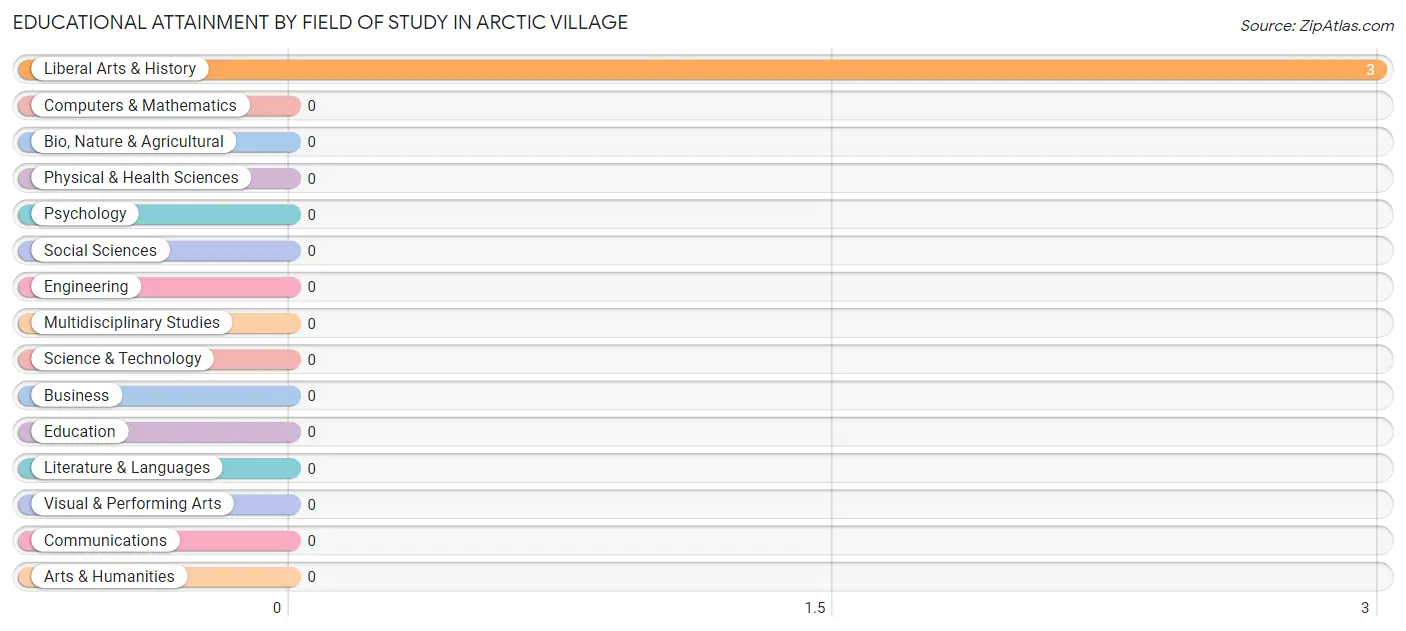
Educational Attainment by Field of Study in Arctic Village
, and liberal arts & history (3 | 100.0%) are the most common fields of study among 3 individuals in Arctic Village who have obtained a bachelor's degree or higher.
| Field of Study | # Graduates | % Graduates |
| Computers & Mathematics | 0 | 0.0% |
| Bio, Nature & Agricultural | 0 | 0.0% |
| Physical & Health Sciences | 0 | 0.0% |
| Psychology | 0 | 0.0% |
| Social Sciences | 0 | 0.0% |
| Engineering | 0 | 0.0% |
| Multidisciplinary Studies | 0 | 0.0% |
| Science & Technology | 0 | 0.0% |
| Business | 0 | 0.0% |
| Education | 0 | 0.0% |
| Literature & Languages | 0 | 0.0% |
| Liberal Arts & History | 3 | 100.0% |
| Visual & Performing Arts | 0 | 0.0% |
| Communications | 0 | 0.0% |
| Arts & Humanities | 0 | 0.0% |
| Total | 3 | 100.0% |
Transportation & Commute in Arctic Village
Vehicle Availability by Sex in Arctic Village
The most prevalent vehicle ownership categories in Arctic Village are males with no vehicle (10, accounting for 100.0%) and females with no vehicle (21, making up 47.6%).
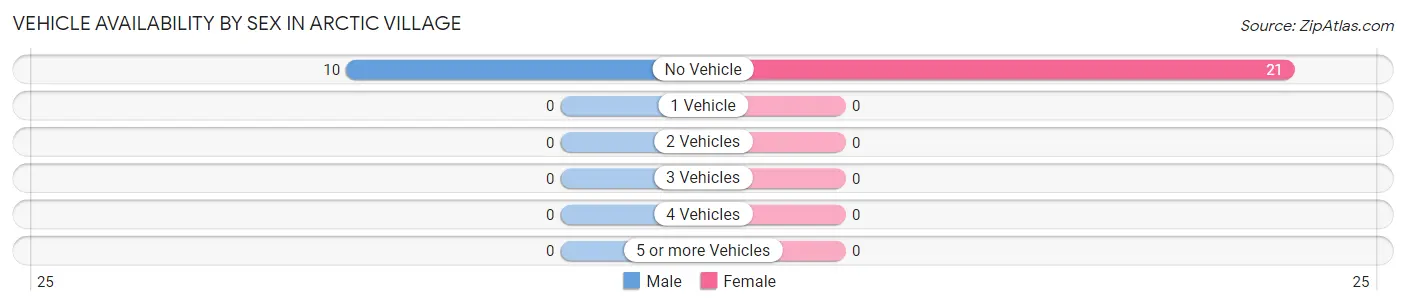
| Vehicles Available | Male | Female |
| No Vehicle | 10 (100.0%) | 21 (100.0%) |
| 1 Vehicle | 0 (0.0%) | 0 (0.0%) |
| 2 Vehicles | 0 (0.0%) | 0 (0.0%) |
| 3 Vehicles | 0 (0.0%) | 0 (0.0%) |
| 4 Vehicles | 0 (0.0%) | 0 (0.0%) |
| 5 or more Vehicles | 0 (0.0%) | 0 (0.0%) |
| Total | 10 (100.0%) | 21 (100.0%) |
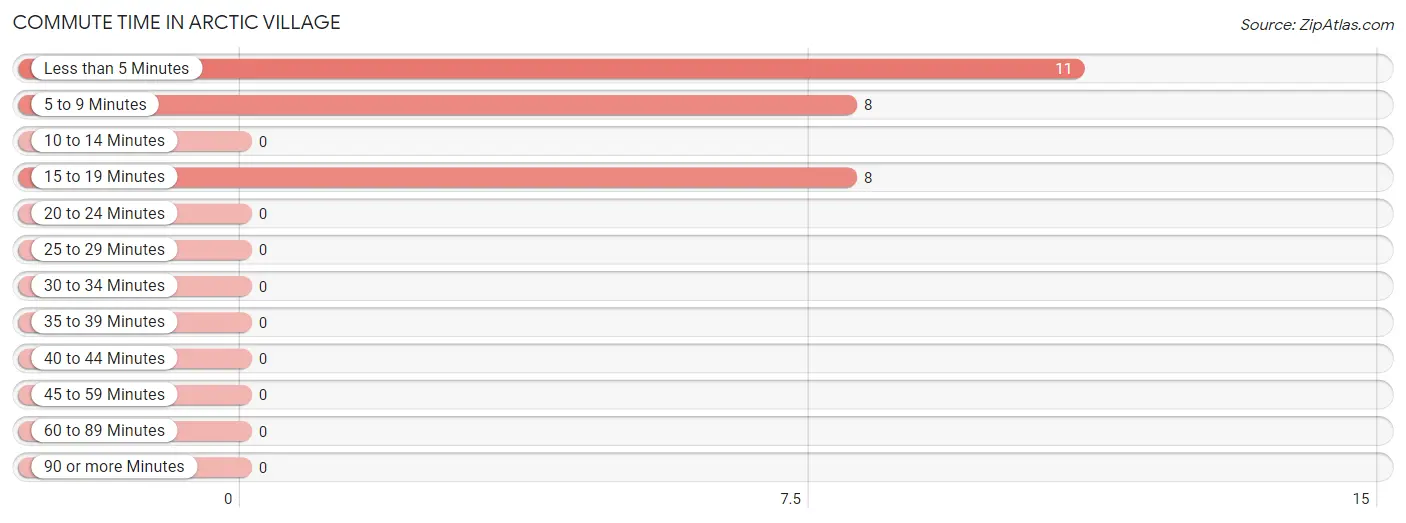
Commute Time in Arctic Village
The most frequently occuring commute durations in Arctic Village are less than 5 minutes (11 commuters, 40.7%), 5 to 9 minutes (8 commuters, 29.6%), and 15 to 19 minutes (8 commuters, 29.6%).
| Commute Time | # Commuters | % Commuters |
| Less than 5 Minutes | 11 | 40.7% |
| 5 to 9 Minutes | 8 | 29.6% |
| 10 to 14 Minutes | 0 | 0.0% |
| 15 to 19 Minutes | 8 | 29.6% |
| 20 to 24 Minutes | 0 | 0.0% |
| 25 to 29 Minutes | 0 | 0.0% |
| 30 to 34 Minutes | 0 | 0.0% |
| 35 to 39 Minutes | 0 | 0.0% |
| 40 to 44 Minutes | 0 | 0.0% |
| 45 to 59 Minutes | 0 | 0.0% |
| 60 to 89 Minutes | 0 | 0.0% |
| 90 or more Minutes | 0 | 0.0% |
Commute Time by Sex in Arctic Village
The most common commute times in Arctic Village are less than 5 minutes (9 commuters, 100.0%) for males and 5 to 9 minutes (8 commuters, 44.4%) for females.
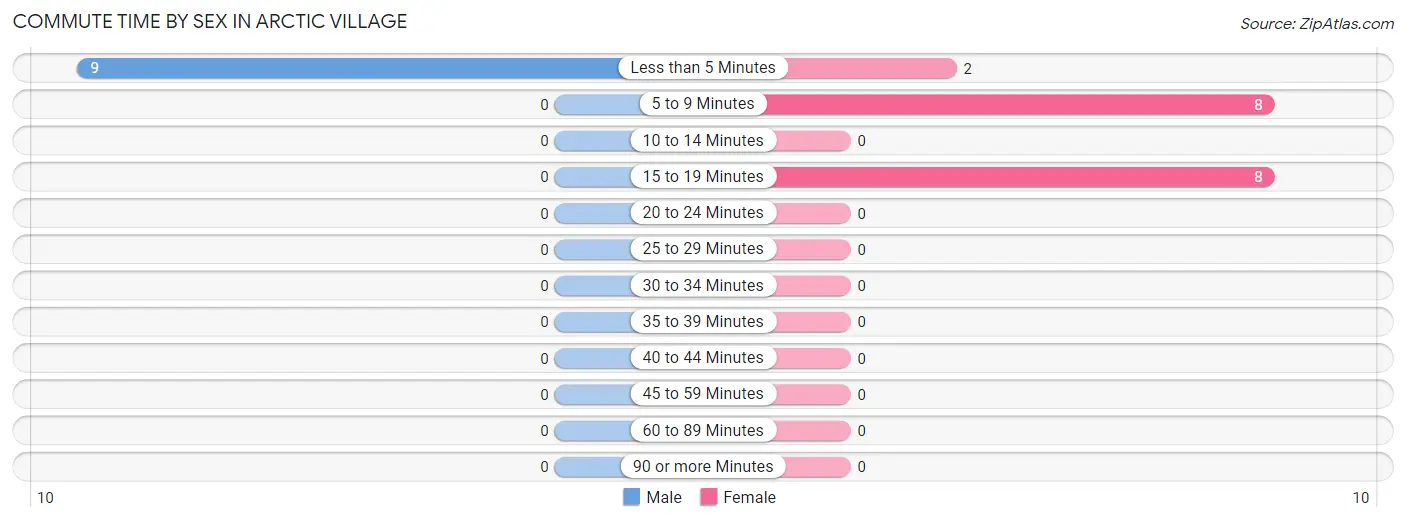
| Commute Time | Male | Female |
| Less than 5 Minutes | 9 (100.0%) | 2 (11.1%) |
| 5 to 9 Minutes | 0 (0.0%) | 8 (44.4%) |
| 10 to 14 Minutes | 0 (0.0%) | 0 (0.0%) |
| 15 to 19 Minutes | 0 (0.0%) | 8 (44.4%) |
| 20 to 24 Minutes | 0 (0.0%) | 0 (0.0%) |
| 25 to 29 Minutes | 0 (0.0%) | 0 (0.0%) |
| 30 to 34 Minutes | 0 (0.0%) | 0 (0.0%) |
| 35 to 39 Minutes | 0 (0.0%) | 0 (0.0%) |
| 40 to 44 Minutes | 0 (0.0%) | 0 (0.0%) |
| 45 to 59 Minutes | 0 (0.0%) | 0 (0.0%) |
| 60 to 89 Minutes | 0 (0.0%) | 0 (0.0%) |
| 90 or more Minutes | 0 (0.0%) | 0 (0.0%) |
Time of Departure to Work by Sex in Arctic Village
The most frequent times of departure to work in Arctic Village are 6:00 AM to 6:29 AM (5, 55.6%) for males and 9:00 AM to 9:59 AM (10, 55.6%) for females.
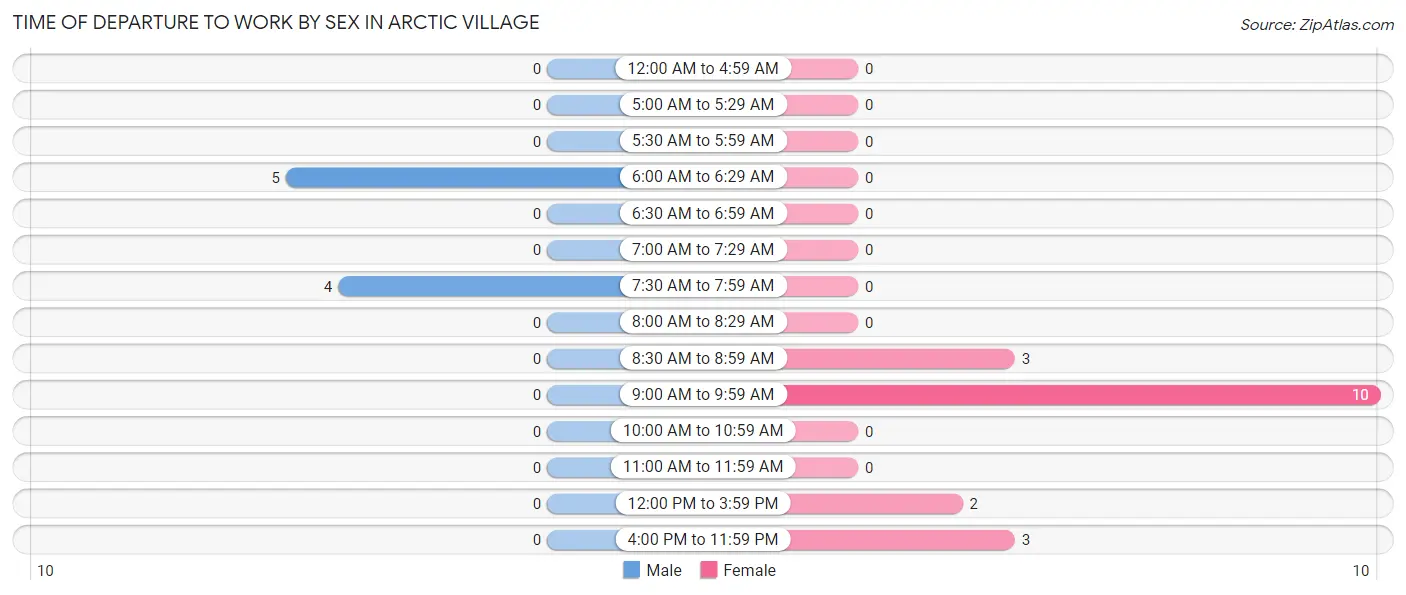
| Time of Departure | Male | Female |
| 12:00 AM to 4:59 AM | 0 (0.0%) | 0 (0.0%) |
| 5:00 AM to 5:29 AM | 0 (0.0%) | 0 (0.0%) |
| 5:30 AM to 5:59 AM | 0 (0.0%) | 0 (0.0%) |
| 6:00 AM to 6:29 AM | 5 (55.6%) | 0 (0.0%) |
| 6:30 AM to 6:59 AM | 0 (0.0%) | 0 (0.0%) |
| 7:00 AM to 7:29 AM | 0 (0.0%) | 0 (0.0%) |
| 7:30 AM to 7:59 AM | 4 (44.4%) | 0 (0.0%) |
| 8:00 AM to 8:29 AM | 0 (0.0%) | 0 (0.0%) |
| 8:30 AM to 8:59 AM | 0 (0.0%) | 3 (16.7%) |
| 9:00 AM to 9:59 AM | 0 (0.0%) | 10 (55.6%) |
| 10:00 AM to 10:59 AM | 0 (0.0%) | 0 (0.0%) |
| 11:00 AM to 11:59 AM | 0 (0.0%) | 0 (0.0%) |
| 12:00 PM to 3:59 PM | 0 (0.0%) | 2 (11.1%) |
| 4:00 PM to 11:59 PM | 0 (0.0%) | 3 (16.7%) |
| Total | 9 (100.0%) | 18 (100.0%) |
Housing Occupancy in Arctic Village
Occupancy by Ownership in Arctic Village
Of the total 65 dwellings in Arctic Village, owner-occupied units account for 48 (73.9%), while renter-occupied units make up 17 (26.2%).
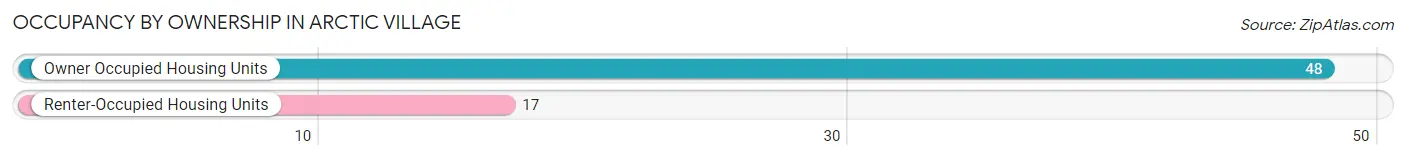
| Occupancy | # Housing Units | % Housing Units |
| Owner Occupied Housing Units | 48 | 73.9% |
| Renter-Occupied Housing Units | 17 | 26.2% |
| Total Occupied Housing Units | 65 | 100.0% |
Occupancy by Household Size in Arctic Village
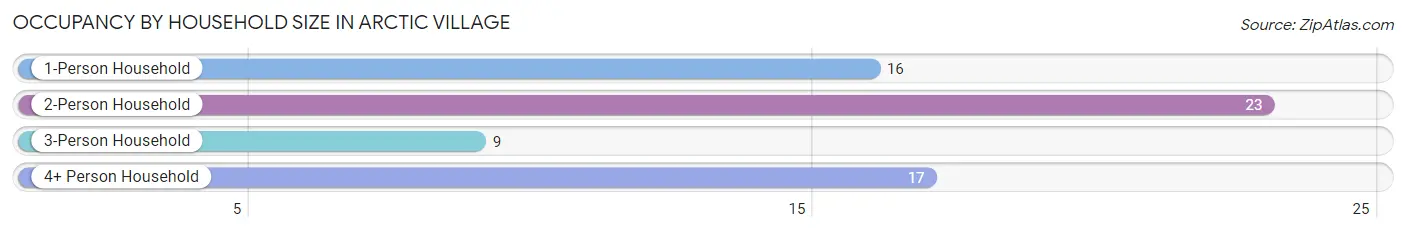
| Household Size | # Housing Units | % Housing Units |
| 1-Person Household | 16 | 24.6% |
| 2-Person Household | 23 | 35.4% |
| 3-Person Household | 9 | 13.9% |
| 4+ Person Household | 17 | 26.2% |
| Total Housing Units | 65 | 100.0% |
Occupancy by Ownership by Household Size in Arctic Village
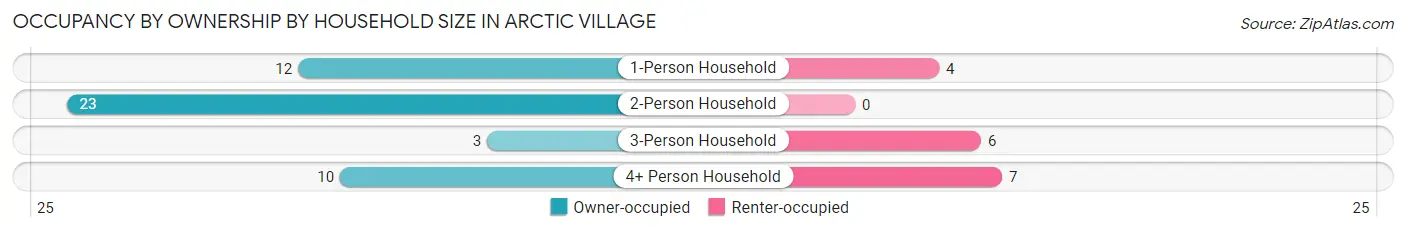
| Household Size | Owner-occupied | Renter-occupied |
| 1-Person Household | 12 (75.0%) | 4 (25.0%) |
| 2-Person Household | 23 (100.0%) | 0 (0.0%) |
| 3-Person Household | 3 (33.3%) | 6 (66.7%) |
| 4+ Person Household | 10 (58.8%) | 7 (41.2%) |
| Total Housing Units | 48 (73.9%) | 17 (26.2%) |
Occupancy by Educational Attainment in Arctic Village
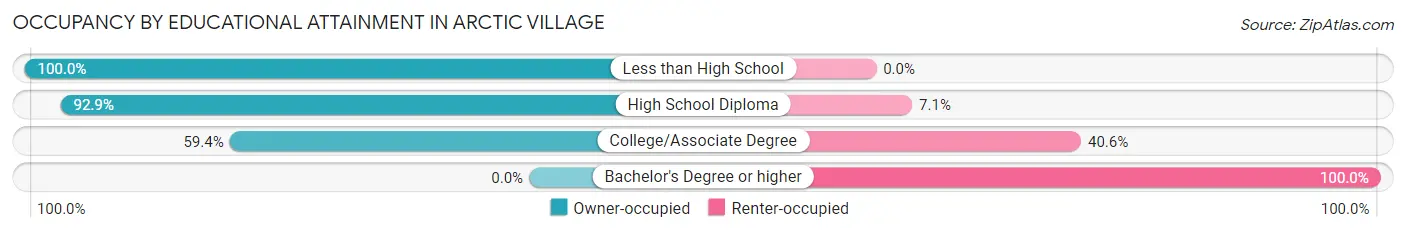
| Household Size | Owner-occupied | Renter-occupied |
| Less than High School | 16 (100.0%) | 0 (0.0%) |
| High School Diploma | 13 (92.9%) | 1 (7.1%) |
| College/Associate Degree | 19 (59.4%) | 13 (40.6%) |
| Bachelor's Degree or higher | 0 (0.0%) | 3 (100.0%) |
Occupancy by Age of Householder in Arctic Village
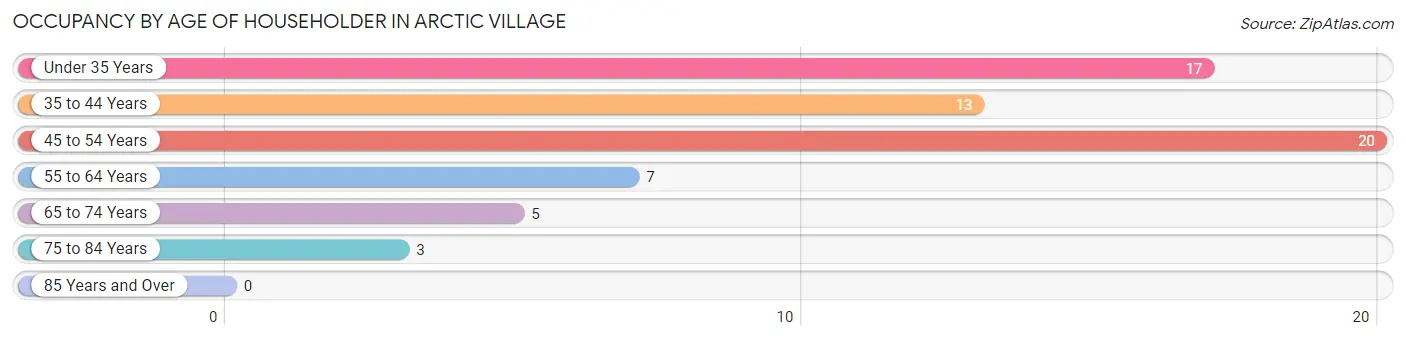
| Age Bracket | # Households | % Households |
| Under 35 Years | 17 | 26.2% |
| 35 to 44 Years | 13 | 20.0% |
| 45 to 54 Years | 20 | 30.8% |
| 55 to 64 Years | 7 | 10.8% |
| 65 to 74 Years | 5 | 7.7% |
| 75 to 84 Years | 3 | 4.6% |
| 85 Years and Over | 0 | 0.0% |
| Total | 65 | 100.0% |
Housing Finances in Arctic Village
Median Income by Occupancy in Arctic Village
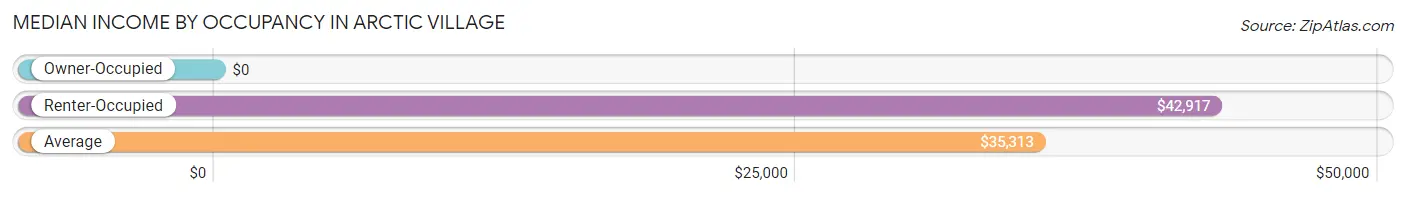
| Occupancy Type | # Households | Median Income |
| Owner-Occupied | 48 (73.9%) | $0 |
| Renter-Occupied | 17 (26.2%) | $42,917 |
| Average | 65 (100.0%) | $35,313 |
Occupancy by Householder Income Bracket in Arctic Village
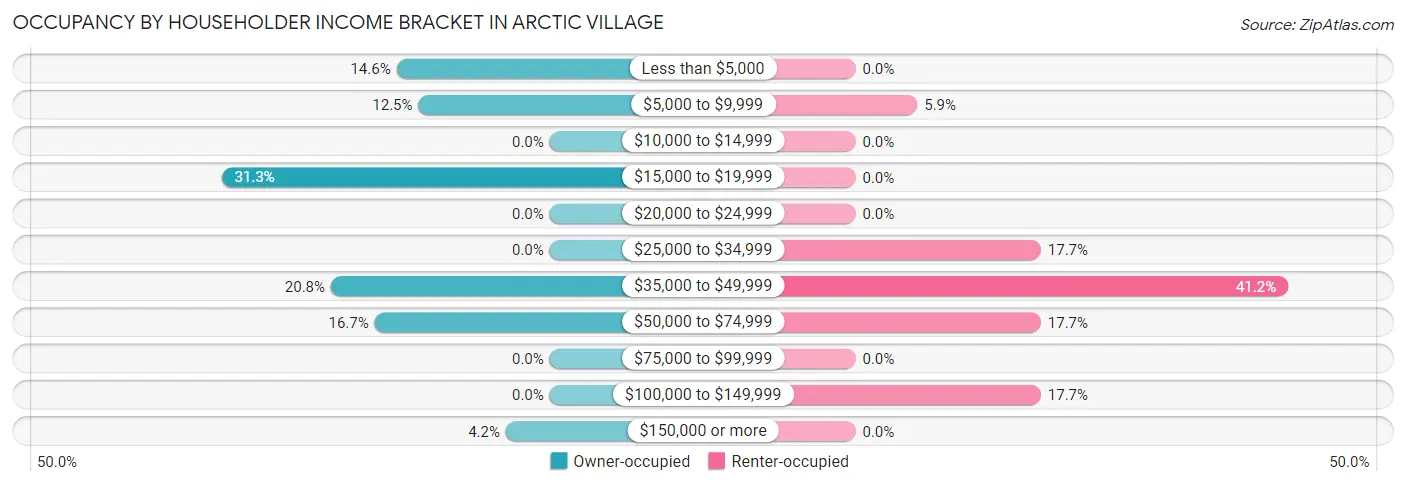
| Income Bracket | Owner-occupied | Renter-occupied |
| Less than $5,000 | 7 (14.6%) | 0 (0.0%) |
| $5,000 to $9,999 | 6 (12.5%) | 1 (5.9%) |
| $10,000 to $14,999 | 0 (0.0%) | 0 (0.0%) |
| $15,000 to $19,999 | 15 (31.2%) | 0 (0.0%) |
| $20,000 to $24,999 | 0 (0.0%) | 0 (0.0%) |
| $25,000 to $34,999 | 0 (0.0%) | 3 (17.6%) |
| $35,000 to $49,999 | 10 (20.8%) | 7 (41.2%) |
| $50,000 to $74,999 | 8 (16.7%) | 3 (17.6%) |
| $75,000 to $99,999 | 0 (0.0%) | 0 (0.0%) |
| $100,000 to $149,999 | 0 (0.0%) | 3 (17.6%) |
| $150,000 or more | 2 (4.2%) | 0 (0.0%) |
| Total | 48 (100.0%) | 17 (100.0%) |
Monthly Housing Cost Tiers in Arctic Village
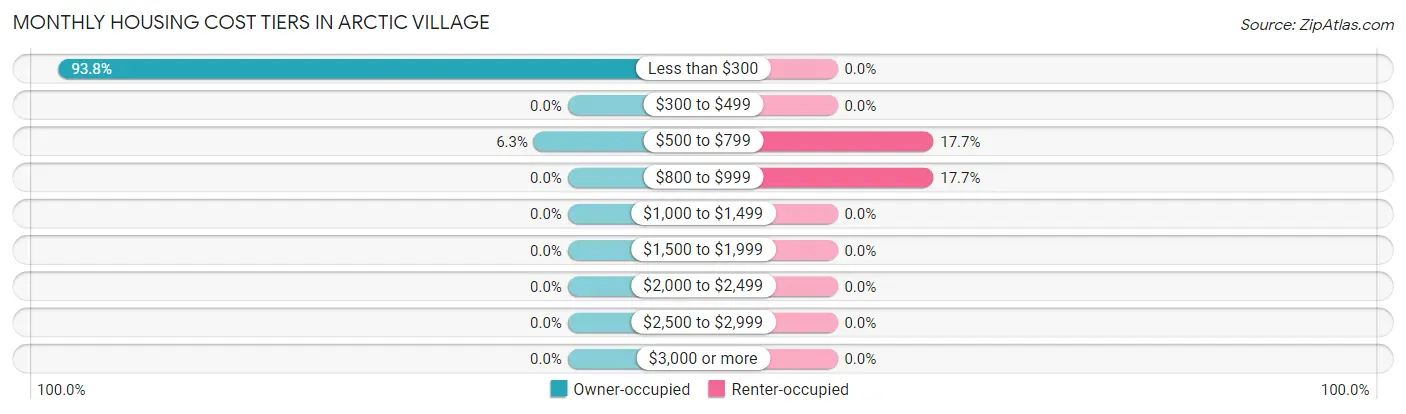
| Monthly Cost | Owner-occupied | Renter-occupied |
| Less than $300 | 45 (93.8%) | 0 (0.0%) |
| $300 to $499 | 0 (0.0%) | 0 (0.0%) |
| $500 to $799 | 3 (6.2%) | 3 (17.6%) |
| $800 to $999 | 0 (0.0%) | 3 (17.6%) |
| $1,000 to $1,499 | 0 (0.0%) | 0 (0.0%) |
| $1,500 to $1,999 | 0 (0.0%) | 0 (0.0%) |
| $2,000 to $2,499 | 0 (0.0%) | 0 (0.0%) |
| $2,500 to $2,999 | 0 (0.0%) | 0 (0.0%) |
| $3,000 or more | 0 (0.0%) | 0 (0.0%) |
| Total | 48 (100.0%) | 17 (100.0%) |
Physical Housing Characteristics in Arctic Village
Housing Structures in Arctic Village
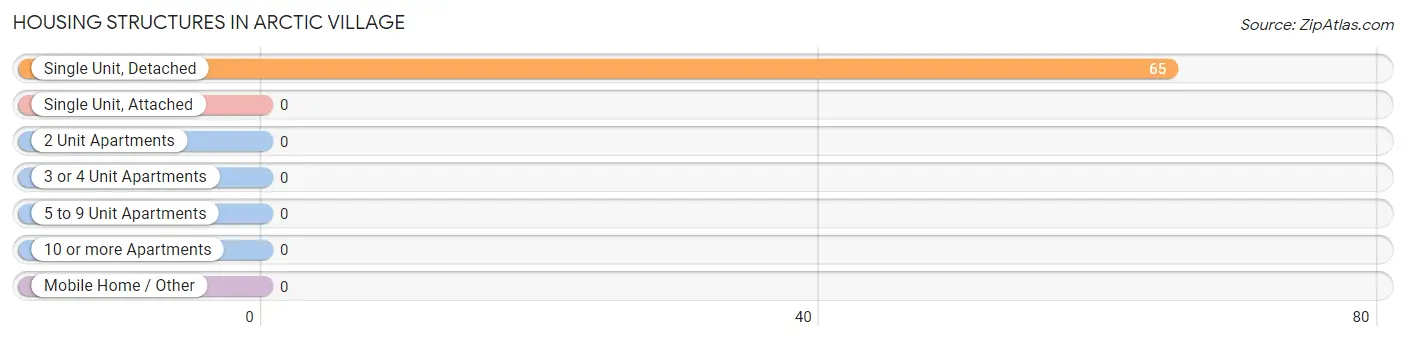
| Structure Type | # Housing Units | % Housing Units |
| Single Unit, Detached | 65 | 100.0% |
| Single Unit, Attached | 0 | 0.0% |
| 2 Unit Apartments | 0 | 0.0% |
| 3 or 4 Unit Apartments | 0 | 0.0% |
| 5 to 9 Unit Apartments | 0 | 0.0% |
| 10 or more Apartments | 0 | 0.0% |
| Mobile Home / Other | 0 | 0.0% |
| Total | 65 | 100.0% |
Housing Structures by Occupancy in Arctic Village
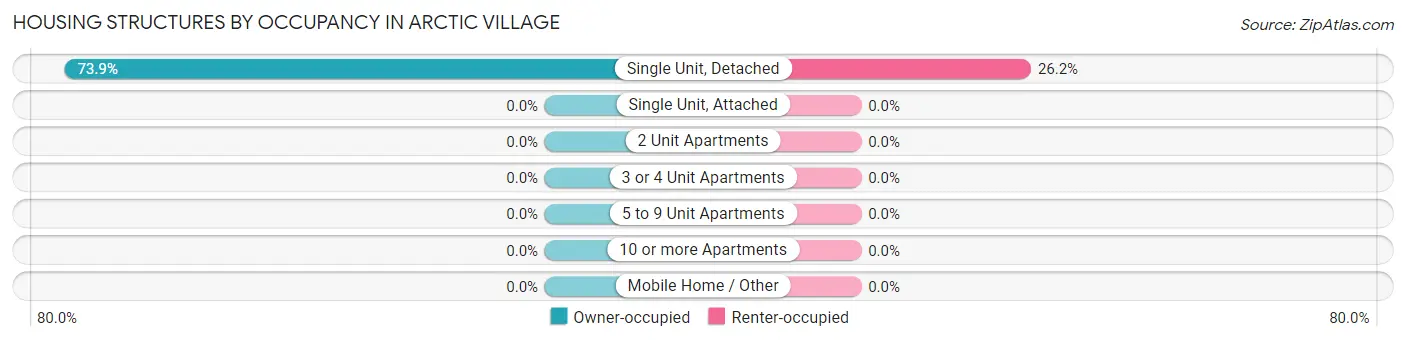
| Structure Type | Owner-occupied | Renter-occupied |
| Single Unit, Detached | 48 (73.9%) | 17 (26.2%) |
| Single Unit, Attached | 0 (0.0%) | 0 (0.0%) |
| 2 Unit Apartments | 0 (0.0%) | 0 (0.0%) |
| 3 or 4 Unit Apartments | 0 (0.0%) | 0 (0.0%) |
| 5 to 9 Unit Apartments | 0 (0.0%) | 0 (0.0%) |
| 10 or more Apartments | 0 (0.0%) | 0 (0.0%) |
| Mobile Home / Other | 0 (0.0%) | 0 (0.0%) |
| Total | 48 (73.9%) | 17 (26.2%) |
Housing Structures by Number of Rooms in Arctic Village
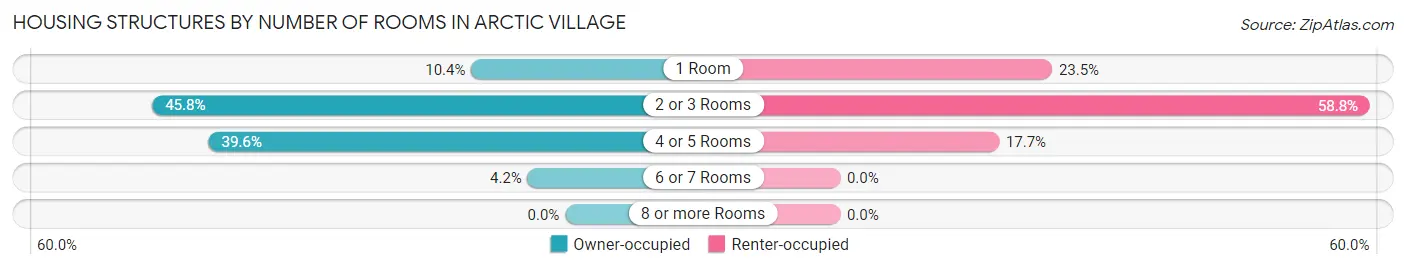
| Number of Rooms | Owner-occupied | Renter-occupied |
| 1 Room | 5 (10.4%) | 4 (23.5%) |
| 2 or 3 Rooms | 22 (45.8%) | 10 (58.8%) |
| 4 or 5 Rooms | 19 (39.6%) | 3 (17.6%) |
| 6 or 7 Rooms | 2 (4.2%) | 0 (0.0%) |
| 8 or more Rooms | 0 (0.0%) | 0 (0.0%) |
| Total | 48 (100.0%) | 17 (100.0%) |
Housing Structure by Heating Type in Arctic Village
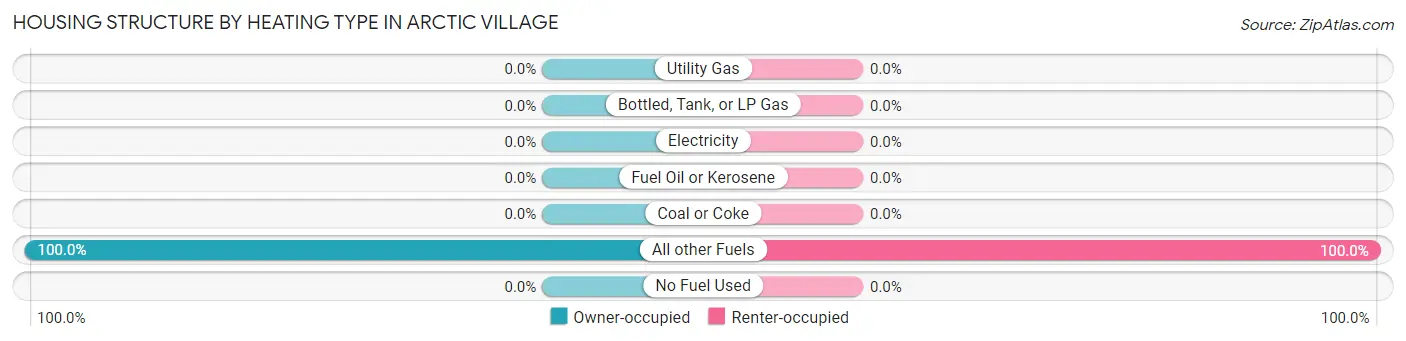
| Heating Type | Owner-occupied | Renter-occupied |
| Utility Gas | 0 (0.0%) | 0 (0.0%) |
| Bottled, Tank, or LP Gas | 0 (0.0%) | 0 (0.0%) |
| Electricity | 0 (0.0%) | 0 (0.0%) |
| Fuel Oil or Kerosene | 0 (0.0%) | 0 (0.0%) |
| Coal or Coke | 0 (0.0%) | 0 (0.0%) |
| All other Fuels | 48 (100.0%) | 17 (100.0%) |
| No Fuel Used | 0 (0.0%) | 0 (0.0%) |
| Total | 48 (100.0%) | 17 (100.0%) |
Household Vehicle Usage in Arctic Village
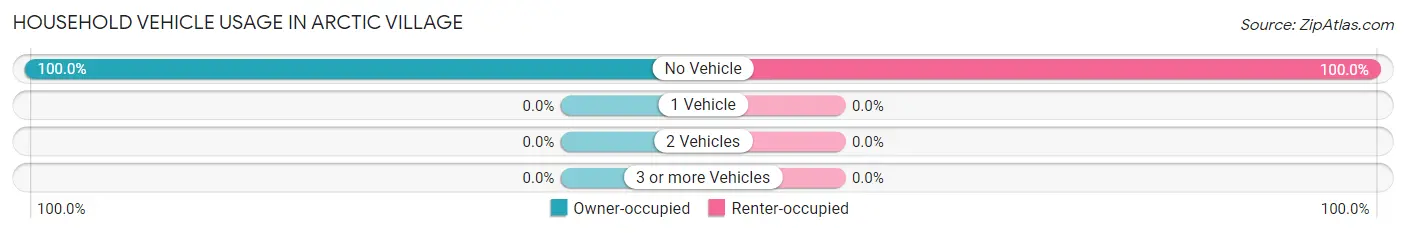
| Vehicles per Household | Owner-occupied | Renter-occupied |
| No Vehicle | 48 (100.0%) | 17 (100.0%) |
| 1 Vehicle | 0 (0.0%) | 0 (0.0%) |
| 2 Vehicles | 0 (0.0%) | 0 (0.0%) |
| 3 or more Vehicles | 0 (0.0%) | 0 (0.0%) |
| Total | 48 (100.0%) | 17 (100.0%) |
Real Estate & Mortgages in Arctic Village
Real Estate and Mortgage Overview in Arctic Village
| Characteristic | Without Mortgage | With Mortgage |
| Housing Units | 48 | 0 |
| Median Property Value | - | - |
| Median Household Income | - | - |
| Monthly Housing Costs | $137 | $0 |
| Real Estate Taxes | - | - |
Property Value by Mortgage Status in Arctic Village
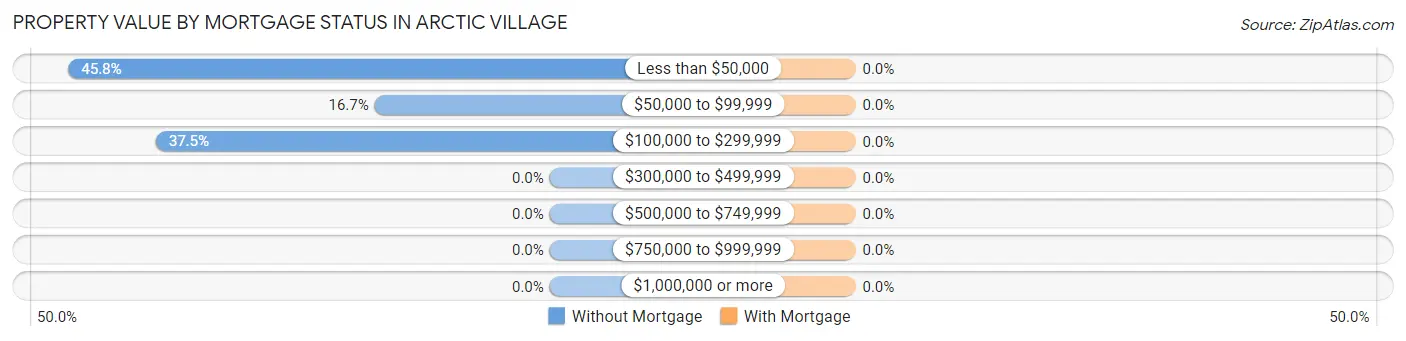
| Property Value | Without Mortgage | With Mortgage |
| Less than $50,000 | 22 (45.8%) | 0 (0.0%) |
| $50,000 to $99,999 | 8 (16.7%) | 0 (0.0%) |
| $100,000 to $299,999 | 18 (37.5%) | 0 (0.0%) |
| $300,000 to $499,999 | 0 (0.0%) | 0 (0.0%) |
| $500,000 to $749,999 | 0 (0.0%) | 0 (0.0%) |
| $750,000 to $999,999 | 0 (0.0%) | 0 (0.0%) |
| $1,000,000 or more | 0 (0.0%) | 0 (0.0%) |
| Total | 48 (100.0%) | 0 (0.0%) |
Household Income by Mortgage Status in Arctic Village
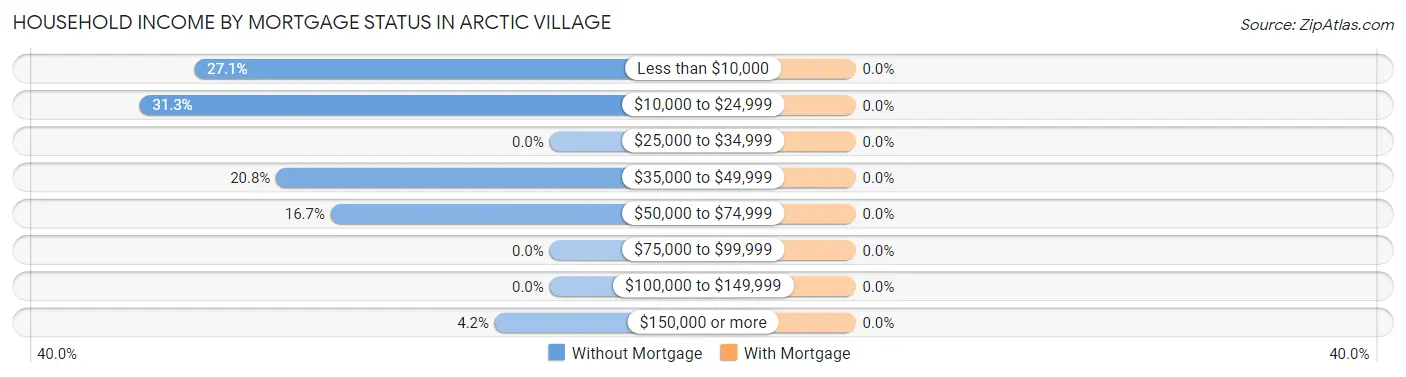
| Household Income | Without Mortgage | With Mortgage |
| Less than $10,000 | 13 (27.1%) | 0 (0.0%) |
| $10,000 to $24,999 | 15 (31.2%) | 0 (0.0%) |
| $25,000 to $34,999 | 0 (0.0%) | 0 (0.0%) |
| $35,000 to $49,999 | 10 (20.8%) | 0 (0.0%) |
| $50,000 to $74,999 | 8 (16.7%) | 0 (0.0%) |
| $75,000 to $99,999 | 0 (0.0%) | 0 (0.0%) |
| $100,000 to $149,999 | 0 (0.0%) | 0 (0.0%) |
| $150,000 or more | 2 (4.2%) | 0 (0.0%) |
| Total | 48 (100.0%) | 0 (0.0%) |
Property Value to Household Income Ratio in Arctic Village
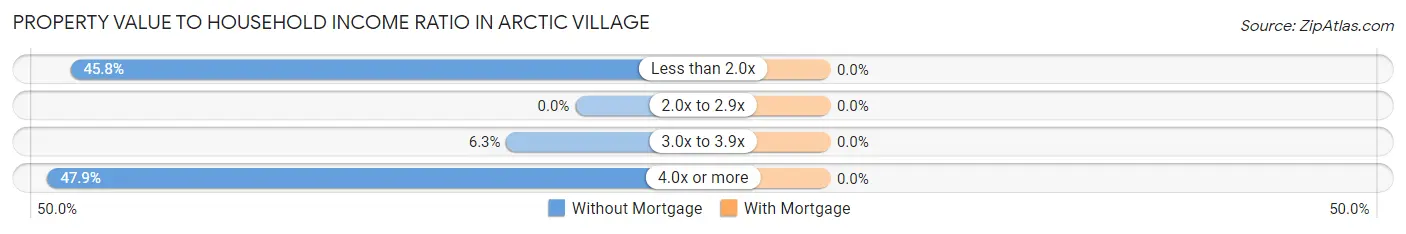
| Value-to-Income Ratio | Without Mortgage | With Mortgage |
| Less than 2.0x | 22 (45.8%) | 0 (0.0%) |
| 2.0x to 2.9x | 0 (0.0%) | 0 (0.0%) |
| 3.0x to 3.9x | 3 (6.2%) | 0 (0.0%) |
| 4.0x or more | 23 (47.9%) | 0 (0.0%) |
| Total | 48 (100.0%) | 0 (0.0%) |
Real Estate Taxes by Mortgage Status in Arctic Village
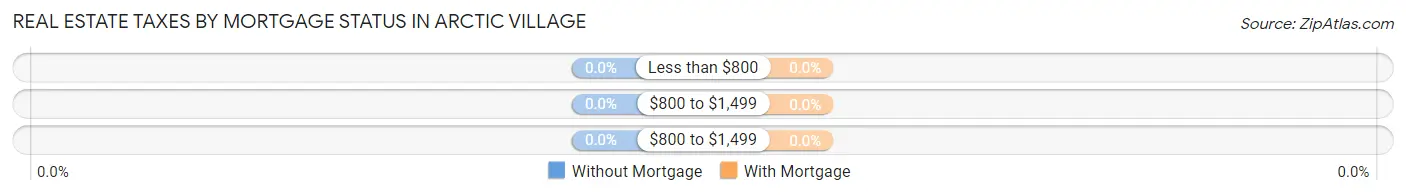
| Property Taxes | Without Mortgage | With Mortgage |
| Less than $800 | 0 (0.0%) | 0 (0.0%) |
| $800 to $1,499 | 0 (0.0%) | 0 (0.0%) |
| $800 to $1,499 | 0 (0.0%) | 0 (0.0%) |
| Total | 48 (100.0%) | 0 (0.0%) |
Health & Disability in Arctic Village
Health Insurance Coverage by Age in Arctic Village
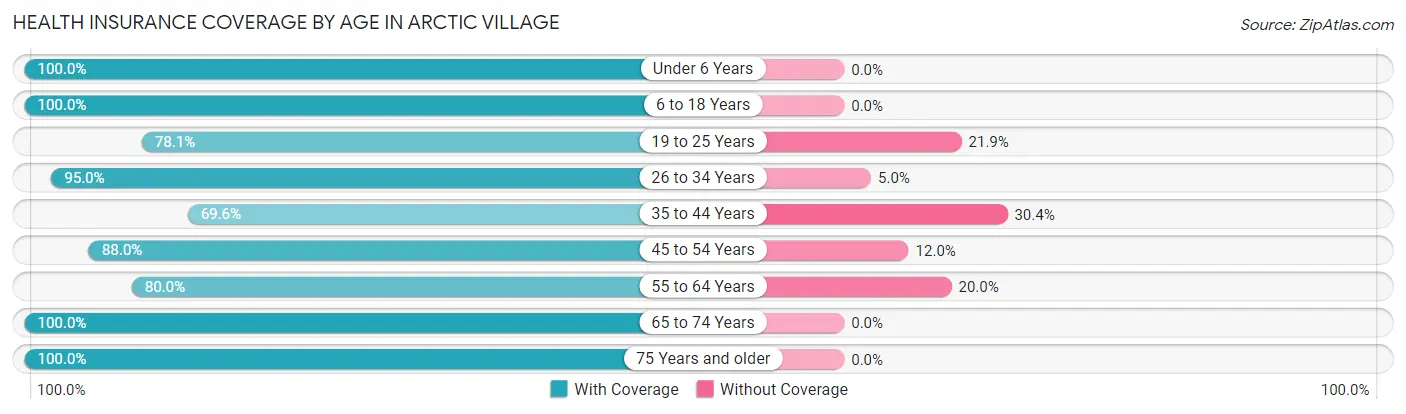
| Age Bracket | With Coverage | Without Coverage |
| Under 6 Years | 14 (100.0%) | 0 (0.0%) |
| 6 to 18 Years | 67 (100.0%) | 0 (0.0%) |
| 19 to 25 Years | 25 (78.1%) | 7 (21.9%) |
| 26 to 34 Years | 19 (95.0%) | 1 (5.0%) |
| 35 to 44 Years | 16 (69.6%) | 7 (30.4%) |
| 45 to 54 Years | 22 (88.0%) | 3 (12.0%) |
| 55 to 64 Years | 8 (80.0%) | 2 (20.0%) |
| 65 to 74 Years | 5 (100.0%) | 0 (0.0%) |
| 75 Years and older | 3 (100.0%) | 0 (0.0%) |
| Total | 179 (89.9%) | 20 (10.1%) |
Health Insurance Coverage by Citizenship Status in Arctic Village
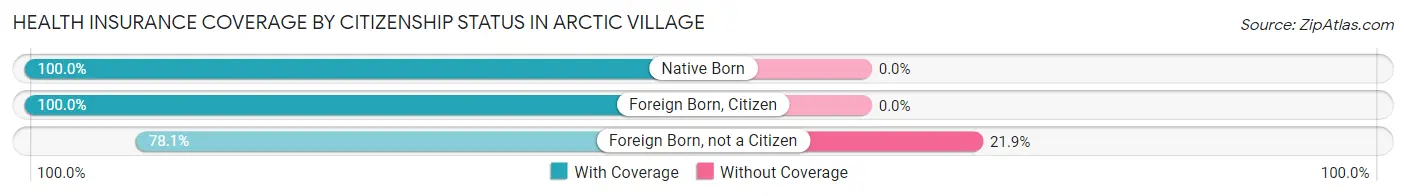
| Citizenship Status | With Coverage | Without Coverage |
| Native Born | 14 (100.0%) | 0 (0.0%) |
| Foreign Born, Citizen | 67 (100.0%) | 0 (0.0%) |
| Foreign Born, not a Citizen | 25 (78.1%) | 7 (21.9%) |
Health Insurance Coverage by Household Income in Arctic Village
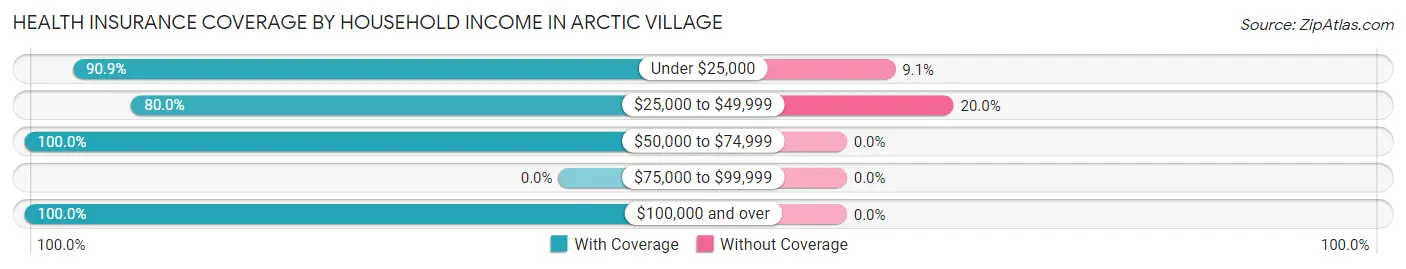
| Household Income | With Coverage | Without Coverage |
| Under $25,000 | 50 (90.9%) | 5 (9.1%) |
| $25,000 to $49,999 | 60 (80.0%) | 15 (20.0%) |
| $50,000 to $74,999 | 49 (100.0%) | 0 (0.0%) |
| $75,000 to $99,999 | 0 (0.0%) | 0 (0.0%) |
| $100,000 and over | 19 (100.0%) | 0 (0.0%) |
Public vs Private Health Insurance Coverage by Age in Arctic Village
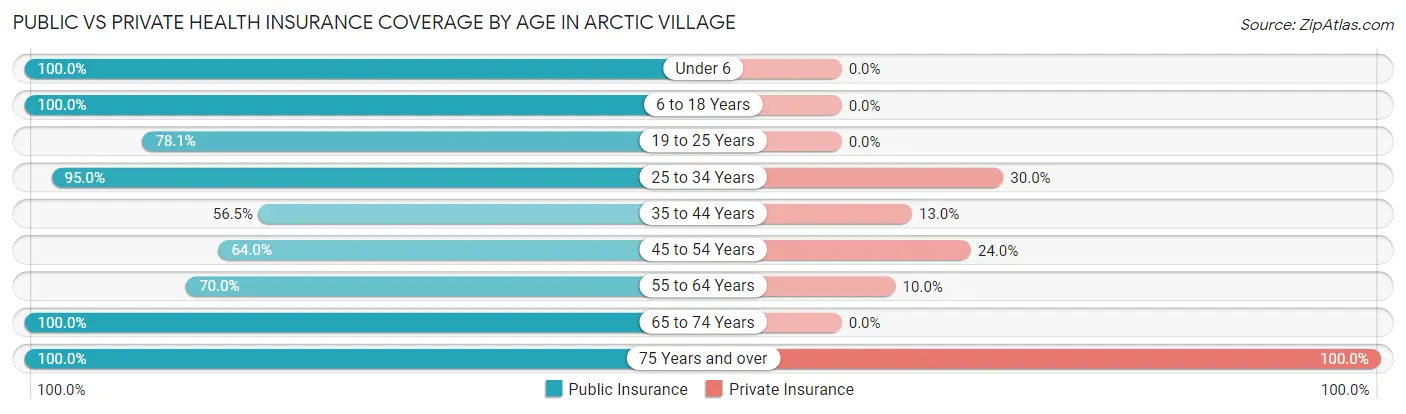
| Age Bracket | Public Insurance | Private Insurance |
| Under 6 | 14 (100.0%) | 0 (0.0%) |
| 6 to 18 Years | 67 (100.0%) | 0 (0.0%) |
| 19 to 25 Years | 25 (78.1%) | 0 (0.0%) |
| 25 to 34 Years | 19 (95.0%) | 6 (30.0%) |
| 35 to 44 Years | 13 (56.5%) | 3 (13.0%) |
| 45 to 54 Years | 16 (64.0%) | 6 (24.0%) |
| 55 to 64 Years | 7 (70.0%) | 1 (10.0%) |
| 65 to 74 Years | 5 (100.0%) | 0 (0.0%) |
| 75 Years and over | 3 (100.0%) | 3 (100.0%) |
| Total | 169 (84.9%) | 19 (9.6%) |
Disability Status by Sex by Age in Arctic Village
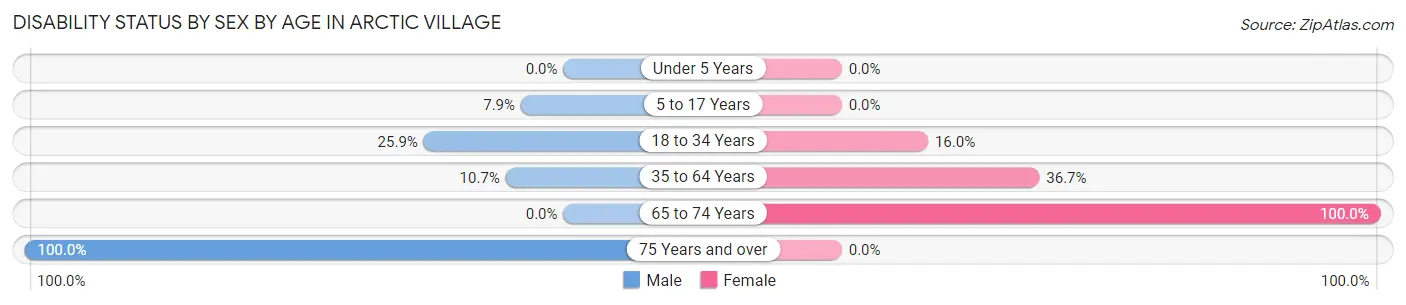
| Age Bracket | Male | Female |
| Under 5 Years | 0 (0.0%) | 0 (0.0%) |
| 5 to 17 Years | 3 (7.9%) | 0 (0.0%) |
| 18 to 34 Years | 7 (25.9%) | 4 (16.0%) |
| 35 to 64 Years | 3 (10.7%) | 11 (36.7%) |
| 65 to 74 Years | 0 (0.0%) | 5 (100.0%) |
| 75 Years and over | 3 (100.0%) | 0 (0.0%) |
Disability Class by Sex by Age in Arctic Village
Disability Class: Hearing Difficulty
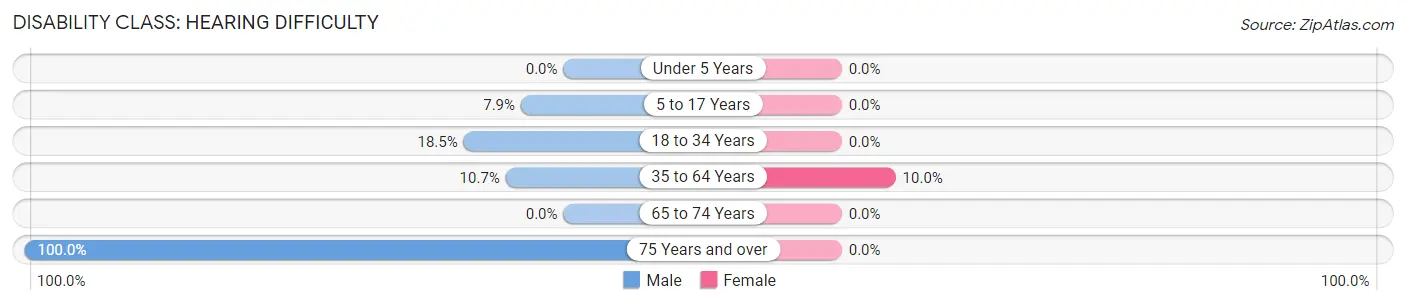
| Age Bracket | Male | Female |
| Under 5 Years | 0 (0.0%) | 0 (0.0%) |
| 5 to 17 Years | 3 (7.9%) | 0 (0.0%) |
| 18 to 34 Years | 5 (18.5%) | 0 (0.0%) |
| 35 to 64 Years | 3 (10.7%) | 3 (10.0%) |
| 65 to 74 Years | 0 (0.0%) | 0 (0.0%) |
| 75 Years and over | 3 (100.0%) | 0 (0.0%) |
Disability Class: Vision Difficulty
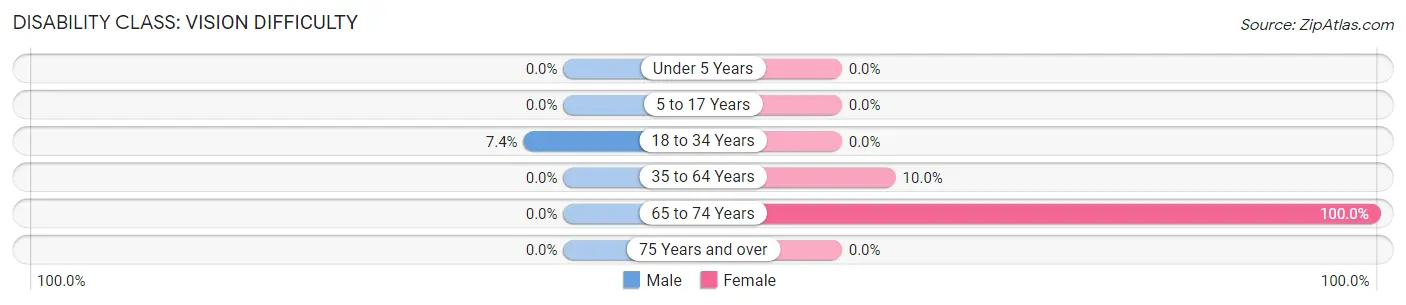
| Age Bracket | Male | Female |
| Under 5 Years | 0 (0.0%) | 0 (0.0%) |
| 5 to 17 Years | 0 (0.0%) | 0 (0.0%) |
| 18 to 34 Years | 2 (7.4%) | 0 (0.0%) |
| 35 to 64 Years | 0 (0.0%) | 3 (10.0%) |
| 65 to 74 Years | 0 (0.0%) | 5 (100.0%) |
| 75 Years and over | 0 (0.0%) | 0 (0.0%) |
Disability Class: Cognitive Difficulty
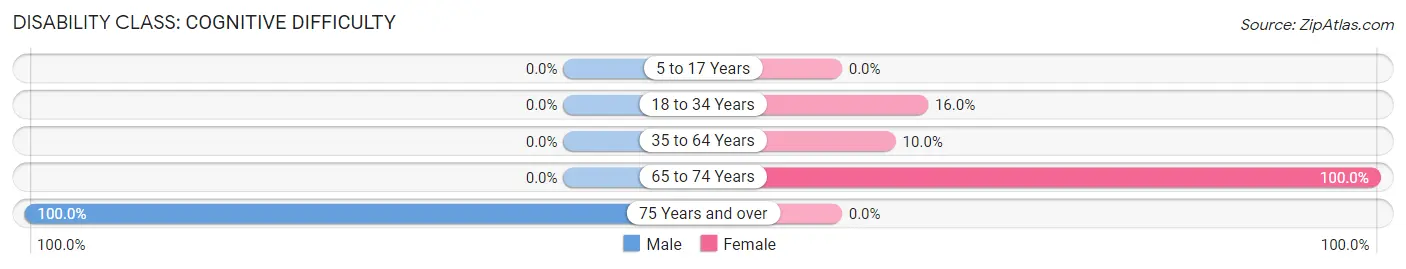
| Age Bracket | Male | Female |
| 5 to 17 Years | 0 (0.0%) | 0 (0.0%) |
| 18 to 34 Years | 0 (0.0%) | 4 (16.0%) |
| 35 to 64 Years | 0 (0.0%) | 3 (10.0%) |
| 65 to 74 Years | 0 (0.0%) | 5 (100.0%) |
| 75 Years and over | 3 (100.0%) | 0 (0.0%) |
Disability Class: Ambulatory Difficulty
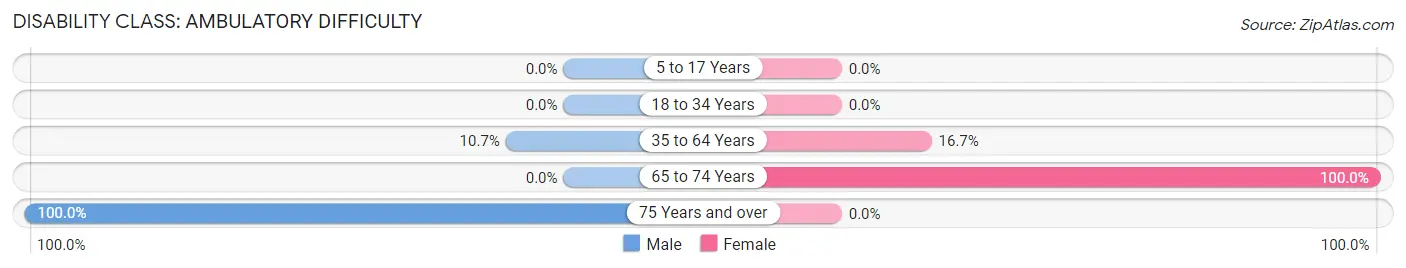
| Age Bracket | Male | Female |
| 5 to 17 Years | 0 (0.0%) | 0 (0.0%) |
| 18 to 34 Years | 0 (0.0%) | 0 (0.0%) |
| 35 to 64 Years | 3 (10.7%) | 5 (16.7%) |
| 65 to 74 Years | 0 (0.0%) | 5 (100.0%) |
| 75 Years and over | 3 (100.0%) | 0 (0.0%) |
Disability Class: Self-Care Difficulty
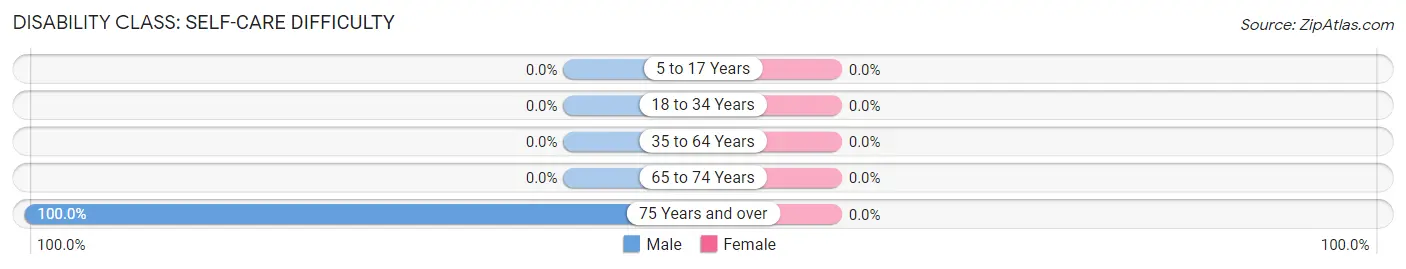
| Age Bracket | Male | Female |
| 5 to 17 Years | 0 (0.0%) | 0 (0.0%) |
| 18 to 34 Years | 0 (0.0%) | 0 (0.0%) |
| 35 to 64 Years | 0 (0.0%) | 0 (0.0%) |
| 65 to 74 Years | 0 (0.0%) | 0 (0.0%) |
| 75 Years and over | 3 (100.0%) | 0 (0.0%) |
Technology Access in Arctic Village
Computing Device Access in Arctic Village
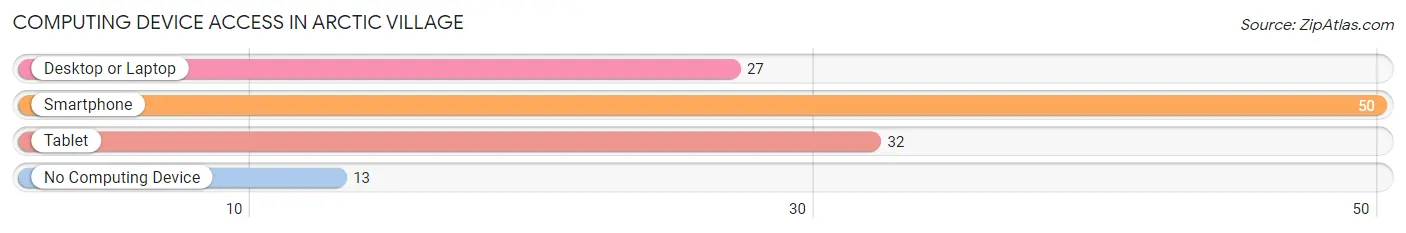
| Device Type | # Households | % Households |
| Desktop or Laptop | 27 | 41.5% |
| Smartphone | 50 | 76.9% |
| Tablet | 32 | 49.2% |
| No Computing Device | 13 | 20.0% |
| Total | 65 | 100.0% |
Internet Access in Arctic Village
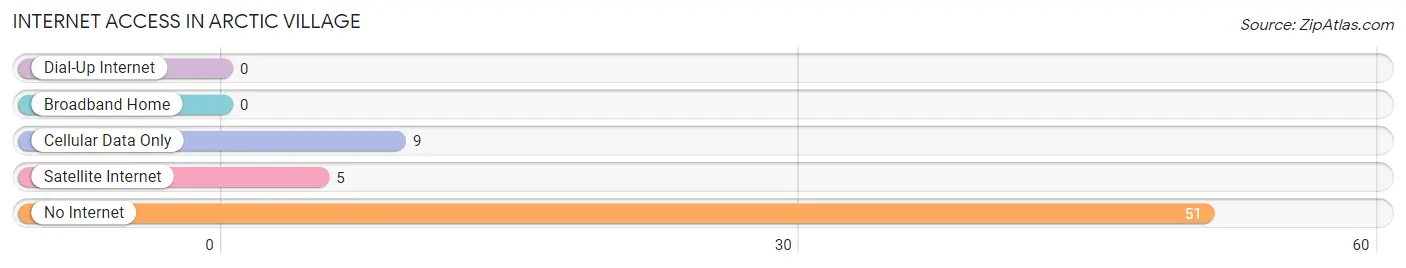
| Internet Type | # Households | % Households |
| Dial-Up Internet | 0 | 0.0% |
| Broadband Home | 0 | 0.0% |
| Cellular Data Only | 9 | 13.9% |
| Satellite Internet | 5 | 7.7% |
| No Internet | 51 | 78.5% |
| Total | 65 | 100.0% |
Arctic Village Summary
Arctic Village is a small, remote village located in the northernmost part of Alaska, in the Brooks Range. It is situated on the south bank of the Chandalar River, approximately 130 miles east of the Yukon River. The village is home to the Gwich’in people, who have lived in the area for thousands of years.
Geography
Arctic Village is located in the northernmost part of Alaska, in the Brooks Range. It is situated on the south bank of the Chandalar River, approximately 130 miles east of the Yukon River. The village is surrounded by mountains, tundra, and boreal forest. The climate is cold and dry, with temperatures ranging from -40°F in the winter to 70°F in the summer. The area receives an average of 10 inches of precipitation per year.
Economy
The economy of Arctic Village is largely based on subsistence activities, such as hunting, fishing, and trapping. The Gwich’in people also rely on the sale of handicrafts, such as fur hats and moccasins, to supplement their income. The village is home to a small store, which sells basic supplies and groceries. The village also has a post office and a health clinic.
Demographics
As of the 2000 census, the population of Arctic Village was approximately 200 people. The majority of the population is Native American, with the Gwich’in people making up the majority of the population. The median age of the population is 28 years old, and the median household income is $20,000.
History
The Gwich’in people have lived in the Arctic Village area for thousands of years. The village was first established in the late 1800s, when the Gwich’in people began to settle in the area. The village was originally known as “Vashraii K’oo”, which means “place of the caribou” in the Gwich’in language. In the early 1900s, the village was renamed “Arctic Village” by the U.S. government.
In the 1950s, the U.S. government began to build roads and airstrips in the area, which allowed for increased access to the village. In the 1970s, the village was connected to the Alaska Highway, which allowed for increased trade and commerce. In the 1980s, the village was connected to the Trans-Alaska Pipeline, which provided jobs and economic opportunities for the residents of Arctic Village.
Today, Arctic Village is a small, remote village that is home to the Gwich’in people. The village is largely dependent on subsistence activities, such as hunting, fishing, and trapping. The village also relies on the sale of handicrafts, such as fur hats and moccasins, to supplement their income. The village is connected to the Alaska Highway and the Trans-Alaska Pipeline, which provide access to goods and services.
Common Questions
What is Per Capita Income in Arctic Village?
Per Capita income in Arctic Village is $13,427.
What is the Median Household income in Arctic Village?
Median Household Income in Arctic Village is $35,313.
What is Income or Wage Gap in Arctic Village?
Income or Wage Gap in Arctic Village is 38.4%.
Women in Arctic Village earn 61.6 cents for every dollar earned by a man.
What is Inequality or Gini Index in Arctic Village?
Inequality or Gini Index in Arctic Village is 0.45.
What is the Total Population of Arctic Village?
Total Population of Arctic Village is 199.
What is the Total Male Population of Arctic Village?
Total Male Population of Arctic Village is 102.
What is the Total Female Population of Arctic Village?
Total Female Population of Arctic Village is 97.
What is the Ratio of Males per 100 Females in Arctic Village?
There are 105.15 Males per 100 Females in Arctic Village.
What is the Ratio of Females per 100 Males in Arctic Village?
There are 95.10 Females per 100 Males in Arctic Village.
What is the Median Population Age in Arctic Village?
Median Population Age in Arctic Village is 20.9 Years.
What is the Average Family Size in Arctic Village
Average Family Size in Arctic Village is 3.7 People.
What is the Average Household Size in Arctic Village
Average Household Size in Arctic Village is 3.0 People.
How Large is the Labor Force in Arctic Village?
There are 38 People in the Labor Forcein in Arctic Village.
What is the Percentage of People in the Labor Force in Arctic Village?
29.7% of People are in the Labor Force in Arctic Village.
What is the Unemployment Rate in Arctic Village?
Unemployment Rate in Arctic Village is 5.3%.