Aniak, AK Map & Demographics
Aniak Map
Aniak Overview
$57,021
PER CAPITA INCOME
$77,083
AVG FAMILY INCOME
$72,500
AVG HOUSEHOLD INCOME
20.4%
WAGE / INCOME GAP [ % ]
79.6¢/ $1
WAGE / INCOME GAP [ $ ]
0.43
INEQUALITY / GINI INDEX
551
TOTAL POPULATION
331
MALE POPULATION
220
FEMALE POPULATION
150.45
MALES / 100 FEMALES
66.47
FEMALES / 100 MALES
38.1
MEDIAN AGE
3.4
AVG FAMILY SIZE
2.9
AVG HOUSEHOLD SIZE
328
LABOR FORCE [ PEOPLE ]
75.1%
PERCENT IN LABOR FORCE
7.3%
UNEMPLOYMENT RATE
Aniak Zip Codes
Aniak Area Codes
Income in Aniak
Income Overview in Aniak
Per Capita Income in Aniak is $57,021, while median incomes of families and households are $77,083 and $72,500 respectively.
| Characteristic | Number | Measure |
| Per Capita Income | 551 | $57,021 |
| Median Family Income | 109 | $77,083 |
| Mean Family Income | 109 | $111,771 |
| Median Household Income | 152 | $72,500 |
| Mean Household Income | 152 | $100,688 |
| Income Deficit | 109 | $0 |
| Wage / Income Gap (%) | 551 | 20.41% |
| Wage / Income Gap ($) | 551 | 79.59¢ per $1 |
| Gini / Inequality Index | 551 | 0.43 |
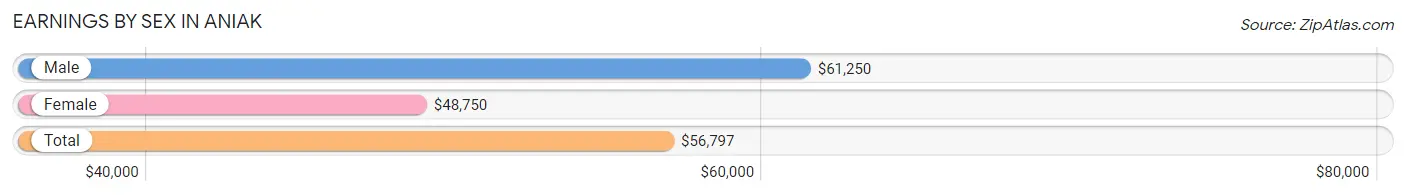
Earnings by Sex in Aniak
Average Earnings in Aniak are $56,797, $61,250 for men and $48,750 for women, a difference of 20.4%.
| Sex | Number | Average Earnings |
| Male | 207 (61.4%) | $61,250 |
| Female | 130 (38.6%) | $48,750 |
| Total | 337 (100.0%) | $56,797 |
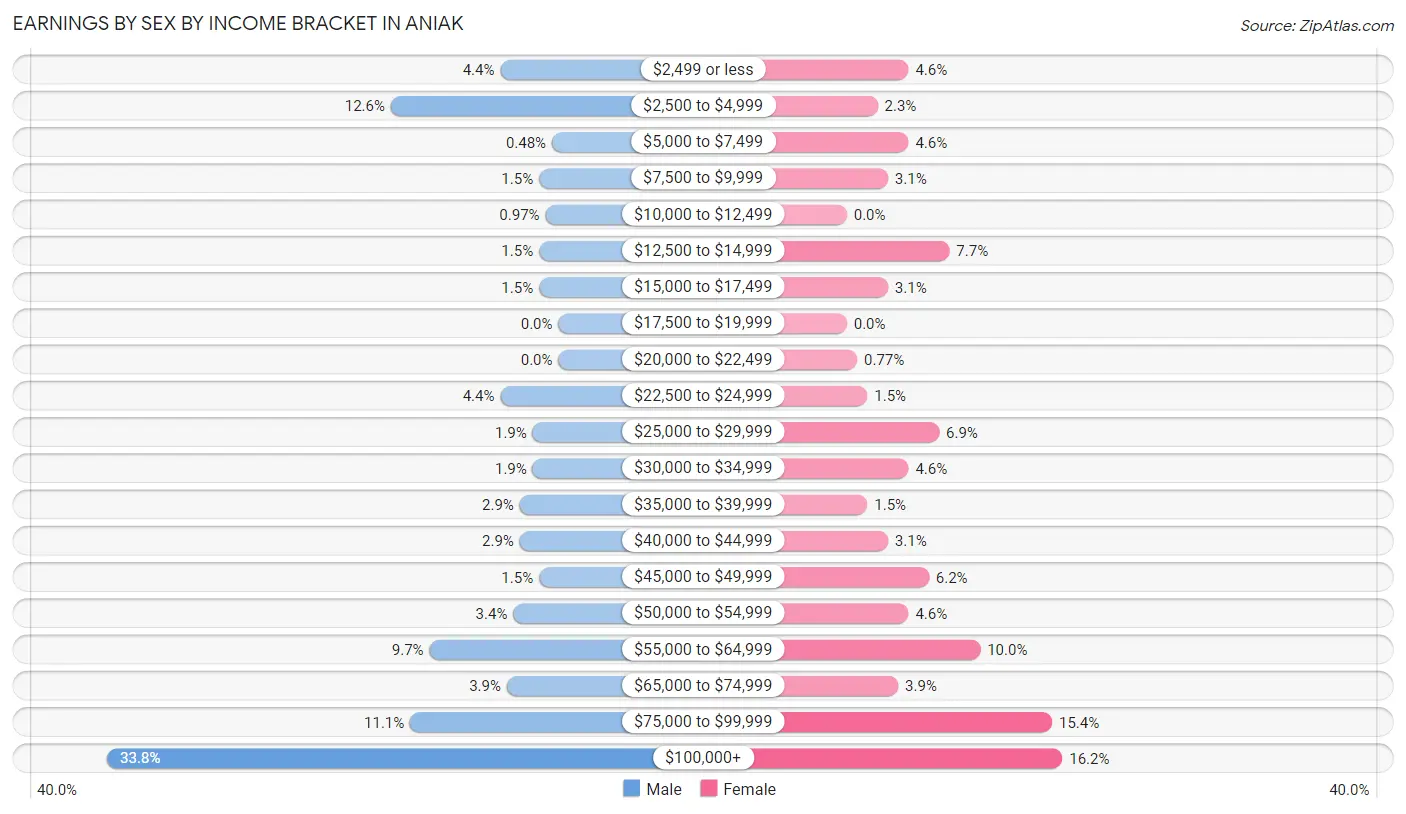
Earnings by Sex by Income Bracket in Aniak
The most common earnings brackets in Aniak are $100,000+ for men (70 | 33.8%) and $100,000+ for women (21 | 16.2%).
| Income | Male | Female |
| $2,499 or less | 9 (4.3%) | 6 (4.6%) |
| $2,500 to $4,999 | 26 (12.6%) | 3 (2.3%) |
| $5,000 to $7,499 | 1 (0.5%) | 6 (4.6%) |
| $7,500 to $9,999 | 3 (1.5%) | 4 (3.1%) |
| $10,000 to $12,499 | 2 (1.0%) | 0 (0.0%) |
| $12,500 to $14,999 | 3 (1.5%) | 10 (7.7%) |
| $15,000 to $17,499 | 3 (1.5%) | 4 (3.1%) |
| $17,500 to $19,999 | 0 (0.0%) | 0 (0.0%) |
| $20,000 to $22,499 | 0 (0.0%) | 1 (0.8%) |
| $22,500 to $24,999 | 9 (4.3%) | 2 (1.5%) |
| $25,000 to $29,999 | 4 (1.9%) | 9 (6.9%) |
| $30,000 to $34,999 | 4 (1.9%) | 6 (4.6%) |
| $35,000 to $39,999 | 6 (2.9%) | 2 (1.5%) |
| $40,000 to $44,999 | 6 (2.9%) | 4 (3.1%) |
| $45,000 to $49,999 | 3 (1.5%) | 8 (6.1%) |
| $50,000 to $54,999 | 7 (3.4%) | 6 (4.6%) |
| $55,000 to $64,999 | 20 (9.7%) | 13 (10.0%) |
| $65,000 to $74,999 | 8 (3.9%) | 5 (3.8%) |
| $75,000 to $99,999 | 23 (11.1%) | 20 (15.4%) |
| $100,000+ | 70 (33.8%) | 21 (16.2%) |
| Total | 207 (100.0%) | 130 (100.0%) |
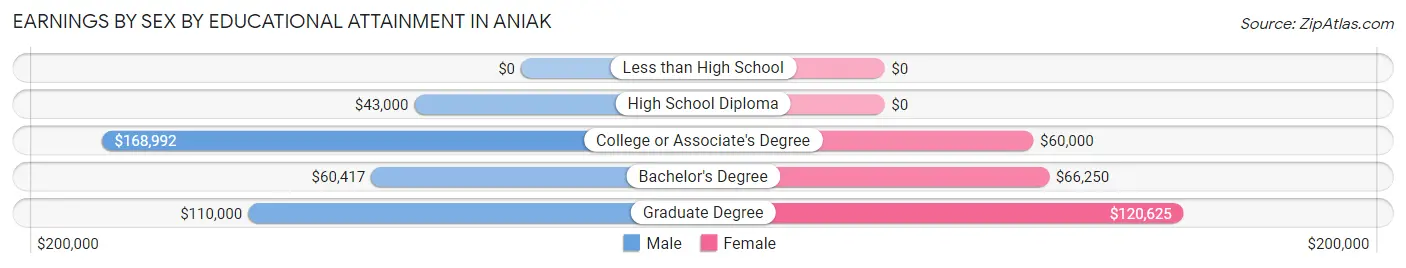
Earnings by Sex by Educational Attainment in Aniak
| Educational Attainment | Male Income | Female Income |
| Less than High School | - | - |
| High School Diploma | $43,000 | $0 |
| College or Associate's Degree | $168,992 | $60,000 |
| Bachelor's Degree | $60,417 | $66,250 |
| Graduate Degree | $110,000 | $120,625 |
| Total | - | - |
Family Income in Aniak
Family Income Brackets in Aniak
According to the Aniak family income data, there are 24 families falling into the $35,000 to $49,999 income range, which is the most common income bracket and makes up 22.0% of all families.
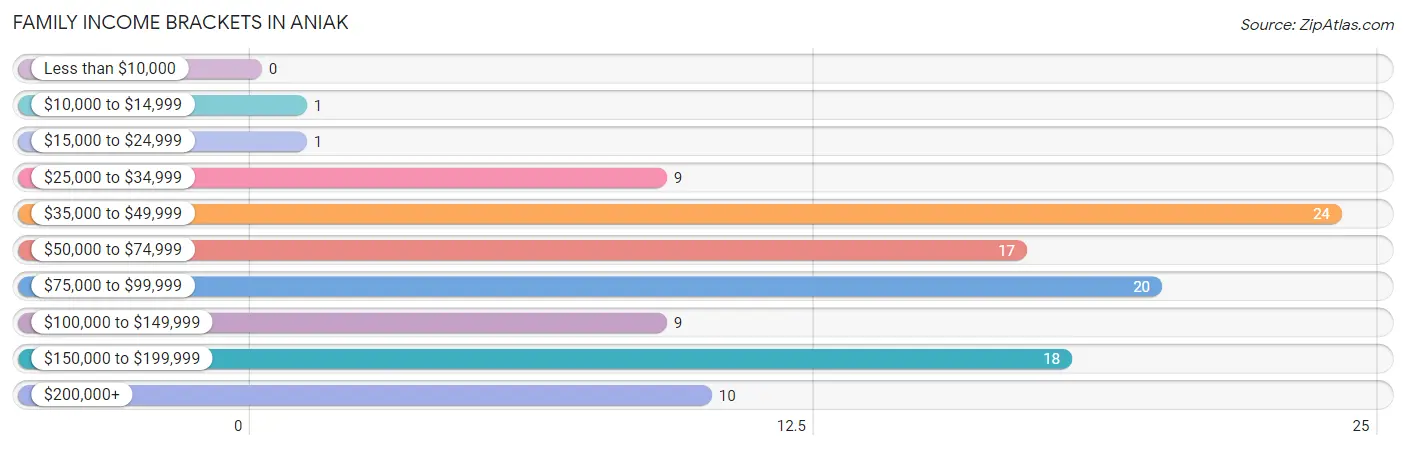
| Income Bracket | # Families | % Families |
| Less than $10,000 | 0 | 0.0% |
| $10,000 to $14,999 | 1 | 0.9% |
| $15,000 to $24,999 | 1 | 0.9% |
| $25,000 to $34,999 | 9 | 8.3% |
| $35,000 to $49,999 | 24 | 22.0% |
| $50,000 to $74,999 | 17 | 15.6% |
| $75,000 to $99,999 | 20 | 18.3% |
| $100,000 to $149,999 | 9 | 8.3% |
| $150,000 to $199,999 | 18 | 16.5% |
| $200,000+ | 10 | 9.2% |
Family Income by Famaliy Size in Aniak
6-person families (6 | 5.5%) account for the highest median family income in Aniak with $153,750 per family, while 2-person families (45 | 41.3%) have the highest median income of $38,542 per family member.
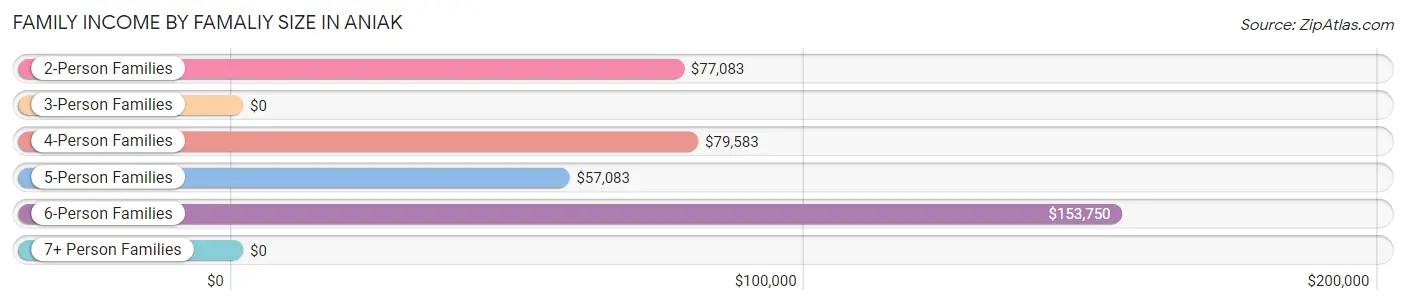
| Income Bracket | # Families | Median Income |
| 2-Person Families | 45 (41.3%) | $77,083 |
| 3-Person Families | 29 (26.6%) | $0 |
| 4-Person Families | 17 (15.6%) | $79,583 |
| 5-Person Families | 11 (10.1%) | $57,083 |
| 6-Person Families | 6 (5.5%) | $153,750 |
| 7+ Person Families | 1 (0.9%) | $0 |
| Total | 109 (100.0%) | $77,083 |
Family Income by Number of Earners in Aniak
The median family income in Aniak is $77,083, with families comprising 3+ earners (16) having the highest median family income of $169,167, while families with no earners (13) have the lowest median family income of $35,417, accounting for 14.7% and 11.9% of families, respectively.
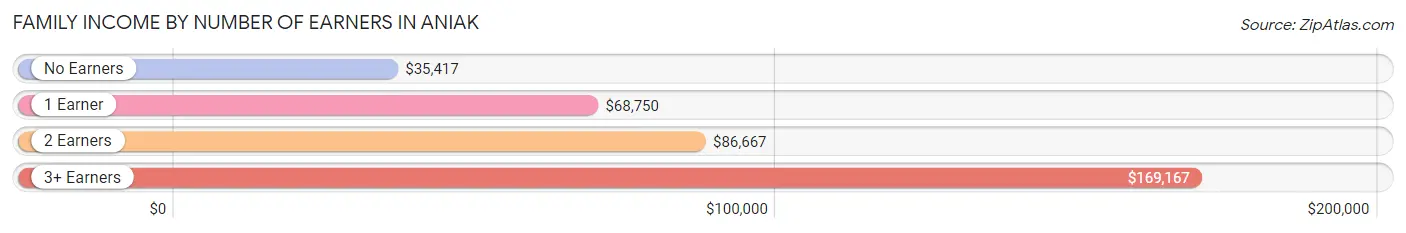
| Number of Earners | # Families | Median Income |
| No Earners | 13 (11.9%) | $35,417 |
| 1 Earner | 32 (29.4%) | $68,750 |
| 2 Earners | 48 (44.0%) | $86,667 |
| 3+ Earners | 16 (14.7%) | $169,167 |
| Total | 109 (100.0%) | $77,083 |
Household Income in Aniak
Household Income Brackets in Aniak
With 31 households falling in the category, the $35,000 to $49,999 income range is the most frequent in Aniak, accounting for 20.4% of all households.
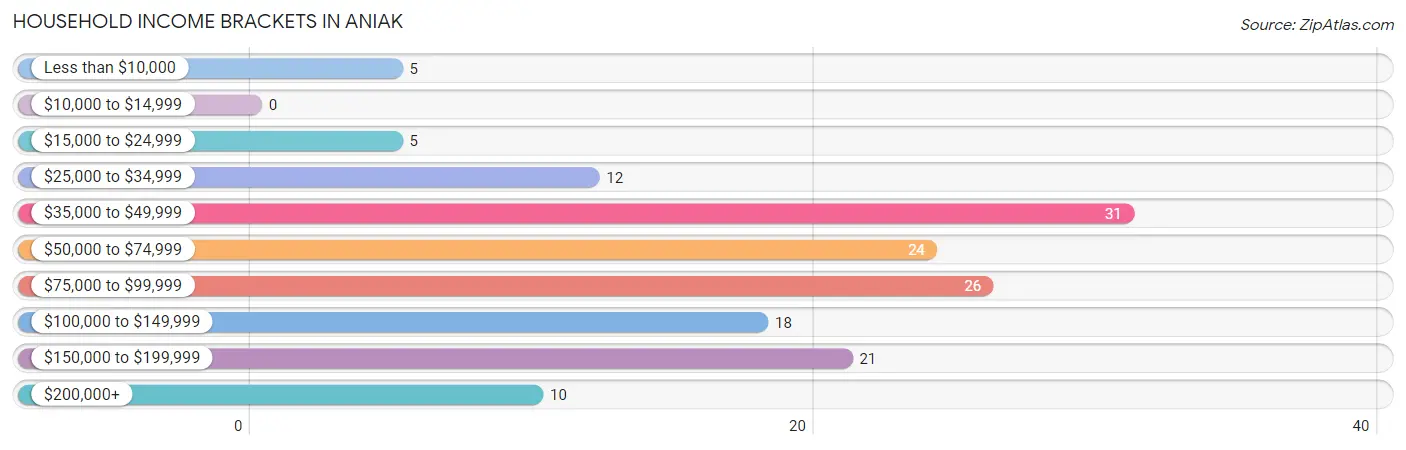
| Income Bracket | # Households | % Households |
| Less than $10,000 | 5 | 3.3% |
| $10,000 to $14,999 | 0 | 0.0% |
| $15,000 to $24,999 | 5 | 3.3% |
| $25,000 to $34,999 | 12 | 7.9% |
| $35,000 to $49,999 | 31 | 20.4% |
| $50,000 to $74,999 | 24 | 15.8% |
| $75,000 to $99,999 | 26 | 17.1% |
| $100,000 to $149,999 | 18 | 11.8% |
| $150,000 to $199,999 | 21 | 13.8% |
| $200,000+ | 10 | 6.6% |
Household Income by Householder Age in Aniak
The median household income in Aniak is $72,500, with the highest median household income of $88,333 found in the 25 to 44 years age bracket for the primary householder. A total of 56 households (36.8%) fall into this category. Meanwhile, the 15 to 24 years age bracket for the primary householder has the lowest median household income of $0, with 4 households (2.6%) in this group.
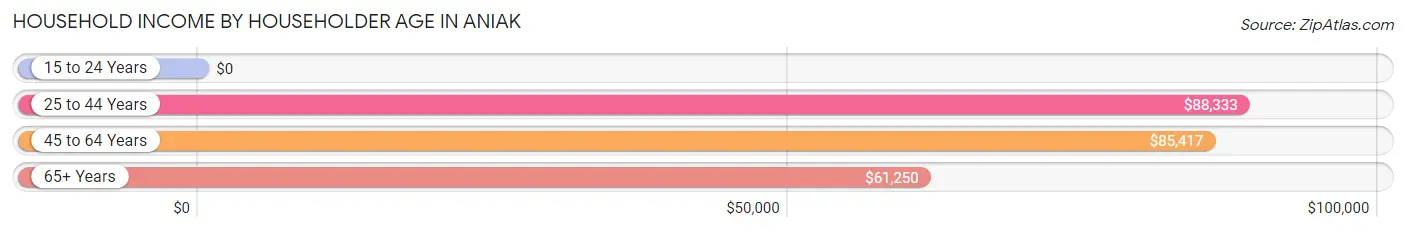
| Income Bracket | # Households | Median Income |
| 15 to 24 Years | 4 (2.6%) | $0 |
| 25 to 44 Years | 56 (36.8%) | $88,333 |
| 45 to 64 Years | 51 (33.6%) | $85,417 |
| 65+ Years | 41 (27.0%) | $61,250 |
| Total | 152 (100.0%) | $72,500 |
Poverty in Aniak
Income Below Poverty by Sex and Age in Aniak
With 13.5% poverty level for males and 9.2% for females among the residents of Aniak, 16 and 17 year old males and 6 to 11 year old females are the most vulnerable to poverty, with 13 males (61.9%) and 6 females (28.6%) in their respective age groups living below the poverty level.
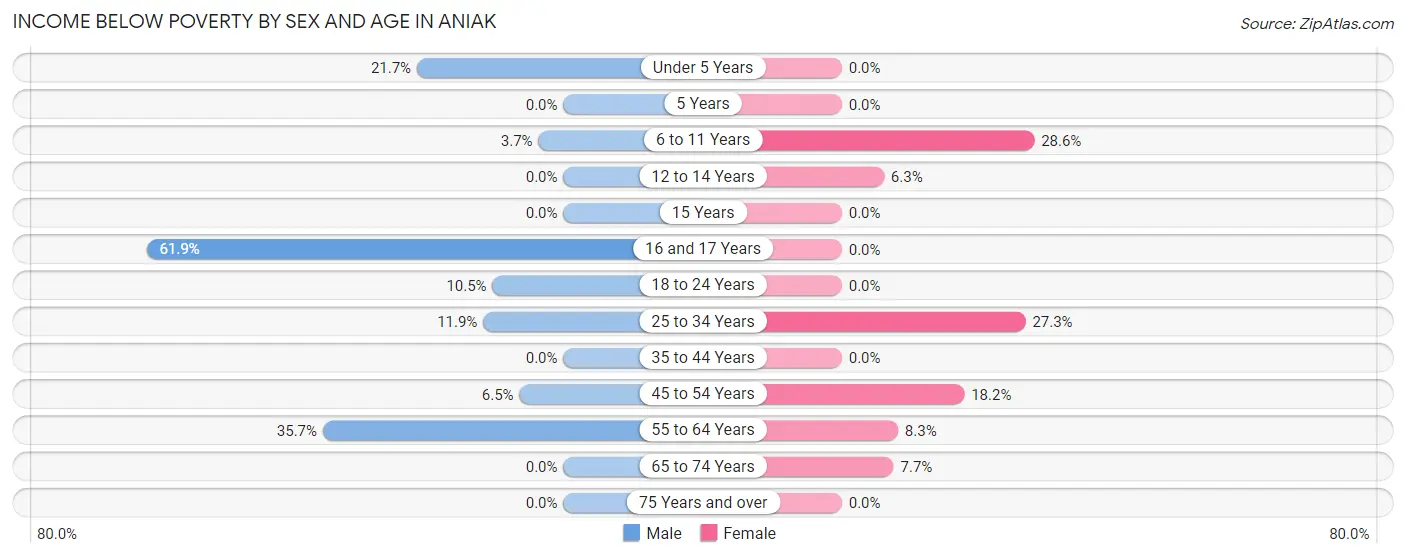
| Age Bracket | Male | Female |
| Under 5 Years | 5 (21.7%) | 0 (0.0%) |
| 5 Years | 0 (0.0%) | 0 (0.0%) |
| 6 to 11 Years | 1 (3.7%) | 6 (28.6%) |
| 12 to 14 Years | 0 (0.0%) | 1 (6.2%) |
| 15 Years | 0 (0.0%) | 0 (0.0%) |
| 16 and 17 Years | 13 (61.9%) | 0 (0.0%) |
| 18 to 24 Years | 2 (10.5%) | 0 (0.0%) |
| 25 to 34 Years | 5 (11.9%) | 6 (27.3%) |
| 35 to 44 Years | 0 (0.0%) | 0 (0.0%) |
| 45 to 54 Years | 3 (6.5%) | 2 (18.2%) |
| 55 to 64 Years | 15 (35.7%) | 4 (8.3%) |
| 65 to 74 Years | 0 (0.0%) | 1 (7.7%) |
| 75 Years and over | 0 (0.0%) | 0 (0.0%) |
| Total | 44 (13.5%) | 20 (9.2%) |
Income Above Poverty by Sex and Age in Aniak
According to the poverty statistics in Aniak, males aged 5 years and females aged under 5 years are the age groups that are most secure financially, with 100.0% of males and 100.0% of females in these age groups living above the poverty line.
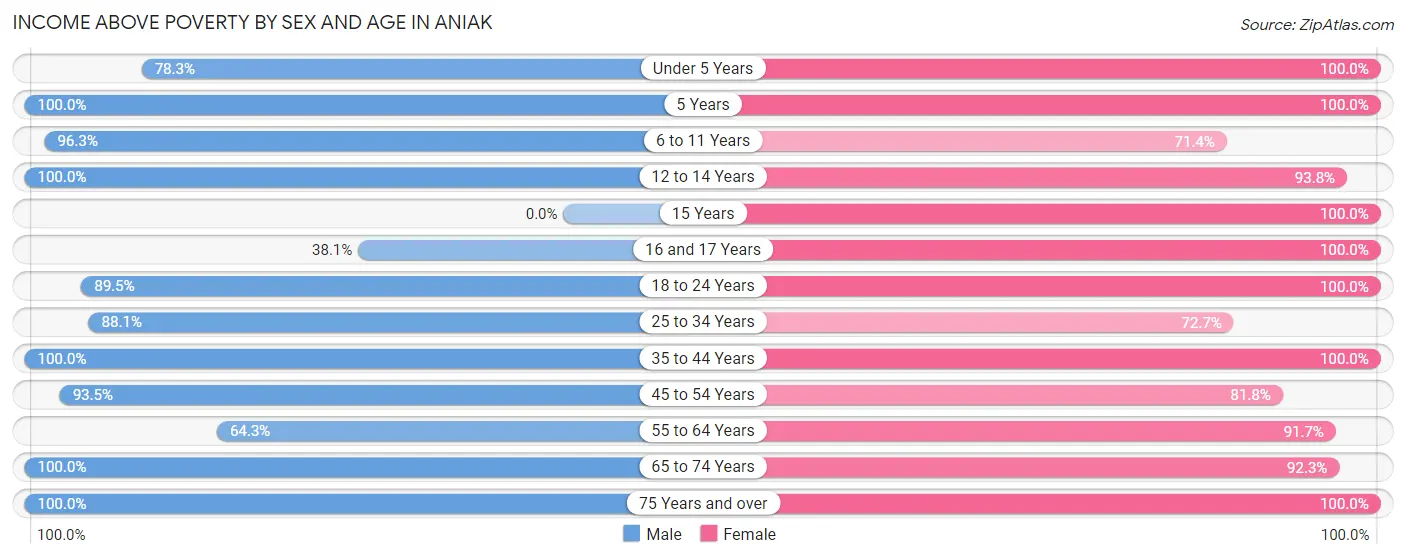
| Age Bracket | Male | Female |
| Under 5 Years | 18 (78.3%) | 1 (100.0%) |
| 5 Years | 1 (100.0%) | 5 (100.0%) |
| 6 to 11 Years | 26 (96.3%) | 15 (71.4%) |
| 12 to 14 Years | 11 (100.0%) | 15 (93.8%) |
| 15 Years | 0 (0.0%) | 1 (100.0%) |
| 16 and 17 Years | 8 (38.1%) | 11 (100.0%) |
| 18 to 24 Years | 17 (89.5%) | 19 (100.0%) |
| 25 to 34 Years | 37 (88.1%) | 16 (72.7%) |
| 35 to 44 Years | 63 (100.0%) | 39 (100.0%) |
| 45 to 54 Years | 43 (93.5%) | 9 (81.8%) |
| 55 to 64 Years | 27 (64.3%) | 44 (91.7%) |
| 65 to 74 Years | 24 (100.0%) | 12 (92.3%) |
| 75 Years and over | 7 (100.0%) | 10 (100.0%) |
| Total | 282 (86.5%) | 197 (90.8%) |
Income Below Poverty Among Married-Couple Families in Aniak
The poverty statistics for married-couple families in Aniak show that 6.2% or 3 of the total 48 families live below the poverty line. Families with 3 or 4 children have the highest poverty rate of 30.0%, comprising of 3 families. On the other hand, families with no children have the lowest poverty rate of 0.0%, which includes 0 families.
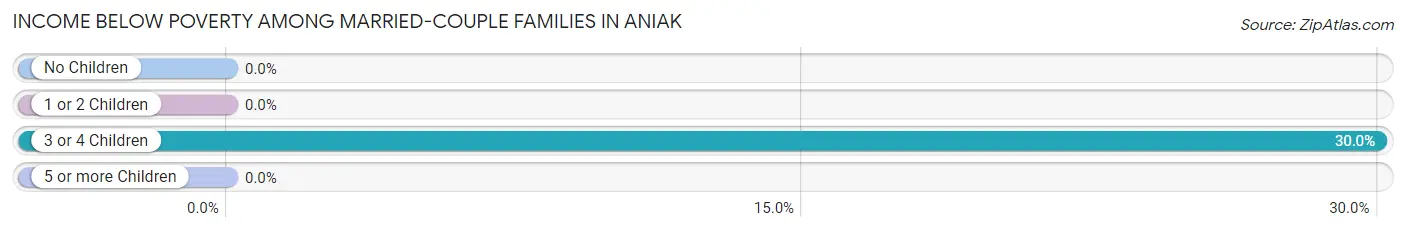
| Children | Above Poverty | Below Poverty |
| No Children | 25 (100.0%) | 0 (0.0%) |
| 1 or 2 Children | 12 (100.0%) | 0 (0.0%) |
| 3 or 4 Children | 7 (70.0%) | 3 (30.0%) |
| 5 or more Children | 1 (100.0%) | 0 (0.0%) |
| Total | 45 (93.8%) | 3 (6.2%) |
Income Below Poverty Among Single-Parent Households in Aniak
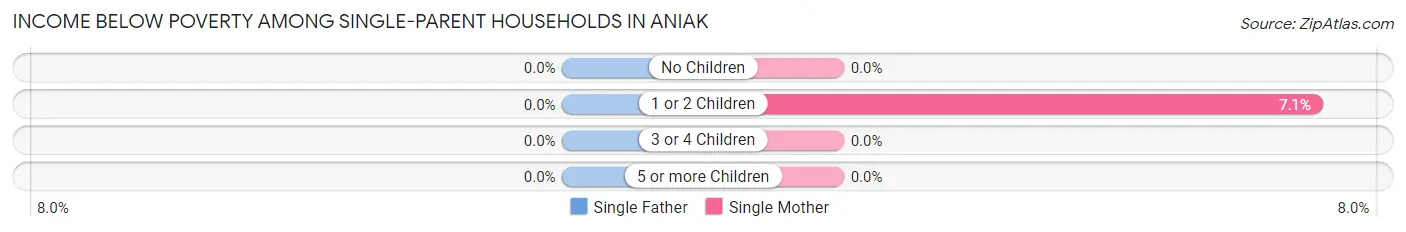
| Children | Single Father | Single Mother |
| No Children | 0 (0.0%) | 0 (0.0%) |
| 1 or 2 Children | 0 (0.0%) | 2 (7.1%) |
| 3 or 4 Children | 0 (0.0%) | 0 (0.0%) |
| 5 or more Children | 0 (0.0%) | 0 (0.0%) |
| Total | 0 (0.0%) | 2 (4.5%) |
Income Below Poverty Among Married-Couple vs Single-Parent Households in Aniak
The poverty data for Aniak shows that 3 of the married-couple family households (6.2%) and 2 of the single-parent households (3.3%) are living below the poverty level. Within the married-couple family households, those with 3 or 4 children have the highest poverty rate, with 3 households (30.0%) falling below the poverty line. Among the single-parent households, those with 1 or 2 children have the highest poverty rate, with 2 household (5.6%) living below poverty.
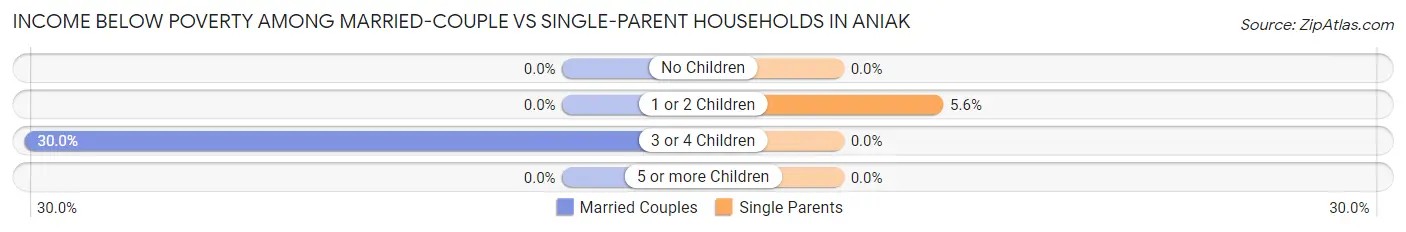
| Children | Married-Couple Families | Single-Parent Households |
| No Children | 0 (0.0%) | 0 (0.0%) |
| 1 or 2 Children | 0 (0.0%) | 2 (5.6%) |
| 3 or 4 Children | 3 (30.0%) | 0 (0.0%) |
| 5 or more Children | 0 (0.0%) | 0 (0.0%) |
| Total | 3 (6.2%) | 2 (3.3%) |
Race in Aniak
The most populous races in Aniak are Native / Alaskan (363 | 65.9%), White / Caucasian (139 | 25.2%), and Two or more Races (19 | 3.5%).
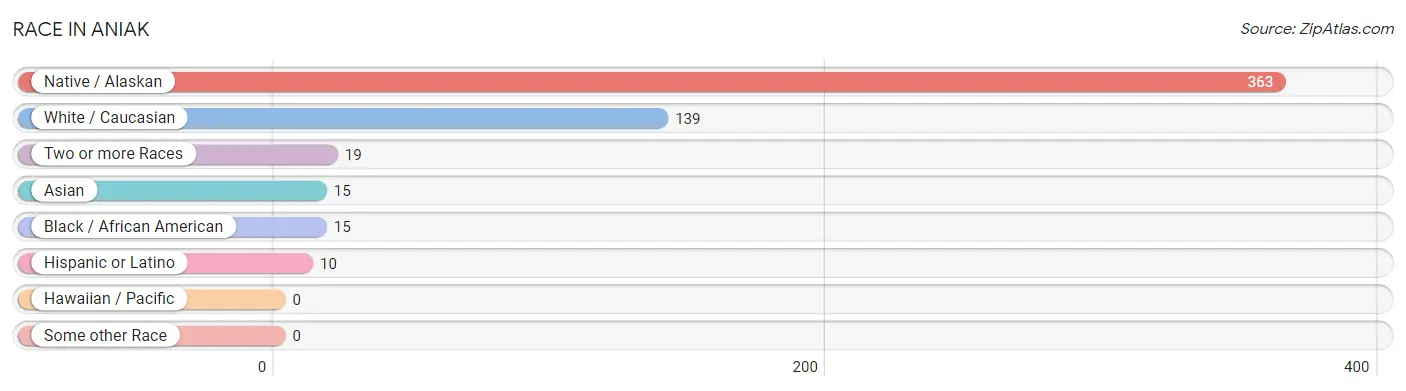
| Race | # Population | % Population |
| Asian | 15 | 2.7% |
| Black / African American | 15 | 2.7% |
| Hawaiian / Pacific | 0 | 0.0% |
| Hispanic or Latino | 10 | 1.8% |
| Native / Alaskan | 363 | 65.9% |
| White / Caucasian | 139 | 25.2% |
| Two or more Races | 19 | 3.5% |
| Some other Race | 0 | 0.0% |
| Total | 551 | 100.0% |
Ancestry in Aniak
The most populous ancestries reported in Aniak are Yup'ik (338 | 61.3%), German (41 | 7.4%), Alaskan Athabascan (20 | 3.6%), Alaska Native (15 | 2.7%), and Ethiopian (15 | 2.7%), together accounting for 77.8% of all Aniak residents.
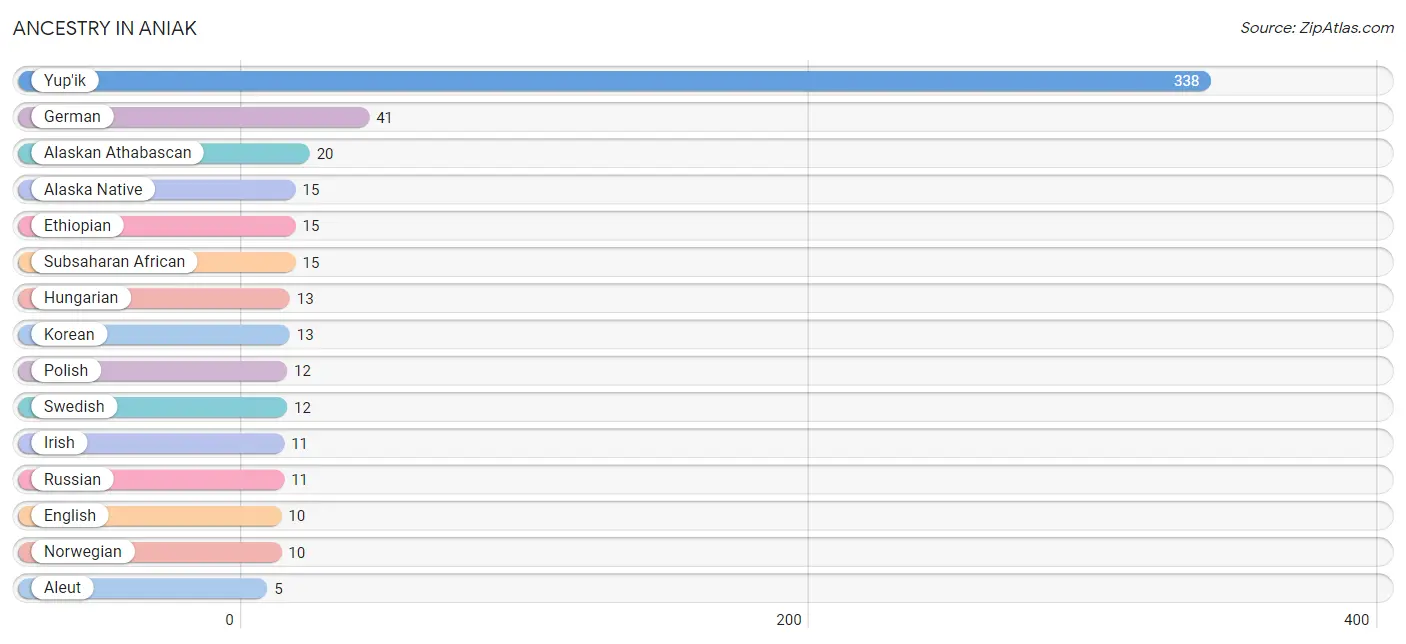
| Ancestry | # Population | % Population |
| Alaska Native | 15 | 2.7% |
| Alaskan Athabascan | 20 | 3.6% |
| Aleut | 5 | 0.9% |
| Blackfeet | 3 | 0.5% |
| British | 1 | 0.2% |
| Burmese | 2 | 0.4% |
| Czechoslovakian | 3 | 0.5% |
| English | 10 | 1.8% |
| Ethiopian | 15 | 2.7% |
| French | 2 | 0.4% |
| German | 41 | 7.4% |
| Hungarian | 13 | 2.4% |
| Irish | 11 | 2.0% |
| Italian | 4 | 0.7% |
| Korean | 13 | 2.4% |
| Mexican | 2 | 0.4% |
| Norwegian | 10 | 1.8% |
| Polish | 12 | 2.2% |
| Puerto Rican | 5 | 0.9% |
| Russian | 11 | 2.0% |
| Scotch-Irish | 1 | 0.2% |
| Scottish | 2 | 0.4% |
| Spanish | 3 | 0.5% |
| Subsaharan African | 15 | 2.7% |
| Swedish | 12 | 2.2% |
| Welsh | 4 | 0.7% |
| Yup'ik | 338 | 61.3% | View All 27 Rows |
Immigrants in Aniak
The most numerous immigrant groups reported in Aniak came from Africa (15 | 2.7%), Eastern Africa (15 | 2.7%), and Ethiopia (15 | 2.7%), together accounting for 8.2% of all Aniak residents.
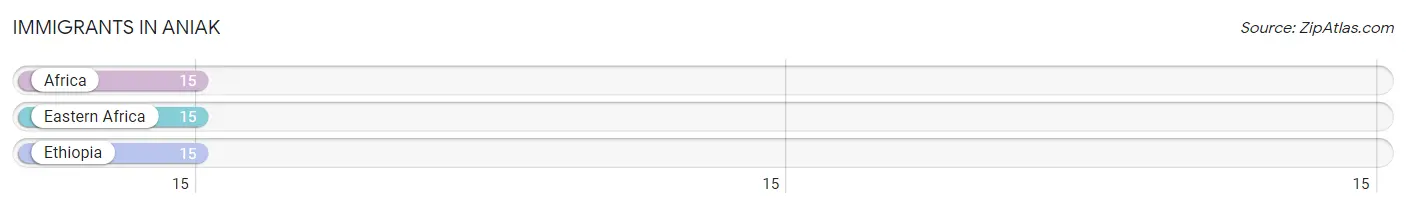
| Immigration Origin | # Population | % Population |
| Africa | 15 | 2.7% |
| Eastern Africa | 15 | 2.7% |
| Ethiopia | 15 | 2.7% | View All 3 Rows |
Sex and Age in Aniak
Sex and Age in Aniak
The most populous age groups in Aniak are 35 to 39 Years (52 | 15.7%) for men and 60 to 64 Years (29 | 13.2%) for women.
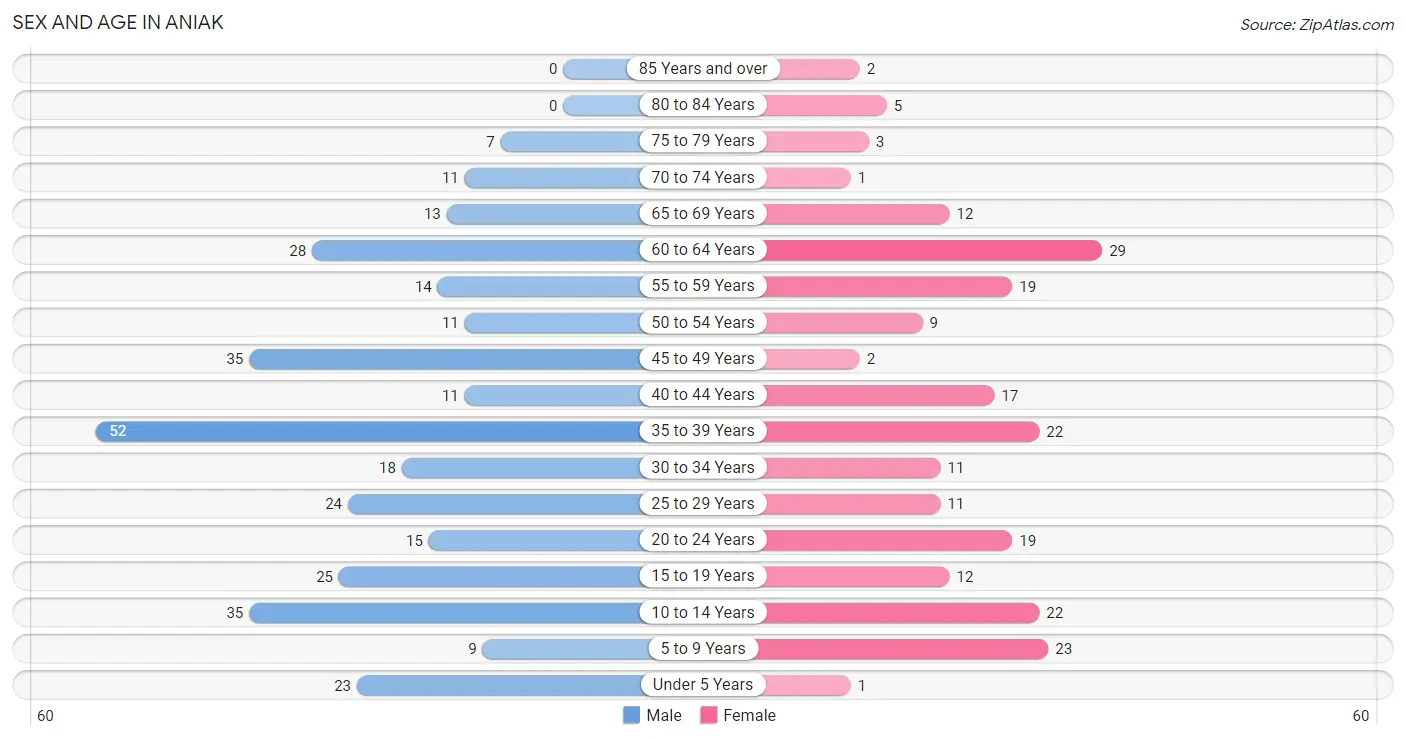
| Age Bracket | Male | Female |
| Under 5 Years | 23 (7.0%) | 1 (0.4%) |
| 5 to 9 Years | 9 (2.7%) | 23 (10.4%) |
| 10 to 14 Years | 35 (10.6%) | 22 (10.0%) |
| 15 to 19 Years | 25 (7.5%) | 12 (5.4%) |
| 20 to 24 Years | 15 (4.5%) | 19 (8.6%) |
| 25 to 29 Years | 24 (7.2%) | 11 (5.0%) |
| 30 to 34 Years | 18 (5.4%) | 11 (5.0%) |
| 35 to 39 Years | 52 (15.7%) | 22 (10.0%) |
| 40 to 44 Years | 11 (3.3%) | 17 (7.7%) |
| 45 to 49 Years | 35 (10.6%) | 2 (0.9%) |
| 50 to 54 Years | 11 (3.3%) | 9 (4.1%) |
| 55 to 59 Years | 14 (4.2%) | 19 (8.6%) |
| 60 to 64 Years | 28 (8.5%) | 29 (13.2%) |
| 65 to 69 Years | 13 (3.9%) | 12 (5.4%) |
| 70 to 74 Years | 11 (3.3%) | 1 (0.4%) |
| 75 to 79 Years | 7 (2.1%) | 3 (1.4%) |
| 80 to 84 Years | 0 (0.0%) | 5 (2.3%) |
| 85 Years and over | 0 (0.0%) | 2 (0.9%) |
| Total | 331 (100.0%) | 220 (100.0%) |
Families and Households in Aniak
Median Family Size in Aniak
The median family size in Aniak is 3.39 persons per family, with single female/mother families (44 | 40.4%) accounting for the largest median family size of 3.55 persons per family. On the other hand, single male/father families (17 | 15.6%) represent the smallest median family size with 2.65 persons per family.
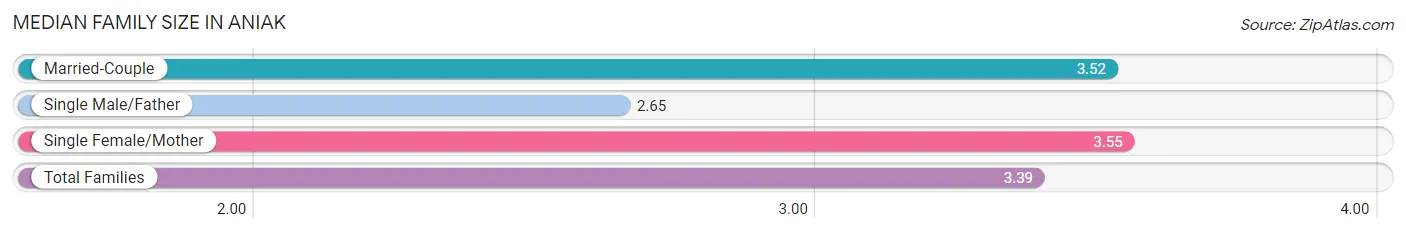
| Family Type | # Families | Family Size |
| Married-Couple | 48 (44.0%) | 3.52 |
| Single Male/Father | 17 (15.6%) | 2.65 |
| Single Female/Mother | 44 (40.4%) | 3.55 |
| Total Families | 109 (100.0%) | 3.39 |
Median Household Size in Aniak
The median household size in Aniak is 2.93 persons per household, with single female/mother households (44 | 28.9%) accounting for the largest median household size of 3.68 persons per household. non-family households (43 | 28.3%) represent the smallest median household size with 1.35 persons per household.
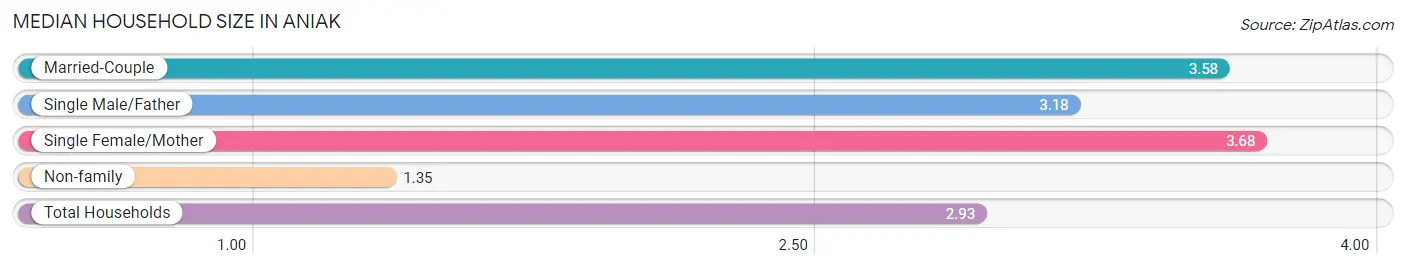
| Household Type | # Households | Household Size |
| Married-Couple | 48 (31.6%) | 3.58 |
| Single Male/Father | 17 (11.2%) | 3.18 |
| Single Female/Mother | 44 (28.9%) | 3.68 |
| Non-family | 43 (28.3%) | 1.35 |
| Total Households | 152 (100.0%) | 2.93 |
Household Size by Marriage Status in Aniak
Out of a total of 152 households in Aniak, 109 (71.7%) are family households, while 43 (28.3%) are nonfamily households. The most numerous type of family households are 2-person households, comprising 40, and the most common type of nonfamily households are 1-person households, comprising 34.
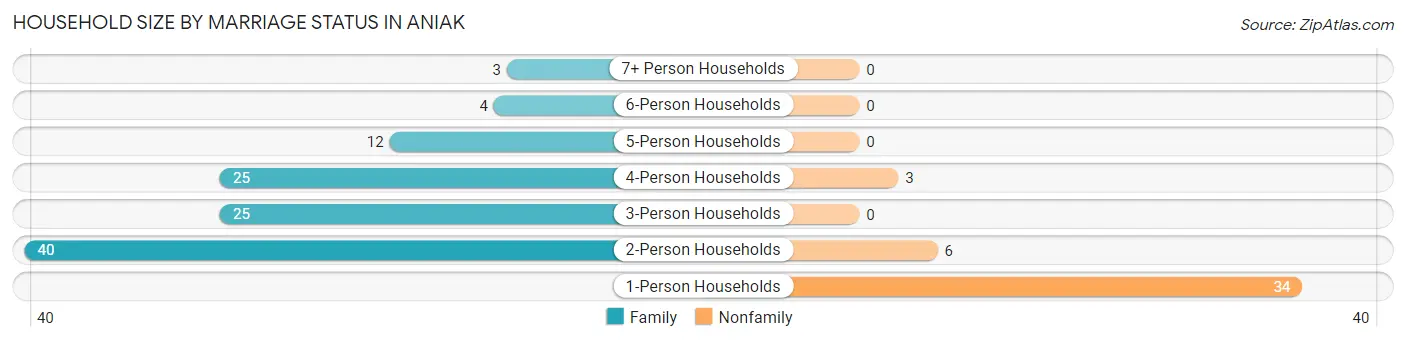
| Household Size | Family Households | Nonfamily Households |
| 1-Person Households | - | 34 (22.4%) |
| 2-Person Households | 40 (26.3%) | 6 (4.0%) |
| 3-Person Households | 25 (16.5%) | 0 (0.0%) |
| 4-Person Households | 25 (16.5%) | 3 (2.0%) |
| 5-Person Households | 12 (7.9%) | 0 (0.0%) |
| 6-Person Households | 4 (2.6%) | 0 (0.0%) |
| 7+ Person Households | 3 (2.0%) | 0 (0.0%) |
| Total | 109 (71.7%) | 43 (28.3%) |
Female Fertility in Aniak
Fertility by Age in Aniak
Average fertility rate in Aniak is 52.0 births per 1,000 women. Women in the age bracket of 15 to 19 years have the highest fertility rate with 167.0 births per 1,000 women. Women in the age bracket of 20 to 34 years acount for 60.0% of all women with births.
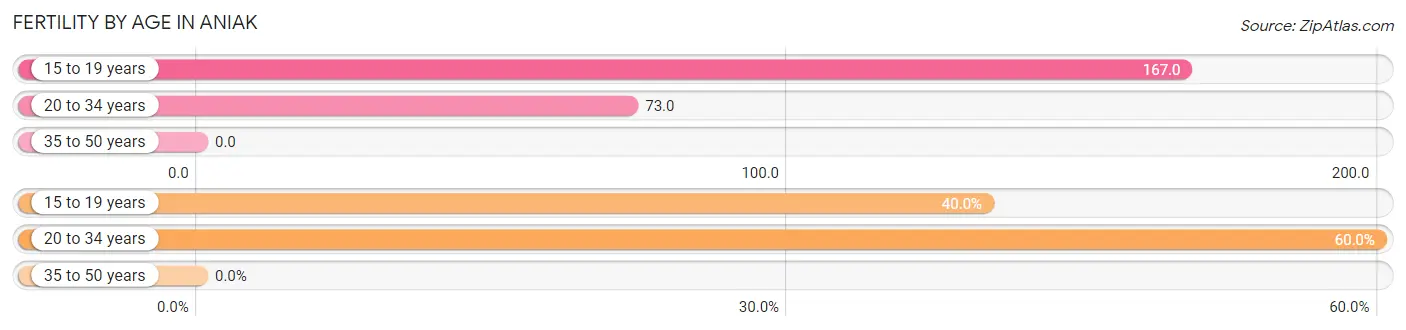
| Age Bracket | Women with Births | Births / 1,000 Women |
| 15 to 19 years | 2 (40.0%) | 167.0 |
| 20 to 34 years | 3 (60.0%) | 73.0 |
| 35 to 50 years | 0 (0.0%) | 0.0 |
| Total | 5 (100.0%) | 52.0 |
Fertility by Age by Marriage Status in Aniak
60.0% of women with births (5) in Aniak are married. The highest percentage of unmarried women with births falls into 15 to 19 years age bracket with 100.0% of them unmarried at the time of birth, while the lowest percentage of unmarried women with births belong to 20 to 34 years age bracket with 0.0% of them unmarried.
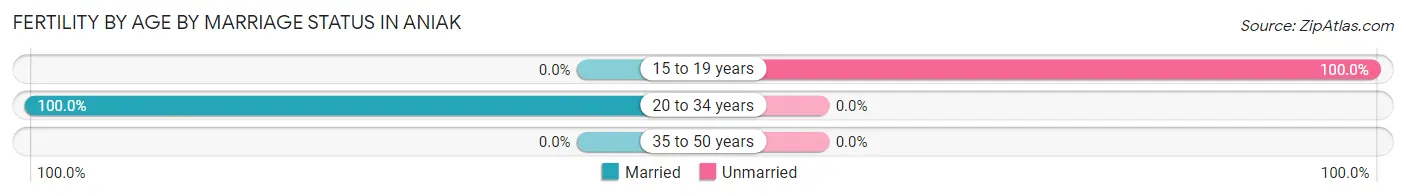
| Age Bracket | Married | Unmarried |
| 15 to 19 years | 0 (0.0%) | 2 (100.0%) |
| 20 to 34 years | 3 (100.0%) | 0 (0.0%) |
| 35 to 50 years | 0 (0.0%) | 0 (0.0%) |
| Total | 3 (60.0%) | 2 (40.0%) |
Fertility by Education in Aniak
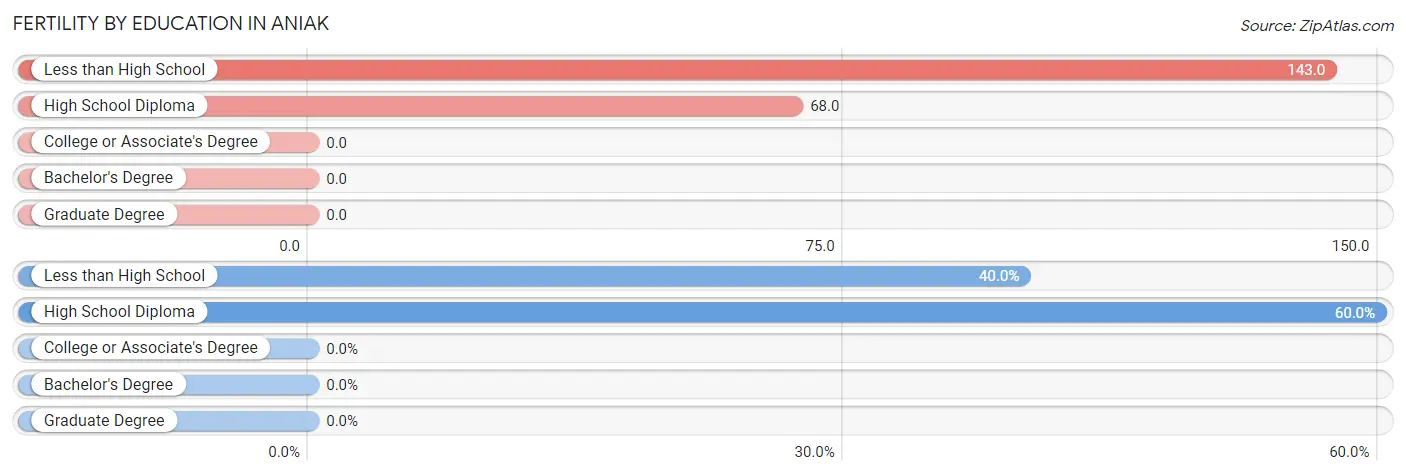
| Educational Attainment | Women with Births | Births / 1,000 Women |
| Less than High School | 2 (40.0%) | 143.0 |
| High School Diploma | 3 (60.0%) | 68.0 |
| College or Associate's Degree | 0 (0.0%) | 0.0 |
| Bachelor's Degree | 0 (0.0%) | 0.0 |
| Graduate Degree | 0 (0.0%) | 0.0 |
| Total | 5 (100.0%) | 52.0 |
Fertility by Education by Marriage Status in Aniak
40.0% of women with births in Aniak are unmarried. Women with the educational attainment of high school diploma are most likely to be married with 100.0% of them married at childbirth, while women with the educational attainment of less than high school are least likely to be married with 100.0% of them unmarried at childbirth.
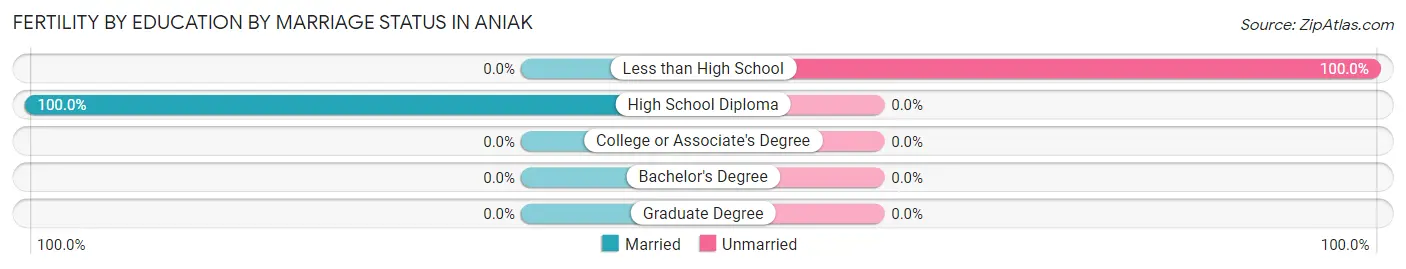
| Educational Attainment | Married | Unmarried |
| Less than High School | 0 (0.0%) | 2 (100.0%) |
| High School Diploma | 3 (100.0%) | 0 (0.0%) |
| College or Associate's Degree | 0 (0.0%) | 0 (0.0%) |
| Bachelor's Degree | 0 (0.0%) | 0 (0.0%) |
| Graduate Degree | 0 (0.0%) | 0 (0.0%) |
| Total | 3 (60.0%) | 2 (40.0%) |
Employment Characteristics in Aniak
Employment by Class of Employer in Aniak
Among the 287 employed individuals in Aniak, private company employees (152 | 53.0%), state government employees (49 | 17.1%), and not-for-profit organizations (33 | 11.5%) make up the most common classes of employment.
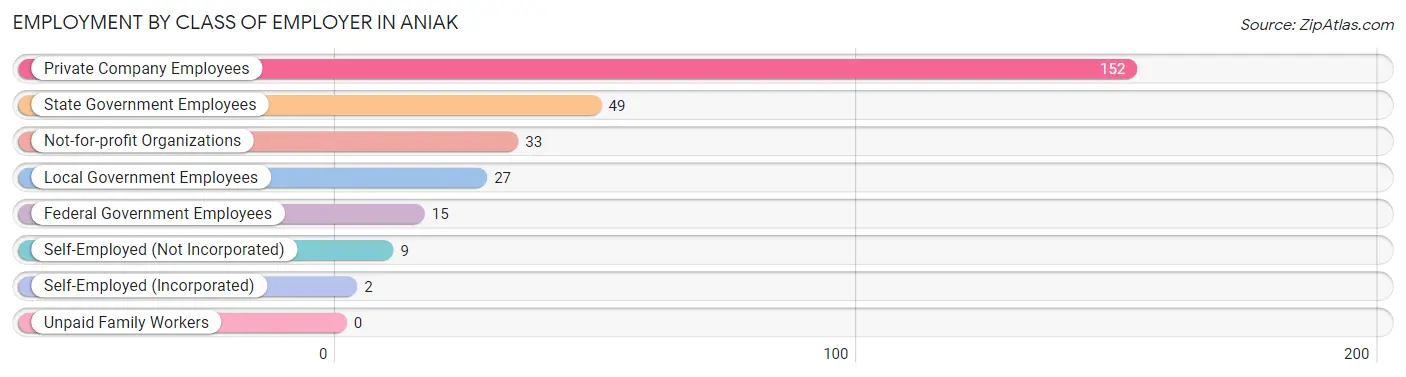
| Employer Class | # Employees | % Employees |
| Private Company Employees | 152 | 53.0% |
| Self-Employed (Incorporated) | 2 | 0.7% |
| Self-Employed (Not Incorporated) | 9 | 3.1% |
| Not-for-profit Organizations | 33 | 11.5% |
| Local Government Employees | 27 | 9.4% |
| State Government Employees | 49 | 17.1% |
| Federal Government Employees | 15 | 5.2% |
| Unpaid Family Workers | 0 | 0.0% |
| Total | 287 | 100.0% |
Employment Status by Age in Aniak
According to the labor force statistics for Aniak, out of the total population over 16 years of age (437), 75.1% or 328 individuals are in the labor force, with 7.3% or 24 of them unemployed. The age group with the highest labor force participation rate is 20 to 24 years, with 100.0% or 34 individuals in the labor force. Within the labor force, the 30 to 34 years age range has the highest percentage of unemployed individuals, with 30.4% or 7 of them being unemployed.
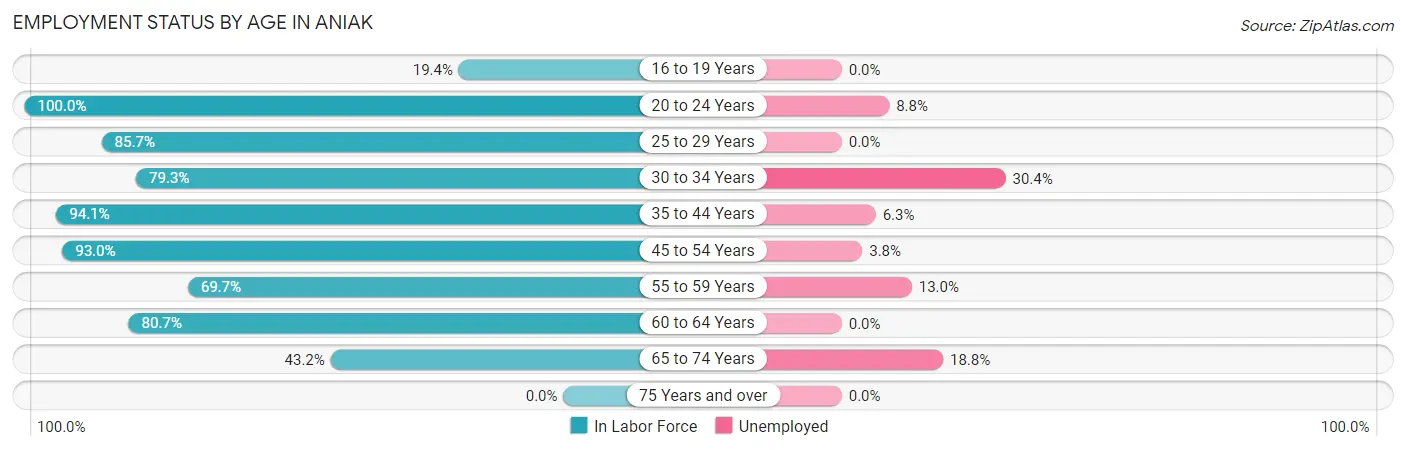
| Age Bracket | In Labor Force | Unemployed |
| 16 to 19 Years | 7 (19.4%) | 0 (0.0%) |
| 20 to 24 Years | 34 (100.0%) | 3 (8.8%) |
| 25 to 29 Years | 30 (85.7%) | 0 (0.0%) |
| 30 to 34 Years | 23 (79.3%) | 7 (30.4%) |
| 35 to 44 Years | 96 (94.1%) | 6 (6.3%) |
| 45 to 54 Years | 53 (93.0%) | 2 (3.8%) |
| 55 to 59 Years | 23 (69.7%) | 3 (13.0%) |
| 60 to 64 Years | 46 (80.7%) | 0 (0.0%) |
| 65 to 74 Years | 16 (43.2%) | 3 (18.8%) |
| 75 Years and over | 0 (0.0%) | 0 (0.0%) |
| Total | 328 (75.1%) | 24 (7.3%) |
Employment Status by Educational Attainment in Aniak
According to labor force statistics for Aniak, 86.6% of individuals (271) out of the total population between 25 and 64 years of age (313) are in the labor force, with 6.6% or 18 of them being unemployed. The group with the highest labor force participation rate are those with the educational attainment of bachelor's degree or higher, with 96.4% or 27 individuals in the labor force. Within the labor force, individuals with high school diploma education have the highest percentage of unemployment, with 12.8% or 14 of them being unemployed.
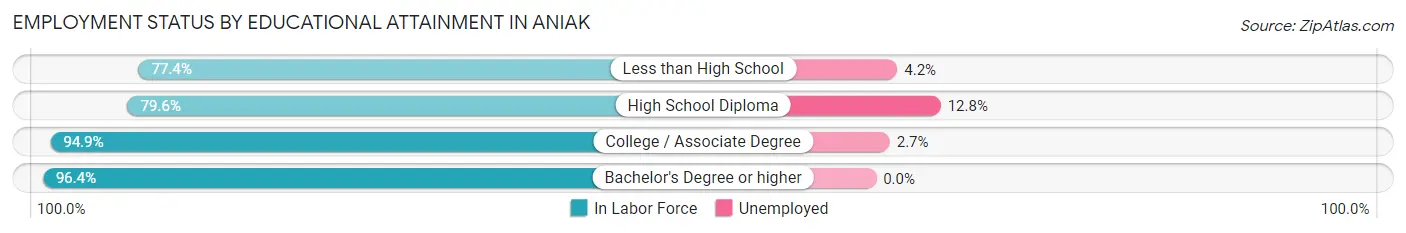
| Educational Attainment | In Labor Force | Unemployed |
| Less than High School | 24 (77.4%) | 1 (4.2%) |
| High School Diploma | 109 (79.6%) | 18 (12.8%) |
| College / Associate Degree | 111 (94.9%) | 3 (2.7%) |
| Bachelor's Degree or higher | 27 (96.4%) | 0 (0.0%) |
| Total | 271 (86.6%) | 21 (6.6%) |
Employment Occupations by Sex in Aniak
Management, Business, Science and Arts Occupations
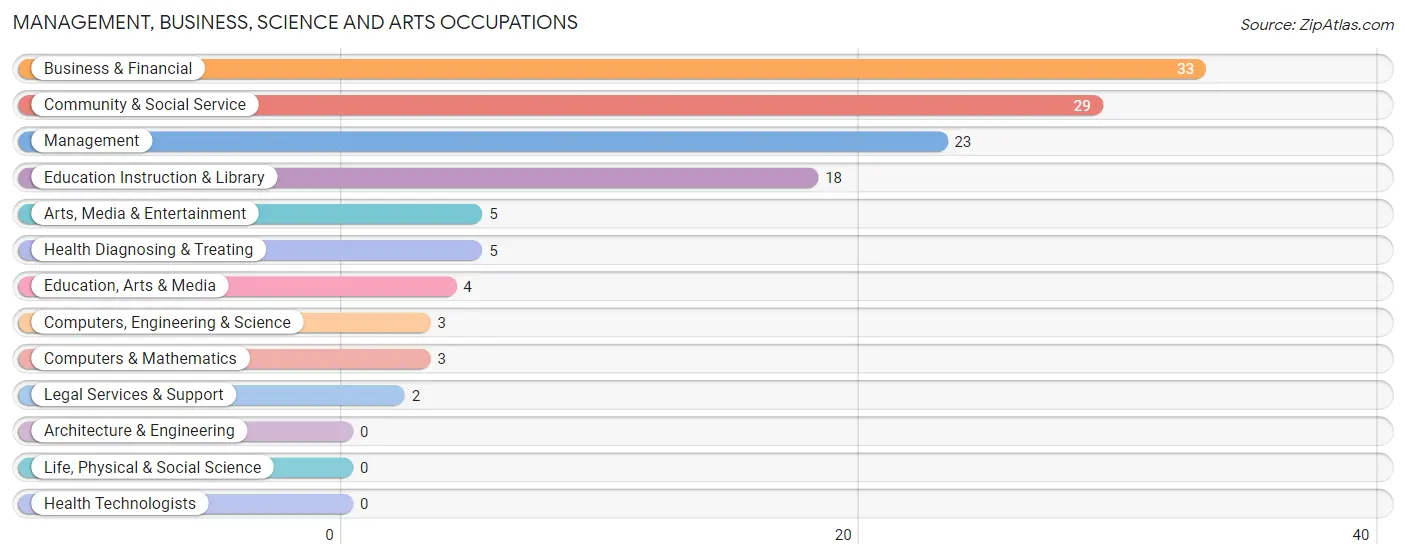
The most common Management, Business, Science and Arts occupations in Aniak are Business & Financial (33 | 10.9%), Community & Social Service (29 | 9.5%), Management (23 | 7.6%), Education Instruction & Library (18 | 5.9%), and Arts, Media & Entertainment (5 | 1.6%).
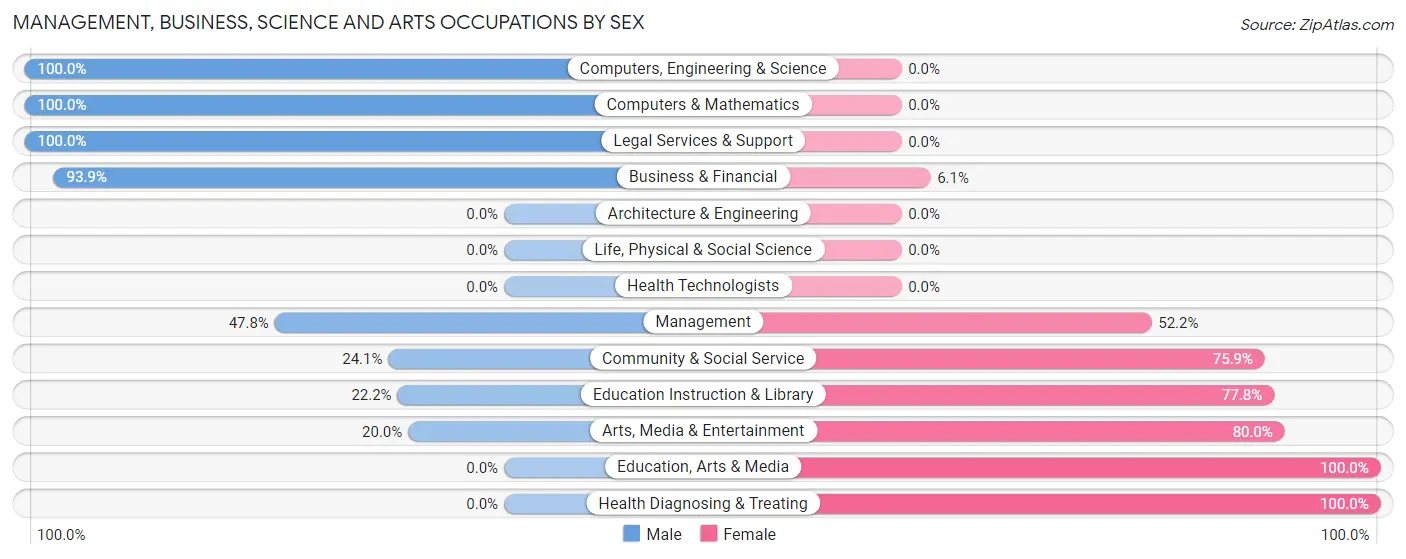
Management, Business, Science and Arts Occupations by Sex
Within the Management, Business, Science and Arts occupations in Aniak, the most male-oriented occupations are Computers, Engineering & Science (100.0%), Computers & Mathematics (100.0%), and Legal Services & Support (100.0%), while the most female-oriented occupations are Education, Arts & Media (100.0%), Health Diagnosing & Treating (100.0%), and Arts, Media & Entertainment (80.0%).
| Occupation | Male | Female |
| Management | 11 (47.8%) | 12 (52.2%) |
| Business & Financial | 31 (93.9%) | 2 (6.1%) |
| Computers, Engineering & Science | 3 (100.0%) | 0 (0.0%) |
| Computers & Mathematics | 3 (100.0%) | 0 (0.0%) |
| Architecture & Engineering | 0 (0.0%) | 0 (0.0%) |
| Life, Physical & Social Science | 0 (0.0%) | 0 (0.0%) |
| Community & Social Service | 7 (24.1%) | 22 (75.9%) |
| Education, Arts & Media | 0 (0.0%) | 4 (100.0%) |
| Legal Services & Support | 2 (100.0%) | 0 (0.0%) |
| Education Instruction & Library | 4 (22.2%) | 14 (77.8%) |
| Arts, Media & Entertainment | 1 (20.0%) | 4 (80.0%) |
| Health Diagnosing & Treating | 0 (0.0%) | 5 (100.0%) |
| Health Technologists | 0 (0.0%) | 0 (0.0%) |
| Total (Category) | 52 (55.9%) | 41 (44.1%) |
| Total (Overall) | 189 (62.2%) | 115 (37.8%) |
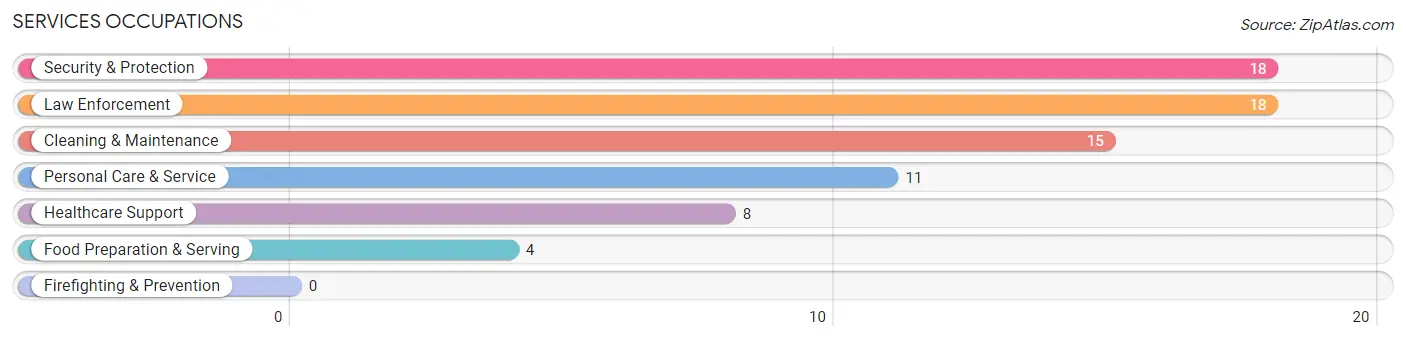
Services Occupations
The most common Services occupations in Aniak are Security & Protection (18 | 5.9%), Law Enforcement (18 | 5.9%), Cleaning & Maintenance (15 | 4.9%), Personal Care & Service (11 | 3.6%), and Healthcare Support (8 | 2.6%).
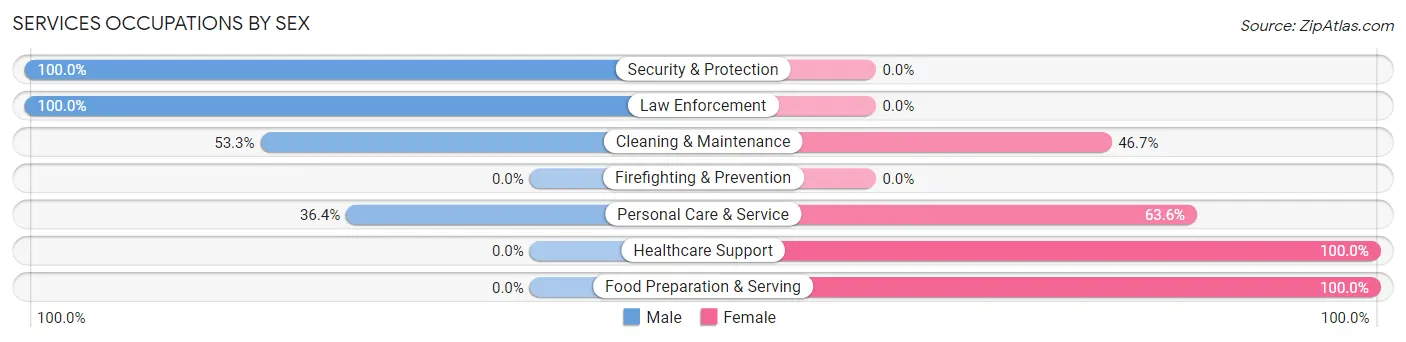
Services Occupations by Sex
Within the Services occupations in Aniak, the most male-oriented occupations are Security & Protection (100.0%), Law Enforcement (100.0%), and Cleaning & Maintenance (53.3%), while the most female-oriented occupations are Healthcare Support (100.0%), Food Preparation & Serving (100.0%), and Personal Care & Service (63.6%).
| Occupation | Male | Female |
| Healthcare Support | 0 (0.0%) | 8 (100.0%) |
| Security & Protection | 18 (100.0%) | 0 (0.0%) |
| Firefighting & Prevention | 0 (0.0%) | 0 (0.0%) |
| Law Enforcement | 18 (100.0%) | 0 (0.0%) |
| Food Preparation & Serving | 0 (0.0%) | 4 (100.0%) |
| Cleaning & Maintenance | 8 (53.3%) | 7 (46.7%) |
| Personal Care & Service | 4 (36.4%) | 7 (63.6%) |
| Total (Category) | 30 (53.6%) | 26 (46.4%) |
| Total (Overall) | 189 (62.2%) | 115 (37.8%) |
Sales and Office Occupations
The most common Sales and Office occupations in Aniak are Office & Administration (38 | 12.5%), and Sales & Related (17 | 5.6%).
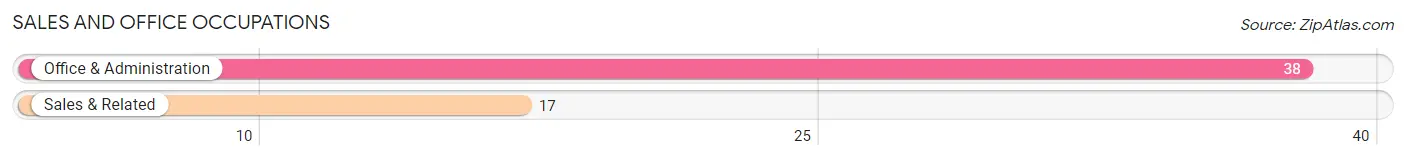
Sales and Office Occupations by Sex
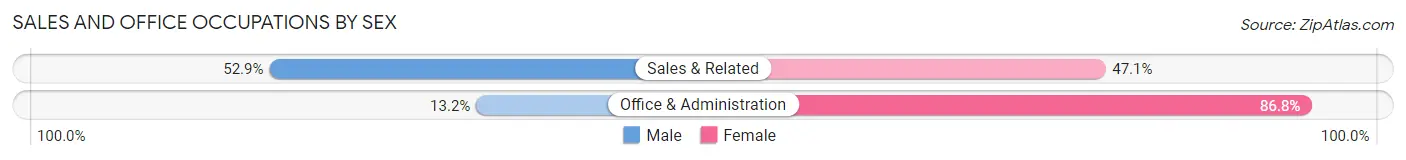
| Occupation | Male | Female |
| Sales & Related | 9 (52.9%) | 8 (47.1%) |
| Office & Administration | 5 (13.2%) | 33 (86.8%) |
| Total (Category) | 14 (25.5%) | 41 (74.6%) |
| Total (Overall) | 189 (62.2%) | 115 (37.8%) |
Natural Resources, Construction and Maintenance Occupations
The most common Natural Resources, Construction and Maintenance occupations in Aniak are Construction & Extraction (12 | 4.0%), Installation, Maintenance & Repair (7 | 2.3%), and Farming, Fishing & Forestry (2 | 0.7%).
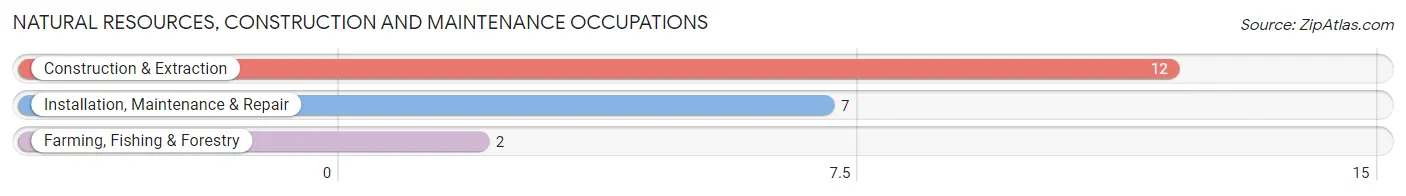
Natural Resources, Construction and Maintenance Occupations by Sex
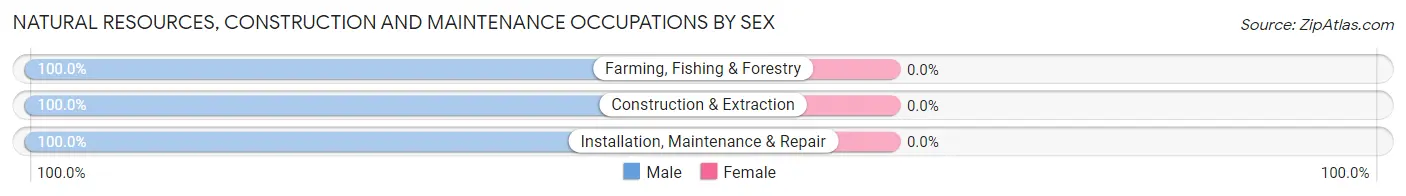
| Occupation | Male | Female |
| Farming, Fishing & Forestry | 2 (100.0%) | 0 (0.0%) |
| Construction & Extraction | 12 (100.0%) | 0 (0.0%) |
| Installation, Maintenance & Repair | 7 (100.0%) | 0 (0.0%) |
| Total (Category) | 21 (100.0%) | 0 (0.0%) |
| Total (Overall) | 189 (62.2%) | 115 (37.8%) |
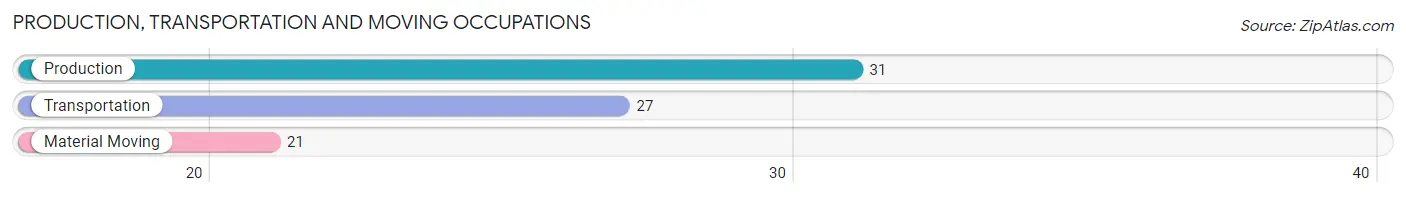
Production, Transportation and Moving Occupations
The most common Production, Transportation and Moving occupations in Aniak are Production (31 | 10.2%), Transportation (27 | 8.9%), and Material Moving (21 | 6.9%).
Production, Transportation and Moving Occupations by Sex
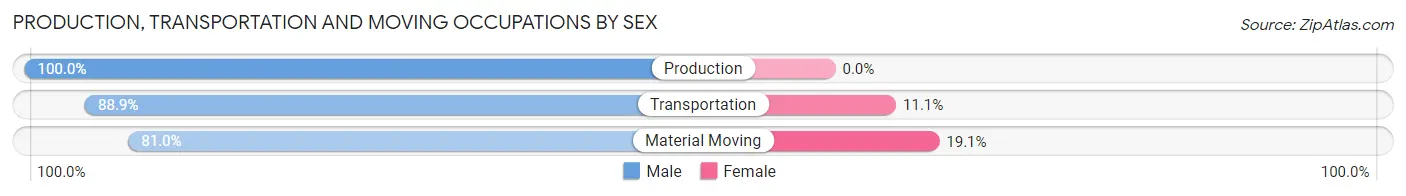
| Occupation | Male | Female |
| Production | 31 (100.0%) | 0 (0.0%) |
| Transportation | 24 (88.9%) | 3 (11.1%) |
| Material Moving | 17 (80.9%) | 4 (19.1%) |
| Total (Category) | 72 (91.1%) | 7 (8.9%) |
| Total (Overall) | 189 (62.2%) | 115 (37.8%) |
Employment Industries by Sex in Aniak
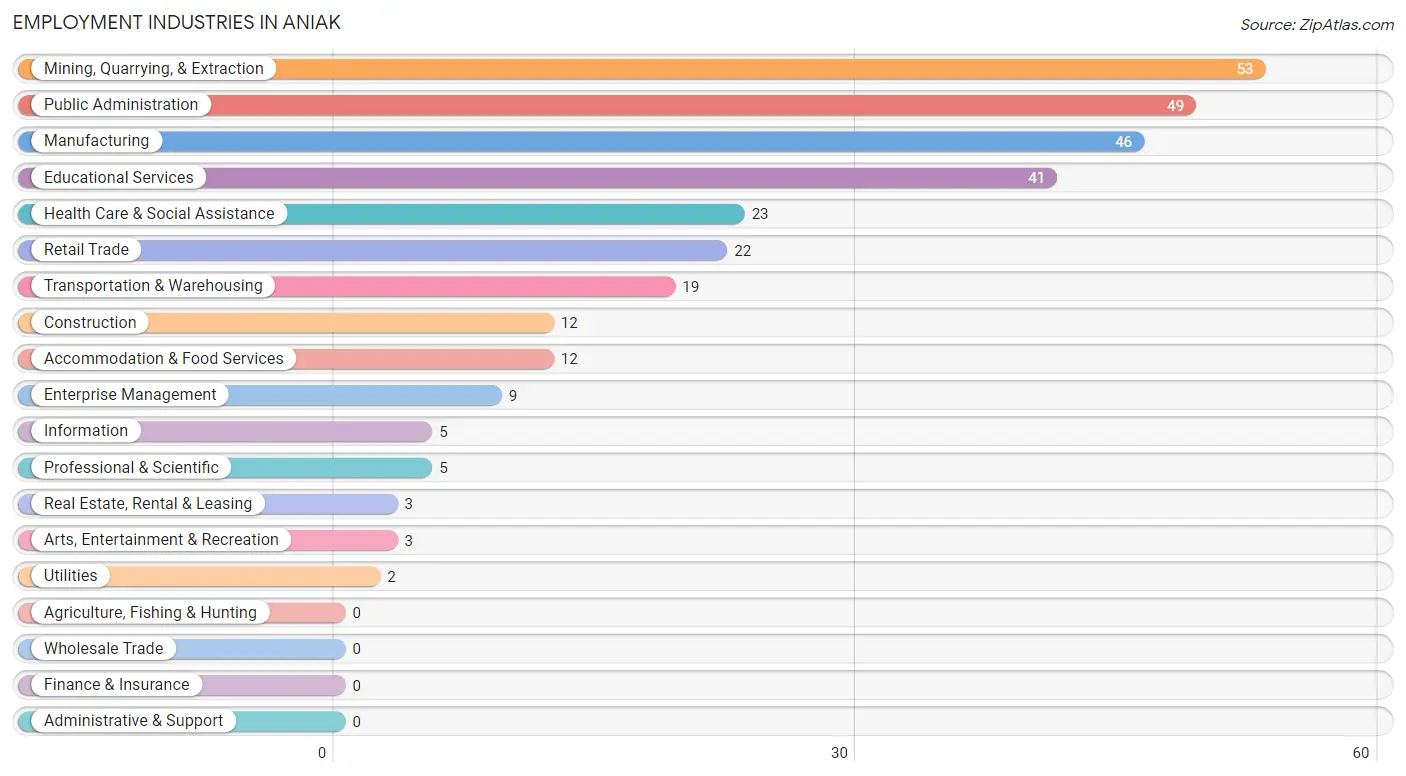
Employment Industries in Aniak
The major employment industries in Aniak include Mining, Quarrying, & Extraction (53 | 17.4%), Public Administration (49 | 16.1%), Manufacturing (46 | 15.1%), Educational Services (41 | 13.5%), and Health Care & Social Assistance (23 | 7.6%).
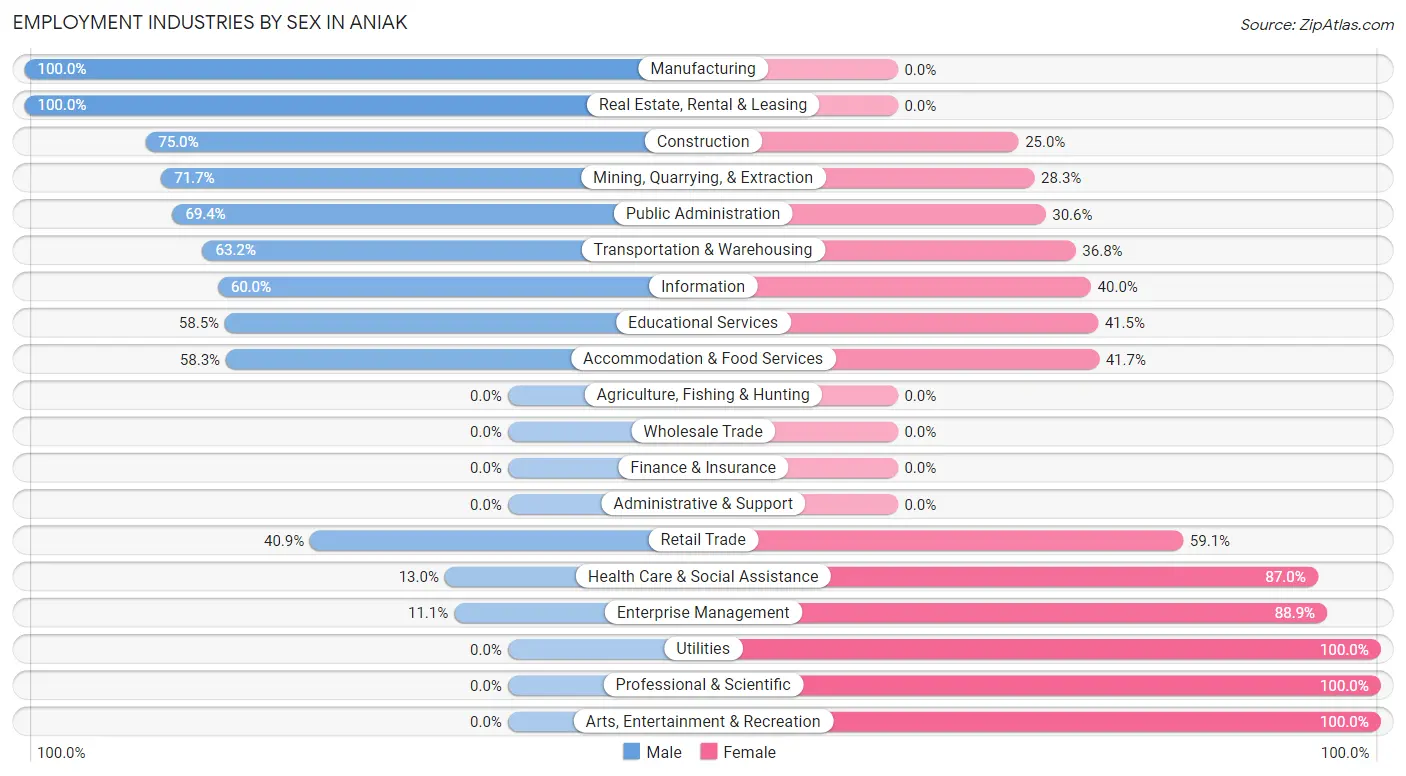
Employment Industries by Sex in Aniak
The Aniak industries that see more men than women are Manufacturing (100.0%), Real Estate, Rental & Leasing (100.0%), and Construction (75.0%), whereas the industries that tend to have a higher number of women are Utilities (100.0%), Professional & Scientific (100.0%), and Arts, Entertainment & Recreation (100.0%).
| Industry | Male | Female |
| Agriculture, Fishing & Hunting | 0 (0.0%) | 0 (0.0%) |
| Mining, Quarrying, & Extraction | 38 (71.7%) | 15 (28.3%) |
| Construction | 9 (75.0%) | 3 (25.0%) |
| Manufacturing | 46 (100.0%) | 0 (0.0%) |
| Wholesale Trade | 0 (0.0%) | 0 (0.0%) |
| Retail Trade | 9 (40.9%) | 13 (59.1%) |
| Transportation & Warehousing | 12 (63.2%) | 7 (36.8%) |
| Utilities | 0 (0.0%) | 2 (100.0%) |
| Information | 3 (60.0%) | 2 (40.0%) |
| Finance & Insurance | 0 (0.0%) | 0 (0.0%) |
| Real Estate, Rental & Leasing | 3 (100.0%) | 0 (0.0%) |
| Professional & Scientific | 0 (0.0%) | 5 (100.0%) |
| Enterprise Management | 1 (11.1%) | 8 (88.9%) |
| Administrative & Support | 0 (0.0%) | 0 (0.0%) |
| Educational Services | 24 (58.5%) | 17 (41.5%) |
| Health Care & Social Assistance | 3 (13.0%) | 20 (87.0%) |
| Arts, Entertainment & Recreation | 0 (0.0%) | 3 (100.0%) |
| Accommodation & Food Services | 7 (58.3%) | 5 (41.7%) |
| Public Administration | 34 (69.4%) | 15 (30.6%) |
| Total | 189 (62.2%) | 115 (37.8%) |
Education in Aniak
School Enrollment in Aniak
The most common levels of schooling among the 134 students in Aniak are high school (49 | 36.6%), middle school (34 | 25.4%), and elementary school (32 | 23.9%).
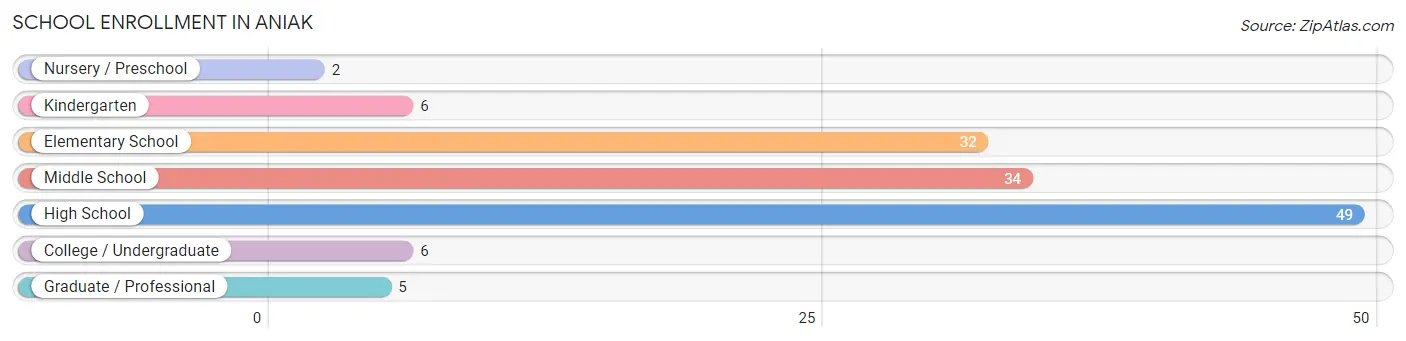
| School Level | # Students | % Students |
| Nursery / Preschool | 2 | 1.5% |
| Kindergarten | 6 | 4.5% |
| Elementary School | 32 | 23.9% |
| Middle School | 34 | 25.4% |
| High School | 49 | 36.6% |
| College / Undergraduate | 6 | 4.5% |
| Graduate / Professional | 5 | 3.7% |
| Total | 134 | 100.0% |
School Enrollment by Age by Funding Source in Aniak
Out of a total of 134 students who are enrolled in schools in Aniak, 3 (2.2%) attend a private institution, while the remaining 131 (97.8%) are enrolled in public schools. The age group of 10 to 14 year olds has the highest likelihood of being enrolled in private schools, with 3 (5.6% in the age bracket) enrolled. Conversely, the age group of 3 to 4 year olds has the lowest likelihood of being enrolled in a private school, with 2 (100.0% in the age bracket) attending a public institution.
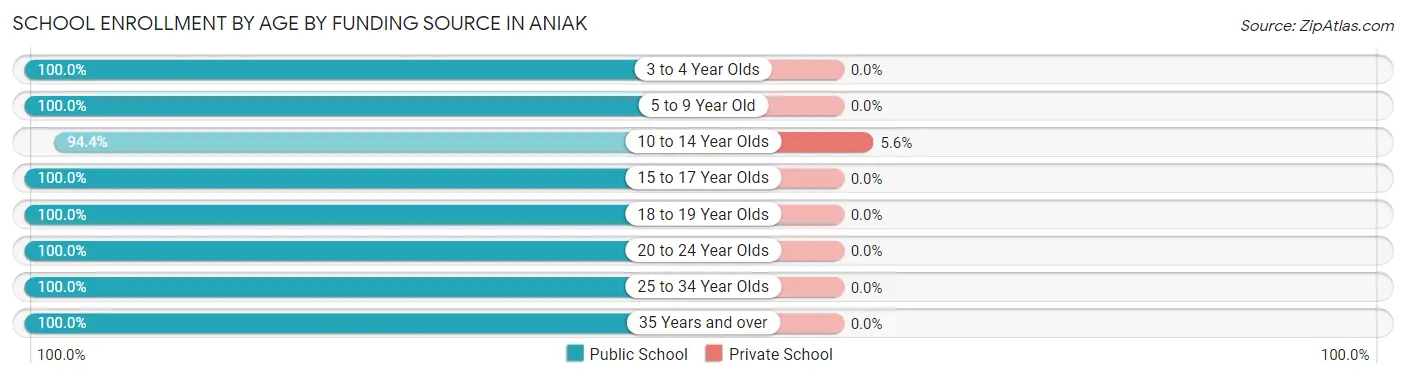
| Age Bracket | Public School | Private School |
| 3 to 4 Year Olds | 2 (100.0%) | 0 (0.0%) |
| 5 to 9 Year Old | 32 (100.0%) | 0 (0.0%) |
| 10 to 14 Year Olds | 51 (94.4%) | 3 (5.6%) |
| 15 to 17 Year Olds | 33 (100.0%) | 0 (0.0%) |
| 18 to 19 Year Olds | 2 (100.0%) | 0 (0.0%) |
| 20 to 24 Year Olds | 6 (100.0%) | 0 (0.0%) |
| 25 to 34 Year Olds | 1 (100.0%) | 0 (0.0%) |
| 35 Years and over | 4 (100.0%) | 0 (0.0%) |
| Total | 131 (97.8%) | 3 (2.2%) |
Educational Attainment by Field of Study in Aniak
Education (11 | 26.8%), bio, nature & agricultural (7 | 17.1%), social sciences (6 | 14.6%), business (4 | 9.8%), and arts & humanities (4 | 9.8%) are the most common fields of study among 41 individuals in Aniak who have obtained a bachelor's degree or higher.
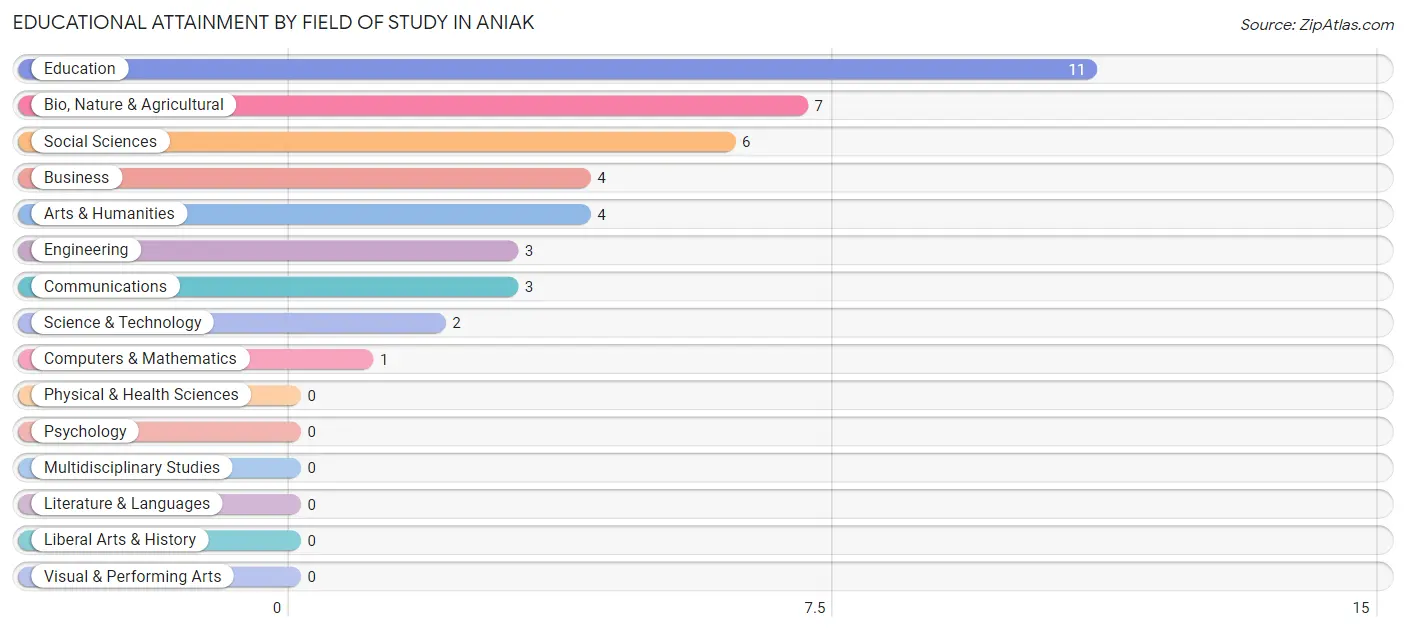
| Field of Study | # Graduates | % Graduates |
| Computers & Mathematics | 1 | 2.4% |
| Bio, Nature & Agricultural | 7 | 17.1% |
| Physical & Health Sciences | 0 | 0.0% |
| Psychology | 0 | 0.0% |
| Social Sciences | 6 | 14.6% |
| Engineering | 3 | 7.3% |
| Multidisciplinary Studies | 0 | 0.0% |
| Science & Technology | 2 | 4.9% |
| Business | 4 | 9.8% |
| Education | 11 | 26.8% |
| Literature & Languages | 0 | 0.0% |
| Liberal Arts & History | 0 | 0.0% |
| Visual & Performing Arts | 0 | 0.0% |
| Communications | 3 | 7.3% |
| Arts & Humanities | 4 | 9.8% |
| Total | 41 | 100.0% |
Transportation & Commute in Aniak
Vehicle Availability by Sex in Aniak
The most prevalent vehicle ownership categories in Aniak are males with 1 vehicle (40, accounting for 46.5%) and females with 1 vehicle (54, making up 41.7%).
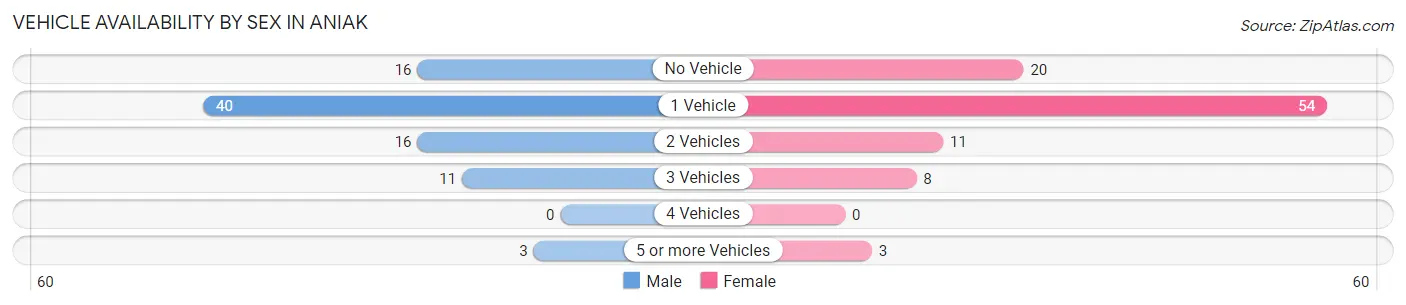
| Vehicles Available | Male | Female |
| No Vehicle | 16 (18.6%) | 20 (20.8%) |
| 1 Vehicle | 40 (46.5%) | 54 (56.2%) |
| 2 Vehicles | 16 (18.6%) | 11 (11.5%) |
| 3 Vehicles | 11 (12.8%) | 8 (8.3%) |
| 4 Vehicles | 0 (0.0%) | 0 (0.0%) |
| 5 or more Vehicles | 3 (3.5%) | 3 (3.1%) |
| Total | 86 (100.0%) | 96 (100.0%) |
Commute Time in Aniak
The most frequently occuring commute durations in Aniak are less than 5 minutes (108 commuters, 40.7%), 5 to 9 minutes (84 commuters, 31.7%), and 10 to 14 minutes (35 commuters, 13.2%).
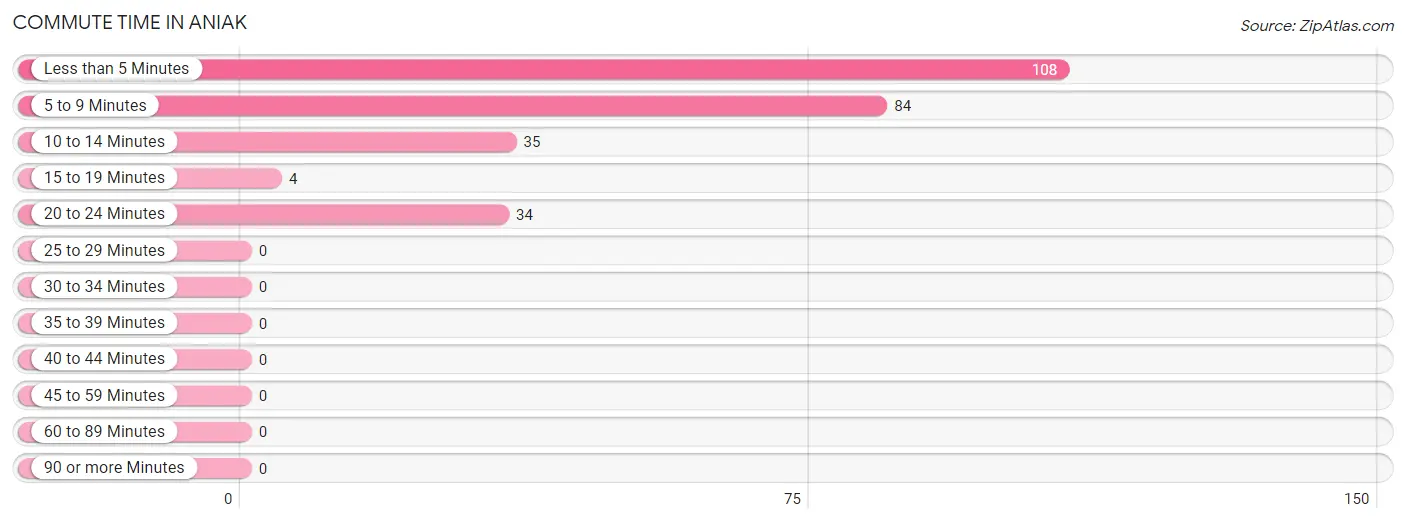
| Commute Time | # Commuters | % Commuters |
| Less than 5 Minutes | 108 | 40.7% |
| 5 to 9 Minutes | 84 | 31.7% |
| 10 to 14 Minutes | 35 | 13.2% |
| 15 to 19 Minutes | 4 | 1.5% |
| 20 to 24 Minutes | 34 | 12.8% |
| 25 to 29 Minutes | 0 | 0.0% |
| 30 to 34 Minutes | 0 | 0.0% |
| 35 to 39 Minutes | 0 | 0.0% |
| 40 to 44 Minutes | 0 | 0.0% |
| 45 to 59 Minutes | 0 | 0.0% |
| 60 to 89 Minutes | 0 | 0.0% |
| 90 or more Minutes | 0 | 0.0% |
Commute Time by Sex in Aniak
The most common commute times in Aniak are less than 5 minutes (69 commuters, 43.1%) for males and less than 5 minutes (39 commuters, 37.1%) for females.
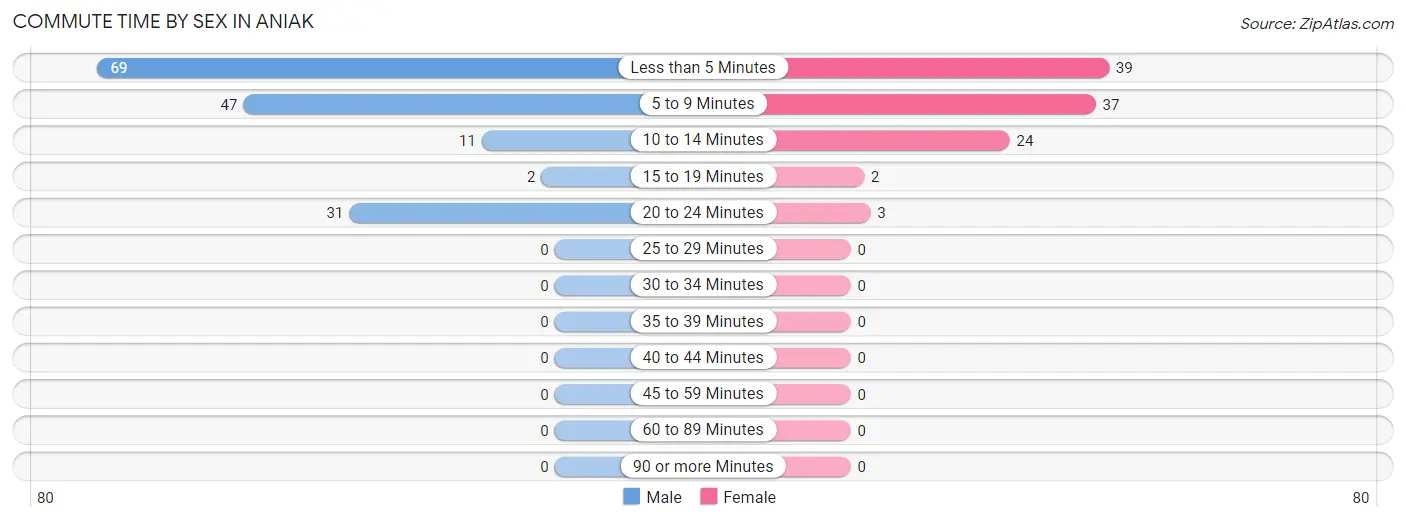
| Commute Time | Male | Female |
| Less than 5 Minutes | 69 (43.1%) | 39 (37.1%) |
| 5 to 9 Minutes | 47 (29.4%) | 37 (35.2%) |
| 10 to 14 Minutes | 11 (6.9%) | 24 (22.9%) |
| 15 to 19 Minutes | 2 (1.3%) | 2 (1.9%) |
| 20 to 24 Minutes | 31 (19.4%) | 3 (2.9%) |
| 25 to 29 Minutes | 0 (0.0%) | 0 (0.0%) |
| 30 to 34 Minutes | 0 (0.0%) | 0 (0.0%) |
| 35 to 39 Minutes | 0 (0.0%) | 0 (0.0%) |
| 40 to 44 Minutes | 0 (0.0%) | 0 (0.0%) |
| 45 to 59 Minutes | 0 (0.0%) | 0 (0.0%) |
| 60 to 89 Minutes | 0 (0.0%) | 0 (0.0%) |
| 90 or more Minutes | 0 (0.0%) | 0 (0.0%) |
Time of Departure to Work by Sex in Aniak
The most frequent times of departure to work in Aniak are 6:00 AM to 6:29 AM (62, 38.8%) for males and 8:30 AM to 8:59 AM (27, 25.7%) for females.
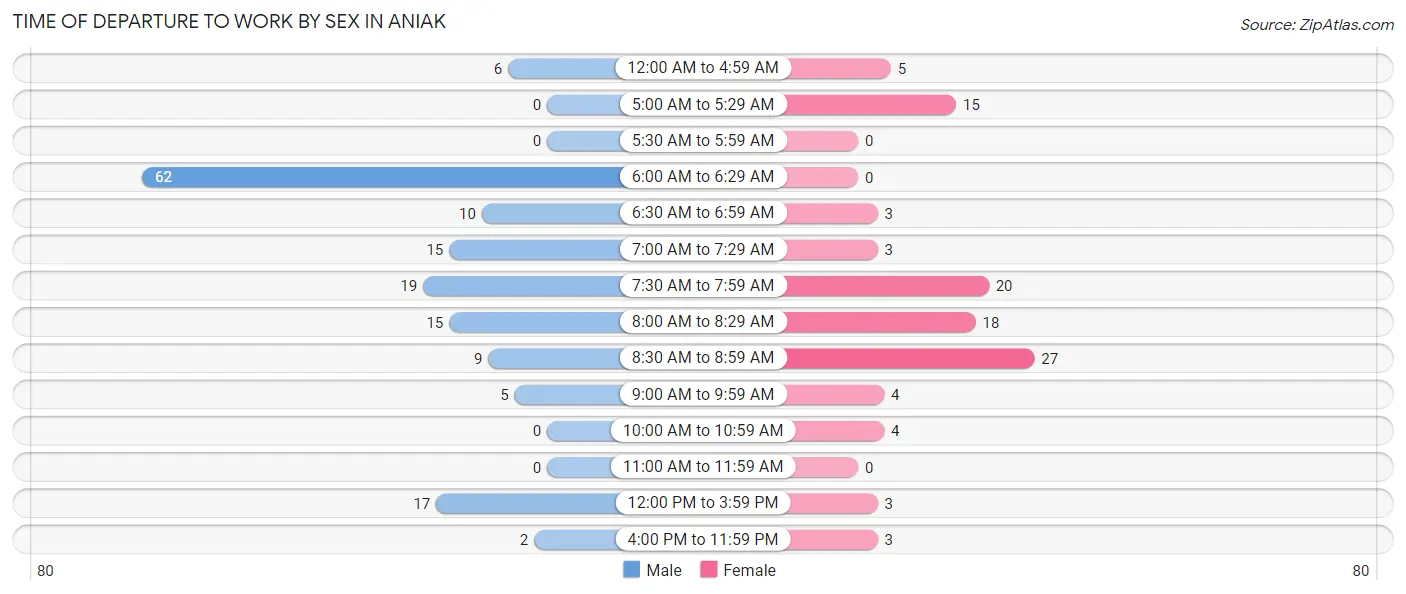
| Time of Departure | Male | Female |
| 12:00 AM to 4:59 AM | 6 (3.7%) | 5 (4.8%) |
| 5:00 AM to 5:29 AM | 0 (0.0%) | 15 (14.3%) |
| 5:30 AM to 5:59 AM | 0 (0.0%) | 0 (0.0%) |
| 6:00 AM to 6:29 AM | 62 (38.8%) | 0 (0.0%) |
| 6:30 AM to 6:59 AM | 10 (6.2%) | 3 (2.9%) |
| 7:00 AM to 7:29 AM | 15 (9.4%) | 3 (2.9%) |
| 7:30 AM to 7:59 AM | 19 (11.9%) | 20 (19.1%) |
| 8:00 AM to 8:29 AM | 15 (9.4%) | 18 (17.1%) |
| 8:30 AM to 8:59 AM | 9 (5.6%) | 27 (25.7%) |
| 9:00 AM to 9:59 AM | 5 (3.1%) | 4 (3.8%) |
| 10:00 AM to 10:59 AM | 0 (0.0%) | 4 (3.8%) |
| 11:00 AM to 11:59 AM | 0 (0.0%) | 0 (0.0%) |
| 12:00 PM to 3:59 PM | 17 (10.6%) | 3 (2.9%) |
| 4:00 PM to 11:59 PM | 2 (1.3%) | 3 (2.9%) |
| Total | 160 (100.0%) | 105 (100.0%) |
Housing Occupancy in Aniak
Occupancy by Ownership in Aniak
Of the total 152 dwellings in Aniak, owner-occupied units account for 95 (62.5%), while renter-occupied units make up 57 (37.5%).
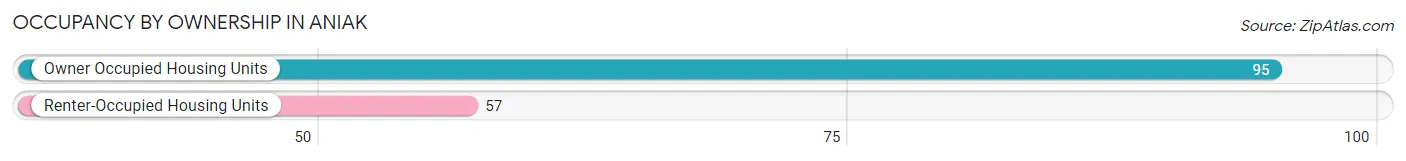
| Occupancy | # Housing Units | % Housing Units |
| Owner Occupied Housing Units | 95 | 62.5% |
| Renter-Occupied Housing Units | 57 | 37.5% |
| Total Occupied Housing Units | 152 | 100.0% |
Occupancy by Household Size in Aniak
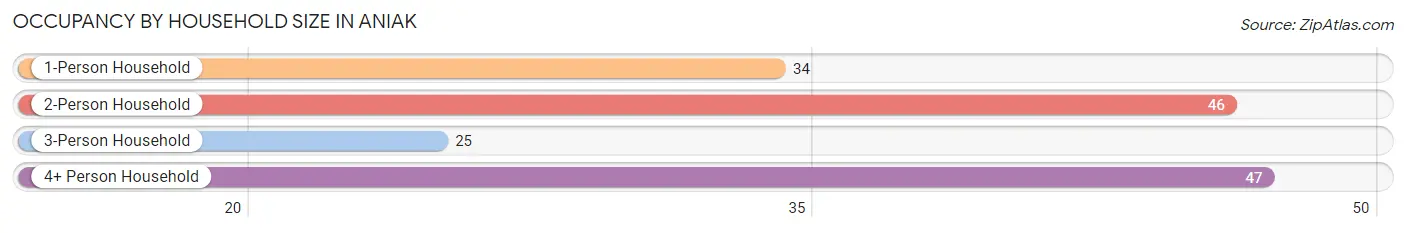
| Household Size | # Housing Units | % Housing Units |
| 1-Person Household | 34 | 22.4% |
| 2-Person Household | 46 | 30.3% |
| 3-Person Household | 25 | 16.5% |
| 4+ Person Household | 47 | 30.9% |
| Total Housing Units | 152 | 100.0% |
Occupancy by Ownership by Household Size in Aniak
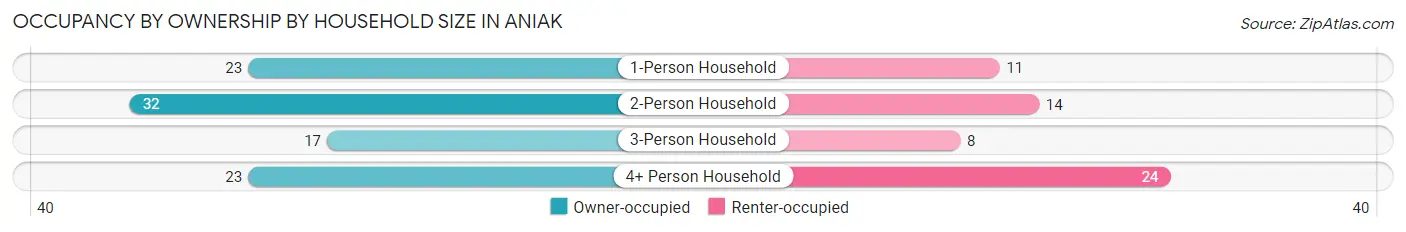
| Household Size | Owner-occupied | Renter-occupied |
| 1-Person Household | 23 (67.6%) | 11 (32.4%) |
| 2-Person Household | 32 (69.6%) | 14 (30.4%) |
| 3-Person Household | 17 (68.0%) | 8 (32.0%) |
| 4+ Person Household | 23 (48.9%) | 24 (51.1%) |
| Total Housing Units | 95 (62.5%) | 57 (37.5%) |
Occupancy by Educational Attainment in Aniak
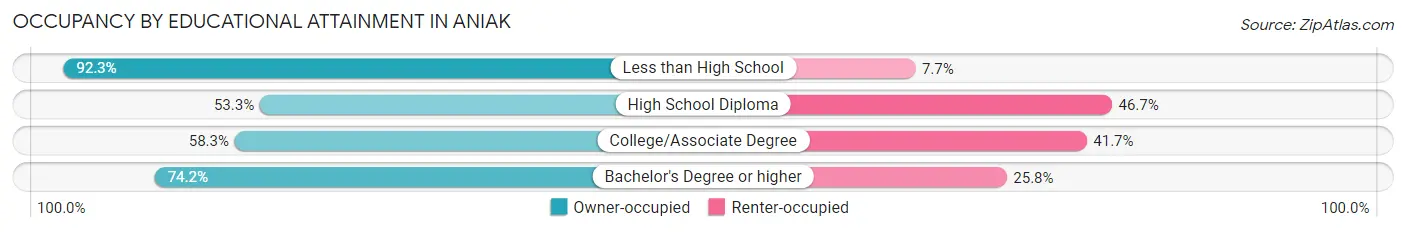
| Household Size | Owner-occupied | Renter-occupied |
| Less than High School | 12 (92.3%) | 1 (7.7%) |
| High School Diploma | 32 (53.3%) | 28 (46.7%) |
| College/Associate Degree | 28 (58.3%) | 20 (41.7%) |
| Bachelor's Degree or higher | 23 (74.2%) | 8 (25.8%) |
Occupancy by Age of Householder in Aniak
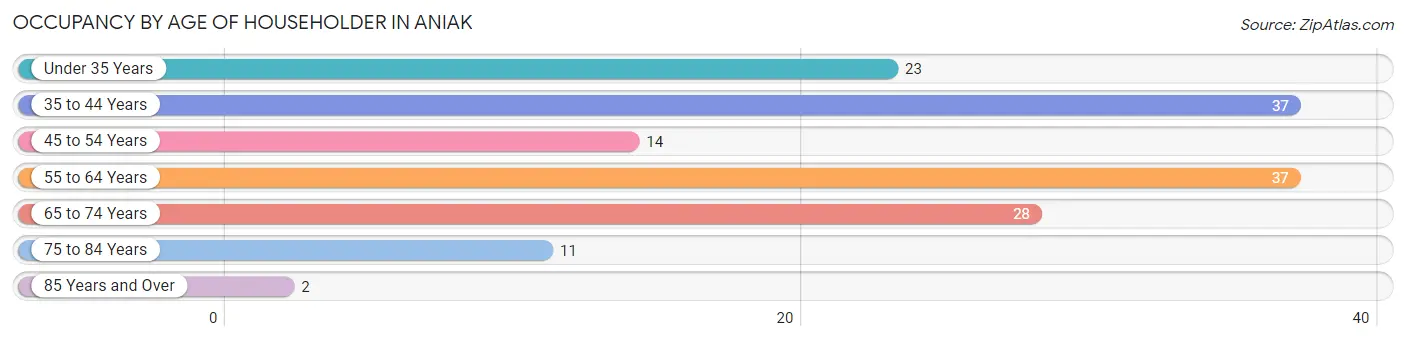
| Age Bracket | # Households | % Households |
| Under 35 Years | 23 | 15.1% |
| 35 to 44 Years | 37 | 24.3% |
| 45 to 54 Years | 14 | 9.2% |
| 55 to 64 Years | 37 | 24.3% |
| 65 to 74 Years | 28 | 18.4% |
| 75 to 84 Years | 11 | 7.2% |
| 85 Years and Over | 2 | 1.3% |
| Total | 152 | 100.0% |
Housing Finances in Aniak
Median Income by Occupancy in Aniak
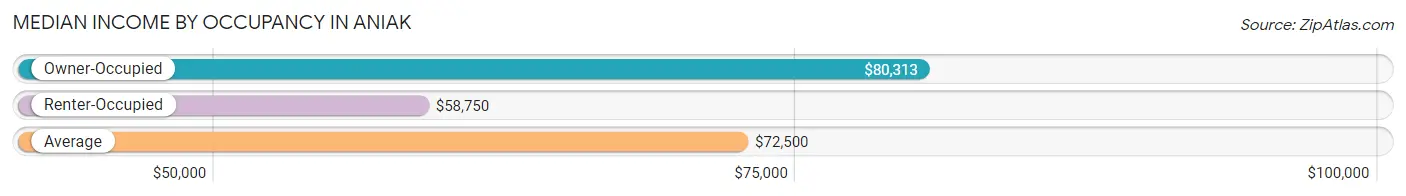
| Occupancy Type | # Households | Median Income |
| Owner-Occupied | 95 (62.5%) | $80,313 |
| Renter-Occupied | 57 (37.5%) | $58,750 |
| Average | 152 (100.0%) | $72,500 |
Occupancy by Householder Income Bracket in Aniak
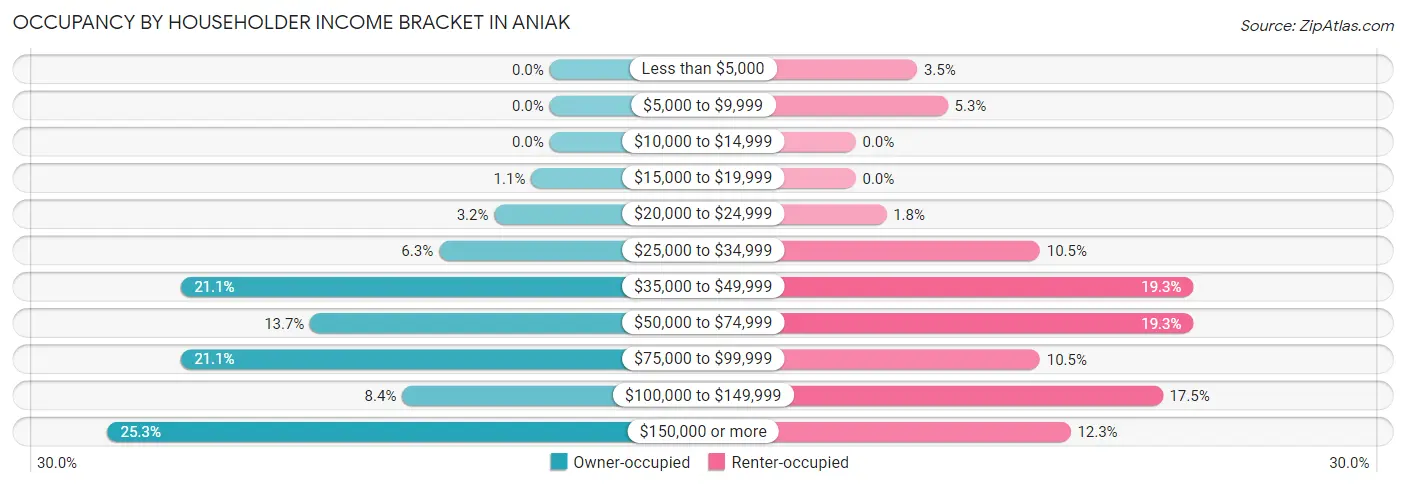
| Income Bracket | Owner-occupied | Renter-occupied |
| Less than $5,000 | 0 (0.0%) | 2 (3.5%) |
| $5,000 to $9,999 | 0 (0.0%) | 3 (5.3%) |
| $10,000 to $14,999 | 0 (0.0%) | 0 (0.0%) |
| $15,000 to $19,999 | 1 (1.1%) | 0 (0.0%) |
| $20,000 to $24,999 | 3 (3.2%) | 1 (1.8%) |
| $25,000 to $34,999 | 6 (6.3%) | 6 (10.5%) |
| $35,000 to $49,999 | 20 (21.0%) | 11 (19.3%) |
| $50,000 to $74,999 | 13 (13.7%) | 11 (19.3%) |
| $75,000 to $99,999 | 20 (21.0%) | 6 (10.5%) |
| $100,000 to $149,999 | 8 (8.4%) | 10 (17.5%) |
| $150,000 or more | 24 (25.3%) | 7 (12.3%) |
| Total | 95 (100.0%) | 57 (100.0%) |
Monthly Housing Cost Tiers in Aniak
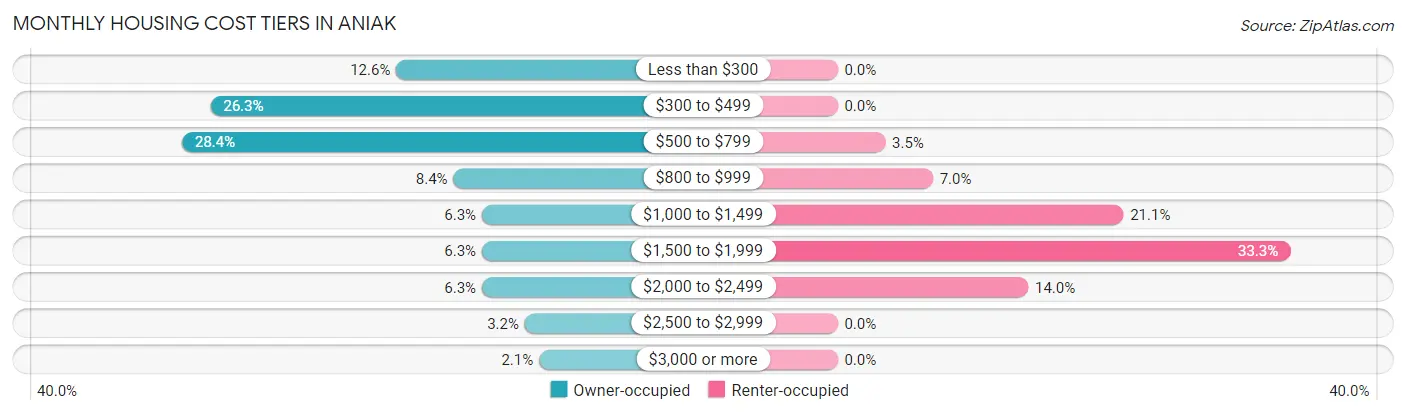
| Monthly Cost | Owner-occupied | Renter-occupied |
| Less than $300 | 12 (12.6%) | 0 (0.0%) |
| $300 to $499 | 25 (26.3%) | 0 (0.0%) |
| $500 to $799 | 27 (28.4%) | 2 (3.5%) |
| $800 to $999 | 8 (8.4%) | 4 (7.0%) |
| $1,000 to $1,499 | 6 (6.3%) | 12 (21.0%) |
| $1,500 to $1,999 | 6 (6.3%) | 19 (33.3%) |
| $2,000 to $2,499 | 6 (6.3%) | 8 (14.0%) |
| $2,500 to $2,999 | 3 (3.2%) | 0 (0.0%) |
| $3,000 or more | 2 (2.1%) | 0 (0.0%) |
| Total | 95 (100.0%) | 57 (100.0%) |
Physical Housing Characteristics in Aniak
Housing Structures in Aniak
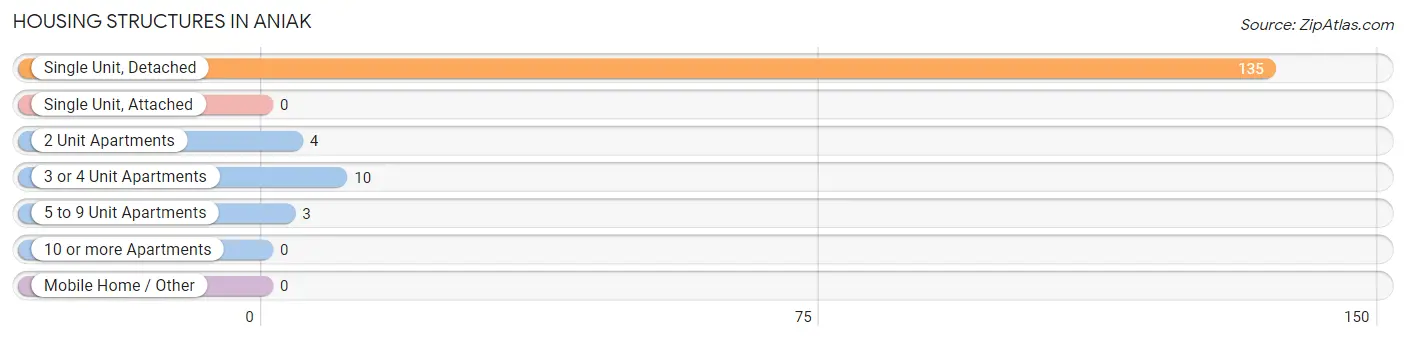
| Structure Type | # Housing Units | % Housing Units |
| Single Unit, Detached | 135 | 88.8% |
| Single Unit, Attached | 0 | 0.0% |
| 2 Unit Apartments | 4 | 2.6% |
| 3 or 4 Unit Apartments | 10 | 6.6% |
| 5 to 9 Unit Apartments | 3 | 2.0% |
| 10 or more Apartments | 0 | 0.0% |
| Mobile Home / Other | 0 | 0.0% |
| Total | 152 | 100.0% |
Housing Structures by Occupancy in Aniak
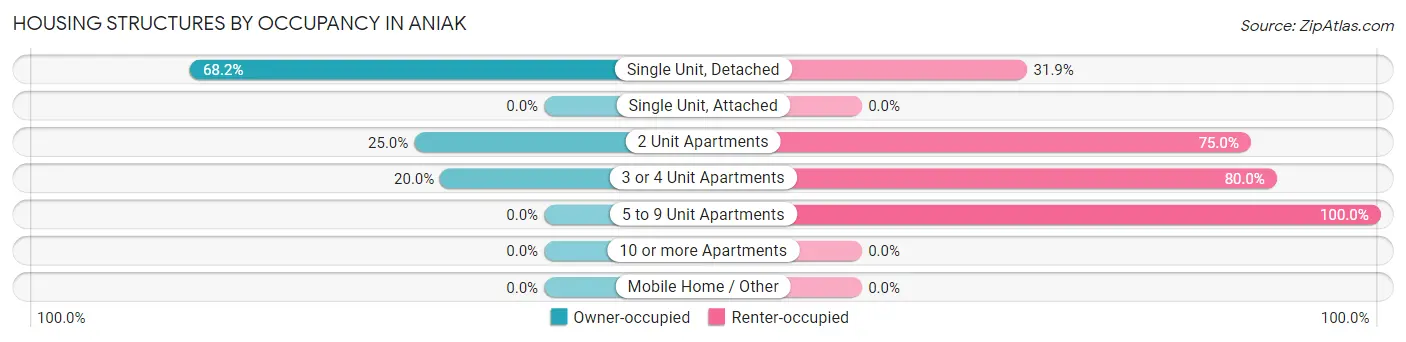
| Structure Type | Owner-occupied | Renter-occupied |
| Single Unit, Detached | 92 (68.1%) | 43 (31.9%) |
| Single Unit, Attached | 0 (0.0%) | 0 (0.0%) |
| 2 Unit Apartments | 1 (25.0%) | 3 (75.0%) |
| 3 or 4 Unit Apartments | 2 (20.0%) | 8 (80.0%) |
| 5 to 9 Unit Apartments | 0 (0.0%) | 3 (100.0%) |
| 10 or more Apartments | 0 (0.0%) | 0 (0.0%) |
| Mobile Home / Other | 0 (0.0%) | 0 (0.0%) |
| Total | 95 (62.5%) | 57 (37.5%) |
Housing Structures by Number of Rooms in Aniak
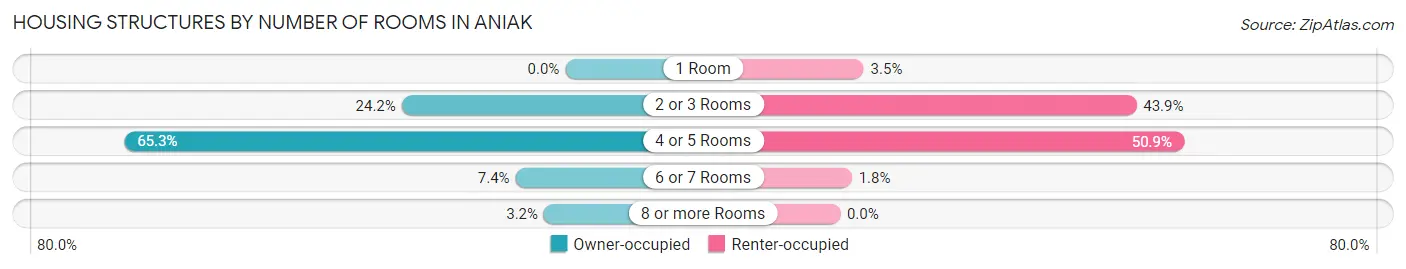
| Number of Rooms | Owner-occupied | Renter-occupied |
| 1 Room | 0 (0.0%) | 2 (3.5%) |
| 2 or 3 Rooms | 23 (24.2%) | 25 (43.9%) |
| 4 or 5 Rooms | 62 (65.3%) | 29 (50.9%) |
| 6 or 7 Rooms | 7 (7.4%) | 1 (1.8%) |
| 8 or more Rooms | 3 (3.2%) | 0 (0.0%) |
| Total | 95 (100.0%) | 57 (100.0%) |
Housing Structure by Heating Type in Aniak
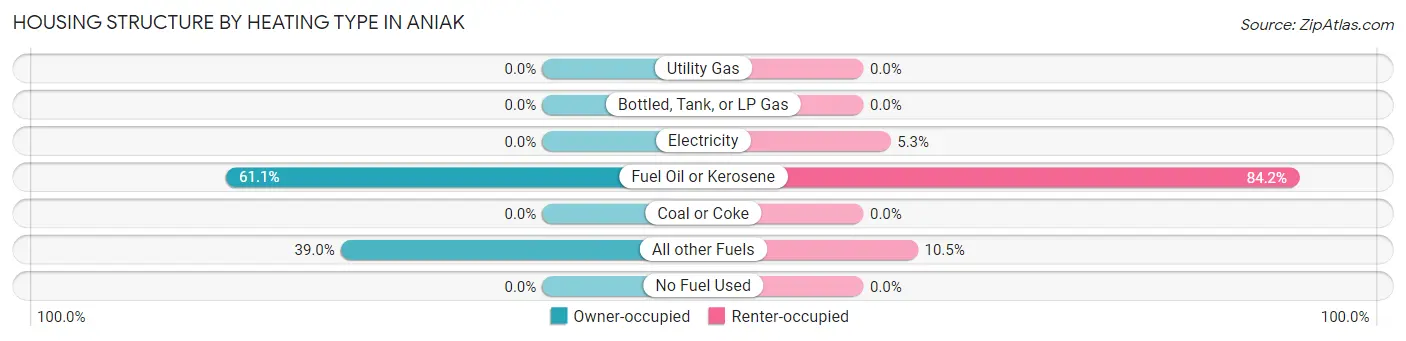
| Heating Type | Owner-occupied | Renter-occupied |
| Utility Gas | 0 (0.0%) | 0 (0.0%) |
| Bottled, Tank, or LP Gas | 0 (0.0%) | 0 (0.0%) |
| Electricity | 0 (0.0%) | 3 (5.3%) |
| Fuel Oil or Kerosene | 58 (61.1%) | 48 (84.2%) |
| Coal or Coke | 0 (0.0%) | 0 (0.0%) |
| All other Fuels | 37 (39.0%) | 6 (10.5%) |
| No Fuel Used | 0 (0.0%) | 0 (0.0%) |
| Total | 95 (100.0%) | 57 (100.0%) |
Household Vehicle Usage in Aniak
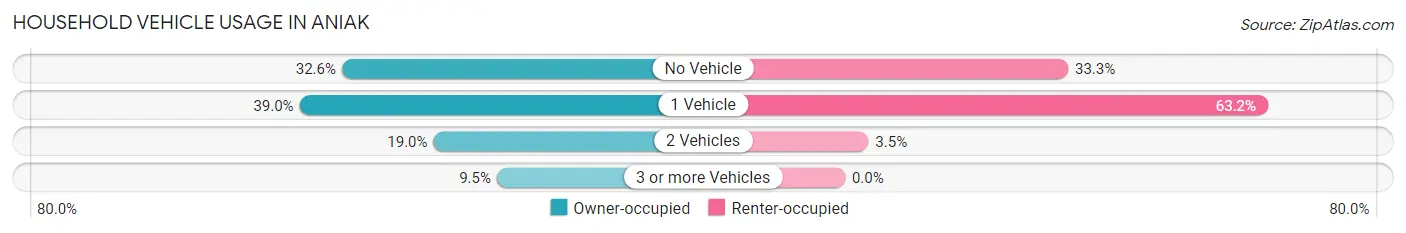
| Vehicles per Household | Owner-occupied | Renter-occupied |
| No Vehicle | 31 (32.6%) | 19 (33.3%) |
| 1 Vehicle | 37 (39.0%) | 36 (63.2%) |
| 2 Vehicles | 18 (19.0%) | 2 (3.5%) |
| 3 or more Vehicles | 9 (9.5%) | 0 (0.0%) |
| Total | 95 (100.0%) | 57 (100.0%) |
Real Estate & Mortgages in Aniak
Real Estate and Mortgage Overview in Aniak
| Characteristic | Without Mortgage | With Mortgage |
| Housing Units | 69 | 26 |
| Median Property Value | $221,200 | $300,000 |
| Median Household Income | $79,063 | $9 |
| Monthly Housing Costs | $481 | $2 |
| Real Estate Taxes | - | - |
Property Value by Mortgage Status in Aniak
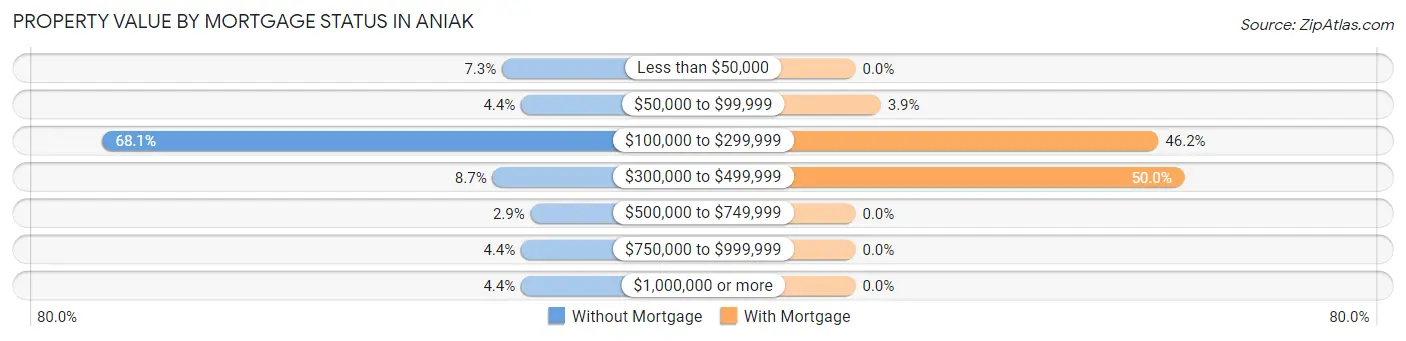
| Property Value | Without Mortgage | With Mortgage |
| Less than $50,000 | 5 (7.2%) | 0 (0.0%) |
| $50,000 to $99,999 | 3 (4.3%) | 1 (3.8%) |
| $100,000 to $299,999 | 47 (68.1%) | 12 (46.2%) |
| $300,000 to $499,999 | 6 (8.7%) | 13 (50.0%) |
| $500,000 to $749,999 | 2 (2.9%) | 0 (0.0%) |
| $750,000 to $999,999 | 3 (4.3%) | 0 (0.0%) |
| $1,000,000 or more | 3 (4.3%) | 0 (0.0%) |
| Total | 69 (100.0%) | 26 (100.0%) |
Household Income by Mortgage Status in Aniak
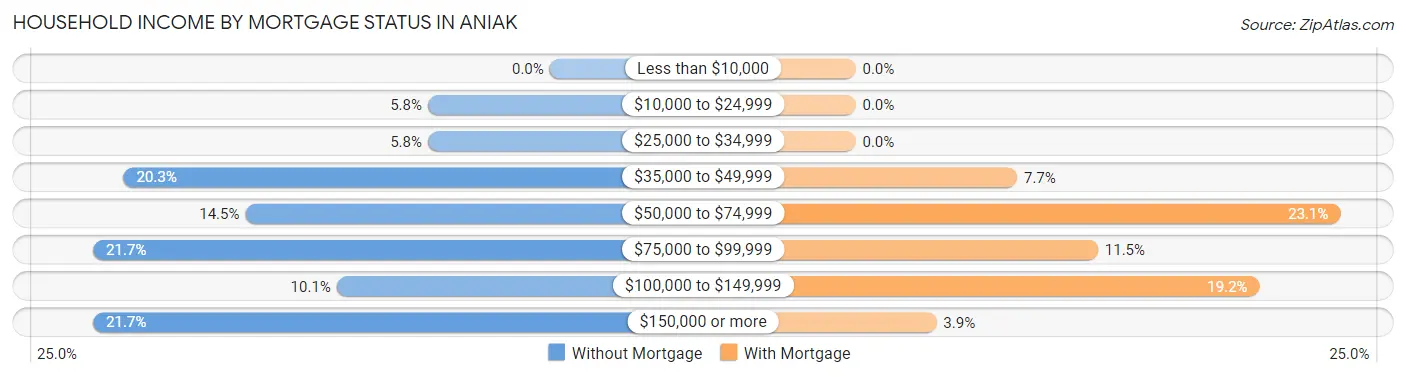
| Household Income | Without Mortgage | With Mortgage |
| Less than $10,000 | 0 (0.0%) | 0 (0.0%) |
| $10,000 to $24,999 | 4 (5.8%) | 0 (0.0%) |
| $25,000 to $34,999 | 4 (5.8%) | 0 (0.0%) |
| $35,000 to $49,999 | 14 (20.3%) | 2 (7.7%) |
| $50,000 to $74,999 | 10 (14.5%) | 6 (23.1%) |
| $75,000 to $99,999 | 15 (21.7%) | 3 (11.5%) |
| $100,000 to $149,999 | 7 (10.1%) | 5 (19.2%) |
| $150,000 or more | 15 (21.7%) | 1 (3.8%) |
| Total | 69 (100.0%) | 26 (100.0%) |
Property Value to Household Income Ratio in Aniak
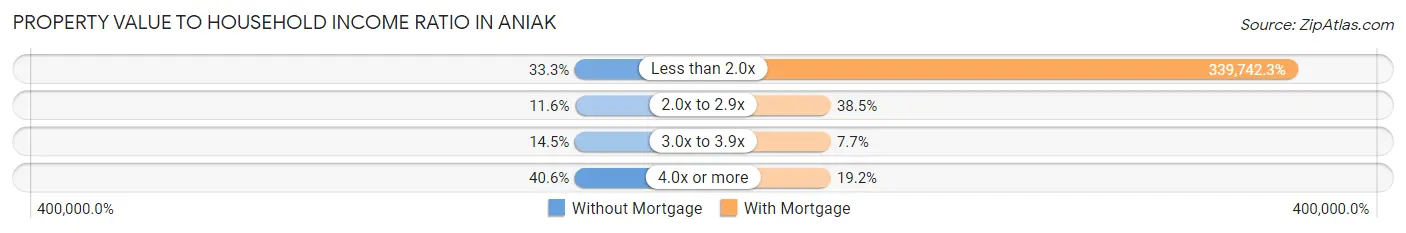
| Value-to-Income Ratio | Without Mortgage | With Mortgage |
| Less than 2.0x | 23 (33.3%) | 88,333 (339,742.3%) |
| 2.0x to 2.9x | 8 (11.6%) | 10 (38.5%) |
| 3.0x to 3.9x | 10 (14.5%) | 2 (7.7%) |
| 4.0x or more | 28 (40.6%) | 5 (19.2%) |
| Total | 69 (100.0%) | 26 (100.0%) |
Real Estate Taxes by Mortgage Status in Aniak
| Property Taxes | Without Mortgage | With Mortgage |
| Less than $800 | 0 (0.0%) | 0 (0.0%) |
| $800 to $1,499 | 0 (0.0%) | 0 (0.0%) |
| $800 to $1,499 | 0 (0.0%) | 0 (0.0%) |
| Total | 69 (100.0%) | 26 (100.0%) |
Health & Disability in Aniak
Health Insurance Coverage by Age in Aniak
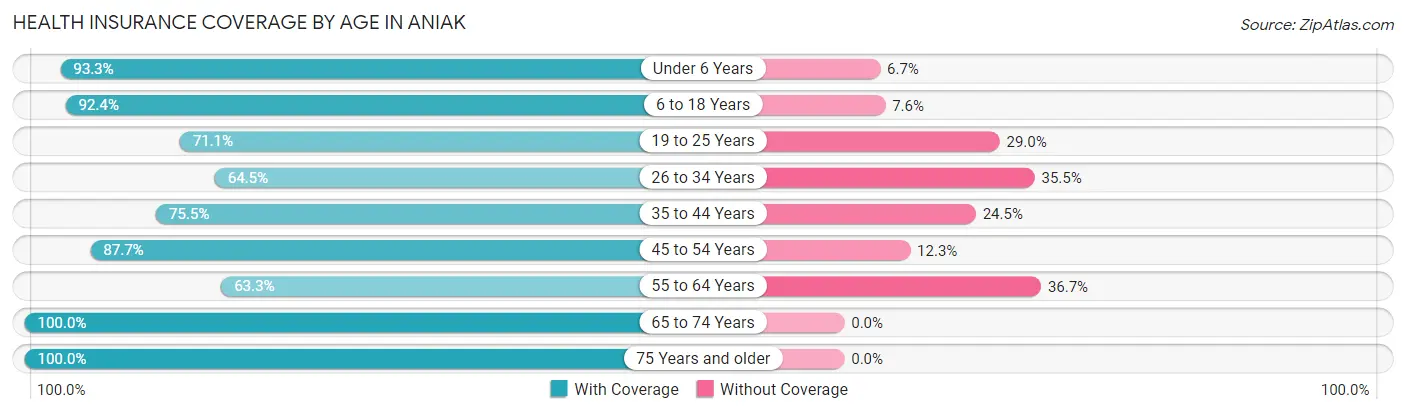
| Age Bracket | With Coverage | Without Coverage |
| Under 6 Years | 28 (93.3%) | 2 (6.7%) |
| 6 to 18 Years | 109 (92.4%) | 9 (7.6%) |
| 19 to 25 Years | 27 (71.1%) | 11 (28.9%) |
| 26 to 34 Years | 40 (64.5%) | 22 (35.5%) |
| 35 to 44 Years | 77 (75.5%) | 25 (24.5%) |
| 45 to 54 Years | 50 (87.7%) | 7 (12.3%) |
| 55 to 64 Years | 57 (63.3%) | 33 (36.7%) |
| 65 to 74 Years | 37 (100.0%) | 0 (0.0%) |
| 75 Years and older | 17 (100.0%) | 0 (0.0%) |
| Total | 442 (80.2%) | 109 (19.8%) |
Health Insurance Coverage by Citizenship Status in Aniak
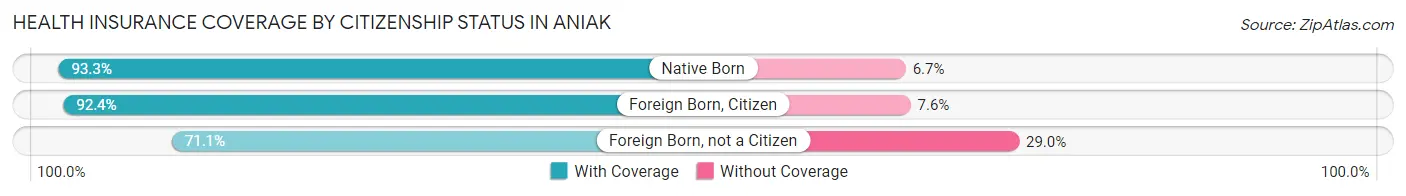
| Citizenship Status | With Coverage | Without Coverage |
| Native Born | 28 (93.3%) | 2 (6.7%) |
| Foreign Born, Citizen | 109 (92.4%) | 9 (7.6%) |
| Foreign Born, not a Citizen | 27 (71.1%) | 11 (28.9%) |
Health Insurance Coverage by Household Income in Aniak
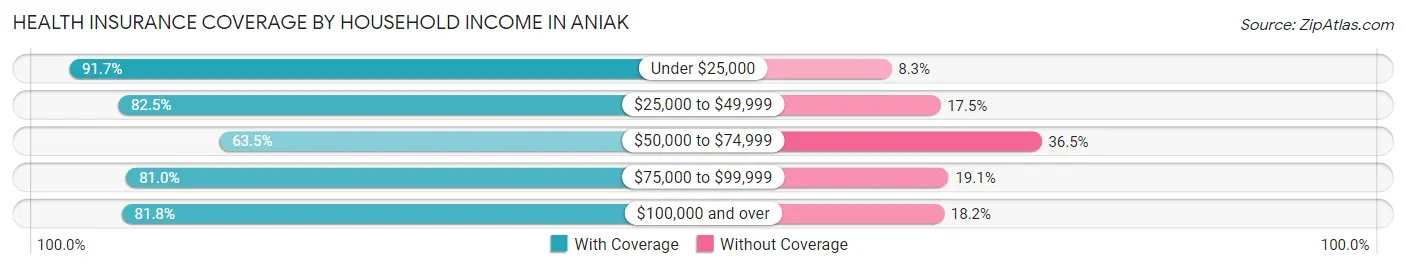
| Household Income | With Coverage | Without Coverage |
| Under $25,000 | 22 (91.7%) | 2 (8.3%) |
| $25,000 to $49,999 | 99 (82.5%) | 21 (17.5%) |
| $50,000 to $74,999 | 54 (63.5%) | 31 (36.5%) |
| $75,000 to $99,999 | 51 (80.9%) | 12 (19.1%) |
| $100,000 and over | 126 (81.8%) | 28 (18.2%) |
Public vs Private Health Insurance Coverage by Age in Aniak
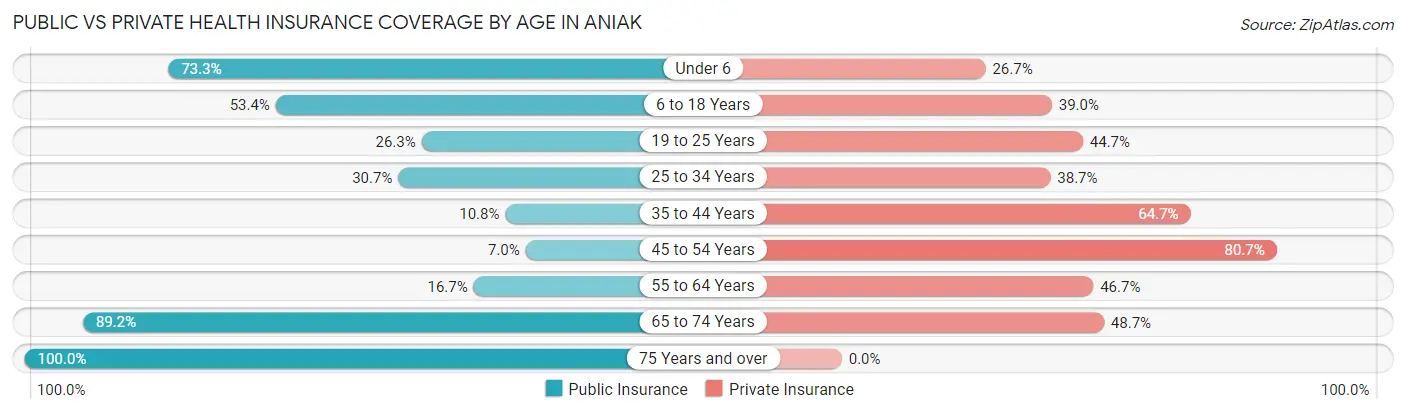
| Age Bracket | Public Insurance | Private Insurance |
| Under 6 | 22 (73.3%) | 8 (26.7%) |
| 6 to 18 Years | 63 (53.4%) | 46 (39.0%) |
| 19 to 25 Years | 10 (26.3%) | 17 (44.7%) |
| 25 to 34 Years | 19 (30.6%) | 24 (38.7%) |
| 35 to 44 Years | 11 (10.8%) | 66 (64.7%) |
| 45 to 54 Years | 4 (7.0%) | 46 (80.7%) |
| 55 to 64 Years | 15 (16.7%) | 42 (46.7%) |
| 65 to 74 Years | 33 (89.2%) | 18 (48.6%) |
| 75 Years and over | 17 (100.0%) | 0 (0.0%) |
| Total | 194 (35.2%) | 267 (48.5%) |
Disability Status by Sex by Age in Aniak
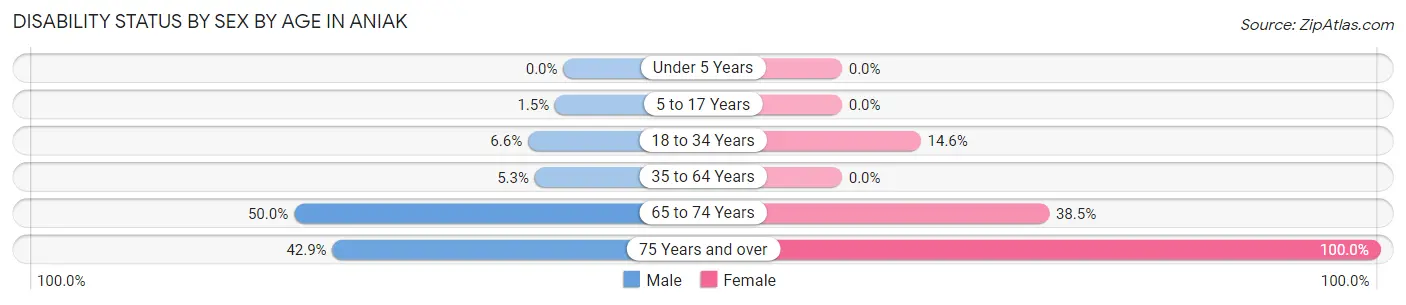
| Age Bracket | Male | Female |
| Under 5 Years | 0 (0.0%) | 0 (0.0%) |
| 5 to 17 Years | 1 (1.5%) | 0 (0.0%) |
| 18 to 34 Years | 4 (6.6%) | 6 (14.6%) |
| 35 to 64 Years | 8 (5.3%) | 0 (0.0%) |
| 65 to 74 Years | 12 (50.0%) | 5 (38.5%) |
| 75 Years and over | 3 (42.9%) | 10 (100.0%) |
Disability Class by Sex by Age in Aniak
Disability Class: Hearing Difficulty
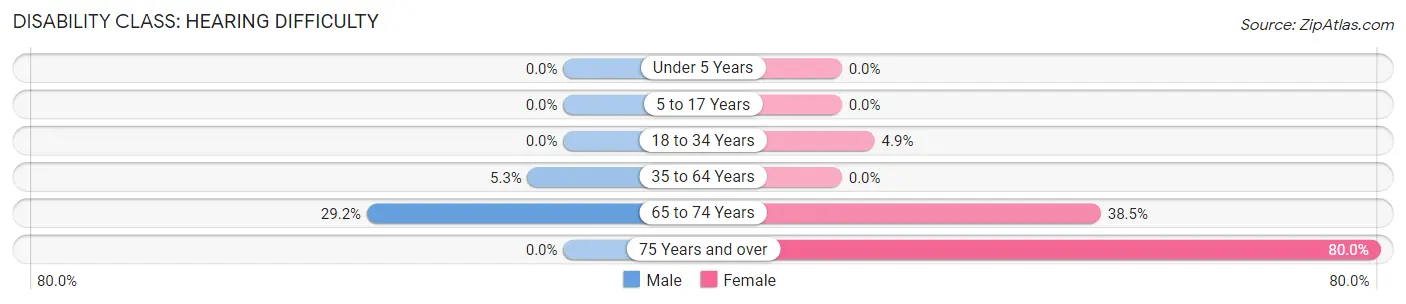
| Age Bracket | Male | Female |
| Under 5 Years | 0 (0.0%) | 0 (0.0%) |
| 5 to 17 Years | 0 (0.0%) | 0 (0.0%) |
| 18 to 34 Years | 0 (0.0%) | 2 (4.9%) |
| 35 to 64 Years | 8 (5.3%) | 0 (0.0%) |
| 65 to 74 Years | 7 (29.2%) | 5 (38.5%) |
| 75 Years and over | 0 (0.0%) | 8 (80.0%) |
Disability Class: Vision Difficulty
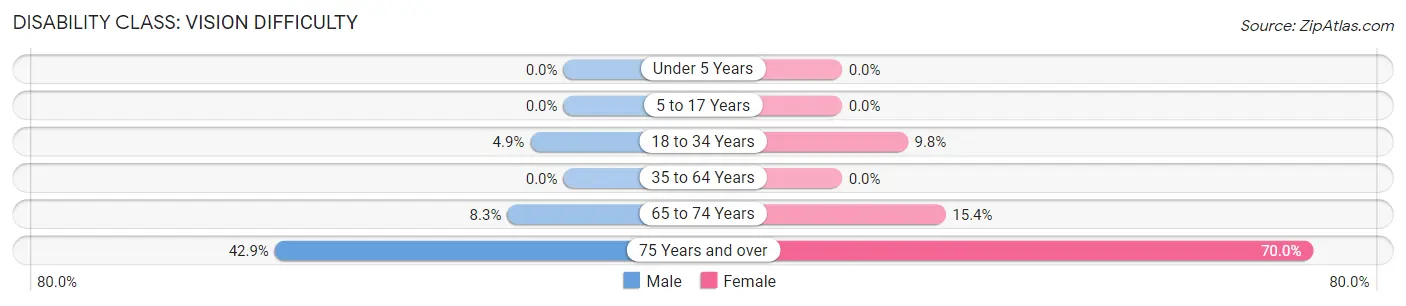
| Age Bracket | Male | Female |
| Under 5 Years | 0 (0.0%) | 0 (0.0%) |
| 5 to 17 Years | 0 (0.0%) | 0 (0.0%) |
| 18 to 34 Years | 3 (4.9%) | 4 (9.8%) |
| 35 to 64 Years | 0 (0.0%) | 0 (0.0%) |
| 65 to 74 Years | 2 (8.3%) | 2 (15.4%) |
| 75 Years and over | 3 (42.9%) | 7 (70.0%) |
Disability Class: Cognitive Difficulty
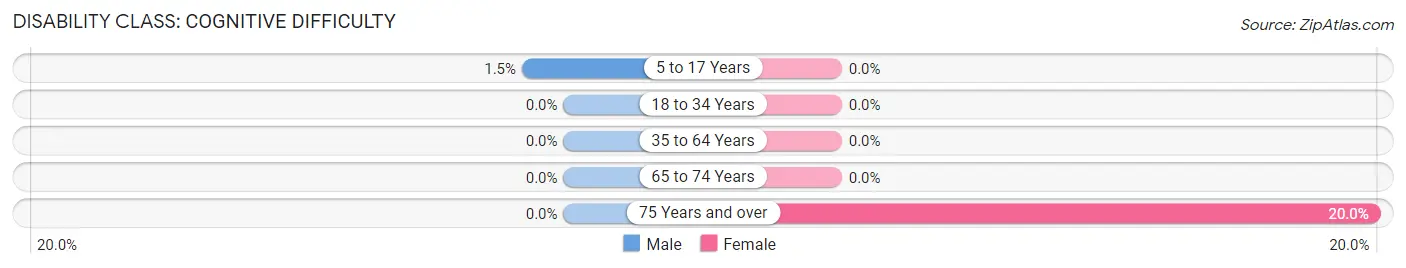
| Age Bracket | Male | Female |
| 5 to 17 Years | 1 (1.5%) | 0 (0.0%) |
| 18 to 34 Years | 0 (0.0%) | 0 (0.0%) |
| 35 to 64 Years | 0 (0.0%) | 0 (0.0%) |
| 65 to 74 Years | 0 (0.0%) | 0 (0.0%) |
| 75 Years and over | 0 (0.0%) | 2 (20.0%) |
Disability Class: Ambulatory Difficulty
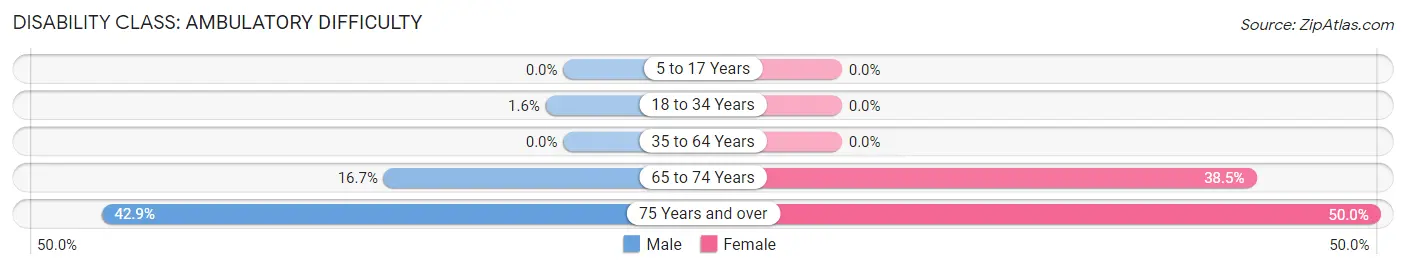
| Age Bracket | Male | Female |
| 5 to 17 Years | 0 (0.0%) | 0 (0.0%) |
| 18 to 34 Years | 1 (1.6%) | 0 (0.0%) |
| 35 to 64 Years | 0 (0.0%) | 0 (0.0%) |
| 65 to 74 Years | 4 (16.7%) | 5 (38.5%) |
| 75 Years and over | 3 (42.9%) | 5 (50.0%) |
Disability Class: Self-Care Difficulty
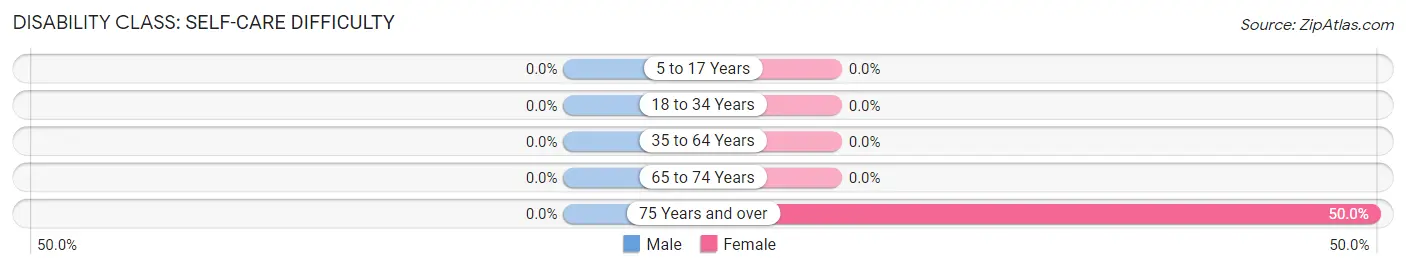
| Age Bracket | Male | Female |
| 5 to 17 Years | 0 (0.0%) | 0 (0.0%) |
| 18 to 34 Years | 0 (0.0%) | 0 (0.0%) |
| 35 to 64 Years | 0 (0.0%) | 0 (0.0%) |
| 65 to 74 Years | 0 (0.0%) | 0 (0.0%) |
| 75 Years and over | 0 (0.0%) | 5 (50.0%) |
Technology Access in Aniak
Computing Device Access in Aniak
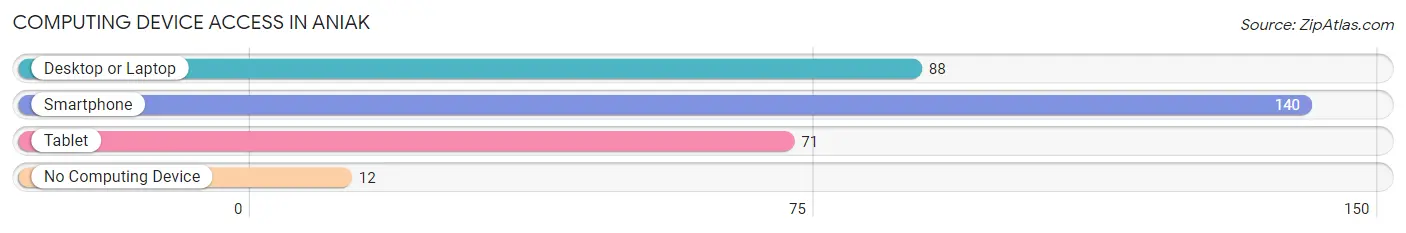
| Device Type | # Households | % Households |
| Desktop or Laptop | 88 | 57.9% |
| Smartphone | 140 | 92.1% |
| Tablet | 71 | 46.7% |
| No Computing Device | 12 | 7.9% |
| Total | 152 | 100.0% |
Internet Access in Aniak
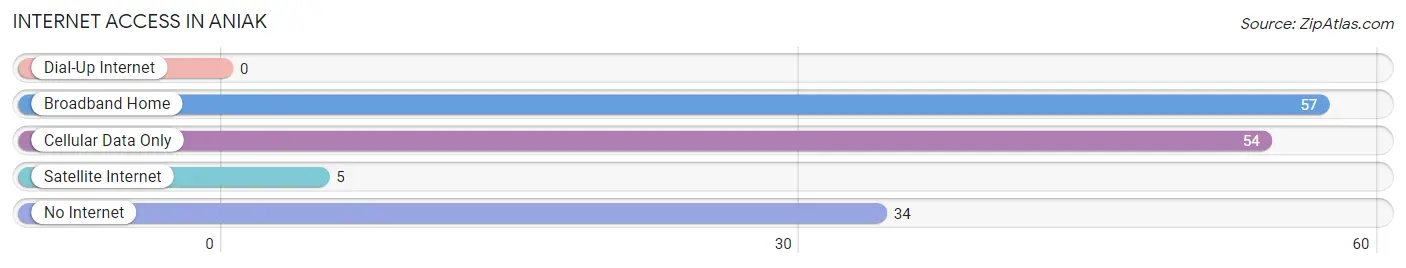
| Internet Type | # Households | % Households |
| Dial-Up Internet | 0 | 0.0% |
| Broadband Home | 57 | 37.5% |
| Cellular Data Only | 54 | 35.5% |
| Satellite Internet | 5 | 3.3% |
| No Internet | 34 | 22.4% |
| Total | 152 | 100.0% |
Aniak Summary
Aniak is a small city located in the southwestern region of Alaska, United States. It is situated on the banks of the Kuskokwim River, approximately 50 miles upstream from the Bering Sea. The city is part of the Bethel Census Area and has a population of approximately 1,000 people.
History
The area around Aniak has been inhabited by the Yup’ik people for thousands of years. The first European settlers arrived in the area in the late 19th century, and the city was officially incorporated in 1945. The city was named after the Yup’ik word for “the place where it comes out”, referring to the Kuskokwim River.
Geography
Aniak is located in the southwestern region of Alaska, approximately 50 miles upstream from the Bering Sea. The city is situated on the banks of the Kuskokwim River, which is the largest river in the state. The city is surrounded by the Kuskokwim Mountains to the east and the Yukon Delta National Wildlife Refuge to the west. The climate in Aniak is subarctic, with cold winters and mild summers.
Economy
The economy of Aniak is largely based on subsistence fishing and hunting. The city is also home to a number of small businesses, including a grocery store, a hardware store, and a restaurant. The city is also home to a number of small manufacturing companies, including a fish processing plant and a woodworking shop.
Demographics
As of the 2010 census, the population of Aniak was 1,023. The racial makeup of the city was 95.3% Native American, 2.2% White, 0.3% Asian, 0.2% Black or African American, and 0.1% from other races. The median household income in Aniak was $37,500, and the median family income was $41,250.
Conclusion
Aniak is a small city located in the southwestern region of Alaska, United States. It is situated on the banks of the Kuskokwim River, approximately 50 miles upstream from the Bering Sea. The city has a population of approximately 1,000 people and is part of the Bethel Census Area. The economy of Aniak is largely based on subsistence fishing and hunting, and the city is also home to a number of small businesses. The racial makeup of the city is 95.3% Native American, 2.2% White, 0.3% Asian, 0.2% Black or African American, and 0.1% from other races. The median household income in Aniak was $37,500, and the median family income was $41,250.
Common Questions
What is Per Capita Income in Aniak?
Per Capita income in Aniak is $57,021.
What is the Median Family Income in Aniak?
Median Family Income in Aniak is $77,083.
What is the Median Household income in Aniak?
Median Household Income in Aniak is $72,500.
What is Income or Wage Gap in Aniak?
Income or Wage Gap in Aniak is 20.4%.
Women in Aniak earn 79.6 cents for every dollar earned by a man.
What is Inequality or Gini Index in Aniak?
Inequality or Gini Index in Aniak is 0.43.
What is the Total Population of Aniak?
Total Population of Aniak is 551.
What is the Total Male Population of Aniak?
Total Male Population of Aniak is 331.
What is the Total Female Population of Aniak?
Total Female Population of Aniak is 220.
What is the Ratio of Males per 100 Females in Aniak?
There are 150.45 Males per 100 Females in Aniak.
What is the Ratio of Females per 100 Males in Aniak?
There are 66.47 Females per 100 Males in Aniak.
What is the Median Population Age in Aniak?
Median Population Age in Aniak is 38.1 Years.
What is the Average Family Size in Aniak
Average Family Size in Aniak is 3.4 People.
What is the Average Household Size in Aniak
Average Household Size in Aniak is 2.9 People.
How Large is the Labor Force in Aniak?
There are 328 People in the Labor Forcein in Aniak.
What is the Percentage of People in the Labor Force in Aniak?
75.1% of People are in the Labor Force in Aniak.
What is the Unemployment Rate in Aniak?
Unemployment Rate in Aniak is 7.3%.