Anchor Point, AK Map & Demographics
Anchor Point Map
Anchor Point Overview
$34,845
PER CAPITA INCOME
$81,161
AVG FAMILY INCOME
$58,357
AVG HOUSEHOLD INCOME
29.1%
WAGE / INCOME GAP [ % ]
70.9¢/ $1
WAGE / INCOME GAP [ $ ]
$10,681
FAMILY INCOME DEFICIT
0.46
INEQUALITY / GINI INDEX
2,260
TOTAL POPULATION
1,224
MALE POPULATION
1,036
FEMALE POPULATION
118.15
MALES / 100 FEMALES
84.64
FEMALES / 100 MALES
51.2
MEDIAN AGE
3.0
AVG FAMILY SIZE
2.3
AVG HOUSEHOLD SIZE
905
LABOR FORCE [ PEOPLE ]
47.3%
PERCENT IN LABOR FORCE
10.5%
UNEMPLOYMENT RATE
Anchor Point Zip Codes
Anchor Point Area Codes
Income in Anchor Point
Income Overview in Anchor Point
Per Capita Income in Anchor Point is $34,845, while median incomes of families and households are $81,161 and $58,357 respectively.
| Characteristic | Number | Measure |
| Per Capita Income | 2,260 | $34,845 |
| Median Family Income | 571 | $81,161 |
| Mean Family Income | 571 | $98,406 |
| Median Household Income | 972 | $58,357 |
| Mean Household Income | 972 | $80,507 |
| Income Deficit | 571 | $10,681 |
| Wage / Income Gap (%) | 2,260 | 29.10% |
| Wage / Income Gap ($) | 2,260 | 70.90¢ per $1 |
| Gini / Inequality Index | 2,260 | 0.46 |
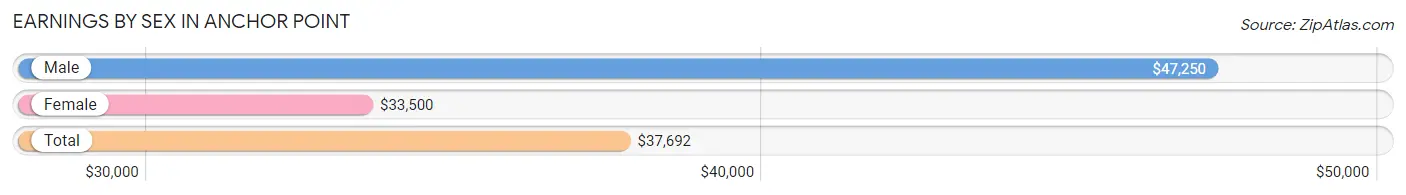
Earnings by Sex in Anchor Point
Average Earnings in Anchor Point are $37,692, $47,250 for men and $33,500 for women, a difference of 29.1%.
| Sex | Number | Average Earnings |
| Male | 552 (56.2%) | $47,250 |
| Female | 430 (43.8%) | $33,500 |
| Total | 982 (100.0%) | $37,692 |
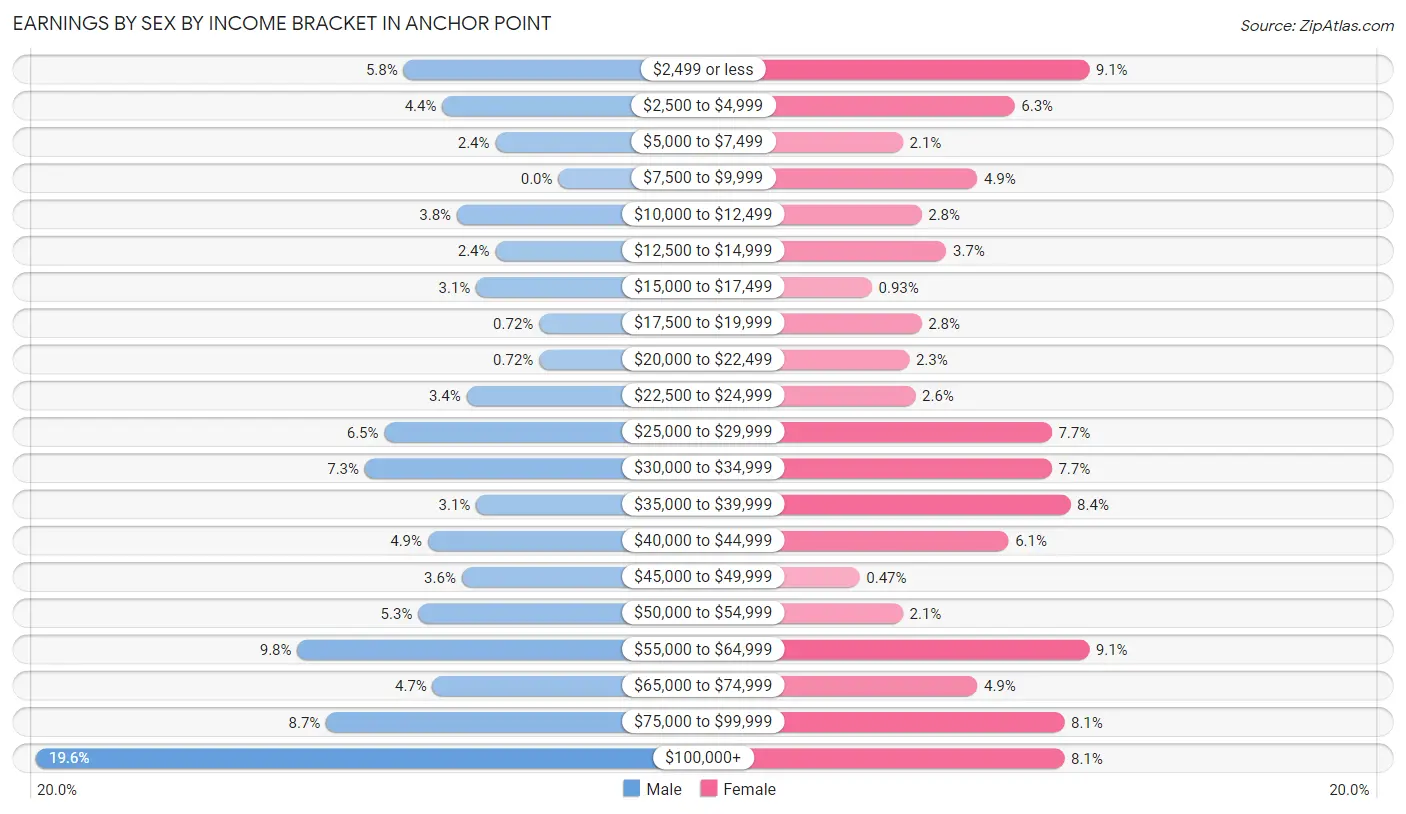
Earnings by Sex by Income Bracket in Anchor Point
The most common earnings brackets in Anchor Point are $100,000+ for men (108 | 19.6%) and $2,499 or less for women (39 | 9.1%).
| Income | Male | Female |
| $2,499 or less | 32 (5.8%) | 39 (9.1%) |
| $2,500 to $4,999 | 24 (4.3%) | 27 (6.3%) |
| $5,000 to $7,499 | 13 (2.4%) | 9 (2.1%) |
| $7,500 to $9,999 | 0 (0.0%) | 21 (4.9%) |
| $10,000 to $12,499 | 21 (3.8%) | 12 (2.8%) |
| $12,500 to $14,999 | 13 (2.4%) | 16 (3.7%) |
| $15,000 to $17,499 | 17 (3.1%) | 4 (0.9%) |
| $17,500 to $19,999 | 4 (0.7%) | 12 (2.8%) |
| $20,000 to $22,499 | 4 (0.7%) | 10 (2.3%) |
| $22,500 to $24,999 | 19 (3.4%) | 11 (2.6%) |
| $25,000 to $29,999 | 36 (6.5%) | 33 (7.7%) |
| $30,000 to $34,999 | 40 (7.2%) | 33 (7.7%) |
| $35,000 to $39,999 | 17 (3.1%) | 36 (8.4%) |
| $40,000 to $44,999 | 27 (4.9%) | 26 (6.0%) |
| $45,000 to $49,999 | 20 (3.6%) | 2 (0.5%) |
| $50,000 to $54,999 | 29 (5.2%) | 9 (2.1%) |
| $55,000 to $64,999 | 54 (9.8%) | 39 (9.1%) |
| $65,000 to $74,999 | 26 (4.7%) | 21 (4.9%) |
| $75,000 to $99,999 | 48 (8.7%) | 35 (8.1%) |
| $100,000+ | 108 (19.6%) | 35 (8.1%) |
| Total | 552 (100.0%) | 430 (100.0%) |
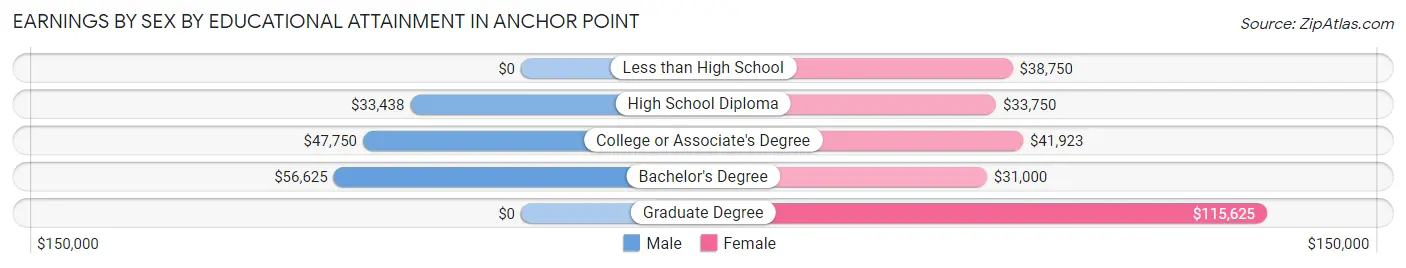
Earnings by Sex by Educational Attainment in Anchor Point
Average earnings in Anchor Point are $50,600 for men and $35,758 for women, a difference of 29.3%. Men with an educational attainment of bachelor's degree enjoy the highest average annual earnings of $56,625, while those with high school diploma education earn the least with $33,438. Women with an educational attainment of graduate degree earn the most with the average annual earnings of $115,625, while those with bachelor's degree education have the smallest earnings of $31,000.
| Educational Attainment | Male Income | Female Income |
| Less than High School | - | - |
| High School Diploma | $33,438 | $33,750 |
| College or Associate's Degree | $47,750 | $41,923 |
| Bachelor's Degree | $56,625 | $31,000 |
| Graduate Degree | - | - |
| Total | $50,600 | $35,758 |
Family Income in Anchor Point
Family Income Brackets in Anchor Point
According to the Anchor Point family income data, there are 120 families falling into the $50,000 to $74,999 income range, which is the most common income bracket and makes up 21.0% of all families. Conversely, the $10,000 to $14,999 income bracket is the least frequent group with only 14 families (2.5%) belonging to this category.
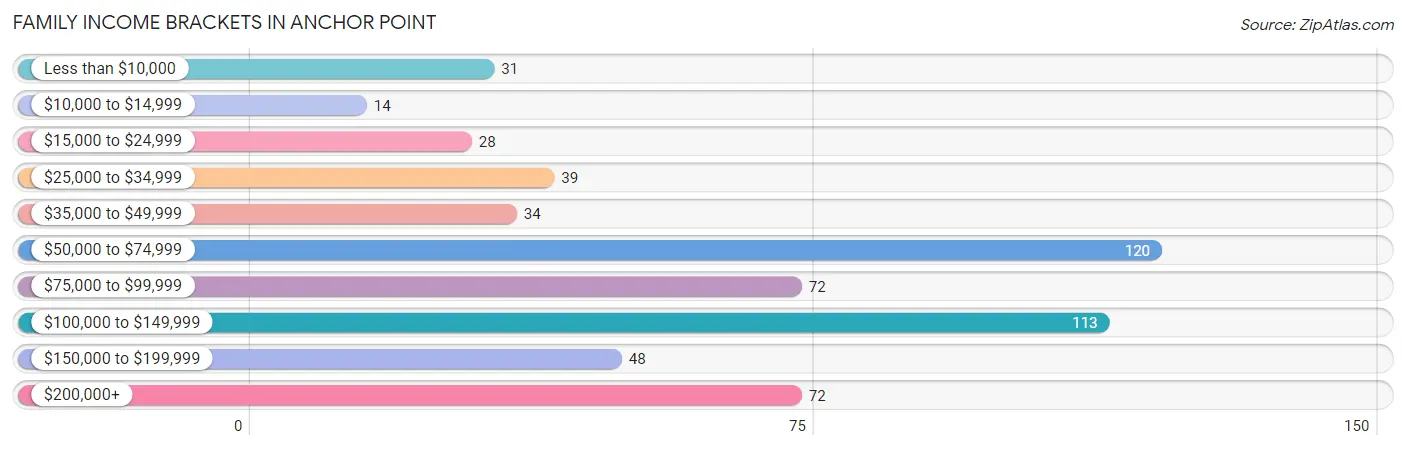
| Income Bracket | # Families | % Families |
| Less than $10,000 | 31 | 5.4% |
| $10,000 to $14,999 | 14 | 2.5% |
| $15,000 to $24,999 | 28 | 4.9% |
| $25,000 to $34,999 | 39 | 6.8% |
| $35,000 to $49,999 | 34 | 6.0% |
| $50,000 to $74,999 | 120 | 21.0% |
| $75,000 to $99,999 | 72 | 12.6% |
| $100,000 to $149,999 | 113 | 19.8% |
| $150,000 to $199,999 | 48 | 8.4% |
| $200,000+ | 72 | 12.6% |
Family Income by Famaliy Size in Anchor Point
4-person families (49 | 8.6%) account for the highest median family income in Anchor Point with $207,880 per family, while 4-person families (49 | 8.6%) have the highest median income of $51,970 per family member.
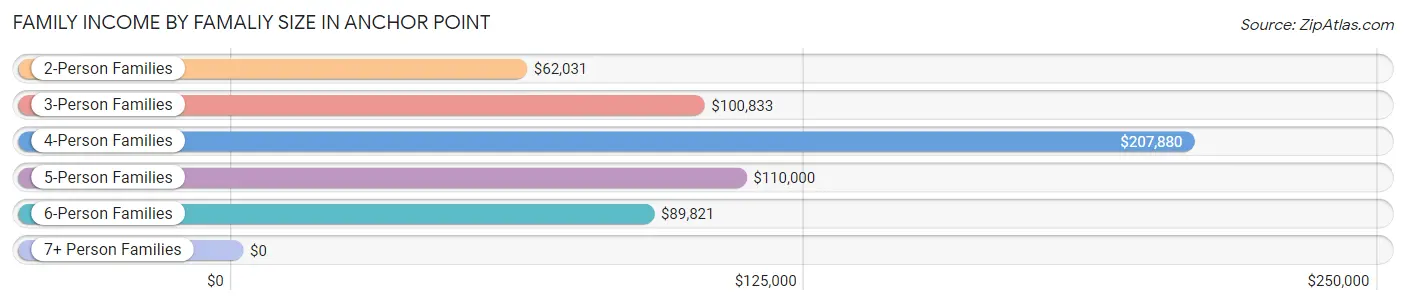
| Income Bracket | # Families | Median Income |
| 2-Person Families | 353 (61.8%) | $62,031 |
| 3-Person Families | 66 (11.6%) | $100,833 |
| 4-Person Families | 49 (8.6%) | $207,880 |
| 5-Person Families | 66 (11.6%) | $110,000 |
| 6-Person Families | 33 (5.8%) | $89,821 |
| 7+ Person Families | 4 (0.7%) | $0 |
| Total | 571 (100.0%) | $81,161 |
Family Income by Number of Earners in Anchor Point
The median family income in Anchor Point is $81,161, with families comprising 3+ earners (65) having the highest median family income of $167,750, while families with no earners (170) have the lowest median family income of $29,318, accounting for 11.4% and 29.8% of families, respectively.
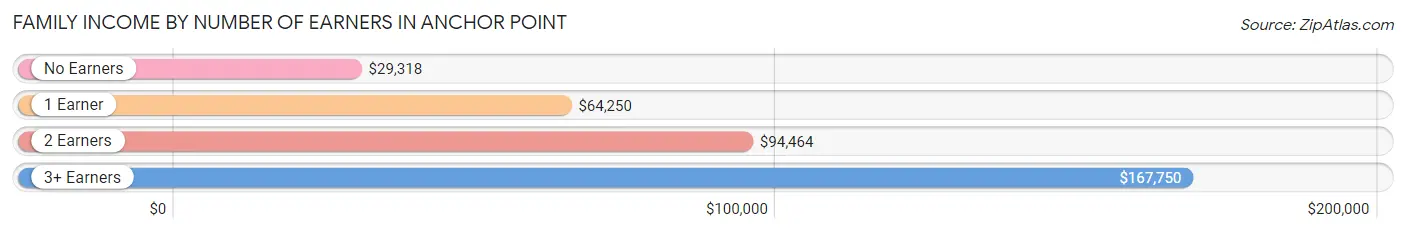
| Number of Earners | # Families | Median Income |
| No Earners | 170 (29.8%) | $29,318 |
| 1 Earner | 159 (27.9%) | $64,250 |
| 2 Earners | 177 (31.0%) | $94,464 |
| 3+ Earners | 65 (11.4%) | $167,750 |
| Total | 571 (100.0%) | $81,161 |
Household Income in Anchor Point
Household Income Brackets in Anchor Point
With 167 households falling in the category, the $50,000 to $74,999 income range is the most frequent in Anchor Point, accounting for 17.2% of all households. In contrast, only 36 households (3.7%) fall into the $10,000 to $14,999 income bracket, making it the least populous group.
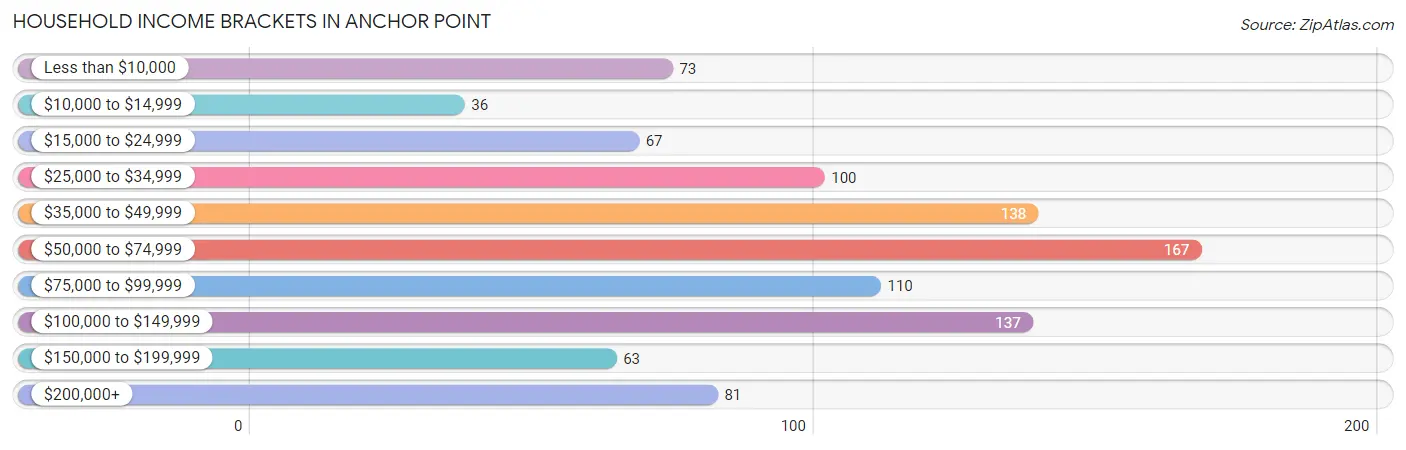
| Income Bracket | # Households | % Households |
| Less than $10,000 | 73 | 7.5% |
| $10,000 to $14,999 | 36 | 3.7% |
| $15,000 to $24,999 | 67 | 6.9% |
| $25,000 to $34,999 | 100 | 10.3% |
| $35,000 to $49,999 | 138 | 14.2% |
| $50,000 to $74,999 | 167 | 17.2% |
| $75,000 to $99,999 | 110 | 11.3% |
| $100,000 to $149,999 | 137 | 14.1% |
| $150,000 to $199,999 | 63 | 6.5% |
| $200,000+ | 81 | 8.3% |
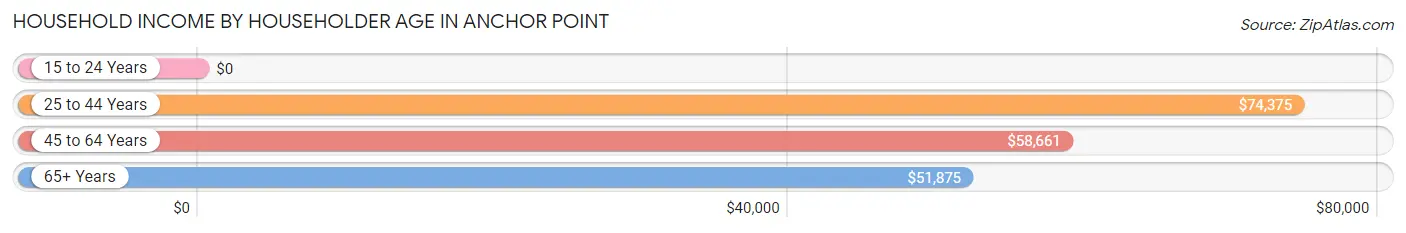
Household Income by Householder Age in Anchor Point
The median household income in Anchor Point is $58,357, with the highest median household income of $74,375 found in the 25 to 44 years age bracket for the primary householder. A total of 184 households (18.9%) fall into this category. Meanwhile, the 15 to 24 years age bracket for the primary householder has the lowest median household income of $0, with 3 households (0.3%) in this group.
| Income Bracket | # Households | Median Income |
| 15 to 24 Years | 3 (0.3%) | $0 |
| 25 to 44 Years | 184 (18.9%) | $74,375 |
| 45 to 64 Years | 432 (44.4%) | $58,661 |
| 65+ Years | 353 (36.3%) | $51,875 |
| Total | 972 (100.0%) | $58,357 |
Poverty in Anchor Point
Income Below Poverty by Sex and Age in Anchor Point
With 14.5% poverty level for males and 10.6% for females among the residents of Anchor Point, 15 year old males and 16 and 17 year old females are the most vulnerable to poverty, with 14 males (42.4%) and 6 females (50.0%) in their respective age groups living below the poverty level.
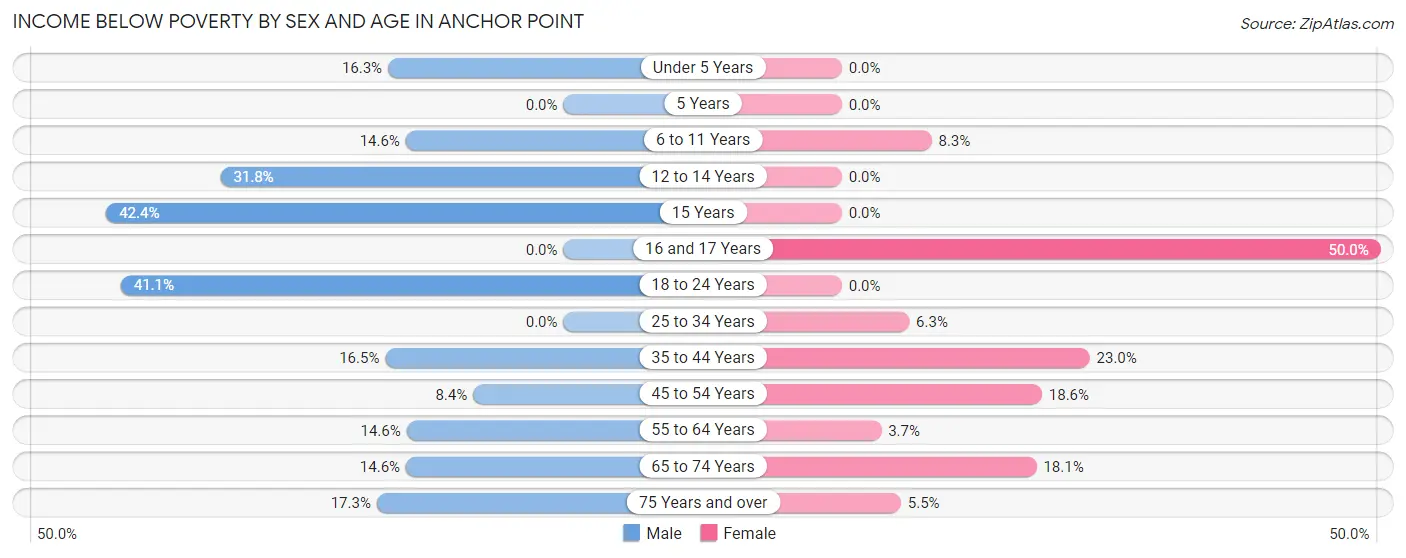
| Age Bracket | Male | Female |
| Under 5 Years | 7 (16.3%) | 0 (0.0%) |
| 5 Years | 0 (0.0%) | 0 (0.0%) |
| 6 to 11 Years | 6 (14.6%) | 8 (8.3%) |
| 12 to 14 Years | 7 (31.8%) | 0 (0.0%) |
| 15 Years | 14 (42.4%) | 0 (0.0%) |
| 16 and 17 Years | 0 (0.0%) | 6 (50.0%) |
| 18 to 24 Years | 23 (41.1%) | 0 (0.0%) |
| 25 to 34 Years | 0 (0.0%) | 6 (6.2%) |
| 35 to 44 Years | 20 (16.5%) | 23 (23.0%) |
| 45 to 54 Years | 15 (8.4%) | 26 (18.6%) |
| 55 to 64 Years | 31 (14.5%) | 7 (3.7%) |
| 65 to 74 Years | 32 (14.6%) | 30 (18.1%) |
| 75 Years and over | 22 (17.3%) | 4 (5.5%) |
| Total | 177 (14.5%) | 110 (10.6%) |
Income Above Poverty by Sex and Age in Anchor Point
According to the poverty statistics in Anchor Point, males aged 5 years and females aged under 5 years are the age groups that are most secure financially, with 100.0% of males and 100.0% of females in these age groups living above the poverty line.
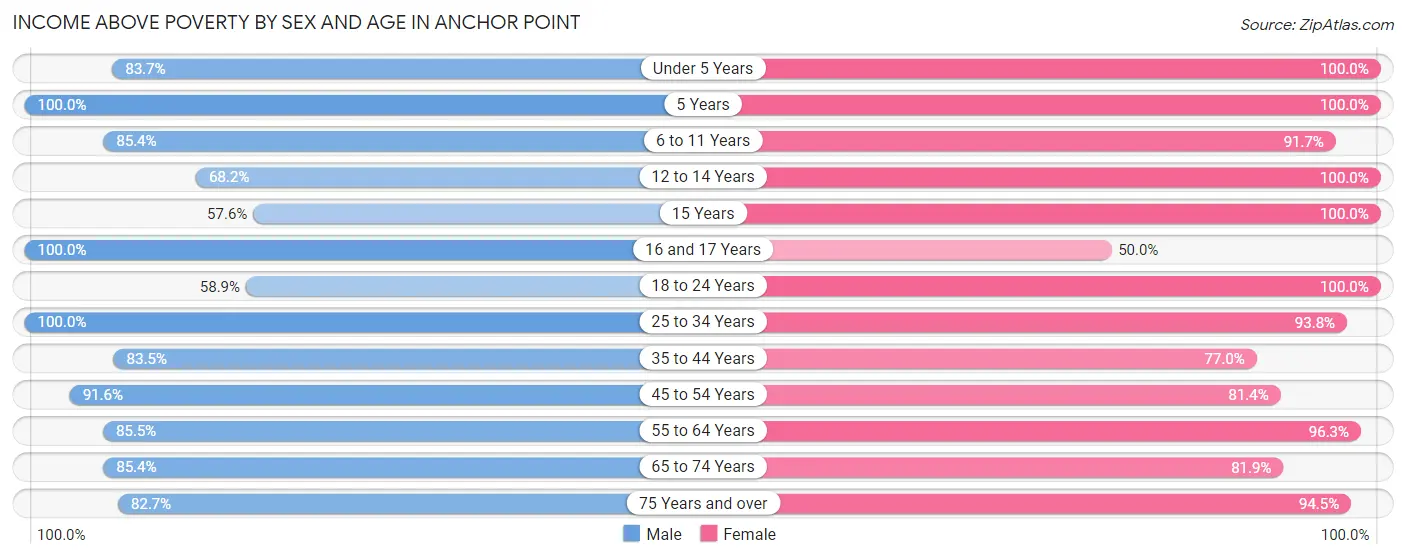
| Age Bracket | Male | Female |
| Under 5 Years | 36 (83.7%) | 27 (100.0%) |
| 5 Years | 15 (100.0%) | 14 (100.0%) |
| 6 to 11 Years | 35 (85.4%) | 88 (91.7%) |
| 12 to 14 Years | 15 (68.2%) | 41 (100.0%) |
| 15 Years | 19 (57.6%) | 15 (100.0%) |
| 16 and 17 Years | 37 (100.0%) | 6 (50.0%) |
| 18 to 24 Years | 33 (58.9%) | 65 (100.0%) |
| 25 to 34 Years | 118 (100.0%) | 90 (93.8%) |
| 35 to 44 Years | 101 (83.5%) | 77 (77.0%) |
| 45 to 54 Years | 164 (91.6%) | 114 (81.4%) |
| 55 to 64 Years | 182 (85.5%) | 184 (96.3%) |
| 65 to 74 Years | 187 (85.4%) | 136 (81.9%) |
| 75 Years and over | 105 (82.7%) | 69 (94.5%) |
| Total | 1,047 (85.5%) | 926 (89.4%) |
Income Below Poverty Among Married-Couple Families in Anchor Point
The poverty statistics for married-couple families in Anchor Point show that 8.7% or 43 of the total 496 families live below the poverty line. Families with no children have the highest poverty rate of 10.2%, comprising of 38 families. On the other hand, families with 1 or 2 children have the lowest poverty rate of 0.0%, which includes 0 families.
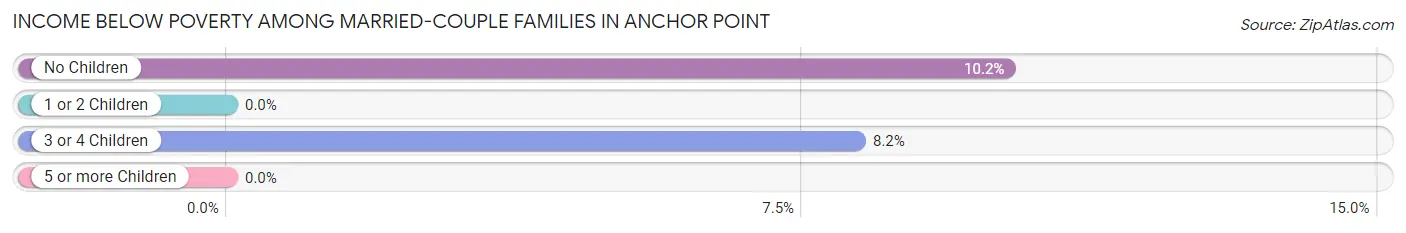
| Children | Above Poverty | Below Poverty |
| No Children | 336 (89.8%) | 38 (10.2%) |
| 1 or 2 Children | 61 (100.0%) | 0 (0.0%) |
| 3 or 4 Children | 56 (91.8%) | 5 (8.2%) |
| 5 or more Children | 0 (0.0%) | 0 (0.0%) |
| Total | 453 (91.3%) | 43 (8.7%) |
Income Below Poverty Among Single-Parent Households in Anchor Point
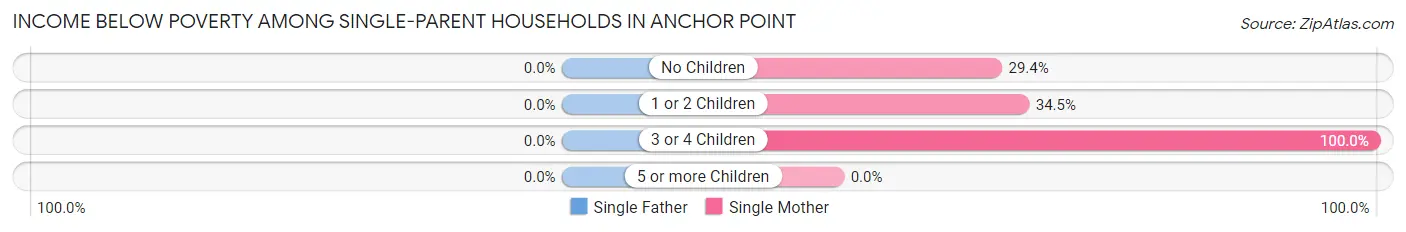
| Children | Single Father | Single Mother |
| No Children | 0 (0.0%) | 5 (29.4%) |
| 1 or 2 Children | 0 (0.0%) | 10 (34.5%) |
| 3 or 4 Children | 0 (0.0%) | 4 (100.0%) |
| 5 or more Children | 0 (0.0%) | 0 (0.0%) |
| Total | 0 (0.0%) | 19 (38.0%) |
Income Below Poverty Among Married-Couple vs Single-Parent Households in Anchor Point
The poverty data for Anchor Point shows that 43 of the married-couple family households (8.7%) and 19 of the single-parent households (25.3%) are living below the poverty level. Within the married-couple family households, those with no children have the highest poverty rate, with 38 households (10.2%) falling below the poverty line. Among the single-parent households, those with 3 or 4 children have the highest poverty rate, with 4 household (100.0%) living below poverty.
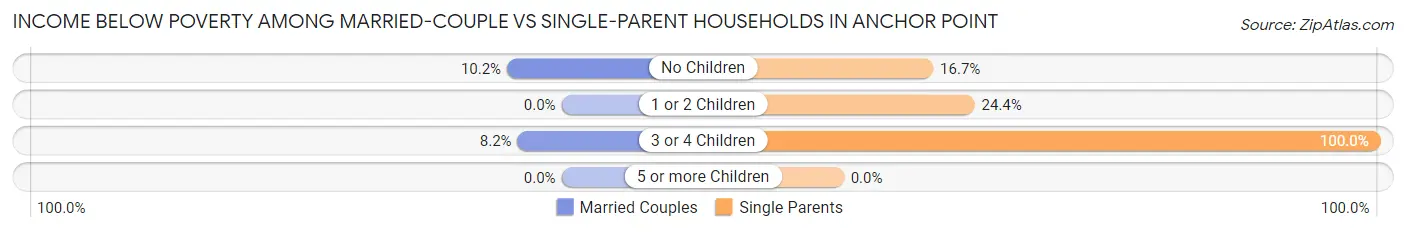
| Children | Married-Couple Families | Single-Parent Households |
| No Children | 38 (10.2%) | 5 (16.7%) |
| 1 or 2 Children | 0 (0.0%) | 10 (24.4%) |
| 3 or 4 Children | 5 (8.2%) | 4 (100.0%) |
| 5 or more Children | 0 (0.0%) | 0 (0.0%) |
| Total | 43 (8.7%) | 19 (25.3%) |
Race in Anchor Point
The most populous races in Anchor Point are White / Caucasian (1,964 | 86.9%), Two or more Races (169 | 7.5%), and Native / Alaskan (105 | 4.6%).
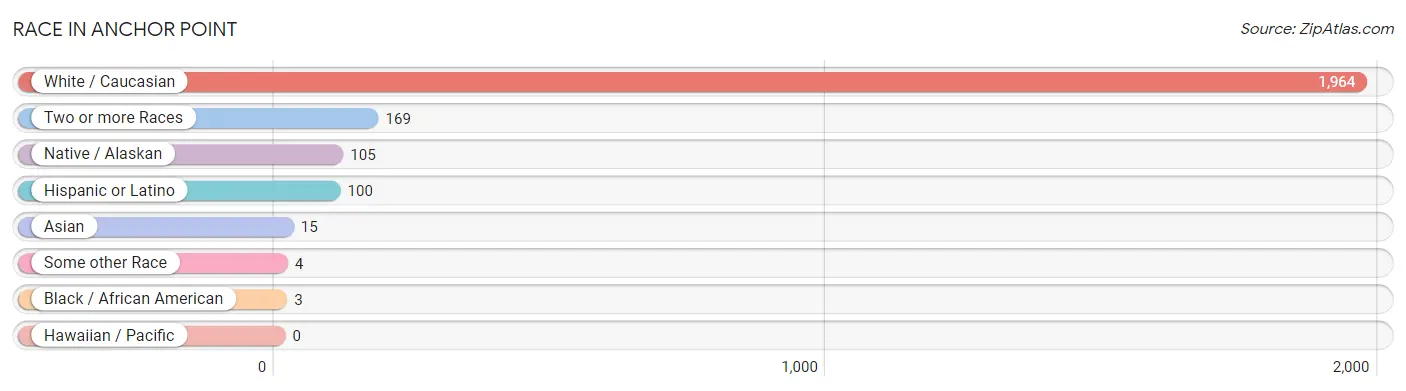
| Race | # Population | % Population |
| Asian | 15 | 0.7% |
| Black / African American | 3 | 0.1% |
| Hawaiian / Pacific | 0 | 0.0% |
| Hispanic or Latino | 100 | 4.4% |
| Native / Alaskan | 105 | 4.6% |
| White / Caucasian | 1,964 | 86.9% |
| Two or more Races | 169 | 7.5% |
| Some other Race | 4 | 0.2% |
| Total | 2,260 | 100.0% |
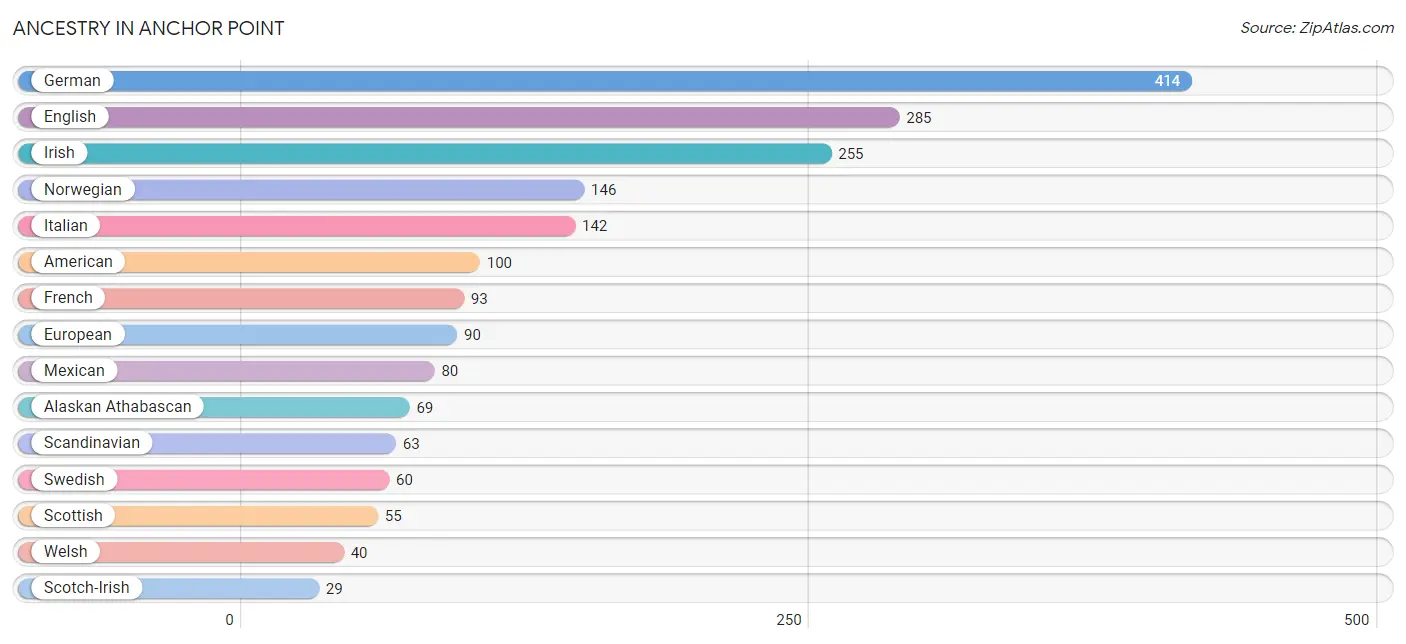
Ancestry in Anchor Point
The most populous ancestries reported in Anchor Point are German (414 | 18.3%), English (285 | 12.6%), Irish (255 | 11.3%), Norwegian (146 | 6.5%), and Italian (142 | 6.3%), together accounting for 54.9% of all Anchor Point residents.
| Ancestry | # Population | % Population |
| Alaska Native | 14 | 0.6% |
| Alaskan Athabascan | 69 | 3.0% |
| Aleut | 7 | 0.3% |
| American | 100 | 4.4% |
| Arab | 13 | 0.6% |
| Belgian | 2 | 0.1% |
| Bhutanese | 10 | 0.4% |
| British | 16 | 0.7% |
| Canadian | 4 | 0.2% |
| Cherokee | 6 | 0.3% |
| Chippewa | 8 | 0.4% |
| Creek | 3 | 0.1% |
| Czech | 14 | 0.6% |
| Czechoslovakian | 4 | 0.2% |
| Danish | 14 | 0.6% |
| Dutch | 28 | 1.2% |
| English | 285 | 12.6% |
| Estonian | 7 | 0.3% |
| European | 90 | 4.0% |
| Finnish | 11 | 0.5% |
| French | 93 | 4.1% |
| French Canadian | 14 | 0.6% |
| German | 414 | 18.3% |
| Icelander | 6 | 0.3% |
| Irish | 255 | 11.3% |
| Italian | 142 | 6.3% |
| Korean | 23 | 1.0% |
| Lithuanian | 5 | 0.2% |
| Mexican | 80 | 3.5% |
| Northern European | 13 | 0.6% |
| Norwegian | 146 | 6.5% |
| Polish | 21 | 0.9% |
| Puerto Rican | 5 | 0.2% |
| Russian | 19 | 0.8% |
| Scandinavian | 63 | 2.8% |
| Scotch-Irish | 29 | 1.3% |
| Scottish | 55 | 2.4% |
| Slovak | 8 | 0.4% |
| Spaniard | 3 | 0.1% |
| Spanish | 12 | 0.5% |
| Swedish | 60 | 2.6% |
| Swiss | 14 | 0.6% |
| Syrian | 13 | 0.6% |
| Tlingit-Haida | 7 | 0.3% |
| Ukrainian | 10 | 0.4% |
| Welsh | 40 | 1.8% |
| Yugoslavian | 4 | 0.2% |
| Yup'ik | 6 | 0.3% | View All 48 Rows |
Immigrants in Anchor Point
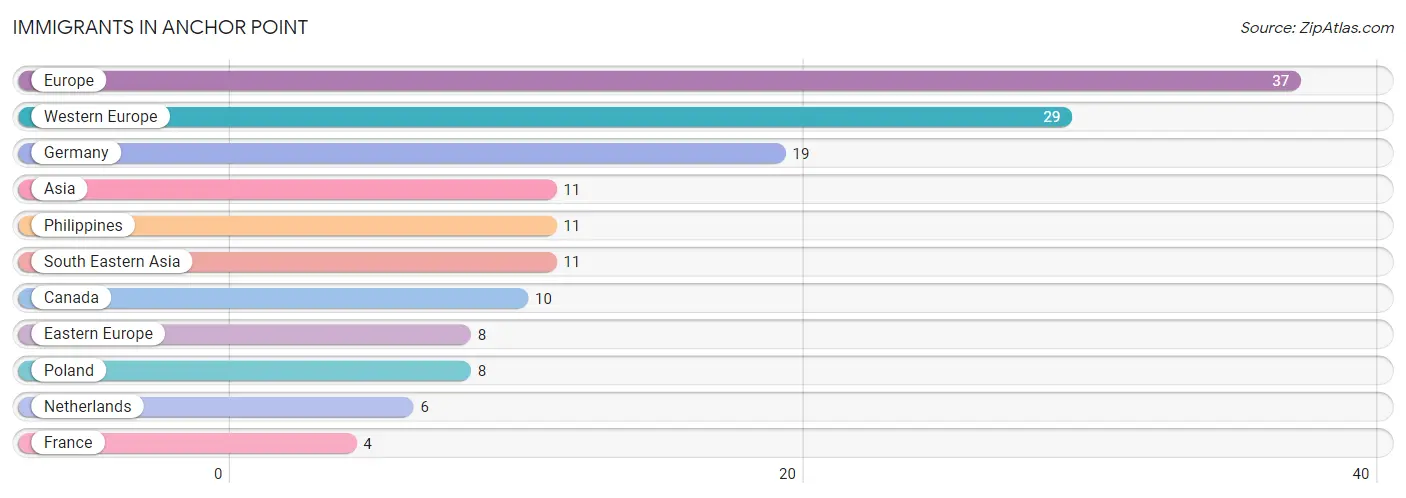
The most numerous immigrant groups reported in Anchor Point came from Europe (37 | 1.6%), Western Europe (29 | 1.3%), Germany (19 | 0.8%), Asia (11 | 0.5%), and Philippines (11 | 0.5%), together accounting for 4.7% of all Anchor Point residents.
| Immigration Origin | # Population | % Population |
| Asia | 11 | 0.5% |
| Canada | 10 | 0.4% |
| Eastern Europe | 8 | 0.4% |
| Europe | 37 | 1.6% |
| France | 4 | 0.2% |
| Germany | 19 | 0.8% |
| Netherlands | 6 | 0.3% |
| Philippines | 11 | 0.5% |
| Poland | 8 | 0.4% |
| South Eastern Asia | 11 | 0.5% |
| Western Europe | 29 | 1.3% | View All 11 Rows |
Sex and Age in Anchor Point
Sex and Age in Anchor Point
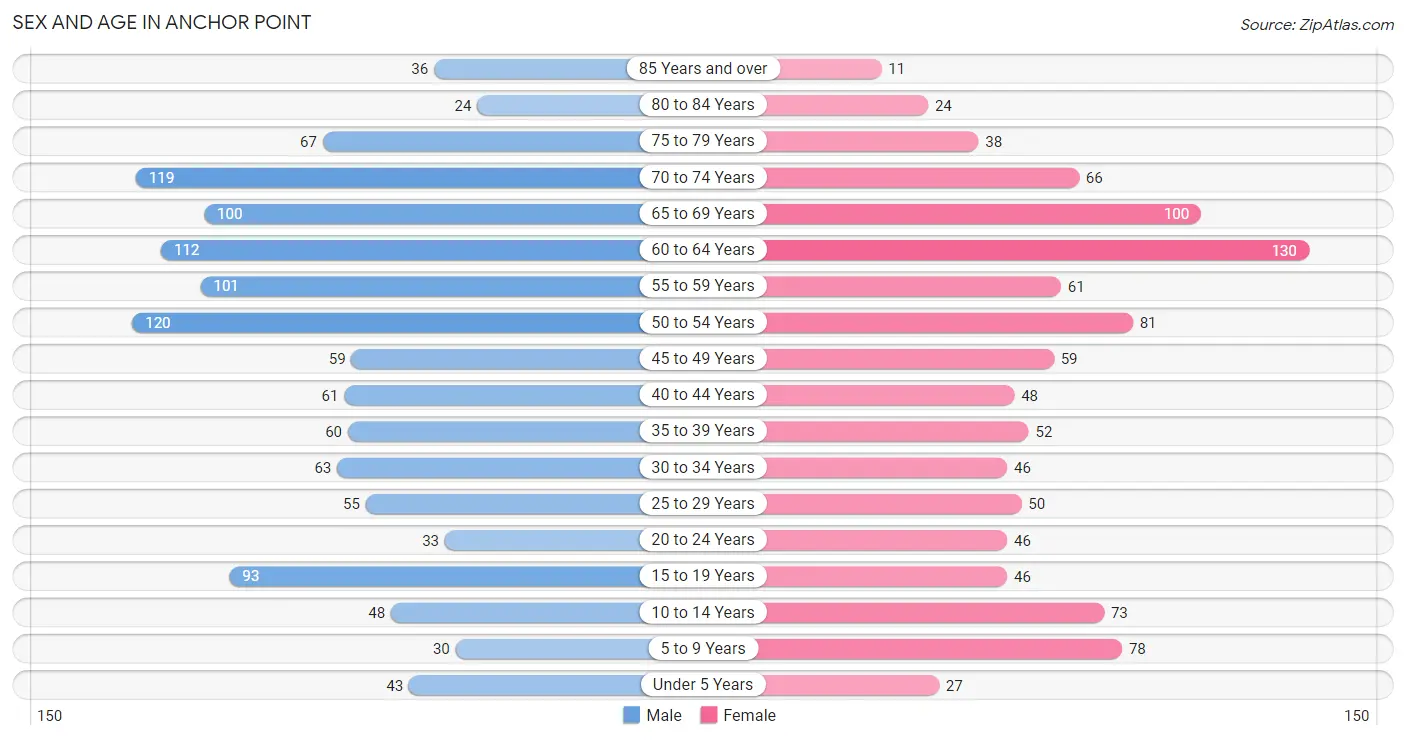
The most populous age groups in Anchor Point are 50 to 54 Years (120 | 9.8%) for men and 60 to 64 Years (130 | 12.6%) for women.
| Age Bracket | Male | Female |
| Under 5 Years | 43 (3.5%) | 27 (2.6%) |
| 5 to 9 Years | 30 (2.5%) | 78 (7.5%) |
| 10 to 14 Years | 48 (3.9%) | 73 (7.0%) |
| 15 to 19 Years | 93 (7.6%) | 46 (4.4%) |
| 20 to 24 Years | 33 (2.7%) | 46 (4.4%) |
| 25 to 29 Years | 55 (4.5%) | 50 (4.8%) |
| 30 to 34 Years | 63 (5.1%) | 46 (4.4%) |
| 35 to 39 Years | 60 (4.9%) | 52 (5.0%) |
| 40 to 44 Years | 61 (5.0%) | 48 (4.6%) |
| 45 to 49 Years | 59 (4.8%) | 59 (5.7%) |
| 50 to 54 Years | 120 (9.8%) | 81 (7.8%) |
| 55 to 59 Years | 101 (8.3%) | 61 (5.9%) |
| 60 to 64 Years | 112 (9.1%) | 130 (12.6%) |
| 65 to 69 Years | 100 (8.2%) | 100 (9.7%) |
| 70 to 74 Years | 119 (9.7%) | 66 (6.4%) |
| 75 to 79 Years | 67 (5.5%) | 38 (3.7%) |
| 80 to 84 Years | 24 (2.0%) | 24 (2.3%) |
| 85 Years and over | 36 (2.9%) | 11 (1.1%) |
| Total | 1,224 (100.0%) | 1,036 (100.0%) |
Families and Households in Anchor Point
Median Family Size in Anchor Point
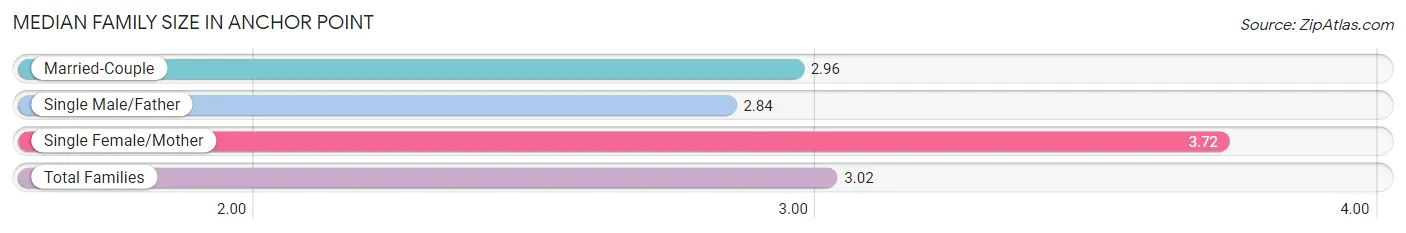
The median family size in Anchor Point is 3.02 persons per family, with single female/mother families (50 | 8.8%) accounting for the largest median family size of 3.72 persons per family. On the other hand, single male/father families (25 | 4.4%) represent the smallest median family size with 2.84 persons per family.
| Family Type | # Families | Family Size |
| Married-Couple | 496 (86.9%) | 2.96 |
| Single Male/Father | 25 (4.4%) | 2.84 |
| Single Female/Mother | 50 (8.8%) | 3.72 |
| Total Families | 571 (100.0%) | 3.02 |
Median Household Size in Anchor Point
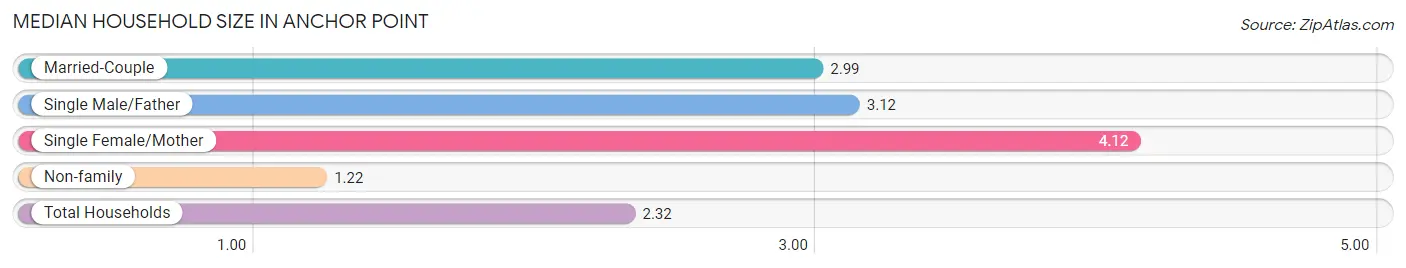
The median household size in Anchor Point is 2.32 persons per household, with single female/mother households (50 | 5.1%) accounting for the largest median household size of 4.12 persons per household. non-family households (401 | 41.3%) represent the smallest median household size with 1.22 persons per household.
| Household Type | # Households | Household Size |
| Married-Couple | 496 (51.0%) | 2.99 |
| Single Male/Father | 25 (2.6%) | 3.12 |
| Single Female/Mother | 50 (5.1%) | 4.12 |
| Non-family | 401 (41.3%) | 1.22 |
| Total Households | 972 (100.0%) | 2.32 |
Household Size by Marriage Status in Anchor Point
Out of a total of 972 households in Anchor Point, 571 (58.7%) are family households, while 401 (41.3%) are nonfamily households. The most numerous type of family households are 2-person households, comprising 333, and the most common type of nonfamily households are 1-person households, comprising 310.
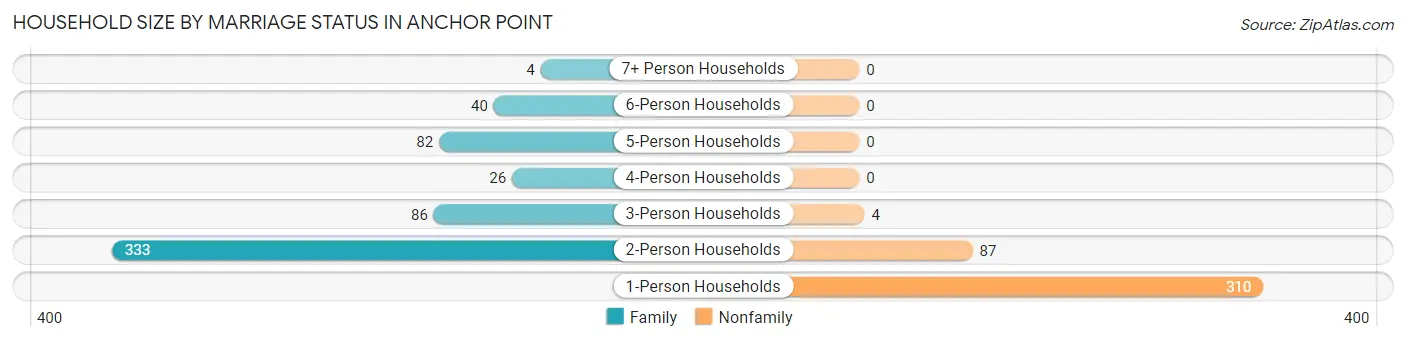
| Household Size | Family Households | Nonfamily Households |
| 1-Person Households | - | 310 (31.9%) |
| 2-Person Households | 333 (34.3%) | 87 (8.9%) |
| 3-Person Households | 86 (8.8%) | 4 (0.4%) |
| 4-Person Households | 26 (2.7%) | 0 (0.0%) |
| 5-Person Households | 82 (8.4%) | 0 (0.0%) |
| 6-Person Households | 40 (4.1%) | 0 (0.0%) |
| 7+ Person Households | 4 (0.4%) | 0 (0.0%) |
| Total | 571 (58.7%) | 401 (41.3%) |
Female Fertility in Anchor Point
Fertility by Age in Anchor Point
Average fertility rate in Anchor Point is 41.0 births per 1,000 women. Women in the age bracket of 20 to 34 years have the highest fertility rate with 106.0 births per 1,000 women. Women in the age bracket of 20 to 34 years acount for 100.0% of all women with births.
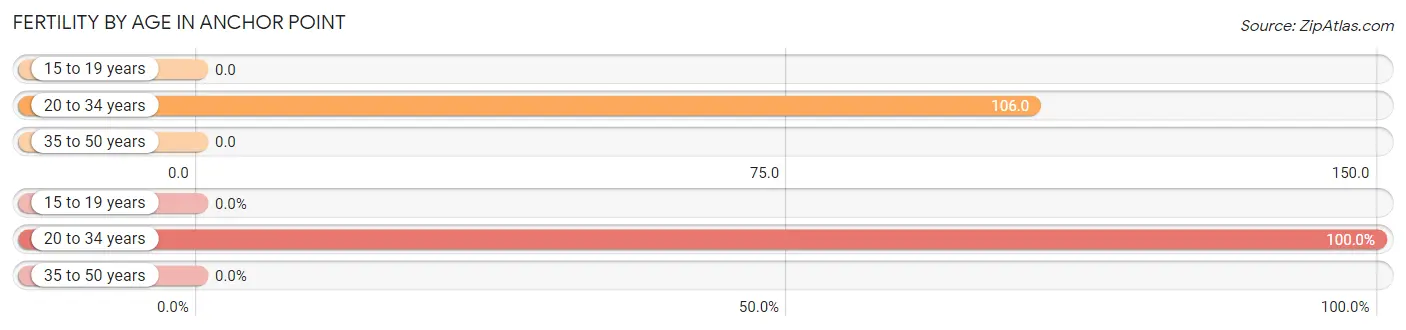
| Age Bracket | Women with Births | Births / 1,000 Women |
| 15 to 19 years | 0 (0.0%) | 0.0 |
| 20 to 34 years | 15 (100.0%) | 106.0 |
| 35 to 50 years | 0 (0.0%) | 0.0 |
| Total | 15 (100.0%) | 41.0 |
Fertility by Age by Marriage Status in Anchor Point
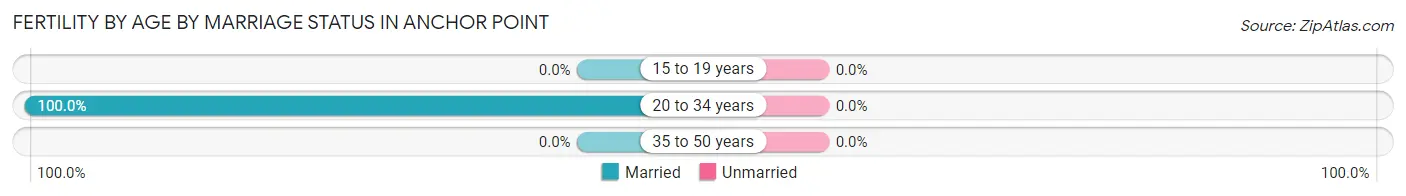
| Age Bracket | Married | Unmarried |
| 15 to 19 years | 0 (0.0%) | 0 (0.0%) |
| 20 to 34 years | 15 (100.0%) | 0 (0.0%) |
| 35 to 50 years | 0 (0.0%) | 0 (0.0%) |
| Total | 15 (100.0%) | 0 (0.0%) |
Fertility by Education in Anchor Point
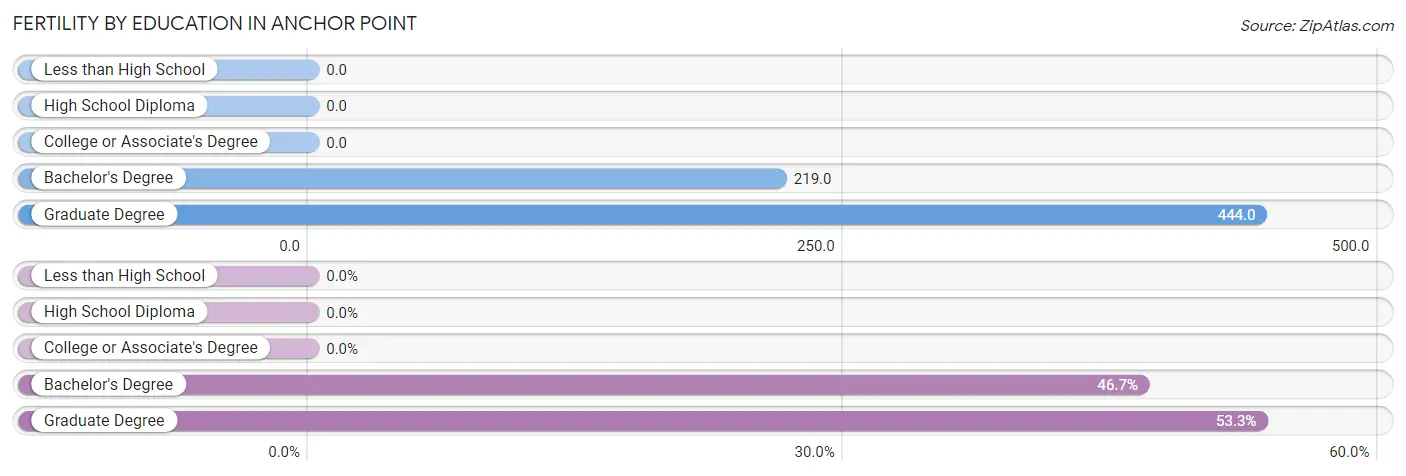
| Educational Attainment | Women with Births | Births / 1,000 Women |
| Less than High School | 0 (0.0%) | 0.0 |
| High School Diploma | 0 (0.0%) | 0.0 |
| College or Associate's Degree | 0 (0.0%) | 0.0 |
| Bachelor's Degree | 7 (46.7%) | 219.0 |
| Graduate Degree | 8 (53.3%) | 444.0 |
| Total | 15 (100.0%) | 41.0 |
Fertility by Education by Marriage Status in Anchor Point
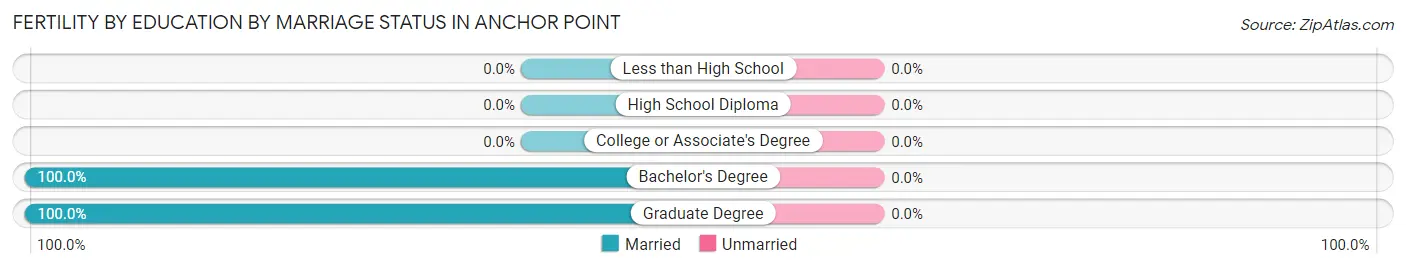
| Educational Attainment | Married | Unmarried |
| Less than High School | 0 (0.0%) | 0 (0.0%) |
| High School Diploma | 0 (0.0%) | 0 (0.0%) |
| College or Associate's Degree | 0 (0.0%) | 0 (0.0%) |
| Bachelor's Degree | 7 (100.0%) | 0 (0.0%) |
| Graduate Degree | 8 (100.0%) | 0 (0.0%) |
| Total | 15 (100.0%) | 0 (0.0%) |
Employment Characteristics in Anchor Point
Employment by Class of Employer in Anchor Point
Among the 751 employed individuals in Anchor Point, private company employees (388 | 51.7%), not-for-profit organizations (122 | 16.3%), and self-employed (not incorporated) (75 | 10.0%) make up the most common classes of employment.
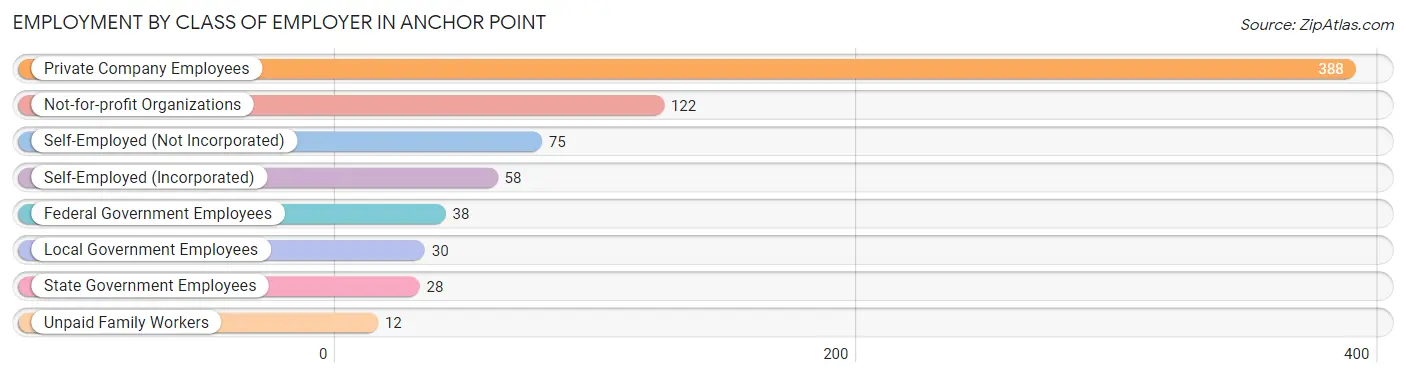
| Employer Class | # Employees | % Employees |
| Private Company Employees | 388 | 51.7% |
| Self-Employed (Incorporated) | 58 | 7.7% |
| Self-Employed (Not Incorporated) | 75 | 10.0% |
| Not-for-profit Organizations | 122 | 16.3% |
| Local Government Employees | 30 | 4.0% |
| State Government Employees | 28 | 3.7% |
| Federal Government Employees | 38 | 5.1% |
| Unpaid Family Workers | 12 | 1.6% |
| Total | 751 | 100.0% |
Employment Status by Age in Anchor Point
According to the labor force statistics for Anchor Point, out of the total population over 16 years of age (1,913), 47.3% or 905 individuals are in the labor force, with 10.5% or 95 of them unemployed. The age group with the highest labor force participation rate is 20 to 24 years, with 84.8% or 67 individuals in the labor force. Within the labor force, the 16 to 19 years age range has the highest percentage of unemployed individuals, with 31.3% or 10 of them being unemployed.
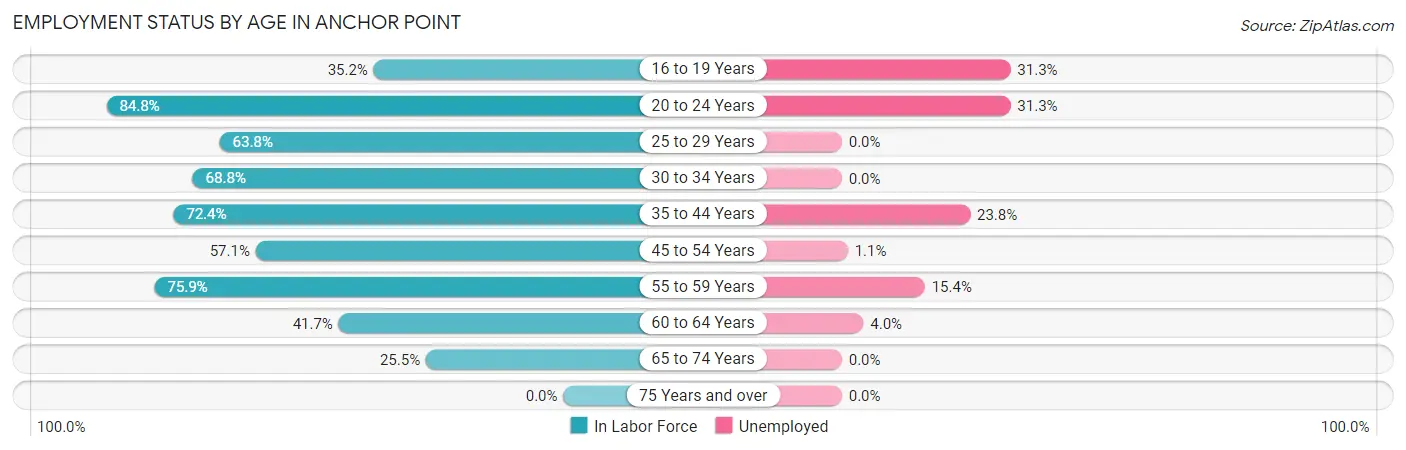
| Age Bracket | In Labor Force | Unemployed |
| 16 to 19 Years | 32 (35.2%) | 10 (31.3%) |
| 20 to 24 Years | 67 (84.8%) | 21 (31.3%) |
| 25 to 29 Years | 67 (63.8%) | 0 (0.0%) |
| 30 to 34 Years | 75 (68.8%) | 0 (0.0%) |
| 35 to 44 Years | 160 (72.4%) | 38 (23.8%) |
| 45 to 54 Years | 182 (57.1%) | 2 (1.1%) |
| 55 to 59 Years | 123 (75.9%) | 19 (15.4%) |
| 60 to 64 Years | 101 (41.7%) | 4 (4.0%) |
| 65 to 74 Years | 98 (25.5%) | 0 (0.0%) |
| 75 Years and over | 0 (0.0%) | 0 (0.0%) |
| Total | 905 (47.3%) | 95 (10.5%) |
Employment Status by Educational Attainment in Anchor Point
According to labor force statistics for Anchor Point, 61.1% of individuals (708) out of the total population between 25 and 64 years of age (1,158) are in the labor force, with 9.0% or 64 of them being unemployed. The group with the highest labor force participation rate are those with the educational attainment of bachelor's degree or higher, with 81.3% or 148 individuals in the labor force. Within the labor force, individuals with less than high school education have the highest percentage of unemployment, with 10.5% or 9 of them being unemployed.
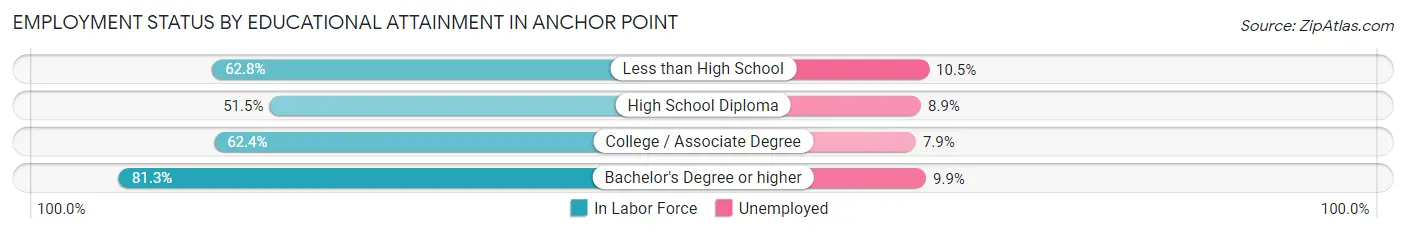
| Educational Attainment | In Labor Force | Unemployed |
| Less than High School | 86 (62.8%) | 14 (10.5%) |
| High School Diploma | 235 (51.5%) | 41 (8.9%) |
| College / Associate Degree | 239 (62.4%) | 30 (7.9%) |
| Bachelor's Degree or higher | 148 (81.3%) | 18 (9.9%) |
| Total | 708 (61.1%) | 104 (9.0%) |
Employment Occupations by Sex in Anchor Point
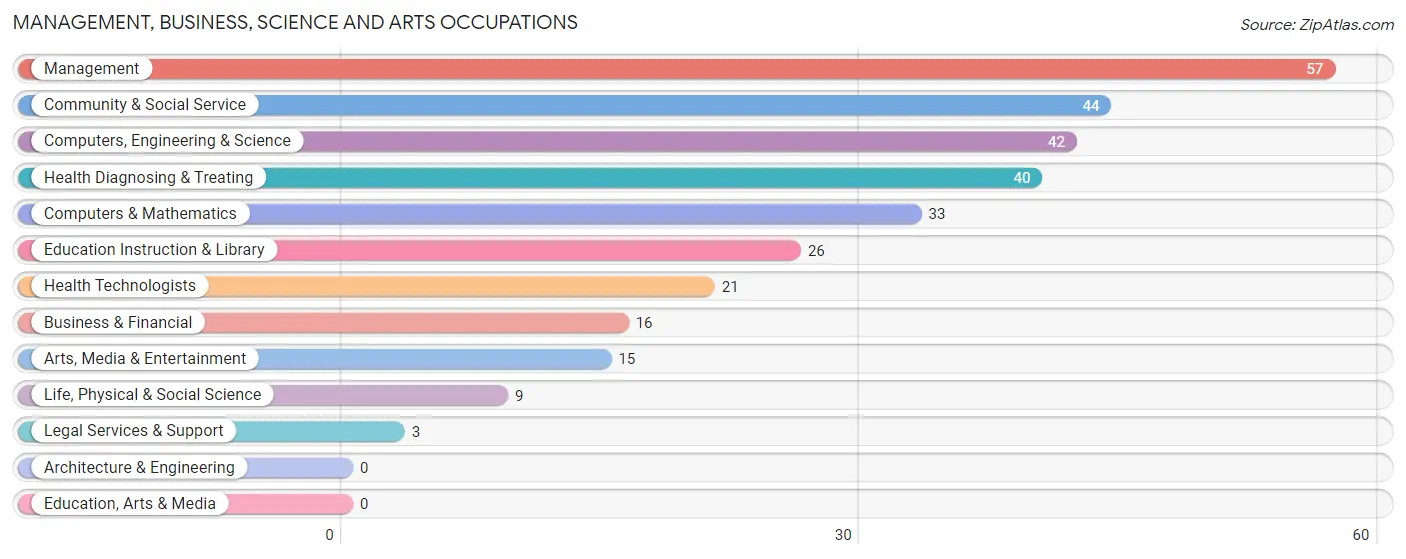
Management, Business, Science and Arts Occupations
The most common Management, Business, Science and Arts occupations in Anchor Point are Management (57 | 7.1%), Community & Social Service (44 | 5.5%), Computers, Engineering & Science (42 | 5.2%), Health Diagnosing & Treating (40 | 5.0%), and Computers & Mathematics (33 | 4.1%).
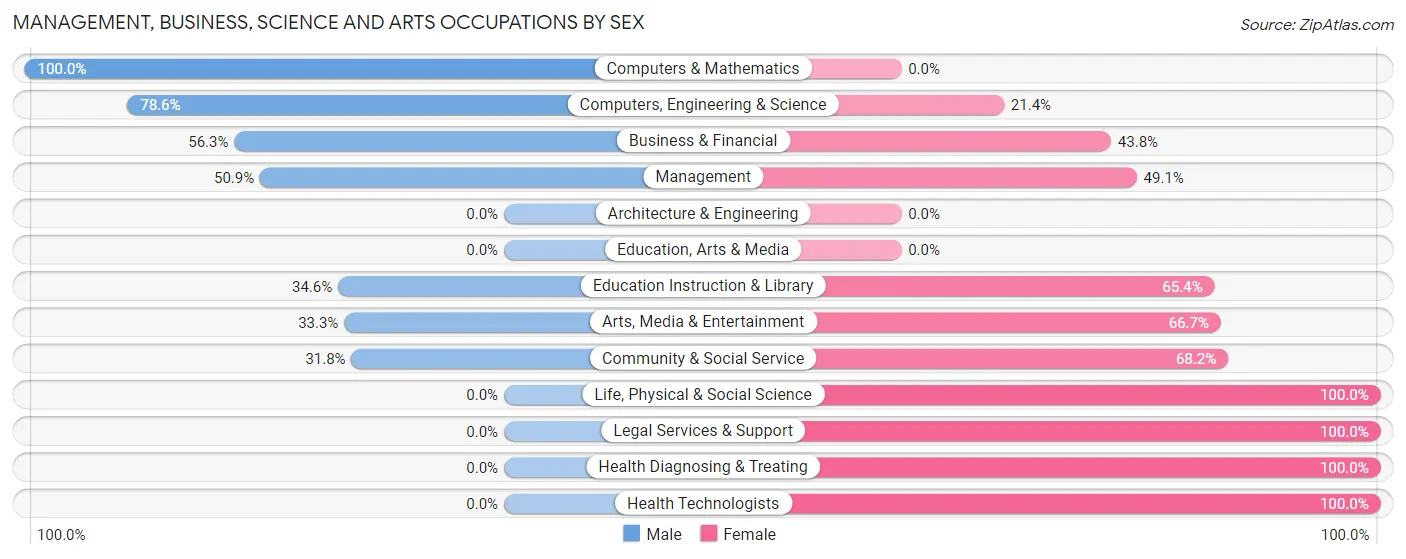
Management, Business, Science and Arts Occupations by Sex
Within the Management, Business, Science and Arts occupations in Anchor Point, the most male-oriented occupations are Computers & Mathematics (100.0%), Computers, Engineering & Science (78.6%), and Business & Financial (56.2%), while the most female-oriented occupations are Life, Physical & Social Science (100.0%), Legal Services & Support (100.0%), and Health Diagnosing & Treating (100.0%).
| Occupation | Male | Female |
| Management | 29 (50.9%) | 28 (49.1%) |
| Business & Financial | 9 (56.2%) | 7 (43.8%) |
| Computers, Engineering & Science | 33 (78.6%) | 9 (21.4%) |
| Computers & Mathematics | 33 (100.0%) | 0 (0.0%) |
| Architecture & Engineering | 0 (0.0%) | 0 (0.0%) |
| Life, Physical & Social Science | 0 (0.0%) | 9 (100.0%) |
| Community & Social Service | 14 (31.8%) | 30 (68.2%) |
| Education, Arts & Media | 0 (0.0%) | 0 (0.0%) |
| Legal Services & Support | 0 (0.0%) | 3 (100.0%) |
| Education Instruction & Library | 9 (34.6%) | 17 (65.4%) |
| Arts, Media & Entertainment | 5 (33.3%) | 10 (66.7%) |
| Health Diagnosing & Treating | 0 (0.0%) | 40 (100.0%) |
| Health Technologists | 0 (0.0%) | 21 (100.0%) |
| Total (Category) | 85 (42.7%) | 114 (57.3%) |
| Total (Overall) | 416 (51.7%) | 388 (48.3%) |
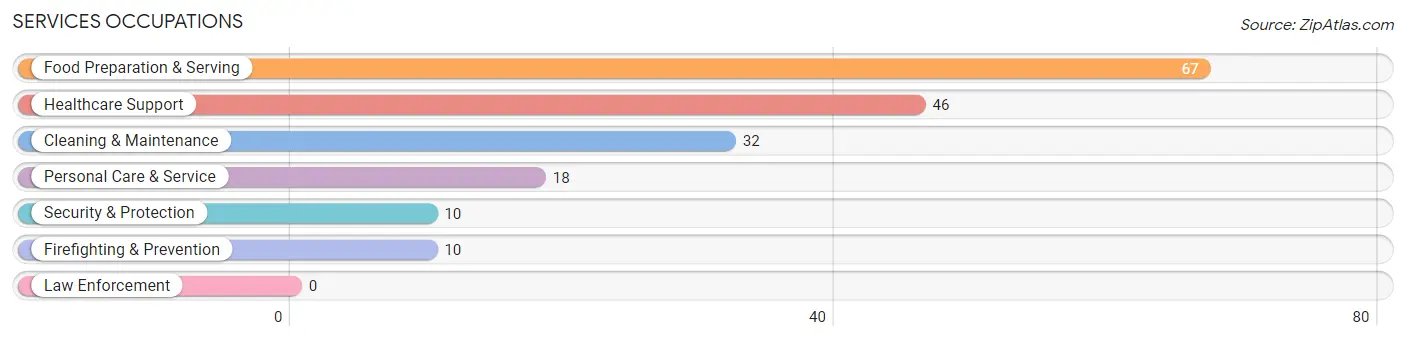
Services Occupations
The most common Services occupations in Anchor Point are Food Preparation & Serving (67 | 8.3%), Healthcare Support (46 | 5.7%), Cleaning & Maintenance (32 | 4.0%), Personal Care & Service (18 | 2.2%), and Security & Protection (10 | 1.2%).
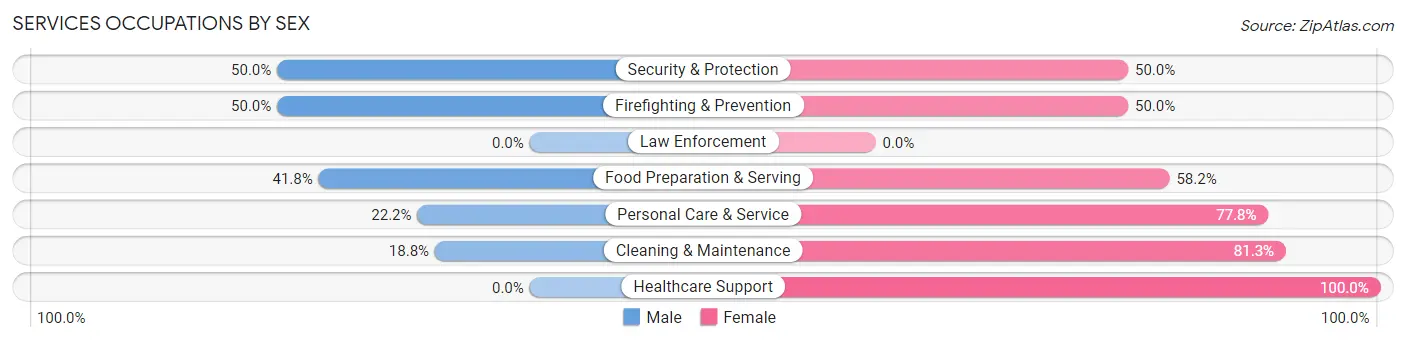
Services Occupations by Sex
Within the Services occupations in Anchor Point, the most male-oriented occupations are Security & Protection (50.0%), Firefighting & Prevention (50.0%), and Food Preparation & Serving (41.8%), while the most female-oriented occupations are Healthcare Support (100.0%), Cleaning & Maintenance (81.2%), and Personal Care & Service (77.8%).
| Occupation | Male | Female |
| Healthcare Support | 0 (0.0%) | 46 (100.0%) |
| Security & Protection | 5 (50.0%) | 5 (50.0%) |
| Firefighting & Prevention | 5 (50.0%) | 5 (50.0%) |
| Law Enforcement | 0 (0.0%) | 0 (0.0%) |
| Food Preparation & Serving | 28 (41.8%) | 39 (58.2%) |
| Cleaning & Maintenance | 6 (18.8%) | 26 (81.2%) |
| Personal Care & Service | 4 (22.2%) | 14 (77.8%) |
| Total (Category) | 43 (24.9%) | 130 (75.1%) |
| Total (Overall) | 416 (51.7%) | 388 (48.3%) |
Sales and Office Occupations
The most common Sales and Office occupations in Anchor Point are Sales & Related (82 | 10.2%), and Office & Administration (79 | 9.8%).
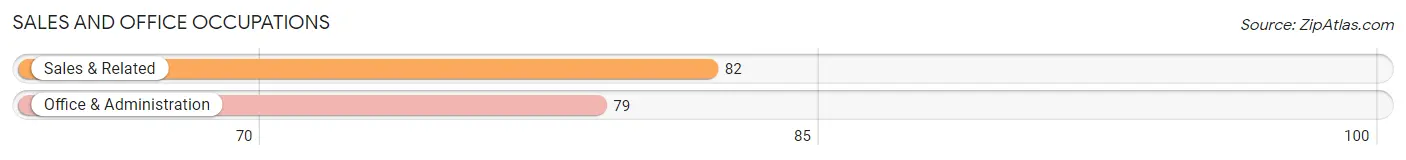
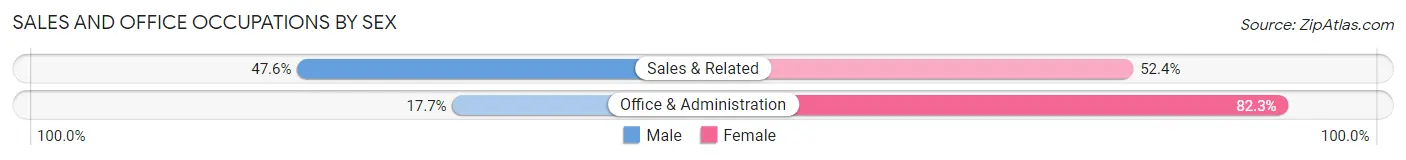
Sales and Office Occupations by Sex
| Occupation | Male | Female |
| Sales & Related | 39 (47.6%) | 43 (52.4%) |
| Office & Administration | 14 (17.7%) | 65 (82.3%) |
| Total (Category) | 53 (32.9%) | 108 (67.1%) |
| Total (Overall) | 416 (51.7%) | 388 (48.3%) |
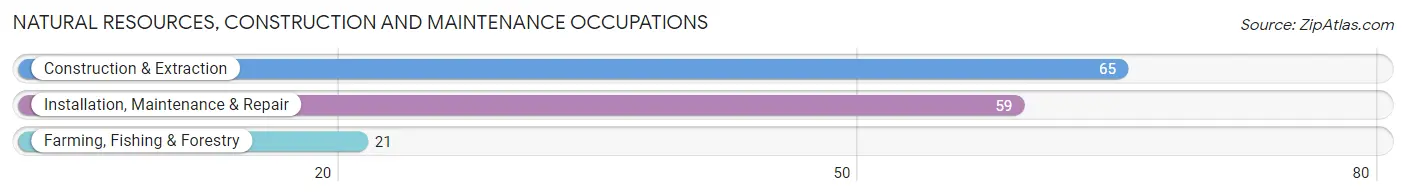
Natural Resources, Construction and Maintenance Occupations
The most common Natural Resources, Construction and Maintenance occupations in Anchor Point are Construction & Extraction (65 | 8.1%), Installation, Maintenance & Repair (59 | 7.3%), and Farming, Fishing & Forestry (21 | 2.6%).
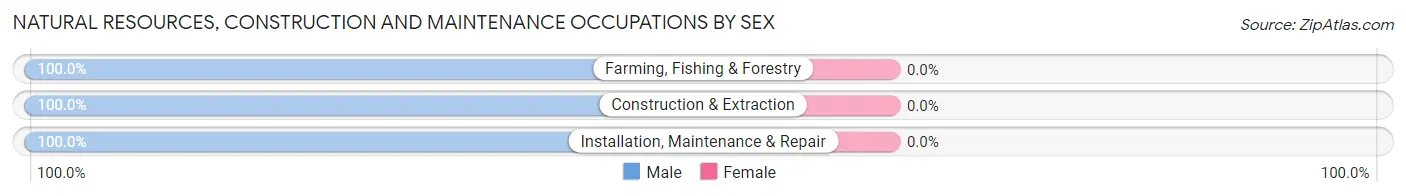
Natural Resources, Construction and Maintenance Occupations by Sex
| Occupation | Male | Female |
| Farming, Fishing & Forestry | 21 (100.0%) | 0 (0.0%) |
| Construction & Extraction | 65 (100.0%) | 0 (0.0%) |
| Installation, Maintenance & Repair | 59 (100.0%) | 0 (0.0%) |
| Total (Category) | 145 (100.0%) | 0 (0.0%) |
| Total (Overall) | 416 (51.7%) | 388 (48.3%) |
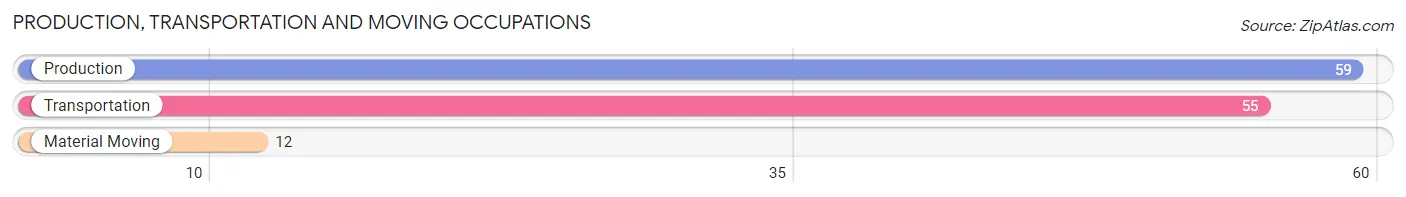
Production, Transportation and Moving Occupations
The most common Production, Transportation and Moving occupations in Anchor Point are Production (59 | 7.3%), Transportation (55 | 6.8%), and Material Moving (12 | 1.5%).
Production, Transportation and Moving Occupations by Sex
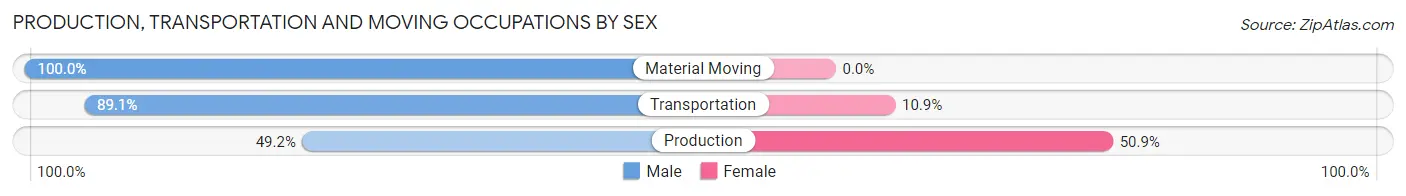
| Occupation | Male | Female |
| Production | 29 (49.1%) | 30 (50.8%) |
| Transportation | 49 (89.1%) | 6 (10.9%) |
| Material Moving | 12 (100.0%) | 0 (0.0%) |
| Total (Category) | 90 (71.4%) | 36 (28.6%) |
| Total (Overall) | 416 (51.7%) | 388 (48.3%) |
Employment Industries by Sex in Anchor Point
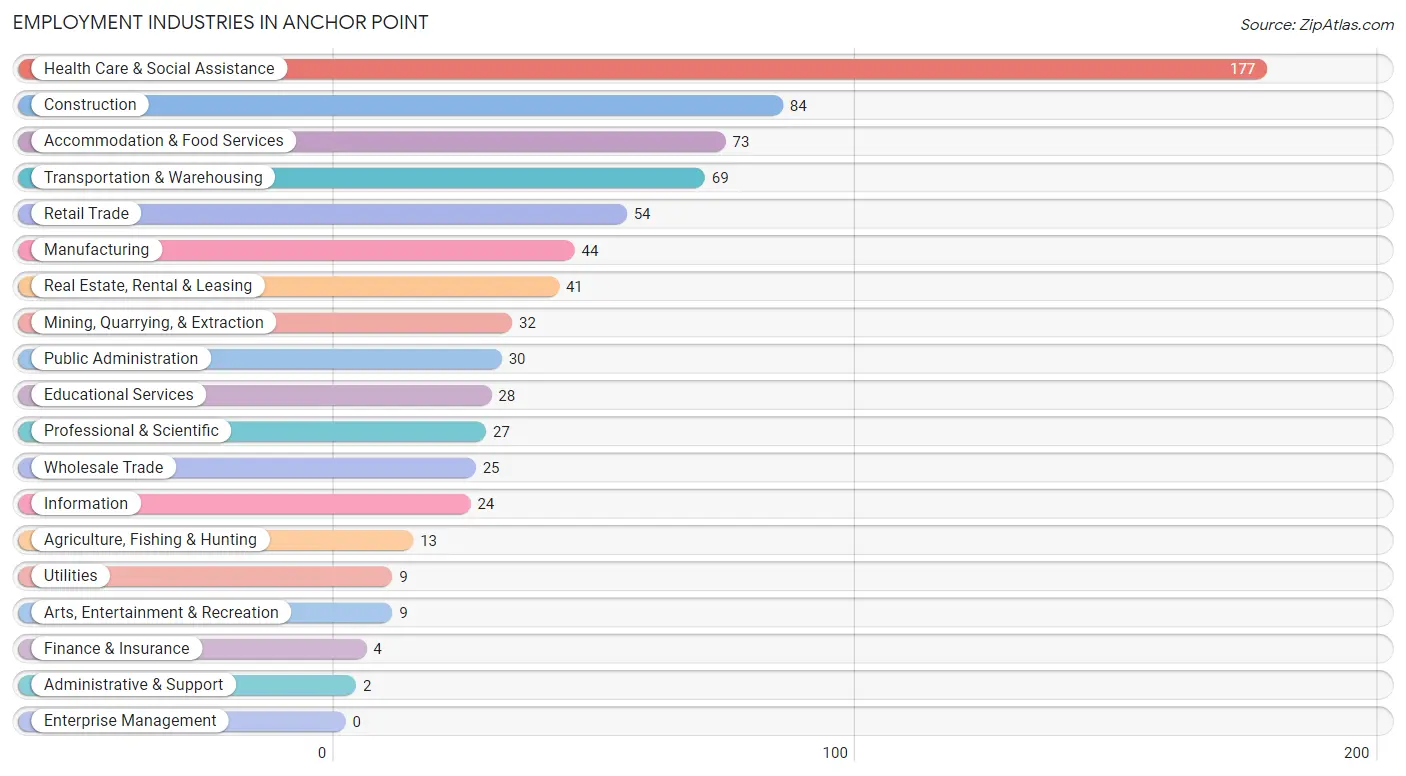
Employment Industries in Anchor Point
The major employment industries in Anchor Point include Health Care & Social Assistance (177 | 22.0%), Construction (84 | 10.4%), Accommodation & Food Services (73 | 9.1%), Transportation & Warehousing (69 | 8.6%), and Retail Trade (54 | 6.7%).
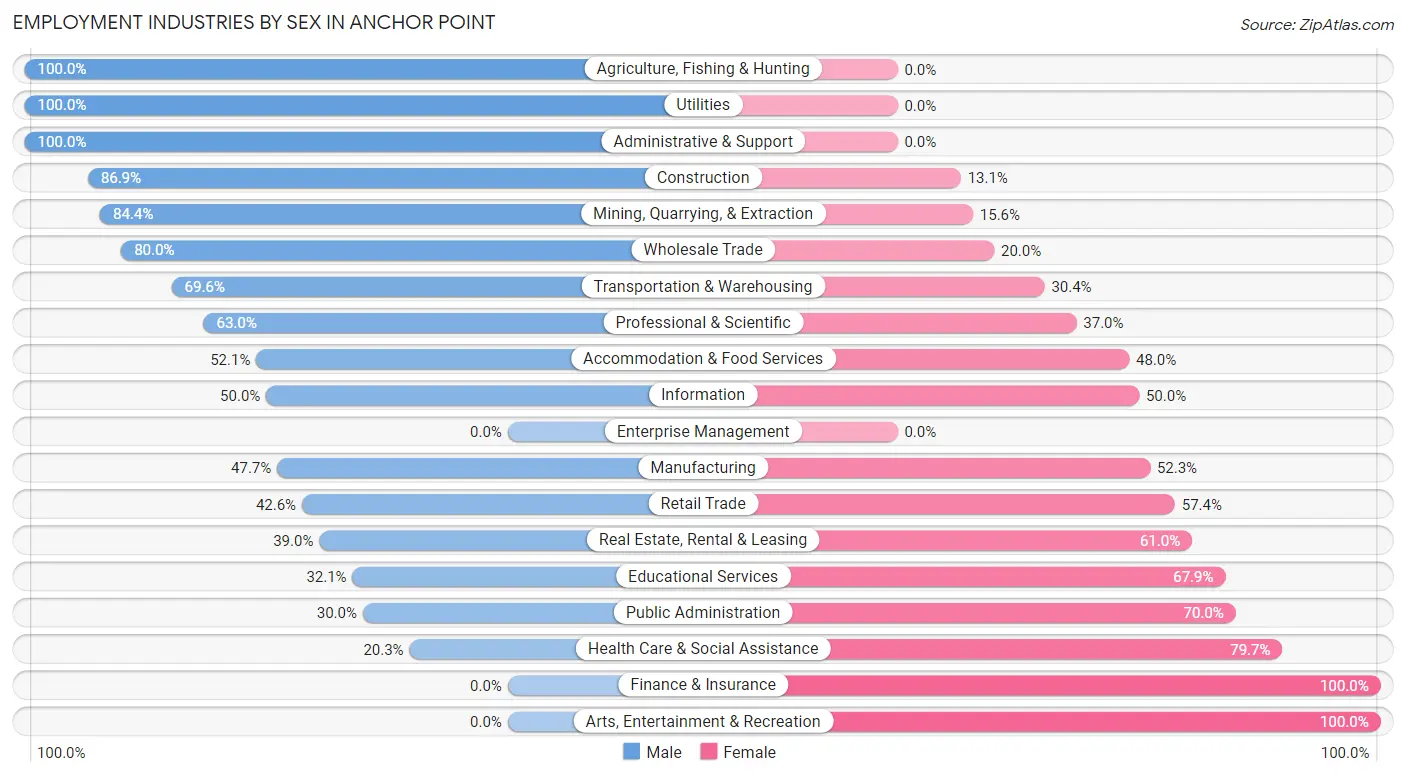
Employment Industries by Sex in Anchor Point
The Anchor Point industries that see more men than women are Agriculture, Fishing & Hunting (100.0%), Utilities (100.0%), and Administrative & Support (100.0%), whereas the industries that tend to have a higher number of women are Finance & Insurance (100.0%), Arts, Entertainment & Recreation (100.0%), and Health Care & Social Assistance (79.7%).
| Industry | Male | Female |
| Agriculture, Fishing & Hunting | 13 (100.0%) | 0 (0.0%) |
| Mining, Quarrying, & Extraction | 27 (84.4%) | 5 (15.6%) |
| Construction | 73 (86.9%) | 11 (13.1%) |
| Manufacturing | 21 (47.7%) | 23 (52.3%) |
| Wholesale Trade | 20 (80.0%) | 5 (20.0%) |
| Retail Trade | 23 (42.6%) | 31 (57.4%) |
| Transportation & Warehousing | 48 (69.6%) | 21 (30.4%) |
| Utilities | 9 (100.0%) | 0 (0.0%) |
| Information | 12 (50.0%) | 12 (50.0%) |
| Finance & Insurance | 0 (0.0%) | 4 (100.0%) |
| Real Estate, Rental & Leasing | 16 (39.0%) | 25 (61.0%) |
| Professional & Scientific | 17 (63.0%) | 10 (37.0%) |
| Enterprise Management | 0 (0.0%) | 0 (0.0%) |
| Administrative & Support | 2 (100.0%) | 0 (0.0%) |
| Educational Services | 9 (32.1%) | 19 (67.9%) |
| Health Care & Social Assistance | 36 (20.3%) | 141 (79.7%) |
| Arts, Entertainment & Recreation | 0 (0.0%) | 9 (100.0%) |
| Accommodation & Food Services | 38 (52.0%) | 35 (47.9%) |
| Public Administration | 9 (30.0%) | 21 (70.0%) |
| Total | 416 (51.7%) | 388 (48.3%) |
Education in Anchor Point
School Enrollment in Anchor Point
The most common levels of schooling among the 418 students in Anchor Point are high school (110 | 26.3%), middle school (96 | 23.0%), and elementary school (94 | 22.5%).

| School Level | # Students | % Students |
| Nursery / Preschool | 31 | 7.4% |
| Kindergarten | 25 | 6.0% |
| Elementary School | 94 | 22.5% |
| Middle School | 96 | 23.0% |
| High School | 110 | 26.3% |
| College / Undergraduate | 37 | 8.8% |
| Graduate / Professional | 25 | 6.0% |
| Total | 418 | 100.0% |
School Enrollment by Age by Funding Source in Anchor Point
Out of a total of 418 students who are enrolled in schools in Anchor Point, 119 (28.5%) attend a private institution, while the remaining 299 (71.5%) are enrolled in public schools. The age group of 20 to 24 year olds has the highest likelihood of being enrolled in private schools, with 7 (100.0% in the age bracket) enrolled. Conversely, the age group of 25 to 34 year olds has the lowest likelihood of being enrolled in a private school, with 36 (100.0% in the age bracket) attending a public institution.
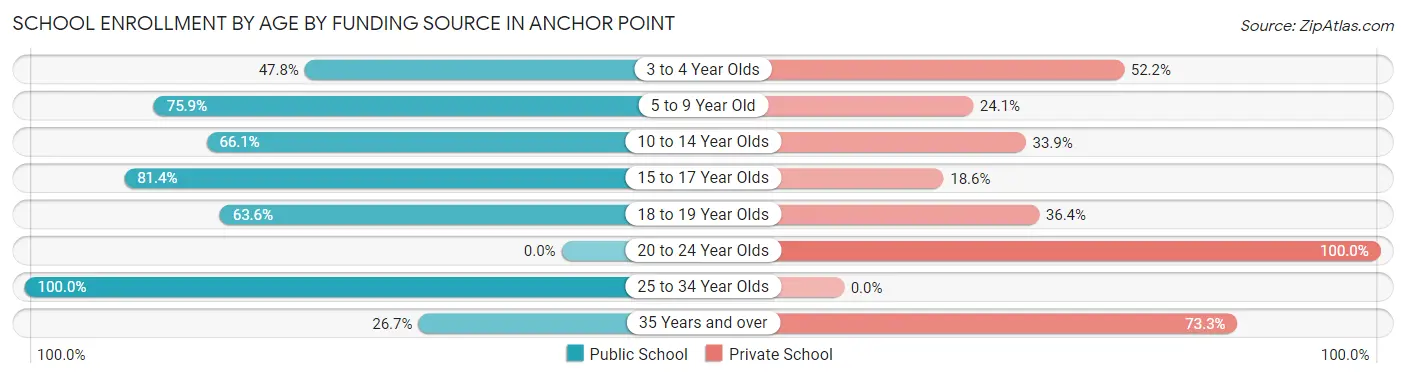
| Age Bracket | Public School | Private School |
| 3 to 4 Year Olds | 11 (47.8%) | 12 (52.2%) |
| 5 to 9 Year Old | 82 (75.9%) | 26 (24.1%) |
| 10 to 14 Year Olds | 80 (66.1%) | 41 (33.9%) |
| 15 to 17 Year Olds | 79 (81.4%) | 18 (18.6%) |
| 18 to 19 Year Olds | 7 (63.6%) | 4 (36.4%) |
| 20 to 24 Year Olds | 0 (0.0%) | 7 (100.0%) |
| 25 to 34 Year Olds | 36 (100.0%) | 0 (0.0%) |
| 35 Years and over | 4 (26.7%) | 11 (73.3%) |
| Total | 299 (71.5%) | 119 (28.5%) |
Educational Attainment by Field of Study in Anchor Point
Education (94 | 27.7%), business (42 | 12.3%), arts & humanities (37 | 10.9%), bio, nature & agricultural (35 | 10.3%), and science & technology (35 | 10.3%) are the most common fields of study among 340 individuals in Anchor Point who have obtained a bachelor's degree or higher.
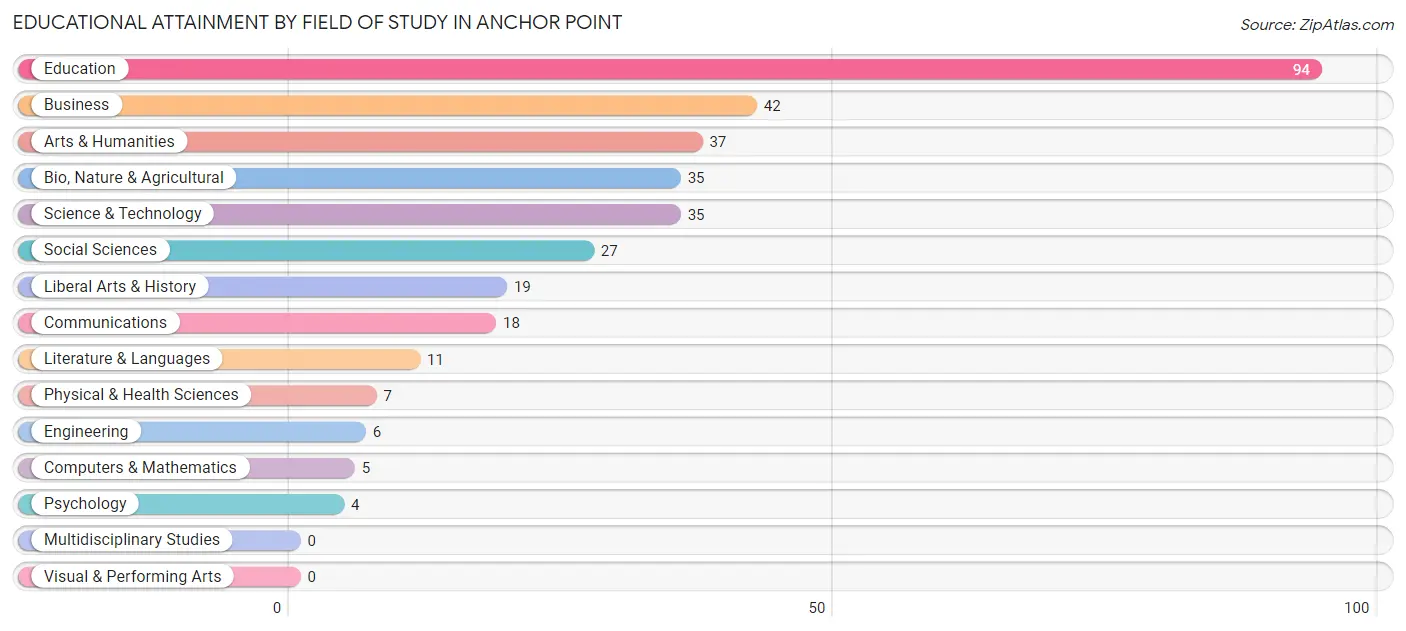
| Field of Study | # Graduates | % Graduates |
| Computers & Mathematics | 5 | 1.5% |
| Bio, Nature & Agricultural | 35 | 10.3% |
| Physical & Health Sciences | 7 | 2.1% |
| Psychology | 4 | 1.2% |
| Social Sciences | 27 | 7.9% |
| Engineering | 6 | 1.8% |
| Multidisciplinary Studies | 0 | 0.0% |
| Science & Technology | 35 | 10.3% |
| Business | 42 | 12.3% |
| Education | 94 | 27.7% |
| Literature & Languages | 11 | 3.2% |
| Liberal Arts & History | 19 | 5.6% |
| Visual & Performing Arts | 0 | 0.0% |
| Communications | 18 | 5.3% |
| Arts & Humanities | 37 | 10.9% |
| Total | 340 | 100.0% |
Transportation & Commute in Anchor Point
Vehicle Availability by Sex in Anchor Point
The most prevalent vehicle ownership categories in Anchor Point are males with 3 vehicles (130, accounting for 33.8%) and females with 3 vehicles (93, making up 35.5%).
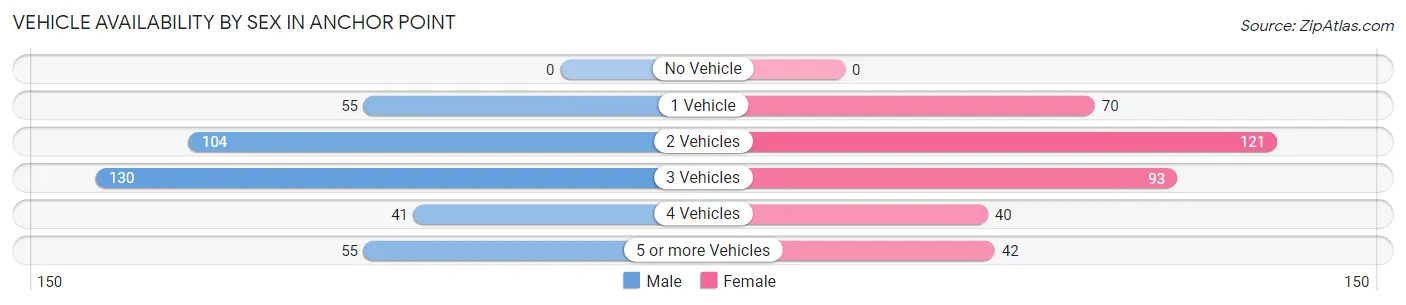
| Vehicles Available | Male | Female |
| No Vehicle | 0 (0.0%) | 0 (0.0%) |
| 1 Vehicle | 55 (14.3%) | 70 (19.1%) |
| 2 Vehicles | 104 (27.0%) | 121 (33.1%) |
| 3 Vehicles | 130 (33.8%) | 93 (25.4%) |
| 4 Vehicles | 41 (10.6%) | 40 (10.9%) |
| 5 or more Vehicles | 55 (14.3%) | 42 (11.5%) |
| Total | 385 (100.0%) | 366 (100.0%) |
Commute Time in Anchor Point
The most frequently occuring commute durations in Anchor Point are 30 to 34 minutes (132 commuters, 19.8%), 20 to 24 minutes (114 commuters, 17.1%), and 25 to 29 minutes (80 commuters, 12.0%).
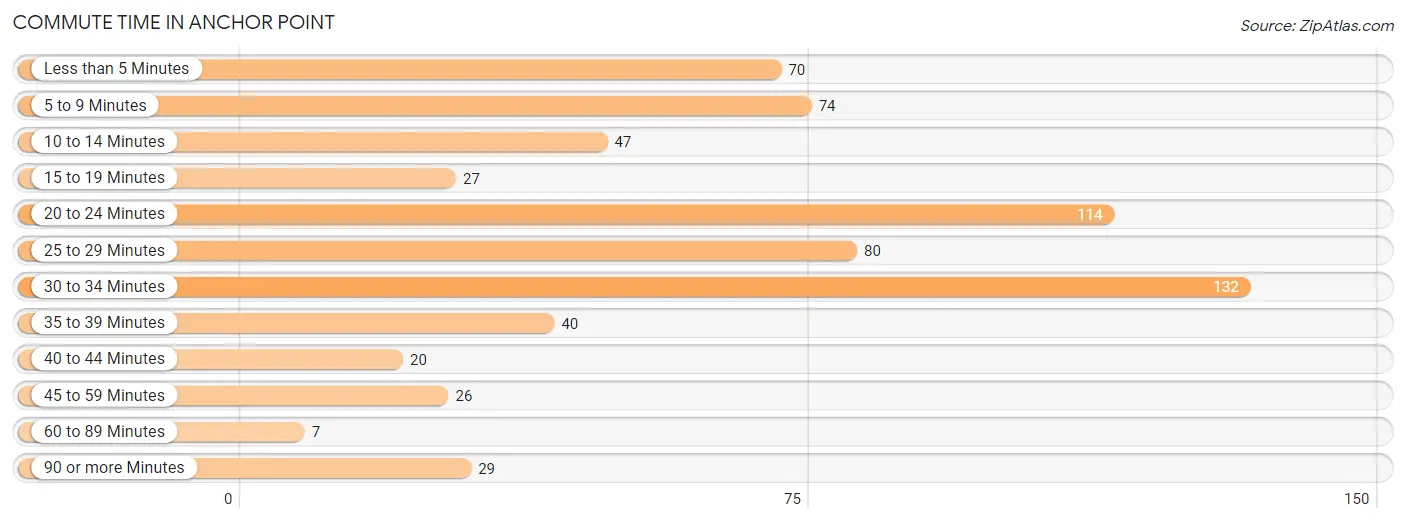
| Commute Time | # Commuters | % Commuters |
| Less than 5 Minutes | 70 | 10.5% |
| 5 to 9 Minutes | 74 | 11.1% |
| 10 to 14 Minutes | 47 | 7.1% |
| 15 to 19 Minutes | 27 | 4.1% |
| 20 to 24 Minutes | 114 | 17.1% |
| 25 to 29 Minutes | 80 | 12.0% |
| 30 to 34 Minutes | 132 | 19.8% |
| 35 to 39 Minutes | 40 | 6.0% |
| 40 to 44 Minutes | 20 | 3.0% |
| 45 to 59 Minutes | 26 | 3.9% |
| 60 to 89 Minutes | 7 | 1.1% |
| 90 or more Minutes | 29 | 4.3% |
Commute Time by Sex in Anchor Point
The most common commute times in Anchor Point are 5 to 9 minutes (54 commuters, 15.8%) for males and 30 to 34 minutes (82 commuters, 25.2%) for females.
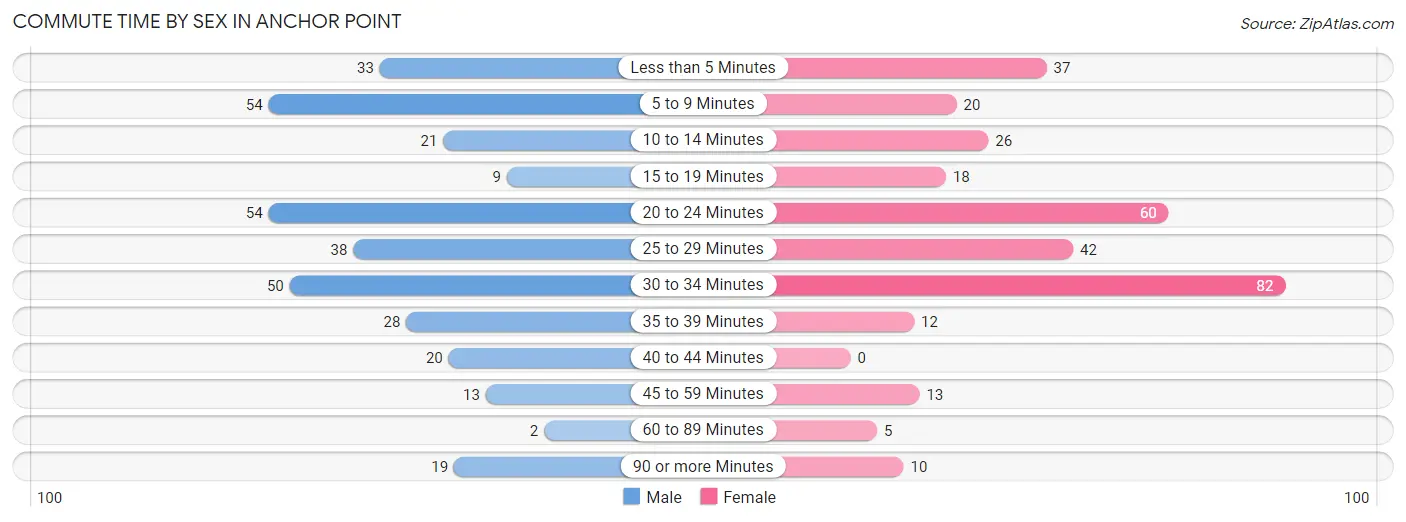
| Commute Time | Male | Female |
| Less than 5 Minutes | 33 (9.7%) | 37 (11.4%) |
| 5 to 9 Minutes | 54 (15.8%) | 20 (6.1%) |
| 10 to 14 Minutes | 21 (6.2%) | 26 (8.0%) |
| 15 to 19 Minutes | 9 (2.6%) | 18 (5.5%) |
| 20 to 24 Minutes | 54 (15.8%) | 60 (18.5%) |
| 25 to 29 Minutes | 38 (11.1%) | 42 (12.9%) |
| 30 to 34 Minutes | 50 (14.7%) | 82 (25.2%) |
| 35 to 39 Minutes | 28 (8.2%) | 12 (3.7%) |
| 40 to 44 Minutes | 20 (5.9%) | 0 (0.0%) |
| 45 to 59 Minutes | 13 (3.8%) | 13 (4.0%) |
| 60 to 89 Minutes | 2 (0.6%) | 5 (1.5%) |
| 90 or more Minutes | 19 (5.6%) | 10 (3.1%) |
Time of Departure to Work by Sex in Anchor Point
The most frequent times of departure to work in Anchor Point are 7:00 AM to 7:29 AM (65, 19.1%) for males and 9:00 AM to 9:59 AM (50, 15.4%) for females.
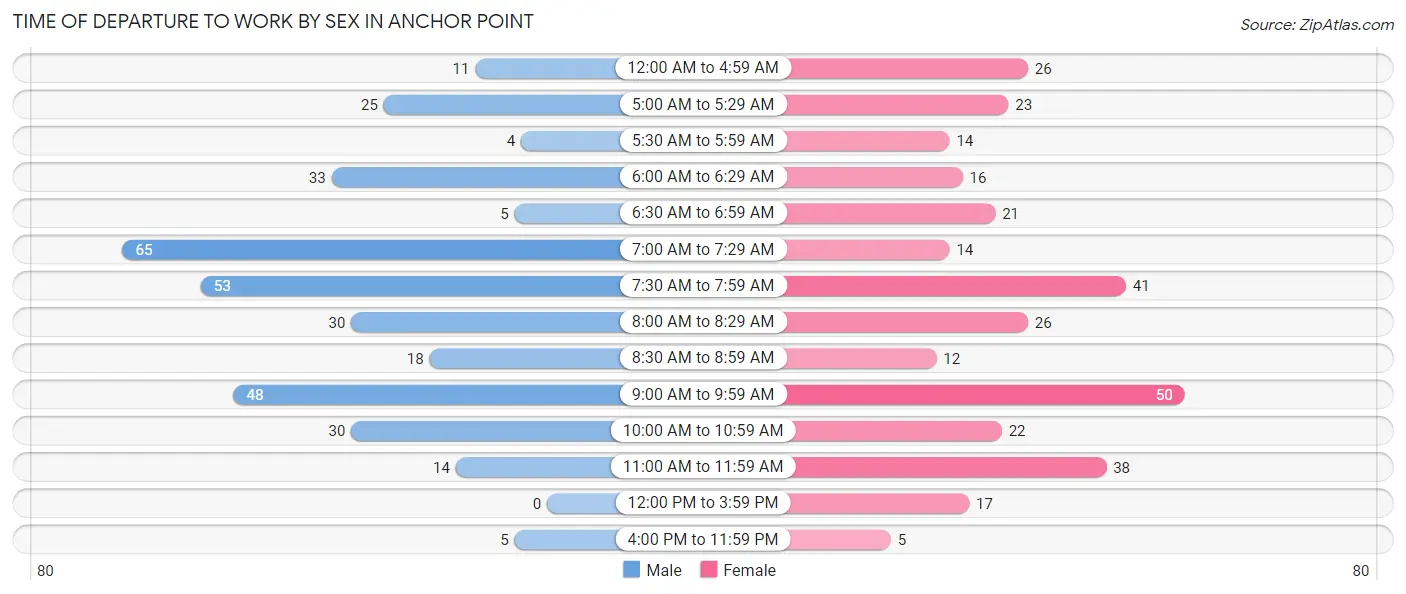
| Time of Departure | Male | Female |
| 12:00 AM to 4:59 AM | 11 (3.2%) | 26 (8.0%) |
| 5:00 AM to 5:29 AM | 25 (7.3%) | 23 (7.1%) |
| 5:30 AM to 5:59 AM | 4 (1.2%) | 14 (4.3%) |
| 6:00 AM to 6:29 AM | 33 (9.7%) | 16 (4.9%) |
| 6:30 AM to 6:59 AM | 5 (1.5%) | 21 (6.5%) |
| 7:00 AM to 7:29 AM | 65 (19.1%) | 14 (4.3%) |
| 7:30 AM to 7:59 AM | 53 (15.5%) | 41 (12.6%) |
| 8:00 AM to 8:29 AM | 30 (8.8%) | 26 (8.0%) |
| 8:30 AM to 8:59 AM | 18 (5.3%) | 12 (3.7%) |
| 9:00 AM to 9:59 AM | 48 (14.1%) | 50 (15.4%) |
| 10:00 AM to 10:59 AM | 30 (8.8%) | 22 (6.8%) |
| 11:00 AM to 11:59 AM | 14 (4.1%) | 38 (11.7%) |
| 12:00 PM to 3:59 PM | 0 (0.0%) | 17 (5.2%) |
| 4:00 PM to 11:59 PM | 5 (1.5%) | 5 (1.5%) |
| Total | 341 (100.0%) | 325 (100.0%) |
Housing Occupancy in Anchor Point
Occupancy by Ownership in Anchor Point
Of the total 972 dwellings in Anchor Point, owner-occupied units account for 799 (82.2%), while renter-occupied units make up 173 (17.8%).
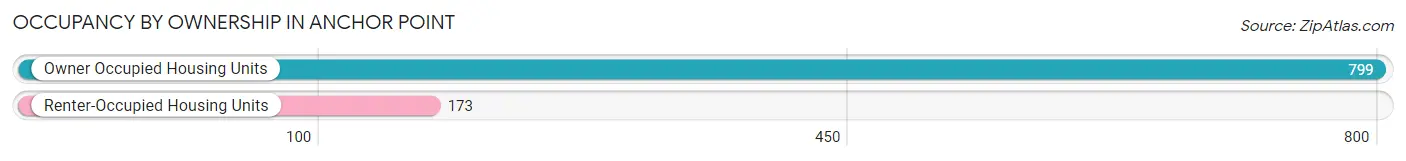
| Occupancy | # Housing Units | % Housing Units |
| Owner Occupied Housing Units | 799 | 82.2% |
| Renter-Occupied Housing Units | 173 | 17.8% |
| Total Occupied Housing Units | 972 | 100.0% |
Occupancy by Household Size in Anchor Point
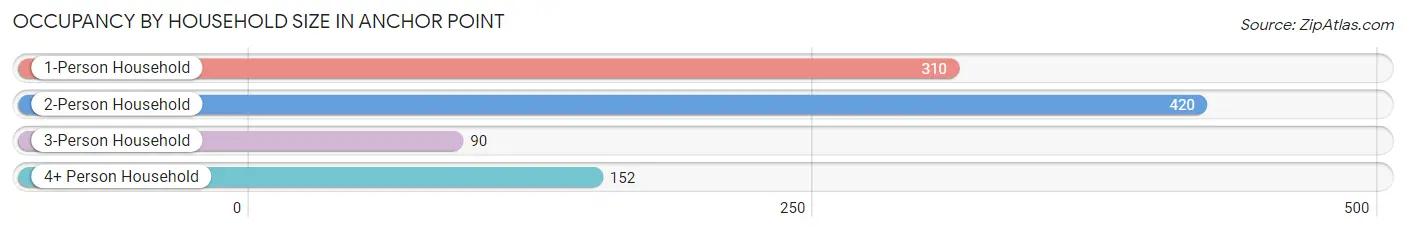
| Household Size | # Housing Units | % Housing Units |
| 1-Person Household | 310 | 31.9% |
| 2-Person Household | 420 | 43.2% |
| 3-Person Household | 90 | 9.3% |
| 4+ Person Household | 152 | 15.6% |
| Total Housing Units | 972 | 100.0% |
Occupancy by Ownership by Household Size in Anchor Point
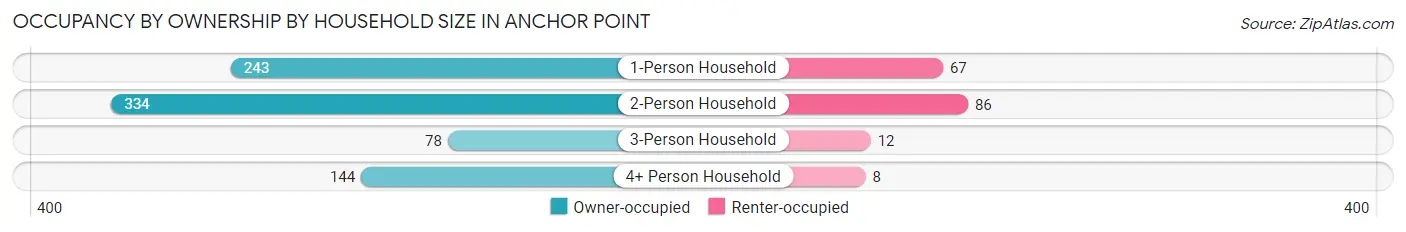
| Household Size | Owner-occupied | Renter-occupied |
| 1-Person Household | 243 (78.4%) | 67 (21.6%) |
| 2-Person Household | 334 (79.5%) | 86 (20.5%) |
| 3-Person Household | 78 (86.7%) | 12 (13.3%) |
| 4+ Person Household | 144 (94.7%) | 8 (5.3%) |
| Total Housing Units | 799 (82.2%) | 173 (17.8%) |
Occupancy by Educational Attainment in Anchor Point
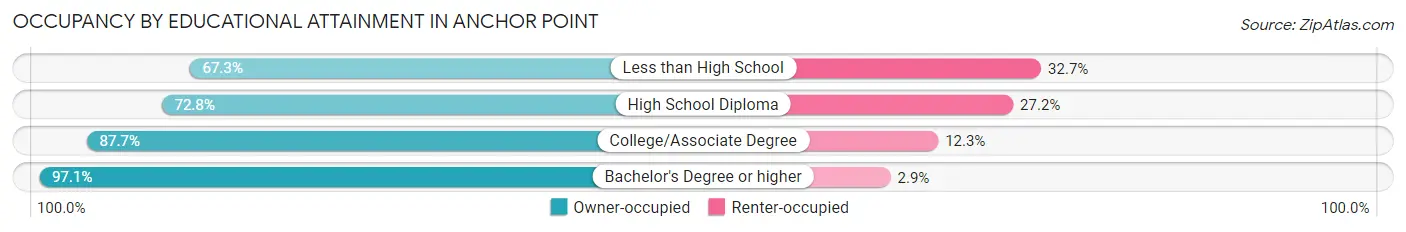
| Household Size | Owner-occupied | Renter-occupied |
| Less than High School | 72 (67.3%) | 35 (32.7%) |
| High School Diploma | 236 (72.8%) | 88 (27.2%) |
| College/Associate Degree | 321 (87.7%) | 45 (12.3%) |
| Bachelor's Degree or higher | 170 (97.1%) | 5 (2.9%) |
Occupancy by Age of Householder in Anchor Point
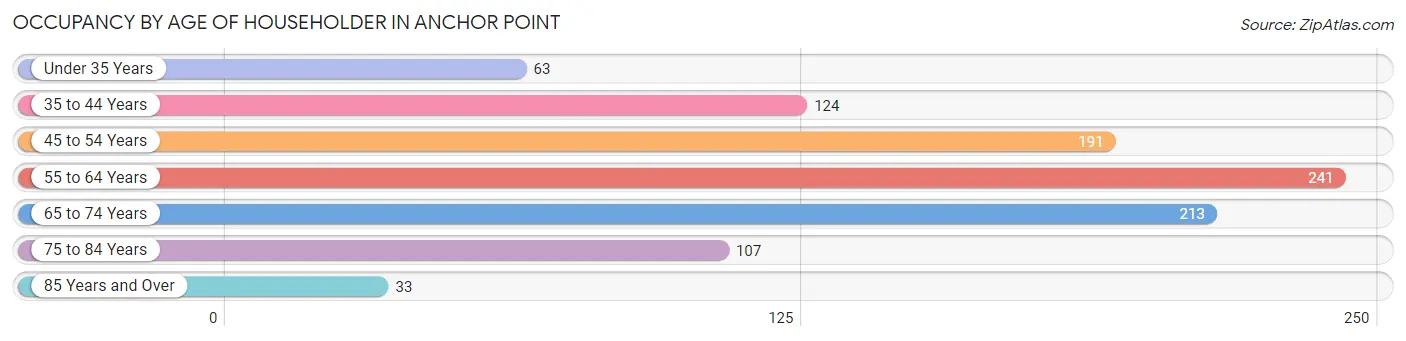
| Age Bracket | # Households | % Households |
| Under 35 Years | 63 | 6.5% |
| 35 to 44 Years | 124 | 12.8% |
| 45 to 54 Years | 191 | 19.7% |
| 55 to 64 Years | 241 | 24.8% |
| 65 to 74 Years | 213 | 21.9% |
| 75 to 84 Years | 107 | 11.0% |
| 85 Years and Over | 33 | 3.4% |
| Total | 972 | 100.0% |
Housing Finances in Anchor Point
Median Income by Occupancy in Anchor Point
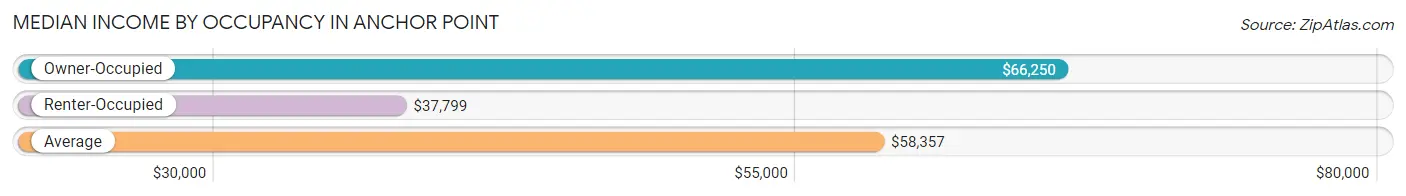
| Occupancy Type | # Households | Median Income |
| Owner-Occupied | 799 (82.2%) | $66,250 |
| Renter-Occupied | 173 (17.8%) | $37,799 |
| Average | 972 (100.0%) | $58,357 |
Occupancy by Householder Income Bracket in Anchor Point

| Income Bracket | Owner-occupied | Renter-occupied |
| Less than $5,000 | 47 (5.9%) | 9 (5.2%) |
| $5,000 to $9,999 | 17 (2.1%) | 0 (0.0%) |
| $10,000 to $14,999 | 13 (1.6%) | 23 (13.3%) |
| $15,000 to $19,999 | 16 (2.0%) | 9 (5.2%) |
| $20,000 to $24,999 | 37 (4.6%) | 5 (2.9%) |
| $25,000 to $34,999 | 72 (9.0%) | 28 (16.2%) |
| $35,000 to $49,999 | 80 (10.0%) | 58 (33.5%) |
| $50,000 to $74,999 | 139 (17.4%) | 28 (16.2%) |
| $75,000 to $99,999 | 102 (12.8%) | 8 (4.6%) |
| $100,000 to $149,999 | 132 (16.5%) | 5 (2.9%) |
| $150,000 or more | 144 (18.0%) | 0 (0.0%) |
| Total | 799 (100.0%) | 173 (100.0%) |
Monthly Housing Cost Tiers in Anchor Point
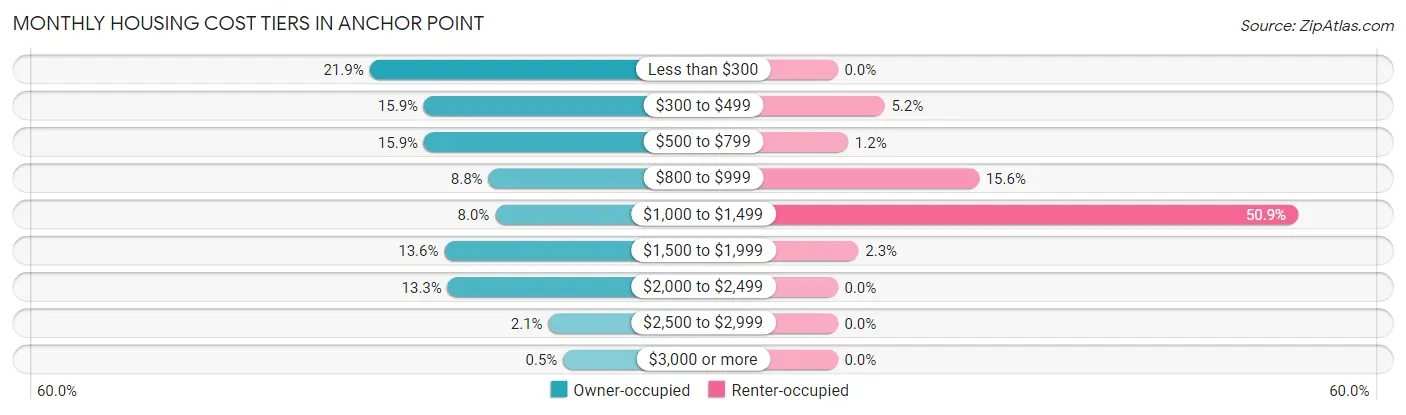
| Monthly Cost | Owner-occupied | Renter-occupied |
| Less than $300 | 175 (21.9%) | 0 (0.0%) |
| $300 to $499 | 127 (15.9%) | 9 (5.2%) |
| $500 to $799 | 127 (15.9%) | 2 (1.2%) |
| $800 to $999 | 70 (8.8%) | 27 (15.6%) |
| $1,000 to $1,499 | 64 (8.0%) | 88 (50.9%) |
| $1,500 to $1,999 | 109 (13.6%) | 4 (2.3%) |
| $2,000 to $2,499 | 106 (13.3%) | 0 (0.0%) |
| $2,500 to $2,999 | 17 (2.1%) | 0 (0.0%) |
| $3,000 or more | 4 (0.5%) | 0 (0.0%) |
| Total | 799 (100.0%) | 173 (100.0%) |
Physical Housing Characteristics in Anchor Point
Housing Structures in Anchor Point
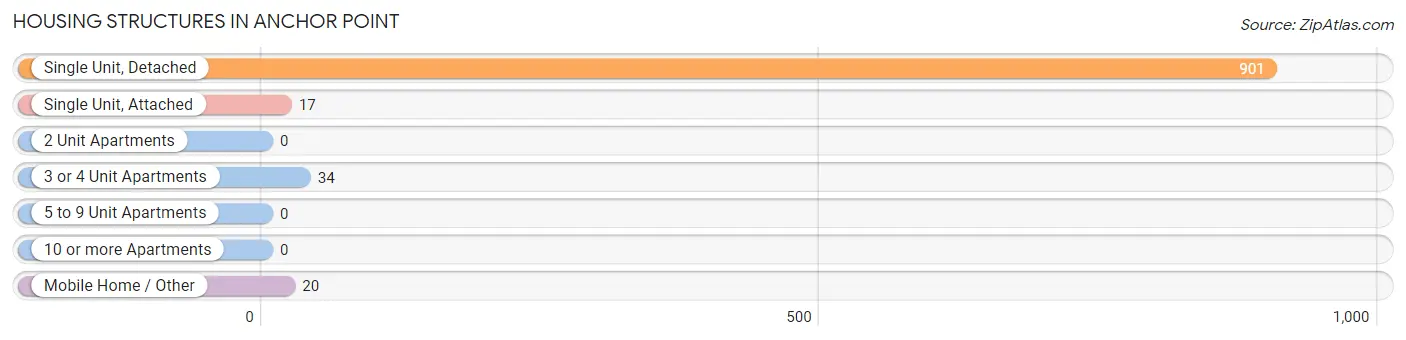
| Structure Type | # Housing Units | % Housing Units |
| Single Unit, Detached | 901 | 92.7% |
| Single Unit, Attached | 17 | 1.8% |
| 2 Unit Apartments | 0 | 0.0% |
| 3 or 4 Unit Apartments | 34 | 3.5% |
| 5 to 9 Unit Apartments | 0 | 0.0% |
| 10 or more Apartments | 0 | 0.0% |
| Mobile Home / Other | 20 | 2.1% |
| Total | 972 | 100.0% |
Housing Structures by Occupancy in Anchor Point
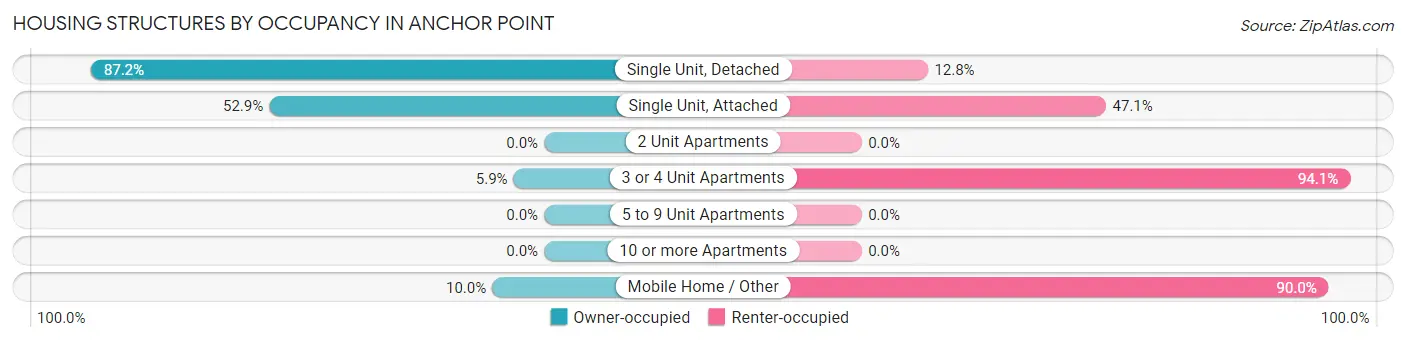
| Structure Type | Owner-occupied | Renter-occupied |
| Single Unit, Detached | 786 (87.2%) | 115 (12.8%) |
| Single Unit, Attached | 9 (52.9%) | 8 (47.1%) |
| 2 Unit Apartments | 0 (0.0%) | 0 (0.0%) |
| 3 or 4 Unit Apartments | 2 (5.9%) | 32 (94.1%) |
| 5 to 9 Unit Apartments | 0 (0.0%) | 0 (0.0%) |
| 10 or more Apartments | 0 (0.0%) | 0 (0.0%) |
| Mobile Home / Other | 2 (10.0%) | 18 (90.0%) |
| Total | 799 (82.2%) | 173 (17.8%) |
Housing Structures by Number of Rooms in Anchor Point
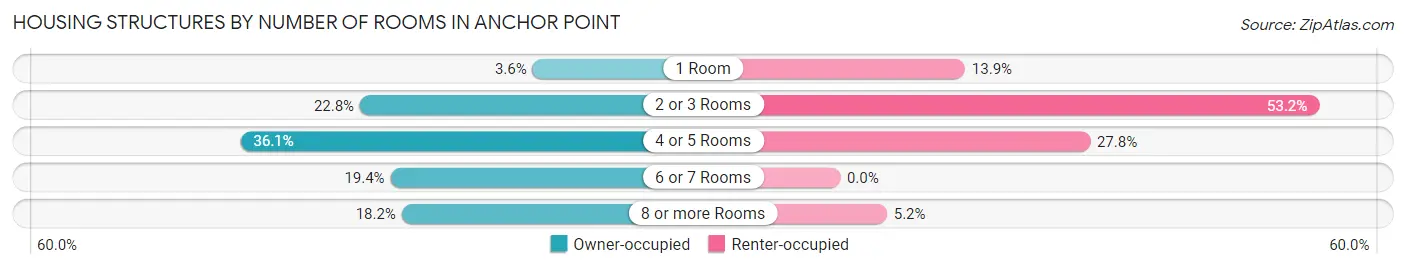
| Number of Rooms | Owner-occupied | Renter-occupied |
| 1 Room | 29 (3.6%) | 24 (13.9%) |
| 2 or 3 Rooms | 182 (22.8%) | 92 (53.2%) |
| 4 or 5 Rooms | 288 (36.0%) | 48 (27.8%) |
| 6 or 7 Rooms | 155 (19.4%) | 0 (0.0%) |
| 8 or more Rooms | 145 (18.1%) | 9 (5.2%) |
| Total | 799 (100.0%) | 173 (100.0%) |
Housing Structure by Heating Type in Anchor Point
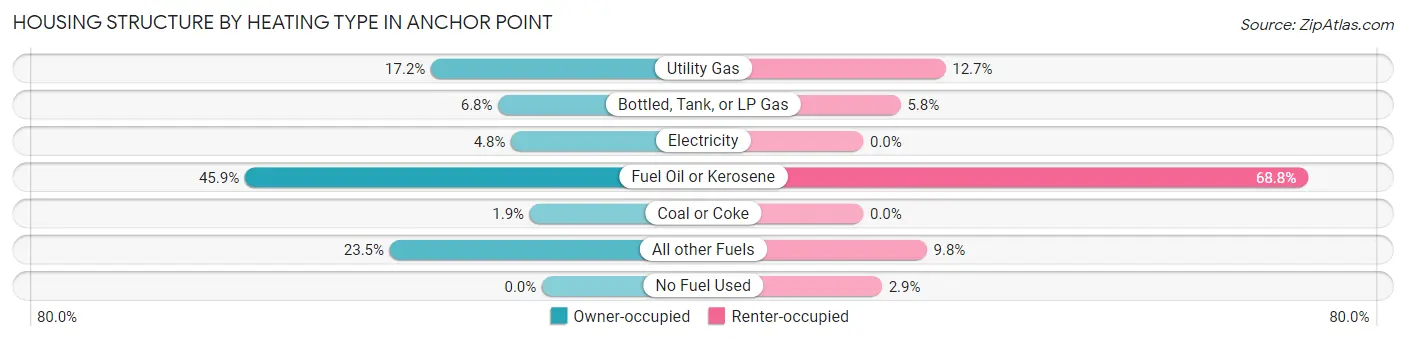
| Heating Type | Owner-occupied | Renter-occupied |
| Utility Gas | 137 (17.2%) | 22 (12.7%) |
| Bottled, Tank, or LP Gas | 54 (6.8%) | 10 (5.8%) |
| Electricity | 38 (4.8%) | 0 (0.0%) |
| Fuel Oil or Kerosene | 367 (45.9%) | 119 (68.8%) |
| Coal or Coke | 15 (1.9%) | 0 (0.0%) |
| All other Fuels | 188 (23.5%) | 17 (9.8%) |
| No Fuel Used | 0 (0.0%) | 5 (2.9%) |
| Total | 799 (100.0%) | 173 (100.0%) |
Household Vehicle Usage in Anchor Point
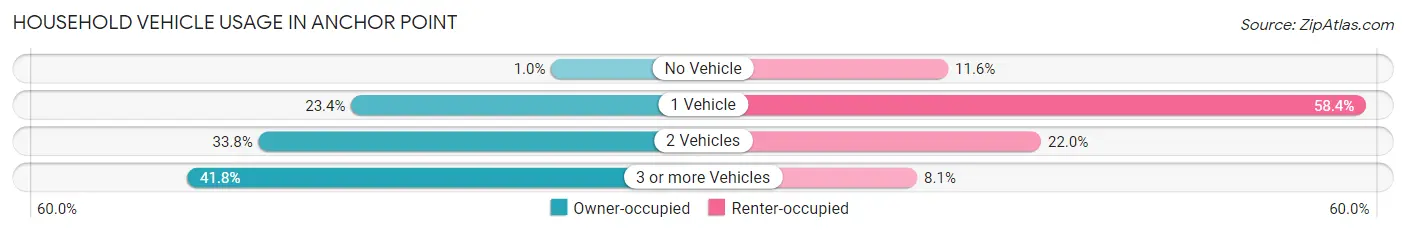
| Vehicles per Household | Owner-occupied | Renter-occupied |
| No Vehicle | 8 (1.0%) | 20 (11.6%) |
| 1 Vehicle | 187 (23.4%) | 101 (58.4%) |
| 2 Vehicles | 270 (33.8%) | 38 (22.0%) |
| 3 or more Vehicles | 334 (41.8%) | 14 (8.1%) |
| Total | 799 (100.0%) | 173 (100.0%) |
Real Estate & Mortgages in Anchor Point
Real Estate and Mortgage Overview in Anchor Point
| Characteristic | Without Mortgage | With Mortgage |
| Housing Units | 470 | 329 |
| Median Property Value | $169,200 | $279,300 |
| Median Household Income | $55,192 | $116 |
| Monthly Housing Costs | $357 | $4 |
| Real Estate Taxes | $1,065 | $74 |
Property Value by Mortgage Status in Anchor Point
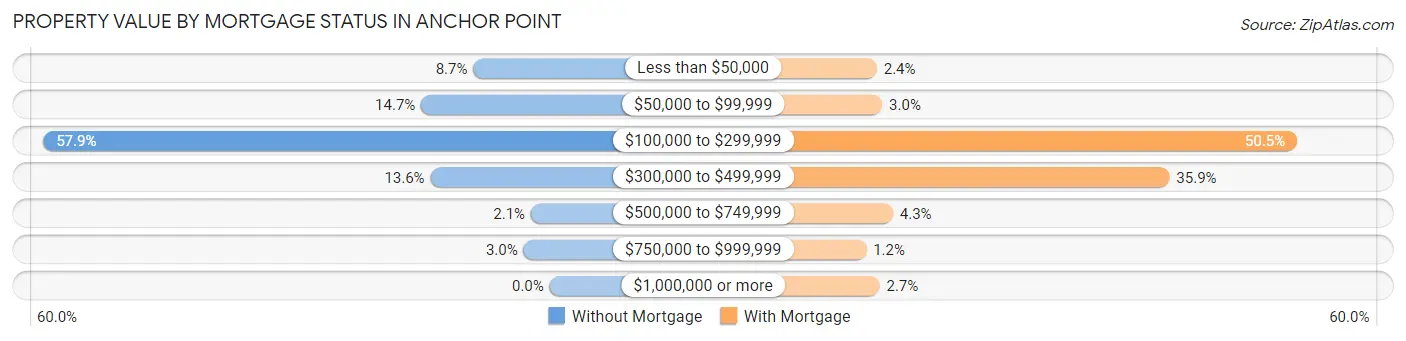
| Property Value | Without Mortgage | With Mortgage |
| Less than $50,000 | 41 (8.7%) | 8 (2.4%) |
| $50,000 to $99,999 | 69 (14.7%) | 10 (3.0%) |
| $100,000 to $299,999 | 272 (57.9%) | 166 (50.5%) |
| $300,000 to $499,999 | 64 (13.6%) | 118 (35.9%) |
| $500,000 to $749,999 | 10 (2.1%) | 14 (4.3%) |
| $750,000 to $999,999 | 14 (3.0%) | 4 (1.2%) |
| $1,000,000 or more | 0 (0.0%) | 9 (2.7%) |
| Total | 470 (100.0%) | 329 (100.0%) |
Household Income by Mortgage Status in Anchor Point
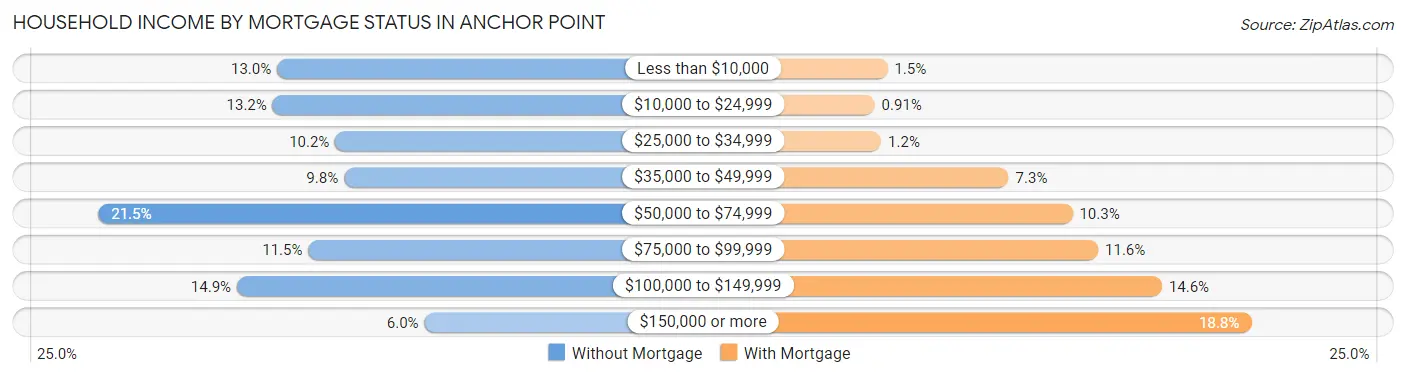
| Household Income | Without Mortgage | With Mortgage |
| Less than $10,000 | 61 (13.0%) | 5 (1.5%) |
| $10,000 to $24,999 | 62 (13.2%) | 3 (0.9%) |
| $25,000 to $34,999 | 48 (10.2%) | 4 (1.2%) |
| $35,000 to $49,999 | 46 (9.8%) | 24 (7.3%) |
| $50,000 to $74,999 | 101 (21.5%) | 34 (10.3%) |
| $75,000 to $99,999 | 54 (11.5%) | 38 (11.6%) |
| $100,000 to $149,999 | 70 (14.9%) | 48 (14.6%) |
| $150,000 or more | 28 (6.0%) | 62 (18.8%) |
| Total | 470 (100.0%) | 329 (100.0%) |
Property Value to Household Income Ratio in Anchor Point
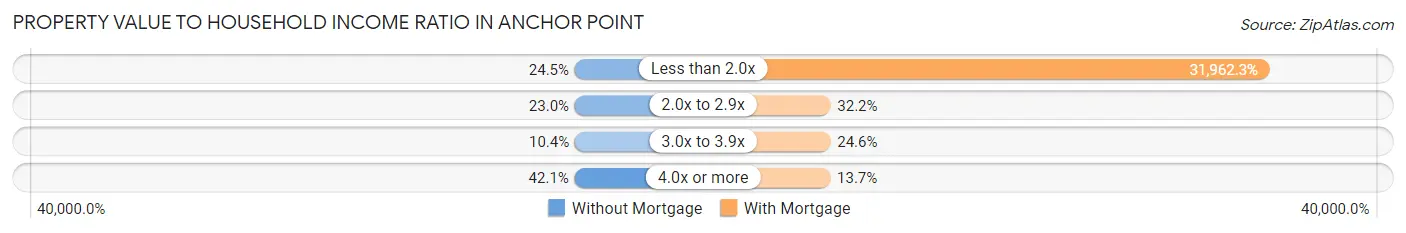
| Value-to-Income Ratio | Without Mortgage | With Mortgage |
| Less than 2.0x | 115 (24.5%) | 105,156 (31,962.3%) |
| 2.0x to 2.9x | 108 (23.0%) | 106 (32.2%) |
| 3.0x to 3.9x | 49 (10.4%) | 81 (24.6%) |
| 4.0x or more | 198 (42.1%) | 45 (13.7%) |
| Total | 470 (100.0%) | 329 (100.0%) |
Real Estate Taxes by Mortgage Status in Anchor Point
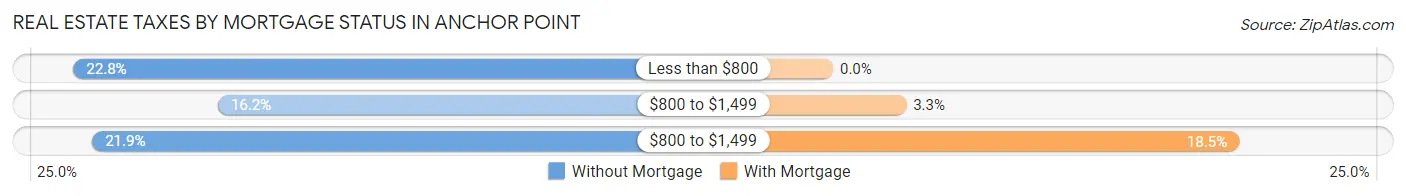
| Property Taxes | Without Mortgage | With Mortgage |
| Less than $800 | 107 (22.8%) | 0 (0.0%) |
| $800 to $1,499 | 76 (16.2%) | 11 (3.3%) |
| $800 to $1,499 | 103 (21.9%) | 61 (18.5%) |
| Total | 470 (100.0%) | 329 (100.0%) |
Health & Disability in Anchor Point
Health Insurance Coverage by Age in Anchor Point
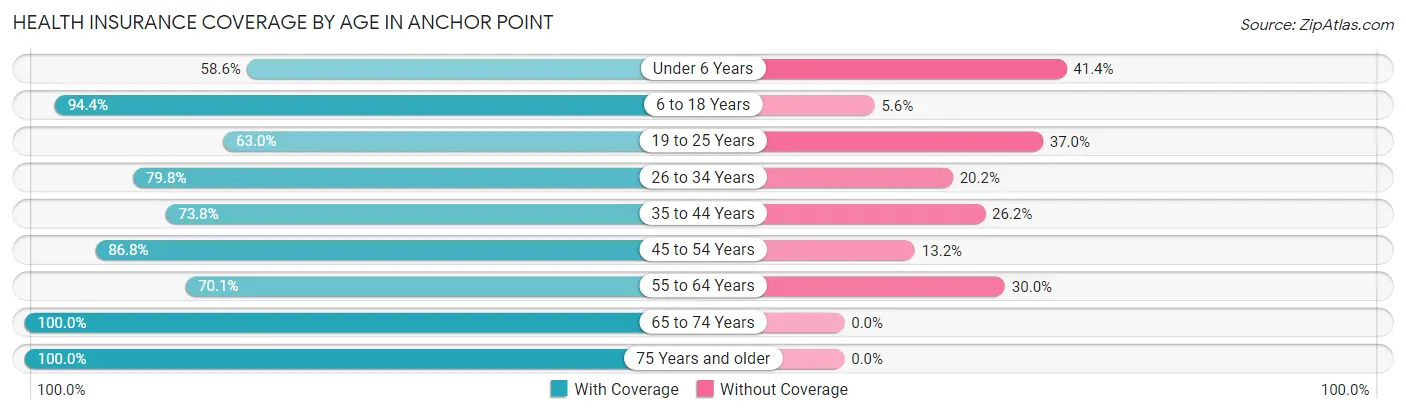
| Age Bracket | With Coverage | Without Coverage |
| Under 6 Years | 58 (58.6%) | 41 (41.4%) |
| 6 to 18 Years | 302 (94.4%) | 18 (5.6%) |
| 19 to 25 Years | 80 (63.0%) | 47 (37.0%) |
| 26 to 34 Years | 142 (79.8%) | 36 (20.2%) |
| 35 to 44 Years | 163 (73.8%) | 58 (26.2%) |
| 45 to 54 Years | 277 (86.8%) | 42 (13.2%) |
| 55 to 64 Years | 283 (70.1%) | 121 (29.9%) |
| 65 to 74 Years | 385 (100.0%) | 0 (0.0%) |
| 75 Years and older | 200 (100.0%) | 0 (0.0%) |
| Total | 1,890 (83.9%) | 363 (16.1%) |
Health Insurance Coverage by Citizenship Status in Anchor Point
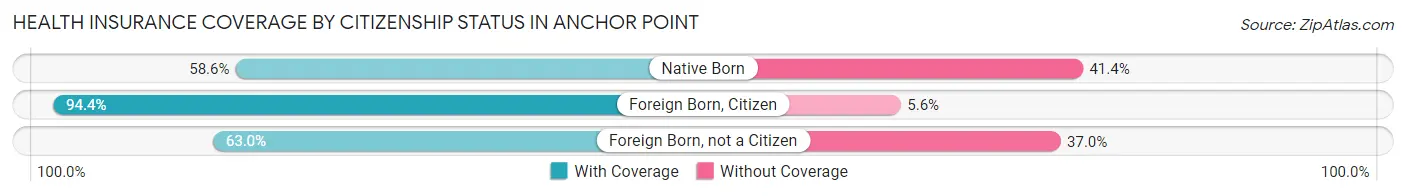
| Citizenship Status | With Coverage | Without Coverage |
| Native Born | 58 (58.6%) | 41 (41.4%) |
| Foreign Born, Citizen | 302 (94.4%) | 18 (5.6%) |
| Foreign Born, not a Citizen | 80 (63.0%) | 47 (37.0%) |
Health Insurance Coverage by Household Income in Anchor Point
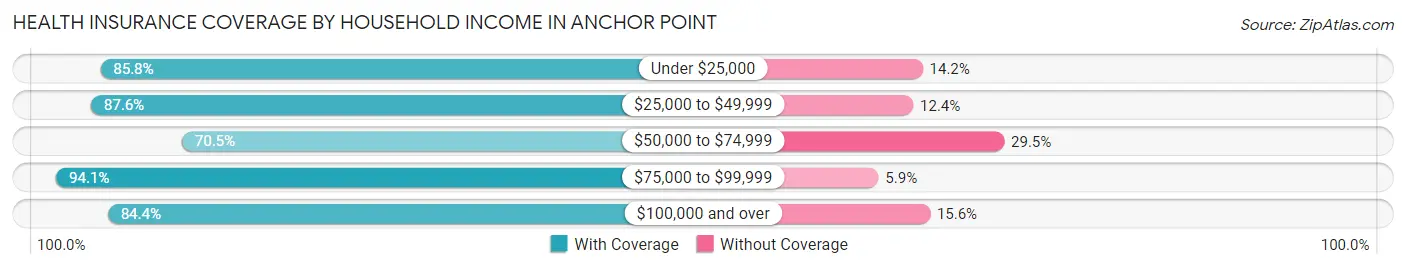
| Household Income | With Coverage | Without Coverage |
| Under $25,000 | 272 (85.8%) | 45 (14.2%) |
| $25,000 to $49,999 | 324 (87.6%) | 46 (12.4%) |
| $50,000 to $74,999 | 292 (70.5%) | 122 (29.5%) |
| $75,000 to $99,999 | 286 (94.1%) | 18 (5.9%) |
| $100,000 and over | 715 (84.4%) | 132 (15.6%) |
Public vs Private Health Insurance Coverage by Age in Anchor Point
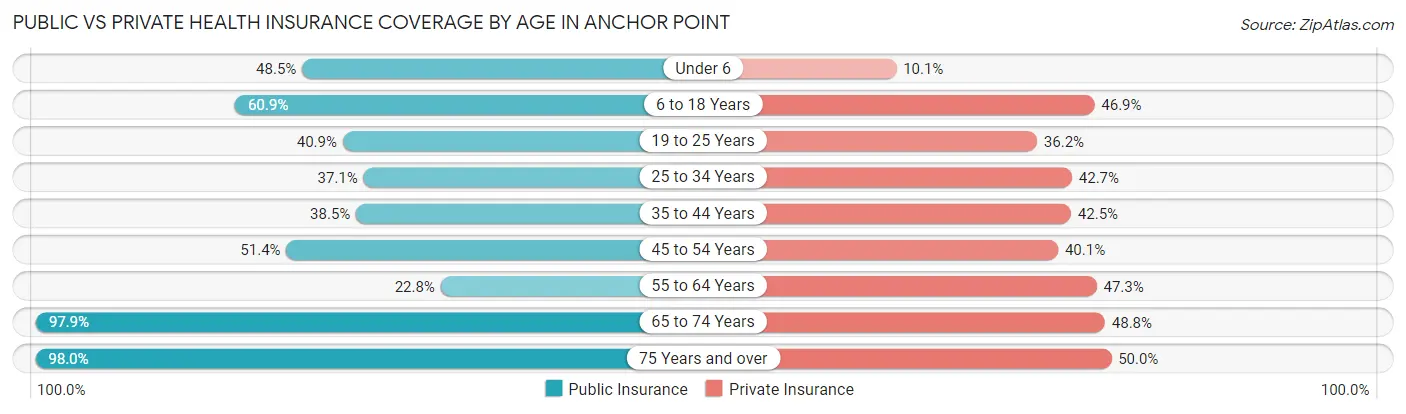
| Age Bracket | Public Insurance | Private Insurance |
| Under 6 | 48 (48.5%) | 10 (10.1%) |
| 6 to 18 Years | 195 (60.9%) | 150 (46.9%) |
| 19 to 25 Years | 52 (40.9%) | 46 (36.2%) |
| 25 to 34 Years | 66 (37.1%) | 76 (42.7%) |
| 35 to 44 Years | 85 (38.5%) | 94 (42.5%) |
| 45 to 54 Years | 164 (51.4%) | 128 (40.1%) |
| 55 to 64 Years | 92 (22.8%) | 191 (47.3%) |
| 65 to 74 Years | 377 (97.9%) | 188 (48.8%) |
| 75 Years and over | 196 (98.0%) | 100 (50.0%) |
| Total | 1,275 (56.6%) | 983 (43.6%) |
Disability Status by Sex by Age in Anchor Point
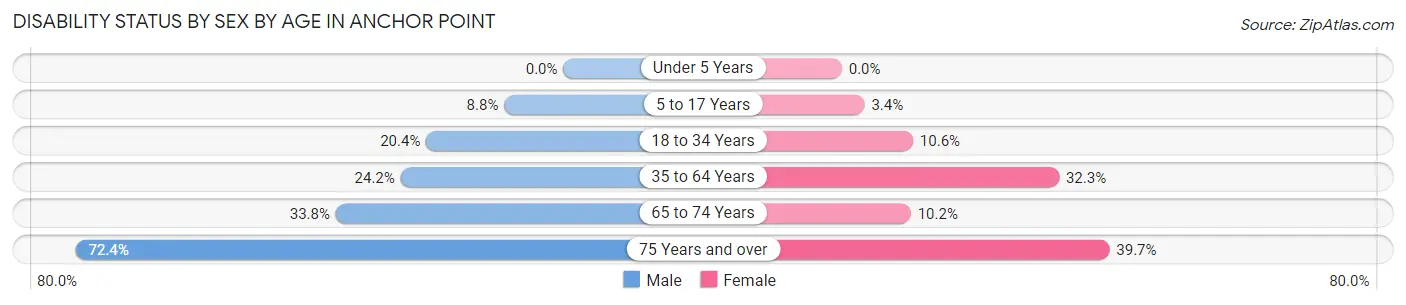
| Age Bracket | Male | Female |
| Under 5 Years | 0 (0.0%) | 0 (0.0%) |
| 5 to 17 Years | 13 (8.8%) | 6 (3.4%) |
| 18 to 34 Years | 34 (20.4%) | 17 (10.6%) |
| 35 to 64 Years | 124 (24.2%) | 139 (32.3%) |
| 65 to 74 Years | 74 (33.8%) | 17 (10.2%) |
| 75 Years and over | 92 (72.4%) | 29 (39.7%) |
Disability Class by Sex by Age in Anchor Point
Disability Class: Hearing Difficulty
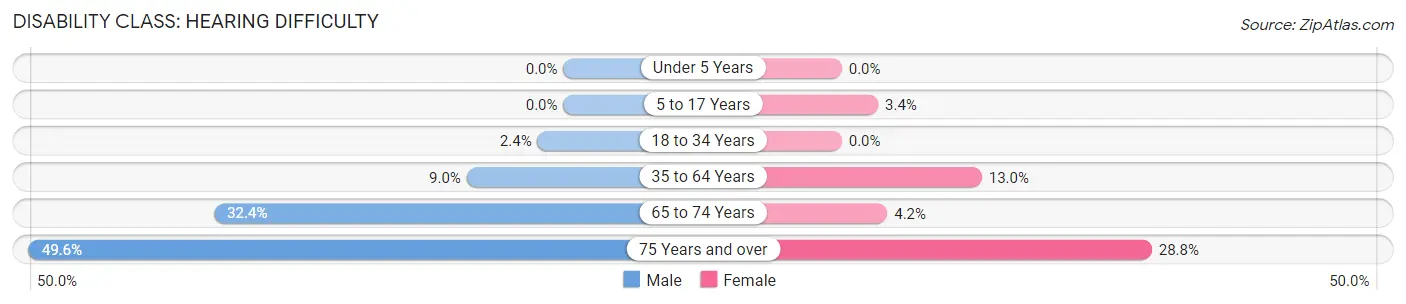
| Age Bracket | Male | Female |
| Under 5 Years | 0 (0.0%) | 0 (0.0%) |
| 5 to 17 Years | 0 (0.0%) | 6 (3.4%) |
| 18 to 34 Years | 4 (2.4%) | 0 (0.0%) |
| 35 to 64 Years | 46 (9.0%) | 56 (13.0%) |
| 65 to 74 Years | 71 (32.4%) | 7 (4.2%) |
| 75 Years and over | 63 (49.6%) | 21 (28.8%) |
Disability Class: Vision Difficulty
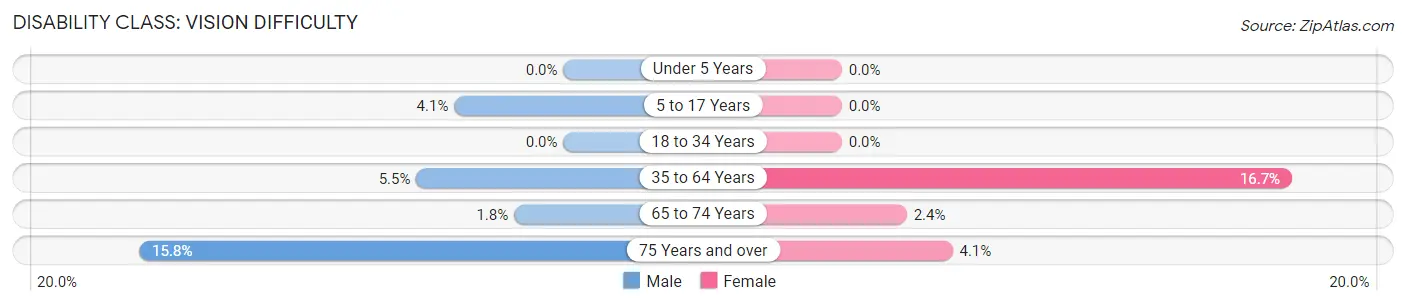
| Age Bracket | Male | Female |
| Under 5 Years | 0 (0.0%) | 0 (0.0%) |
| 5 to 17 Years | 6 (4.1%) | 0 (0.0%) |
| 18 to 34 Years | 0 (0.0%) | 0 (0.0%) |
| 35 to 64 Years | 28 (5.5%) | 72 (16.7%) |
| 65 to 74 Years | 4 (1.8%) | 4 (2.4%) |
| 75 Years and over | 20 (15.8%) | 3 (4.1%) |
Disability Class: Cognitive Difficulty
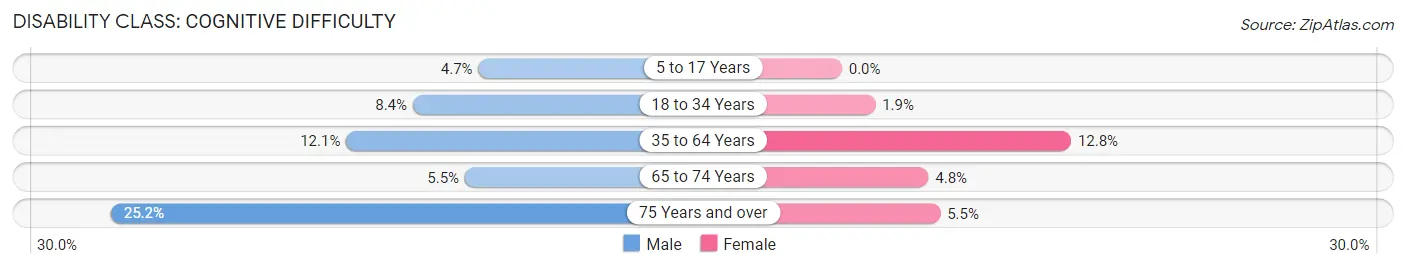
| Age Bracket | Male | Female |
| 5 to 17 Years | 7 (4.7%) | 0 (0.0%) |
| 18 to 34 Years | 14 (8.4%) | 3 (1.9%) |
| 35 to 64 Years | 62 (12.1%) | 55 (12.8%) |
| 65 to 74 Years | 12 (5.5%) | 8 (4.8%) |
| 75 Years and over | 32 (25.2%) | 4 (5.5%) |
Disability Class: Ambulatory Difficulty
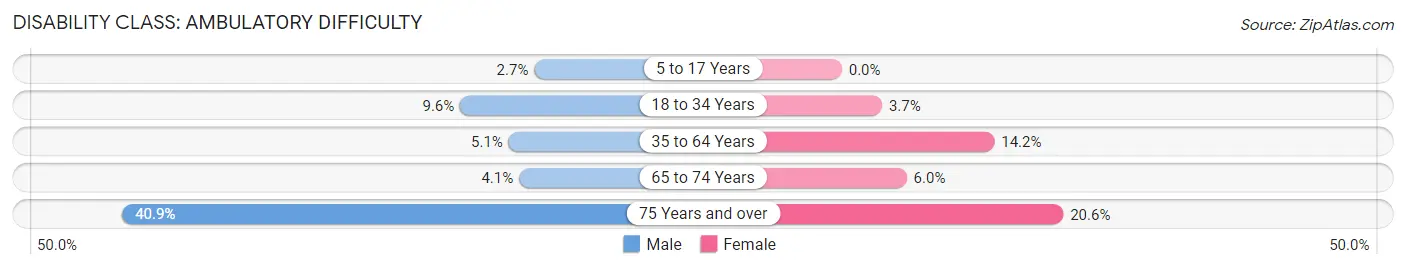
| Age Bracket | Male | Female |
| 5 to 17 Years | 4 (2.7%) | 0 (0.0%) |
| 18 to 34 Years | 16 (9.6%) | 6 (3.7%) |
| 35 to 64 Years | 26 (5.1%) | 61 (14.1%) |
| 65 to 74 Years | 9 (4.1%) | 10 (6.0%) |
| 75 Years and over | 52 (40.9%) | 15 (20.5%) |
Disability Class: Self-Care Difficulty
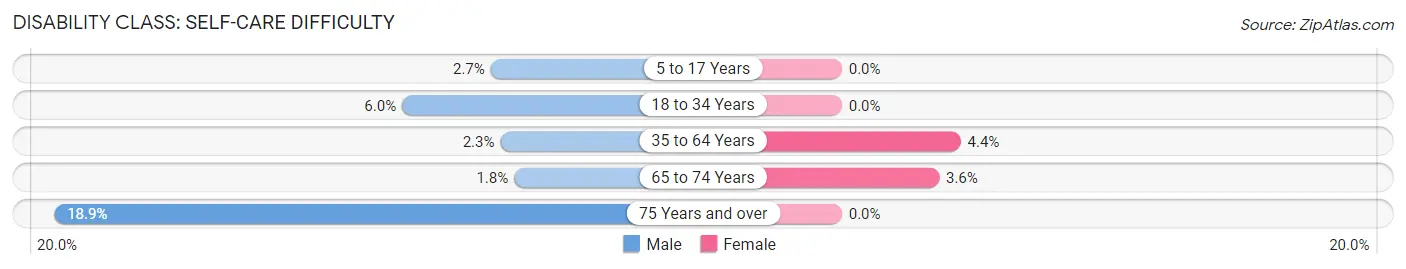
| Age Bracket | Male | Female |
| 5 to 17 Years | 4 (2.7%) | 0 (0.0%) |
| 18 to 34 Years | 10 (6.0%) | 0 (0.0%) |
| 35 to 64 Years | 12 (2.3%) | 19 (4.4%) |
| 65 to 74 Years | 4 (1.8%) | 6 (3.6%) |
| 75 Years and over | 24 (18.9%) | 0 (0.0%) |
Technology Access in Anchor Point
Computing Device Access in Anchor Point
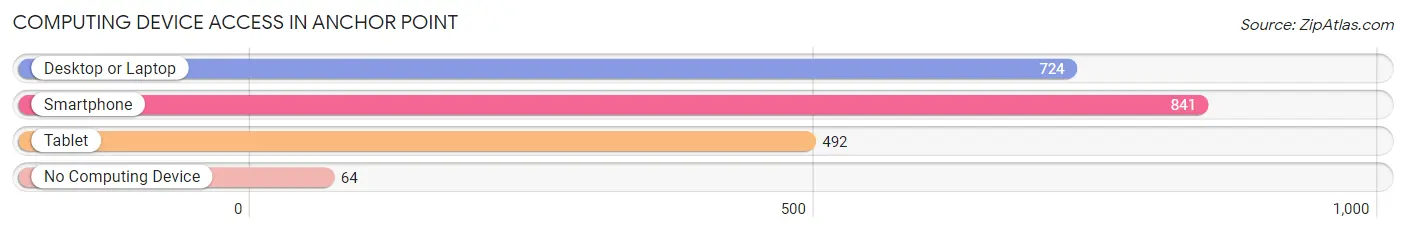
| Device Type | # Households | % Households |
| Desktop or Laptop | 724 | 74.5% |
| Smartphone | 841 | 86.5% |
| Tablet | 492 | 50.6% |
| No Computing Device | 64 | 6.6% |
| Total | 972 | 100.0% |
Internet Access in Anchor Point
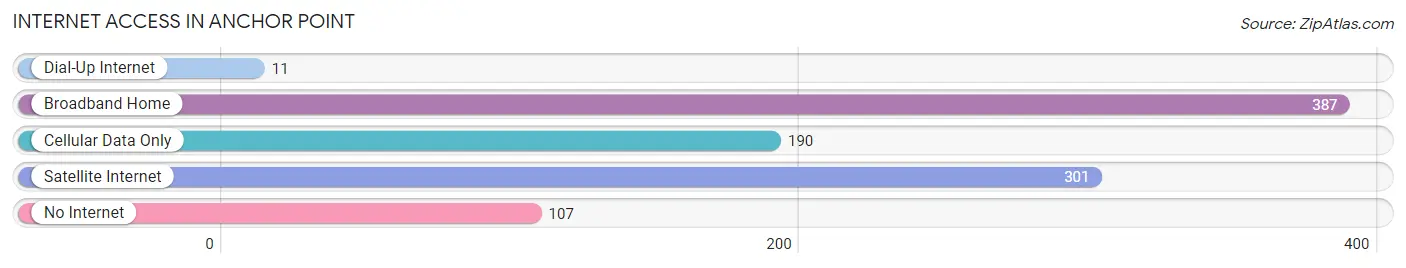
| Internet Type | # Households | % Households |
| Dial-Up Internet | 11 | 1.1% |
| Broadband Home | 387 | 39.8% |
| Cellular Data Only | 190 | 19.6% |
| Satellite Internet | 301 | 31.0% |
| No Internet | 107 | 11.0% |
| Total | 972 | 100.0% |
Anchor Point Summary
Anchor Point is a census-designated place (CDP) located in the Kenai Peninsula Borough in the U.S. state of Alaska. It is situated on the western side of the Kenai Peninsula, approximately 20 miles (32 km) northwest of Homer. As of the 2010 census, the population of Anchor Point was 1,930.
History
The area now known as Anchor Point was first inhabited by the Dena’ina people, who lived in the area for thousands of years before the arrival of Europeans. The first Europeans to settle in the area were Russian fur traders, who arrived in the late 18th century. The area was later settled by American homesteaders in the late 19th century.
The town of Anchor Point was officially established in the early 1900s, when the Alaska Railroad was built through the area. The town was named after the nearby Anchor Point, a rocky promontory that juts out into the Cook Inlet.
Geography
Anchor Point is located at 59°45′N 151°37′W (59.75, -151.62). It is situated on the western side of the Kenai Peninsula, approximately 20 miles (32 km) northwest of Homer. The town is located on the shores of Cook Inlet, and is surrounded by mountains and forests.
The climate of Anchor Point is mild and temperate, with cool summers and mild winters. The average annual temperature is 41°F (5°C). The average annual precipitation is 33 inches (84 cm).
Economy
The economy of Anchor Point is largely based on fishing, tourism, and timber. The town is home to several commercial fishing operations, and is a popular destination for sport fishing. The timber industry is also important to the local economy, with several sawmills located in the area.
Tourism is also an important part of the local economy. The town is a popular destination for outdoor recreation, such as fishing, hunting, and camping. The nearby Anchor River State Recreation Area is a popular destination for visitors.
Demographics
As of the 2010 census, there were 1,930 people, 790 households, and 517 families residing in Anchor Point. The population density was 28.3 people per square mile (10.9/km2). The racial makeup of the CDP was 92.2% White, 0.3% African American, 1.2% Native American, 0.7% Asian, 0.1% Pacific Islander, 0.7% from other races, and 4.9% from two or more races. Hispanic or Latino of any race were 3.2% of the population.
The median income for a household in the CDP was $45,000, and the median income for a family was $50,000. Males had a median income of $41,000 versus $30,000 for females. The per capita income for the CDP was $20,000. About 8.2% of families and 11.2% of the population were below the poverty line, including 16.2% of those under age 18 and none of those age 65 or over.
Common Questions
What is Per Capita Income in Anchor Point?
Per Capita income in Anchor Point is $34,845.
What is the Median Family Income in Anchor Point?
Median Family Income in Anchor Point is $81,161.
What is the Median Household income in Anchor Point?
Median Household Income in Anchor Point is $58,357.
What is Income or Wage Gap in Anchor Point?
Income or Wage Gap in Anchor Point is 29.1%.
Women in Anchor Point earn 70.9 cents for every dollar earned by a man.
What is Family Income Deficit in Anchor Point?
Family Income Deficit in Anchor Point is $10,681.
Families that are below poverty line in Anchor Point earn $10,681 less on average than the poverty threshold level.
What is Inequality or Gini Index in Anchor Point?
Inequality or Gini Index in Anchor Point is 0.46.
What is the Total Population of Anchor Point?
Total Population of Anchor Point is 2,260.
What is the Total Male Population of Anchor Point?
Total Male Population of Anchor Point is 1,224.
What is the Total Female Population of Anchor Point?
Total Female Population of Anchor Point is 1,036.
What is the Ratio of Males per 100 Females in Anchor Point?
There are 118.15 Males per 100 Females in Anchor Point.
What is the Ratio of Females per 100 Males in Anchor Point?
There are 84.64 Females per 100 Males in Anchor Point.
What is the Median Population Age in Anchor Point?
Median Population Age in Anchor Point is 51.2 Years.
What is the Average Family Size in Anchor Point
Average Family Size in Anchor Point is 3.0 People.
What is the Average Household Size in Anchor Point
Average Household Size in Anchor Point is 2.3 People.
How Large is the Labor Force in Anchor Point?
There are 905 People in the Labor Forcein in Anchor Point.
What is the Percentage of People in the Labor Force in Anchor Point?
47.3% of People are in the Labor Force in Anchor Point.
What is the Unemployment Rate in Anchor Point?
Unemployment Rate in Anchor Point is 10.5%.