Anaktuvuk Pass, AK Map & Demographics
Anaktuvuk Pass Map
Anaktuvuk Pass Overview
$19,882
PER CAPITA INCOME
$69,444
AVG FAMILY INCOME
$69,028
AVG HOUSEHOLD INCOME
55.8%
WAGE / INCOME GAP [ % ]
44.2¢/ $1
WAGE / INCOME GAP [ $ ]
0.41
INEQUALITY / GINI INDEX
222
TOTAL POPULATION
135
MALE POPULATION
87
FEMALE POPULATION
155.17
MALES / 100 FEMALES
64.44
FEMALES / 100 MALES
24.0
MEDIAN AGE
3.4
AVG FAMILY SIZE
3.3
AVG HOUSEHOLD SIZE
73
LABOR FORCE [ PEOPLE ]
55.3%
PERCENT IN LABOR FORCE
18.6%
UNEMPLOYMENT RATE
Anaktuvuk Pass Zip Codes
Anaktuvuk Pass Area Codes
Income in Anaktuvuk Pass
Income Overview in Anaktuvuk Pass
Per Capita Income in Anaktuvuk Pass is $19,882, while median incomes of families and households are $69,444 and $69,028 respectively.
| Characteristic | Number | Measure |
| Per Capita Income | 222 | $19,882 |
| Median Family Income | 58 | $69,444 |
| Mean Family Income | 58 | $74,491 |
| Median Household Income | 67 | $69,028 |
| Mean Household Income | 67 | $84,996 |
| Income Deficit | 58 | $0 |
| Wage / Income Gap (%) | 222 | 55.76% |
| Wage / Income Gap ($) | 222 | 44.24¢ per $1 |
| Gini / Inequality Index | 222 | 0.41 |
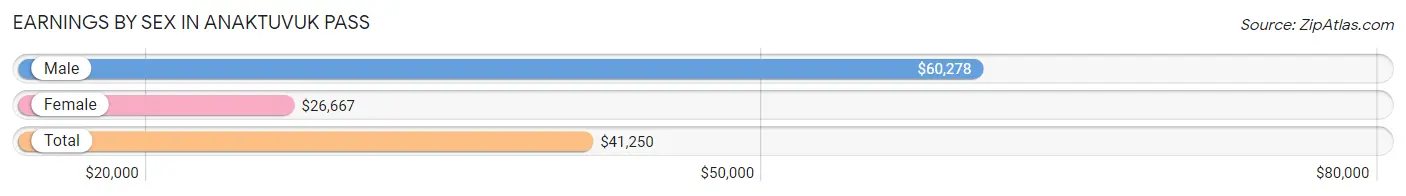
Earnings by Sex in Anaktuvuk Pass
Average Earnings in Anaktuvuk Pass are $41,250, $60,278 for men and $26,667 for women, a difference of 55.8%.
| Sex | Number | Average Earnings |
| Male | 48 (66.7%) | $60,278 |
| Female | 24 (33.3%) | $26,667 |
| Total | 72 (100.0%) | $41,250 |
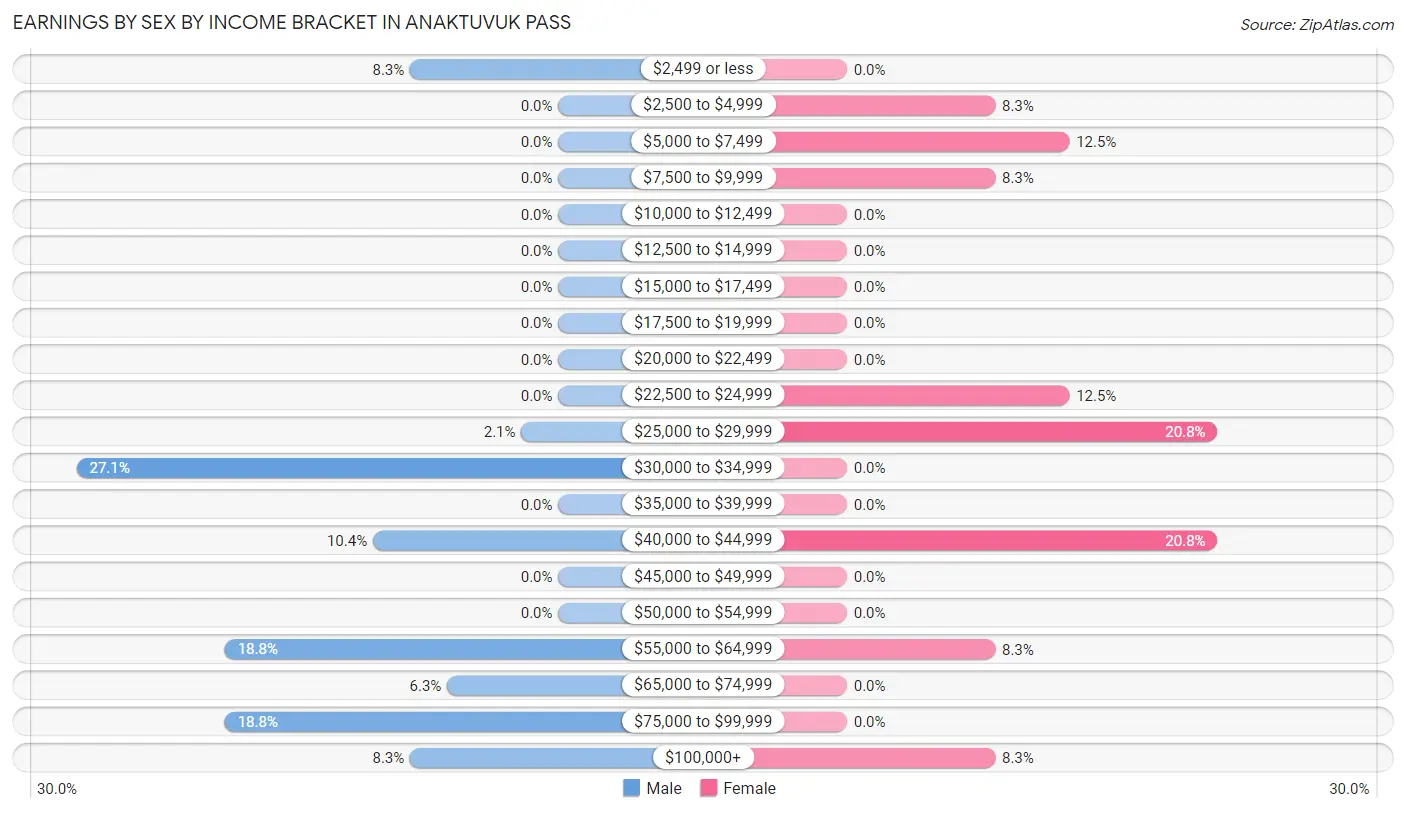
Earnings by Sex by Income Bracket in Anaktuvuk Pass
The most common earnings brackets in Anaktuvuk Pass are $30,000 to $34,999 for men (13 | 27.1%) and $25,000 to $29,999 for women (5 | 20.8%).
| Income | Male | Female |
| $2,499 or less | 4 (8.3%) | 0 (0.0%) |
| $2,500 to $4,999 | 0 (0.0%) | 2 (8.3%) |
| $5,000 to $7,499 | 0 (0.0%) | 3 (12.5%) |
| $7,500 to $9,999 | 0 (0.0%) | 2 (8.3%) |
| $10,000 to $12,499 | 0 (0.0%) | 0 (0.0%) |
| $12,500 to $14,999 | 0 (0.0%) | 0 (0.0%) |
| $15,000 to $17,499 | 0 (0.0%) | 0 (0.0%) |
| $17,500 to $19,999 | 0 (0.0%) | 0 (0.0%) |
| $20,000 to $22,499 | 0 (0.0%) | 0 (0.0%) |
| $22,500 to $24,999 | 0 (0.0%) | 3 (12.5%) |
| $25,000 to $29,999 | 1 (2.1%) | 5 (20.8%) |
| $30,000 to $34,999 | 13 (27.1%) | 0 (0.0%) |
| $35,000 to $39,999 | 0 (0.0%) | 0 (0.0%) |
| $40,000 to $44,999 | 5 (10.4%) | 5 (20.8%) |
| $45,000 to $49,999 | 0 (0.0%) | 0 (0.0%) |
| $50,000 to $54,999 | 0 (0.0%) | 0 (0.0%) |
| $55,000 to $64,999 | 9 (18.8%) | 2 (8.3%) |
| $65,000 to $74,999 | 3 (6.2%) | 0 (0.0%) |
| $75,000 to $99,999 | 9 (18.8%) | 0 (0.0%) |
| $100,000+ | 4 (8.3%) | 2 (8.3%) |
| Total | 48 (100.0%) | 24 (100.0%) |
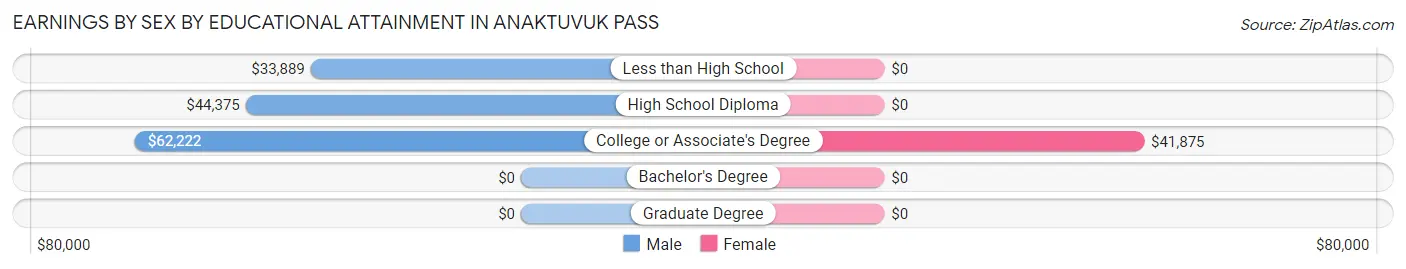
Earnings by Sex by Educational Attainment in Anaktuvuk Pass
Average earnings in Anaktuvuk Pass are $60,833 for men and $28,125 for women, a difference of 53.8%. Men with an educational attainment of college or associate's degree enjoy the highest average annual earnings of $62,222, while those with less than high school education earn the least with $33,889. Women with an educational attainment of college or associate's degree earn the most with the average annual earnings of $41,875, while those with college or associate's degree education have the smallest earnings of $41,875.
| Educational Attainment | Male Income | Female Income |
| Less than High School | $33,889 | $0 |
| High School Diploma | $44,375 | $0 |
| College or Associate's Degree | $62,222 | $41,875 |
| Bachelor's Degree | - | - |
| Graduate Degree | - | - |
| Total | $60,833 | $28,125 |
Family Income in Anaktuvuk Pass
Family Income Brackets in Anaktuvuk Pass
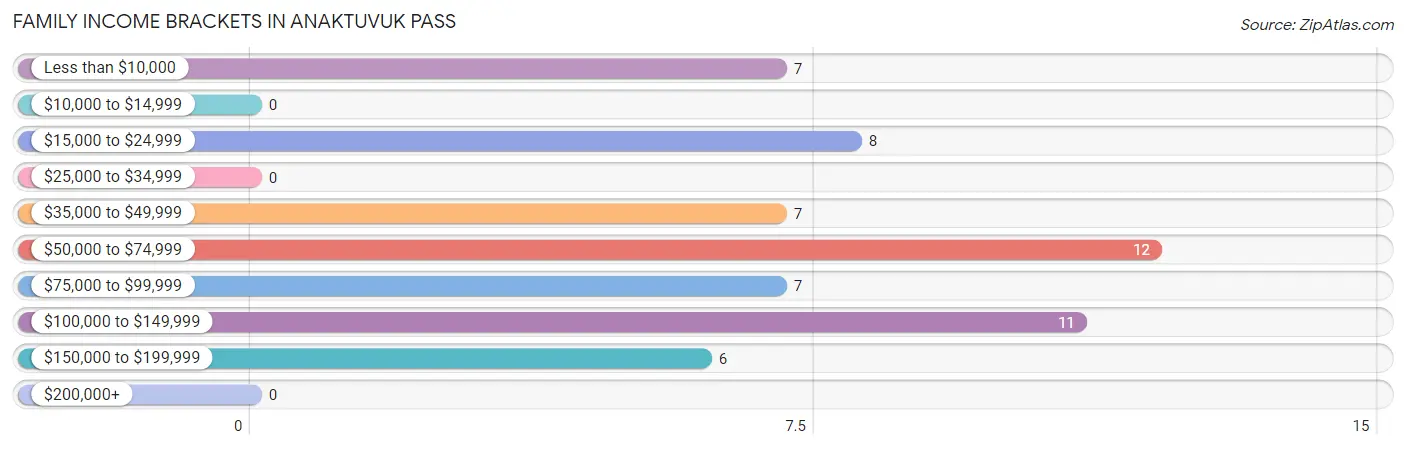
According to the Anaktuvuk Pass family income data, there are 12 families falling into the $50,000 to $74,999 income range, which is the most common income bracket and makes up 20.7% of all families.
| Income Bracket | # Families | % Families |
| Less than $10,000 | 7 | 12.1% |
| $10,000 to $14,999 | 0 | 0.0% |
| $15,000 to $24,999 | 8 | 13.8% |
| $25,000 to $34,999 | 0 | 0.0% |
| $35,000 to $49,999 | 7 | 12.1% |
| $50,000 to $74,999 | 12 | 20.7% |
| $75,000 to $99,999 | 7 | 12.1% |
| $100,000 to $149,999 | 11 | 19.0% |
| $150,000 to $199,999 | 6 | 10.3% |
| $200,000+ | 0 | 0.0% |
Family Income by Famaliy Size in Anaktuvuk Pass
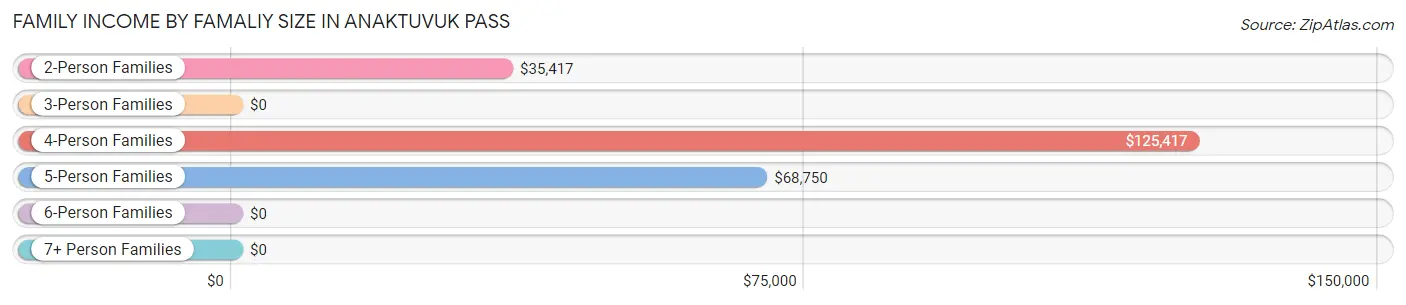
4-person families (15 | 25.9%) account for the highest median family income in Anaktuvuk Pass with $125,417 per family, while 4-person families (15 | 25.9%) have the highest median income of $31,354 per family member.
| Income Bracket | # Families | Median Income |
| 2-Person Families | 11 (19.0%) | $35,417 |
| 3-Person Families | 6 (10.3%) | $0 |
| 4-Person Families | 15 (25.9%) | $125,417 |
| 5-Person Families | 15 (25.9%) | $68,750 |
| 6-Person Families | 4 (6.9%) | $0 |
| 7+ Person Families | 7 (12.1%) | $0 |
| Total | 58 (100.0%) | $69,444 |
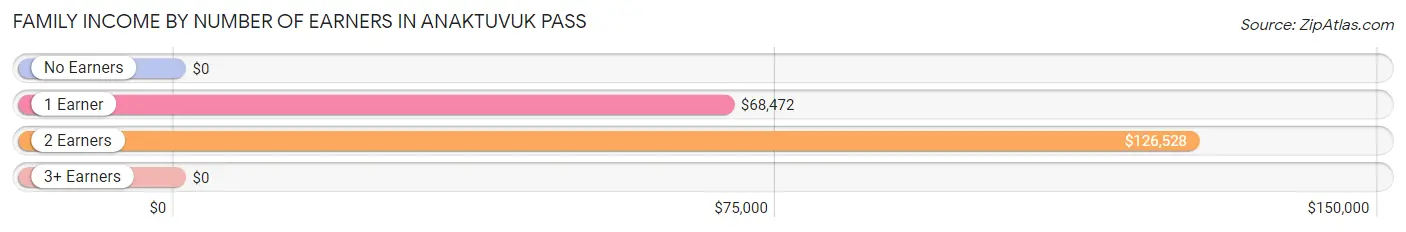
Family Income by Number of Earners in Anaktuvuk Pass
| Number of Earners | # Families | Median Income |
| No Earners | 12 (20.7%) | $0 |
| 1 Earner | 27 (46.6%) | $68,472 |
| 2 Earners | 15 (25.9%) | $126,528 |
| 3+ Earners | 4 (6.9%) | $0 |
| Total | 58 (100.0%) | $69,444 |
Household Income in Anaktuvuk Pass
Household Income Brackets in Anaktuvuk Pass
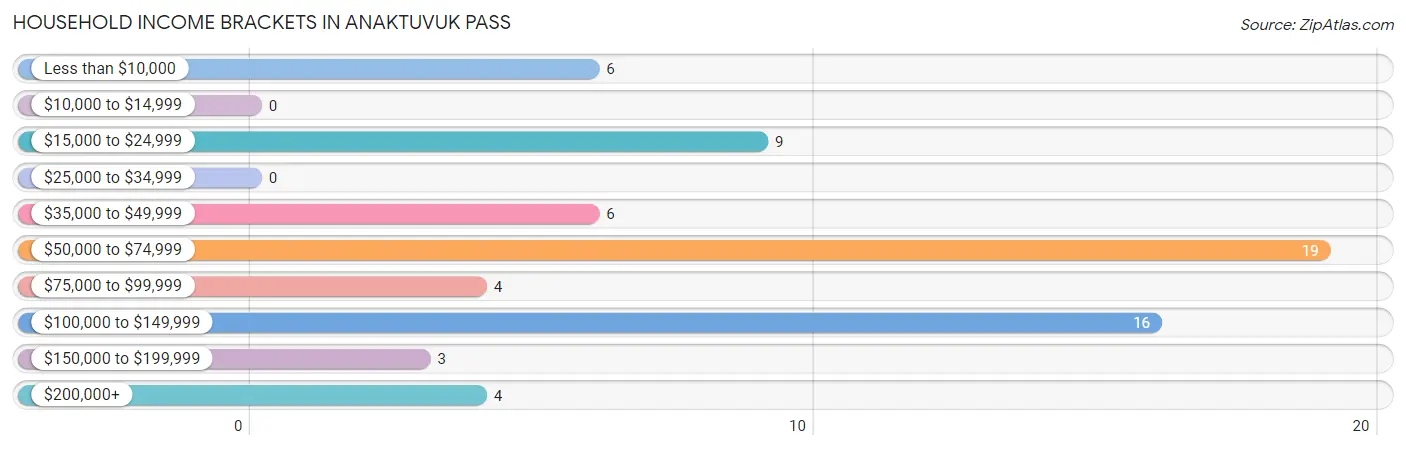
With 19 households falling in the category, the $50,000 to $74,999 income range is the most frequent in Anaktuvuk Pass, accounting for 28.4% of all households.
| Income Bracket | # Households | % Households |
| Less than $10,000 | 6 | 9.0% |
| $10,000 to $14,999 | 0 | 0.0% |
| $15,000 to $24,999 | 9 | 13.4% |
| $25,000 to $34,999 | 0 | 0.0% |
| $35,000 to $49,999 | 6 | 9.0% |
| $50,000 to $74,999 | 19 | 28.4% |
| $75,000 to $99,999 | 4 | 6.0% |
| $100,000 to $149,999 | 16 | 23.9% |
| $150,000 to $199,999 | 3 | 4.5% |
| $200,000+ | 4 | 6.0% |
Household Income by Householder Age in Anaktuvuk Pass
The median household income in Anaktuvuk Pass is $69,028, with the highest median household income of $69,306 found in the 25 to 44 years age bracket for the primary householder. A total of 41 households (61.2%) fall into this category.
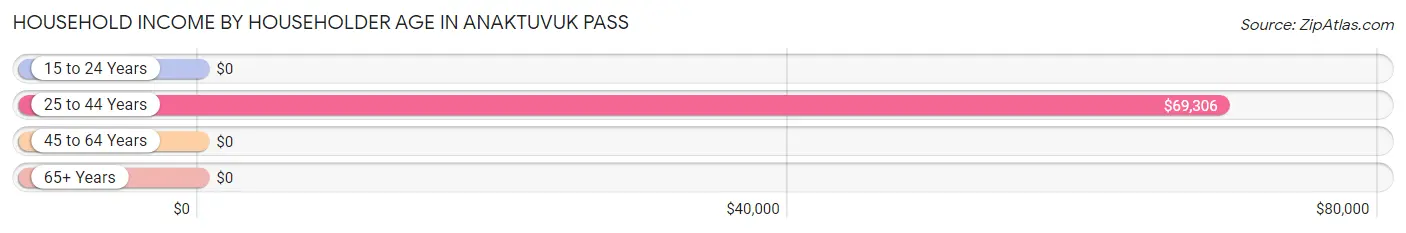
| Income Bracket | # Households | Median Income |
| 15 to 24 Years | 0 (0.0%) | $0 |
| 25 to 44 Years | 41 (61.2%) | $69,306 |
| 45 to 64 Years | 17 (25.4%) | $0 |
| 65+ Years | 9 (13.4%) | $0 |
| Total | 67 (100.0%) | $69,028 |
Poverty in Anaktuvuk Pass
Income Below Poverty by Sex and Age in Anaktuvuk Pass
With 31.1% poverty level for males and 47.6% for females among the residents of Anaktuvuk Pass, 5 year old males and under 5 year old females are the most vulnerable to poverty, with 4 males (100.0%) and 8 females (100.0%) in their respective age groups living below the poverty level.
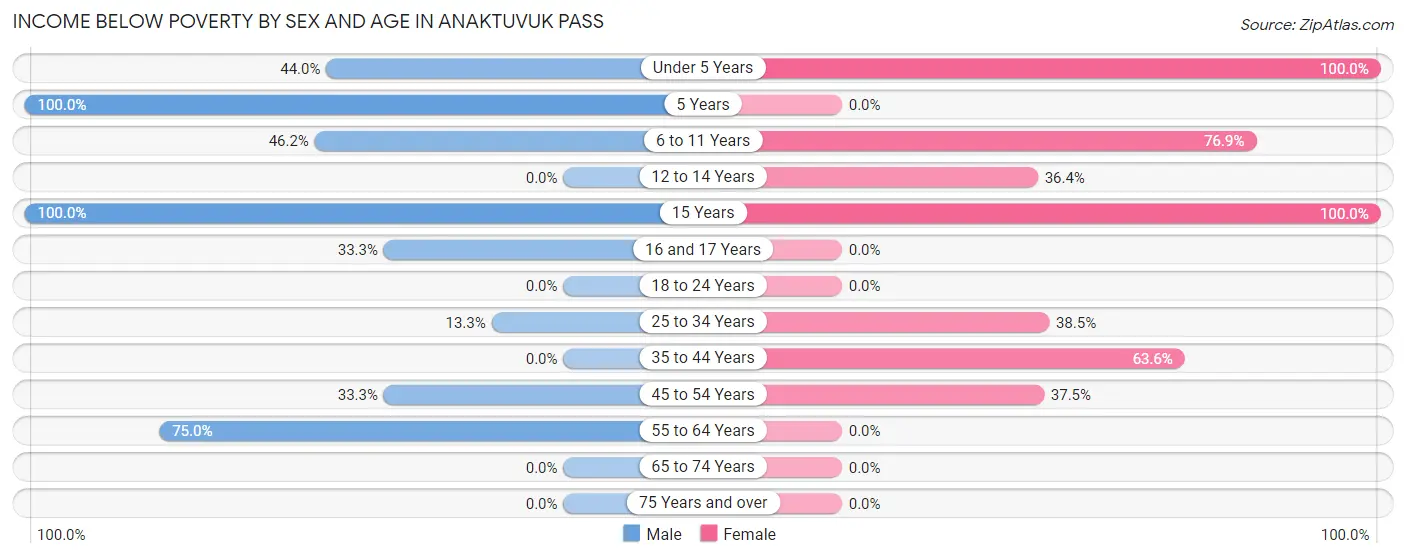
| Age Bracket | Male | Female |
| Under 5 Years | 11 (44.0%) | 8 (100.0%) |
| 5 Years | 4 (100.0%) | 0 (0.0%) |
| 6 to 11 Years | 6 (46.2%) | 10 (76.9%) |
| 12 to 14 Years | 0 (0.0%) | 4 (36.4%) |
| 15 Years | 4 (100.0%) | 3 (100.0%) |
| 16 and 17 Years | 4 (33.3%) | 0 (0.0%) |
| 18 to 24 Years | 0 (0.0%) | 0 (0.0%) |
| 25 to 34 Years | 6 (13.3%) | 5 (38.5%) |
| 35 to 44 Years | 0 (0.0%) | 7 (63.6%) |
| 45 to 54 Years | 1 (33.3%) | 3 (37.5%) |
| 55 to 64 Years | 6 (75.0%) | 0 (0.0%) |
| 65 to 74 Years | 0 (0.0%) | 0 (0.0%) |
| 75 Years and over | 0 (0.0%) | 0 (0.0%) |
| Total | 42 (31.1%) | 40 (47.6%) |
Income Above Poverty by Sex and Age in Anaktuvuk Pass
According to the poverty statistics in Anaktuvuk Pass, males aged 12 to 14 years and females aged 5 years are the age groups that are most secure financially, with 100.0% of males and 100.0% of females in these age groups living above the poverty line.
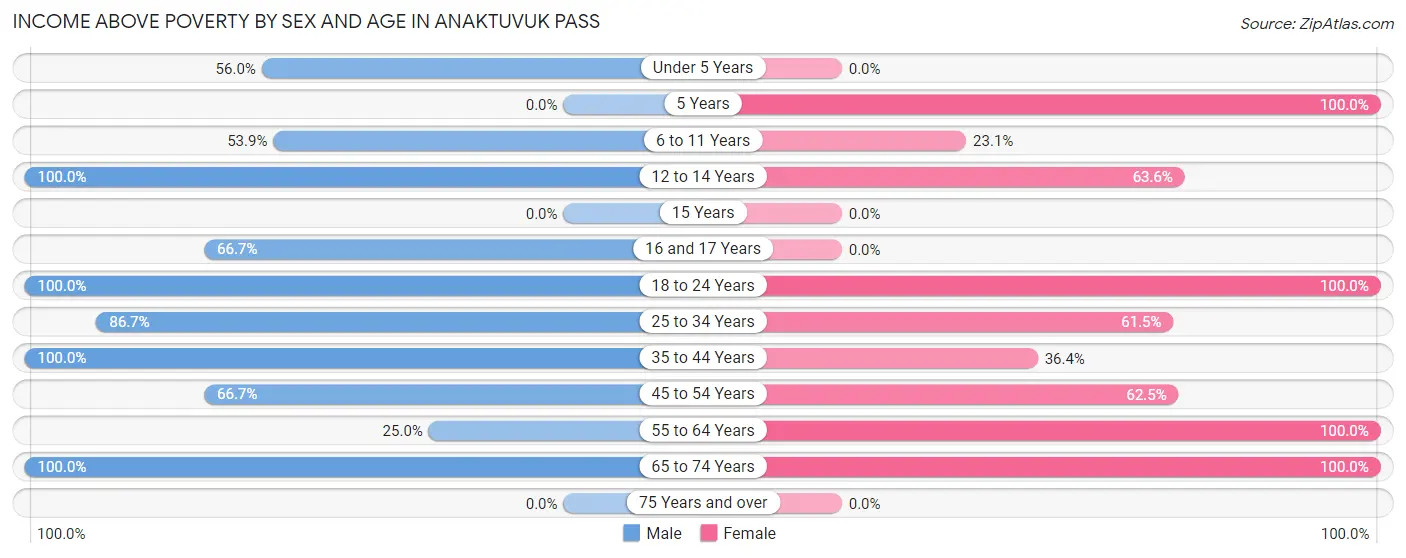
| Age Bracket | Male | Female |
| Under 5 Years | 14 (56.0%) | 0 (0.0%) |
| 5 Years | 0 (0.0%) | 4 (100.0%) |
| 6 to 11 Years | 7 (53.8%) | 3 (23.1%) |
| 12 to 14 Years | 2 (100.0%) | 7 (63.6%) |
| 15 Years | 0 (0.0%) | 0 (0.0%) |
| 16 and 17 Years | 8 (66.7%) | 0 (0.0%) |
| 18 to 24 Years | 3 (100.0%) | 6 (100.0%) |
| 25 to 34 Years | 39 (86.7%) | 8 (61.5%) |
| 35 to 44 Years | 9 (100.0%) | 4 (36.4%) |
| 45 to 54 Years | 2 (66.7%) | 5 (62.5%) |
| 55 to 64 Years | 2 (25.0%) | 5 (100.0%) |
| 65 to 74 Years | 7 (100.0%) | 2 (100.0%) |
| 75 Years and over | 0 (0.0%) | 0 (0.0%) |
| Total | 93 (68.9%) | 44 (52.4%) |
Income Below Poverty Among Married-Couple Families in Anaktuvuk Pass
The poverty statistics for married-couple families in Anaktuvuk Pass show that 62.5% or 10 of the total 16 families live below the poverty line. Families with 5 or more children have the highest poverty rate of 100.0%, comprising of 7 families. On the other hand, families with 1 or 2 children have the lowest poverty rate of 0.0%, which includes 0 families.
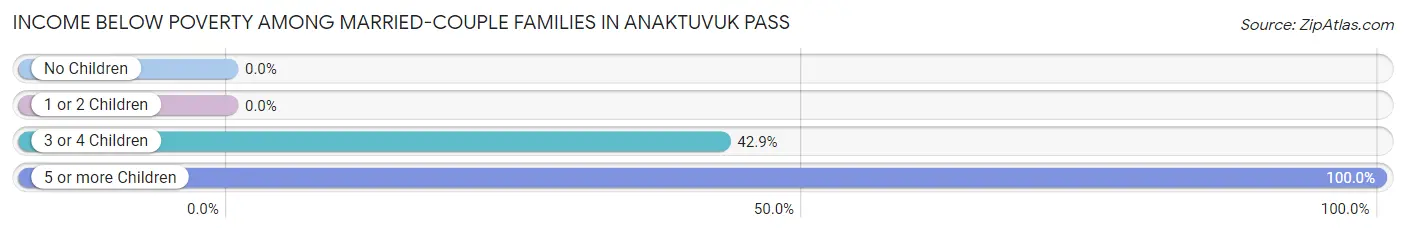
| Children | Above Poverty | Below Poverty |
| No Children | 0 (0.0%) | 0 (0.0%) |
| 1 or 2 Children | 2 (100.0%) | 0 (0.0%) |
| 3 or 4 Children | 4 (57.1%) | 3 (42.9%) |
| 5 or more Children | 0 (0.0%) | 7 (100.0%) |
| Total | 6 (37.5%) | 10 (62.5%) |
Income Below Poverty Among Single-Parent Households in Anaktuvuk Pass
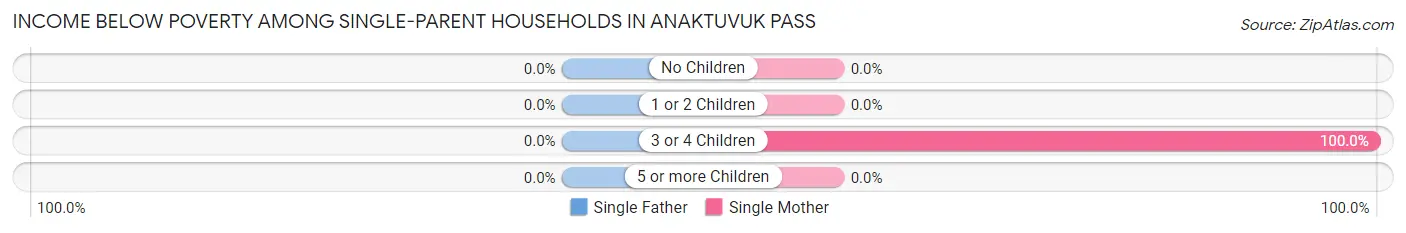
| Children | Single Father | Single Mother |
| No Children | 0 (0.0%) | 0 (0.0%) |
| 1 or 2 Children | 0 (0.0%) | 0 (0.0%) |
| 3 or 4 Children | 0 (0.0%) | 4 (100.0%) |
| 5 or more Children | 0 (0.0%) | 0 (0.0%) |
| Total | 0 (0.0%) | 4 (28.6%) |
Income Below Poverty Among Married-Couple vs Single-Parent Households in Anaktuvuk Pass
The poverty data for Anaktuvuk Pass shows that 10 of the married-couple family households (62.5%) and 4 of the single-parent households (9.5%) are living below the poverty level. Within the married-couple family households, those with 5 or more children have the highest poverty rate, with 7 households (100.0%) falling below the poverty line. Among the single-parent households, those with 3 or 4 children have the highest poverty rate, with 4 household (100.0%) living below poverty.
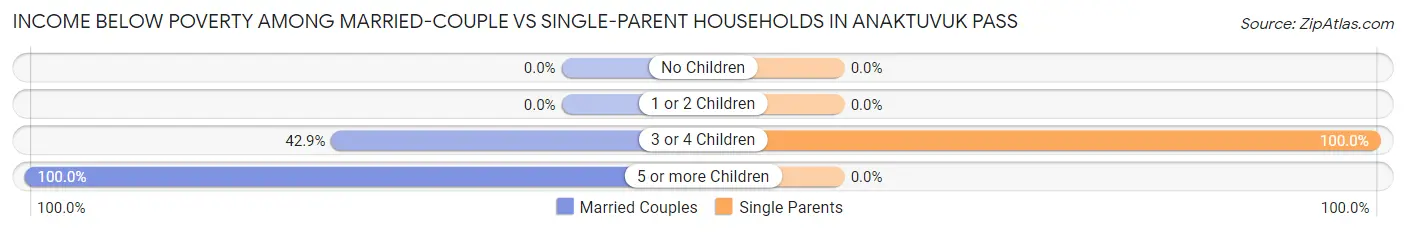
| Children | Married-Couple Families | Single-Parent Households |
| No Children | 0 (0.0%) | 0 (0.0%) |
| 1 or 2 Children | 0 (0.0%) | 0 (0.0%) |
| 3 or 4 Children | 3 (42.9%) | 4 (100.0%) |
| 5 or more Children | 7 (100.0%) | 0 (0.0%) |
| Total | 10 (62.5%) | 4 (9.5%) |
Race in Anaktuvuk Pass
The most populous races in Anaktuvuk Pass are Native / Alaskan (176 | 79.3%), Two or more Races (39 | 17.6%), and Hispanic or Latino (23 | 10.4%).
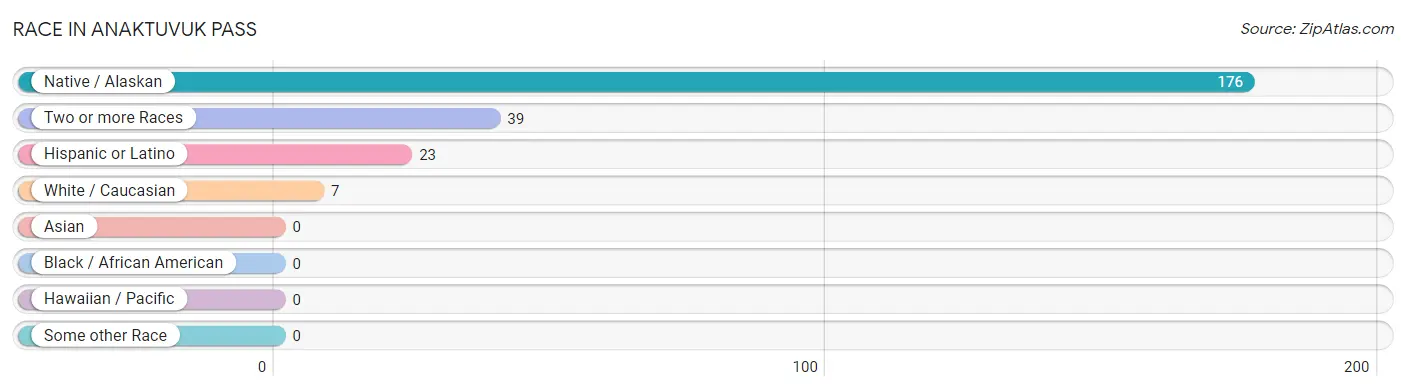
| Race | # Population | % Population |
| Asian | 0 | 0.0% |
| Black / African American | 0 | 0.0% |
| Hawaiian / Pacific | 0 | 0.0% |
| Hispanic or Latino | 23 | 10.4% |
| Native / Alaskan | 176 | 79.3% |
| White / Caucasian | 7 | 3.2% |
| Two or more Races | 39 | 17.6% |
| Some other Race | 0 | 0.0% |
| Total | 222 | 100.0% |
Ancestry in Anaktuvuk Pass
The most populous ancestries reported in Anaktuvuk Pass are Inupiat (176 | 79.3%), German (30 | 13.5%), Alaska Native (28 | 12.6%), Mexican (23 | 10.4%), and Alaskan Athabascan (13 | 5.9%), together accounting for 121.6% of all Anaktuvuk Pass residents.
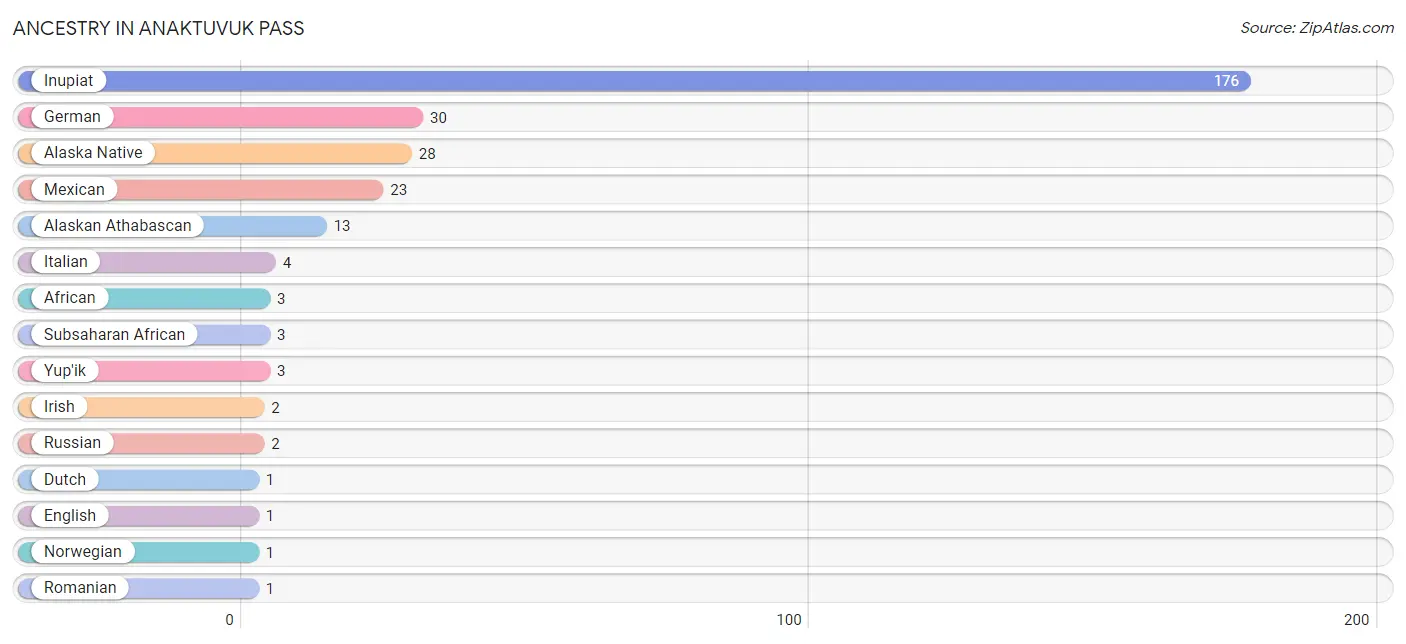
| Ancestry | # Population | % Population |
| African | 3 | 1.3% |
| Alaska Native | 28 | 12.6% |
| Alaskan Athabascan | 13 | 5.9% |
| Dutch | 1 | 0.4% |
| English | 1 | 0.4% |
| German | 30 | 13.5% |
| Inupiat | 176 | 79.3% |
| Irish | 2 | 0.9% |
| Italian | 4 | 1.8% |
| Mexican | 23 | 10.4% |
| Norwegian | 1 | 0.4% |
| Romanian | 1 | 0.4% |
| Russian | 2 | 0.9% |
| Subsaharan African | 3 | 1.3% |
| Ukrainian | 1 | 0.4% |
| Yup'ik | 3 | 1.3% | View All 16 Rows |
Immigrants in Anaktuvuk Pass

| Immigration Origin | # Population | % Population | View All 0 Rows |
Sex and Age in Anaktuvuk Pass
Sex and Age in Anaktuvuk Pass
The most populous age groups in Anaktuvuk Pass are 30 to 34 Years (41 | 30.4%) for men and 5 to 9 Years (20 | 23.0%) for women.
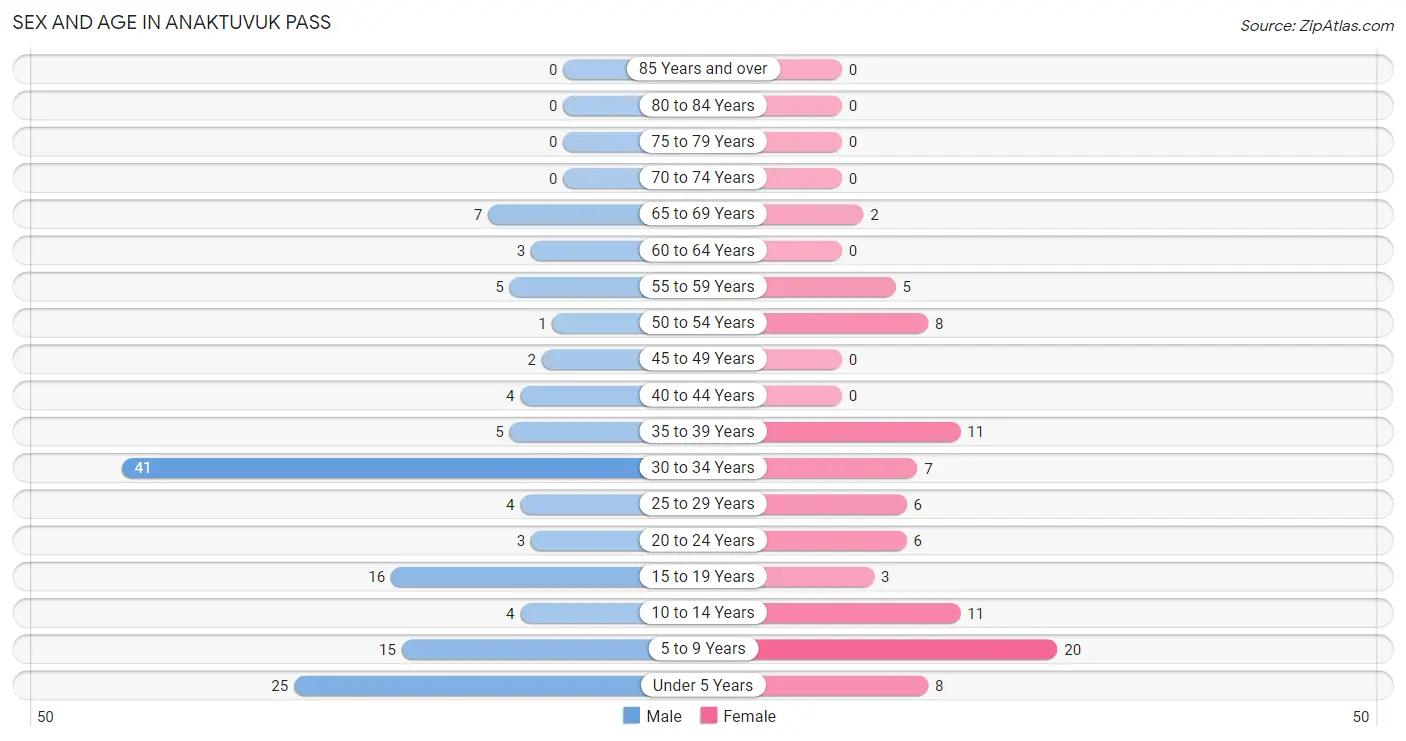
| Age Bracket | Male | Female |
| Under 5 Years | 25 (18.5%) | 8 (9.2%) |
| 5 to 9 Years | 15 (11.1%) | 20 (23.0%) |
| 10 to 14 Years | 4 (3.0%) | 11 (12.6%) |
| 15 to 19 Years | 16 (11.8%) | 3 (3.5%) |
| 20 to 24 Years | 3 (2.2%) | 6 (6.9%) |
| 25 to 29 Years | 4 (3.0%) | 6 (6.9%) |
| 30 to 34 Years | 41 (30.4%) | 7 (8.1%) |
| 35 to 39 Years | 5 (3.7%) | 11 (12.6%) |
| 40 to 44 Years | 4 (3.0%) | 0 (0.0%) |
| 45 to 49 Years | 2 (1.5%) | 0 (0.0%) |
| 50 to 54 Years | 1 (0.7%) | 8 (9.2%) |
| 55 to 59 Years | 5 (3.7%) | 5 (5.8%) |
| 60 to 64 Years | 3 (2.2%) | 0 (0.0%) |
| 65 to 69 Years | 7 (5.2%) | 2 (2.3%) |
| 70 to 74 Years | 0 (0.0%) | 0 (0.0%) |
| 75 to 79 Years | 0 (0.0%) | 0 (0.0%) |
| 80 to 84 Years | 0 (0.0%) | 0 (0.0%) |
| 85 Years and over | 0 (0.0%) | 0 (0.0%) |
| Total | 135 (100.0%) | 87 (100.0%) |
Families and Households in Anaktuvuk Pass
Median Family Size in Anaktuvuk Pass
The median family size in Anaktuvuk Pass is 3.41 persons per family, with married-couple families (16 | 27.6%) accounting for the largest median family size of 5.63 persons per family. On the other hand, single male/father families (28 | 48.3%) represent the smallest median family size with 2.18 persons per family.
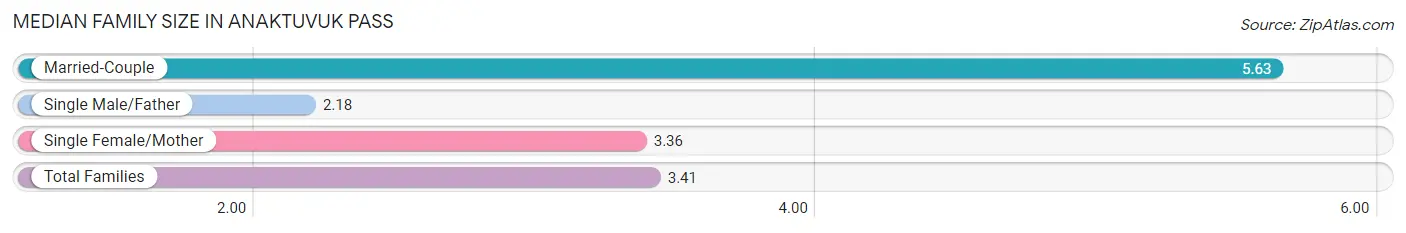
| Family Type | # Families | Family Size |
| Married-Couple | 16 (27.6%) | 5.63 |
| Single Male/Father | 28 (48.3%) | 2.18 |
| Single Female/Mother | 14 (24.1%) | 3.36 |
| Total Families | 58 (100.0%) | 3.41 |
Median Household Size in Anaktuvuk Pass
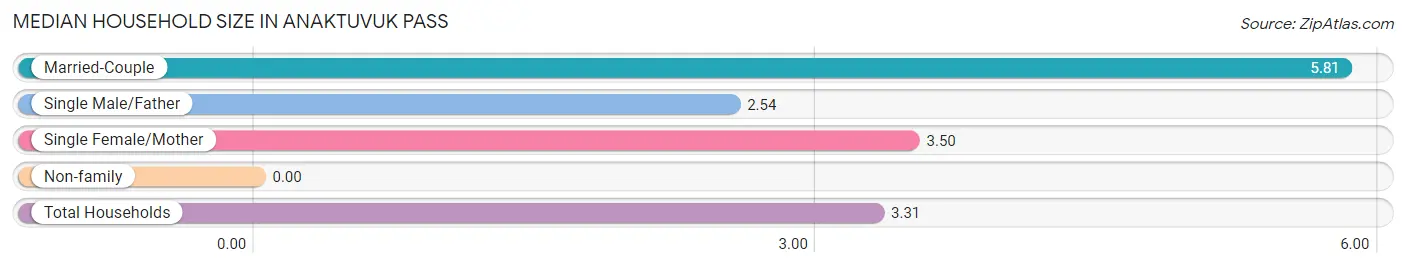
| Household Type | # Households | Household Size |
| Married-Couple | 16 (23.9%) | 5.81 |
| Single Male/Father | 28 (41.8%) | 2.54 |
| Single Female/Mother | 14 (20.9%) | 3.50 |
| Non-family | 9 (13.4%) | - |
| Total Households | 67 (100.0%) | 3.31 |
Household Size by Marriage Status in Anaktuvuk Pass
Out of a total of 67 households in Anaktuvuk Pass, 58 (86.6%) are family households, while 9 (13.4%) are nonfamily households. The most numerous type of family households are 5-person households, comprising 23, and the most common type of nonfamily households are 1-person households, comprising 9.
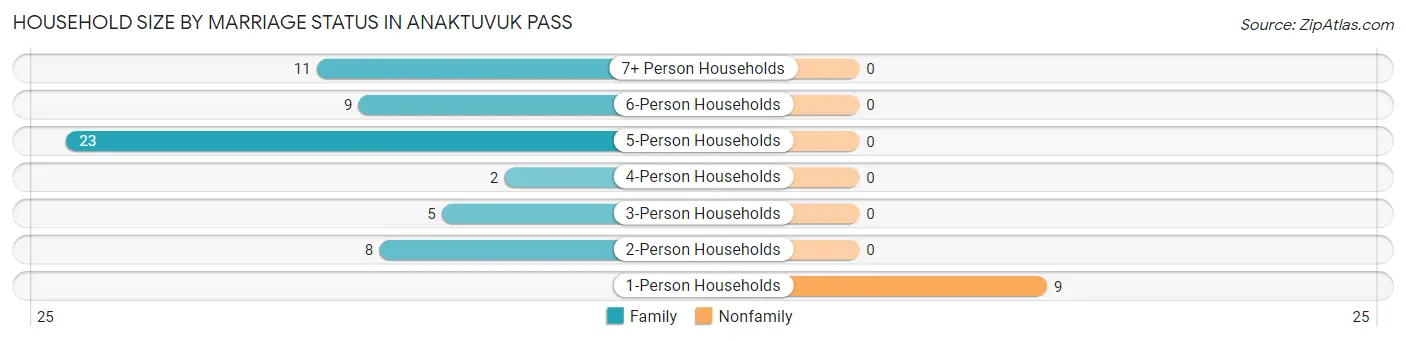
| Household Size | Family Households | Nonfamily Households |
| 1-Person Households | - | 9 (13.4%) |
| 2-Person Households | 8 (11.9%) | 0 (0.0%) |
| 3-Person Households | 5 (7.5%) | 0 (0.0%) |
| 4-Person Households | 2 (3.0%) | 0 (0.0%) |
| 5-Person Households | 23 (34.3%) | 0 (0.0%) |
| 6-Person Households | 9 (13.4%) | 0 (0.0%) |
| 7+ Person Households | 11 (16.4%) | 0 (0.0%) |
| Total | 58 (86.6%) | 9 (13.4%) |
Female Fertility in Anaktuvuk Pass
Fertility by Age in Anaktuvuk Pass
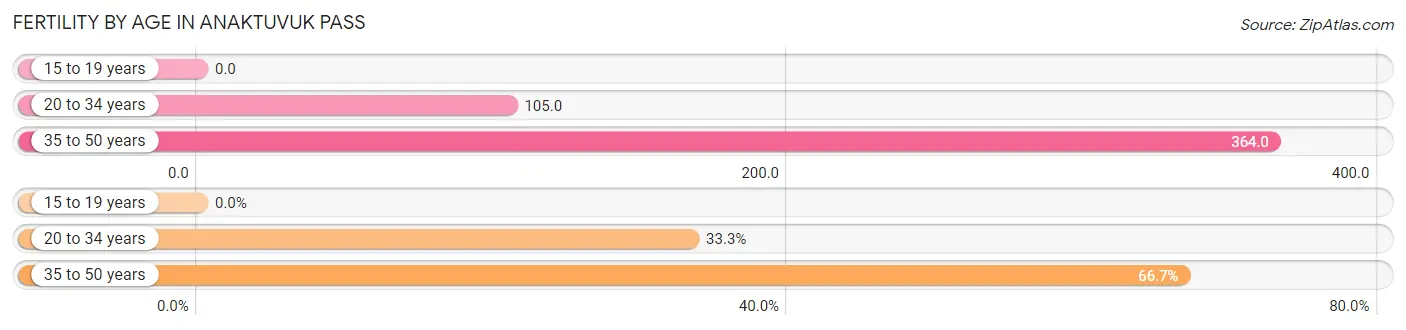
Average fertility rate in Anaktuvuk Pass is 182.0 births per 1,000 women. Women in the age bracket of 35 to 50 years have the highest fertility rate with 364.0 births per 1,000 women. Women in the age bracket of 35 to 50 years acount for 66.7% of all women with births.
| Age Bracket | Women with Births | Births / 1,000 Women |
| 15 to 19 years | 0 (0.0%) | 0.0 |
| 20 to 34 years | 2 (33.3%) | 105.0 |
| 35 to 50 years | 4 (66.7%) | 364.0 |
| Total | 6 (100.0%) | 182.0 |
Fertility by Age by Marriage Status in Anaktuvuk Pass
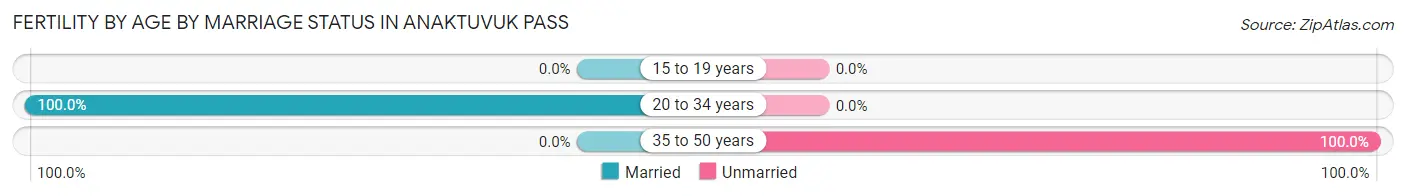
33.3% of women with births (6) in Anaktuvuk Pass are married. The highest percentage of unmarried women with births falls into 35 to 50 years age bracket with 100.0% of them unmarried at the time of birth, while the lowest percentage of unmarried women with births belong to 20 to 34 years age bracket with 0.0% of them unmarried.
| Age Bracket | Married | Unmarried |
| 15 to 19 years | 0 (0.0%) | 0 (0.0%) |
| 20 to 34 years | 2 (100.0%) | 0 (0.0%) |
| 35 to 50 years | 0 (0.0%) | 4 (100.0%) |
| Total | 2 (33.3%) | 4 (66.7%) |
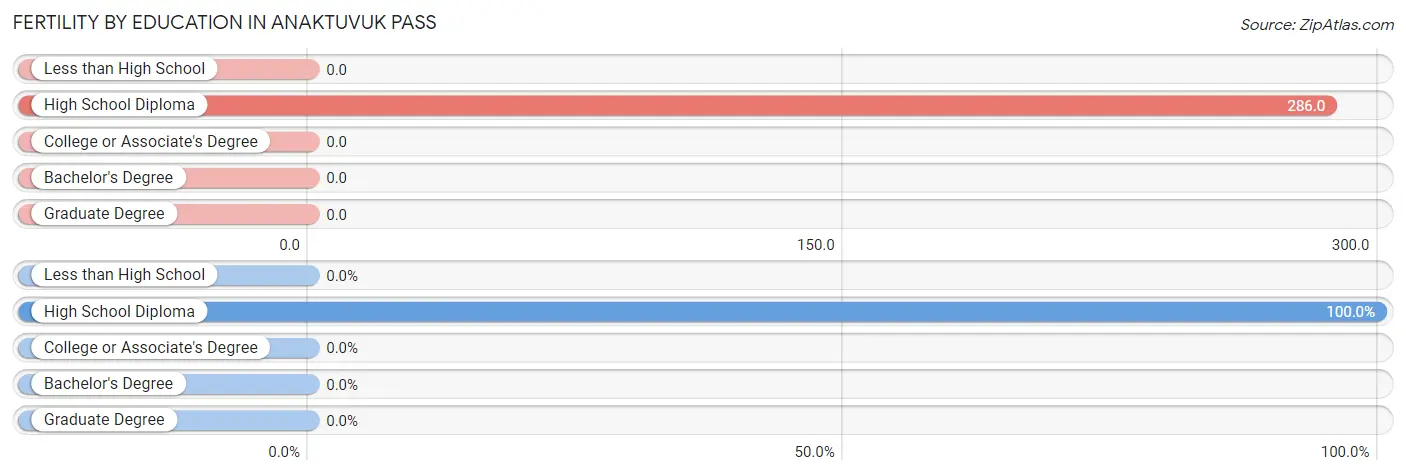
Fertility by Education in Anaktuvuk Pass
| Educational Attainment | Women with Births | Births / 1,000 Women |
| Less than High School | 0 (0.0%) | 0.0 |
| High School Diploma | 6 (100.0%) | 286.0 |
| College or Associate's Degree | 0 (0.0%) | 0.0 |
| Bachelor's Degree | 0 (0.0%) | 0.0 |
| Graduate Degree | 0 (0.0%) | 0.0 |
| Total | 6 (100.0%) | 182.0 |
Fertility by Education by Marriage Status in Anaktuvuk Pass
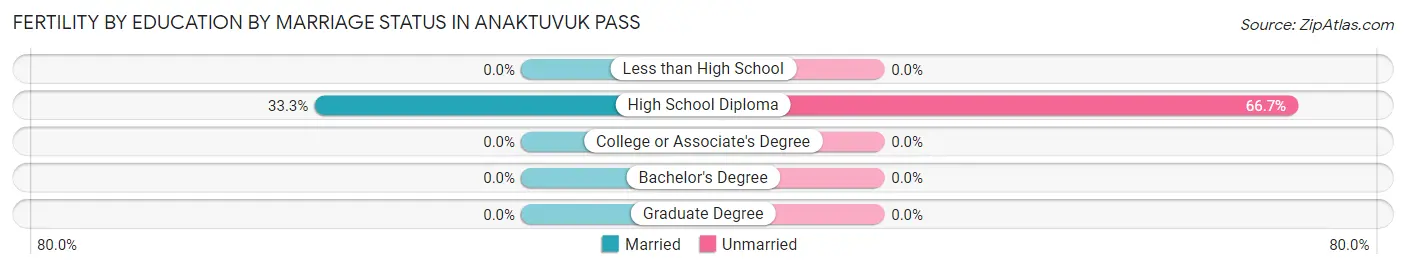
66.7% of women with births in Anaktuvuk Pass are unmarried. Women with the educational attainment of high school diploma are most likely to be married with 33.3% of them married at childbirth, while women with the educational attainment of high school diploma are least likely to be married with 66.7% of them unmarried at childbirth.
| Educational Attainment | Married | Unmarried |
| Less than High School | 0 (0.0%) | 0 (0.0%) |
| High School Diploma | 2 (33.3%) | 4 (66.7%) |
| College or Associate's Degree | 0 (0.0%) | 0 (0.0%) |
| Bachelor's Degree | 0 (0.0%) | 0 (0.0%) |
| Graduate Degree | 0 (0.0%) | 0 (0.0%) |
| Total | 2 (33.3%) | 4 (66.7%) |
Employment Characteristics in Anaktuvuk Pass
Employment by Class of Employer in Anaktuvuk Pass
Among the 54 employed individuals in Anaktuvuk Pass, local government employees (32 | 59.3%), self-employed (not incorporated) (12 | 22.2%), and federal government employees (7 | 13.0%) make up the most common classes of employment.
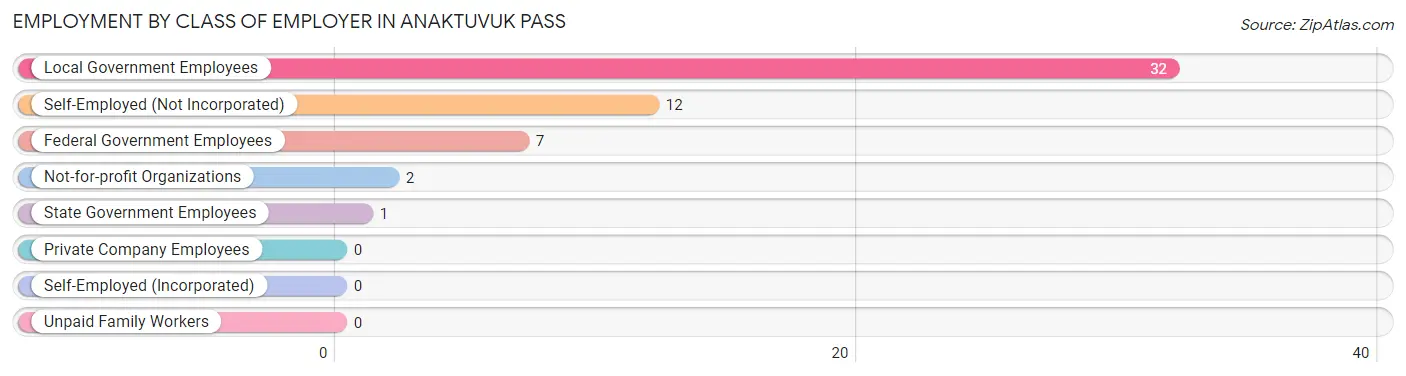
| Employer Class | # Employees | % Employees |
| Private Company Employees | 0 | 0.0% |
| Self-Employed (Incorporated) | 0 | 0.0% |
| Self-Employed (Not Incorporated) | 12 | 22.2% |
| Not-for-profit Organizations | 2 | 3.7% |
| Local Government Employees | 32 | 59.3% |
| State Government Employees | 1 | 1.8% |
| Federal Government Employees | 7 | 13.0% |
| Unpaid Family Workers | 0 | 0.0% |
| Total | 54 | 100.0% |
Employment Status by Age in Anaktuvuk Pass
According to the labor force statistics for Anaktuvuk Pass, out of the total population over 16 years of age (132), 55.3% or 73 individuals are in the labor force, with 18.6% or 14 of them unemployed. The age group with the highest labor force participation rate is 25 to 29 years, with 100.0% or 10 individuals in the labor force. Within the labor force, the 45 to 54 years age range has the highest percentage of unemployed individuals, with 57.1% or 4 of them being unemployed.
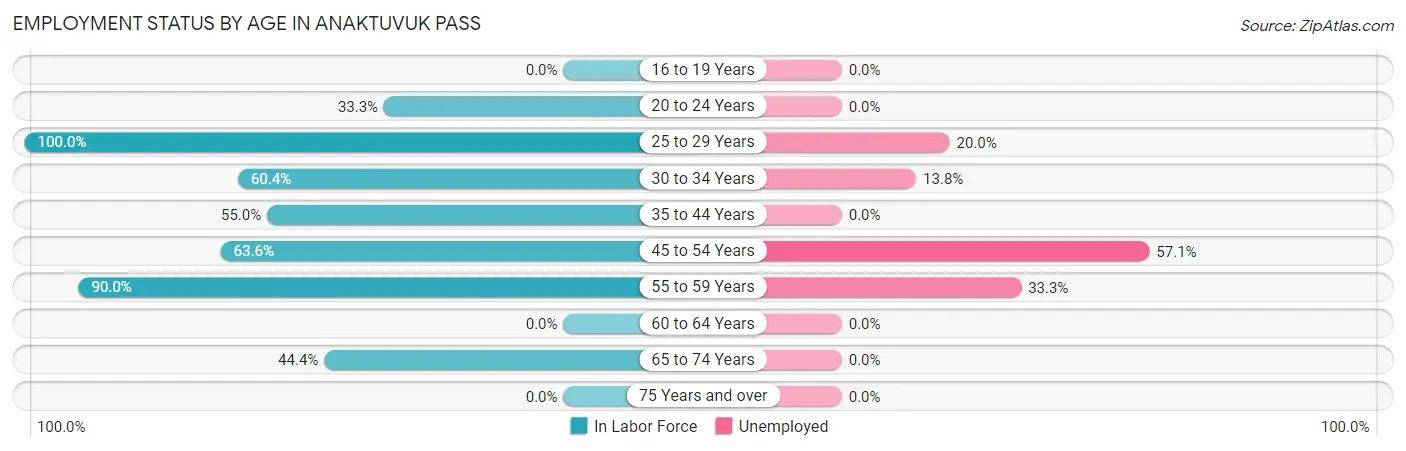
| Age Bracket | In Labor Force | Unemployed |
| 16 to 19 Years | 0 (0.0%) | 0 (0.0%) |
| 20 to 24 Years | 3 (33.3%) | 0 (0.0%) |
| 25 to 29 Years | 10 (100.0%) | 2 (20.0%) |
| 30 to 34 Years | 29 (60.4%) | 4 (13.8%) |
| 35 to 44 Years | 11 (55.0%) | 0 (0.0%) |
| 45 to 54 Years | 7 (63.6%) | 4 (57.1%) |
| 55 to 59 Years | 9 (90.0%) | 3 (33.3%) |
| 60 to 64 Years | 0 (0.0%) | 0 (0.0%) |
| 65 to 74 Years | 4 (44.4%) | 0 (0.0%) |
| 75 Years and over | 0 (0.0%) | 0 (0.0%) |
| Total | 73 (55.3%) | 14 (18.6%) |
Employment Status by Educational Attainment in Anaktuvuk Pass
According to labor force statistics for Anaktuvuk Pass, 64.7% of individuals (66) out of the total population between 25 and 64 years of age (102) are in the labor force, with 20.6% or 14 of them being unemployed. The group with the highest labor force participation rate are those with the educational attainment of bachelor's degree or higher, with 100.0% or 5 individuals in the labor force. Within the labor force, individuals with bachelor's degree or higher education have the highest percentage of unemployment, with 60.0% or 3 of them being unemployed.
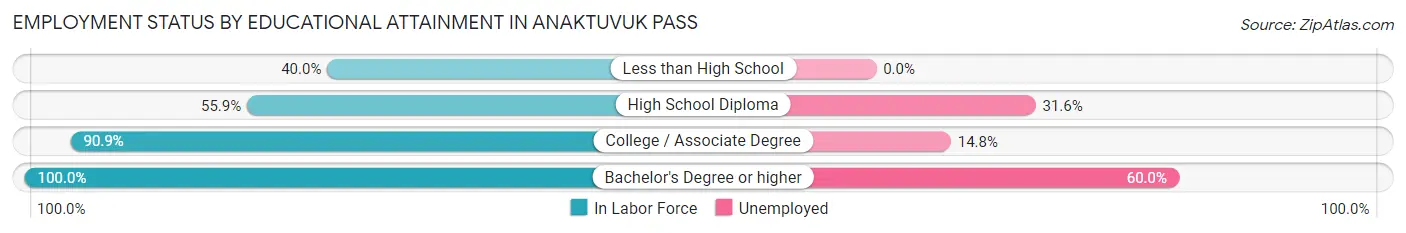
| Educational Attainment | In Labor Force | Unemployed |
| Less than High School | 12 (40.0%) | 0 (0.0%) |
| High School Diploma | 19 (55.9%) | 11 (31.6%) |
| College / Associate Degree | 30 (90.9%) | 5 (14.8%) |
| Bachelor's Degree or higher | 5 (100.0%) | 3 (60.0%) |
| Total | 66 (64.7%) | 21 (20.6%) |
Employment Occupations by Sex in Anaktuvuk Pass
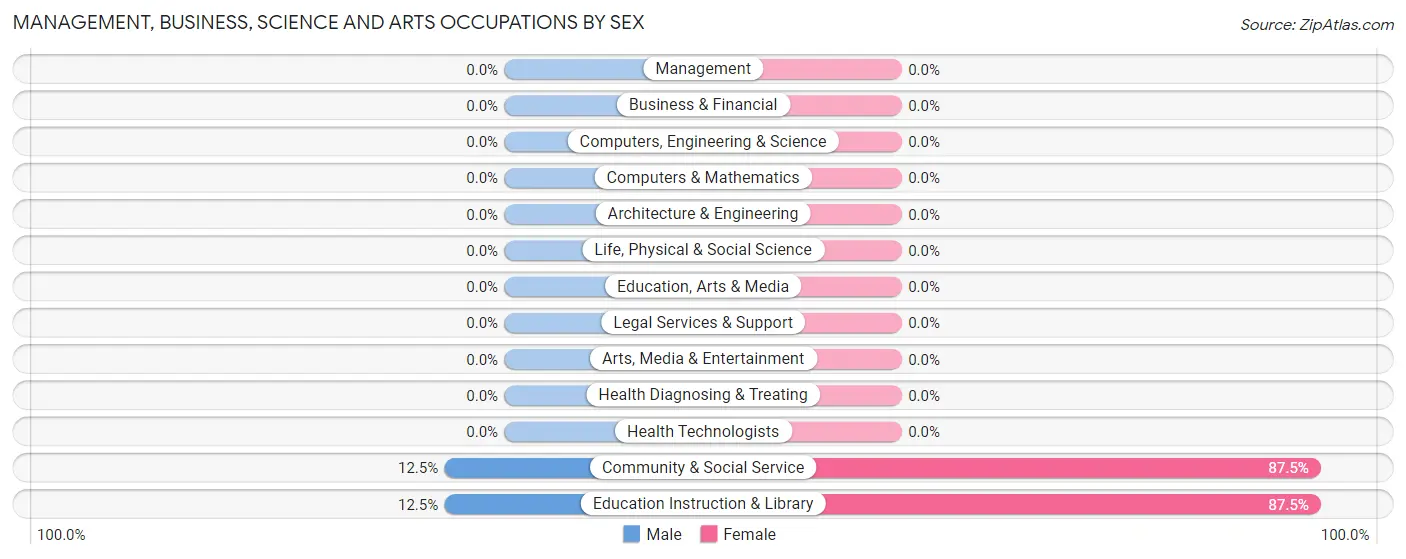
Management, Business, Science and Arts Occupations
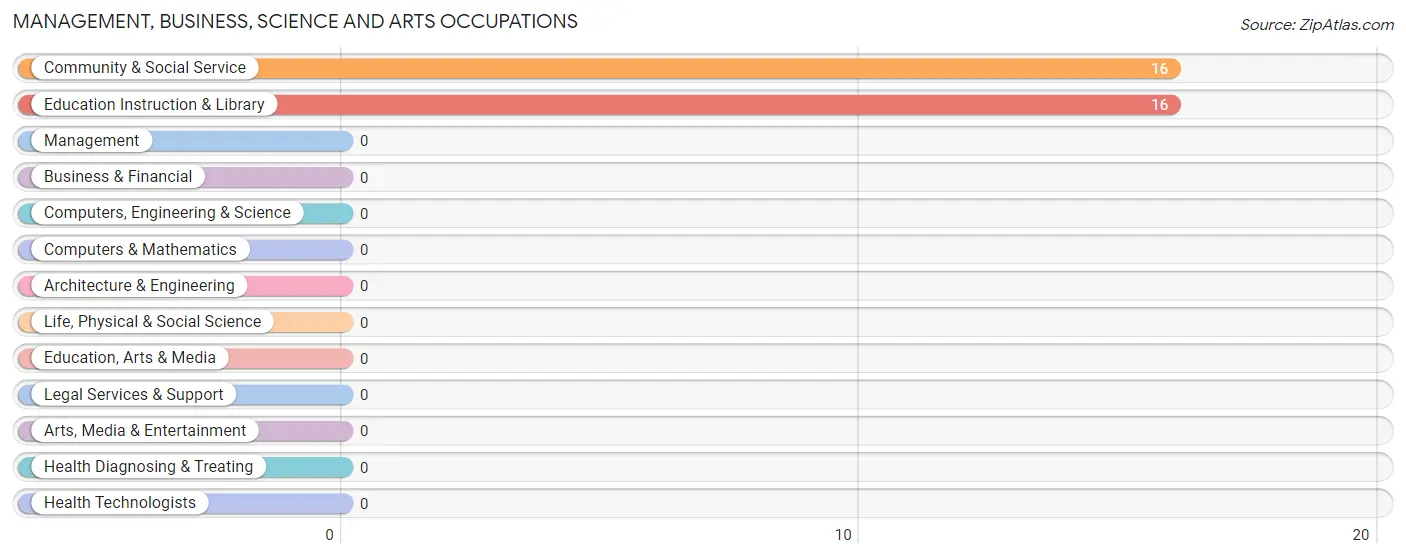
The most common Management, Business, Science and Arts occupations in Anaktuvuk Pass are Community & Social Service (16 | 28.1%), and Education Instruction & Library (16 | 28.1%).
Management, Business, Science and Arts Occupations by Sex
Within the Management, Business, Science and Arts occupations in Anaktuvuk Pass, the most male-oriented occupations are Community & Social Service (12.5%), and Education Instruction & Library (12.5%), while the most female-oriented occupations are Community & Social Service (87.5%), and Education Instruction & Library (87.5%).
| Occupation | Male | Female |
| Management | 0 (0.0%) | 0 (0.0%) |
| Business & Financial | 0 (0.0%) | 0 (0.0%) |
| Computers, Engineering & Science | 0 (0.0%) | 0 (0.0%) |
| Computers & Mathematics | 0 (0.0%) | 0 (0.0%) |
| Architecture & Engineering | 0 (0.0%) | 0 (0.0%) |
| Life, Physical & Social Science | 0 (0.0%) | 0 (0.0%) |
| Community & Social Service | 2 (12.5%) | 14 (87.5%) |
| Education, Arts & Media | 0 (0.0%) | 0 (0.0%) |
| Legal Services & Support | 0 (0.0%) | 0 (0.0%) |
| Education Instruction & Library | 2 (12.5%) | 14 (87.5%) |
| Arts, Media & Entertainment | 0 (0.0%) | 0 (0.0%) |
| Health Diagnosing & Treating | 0 (0.0%) | 0 (0.0%) |
| Health Technologists | 0 (0.0%) | 0 (0.0%) |
| Total (Category) | 2 (12.5%) | 14 (87.5%) |
| Total (Overall) | 36 (63.2%) | 21 (36.8%) |
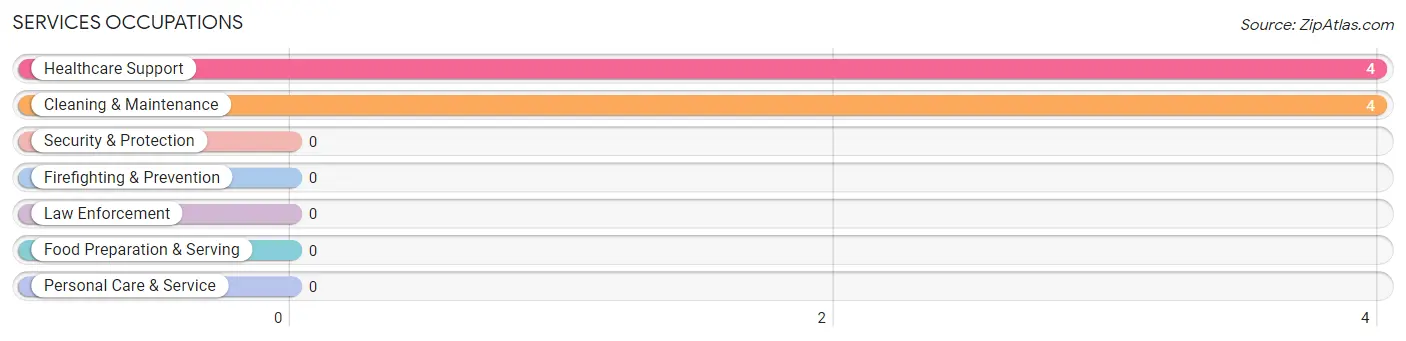
Services Occupations
The most common Services occupations in Anaktuvuk Pass are Healthcare Support (4 | 7.0%), and Cleaning & Maintenance (4 | 7.0%).
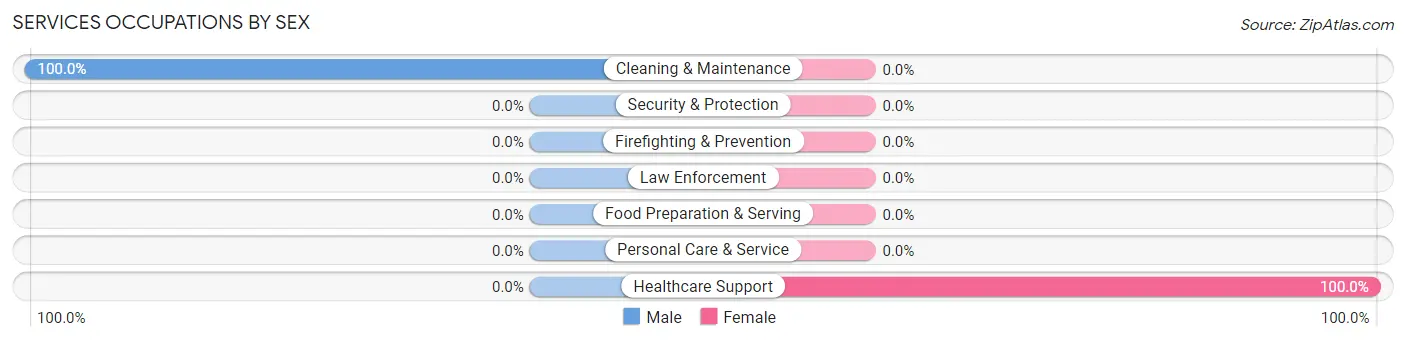
Services Occupations by Sex
| Occupation | Male | Female |
| Healthcare Support | 0 (0.0%) | 4 (100.0%) |
| Security & Protection | 0 (0.0%) | 0 (0.0%) |
| Firefighting & Prevention | 0 (0.0%) | 0 (0.0%) |
| Law Enforcement | 0 (0.0%) | 0 (0.0%) |
| Food Preparation & Serving | 0 (0.0%) | 0 (0.0%) |
| Cleaning & Maintenance | 4 (100.0%) | 0 (0.0%) |
| Personal Care & Service | 0 (0.0%) | 0 (0.0%) |
| Total (Category) | 4 (50.0%) | 4 (50.0%) |
| Total (Overall) | 36 (63.2%) | 21 (36.8%) |
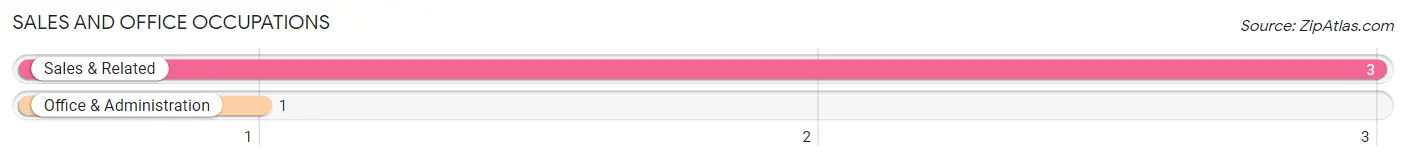
Sales and Office Occupations
The most common Sales and Office occupations in Anaktuvuk Pass are Sales & Related (3 | 5.3%), and Office & Administration (1 | 1.8%).
Sales and Office Occupations by Sex
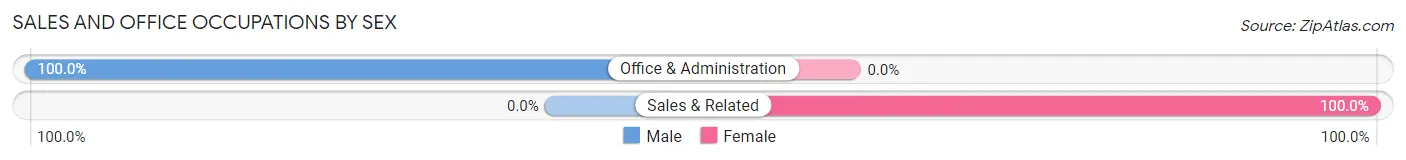
| Occupation | Male | Female |
| Sales & Related | 0 (0.0%) | 3 (100.0%) |
| Office & Administration | 1 (100.0%) | 0 (0.0%) |
| Total (Category) | 1 (25.0%) | 3 (75.0%) |
| Total (Overall) | 36 (63.2%) | 21 (36.8%) |
Natural Resources, Construction and Maintenance Occupations
The most common Natural Resources, Construction and Maintenance occupations in Anaktuvuk Pass are , and Installation, Maintenance & Repair (17 | 29.8%).
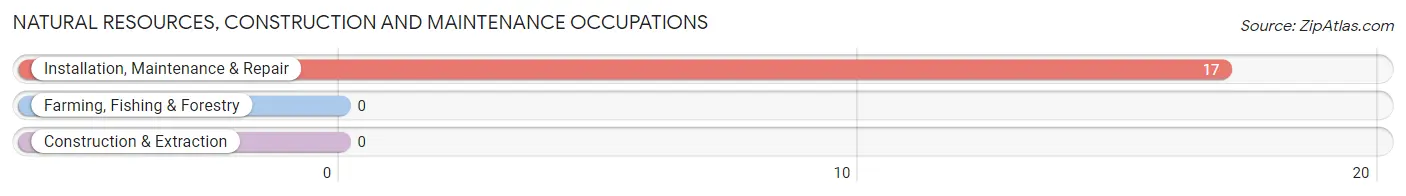
Natural Resources, Construction and Maintenance Occupations by Sex
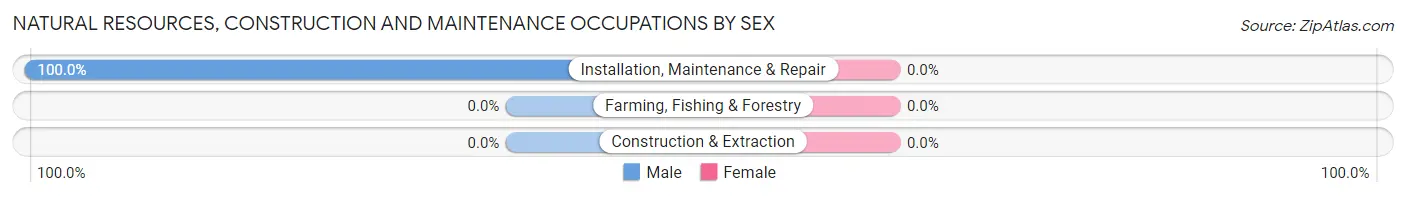
| Occupation | Male | Female |
| Farming, Fishing & Forestry | 0 (0.0%) | 0 (0.0%) |
| Construction & Extraction | 0 (0.0%) | 0 (0.0%) |
| Installation, Maintenance & Repair | 17 (100.0%) | 0 (0.0%) |
| Total (Category) | 17 (100.0%) | 0 (0.0%) |
| Total (Overall) | 36 (63.2%) | 21 (36.8%) |
Production, Transportation and Moving Occupations
The most common Production, Transportation and Moving occupations in Anaktuvuk Pass are Production (10 | 17.5%), and Transportation (2 | 3.5%).
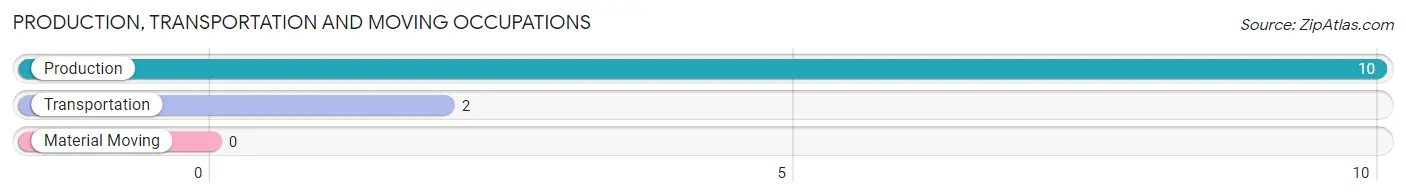
Production, Transportation and Moving Occupations by Sex

| Occupation | Male | Female |
| Production | 10 (100.0%) | 0 (0.0%) |
| Transportation | 2 (100.0%) | 0 (0.0%) |
| Material Moving | 0 (0.0%) | 0 (0.0%) |
| Total (Category) | 12 (100.0%) | 0 (0.0%) |
| Total (Overall) | 36 (63.2%) | 21 (36.8%) |
Employment Industries by Sex in Anaktuvuk Pass
Employment Industries in Anaktuvuk Pass
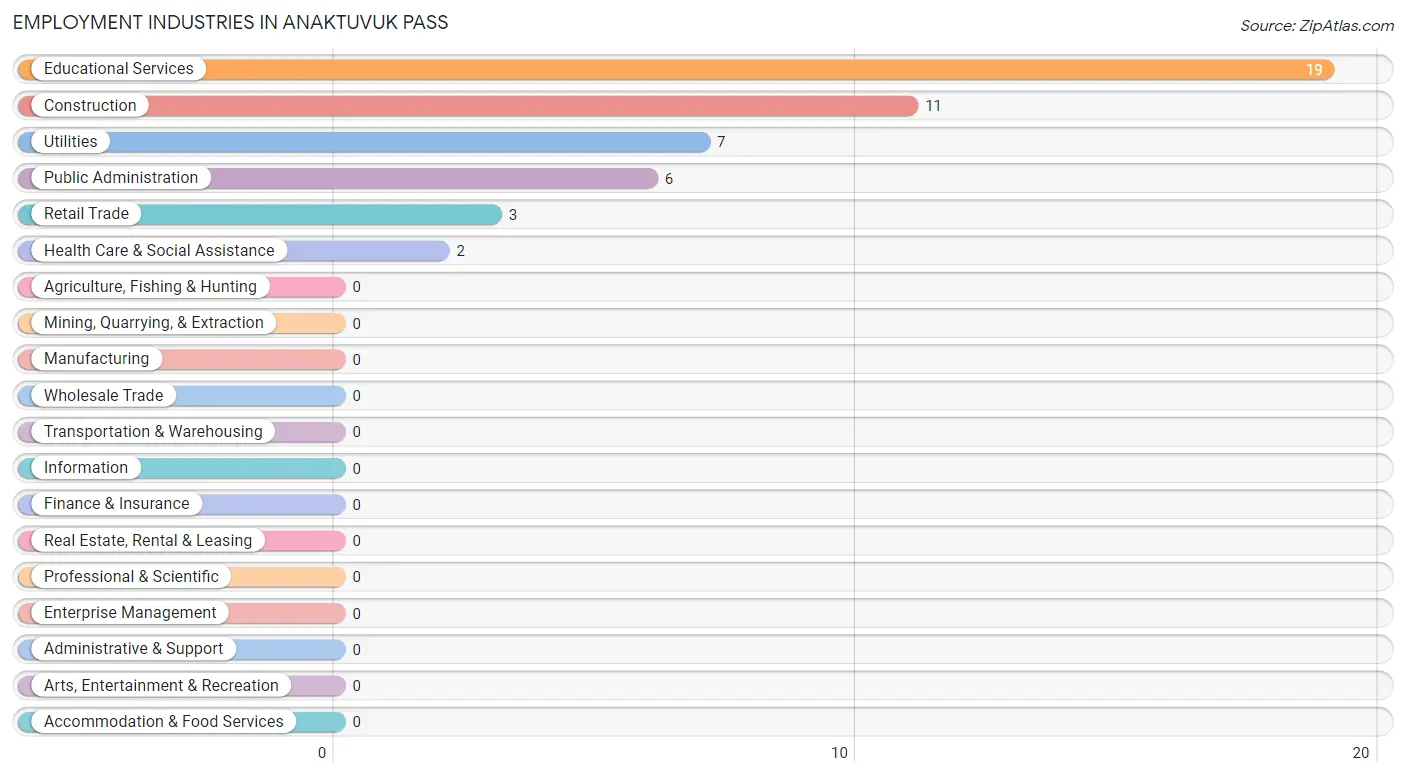
The major employment industries in Anaktuvuk Pass include Educational Services (19 | 33.3%), Construction (11 | 19.3%), Utilities (7 | 12.3%), Public Administration (6 | 10.5%), and Retail Trade (3 | 5.3%).
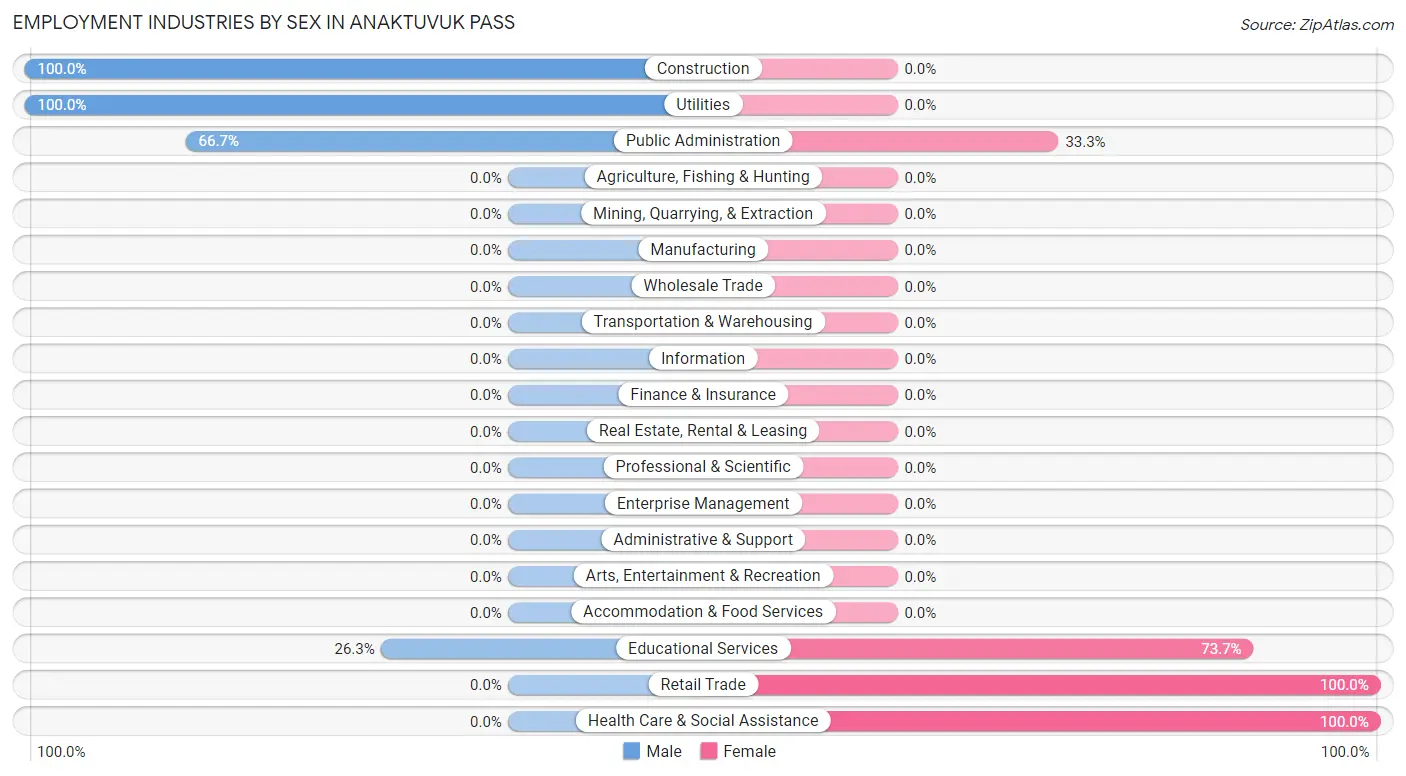
Employment Industries by Sex in Anaktuvuk Pass
The Anaktuvuk Pass industries that see more men than women are Construction (100.0%), Utilities (100.0%), and Public Administration (66.7%), whereas the industries that tend to have a higher number of women are Retail Trade (100.0%), Health Care & Social Assistance (100.0%), and Educational Services (73.7%).
| Industry | Male | Female |
| Agriculture, Fishing & Hunting | 0 (0.0%) | 0 (0.0%) |
| Mining, Quarrying, & Extraction | 0 (0.0%) | 0 (0.0%) |
| Construction | 11 (100.0%) | 0 (0.0%) |
| Manufacturing | 0 (0.0%) | 0 (0.0%) |
| Wholesale Trade | 0 (0.0%) | 0 (0.0%) |
| Retail Trade | 0 (0.0%) | 3 (100.0%) |
| Transportation & Warehousing | 0 (0.0%) | 0 (0.0%) |
| Utilities | 7 (100.0%) | 0 (0.0%) |
| Information | 0 (0.0%) | 0 (0.0%) |
| Finance & Insurance | 0 (0.0%) | 0 (0.0%) |
| Real Estate, Rental & Leasing | 0 (0.0%) | 0 (0.0%) |
| Professional & Scientific | 0 (0.0%) | 0 (0.0%) |
| Enterprise Management | 0 (0.0%) | 0 (0.0%) |
| Administrative & Support | 0 (0.0%) | 0 (0.0%) |
| Educational Services | 5 (26.3%) | 14 (73.7%) |
| Health Care & Social Assistance | 0 (0.0%) | 2 (100.0%) |
| Arts, Entertainment & Recreation | 0 (0.0%) | 0 (0.0%) |
| Accommodation & Food Services | 0 (0.0%) | 0 (0.0%) |
| Public Administration | 4 (66.7%) | 2 (33.3%) |
| Total | 36 (63.2%) | 21 (36.8%) |
Education in Anaktuvuk Pass
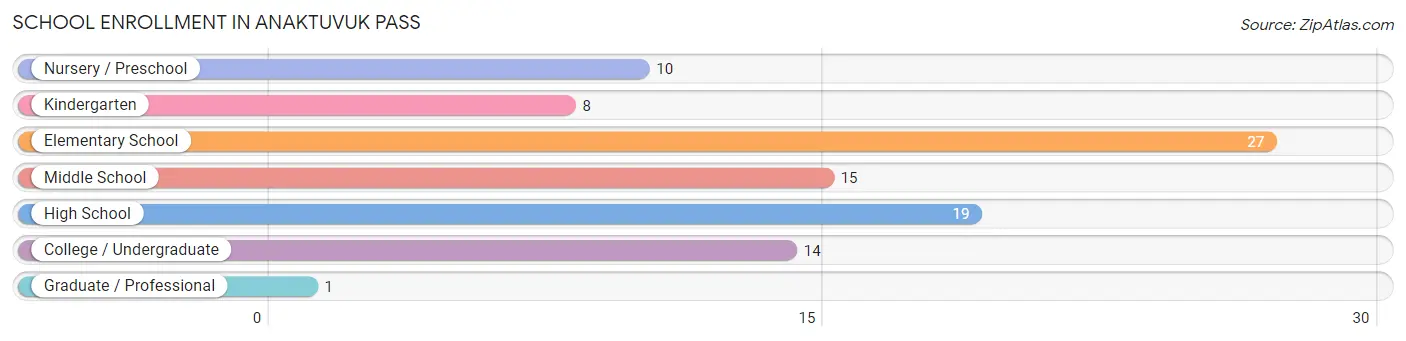
School Enrollment in Anaktuvuk Pass
The most common levels of schooling among the 94 students in Anaktuvuk Pass are elementary school (27 | 28.7%), high school (19 | 20.2%), and middle school (15 | 16.0%).
| School Level | # Students | % Students |
| Nursery / Preschool | 10 | 10.6% |
| Kindergarten | 8 | 8.5% |
| Elementary School | 27 | 28.7% |
| Middle School | 15 | 16.0% |
| High School | 19 | 20.2% |
| College / Undergraduate | 14 | 14.9% |
| Graduate / Professional | 1 | 1.1% |
| Total | 94 | 100.0% |
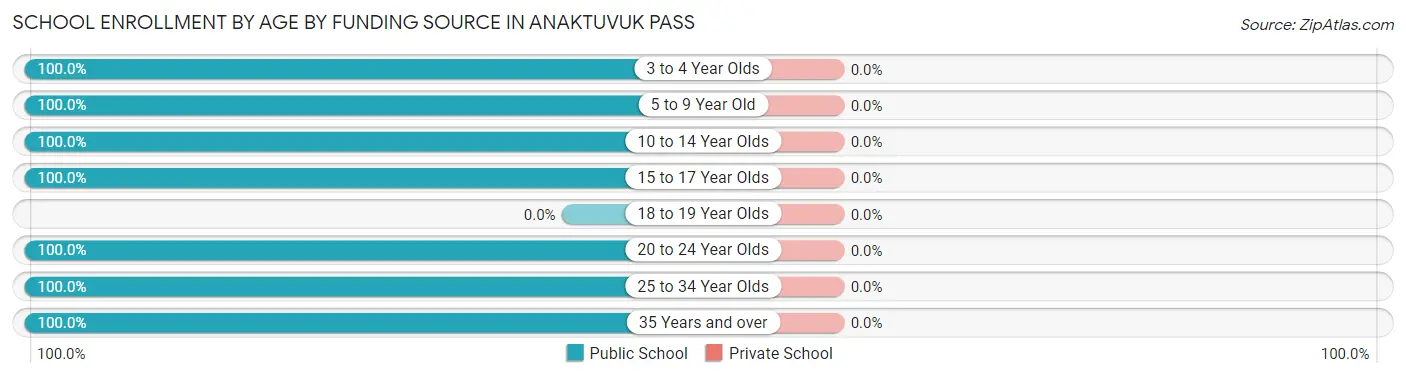
School Enrollment by Age by Funding Source in Anaktuvuk Pass
| Age Bracket | Public School | Private School |
| 3 to 4 Year Olds | 10 (100.0%) | 0 (0.0%) |
| 5 to 9 Year Old | 35 (100.0%) | 0 (0.0%) |
| 10 to 14 Year Olds | 15 (100.0%) | 0 (0.0%) |
| 15 to 17 Year Olds | 19 (100.0%) | 0 (0.0%) |
| 18 to 19 Year Olds | 0 (0.0%) | 0 (0.0%) |
| 20 to 24 Year Olds | 3 (100.0%) | 0 (0.0%) |
| 25 to 34 Year Olds | 8 (100.0%) | 0 (0.0%) |
| 35 Years and over | 4 (100.0%) | 0 (0.0%) |
| Total | 94 (100.0%) | 0 (0.0%) |
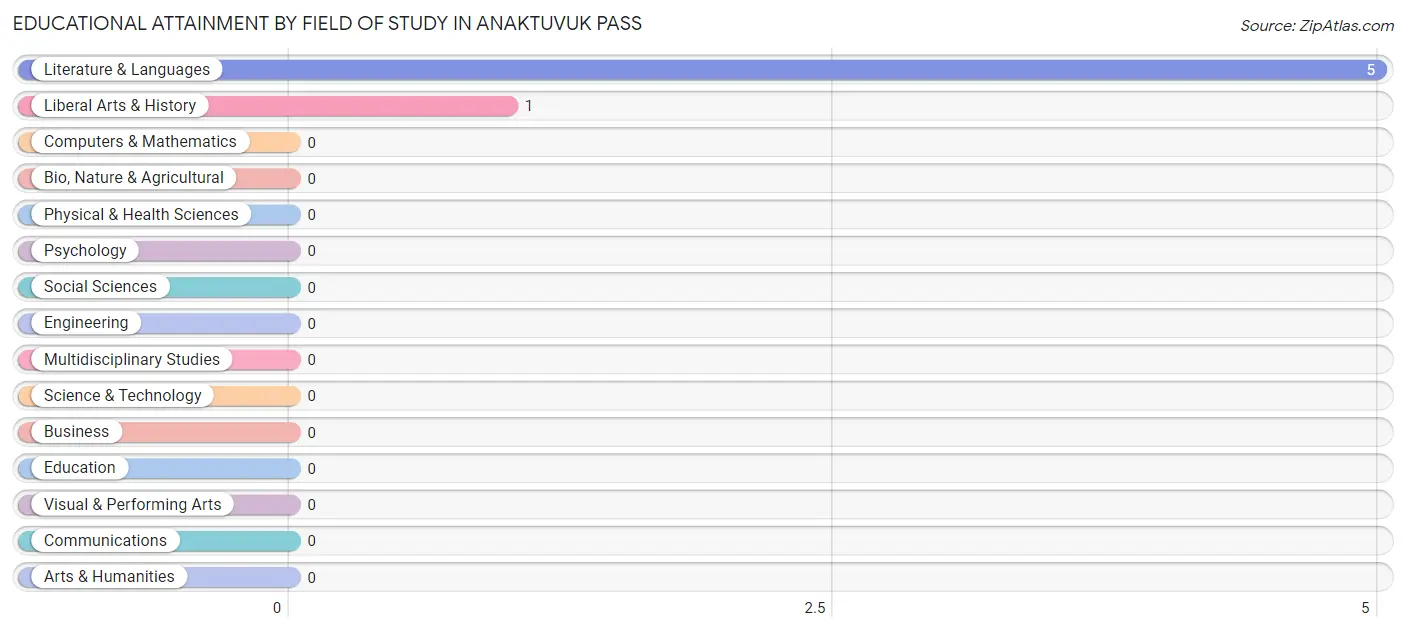
Educational Attainment by Field of Study in Anaktuvuk Pass
Literature & languages (5 | 83.3%), and liberal arts & history (1 | 16.7%) are the most common fields of study among 6 individuals in Anaktuvuk Pass who have obtained a bachelor's degree or higher.
| Field of Study | # Graduates | % Graduates |
| Computers & Mathematics | 0 | 0.0% |
| Bio, Nature & Agricultural | 0 | 0.0% |
| Physical & Health Sciences | 0 | 0.0% |
| Psychology | 0 | 0.0% |
| Social Sciences | 0 | 0.0% |
| Engineering | 0 | 0.0% |
| Multidisciplinary Studies | 0 | 0.0% |
| Science & Technology | 0 | 0.0% |
| Business | 0 | 0.0% |
| Education | 0 | 0.0% |
| Literature & Languages | 5 | 83.3% |
| Liberal Arts & History | 1 | 16.7% |
| Visual & Performing Arts | 0 | 0.0% |
| Communications | 0 | 0.0% |
| Arts & Humanities | 0 | 0.0% |
| Total | 6 | 100.0% |
Transportation & Commute in Anaktuvuk Pass
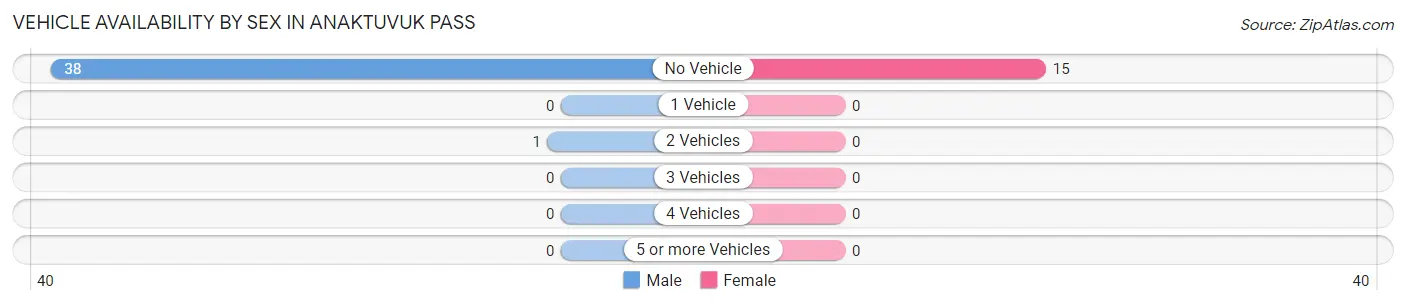
Vehicle Availability by Sex in Anaktuvuk Pass
The most prevalent vehicle ownership categories in Anaktuvuk Pass are males with no vehicle (38, accounting for 97.4%) and females with no vehicle (15, making up 253.3%).
| Vehicles Available | Male | Female |
| No Vehicle | 38 (97.4%) | 15 (100.0%) |
| 1 Vehicle | 0 (0.0%) | 0 (0.0%) |
| 2 Vehicles | 1 (2.6%) | 0 (0.0%) |
| 3 Vehicles | 0 (0.0%) | 0 (0.0%) |
| 4 Vehicles | 0 (0.0%) | 0 (0.0%) |
| 5 or more Vehicles | 0 (0.0%) | 0 (0.0%) |
| Total | 39 (100.0%) | 15 (100.0%) |
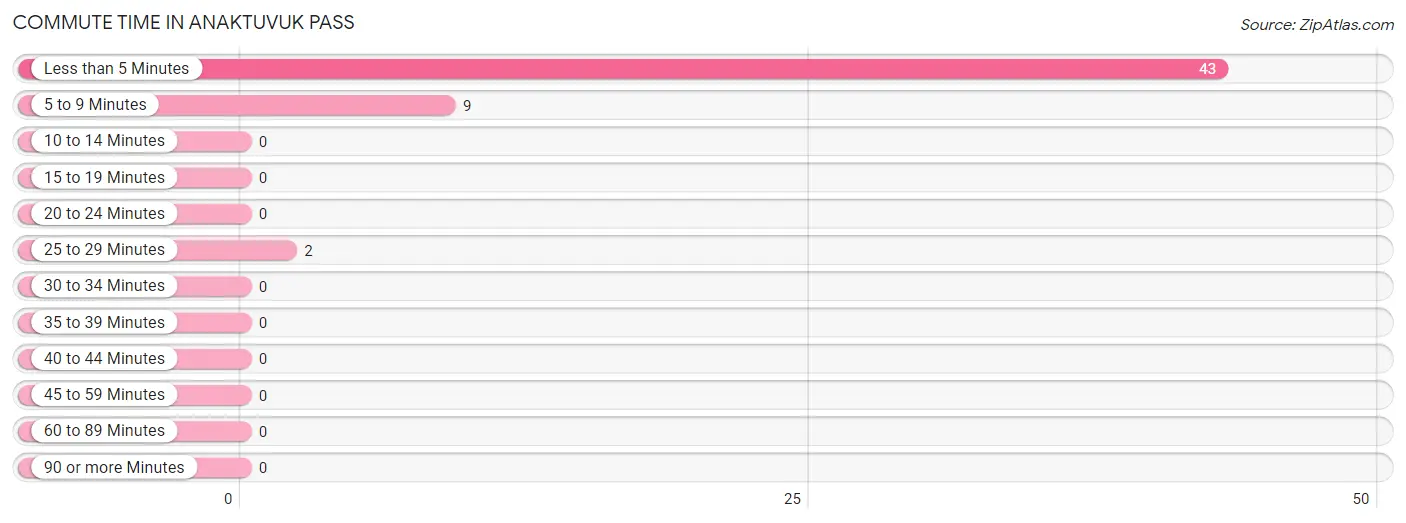
Commute Time in Anaktuvuk Pass
The most frequently occuring commute durations in Anaktuvuk Pass are less than 5 minutes (43 commuters, 79.6%), 5 to 9 minutes (9 commuters, 16.7%), and 25 to 29 minutes (2 commuters, 3.7%).
| Commute Time | # Commuters | % Commuters |
| Less than 5 Minutes | 43 | 79.6% |
| 5 to 9 Minutes | 9 | 16.7% |
| 10 to 14 Minutes | 0 | 0.0% |
| 15 to 19 Minutes | 0 | 0.0% |
| 20 to 24 Minutes | 0 | 0.0% |
| 25 to 29 Minutes | 2 | 3.7% |
| 30 to 34 Minutes | 0 | 0.0% |
| 35 to 39 Minutes | 0 | 0.0% |
| 40 to 44 Minutes | 0 | 0.0% |
| 45 to 59 Minutes | 0 | 0.0% |
| 60 to 89 Minutes | 0 | 0.0% |
| 90 or more Minutes | 0 | 0.0% |
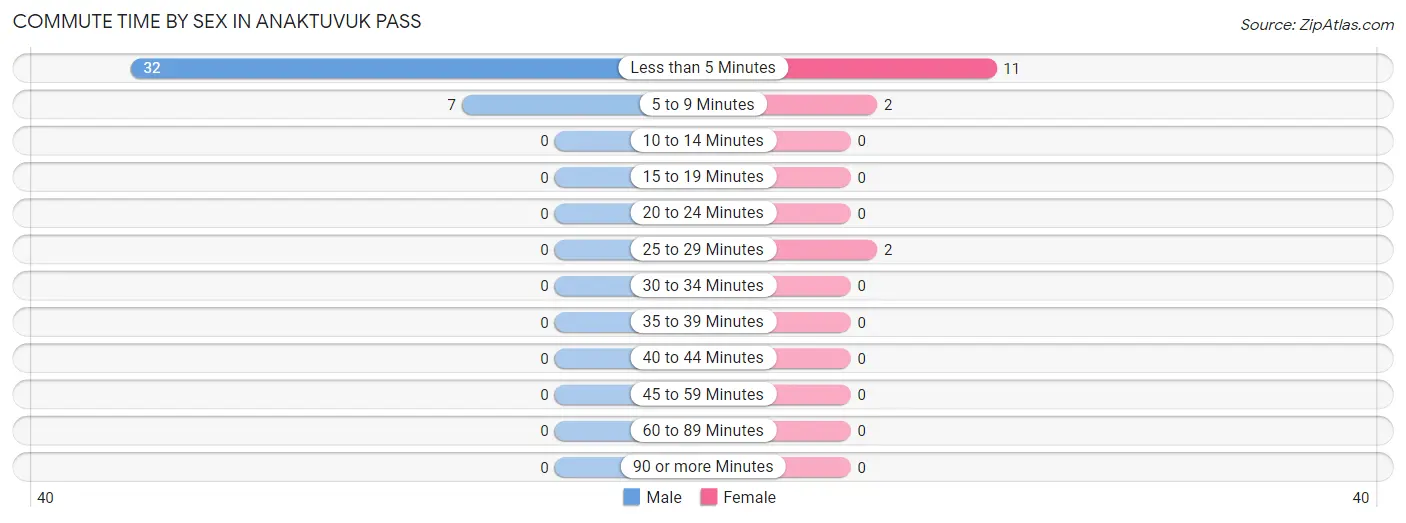
Commute Time by Sex in Anaktuvuk Pass
The most common commute times in Anaktuvuk Pass are less than 5 minutes (32 commuters, 82.1%) for males and less than 5 minutes (11 commuters, 73.3%) for females.
| Commute Time | Male | Female |
| Less than 5 Minutes | 32 (82.1%) | 11 (73.3%) |
| 5 to 9 Minutes | 7 (17.9%) | 2 (13.3%) |
| 10 to 14 Minutes | 0 (0.0%) | 0 (0.0%) |
| 15 to 19 Minutes | 0 (0.0%) | 0 (0.0%) |
| 20 to 24 Minutes | 0 (0.0%) | 0 (0.0%) |
| 25 to 29 Minutes | 0 (0.0%) | 2 (13.3%) |
| 30 to 34 Minutes | 0 (0.0%) | 0 (0.0%) |
| 35 to 39 Minutes | 0 (0.0%) | 0 (0.0%) |
| 40 to 44 Minutes | 0 (0.0%) | 0 (0.0%) |
| 45 to 59 Minutes | 0 (0.0%) | 0 (0.0%) |
| 60 to 89 Minutes | 0 (0.0%) | 0 (0.0%) |
| 90 or more Minutes | 0 (0.0%) | 0 (0.0%) |
Time of Departure to Work by Sex in Anaktuvuk Pass
The most frequent times of departure to work in Anaktuvuk Pass are 8:00 AM to 8:29 AM (15, 38.5%) for males and 7:30 AM to 7:59 AM (9, 60.0%) for females.
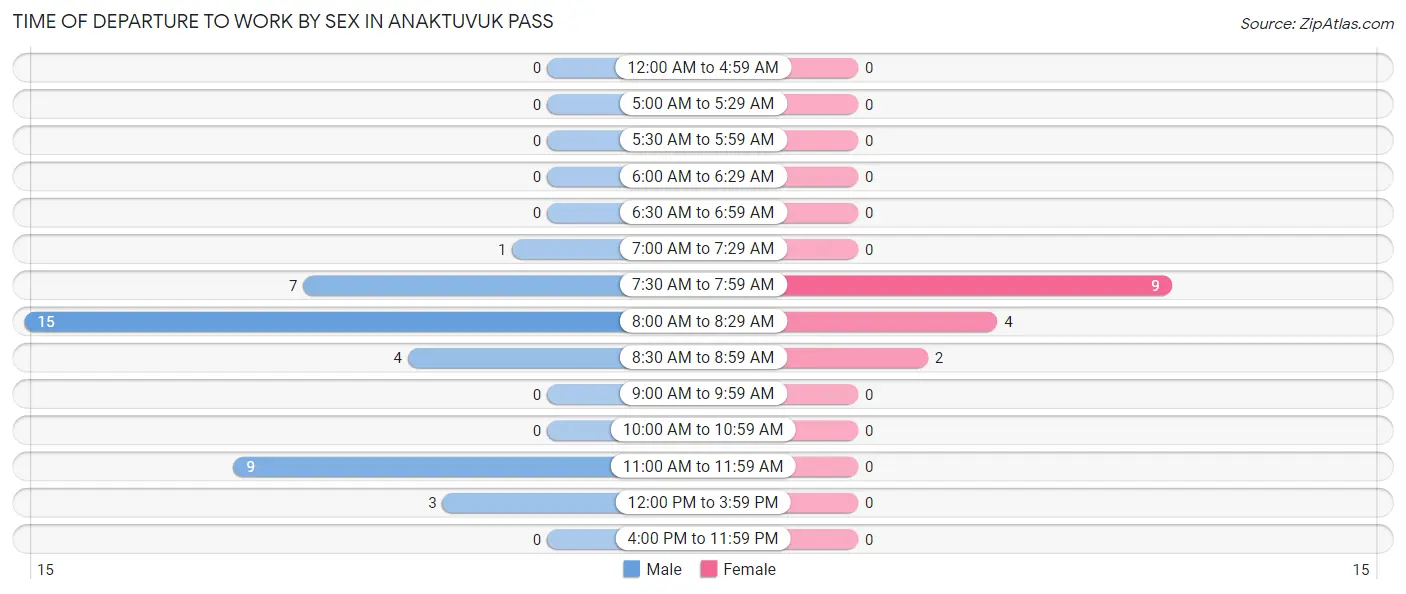
| Time of Departure | Male | Female |
| 12:00 AM to 4:59 AM | 0 (0.0%) | 0 (0.0%) |
| 5:00 AM to 5:29 AM | 0 (0.0%) | 0 (0.0%) |
| 5:30 AM to 5:59 AM | 0 (0.0%) | 0 (0.0%) |
| 6:00 AM to 6:29 AM | 0 (0.0%) | 0 (0.0%) |
| 6:30 AM to 6:59 AM | 0 (0.0%) | 0 (0.0%) |
| 7:00 AM to 7:29 AM | 1 (2.6%) | 0 (0.0%) |
| 7:30 AM to 7:59 AM | 7 (17.9%) | 9 (60.0%) |
| 8:00 AM to 8:29 AM | 15 (38.5%) | 4 (26.7%) |
| 8:30 AM to 8:59 AM | 4 (10.3%) | 2 (13.3%) |
| 9:00 AM to 9:59 AM | 0 (0.0%) | 0 (0.0%) |
| 10:00 AM to 10:59 AM | 0 (0.0%) | 0 (0.0%) |
| 11:00 AM to 11:59 AM | 9 (23.1%) | 0 (0.0%) |
| 12:00 PM to 3:59 PM | 3 (7.7%) | 0 (0.0%) |
| 4:00 PM to 11:59 PM | 0 (0.0%) | 0 (0.0%) |
| Total | 39 (100.0%) | 15 (100.0%) |
Housing Occupancy in Anaktuvuk Pass
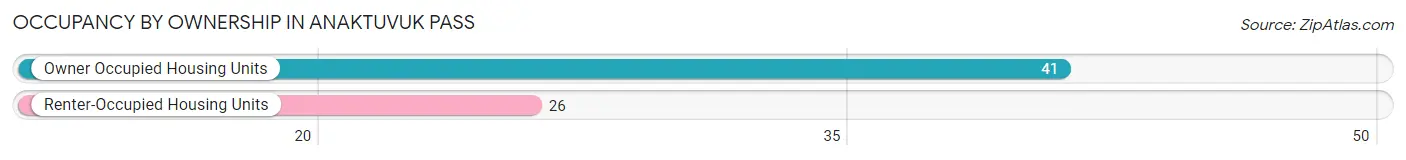
Occupancy by Ownership in Anaktuvuk Pass
Of the total 67 dwellings in Anaktuvuk Pass, owner-occupied units account for 41 (61.2%), while renter-occupied units make up 26 (38.8%).
| Occupancy | # Housing Units | % Housing Units |
| Owner Occupied Housing Units | 41 | 61.2% |
| Renter-Occupied Housing Units | 26 | 38.8% |
| Total Occupied Housing Units | 67 | 100.0% |
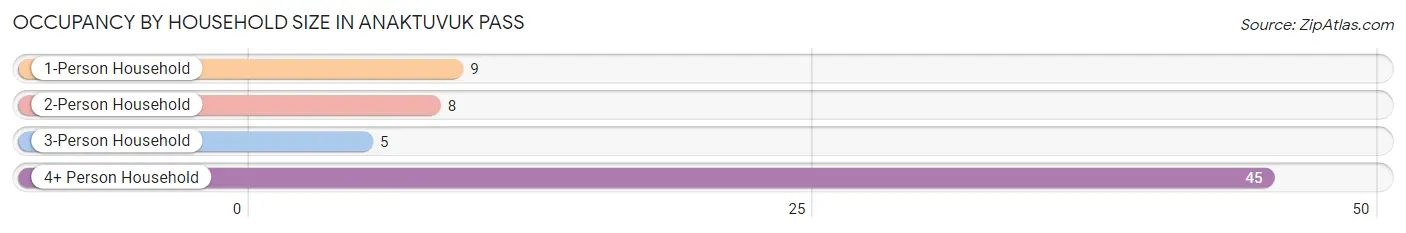
Occupancy by Household Size in Anaktuvuk Pass
| Household Size | # Housing Units | % Housing Units |
| 1-Person Household | 9 | 13.4% |
| 2-Person Household | 8 | 11.9% |
| 3-Person Household | 5 | 7.5% |
| 4+ Person Household | 45 | 67.2% |
| Total Housing Units | 67 | 100.0% |
Occupancy by Ownership by Household Size in Anaktuvuk Pass
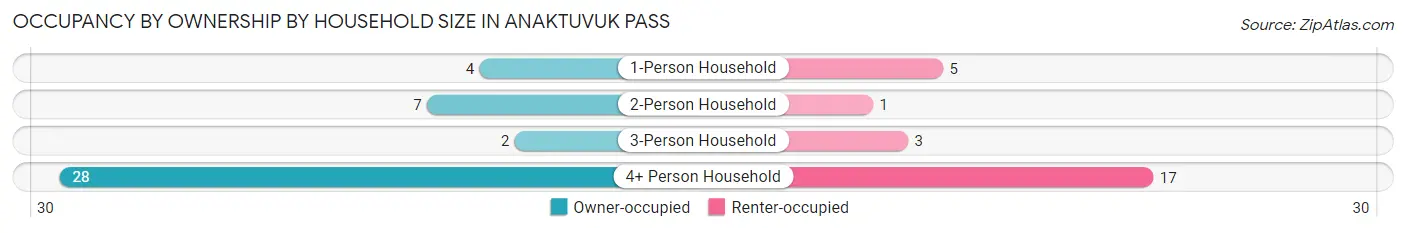
| Household Size | Owner-occupied | Renter-occupied |
| 1-Person Household | 4 (44.4%) | 5 (55.6%) |
| 2-Person Household | 7 (87.5%) | 1 (12.5%) |
| 3-Person Household | 2 (40.0%) | 3 (60.0%) |
| 4+ Person Household | 28 (62.2%) | 17 (37.8%) |
| Total Housing Units | 41 (61.2%) | 26 (38.8%) |
Occupancy by Educational Attainment in Anaktuvuk Pass
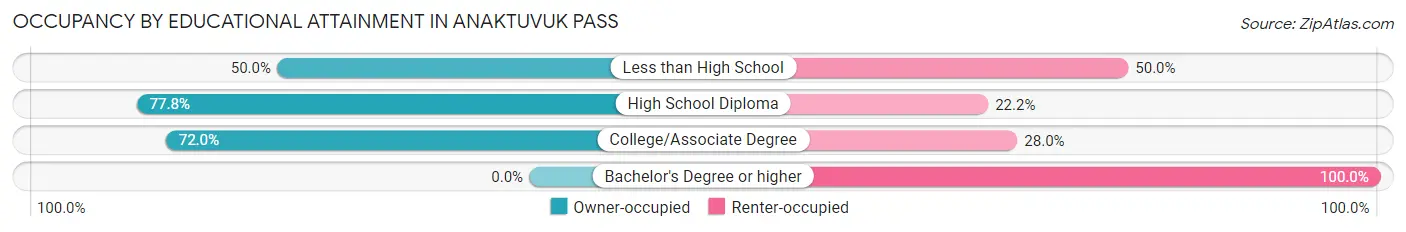
| Household Size | Owner-occupied | Renter-occupied |
| Less than High School | 9 (50.0%) | 9 (50.0%) |
| High School Diploma | 14 (77.8%) | 4 (22.2%) |
| College/Associate Degree | 18 (72.0%) | 7 (28.0%) |
| Bachelor's Degree or higher | 0 (0.0%) | 6 (100.0%) |
Occupancy by Age of Householder in Anaktuvuk Pass
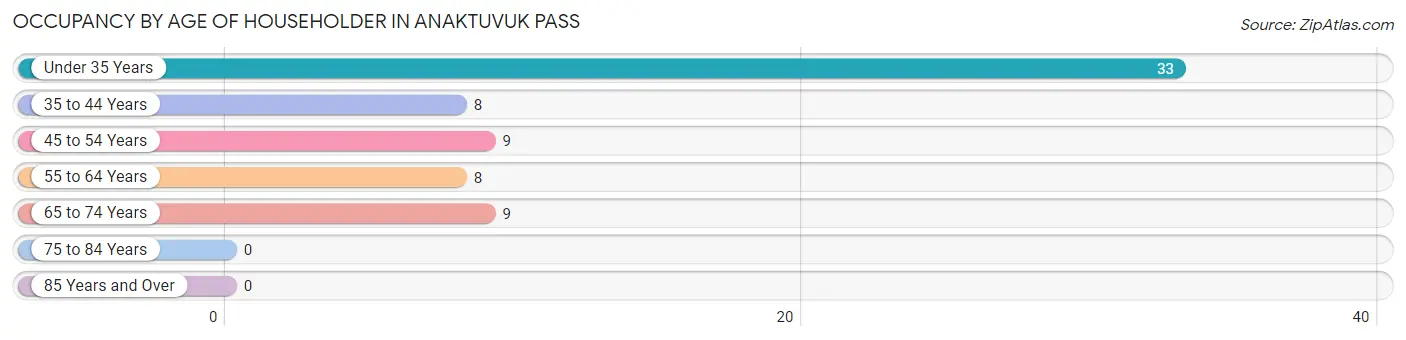
| Age Bracket | # Households | % Households |
| Under 35 Years | 33 | 49.2% |
| 35 to 44 Years | 8 | 11.9% |
| 45 to 54 Years | 9 | 13.4% |
| 55 to 64 Years | 8 | 11.9% |
| 65 to 74 Years | 9 | 13.4% |
| 75 to 84 Years | 0 | 0.0% |
| 85 Years and Over | 0 | 0.0% |
| Total | 67 | 100.0% |
Housing Finances in Anaktuvuk Pass
Median Income by Occupancy in Anaktuvuk Pass
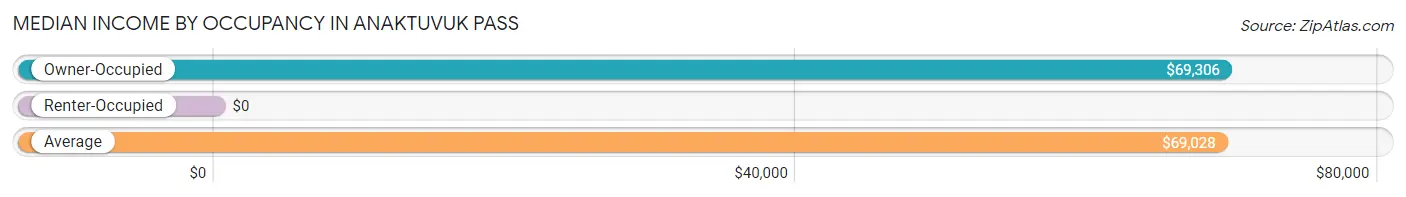
| Occupancy Type | # Households | Median Income |
| Owner-Occupied | 41 (61.2%) | $69,306 |
| Renter-Occupied | 26 (38.8%) | $0 |
| Average | 67 (100.0%) | $69,028 |
Occupancy by Householder Income Bracket in Anaktuvuk Pass
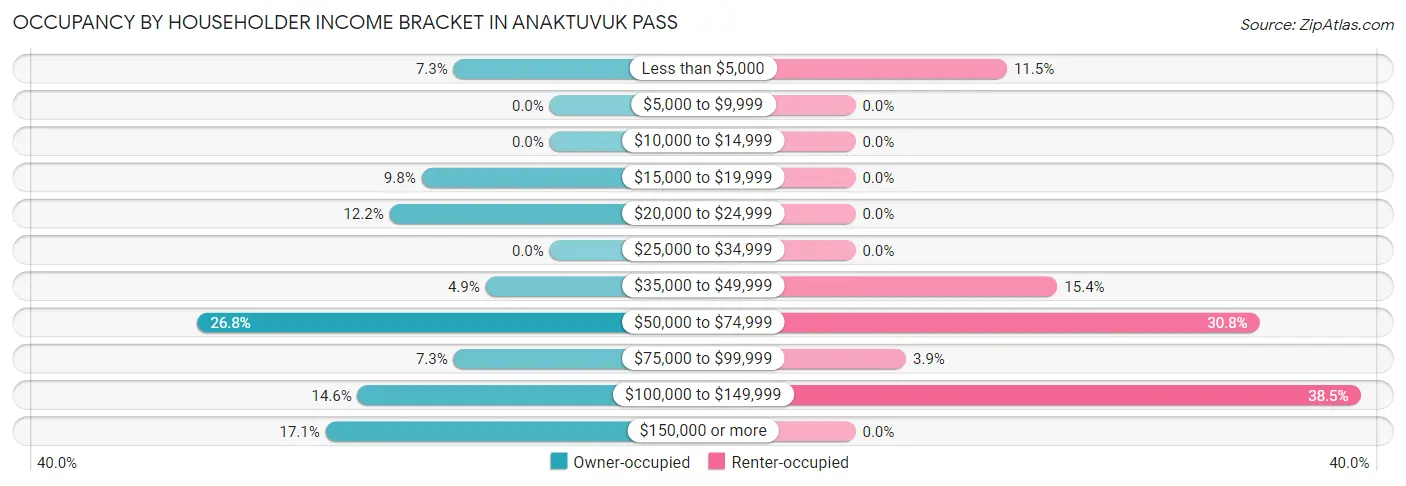
| Income Bracket | Owner-occupied | Renter-occupied |
| Less than $5,000 | 3 (7.3%) | 3 (11.5%) |
| $5,000 to $9,999 | 0 (0.0%) | 0 (0.0%) |
| $10,000 to $14,999 | 0 (0.0%) | 0 (0.0%) |
| $15,000 to $19,999 | 4 (9.8%) | 0 (0.0%) |
| $20,000 to $24,999 | 5 (12.2%) | 0 (0.0%) |
| $25,000 to $34,999 | 0 (0.0%) | 0 (0.0%) |
| $35,000 to $49,999 | 2 (4.9%) | 4 (15.4%) |
| $50,000 to $74,999 | 11 (26.8%) | 8 (30.8%) |
| $75,000 to $99,999 | 3 (7.3%) | 1 (3.8%) |
| $100,000 to $149,999 | 6 (14.6%) | 10 (38.5%) |
| $150,000 or more | 7 (17.1%) | 0 (0.0%) |
| Total | 41 (100.0%) | 26 (100.0%) |
Monthly Housing Cost Tiers in Anaktuvuk Pass
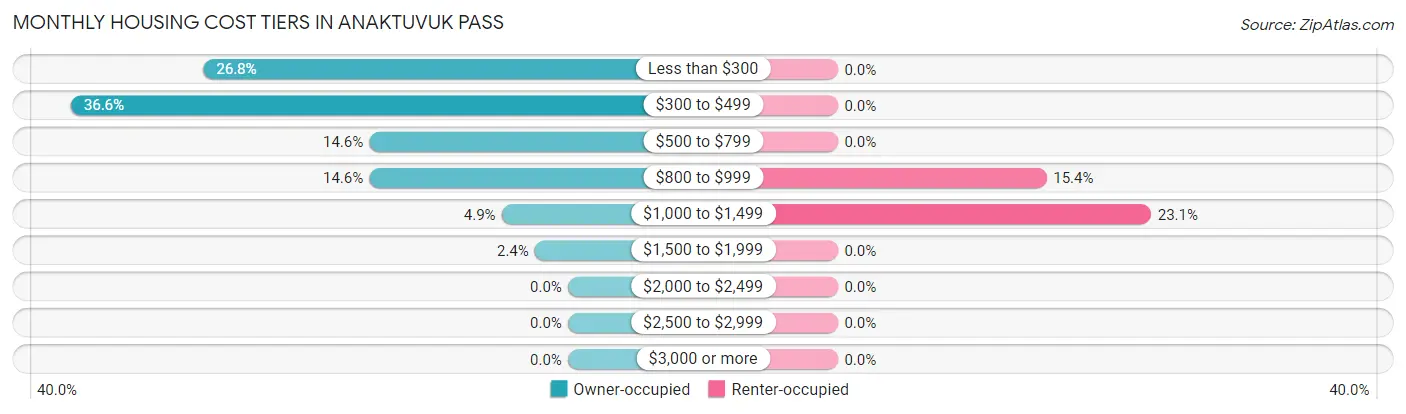
| Monthly Cost | Owner-occupied | Renter-occupied |
| Less than $300 | 11 (26.8%) | 0 (0.0%) |
| $300 to $499 | 15 (36.6%) | 0 (0.0%) |
| $500 to $799 | 6 (14.6%) | 0 (0.0%) |
| $800 to $999 | 6 (14.6%) | 4 (15.4%) |
| $1,000 to $1,499 | 2 (4.9%) | 6 (23.1%) |
| $1,500 to $1,999 | 1 (2.4%) | 0 (0.0%) |
| $2,000 to $2,499 | 0 (0.0%) | 0 (0.0%) |
| $2,500 to $2,999 | 0 (0.0%) | 0 (0.0%) |
| $3,000 or more | 0 (0.0%) | 0 (0.0%) |
| Total | 41 (100.0%) | 26 (100.0%) |
Physical Housing Characteristics in Anaktuvuk Pass
Housing Structures in Anaktuvuk Pass
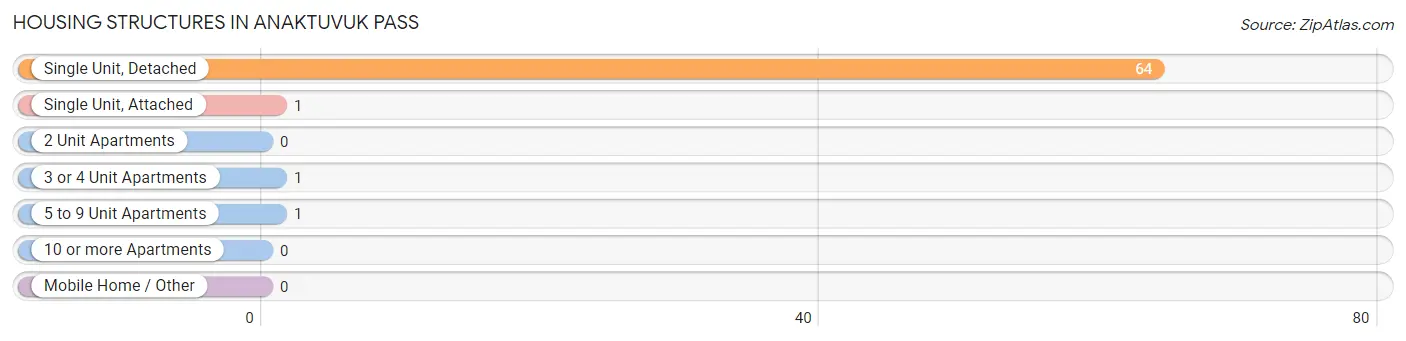
| Structure Type | # Housing Units | % Housing Units |
| Single Unit, Detached | 64 | 95.5% |
| Single Unit, Attached | 1 | 1.5% |
| 2 Unit Apartments | 0 | 0.0% |
| 3 or 4 Unit Apartments | 1 | 1.5% |
| 5 to 9 Unit Apartments | 1 | 1.5% |
| 10 or more Apartments | 0 | 0.0% |
| Mobile Home / Other | 0 | 0.0% |
| Total | 67 | 100.0% |
Housing Structures by Occupancy in Anaktuvuk Pass
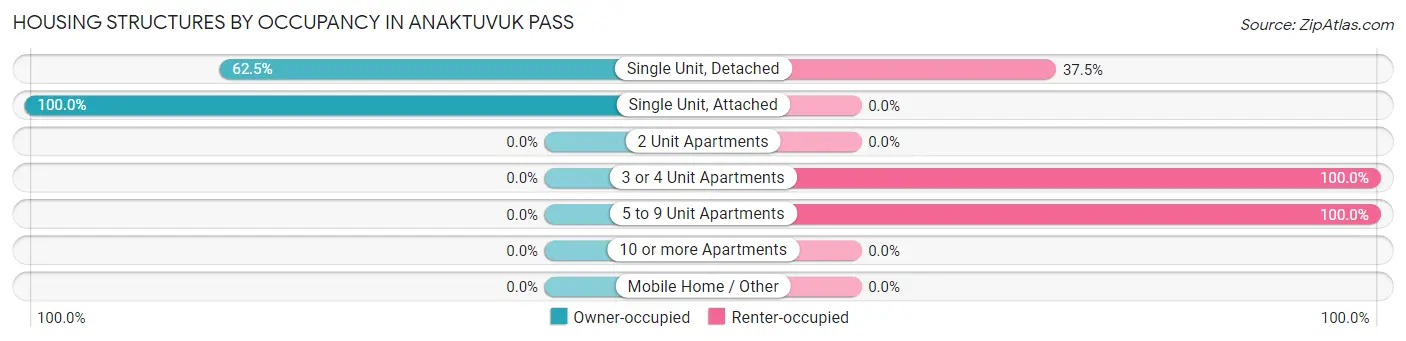
| Structure Type | Owner-occupied | Renter-occupied |
| Single Unit, Detached | 40 (62.5%) | 24 (37.5%) |
| Single Unit, Attached | 1 (100.0%) | 0 (0.0%) |
| 2 Unit Apartments | 0 (0.0%) | 0 (0.0%) |
| 3 or 4 Unit Apartments | 0 (0.0%) | 1 (100.0%) |
| 5 to 9 Unit Apartments | 0 (0.0%) | 1 (100.0%) |
| 10 or more Apartments | 0 (0.0%) | 0 (0.0%) |
| Mobile Home / Other | 0 (0.0%) | 0 (0.0%) |
| Total | 41 (61.2%) | 26 (38.8%) |
Housing Structures by Number of Rooms in Anaktuvuk Pass
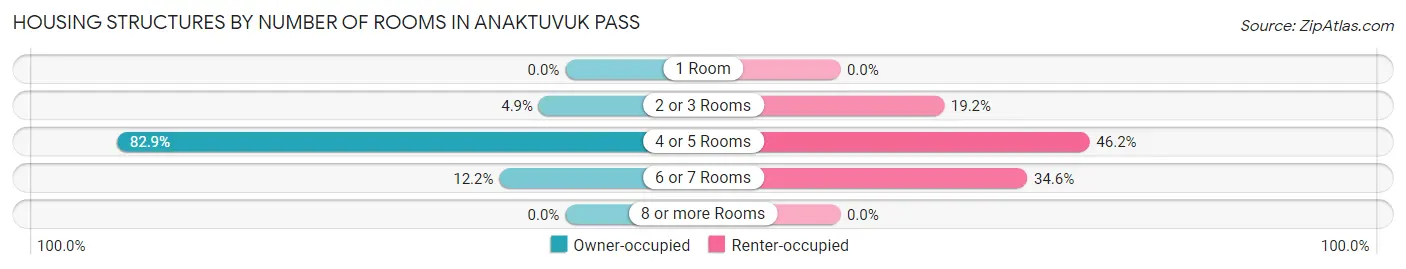
| Number of Rooms | Owner-occupied | Renter-occupied |
| 1 Room | 0 (0.0%) | 0 (0.0%) |
| 2 or 3 Rooms | 2 (4.9%) | 5 (19.2%) |
| 4 or 5 Rooms | 34 (82.9%) | 12 (46.2%) |
| 6 or 7 Rooms | 5 (12.2%) | 9 (34.6%) |
| 8 or more Rooms | 0 (0.0%) | 0 (0.0%) |
| Total | 41 (100.0%) | 26 (100.0%) |
Housing Structure by Heating Type in Anaktuvuk Pass
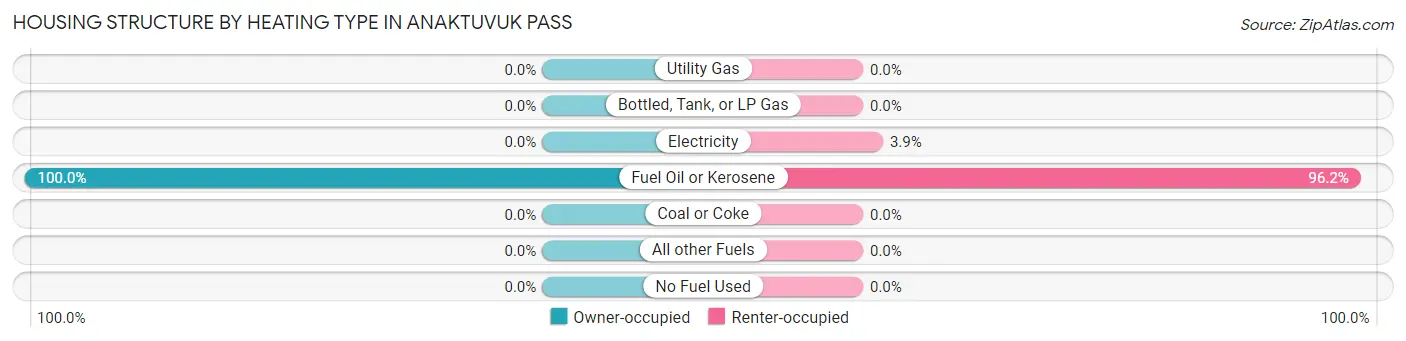
| Heating Type | Owner-occupied | Renter-occupied |
| Utility Gas | 0 (0.0%) | 0 (0.0%) |
| Bottled, Tank, or LP Gas | 0 (0.0%) | 0 (0.0%) |
| Electricity | 0 (0.0%) | 1 (3.8%) |
| Fuel Oil or Kerosene | 41 (100.0%) | 25 (96.2%) |
| Coal or Coke | 0 (0.0%) | 0 (0.0%) |
| All other Fuels | 0 (0.0%) | 0 (0.0%) |
| No Fuel Used | 0 (0.0%) | 0 (0.0%) |
| Total | 41 (100.0%) | 26 (100.0%) |
Household Vehicle Usage in Anaktuvuk Pass
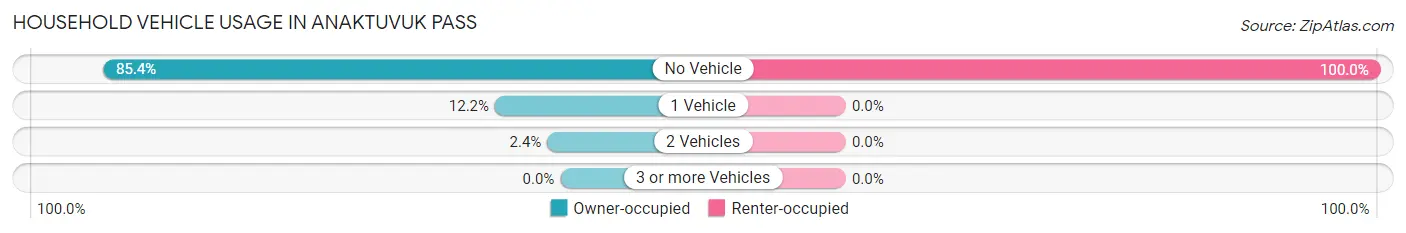
| Vehicles per Household | Owner-occupied | Renter-occupied |
| No Vehicle | 35 (85.4%) | 26 (100.0%) |
| 1 Vehicle | 5 (12.2%) | 0 (0.0%) |
| 2 Vehicles | 1 (2.4%) | 0 (0.0%) |
| 3 or more Vehicles | 0 (0.0%) | 0 (0.0%) |
| Total | 41 (100.0%) | 26 (100.0%) |
Real Estate & Mortgages in Anaktuvuk Pass
Real Estate and Mortgage Overview in Anaktuvuk Pass
| Characteristic | Without Mortgage | With Mortgage |
| Housing Units | 35 | 6 |
| Median Property Value | - | - |
| Median Household Income | $69,583 | $0 |
| Monthly Housing Costs | $375 | $0 |
| Real Estate Taxes | $1,375 | $0 |
Property Value by Mortgage Status in Anaktuvuk Pass
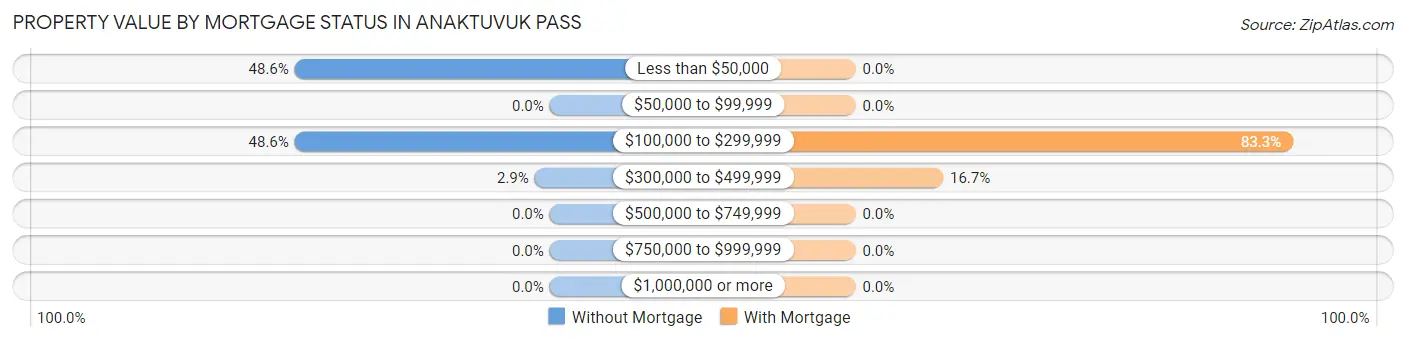
| Property Value | Without Mortgage | With Mortgage |
| Less than $50,000 | 17 (48.6%) | 0 (0.0%) |
| $50,000 to $99,999 | 0 (0.0%) | 0 (0.0%) |
| $100,000 to $299,999 | 17 (48.6%) | 5 (83.3%) |
| $300,000 to $499,999 | 1 (2.9%) | 1 (16.7%) |
| $500,000 to $749,999 | 0 (0.0%) | 0 (0.0%) |
| $750,000 to $999,999 | 0 (0.0%) | 0 (0.0%) |
| $1,000,000 or more | 0 (0.0%) | 0 (0.0%) |
| Total | 35 (100.0%) | 6 (100.0%) |
Household Income by Mortgage Status in Anaktuvuk Pass
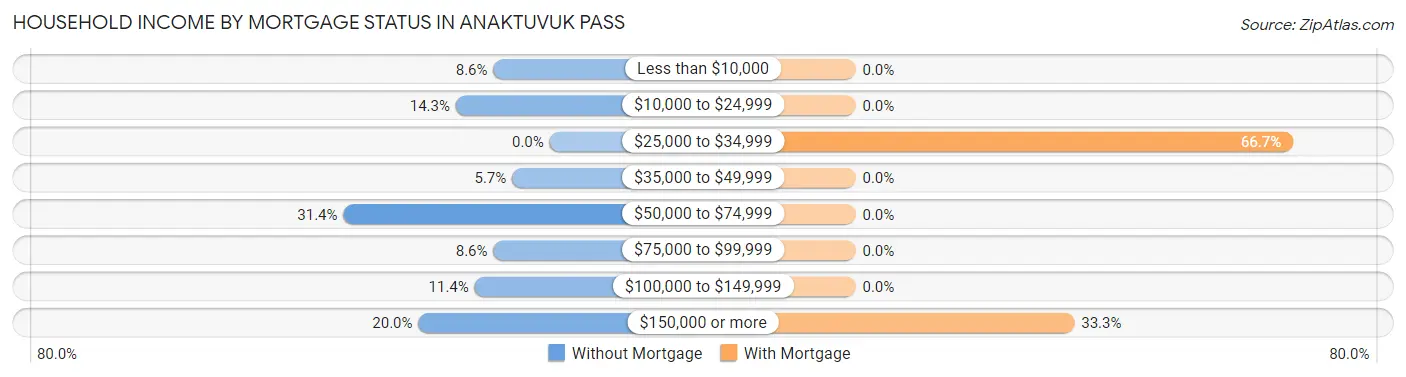
| Household Income | Without Mortgage | With Mortgage |
| Less than $10,000 | 3 (8.6%) | 0 (0.0%) |
| $10,000 to $24,999 | 5 (14.3%) | 0 (0.0%) |
| $25,000 to $34,999 | 0 (0.0%) | 4 (66.7%) |
| $35,000 to $49,999 | 2 (5.7%) | 0 (0.0%) |
| $50,000 to $74,999 | 11 (31.4%) | 0 (0.0%) |
| $75,000 to $99,999 | 3 (8.6%) | 0 (0.0%) |
| $100,000 to $149,999 | 4 (11.4%) | 0 (0.0%) |
| $150,000 or more | 7 (20.0%) | 2 (33.3%) |
| Total | 35 (100.0%) | 6 (100.0%) |
Property Value to Household Income Ratio in Anaktuvuk Pass
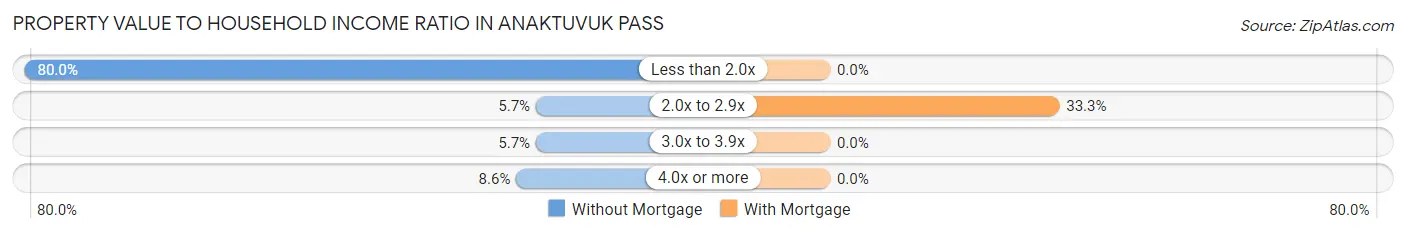
| Value-to-Income Ratio | Without Mortgage | With Mortgage |
| Less than 2.0x | 28 (80.0%) | 0 (0.0%) |
| 2.0x to 2.9x | 2 (5.7%) | 2 (33.3%) |
| 3.0x to 3.9x | 2 (5.7%) | 0 (0.0%) |
| 4.0x or more | 3 (8.6%) | 0 (0.0%) |
| Total | 35 (100.0%) | 6 (100.0%) |
Real Estate Taxes by Mortgage Status in Anaktuvuk Pass
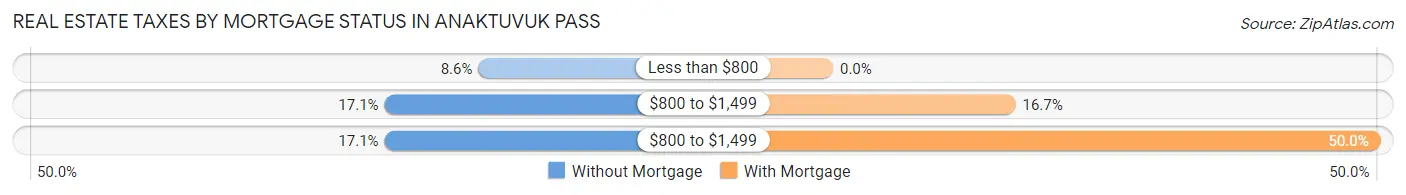
| Property Taxes | Without Mortgage | With Mortgage |
| Less than $800 | 3 (8.6%) | 0 (0.0%) |
| $800 to $1,499 | 6 (17.1%) | 1 (16.7%) |
| $800 to $1,499 | 6 (17.1%) | 3 (50.0%) |
| Total | 35 (100.0%) | 6 (100.0%) |
Health & Disability in Anaktuvuk Pass
Health Insurance Coverage by Age in Anaktuvuk Pass
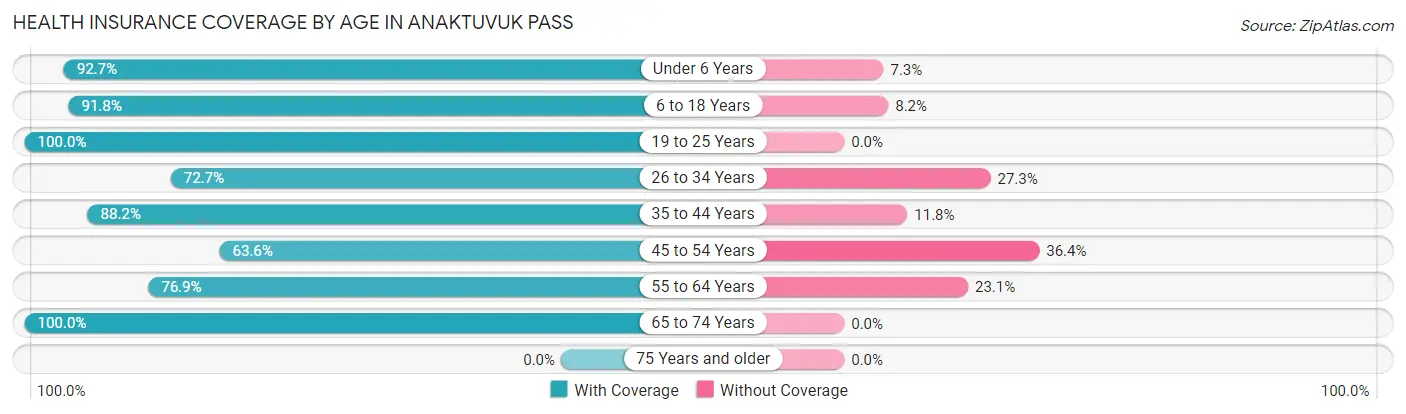
| Age Bracket | With Coverage | Without Coverage |
| Under 6 Years | 38 (92.7%) | 3 (7.3%) |
| 6 to 18 Years | 56 (91.8%) | 5 (8.2%) |
| 19 to 25 Years | 12 (100.0%) | 0 (0.0%) |
| 26 to 34 Years | 40 (72.7%) | 15 (27.3%) |
| 35 to 44 Years | 15 (88.2%) | 2 (11.8%) |
| 45 to 54 Years | 7 (63.6%) | 4 (36.4%) |
| 55 to 64 Years | 10 (76.9%) | 3 (23.1%) |
| 65 to 74 Years | 9 (100.0%) | 0 (0.0%) |
| 75 Years and older | 0 (0.0%) | 0 (0.0%) |
| Total | 187 (85.4%) | 32 (14.6%) |
Health Insurance Coverage by Citizenship Status in Anaktuvuk Pass
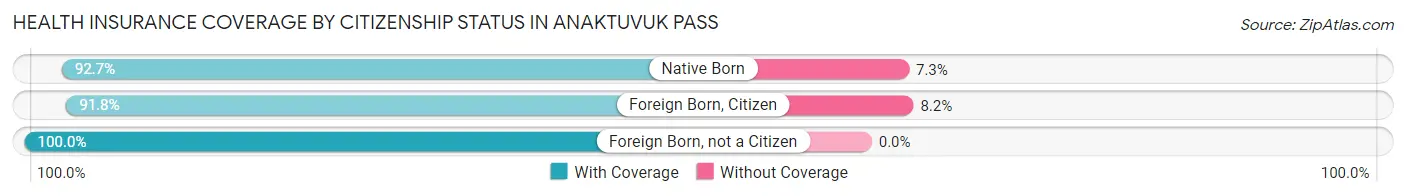
| Citizenship Status | With Coverage | Without Coverage |
| Native Born | 38 (92.7%) | 3 (7.3%) |
| Foreign Born, Citizen | 56 (91.8%) | 5 (8.2%) |
| Foreign Born, not a Citizen | 12 (100.0%) | 0 (0.0%) |
Health Insurance Coverage by Household Income in Anaktuvuk Pass
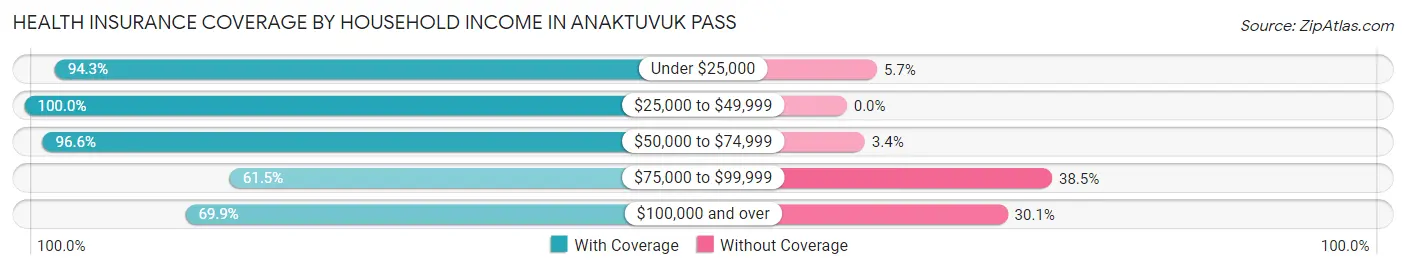
| Household Income | With Coverage | Without Coverage |
| Under $25,000 | 50 (94.3%) | 3 (5.7%) |
| $25,000 to $49,999 | 21 (100.0%) | 0 (0.0%) |
| $50,000 to $74,999 | 57 (96.6%) | 2 (3.4%) |
| $75,000 to $99,999 | 8 (61.5%) | 5 (38.5%) |
| $100,000 and over | 51 (69.9%) | 22 (30.1%) |
Public vs Private Health Insurance Coverage by Age in Anaktuvuk Pass
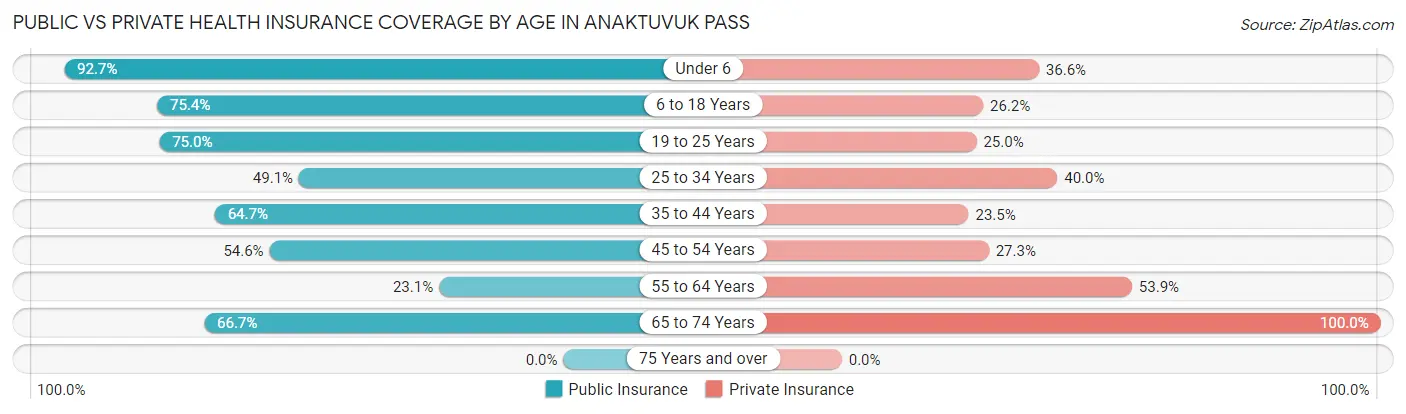
| Age Bracket | Public Insurance | Private Insurance |
| Under 6 | 38 (92.7%) | 15 (36.6%) |
| 6 to 18 Years | 46 (75.4%) | 16 (26.2%) |
| 19 to 25 Years | 9 (75.0%) | 3 (25.0%) |
| 25 to 34 Years | 27 (49.1%) | 22 (40.0%) |
| 35 to 44 Years | 11 (64.7%) | 4 (23.5%) |
| 45 to 54 Years | 6 (54.5%) | 3 (27.3%) |
| 55 to 64 Years | 3 (23.1%) | 7 (53.8%) |
| 65 to 74 Years | 6 (66.7%) | 9 (100.0%) |
| 75 Years and over | 0 (0.0%) | 0 (0.0%) |
| Total | 146 (66.7%) | 79 (36.1%) |
Disability Status by Sex by Age in Anaktuvuk Pass
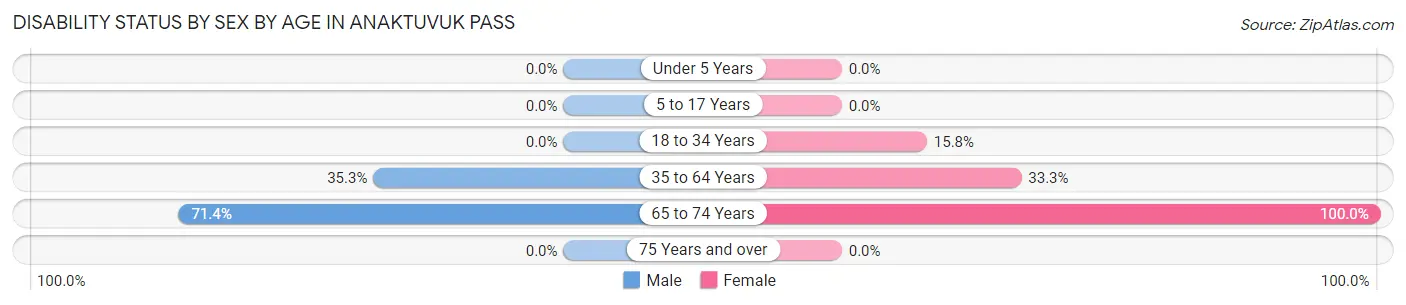
| Age Bracket | Male | Female |
| Under 5 Years | 0 (0.0%) | 0 (0.0%) |
| 5 to 17 Years | 0 (0.0%) | 0 (0.0%) |
| 18 to 34 Years | 0 (0.0%) | 3 (15.8%) |
| 35 to 64 Years | 6 (35.3%) | 8 (33.3%) |
| 65 to 74 Years | 5 (71.4%) | 2 (100.0%) |
| 75 Years and over | 0 (0.0%) | 0 (0.0%) |
Disability Class by Sex by Age in Anaktuvuk Pass
Disability Class: Hearing Difficulty
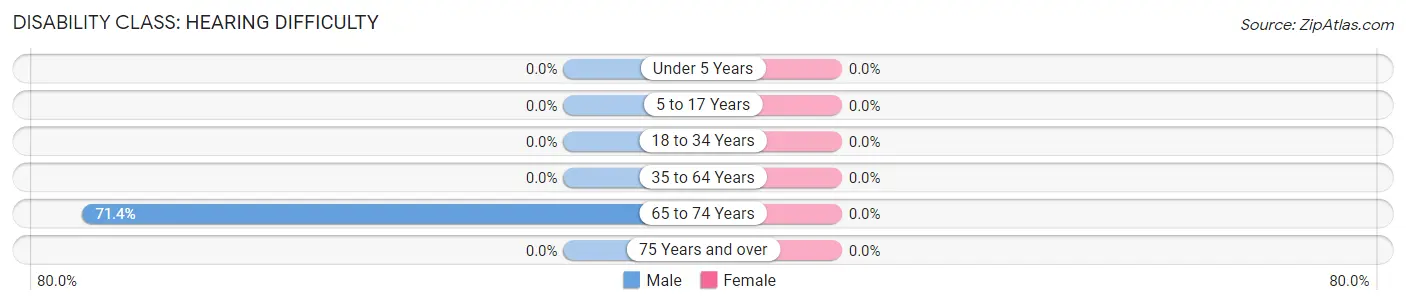
| Age Bracket | Male | Female |
| Under 5 Years | 0 (0.0%) | 0 (0.0%) |
| 5 to 17 Years | 0 (0.0%) | 0 (0.0%) |
| 18 to 34 Years | 0 (0.0%) | 0 (0.0%) |
| 35 to 64 Years | 0 (0.0%) | 0 (0.0%) |
| 65 to 74 Years | 5 (71.4%) | 0 (0.0%) |
| 75 Years and over | 0 (0.0%) | 0 (0.0%) |
Disability Class: Vision Difficulty
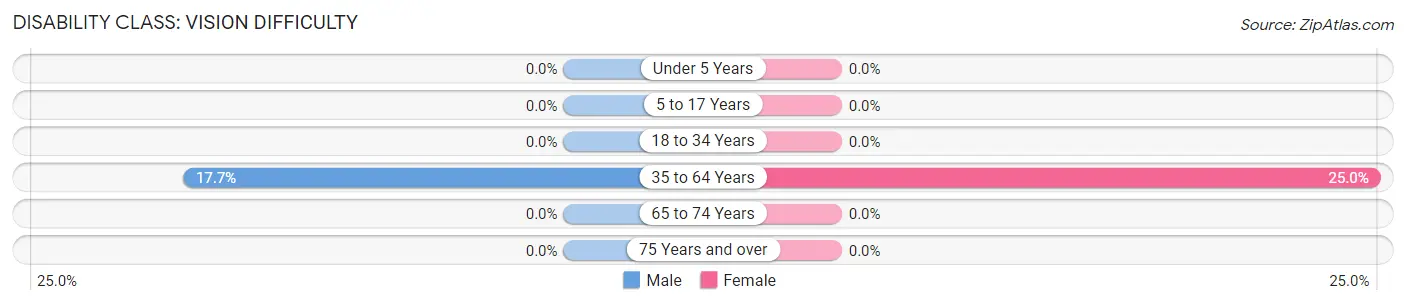
| Age Bracket | Male | Female |
| Under 5 Years | 0 (0.0%) | 0 (0.0%) |
| 5 to 17 Years | 0 (0.0%) | 0 (0.0%) |
| 18 to 34 Years | 0 (0.0%) | 0 (0.0%) |
| 35 to 64 Years | 3 (17.6%) | 6 (25.0%) |
| 65 to 74 Years | 0 (0.0%) | 0 (0.0%) |
| 75 Years and over | 0 (0.0%) | 0 (0.0%) |
Disability Class: Cognitive Difficulty
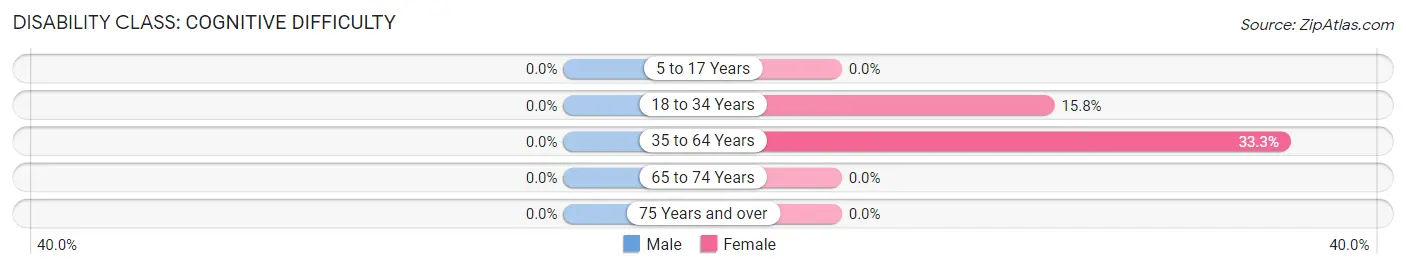
| Age Bracket | Male | Female |
| 5 to 17 Years | 0 (0.0%) | 0 (0.0%) |
| 18 to 34 Years | 0 (0.0%) | 3 (15.8%) |
| 35 to 64 Years | 0 (0.0%) | 8 (33.3%) |
| 65 to 74 Years | 0 (0.0%) | 0 (0.0%) |
| 75 Years and over | 0 (0.0%) | 0 (0.0%) |
Disability Class: Ambulatory Difficulty
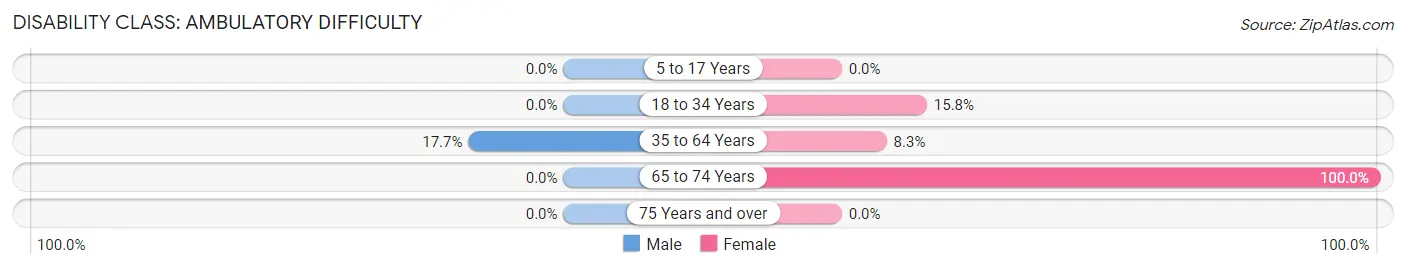
| Age Bracket | Male | Female |
| 5 to 17 Years | 0 (0.0%) | 0 (0.0%) |
| 18 to 34 Years | 0 (0.0%) | 3 (15.8%) |
| 35 to 64 Years | 3 (17.6%) | 2 (8.3%) |
| 65 to 74 Years | 0 (0.0%) | 2 (100.0%) |
| 75 Years and over | 0 (0.0%) | 0 (0.0%) |
Disability Class: Self-Care Difficulty
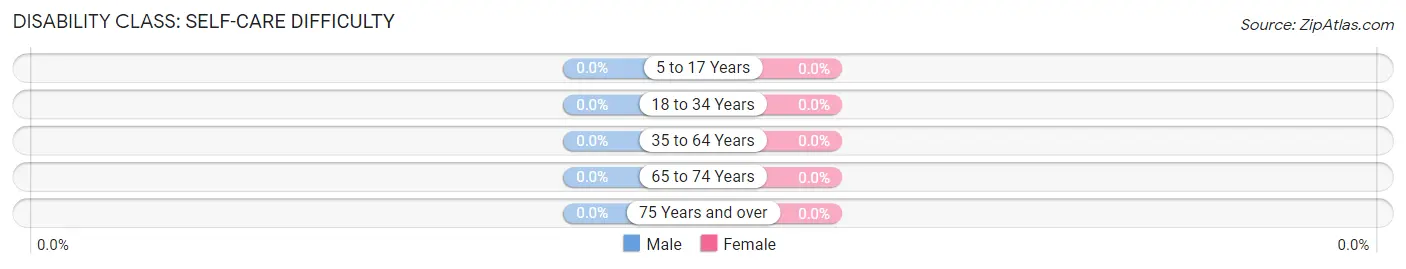
| Age Bracket | Male | Female |
| 5 to 17 Years | 0 (0.0%) | 0 (0.0%) |
| 18 to 34 Years | 0 (0.0%) | 0 (0.0%) |
| 35 to 64 Years | 0 (0.0%) | 0 (0.0%) |
| 65 to 74 Years | 0 (0.0%) | 0 (0.0%) |
| 75 Years and over | 0 (0.0%) | 0 (0.0%) |
Technology Access in Anaktuvuk Pass
Computing Device Access in Anaktuvuk Pass
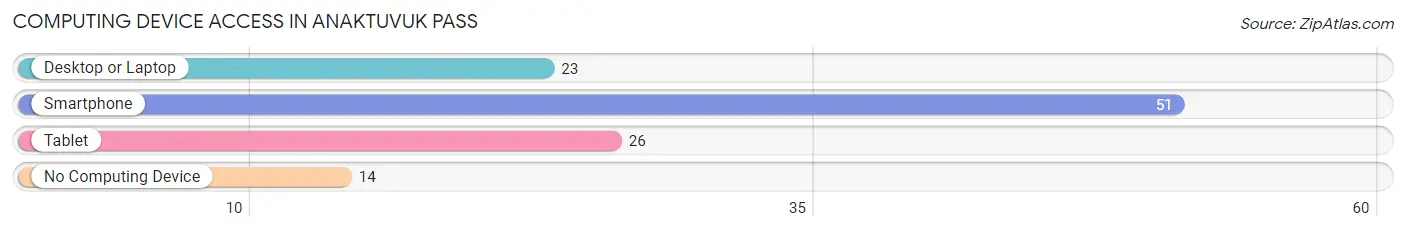
| Device Type | # Households | % Households |
| Desktop or Laptop | 23 | 34.3% |
| Smartphone | 51 | 76.1% |
| Tablet | 26 | 38.8% |
| No Computing Device | 14 | 20.9% |
| Total | 67 | 100.0% |
Internet Access in Anaktuvuk Pass
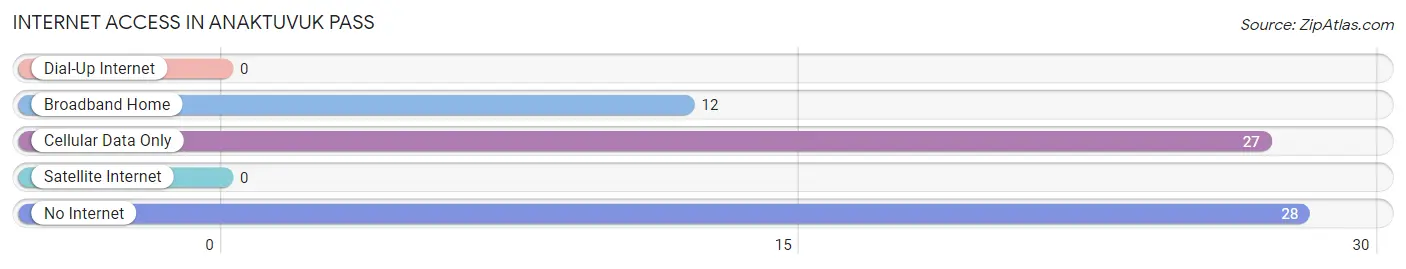
| Internet Type | # Households | % Households |
| Dial-Up Internet | 0 | 0.0% |
| Broadband Home | 12 | 17.9% |
| Cellular Data Only | 27 | 40.3% |
| Satellite Internet | 0 | 0.0% |
| No Internet | 28 | 41.8% |
| Total | 67 | 100.0% |
Anaktuvuk Pass Summary
Anaktuvuk Pass is a small unincorporated community located in the North Slope Borough of Alaska. It is located in the Brooks Range, about 200 miles north of the Arctic Circle and is the only permanent settlement in the area. The population of Anaktuvuk Pass was estimated to be around 250 people in 2000.
History
The area around Anaktuvuk Pass has been inhabited by the Nunamiut people for thousands of years. The Nunamiut are a subgroup of the Inupiat people, who have lived in the Arctic regions of Alaska for centuries. The name Anaktuvuk is derived from the Inupiat language and means “place of caribou crossing”.
The first recorded contact between the Nunamiut and Europeans occurred in 1851, when a group of British explorers led by John Franklin passed through the area. In the early 1900s, the area was explored by Robert Peary and Donald MacMillan, who were looking for a route to the North Pole.
In the 1930s, the U.S. government began to establish a presence in the area. The first permanent settlement was established in 1949, when the U.S. Army Corps of Engineers built a weather station at Anaktuvuk Pass. The station was used to monitor weather conditions in the area and to provide support for military operations in the Arctic.
In the 1950s, the U.S. government began to encourage the Nunamiut to settle in the area. The government provided housing, medical care, and other services to the Nunamiut. In 1961, the U.S. government established the Anaktuvuk Pass Native Corporation, which was responsible for managing the land and resources of the area.
In the 1970s, the Alaska Native Claims Settlement Act (ANCSA) was passed, which provided land and financial compensation to Alaska Native people. The Anaktuvuk Pass Native Corporation was one of the corporations that was established under ANCSA.
Geography
Anaktuvuk Pass is located in the Brooks Range, which is a mountain range that stretches across northern Alaska. The area is characterized by rugged terrain and is covered in tundra and boreal forest. The climate is cold and dry, with temperatures ranging from -40°F in the winter to 70°F in the summer.
The Anaktuvuk River flows through the area and is the main source of water for the community. The river is also home to a variety of fish, including Arctic char, grayling, and whitefish.
Economy
The economy of Anaktuvuk Pass is largely based on subsistence hunting and fishing. The Nunamiut people rely on caribou, moose, and other game for food and clothing. They also hunt and fish for salmon, whitefish, and other species.
The Anaktuvuk Pass Native Corporation owns and manages the land and resources of the area. The corporation is involved in a variety of activities, including oil and gas exploration, tourism, and mining.
Demographics
The population of Anaktuvuk Pass was estimated to be around 250 people in 2000. The majority of the population is Alaska Native, with the majority being Inupiat. The population is largely concentrated in the village of Anaktuvuk Pass, with a few smaller settlements located in the surrounding area.
The majority of the population speaks English, although Inupiat is also spoken by some of the older members of the community. The majority of the population is Christian, with the majority being members of the Catholic Church.
Conclusion
Anaktuvuk Pass is a small unincorporated community located in the North Slope Borough of Alaska. It is located in the Brooks Range, about 200 miles north of the Arctic Circle and is the only permanent settlement in the area. The population of Anaktuvuk Pass was estimated to be around 250 people in 2000. The area has been inhabited by the Nunamiut people for thousands of years and the economy is largely based on subsistence hunting and fishing. The Anaktuvuk Pass Native Corporation owns and manages the land and resources of the area and is involved in a variety of activities, including oil and gas exploration, tourism, and mining. The majority of the population is Alaska Native, with the majority being Inupiat. The majority of the population speaks English, although Inupiat is also spoken by some of the older members of the community.
Common Questions
What is Per Capita Income in Anaktuvuk Pass?
Per Capita income in Anaktuvuk Pass is $19,882.
What is the Median Family Income in Anaktuvuk Pass?
Median Family Income in Anaktuvuk Pass is $69,444.
What is the Median Household income in Anaktuvuk Pass?
Median Household Income in Anaktuvuk Pass is $69,028.
What is Income or Wage Gap in Anaktuvuk Pass?
Income or Wage Gap in Anaktuvuk Pass is 55.8%.
Women in Anaktuvuk Pass earn 44.2 cents for every dollar earned by a man.
What is Inequality or Gini Index in Anaktuvuk Pass?
Inequality or Gini Index in Anaktuvuk Pass is 0.41.
What is the Total Population of Anaktuvuk Pass?
Total Population of Anaktuvuk Pass is 222.
What is the Total Male Population of Anaktuvuk Pass?
Total Male Population of Anaktuvuk Pass is 135.
What is the Total Female Population of Anaktuvuk Pass?
Total Female Population of Anaktuvuk Pass is 87.
What is the Ratio of Males per 100 Females in Anaktuvuk Pass?
There are 155.17 Males per 100 Females in Anaktuvuk Pass.
What is the Ratio of Females per 100 Males in Anaktuvuk Pass?
There are 64.44 Females per 100 Males in Anaktuvuk Pass.
What is the Median Population Age in Anaktuvuk Pass?
Median Population Age in Anaktuvuk Pass is 24.0 Years.
What is the Average Family Size in Anaktuvuk Pass
Average Family Size in Anaktuvuk Pass is 3.4 People.
What is the Average Household Size in Anaktuvuk Pass
Average Household Size in Anaktuvuk Pass is 3.3 People.
How Large is the Labor Force in Anaktuvuk Pass?
There are 73 People in the Labor Forcein in Anaktuvuk Pass.
What is the Percentage of People in the Labor Force in Anaktuvuk Pass?
55.3% of People are in the Labor Force in Anaktuvuk Pass.
What is the Unemployment Rate in Anaktuvuk Pass?
Unemployment Rate in Anaktuvuk Pass is 18.6%.