Zip Codes with the Highest Percentage of Population Taking Public Transit to Work in Cheyenne, WY
RELATED REPORTS & OPTIONS
Public Transit
Cheyenne
Compare Zip Codes
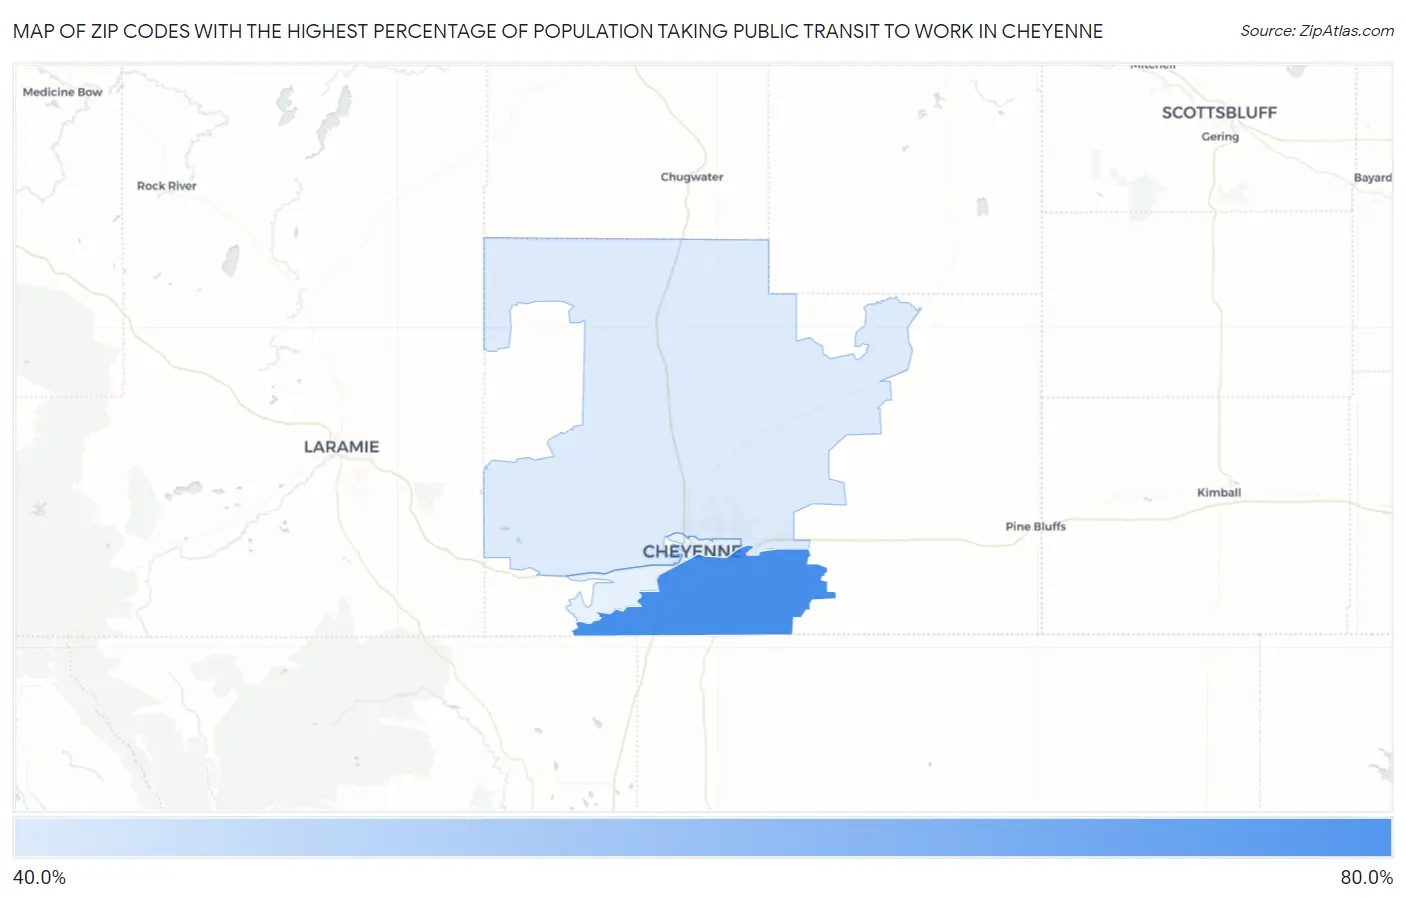
Map of Zip Codes with the Highest Percentage of Population Taking Public Transit to Work in Cheyenne
45.5%
68.4%
Zip Codes with the Highest Percentage of Population Taking Public Transit to Work in Cheyenne, WY
| Zip Code | % Public Transit | vs State | vs National | |
| 1. | 82007 | 68.4% | 38.8%(+29.6)#1 | 38.5%(+29.9)#42 |
| 2. | 82009 | 45.5% | 38.8%(+6.70)#7 | 38.5%(+7.00)#2,579 |
1
Common Questions
What are the Top Zip Codes with the Highest Percentage of Population Taking Public Transit to Work in Cheyenne, WY?
Top Zip Codes with the Highest Percentage of Population Taking Public Transit to Work in Cheyenne, WY are:
What zip code has the Highest Percentage of Population Taking Public Transit to Work in Cheyenne, WY?
82007 has the Highest Percentage of Population Taking Public Transit to Work in Cheyenne, WY with 68.4%.
What is the Percentage of Population Taking Public Transit to Work in Cheyenne, WY?
Percentage of Population Taking Public Transit to Work in Cheyenne is 44.7%.
What is the Percentage of Population Taking Public Transit to Work in Wyoming?
Percentage of Population Taking Public Transit to Work in Wyoming is 38.8%.
What is the Percentage of Population Taking Public Transit to Work in the United States?
Percentage of Population Taking Public Transit to Work in the United States is 38.5%.