Zip Codes with the Highest Percentage of Population with a Degree in Psychology in Watertown, WI
RELATED REPORTS & OPTIONS
Psychology
Watertown
Compare Zip Codes
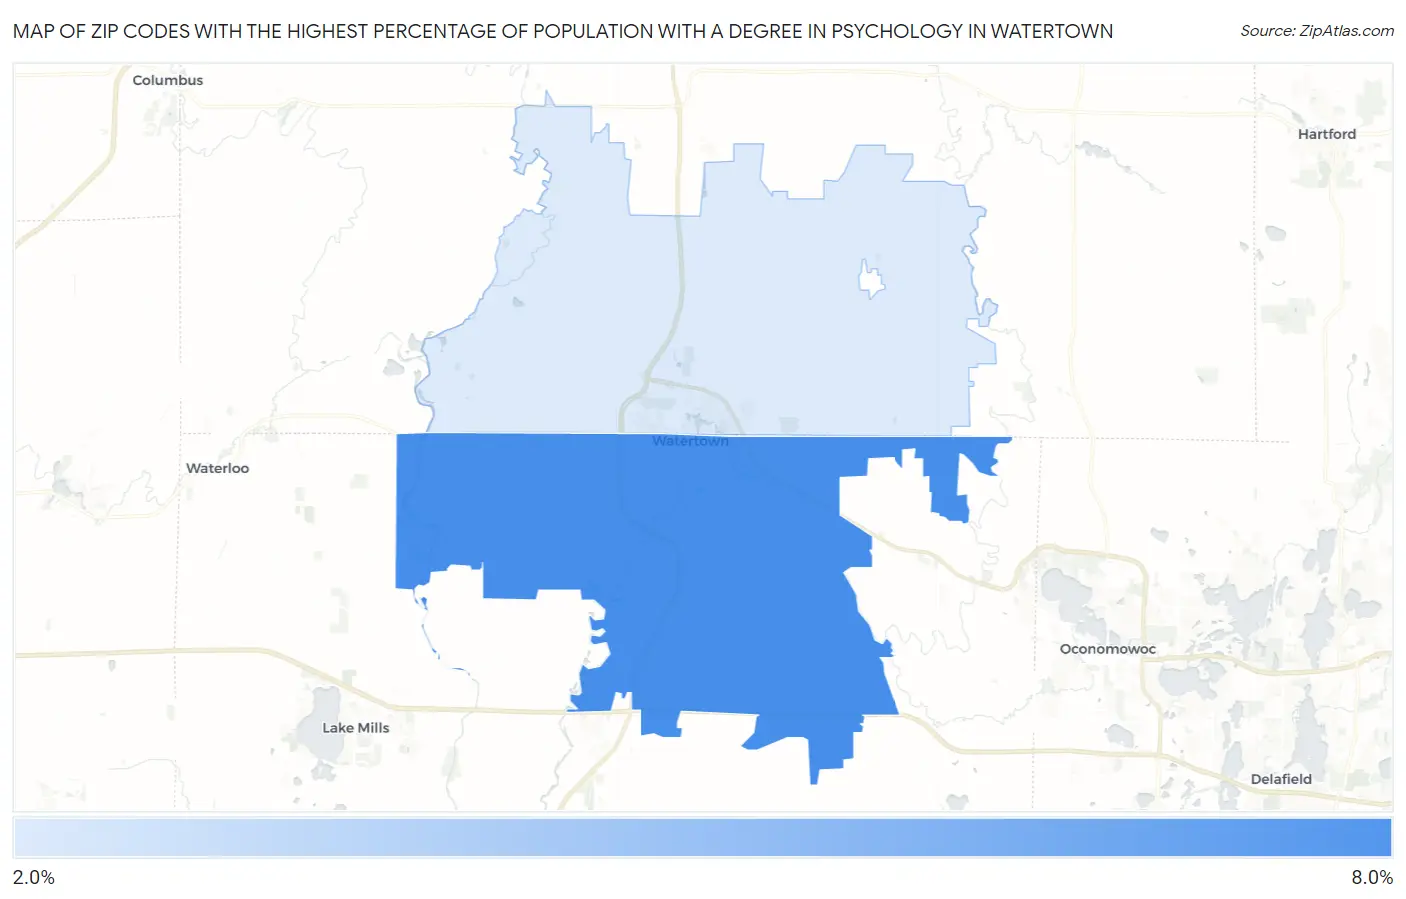
Map of Zip Codes with the Highest Percentage of Population with a Degree in Psychology in Watertown
2.3%
7.2%
Zip Codes with the Highest Percentage of Population with a Degree in Psychology in Watertown, WI
| Zip Code | % Graduates | vs State | vs National | |
| 1. | 53094 | 7.2% | 4.6%(+2.65)#80 | 5.1%(+2.16)#5,269 |
| 2. | 53098 | 2.3% | 4.6%(-2.26)#549 | 5.1%(-2.75)#20,114 |
1
Common Questions
What are the Top Zip Codes with the Highest Percentage of Population with a Degree in Psychology in Watertown, WI?
Top Zip Codes with the Highest Percentage of Population with a Degree in Psychology in Watertown, WI are:
What zip code has the Highest Percentage of Population with a Degree in Psychology in Watertown, WI?
53094 has the Highest Percentage of Population with a Degree in Psychology in Watertown, WI with 7.2%.
What is the Percentage of Population with a Degree in Psychology in Watertown, WI?
Percentage of Population with a Degree in Psychology in Watertown is 7.3%.
What is the Percentage of Population with a Degree in Psychology in Wisconsin?
Percentage of Population with a Degree in Psychology in Wisconsin is 4.6%.
What is the Percentage of Population with a Degree in Psychology in the United States?
Percentage of Population with a Degree in Psychology in the United States is 5.1%.