Zip Codes with the Highest Percentage of Population with a Degree in Arts and Humanities in Madison, WI

RELATED REPORTS & OPTIONS

Arts and Humanities
Population
Families and Households
Female Fertility
Female Fertility (Unmarried)
Race (Community Size)
Race (Percentage)
Ancestry (Community Size)
AfghanAfricanAlbanianAmericanApacheArabArgentineanArmenianAustralianAustrianBangladeshiBelgianBelizeanBhutaneseBolivianBrazilianBritishBulgarianBurmeseCajunCambodianCanadianCelticCentral AmericanCentral American IndianCherokeeChickasawChileanChineseChippewaChoctawColombianCosta RicanCroatianCubanCzechCzechoslovakianDanishDelawareDominicanDutchEastern EuropeanEcuadorianEgyptianEnglishEthiopianEuropeanFilipinoFinnishFrenchFrench CanadianGermanGerman RussianGhanaianGreekGuamanian / ChamorroGuatemalanGuyaneseHaitianHonduranHungarianIcelanderIndian (Asian)IndonesianInupiatIranianIraqiIrishIroquoisIsraeliItalianJamaicanJapaneseJordanianKoreanLaotianLatvianLebaneseLiberianLithuanianLuxembourgerMacedonianMalaysianMenomineeMexicanMexican American IndianMongolianNative HawaiianNavajoNew ZealanderNicaraguanNigerianNorthern EuropeanNorwegianOkinawanOttawaPakistaniPalestinianPanamanianPennsylvania GermanPeruvianPolishPortuguesePotawatomiPuerto RicanRomanianRussianSalvadoranScandinavianScotch-IrishScottishSenegaleseSerbianSiouxSlavicSlovakSloveneSomaliSouth AfricanSouth AmericanSpaniardSpanishSri LankanSubsaharan AfricanSudaneseSwedishSwissSyrianThaiTurkishUkrainianUruguayanVenezuelanVietnameseWelshWest IndianYugoslavian
Ancestry (Percentage)
AfghanAfricanAlbanianAmericanApacheArabArgentineanArmenianAustralianAustrianBangladeshiBelgianBelizeanBhutaneseBolivianBrazilianBritishBulgarianBurmeseCajunCambodianCanadianCelticCentral AmericanCentral American IndianCherokeeChickasawChileanChineseChippewaChoctawColombianCosta RicanCroatianCubanCzechCzechoslovakianDanishDelawareDominicanDutchEastern EuropeanEcuadorianEgyptianEnglishEthiopianEuropeanFilipinoFinnishFrenchFrench CanadianGermanGerman RussianGhanaianGreekGuamanian / ChamorroGuatemalanGuyaneseHaitianHonduranHungarianIcelanderIndian (Asian)IndonesianInupiatIranianIraqiIrishIroquoisIsraeliItalianJamaicanJapaneseJordanianKoreanLaotianLatvianLebaneseLiberianLithuanianLuxembourgerMacedonianMalaysianMenomineeMexicanMexican American IndianMongolianNative HawaiianNavajoNew ZealanderNicaraguanNigerianNorthern EuropeanNorwegianOkinawanOttawaPakistaniPalestinianPanamanianPennsylvania GermanPeruvianPolishPortuguesePotawatomiPuerto RicanRomanianRussianSalvadoranScandinavianScotch-IrishScottishSenegaleseSerbianSiouxSlavicSlovakSloveneSomaliSouth AfricanSouth AmericanSpaniardSpanishSri LankanSubsaharan AfricanSudaneseSwedishSwissSyrianThaiTurkishUkrainianUruguayanVenezuelanVietnameseWelshWest IndianYugoslavian
Immigrant Origin (Total)
AfghanistanAfricaAlbaniaArgentinaAsiaAustraliaAustriaBahamasBangladeshBelarusBelgiumBoliviaBosnia and HerzegovinaBrazilBulgariaBurma / MyanmarCambodiaCanadaCaribbeanCentral AmericaChileChinaColombiaCubaCzechoslovakiaDenmarkDominican RepublicEastern AfricaEastern AsiaEastern EuropeEcuadorEgyptEl SalvadorEnglandEthiopiaEuropeFranceGermanyGhanaGreeceGuatemalaGuyanaHaitiHondurasHong KongHungaryIndiaIndonesiaIranIraqIrelandIsraelItalyJamaicaJapanJordanKenyaKoreaLaosLatin AmericaLatviaLiberiaMalaysiaMexicoMiddle AfricaMoldovaMoroccoNepalNetherlandsNicaraguaNigeriaNorthern AfricaNorthern EuropeOceaniaPakistanPanamaPeruPhilippinesPolandPortugalRomaniaRussiaSaudi ArabiaScotlandSenegalSingaporeSomaliaSouth AfricaSouth AmericaSouth Central AsiaSouth Eastern AsiaSouthern EuropeSpainSri LankaSudanSwedenSwitzerlandSyriaTaiwanThailandTurkeyUkraineUruguayVenezuelaVietnamWestern AfricaWestern AsiaWestern EuropeZaireZimbabwe
Immigrant Origin (Percentage)
AfghanistanAfricaAlbaniaArgentinaAsiaAustraliaAustriaBahamasBangladeshBelarusBelgiumBoliviaBosnia and HerzegovinaBrazilBulgariaBurma / MyanmarCambodiaCanadaCaribbeanCentral AmericaChileChinaColombiaCubaCzechoslovakiaDenmarkDominican RepublicEastern AfricaEastern AsiaEastern EuropeEcuadorEgyptEl SalvadorEnglandEthiopiaEuropeFranceGermanyGhanaGreeceGuatemalaGuyanaHaitiHondurasHong KongHungaryIndiaIndonesiaIranIraqIrelandIsraelItalyJamaicaJapanJordanKenyaKoreaLaosLatin AmericaLatviaLiberiaMalaysiaMexicoMiddle AfricaMoldovaMoroccoNepalNetherlandsNicaraguaNigeriaNorthern AfricaNorthern EuropeOceaniaPakistanPanamaPeruPhilippinesPolandPortugalRomaniaRussiaSaudi ArabiaScotlandSenegalSingaporeSomaliaSouth AfricaSouth AmericaSouth Central AsiaSouth Eastern AsiaSouthern EuropeSpainSri LankaSudanSwedenSwitzerlandSyriaTaiwanThailandTurkeyUkraineUruguayVenezuelaVietnamWestern AfricaWestern AsiaWestern EuropeZaireZimbabwe
Income
Income (Families)
Income (Households)
Poverty
Poverty (Families)
Unemployment
Employment Occupations
Employment Industries
Employer Class
Commute Time
Commute Means
School Enrollment
Education by Degree Field
Occupancy
Finances
Physical Characteristics
Madison
Compare Zip Codes
Comparison Subject

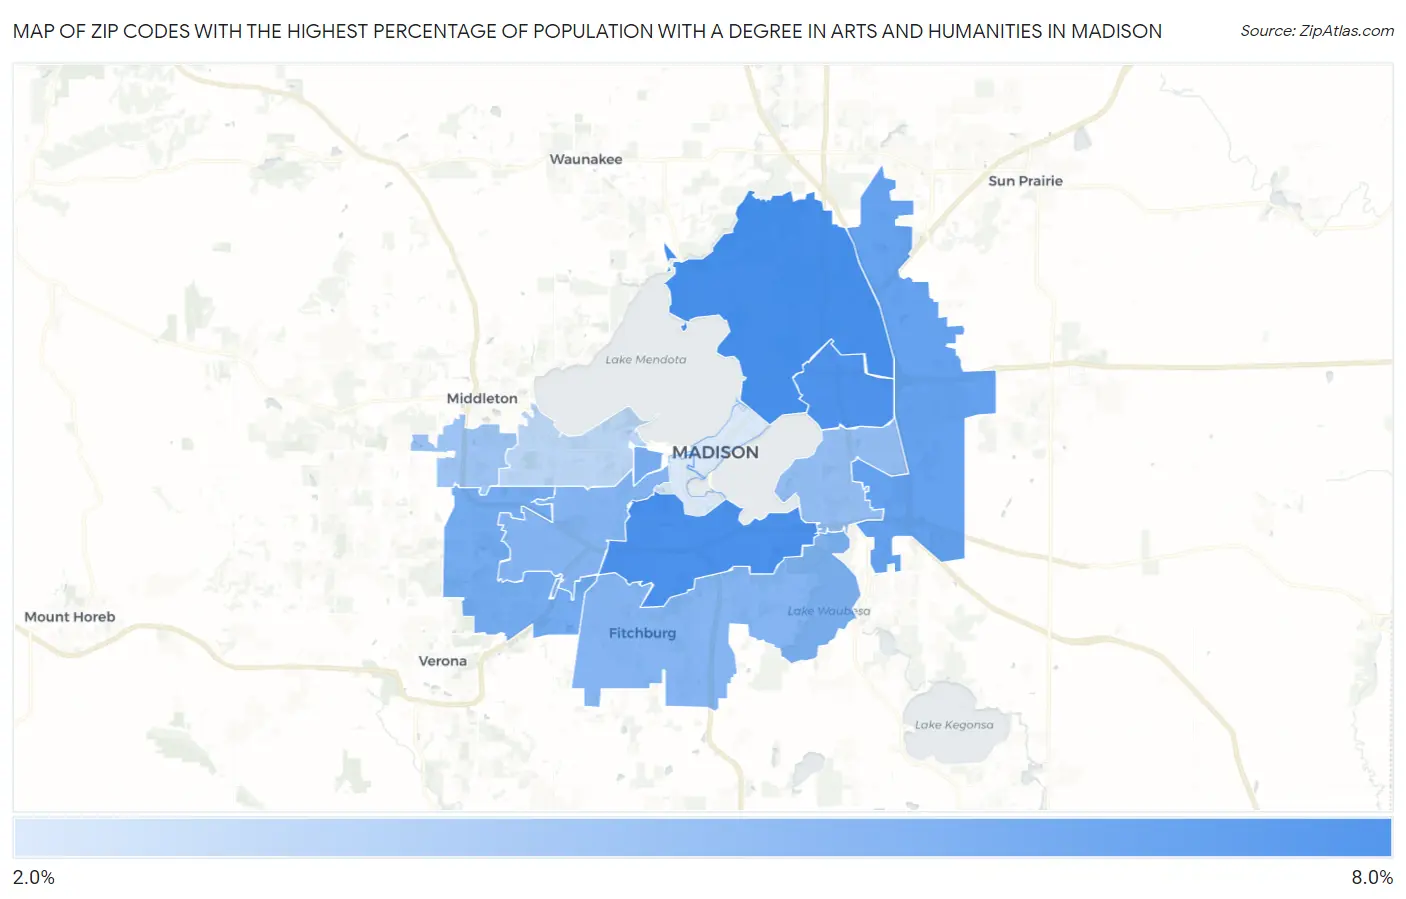
Map of Zip Codes with the Highest Percentage of Population with a Degree in Arts and Humanities in Madison

0.0%
8.0%
Zip Codes with the Highest Percentage of Population with a Degree in Arts and Humanities in Madison Map

Zip Codes with the Highest Percentage of Population with a Degree in Arts and Humanities in Madison, WI

Zip Code % Graduates vs State vs National
1.537046.2%6.5%(-0.339)#4026.0%(+0.176)#14,180
2.537136.1%6.5%(-0.435)#4126.0%(+0.081)#14,458
3.537146.0%6.5%(-0.554)#4236.0%(-0.038)#14,784
4.537185.4%6.5%(-1.11)#4786.0%(-0.595)#16,425
5.537195.0%6.5%(-1.52)#5186.0%(-1.00)#17,634
6.537264.9%6.5%(-1.60)#5236.0%(-1.08)#17,854
7.537114.6%6.5%(-1.94)#5456.0%(-1.42)#18,805
8.537164.2%6.5%(-2.29)#5686.0%(-1.77)#19,744
9.537173.9%6.5%(-2.57)#5946.0%(-2.06)#20,505
10.537053.1%6.5%(-3.39)#6486.0%(-2.87)#22,413
11.537032.4%6.5%(-4.16)#6806.0%(-3.64)#23,830
12.537152.3%6.5%(-4.18)#6816.0%(-3.66)#23,857

Common Questions

What are the Top 10 Zip Codes with the Highest Percentage of Population with a Degree in Arts and Humanities in Madison, WI?
Top 10 Zip Codes with the Highest Percentage of Population with a Degree in Arts and Humanities in Madison, WI are:
#1
6.2%
#2
6.1%
#3
6.0%
#4
5.4%
#5
5.0%
#6
4.9%
#7
4.6%
#8
4.2%
#9
3.9%
#10
3.1%
What zip code has the Highest Percentage of Population with a Degree in Arts and Humanities in Madison, WI?
53704 has the Highest Percentage of Population with a Degree in Arts and Humanities in Madison, WI with 6.2%.
What is the Percentage of Population with a Degree in Arts and Humanities in Madison, WI?
Percentage of Population with a Degree in Arts and Humanities in Madison is 4.6%.
What is the Percentage of Population with a Degree in Arts and Humanities in Wisconsin?
Percentage of Population with a Degree in Arts and Humanities in Wisconsin is 6.5%.
What is the Percentage of Population with a Degree in Arts and Humanities in the United States?
Percentage of Population with a Degree in Arts and Humanities in the United States is 6.0%.