Zip Codes with the Most Immigrants from South Eastern Asia in La Crosse, WI
RELATED REPORTS & OPTIONS
South Eastern Asia
La Crosse
Compare Zip Codes
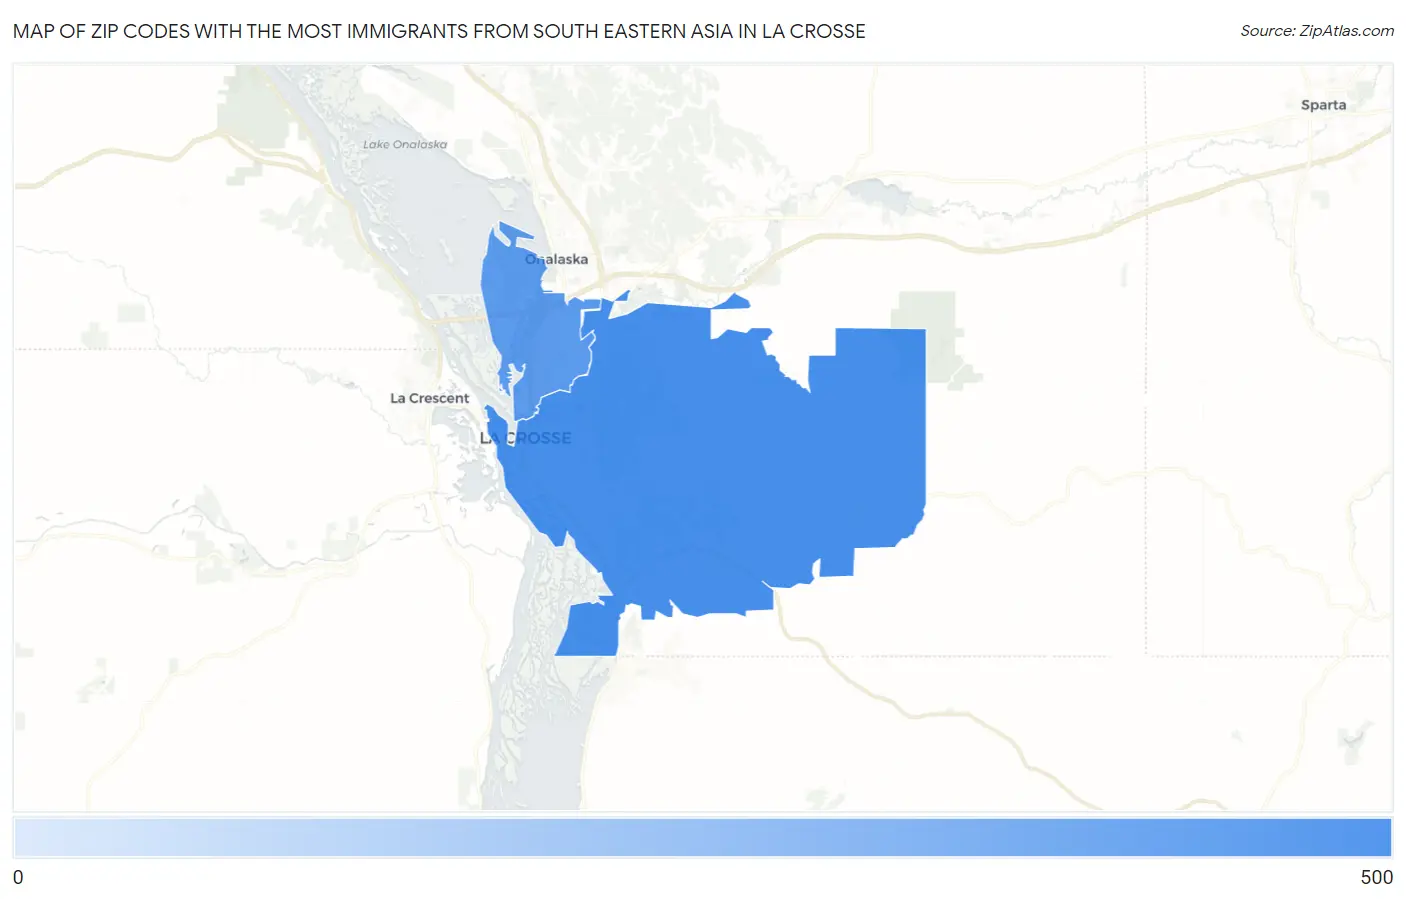
Map of Zip Codes with the Most Immigrants from South Eastern Asia in La Crosse
197
470
Zip Codes with the Most Immigrants from South Eastern Asia in La Crosse, WI
| Zip Code | South Eastern Asia | vs State | vs National | |
| 1. | 54601 | 470 | 42,844(1.10%)#24 | 4,292,058(0.01%)#2,046 |
| 2. | 54603 | 197 | 42,844(0.46%)#60 | 4,292,058(0.00%)#4,070 |
1
Common Questions
What are the Top Zip Codes with the Most Immigrants from South Eastern Asia in La Crosse, WI?
Top Zip Codes with the Most Immigrants from South Eastern Asia in La Crosse, WI are:
What zip code has the Most Immigrants from South Eastern Asia in La Crosse, WI?
54601 has the Most Immigrants from South Eastern Asia in La Crosse, WI with 470.
What is the Total Immigrants from South Eastern Asia in La Crosse, WI?
Total Immigrants from South Eastern Asia in La Crosse is 596.
What is the Total Immigrants from South Eastern Asia in Wisconsin?
Total Immigrants from South Eastern Asia in Wisconsin is 42,844.
What is the Total Immigrants from South Eastern Asia in the United States?
Total Immigrants from South Eastern Asia in the United States is 4,292,058.