Zip Codes with the Highest Percentage of Population Employed in Agriculture, Fishing & Hunting in Kirkland, WA
RELATED REPORTS & OPTIONS
Agriculture, Fishing & Hunting
Kirkland
Compare Zip Codes
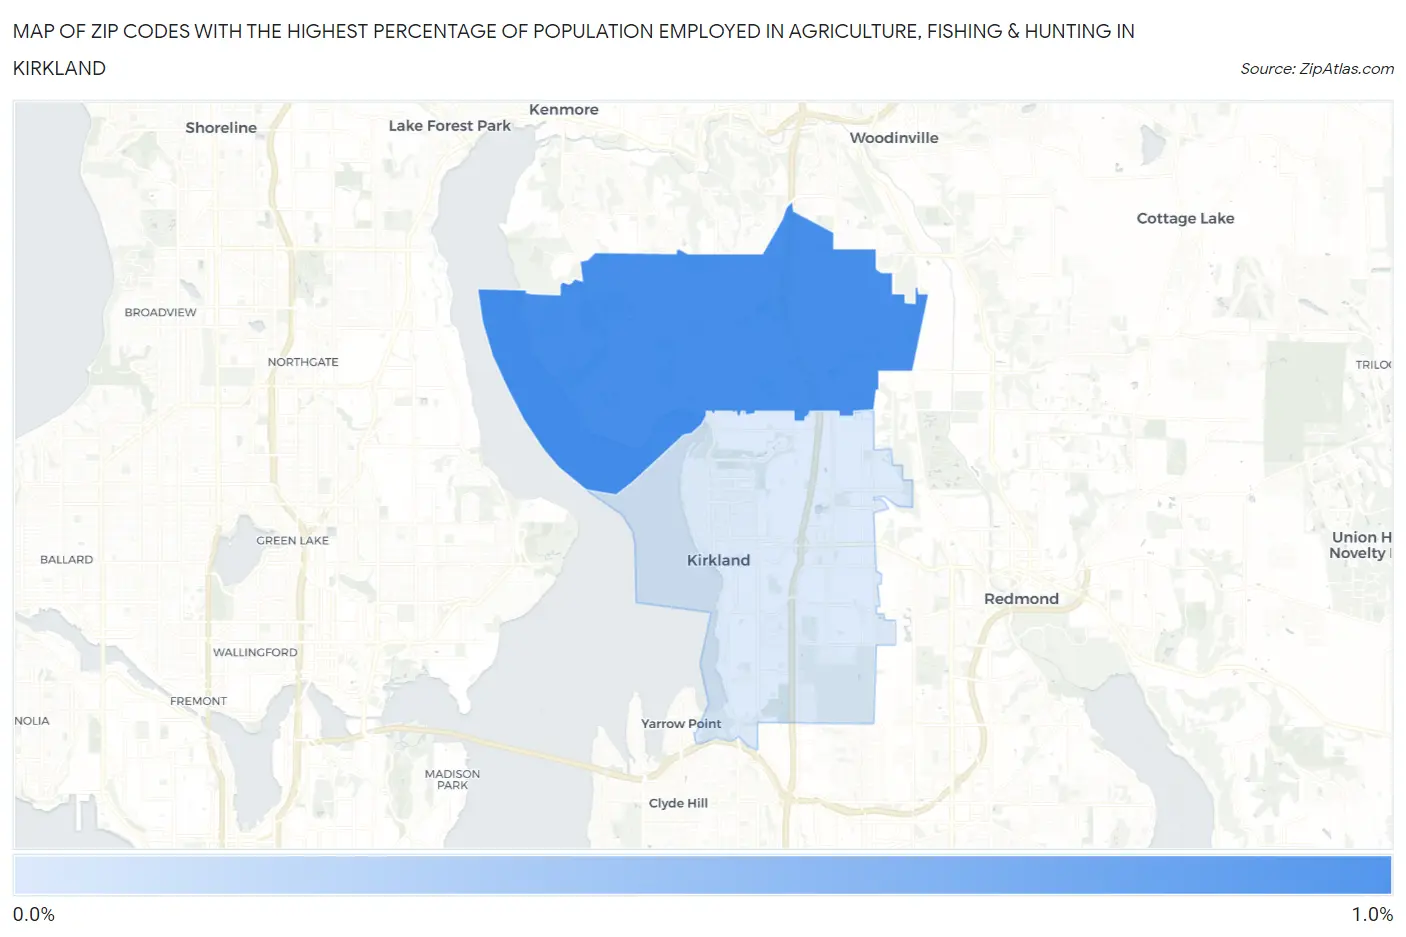
Map of Zip Codes with the Highest Percentage of Population Employed in Agriculture, Fishing & Hunting in Kirkland
0.0%
1.0%
Zip Codes with the Highest Percentage of Population Employed in Agriculture, Fishing & Hunting in Kirkland, WA
| Zip Code | % Employed | vs State | vs National | |
| 1. | 98034 | 0.87% | 2.4%(-1.52)#363 | 1.2%(-0.325)#16,840 |
| 2. | 98033 | 0.13% | 2.4%(-2.26)#492 | 1.2%(-1.07)#23,292 |
1
Common Questions
What are the Top Zip Codes with the Highest Percentage of Population Employed in Agriculture, Fishing & Hunting in Kirkland, WA?
Top Zip Codes with the Highest Percentage of Population Employed in Agriculture, Fishing & Hunting in Kirkland, WA are:
What zip code has the Highest Percentage of Population Employed in Agriculture, Fishing & Hunting in Kirkland, WA?
98034 has the Highest Percentage of Population Employed in Agriculture, Fishing & Hunting in Kirkland, WA with 0.87%.
What is the Percentage of Population Employed in Agriculture, Fishing & Hunting in Kirkland, WA?
Percentage of Population Employed in Agriculture, Fishing & Hunting in Kirkland is 0.56%.
What is the Percentage of Population Employed in Agriculture, Fishing & Hunting in Washington?
Percentage of Population Employed in Agriculture, Fishing & Hunting in Washington is 2.4%.
What is the Percentage of Population Employed in Agriculture, Fishing & Hunting in the United States?
Percentage of Population Employed in Agriculture, Fishing & Hunting in the United States is 1.2%.