Zip Codes with the Highest Percentage of Population Employed in Farming, Fishing & Forestry in Vermont
RELATED REPORTS & OPTIONS
Farming, Fishing & Forestry
Vermont
Compare Zip Codes
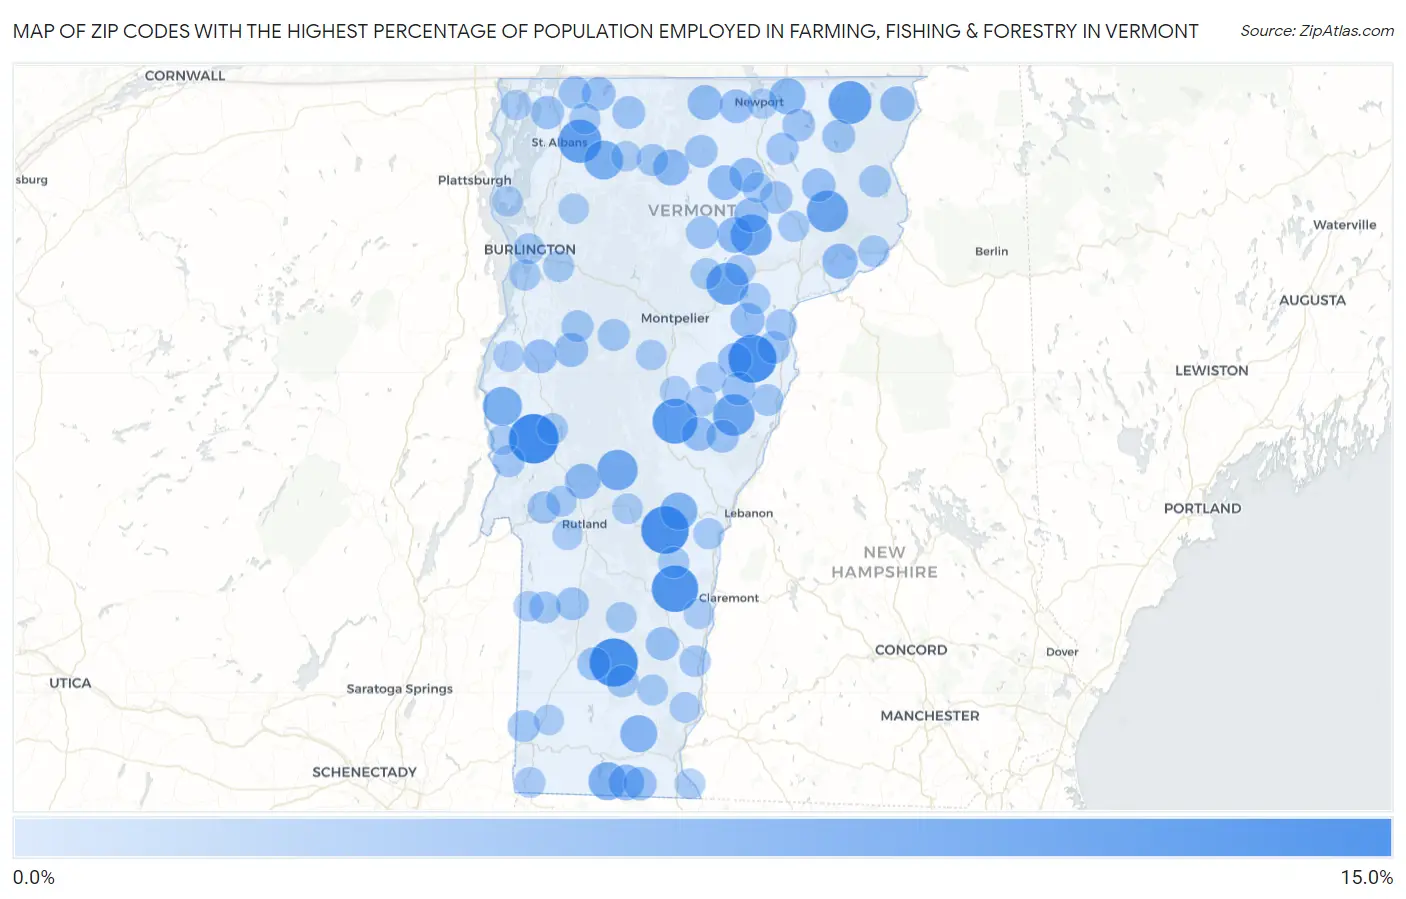
Map of Zip Codes with the Highest Percentage of Population Employed in Farming, Fishing & Forestry in Vermont
0.0%
15.0%
Zip Codes with the Highest Percentage of Population Employed in Farming, Fishing & Forestry in Vermont
| Zip Code | % Employed | vs State | vs National | |
| 1. | 05778 | 13.6% | 1.2%(+12.4)#1 | 0.61%(+13.0)#759 |
| 2. | 05155 | 12.7% | 1.2%(+11.5)#2 | 0.61%(+12.1)#841 |
| 3. | 05076 | 12.6% | 1.2%(+11.3)#3 | 0.61%(+11.9)#862 |
| 4. | 05034 | 12.3% | 1.2%(+11.1)#4 | 0.61%(+11.7)#890 |
| 5. | 05142 | 11.6% | 1.2%(+10.4)#5 | 0.61%(+11.0)#976 |
| 6. | 05061 | 10.5% | 1.2%(+9.30)#6 | 0.61%(+9.93)#1,119 |
| 7. | 05455 | 9.5% | 1.2%(+8.25)#7 | 0.61%(+8.88)#1,301 |
| 8. | 05907 | 9.2% | 1.2%(+7.98)#8 | 0.61%(+8.60)#1,358 |
| 9. | 05658 | 8.7% | 1.2%(+7.50)#9 | 0.61%(+8.12)#1,472 |
| 10. | 05079 | 8.4% | 1.2%(+7.21)#10 | 0.61%(+7.84)#1,537 |
| 11. | 05832 | 8.3% | 1.2%(+7.10)#11 | 0.61%(+7.73)#1,554 |
| 12. | 05836 | 8.0% | 1.2%(+6.80)#12 | 0.61%(+7.43)#1,654 |
| 13. | 05762 | 7.6% | 1.2%(+6.39)#13 | 0.61%(+7.02)#1,782 |
| 14. | 05734 | 6.8% | 1.2%(+5.54)#14 | 0.61%(+6.17)#2,068 |
| 15. | 05448 | 6.7% | 1.2%(+5.50)#15 | 0.61%(+6.13)#2,082 |
| 16. | 05361 | 6.1% | 1.2%(+4.87)#16 | 0.61%(+5.50)#2,340 |
| 17. | 05091 | 5.6% | 1.2%(+4.38)#17 | 0.61%(+5.00)#2,592 |
| 18. | 05351 | 5.5% | 1.2%(+4.26)#18 | 0.61%(+4.89)#2,655 |
| 19. | 05829 | 5.0% | 1.2%(+3.74)#19 | 0.61%(+4.37)#2,942 |
| 20. | 05652 | 4.8% | 1.2%(+3.55)#20 | 0.61%(+4.18)#3,087 |
| 21. | 05342 | 4.6% | 1.2%(+3.41)#21 | 0.61%(+4.04)#3,200 |
| 22. | 05843 | 4.6% | 1.2%(+3.38)#22 | 0.61%(+4.01)#3,215 |
| 23. | 05824 | 4.5% | 1.2%(+3.28)#23 | 0.61%(+3.90)#3,296 |
| 24. | 05763 | 4.4% | 1.2%(+3.19)#24 | 0.61%(+3.82)#3,362 |
| 25. | 05903 | 4.2% | 1.2%(+2.92)#25 | 0.61%(+3.55)#3,581 |
| 26. | 05859 | 4.1% | 1.2%(+2.88)#26 | 0.61%(+3.50)#3,622 |
| 27. | 05827 | 3.9% | 1.2%(+2.66)#27 | 0.61%(+3.29)#3,818 |
| 28. | 05842 | 3.8% | 1.2%(+2.57)#28 | 0.61%(+3.20)#3,899 |
| 29. | 05875 | 3.8% | 1.2%(+2.52)#29 | 0.61%(+3.15)#3,940 |
| 30. | 05046 | 3.7% | 1.2%(+2.48)#30 | 0.61%(+3.10)#3,990 |
| 31. | 05077 | 3.6% | 1.2%(+2.35)#31 | 0.61%(+2.98)#4,108 |
| 32. | 05443 | 3.5% | 1.2%(+2.30)#32 | 0.61%(+2.93)#4,164 |
| 33. | 05086 | 3.4% | 1.2%(+2.18)#33 | 0.61%(+2.81)#4,313 |
| 34. | 05472 | 3.4% | 1.2%(+2.17)#34 | 0.61%(+2.80)#4,325 |
| 35. | 05857 | 3.3% | 1.2%(+2.12)#35 | 0.61%(+2.74)#4,397 |
| 36. | 05457 | 3.3% | 1.2%(+2.08)#36 | 0.61%(+2.71)#4,431 |
| 37. | 05871 | 3.2% | 1.2%(+2.02)#37 | 0.61%(+2.64)#4,494 |
| 38. | 05143 | 3.2% | 1.2%(+1.96)#38 | 0.61%(+2.59)#4,555 |
| 39. | 05358 | 3.2% | 1.2%(+1.95)#39 | 0.61%(+2.58)#4,571 |
| 40. | 05039 | 3.1% | 1.2%(+1.86)#40 | 0.61%(+2.49)#4,697 |
| 41. | 05488 | 3.1% | 1.2%(+1.85)#41 | 0.61%(+2.48)#4,710 |
| 42. | 05846 | 2.9% | 1.2%(+1.70)#42 | 0.61%(+2.33)#4,910 |
| 43. | 05340 | 2.9% | 1.2%(+1.64)#43 | 0.61%(+2.27)#4,992 |
| 44. | 05450 | 2.9% | 1.2%(+1.63)#44 | 0.61%(+2.25)#5,002 |
| 45. | 05072 | 2.9% | 1.2%(+1.62)#45 | 0.61%(+2.25)#5,008 |
| 46. | 05739 | 2.8% | 1.2%(+1.56)#46 | 0.61%(+2.19)#5,115 |
| 47. | 05872 | 2.8% | 1.2%(+1.54)#47 | 0.61%(+2.17)#5,137 |
| 48. | 05680 | 2.8% | 1.2%(+1.54)#48 | 0.61%(+2.17)#5,152 |
| 49. | 05459 | 2.7% | 1.2%(+1.48)#49 | 0.61%(+2.11)#5,219 |
| 50. | 05847 | 2.7% | 1.2%(+1.46)#50 | 0.61%(+2.09)#5,248 |
| 51. | 05069 | 2.7% | 1.2%(+1.42)#51 | 0.61%(+2.05)#5,315 |
| 52. | 05866 | 2.6% | 1.2%(+1.40)#52 | 0.61%(+2.03)#5,342 |
| 53. | 05860 | 2.6% | 1.2%(+1.34)#53 | 0.61%(+1.97)#5,418 |
| 54. | 05735 | 2.5% | 1.2%(+1.26)#54 | 0.61%(+1.89)#5,554 |
| 55. | 05905 | 2.3% | 1.2%(+1.05)#55 | 0.61%(+1.68)#5,938 |
| 56. | 05257 | 2.3% | 1.2%(+1.05)#56 | 0.61%(+1.68)#5,955 |
| 57. | 05673 | 2.3% | 1.2%(+1.05)#57 | 0.61%(+1.68)#5,957 |
| 58. | 05487 | 2.3% | 1.2%(+1.04)#58 | 0.61%(+1.67)#5,967 |
| 59. | 05343 | 2.3% | 1.2%(+1.02)#59 | 0.61%(+1.65)#6,018 |
| 60. | 05760 | 2.2% | 1.2%(+1.01)#60 | 0.61%(+1.64)#6,041 |
| 61. | 05442 | 2.2% | 1.2%(+0.969)#61 | 0.61%(+1.60)#6,128 |
| 62. | 05761 | 2.2% | 1.2%(+0.955)#62 | 0.61%(+1.58)#6,155 |
| 63. | 05033 | 2.1% | 1.2%(+0.896)#63 | 0.61%(+1.52)#6,270 |
| 64. | 05906 | 2.1% | 1.2%(+0.846)#64 | 0.61%(+1.47)#6,367 |
| 65. | 05042 | 2.0% | 1.2%(+0.780)#65 | 0.61%(+1.41)#6,528 |
| 66. | 05101 | 1.9% | 1.2%(+0.709)#66 | 0.61%(+1.34)#6,687 |
| 67. | 05062 | 1.9% | 1.2%(+0.661)#67 | 0.61%(+1.29)#6,790 |
| 68. | 05851 | 1.9% | 1.2%(+0.644)#68 | 0.61%(+1.27)#6,826 |
| 69. | 05483 | 1.8% | 1.2%(+0.612)#69 | 0.61%(+1.24)#6,904 |
| 70. | 05482 | 1.8% | 1.2%(+0.594)#70 | 0.61%(+1.22)#6,962 |
| 71. | 05862 | 1.8% | 1.2%(+0.585)#71 | 0.61%(+1.21)#6,994 |
| 72. | 05650 | 1.8% | 1.2%(+0.559)#72 | 0.61%(+1.19)#7,058 |
| 73. | 05495 | 1.8% | 1.2%(+0.535)#73 | 0.61%(+1.16)#7,122 |
| 74. | 05401 | 1.7% | 1.2%(+0.491)#74 | 0.61%(+1.12)#7,230 |
| 75. | 05353 | 1.7% | 1.2%(+0.455)#75 | 0.61%(+1.08)#7,327 |
| 76. | 05769 | 1.7% | 1.2%(+0.436)#76 | 0.61%(+1.06)#7,375 |
| 77. | 05161 | 1.7% | 1.2%(+0.420)#77 | 0.61%(+1.05)#7,423 |
| 78. | 05048 | 1.6% | 1.2%(+0.406)#78 | 0.61%(+1.03)#7,462 |
| 79. | 05744 | 1.6% | 1.2%(+0.393)#79 | 0.61%(+1.02)#7,513 |
| 80. | 05261 | 1.5% | 1.2%(+0.301)#80 | 0.61%(+0.928)#7,789 |
| 81. | 05491 | 1.5% | 1.2%(+0.274)#81 | 0.61%(+0.901)#7,860 |
| 82. | 05675 | 1.5% | 1.2%(+0.250)#82 | 0.61%(+0.877)#7,936 |
| 83. | 05346 | 1.5% | 1.2%(+0.243)#83 | 0.61%(+0.870)#7,953 |
| 84. | 05038 | 1.5% | 1.2%(+0.240)#84 | 0.61%(+0.867)#7,961 |
| 85. | 05751 | 1.5% | 1.2%(+0.219)#85 | 0.61%(+0.847)#8,023 |
| 86. | 05663 | 1.4% | 1.2%(+0.196)#86 | 0.61%(+0.824)#8,100 |
| 87. | 05647 | 1.4% | 1.2%(+0.146)#87 | 0.61%(+0.774)#8,277 |
| 88. | 05262 | 1.4% | 1.2%(+0.124)#88 | 0.61%(+0.752)#8,352 |
| 89. | 05486 | 1.4% | 1.2%(+0.118)#89 | 0.61%(+0.746)#8,376 |
| 90. | 05775 | 1.4% | 1.2%(+0.118)#90 | 0.61%(+0.746)#8,377 |
| 91. | 05354 | 1.3% | 1.2%(+0.104)#91 | 0.61%(+0.732)#8,419 |
| 92. | 05494 | 1.3% | 1.2%(+0.104)#92 | 0.61%(+0.732)#8,420 |
| 93. | 05839 | 1.3% | 1.2%(+0.104)#93 | 0.61%(+0.732)#8,421 |
| 94. | 05440 | 1.3% | 1.2%(+0.069)#94 | 0.61%(+0.697)#8,564 |
| 95. | 05156 | 1.3% | 1.2%(+0.059)#95 | 0.61%(+0.687)#8,591 |
| 96. | 05855 | 1.3% | 1.2%(+0.029)#96 | 0.61%(+0.657)#8,714 |
| 97. | 05770 | 1.3% | 1.2%(+0.025)#97 | 0.61%(+0.652)#8,730 |
| 98. | 05441 | 1.2% | 1.2%(+0.013)#98 | 0.61%(+0.641)#8,774 |
| 99. | 05777 | 1.2% | 1.2%(+0.008)#99 | 0.61%(+0.636)#8,791 |
| 100. | 05036 | 1.2% | 1.2%(-0.004)#100 | 0.61%(+0.623)#8,831 |
Common Questions
What are the Top 10 Zip Codes with the Highest Percentage of Population Employed in Farming, Fishing & Forestry in Vermont?
Top 10 Zip Codes with the Highest Percentage of Population Employed in Farming, Fishing & Forestry in Vermont are:
What zip code has the Highest Percentage of Population Employed in Farming, Fishing & Forestry in Vermont?
05778 has the Highest Percentage of Population Employed in Farming, Fishing & Forestry in Vermont with 13.6%.
What is the Percentage of Population Employed in Farming, Fishing & Forestry in the State of Vermont?
Percentage of Population Employed in Farming, Fishing & Forestry in Vermont is 1.2%.
What is the Percentage of Population Employed in Farming, Fishing & Forestry in the United States?
Percentage of Population Employed in Farming, Fishing & Forestry in the United States is 0.61%.