Zip Codes with the Highest Percentage of Population Taking Taxi / Cab to Work in Colchester, VT
RELATED REPORTS & OPTIONS
Taxi / Cab
Colchester
Compare Zip Codes
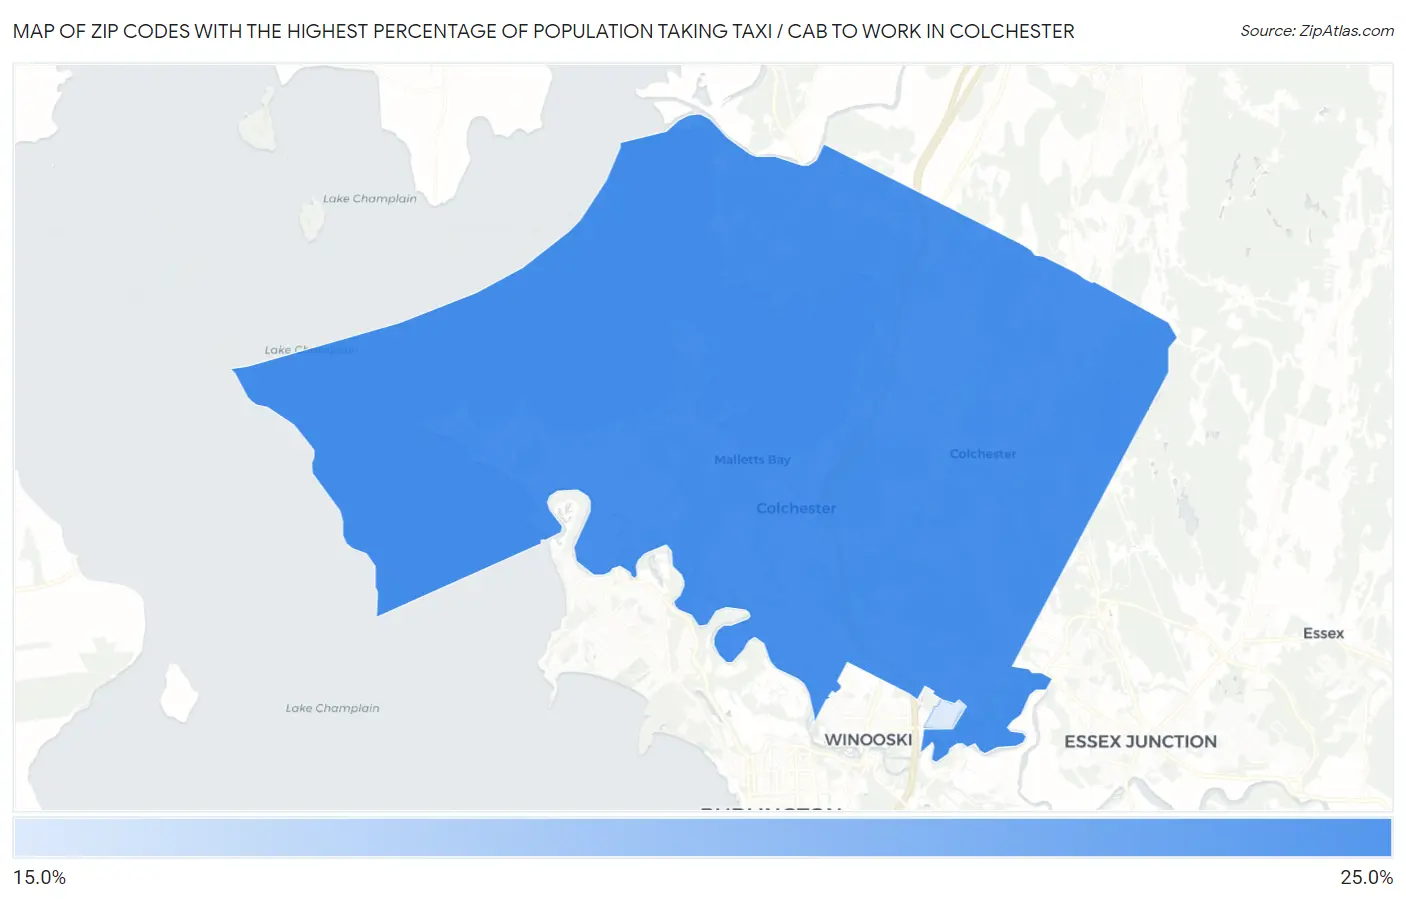
Map of Zip Codes with the Highest Percentage of Population Taking Taxi / Cab to Work in Colchester
18.8%
20.7%
Zip Codes with the Highest Percentage of Population Taking Taxi / Cab to Work in Colchester, VT
| Zip Code | % Take Taxi / Cab | vs State | vs National | |
| 1. | 05446 | 20.7% | 39.9%(-19.2)#42 | 38.2%(-17.5)#12,953 |
| 2. | 05439 | 18.8% | 39.9%(-21.1)#45 | 38.2%(-19.4)#13,170 |
1
Common Questions
What are the Top Zip Codes with the Highest Percentage of Population Taking Taxi / Cab to Work in Colchester, VT?
Top Zip Codes with the Highest Percentage of Population Taking Taxi / Cab to Work in Colchester, VT are:
What zip code has the Highest Percentage of Population Taking Taxi / Cab to Work in Colchester, VT?
05446 has the Highest Percentage of Population Taking Taxi / Cab to Work in Colchester, VT with 20.7%.
What is the Percentage of Population Taking Taxi / Cab to Work in Vermont?
Percentage of Population Taking Taxi / Cab to Work in Vermont is 39.9%.
What is the Percentage of Population Taking Taxi / Cab to Work in the United States?
Percentage of Population Taking Taxi / Cab to Work in the United States is 38.2%.