Zip Codes with the Highest Percentage of Population Employed in Transportation & Warehousing in Utah
RELATED REPORTS & OPTIONS
Transportation & Warehousing
Utah
Compare Zip Codes
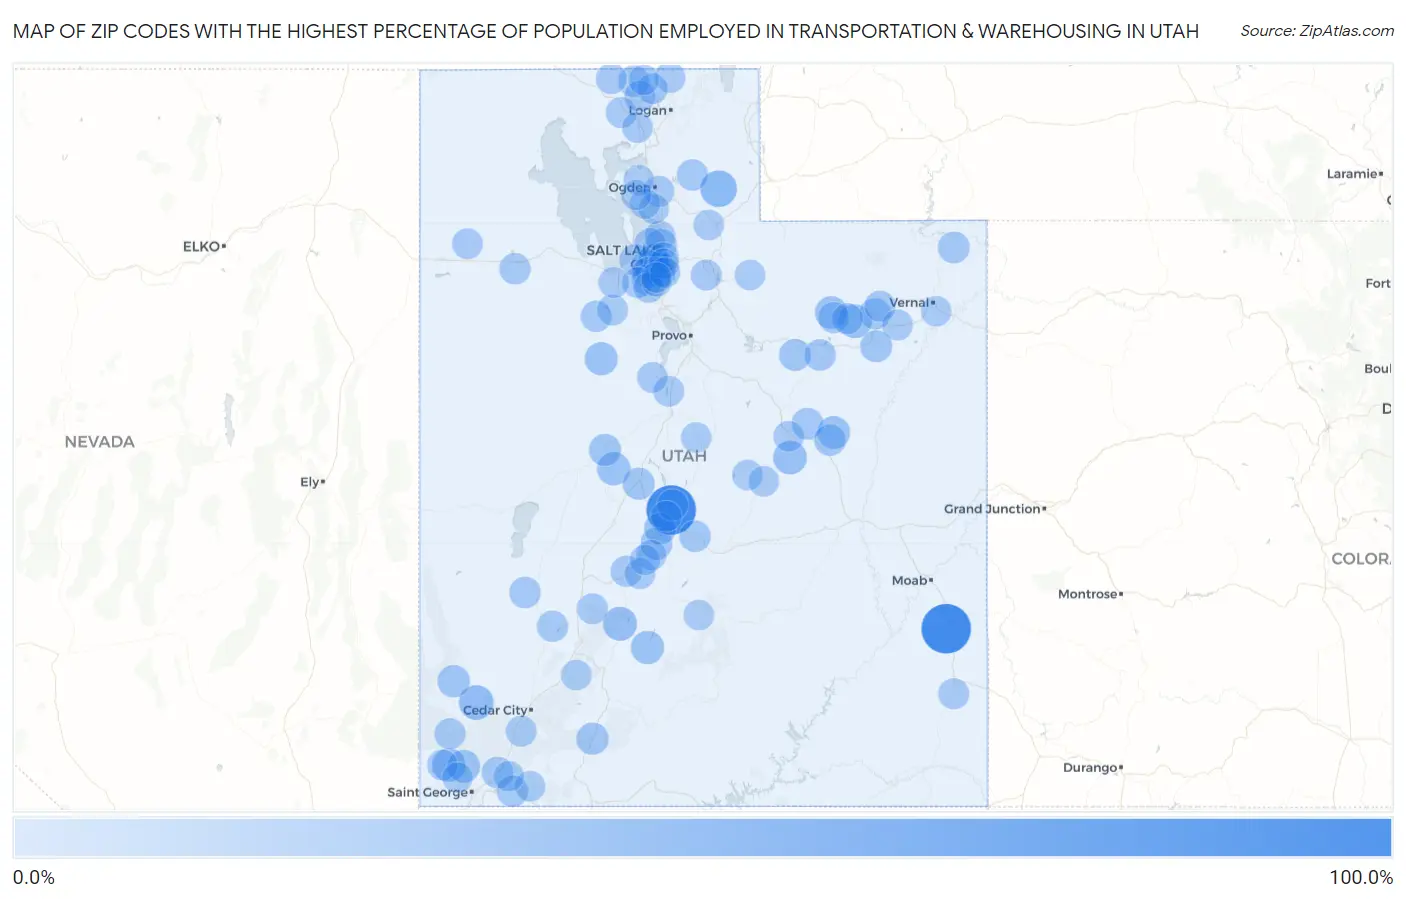
Map of Zip Codes with the Highest Percentage of Population Employed in Transportation & Warehousing in Utah
0.0%
100.0%
Zip Codes with the Highest Percentage of Population Employed in Transportation & Warehousing in Utah
| Zip Code | % Employed | vs State | vs National | |
| 1. | 84530 | 100.0% | 4.7%(+95.3)#1 | 4.9%(+95.1)#1 |
| 2. | 84621 | 100.0% | 4.7%(+95.3)#2 | 4.9%(+95.1)#15 |
| 3. | 84018 | 34.3% | 4.7%(+29.6)#3 | 4.9%(+29.4)#172 |
| 4. | 84756 | 25.3% | 4.7%(+20.6)#4 | 4.9%(+20.3)#326 |
| 5. | 84740 | 22.2% | 4.7%(+17.5)#5 | 4.9%(+17.3)#421 |
| 6. | 84521 | 21.1% | 4.7%(+16.4)#6 | 4.9%(+16.2)#468 |
| 7. | 84007 | 21.1% | 4.7%(+16.4)#7 | 4.9%(+16.2)#473 |
| 8. | 84733 | 19.7% | 4.7%(+15.0)#8 | 4.9%(+14.8)#558 |
| 9. | 84649 | 18.9% | 4.7%(+14.2)#9 | 4.9%(+13.9)#607 |
| 10. | 84712 | 18.6% | 4.7%(+13.9)#10 | 4.9%(+13.7)#630 |
| 11. | 84080 | 18.1% | 4.7%(+13.4)#11 | 4.9%(+13.1)#677 |
| 12. | 84539 | 16.7% | 4.7%(+12.0)#12 | 4.9%(+11.7)#820 |
| 13. | 84783 | 16.1% | 4.7%(+11.4)#13 | 4.9%(+11.2)#887 |
| 14. | 84051 | 15.8% | 4.7%(+11.1)#14 | 4.9%(+10.9)#938 |
| 15. | 84714 | 15.2% | 4.7%(+10.5)#15 | 4.9%(+10.2)#1,026 |
| 16. | 84710 | 14.1% | 4.7%(+9.39)#16 | 4.9%(+9.14)#1,265 |
| 17. | 84640 | 13.6% | 4.7%(+8.86)#17 | 4.9%(+8.61)#1,377 |
| 18. | 84657 | 13.0% | 4.7%(+8.34)#18 | 4.9%(+8.10)#1,522 |
| 19. | 84656 | 12.9% | 4.7%(+8.24)#19 | 4.9%(+7.99)#1,549 |
| 20. | 84027 | 12.3% | 4.7%(+7.56)#20 | 4.9%(+7.32)#1,760 |
| 21. | 84052 | 12.2% | 4.7%(+7.48)#21 | 4.9%(+7.23)#1,791 |
| 22. | 84620 | 12.1% | 4.7%(+7.38)#22 | 4.9%(+7.13)#1,824 |
| 23. | 84542 | 11.7% | 4.7%(+7.02)#23 | 4.9%(+6.78)#1,985 |
| 24. | 84023 | 11.5% | 4.7%(+6.78)#24 | 4.9%(+6.53)#2,087 |
| 25. | 84520 | 11.3% | 4.7%(+6.56)#25 | 4.9%(+6.32)#2,201 |
| 26. | 84054 | 11.1% | 4.7%(+6.36)#26 | 4.9%(+6.11)#2,296 |
| 27. | 84746 | 10.7% | 4.7%(+6.00)#27 | 4.9%(+5.75)#2,479 |
| 28. | 84021 | 10.5% | 4.7%(+5.77)#28 | 4.9%(+5.53)#2,603 |
| 29. | 84654 | 10.4% | 4.7%(+5.68)#29 | 4.9%(+5.43)#2,653 |
| 30. | 84751 | 10.3% | 4.7%(+5.58)#30 | 4.9%(+5.33)#2,722 |
| 31. | 84128 | 10.0% | 4.7%(+5.32)#31 | 4.9%(+5.07)#2,870 |
| 32. | 84622 | 10.0% | 4.7%(+5.29)#32 | 4.9%(+5.04)#2,905 |
| 33. | 84317 | 9.7% | 4.7%(+5.02)#33 | 4.9%(+4.77)#3,059 |
| 34. | 84120 | 9.7% | 4.7%(+5.01)#34 | 4.9%(+4.76)#3,063 |
| 35. | 84029 | 9.6% | 4.7%(+4.88)#35 | 4.9%(+4.63)#3,183 |
| 36. | 84737 | 9.5% | 4.7%(+4.83)#36 | 4.9%(+4.58)#3,212 |
| 37. | 84044 | 9.5% | 4.7%(+4.77)#37 | 4.9%(+4.52)#3,263 |
| 38. | 84066 | 9.4% | 4.7%(+4.70)#38 | 4.9%(+4.45)#3,321 |
| 39. | 84752 | 9.2% | 4.7%(+4.51)#39 | 4.9%(+4.27)#3,466 |
| 40. | 84739 | 9.0% | 4.7%(+4.30)#40 | 4.9%(+4.06)#3,701 |
| 41. | 84073 | 8.9% | 4.7%(+4.19)#41 | 4.9%(+3.94)#3,828 |
| 42. | 84330 | 8.8% | 4.7%(+4.14)#42 | 4.9%(+3.89)#3,885 |
| 43. | 84069 | 8.8% | 4.7%(+4.09)#43 | 4.9%(+3.84)#3,937 |
| 44. | 84104 | 8.7% | 4.7%(+3.99)#44 | 4.9%(+3.74)#4,065 |
| 45. | 84081 | 8.5% | 4.7%(+3.79)#45 | 4.9%(+3.54)#4,295 |
| 46. | 84001 | 8.4% | 4.7%(+3.72)#46 | 4.9%(+3.47)#4,369 |
| 47. | 84119 | 8.4% | 4.7%(+3.70)#47 | 4.9%(+3.45)#4,392 |
| 48. | 84311 | 8.3% | 4.7%(+3.63)#48 | 4.9%(+3.39)#4,460 |
| 49. | 84053 | 8.3% | 4.7%(+3.61)#49 | 4.9%(+3.36)#4,510 |
| 50. | 84116 | 8.2% | 4.7%(+3.47)#50 | 4.9%(+3.22)#4,671 |
| 51. | 84652 | 7.9% | 4.7%(+3.24)#51 | 4.9%(+2.99)#4,982 |
| 52. | 84725 | 7.9% | 4.7%(+3.23)#52 | 4.9%(+2.98)#4,997 |
| 53. | 84129 | 7.9% | 4.7%(+3.20)#53 | 4.9%(+2.96)#5,029 |
| 54. | 84118 | 7.8% | 4.7%(+3.06)#54 | 4.9%(+2.81)#5,241 |
| 55. | 84026 | 7.6% | 4.7%(+2.93)#55 | 4.9%(+2.68)#5,442 |
| 56. | 84071 | 7.6% | 4.7%(+2.87)#56 | 4.9%(+2.62)#5,540 |
| 57. | 84060 | 7.5% | 4.7%(+2.82)#57 | 4.9%(+2.58)#5,600 |
| 58. | 84337 | 7.5% | 4.7%(+2.81)#58 | 4.9%(+2.56)#5,631 |
| 59. | 84535 | 7.5% | 4.7%(+2.80)#59 | 4.9%(+2.55)#5,640 |
| 60. | 84742 | 7.5% | 4.7%(+2.80)#60 | 4.9%(+2.55)#5,644 |
| 61. | 84087 | 7.4% | 4.7%(+2.66)#61 | 4.9%(+2.41)#5,889 |
| 62. | 84331 | 7.3% | 4.7%(+2.62)#62 | 4.9%(+2.37)#5,972 |
| 63. | 84713 | 7.3% | 4.7%(+2.57)#63 | 4.9%(+2.33)#6,049 |
| 64. | 84006 | 7.2% | 4.7%(+2.50)#64 | 4.9%(+2.25)#6,186 |
| 65. | 84408 | 7.1% | 4.7%(+2.44)#65 | 4.9%(+2.20)#6,295 |
| 66. | 84645 | 7.1% | 4.7%(+2.43)#66 | 4.9%(+2.18)#6,309 |
| 67. | 84074 | 7.1% | 4.7%(+2.42)#67 | 4.9%(+2.17)#6,332 |
| 68. | 84123 | 7.0% | 4.7%(+2.31)#68 | 4.9%(+2.07)#6,535 |
| 69. | 84301 | 6.7% | 4.7%(+2.04)#69 | 4.9%(+1.79)#7,078 |
| 70. | 84083 | 6.7% | 4.7%(+1.98)#70 | 4.9%(+1.73)#7,197 |
| 71. | 84754 | 6.6% | 4.7%(+1.88)#71 | 4.9%(+1.63)#7,423 |
| 72. | 84320 | 6.5% | 4.7%(+1.82)#72 | 4.9%(+1.58)#7,524 |
| 73. | 84626 | 6.5% | 4.7%(+1.82)#73 | 4.9%(+1.58)#7,529 |
| 74. | 84765 | 6.4% | 4.7%(+1.75)#74 | 4.9%(+1.50)#7,680 |
| 75. | 84501 | 6.4% | 4.7%(+1.73)#75 | 4.9%(+1.49)#7,729 |
| 76. | 84327 | 6.4% | 4.7%(+1.71)#76 | 4.9%(+1.46)#7,792 |
| 77. | 84009 | 6.4% | 4.7%(+1.68)#77 | 4.9%(+1.43)#7,853 |
| 78. | 84537 | 6.4% | 4.7%(+1.66)#78 | 4.9%(+1.42)#7,896 |
| 79. | 84088 | 6.3% | 4.7%(+1.61)#79 | 4.9%(+1.37)#8,020 |
| 80. | 84305 | 6.1% | 4.7%(+1.37)#80 | 4.9%(+1.12)#8,610 |
| 81. | 84760 | 6.0% | 4.7%(+1.32)#81 | 4.9%(+1.07)#8,735 |
| 82. | 84513 | 6.0% | 4.7%(+1.28)#82 | 4.9%(+1.03)#8,829 |
| 83. | 84730 | 5.9% | 4.7%(+1.20)#83 | 4.9%(+0.955)#9,018 |
| 84. | 84763 | 5.9% | 4.7%(+1.18)#84 | 4.9%(+0.936)#9,094 |
| 85. | 84101 | 5.8% | 4.7%(+1.06)#85 | 4.9%(+0.816)#9,461 |
| 86. | 84115 | 5.7% | 4.7%(+0.976)#86 | 4.9%(+0.729)#9,732 |
| 87. | 84107 | 5.6% | 4.7%(+0.917)#87 | 4.9%(+0.670)#9,911 |
| 88. | 84745 | 5.6% | 4.7%(+0.908)#88 | 4.9%(+0.662)#9,938 |
| 89. | 84404 | 5.5% | 4.7%(+0.820)#89 | 4.9%(+0.574)#10,185 |
| 90. | 84033 | 5.5% | 4.7%(+0.803)#90 | 4.9%(+0.557)#10,235 |
| 91. | 84715 | 5.5% | 4.7%(+0.791)#91 | 4.9%(+0.544)#10,275 |
| 92. | 84036 | 5.5% | 4.7%(+0.786)#92 | 4.9%(+0.539)#10,291 |
| 93. | 84646 | 5.3% | 4.7%(+0.647)#93 | 4.9%(+0.400)#10,755 |
| 94. | 84738 | 5.3% | 4.7%(+0.626)#94 | 4.9%(+0.379)#10,835 |
| 95. | 84084 | 5.3% | 4.7%(+0.607)#95 | 4.9%(+0.360)#10,893 |
| 96. | 84078 | 5.3% | 4.7%(+0.587)#96 | 4.9%(+0.340)#10,953 |
| 97. | 84041 | 5.3% | 4.7%(+0.570)#97 | 4.9%(+0.323)#11,005 |
| 98. | 84711 | 5.2% | 4.7%(+0.503)#98 | 4.9%(+0.256)#11,234 |
| 99. | 84015 | 5.2% | 4.7%(+0.494)#99 | 4.9%(+0.247)#11,267 |
| 100. | 84315 | 5.1% | 4.7%(+0.441)#100 | 4.9%(+0.194)#11,471 |
Common Questions
What are the Top 10 Zip Codes with the Highest Percentage of Population Employed in Transportation & Warehousing in Utah?
Top 10 Zip Codes with the Highest Percentage of Population Employed in Transportation & Warehousing in Utah are:
What zip code has the Highest Percentage of Population Employed in Transportation & Warehousing in Utah?
84530 has the Highest Percentage of Population Employed in Transportation & Warehousing in Utah with 100.0%.
What is the Percentage of Population Employed in Transportation & Warehousing in the State of Utah?
Percentage of Population Employed in Transportation & Warehousing in Utah is 4.7%.
What is the Percentage of Population Employed in Transportation & Warehousing in the United States?
Percentage of Population Employed in Transportation & Warehousing in the United States is 4.9%.