Zip Codes with the Highest Percentage of Population Employed in Farming, Fishing & Forestry in Logan, UT
RELATED REPORTS & OPTIONS
Farming, Fishing & Forestry
Logan
Compare Zip Codes
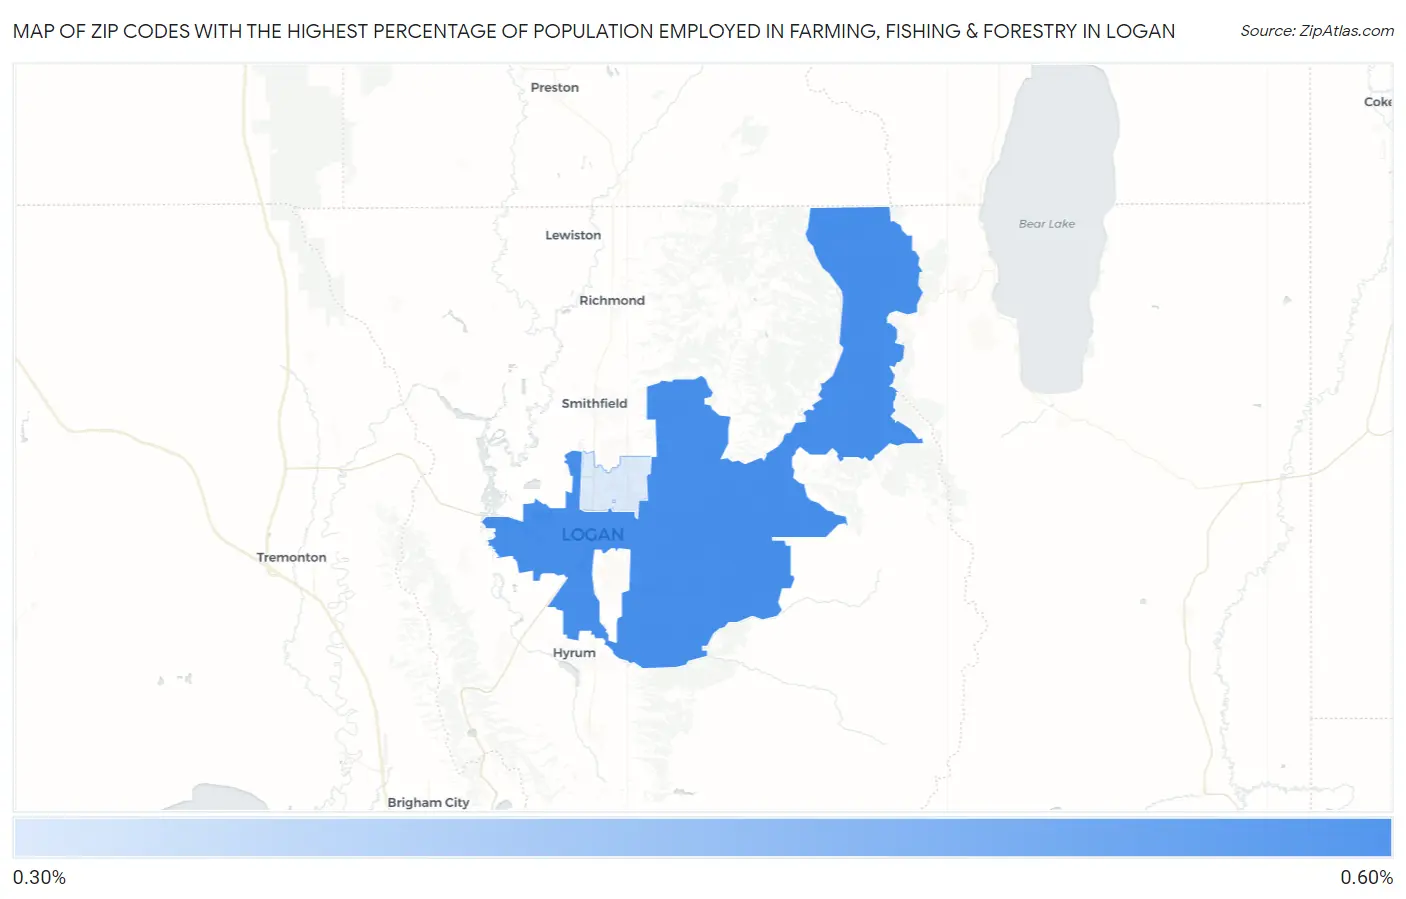
Map of Zip Codes with the Highest Percentage of Population Employed in Farming, Fishing & Forestry in Logan
0.0%
0.60%
Zip Codes with the Highest Percentage of Population Employed in Farming, Fishing & Forestry in Logan, UT
| Zip Code | % Employed | vs State | vs National | |
| 1. | 84321 | 0.54% | 0.32%(+0.216)#96 | 0.61%(-0.067)#12,532 |
| 2. | 84341 | 0.32% | 0.32%(+0.001)#117 | 0.61%(-0.282)#14,541 |
1
Common Questions
What are the Top Zip Codes with the Highest Percentage of Population Employed in Farming, Fishing & Forestry in Logan, UT?
Top Zip Codes with the Highest Percentage of Population Employed in Farming, Fishing & Forestry in Logan, UT are:
What zip code has the Highest Percentage of Population Employed in Farming, Fishing & Forestry in Logan, UT?
84321 has the Highest Percentage of Population Employed in Farming, Fishing & Forestry in Logan, UT with 0.54%.
What is the Percentage of Population Employed in Farming, Fishing & Forestry in Logan, UT?
Percentage of Population Employed in Farming, Fishing & Forestry in Logan is 0.40%.
What is the Percentage of Population Employed in Farming, Fishing & Forestry in Utah?
Percentage of Population Employed in Farming, Fishing & Forestry in Utah is 0.32%.
What is the Percentage of Population Employed in Farming, Fishing & Forestry in the United States?
Percentage of Population Employed in Farming, Fishing & Forestry in the United States is 0.61%.