Zip Codes with the Highest Percentage of Population Employed in Professional & Scientific Services in Round Rock, TX

RELATED REPORTS & OPTIONS

Professional & Scientific Services
Population
Families and Households
Female Fertility
Female Fertility (Unmarried)
Race (Community Size)
Race (Percentage)
Ancestry (Community Size)
AfghanAfricanAlaska NativeAmericanApacheArabAustralianAustrianBelgianBhutaneseBlackfeetBrazilianBritishBurmeseCajunCanadianCelticCentral AmericanCentral American IndianCherokeeChickasawChileanChineseChoctawColombianComancheCreekCroatianCubanCzechCzechoslovakianDanishDominicanDutchEastern EuropeanEcuadorianEgyptianEnglishEthiopianEuropeanFinnishFrenchFrench CanadianGermanGhanaianGreekGuamanian / ChamorroGuatemalanGuyaneseHaitianHonduranHungarianIndian (Asian)IranianIrishItalianJamaicanJapaneseKoreanLaotianLebaneseLithuanianMalteseMexicanMexican American IndianNative HawaiianNicaraguanNigerianNorthern EuropeanNorwegianPakistaniPalestinianPanamanianPeruvianPolishPortuguesePuerto RicanRomanianRussianSalvadoranScandinavianScotch-IrishScottishSlovakSloveneSouth AfricanSouth AmericanSouth American IndianSpaniardSpanishSri LankanSubsaharan AfricanSwedishSwissSyrianThaiTrinidadian and TobagonianTurkishUkrainianVenezuelanWelshWest IndianYugoslavian
Ancestry (Percentage)
AfghanAfricanAlaska NativeAmericanApacheArabAustralianAustrianBelgianBhutaneseBlackfeetBrazilianBritishBurmeseCajunCanadianCelticCentral AmericanCentral American IndianCherokeeChickasawChileanChineseChoctawColombianComancheCreekCroatianCubanCzechCzechoslovakianDanishDominicanDutchEastern EuropeanEcuadorianEgyptianEnglishEthiopianEuropeanFinnishFrenchFrench CanadianGermanGhanaianGreekGuamanian / ChamorroGuatemalanGuyaneseHaitianHonduranHungarianIndian (Asian)IranianIrishItalianJamaicanJapaneseKoreanLaotianLebaneseLithuanianMalteseMexicanMexican American IndianNative HawaiianNicaraguanNigerianNorthern EuropeanNorwegianPakistaniPalestinianPanamanianPeruvianPolishPortuguesePuerto RicanRomanianRussianSalvadoranScandinavianScotch-IrishScottishSlovakSloveneSouth AfricanSouth AmericanSouth American IndianSpaniardSpanishSri LankanSubsaharan AfricanSwedishSwissSyrianThaiTrinidadian and TobagonianTurkishUkrainianVenezuelanWelshWest IndianYugoslavian
Immigrant Origin (Total)
Immigrant Origin (Percentage)
Income
Income (Families)
Income (Households)
Poverty
Poverty (Families)
Unemployment
Employment Occupations
Employment Industries
Employer Class
Commute Time
Commute Means
School Enrollment
Education by Degree Field
Occupancy
Finances
Physical Characteristics
Round Rock
Compare Zip Codes
Comparison Subject

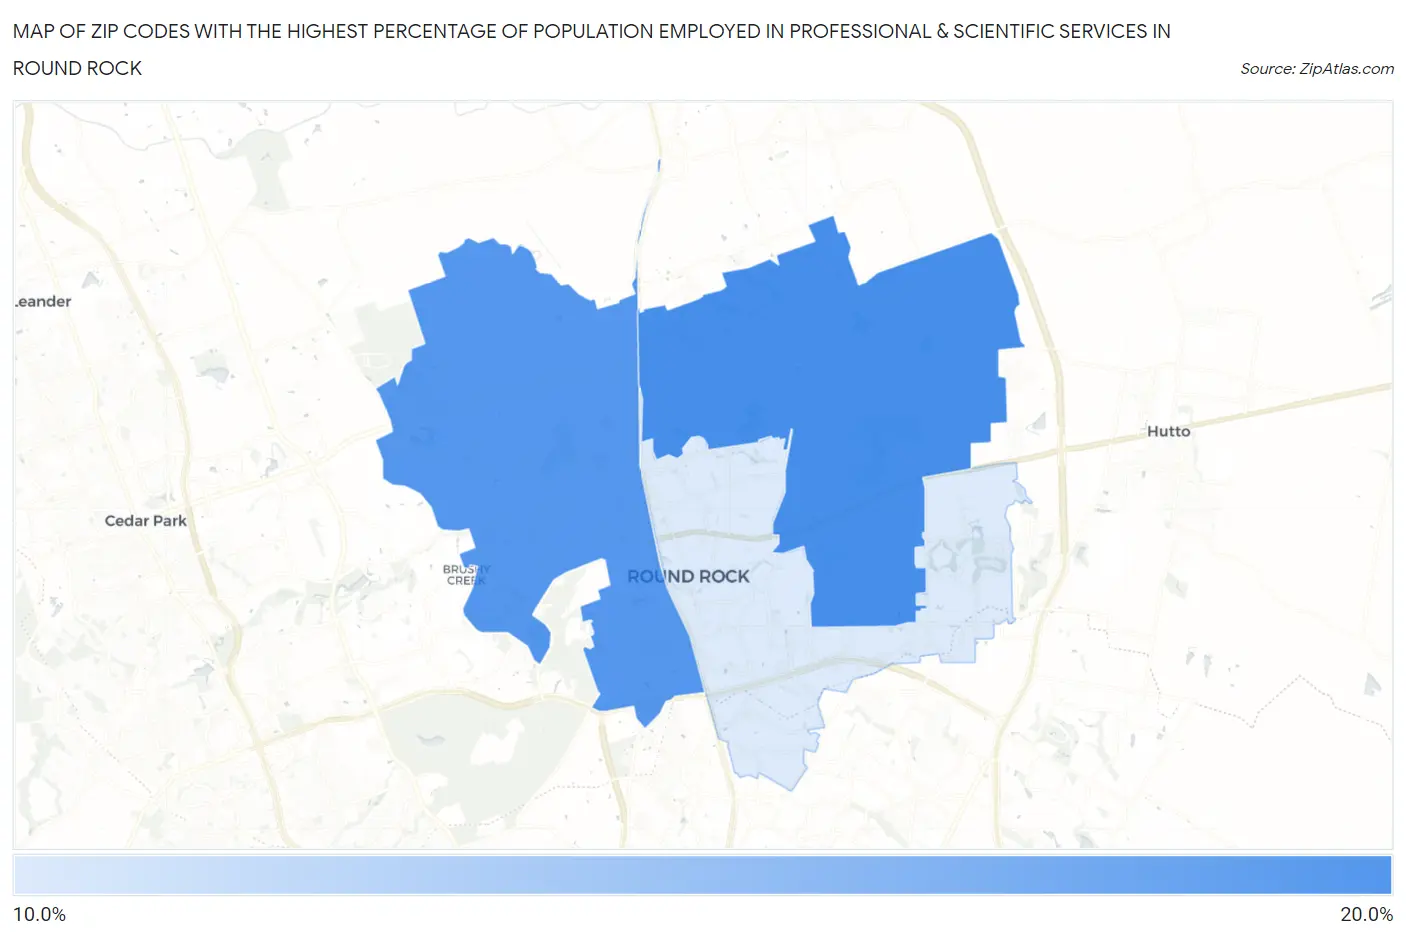
Map of Zip Codes with the Highest Percentage of Population Employed in Professional & Scientific Services in Round Rock

0.0%
20.0%
Zip Codes with the Highest Percentage of Population Employed in Professional & Scientific Services in Round Rock Map

Zip Codes with the Highest Percentage of Population Employed in Professional & Scientific Services in Round Rock, TX

Zip Code % Employed vs State vs National
1.7866515.6%7.6%(+7.98)#1027.8%(+7.74)#1,720
2.7868115.2%7.6%(+7.59)#1117.8%(+7.34)#1,835
3.7866411.5%7.6%(+3.94)#1897.8%(+3.69)#3,492

Common Questions

What are the Top Zip Codes with the Highest Percentage of Population Employed in Professional & Scientific Services in Round Rock, TX?
Top Zip Codes with the Highest Percentage of Population Employed in Professional & Scientific Services in Round Rock, TX are:
#1
15.6%
#2
15.2%
#3
11.5%
What zip code has the Highest Percentage of Population Employed in Professional & Scientific Services in Round Rock, TX?
78665 has the Highest Percentage of Population Employed in Professional & Scientific Services in Round Rock, TX with 15.6%.
What is the Percentage of Population Employed in Professional & Scientific Services in Round Rock, TX?
Percentage of Population Employed in Professional & Scientific Services in Round Rock is 13.4%.
What is the Percentage of Population Employed in Professional & Scientific Services in Texas?
Percentage of Population Employed in Professional & Scientific Services in Texas is 7.6%.
What is the Percentage of Population Employed in Professional & Scientific Services in the United States?
Percentage of Population Employed in Professional & Scientific Services in the United States is 7.8%.