Zip Codes with the Highest Percentage of Population Employed in Professional & Scientific Services in Amarillo, TX
RELATED REPORTS & OPTIONS
Professional & Scientific Services
Amarillo
Compare Zip Codes
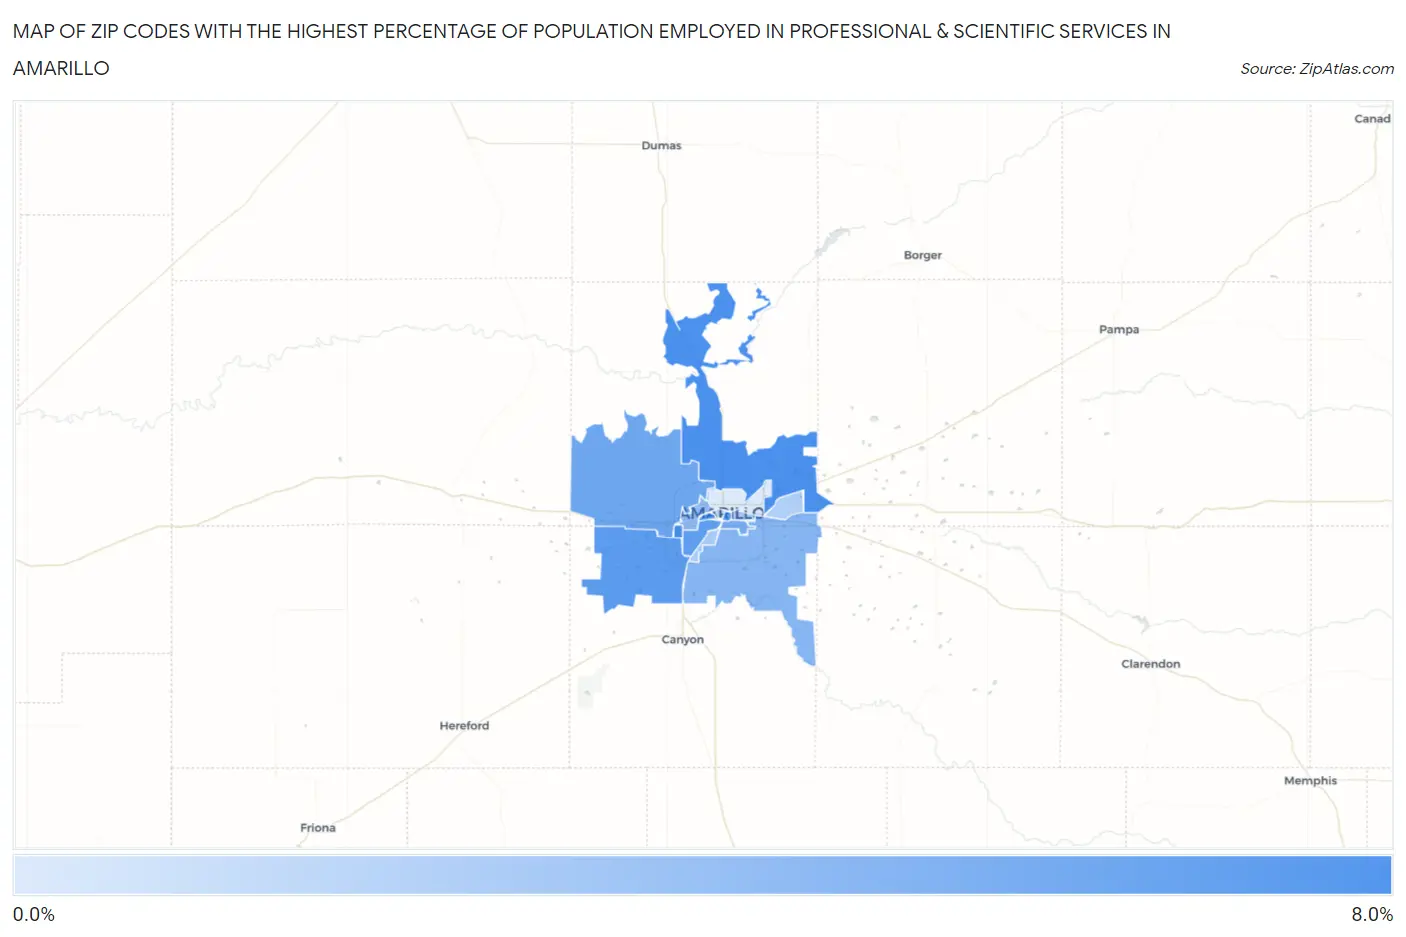
Map of Zip Codes with the Highest Percentage of Population Employed in Professional & Scientific Services in Amarillo
0.0%
8.0%
Zip Codes with the Highest Percentage of Population Employed in Professional & Scientific Services in Amarillo, TX
| Zip Code | % Employed | vs State | vs National | |
| 1. | 79121 | 6.4% | 7.6%(-1.22)#493 | 7.8%(-1.47)#9,237 |
| 2. | 79108 | 6.3% | 7.6%(-1.27)#498 | 7.8%(-1.51)#9,336 |
| 3. | 79102 | 5.7% | 7.6%(-1.86)#575 | 7.8%(-2.10)#10,472 |
| 4. | 79119 | 5.6% | 7.6%(-2.02)#612 | 7.8%(-2.26)#10,886 |
| 5. | 79109 | 5.4% | 7.6%(-2.18)#634 | 7.8%(-2.42)#11,262 |
| 6. | 79124 | 4.9% | 7.6%(-2.75)#721 | 7.8%(-2.99)#12,686 |
| 7. | 79103 | 4.5% | 7.6%(-3.07)#801 | 7.8%(-3.32)#13,570 |
| 8. | 79118 | 3.9% | 7.6%(-3.65)#907 | 7.8%(-3.90)#15,255 |
| 9. | 79106 | 3.5% | 7.6%(-4.10)#998 | 7.8%(-4.35)#16,739 |
| 10. | 79110 | 2.6% | 7.6%(-5.02)#1,170 | 7.8%(-5.26)#19,898 |
| 11. | 79104 | 2.6% | 7.6%(-5.05)#1,177 | 7.8%(-5.29)#19,992 |
| 12. | 79111 | 2.3% | 7.6%(-5.29)#1,235 | 7.8%(-5.54)#20,867 |
| 13. | 79101 | 2.0% | 7.6%(-5.64)#1,303 | 7.8%(-5.88)#22,001 |
| 14. | 79107 | 0.64% | 7.6%(-6.97)#1,518 | 7.8%(-7.21)#25,944 |
1
Common Questions
What are the Top 10 Zip Codes with the Highest Percentage of Population Employed in Professional & Scientific Services in Amarillo, TX?
Top 10 Zip Codes with the Highest Percentage of Population Employed in Professional & Scientific Services in Amarillo, TX are:
What zip code has the Highest Percentage of Population Employed in Professional & Scientific Services in Amarillo, TX?
79121 has the Highest Percentage of Population Employed in Professional & Scientific Services in Amarillo, TX with 6.4%.
What is the Percentage of Population Employed in Professional & Scientific Services in Amarillo, TX?
Percentage of Population Employed in Professional & Scientific Services in Amarillo is 4.0%.
What is the Percentage of Population Employed in Professional & Scientific Services in Texas?
Percentage of Population Employed in Professional & Scientific Services in Texas is 7.6%.
What is the Percentage of Population Employed in Professional & Scientific Services in the United States?
Percentage of Population Employed in Professional & Scientific Services in the United States is 7.8%.