Zip Codes with the Highest Percentage of Population Employed in Agriculture, Fishing & Hunting in Murfreesboro, TN
RELATED REPORTS & OPTIONS
Agriculture, Fishing & Hunting
Murfreesboro
Compare Zip Codes
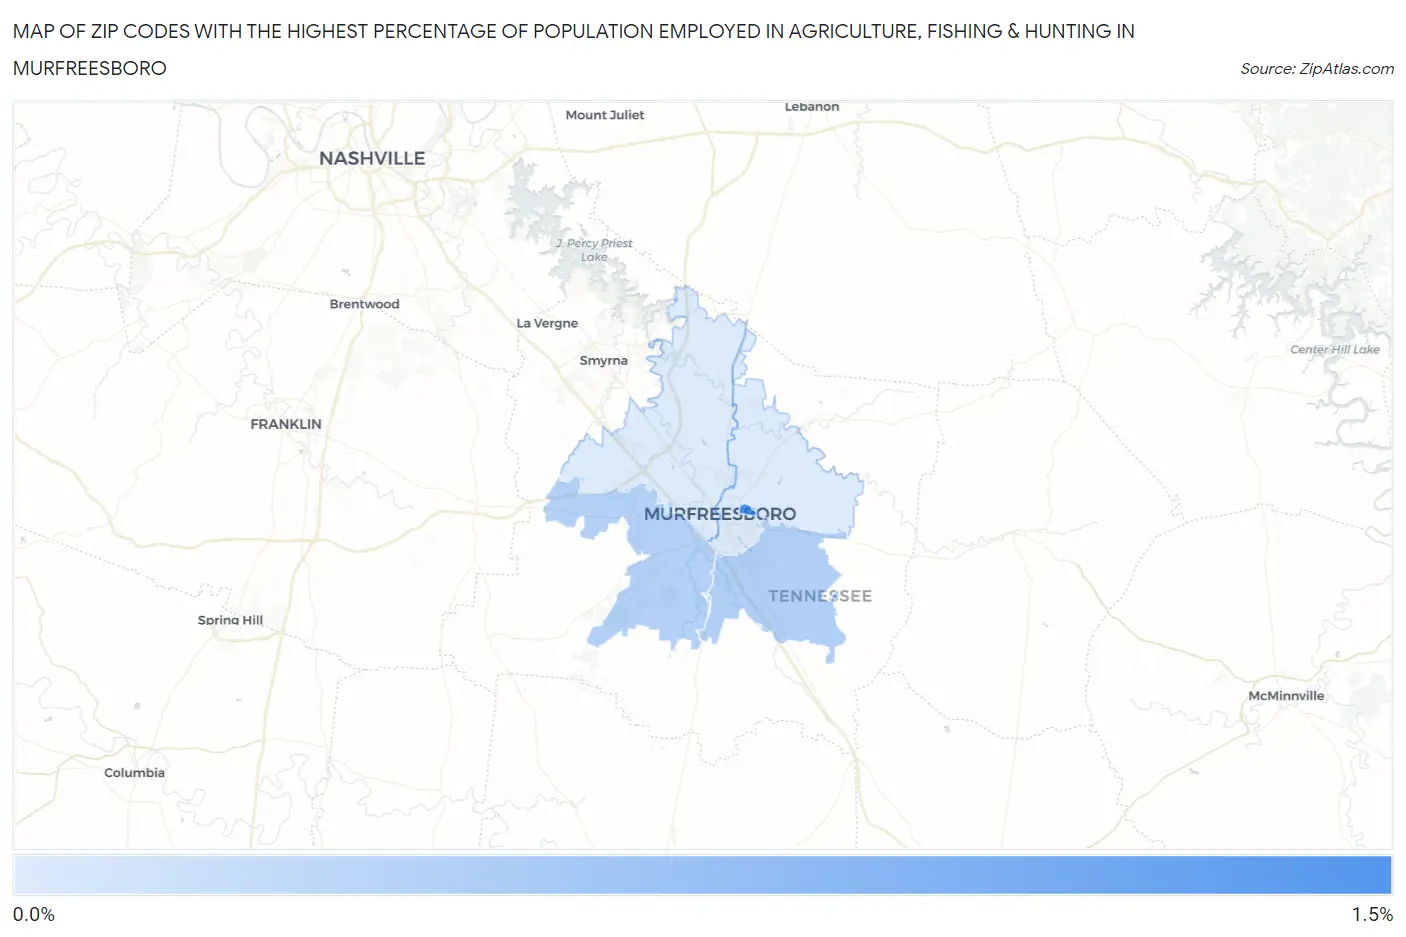
Map of Zip Codes with the Highest Percentage of Population Employed in Agriculture, Fishing & Hunting in Murfreesboro
0.0%
1.5%
Zip Codes with the Highest Percentage of Population Employed in Agriculture, Fishing & Hunting in Murfreesboro, TN
| Zip Code | % Employed | vs State | vs National | |
| 1. | 37132 | 1.4% | 0.74%(+0.633)#217 | 1.2%(+0.171)#14,758 |
| 2. | 37127 | 0.50% | 0.74%(-0.237)#325 | 1.2%(-0.700)#19,288 |
| 3. | 37128 | 0.49% | 0.74%(-0.250)#330 | 1.2%(-0.713)#19,389 |
| 4. | 37130 | 0.16% | 0.74%(-0.577)#424 | 1.2%(-1.04)#22,869 |
| 5. | 37129 | 0.15% | 0.74%(-0.586)#428 | 1.2%(-1.05)#23,000 |
1
Common Questions
What are the Top 3 Zip Codes with the Highest Percentage of Population Employed in Agriculture, Fishing & Hunting in Murfreesboro, TN?
Top 3 Zip Codes with the Highest Percentage of Population Employed in Agriculture, Fishing & Hunting in Murfreesboro, TN are:
What zip code has the Highest Percentage of Population Employed in Agriculture, Fishing & Hunting in Murfreesboro, TN?
37132 has the Highest Percentage of Population Employed in Agriculture, Fishing & Hunting in Murfreesboro, TN with 1.4%.
What is the Percentage of Population Employed in Agriculture, Fishing & Hunting in Murfreesboro, TN?
Percentage of Population Employed in Agriculture, Fishing & Hunting in Murfreesboro is 0.37%.
What is the Percentage of Population Employed in Agriculture, Fishing & Hunting in Tennessee?
Percentage of Population Employed in Agriculture, Fishing & Hunting in Tennessee is 0.74%.
What is the Percentage of Population Employed in Agriculture, Fishing & Hunting in the United States?
Percentage of Population Employed in Agriculture, Fishing & Hunting in the United States is 1.2%.