Zip Codes with the Highest Percentage of Population Employed in Farming, Fishing & Forestry in Murfreesboro, TN
RELATED REPORTS & OPTIONS
Farming, Fishing & Forestry
Murfreesboro
Compare Zip Codes
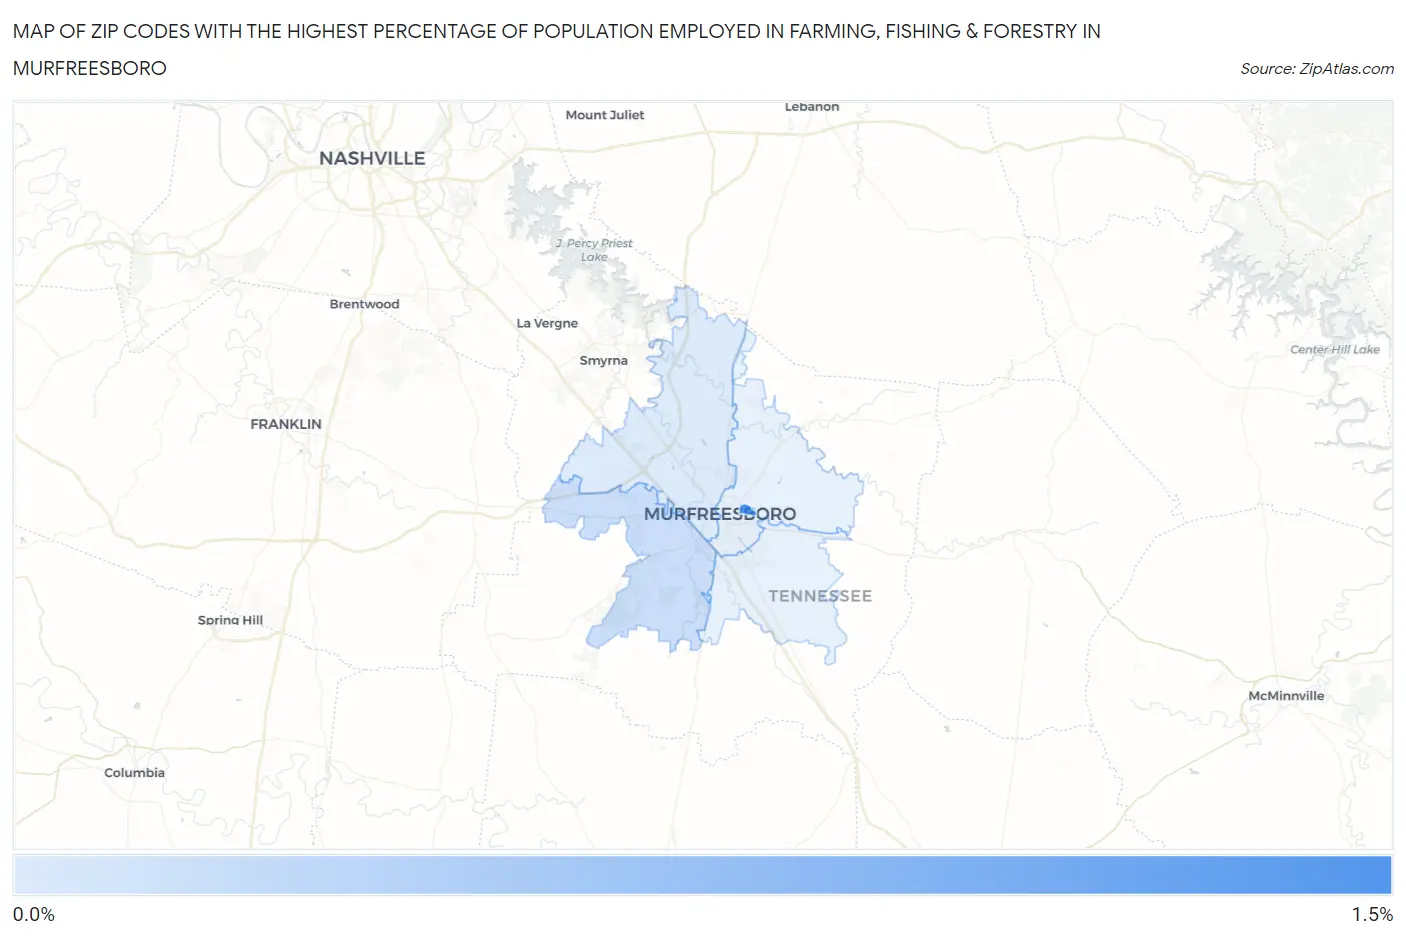
Map of Zip Codes with the Highest Percentage of Population Employed in Farming, Fishing & Forestry in Murfreesboro
0.0%
1.5%
Zip Codes with the Highest Percentage of Population Employed in Farming, Fishing & Forestry in Murfreesboro, TN
| Zip Code | % Employed | vs State | vs National | |
| 1. | 37132 | 1.4% | 0.36%(+1.01)#105 | 0.61%(+0.764)#8,309 |
| 2. | 37128 | 0.34% | 0.36%(-0.023)#215 | 0.61%(-0.270)#14,429 |
| 3. | 37129 | 0.19% | 0.36%(-0.167)#256 | 0.61%(-0.415)#16,270 |
1
Common Questions
What are the Top 3 Zip Codes with the Highest Percentage of Population Employed in Farming, Fishing & Forestry in Murfreesboro, TN?
Top 3 Zip Codes with the Highest Percentage of Population Employed in Farming, Fishing & Forestry in Murfreesboro, TN are:
What zip code has the Highest Percentage of Population Employed in Farming, Fishing & Forestry in Murfreesboro, TN?
37132 has the Highest Percentage of Population Employed in Farming, Fishing & Forestry in Murfreesboro, TN with 1.4%.
What is the Percentage of Population Employed in Farming, Fishing & Forestry in Murfreesboro, TN?
Percentage of Population Employed in Farming, Fishing & Forestry in Murfreesboro is 0.25%.
What is the Percentage of Population Employed in Farming, Fishing & Forestry in Tennessee?
Percentage of Population Employed in Farming, Fishing & Forestry in Tennessee is 0.36%.
What is the Percentage of Population Employed in Farming, Fishing & Forestry in the United States?
Percentage of Population Employed in Farming, Fishing & Forestry in the United States is 0.61%.