Zip Codes with the Highest Percentage of Population Employed in Health Care & Social Assistance in South Carolina
RELATED REPORTS & OPTIONS
Health Care & Social Assistance
South Carolina
Compare Zip Codes
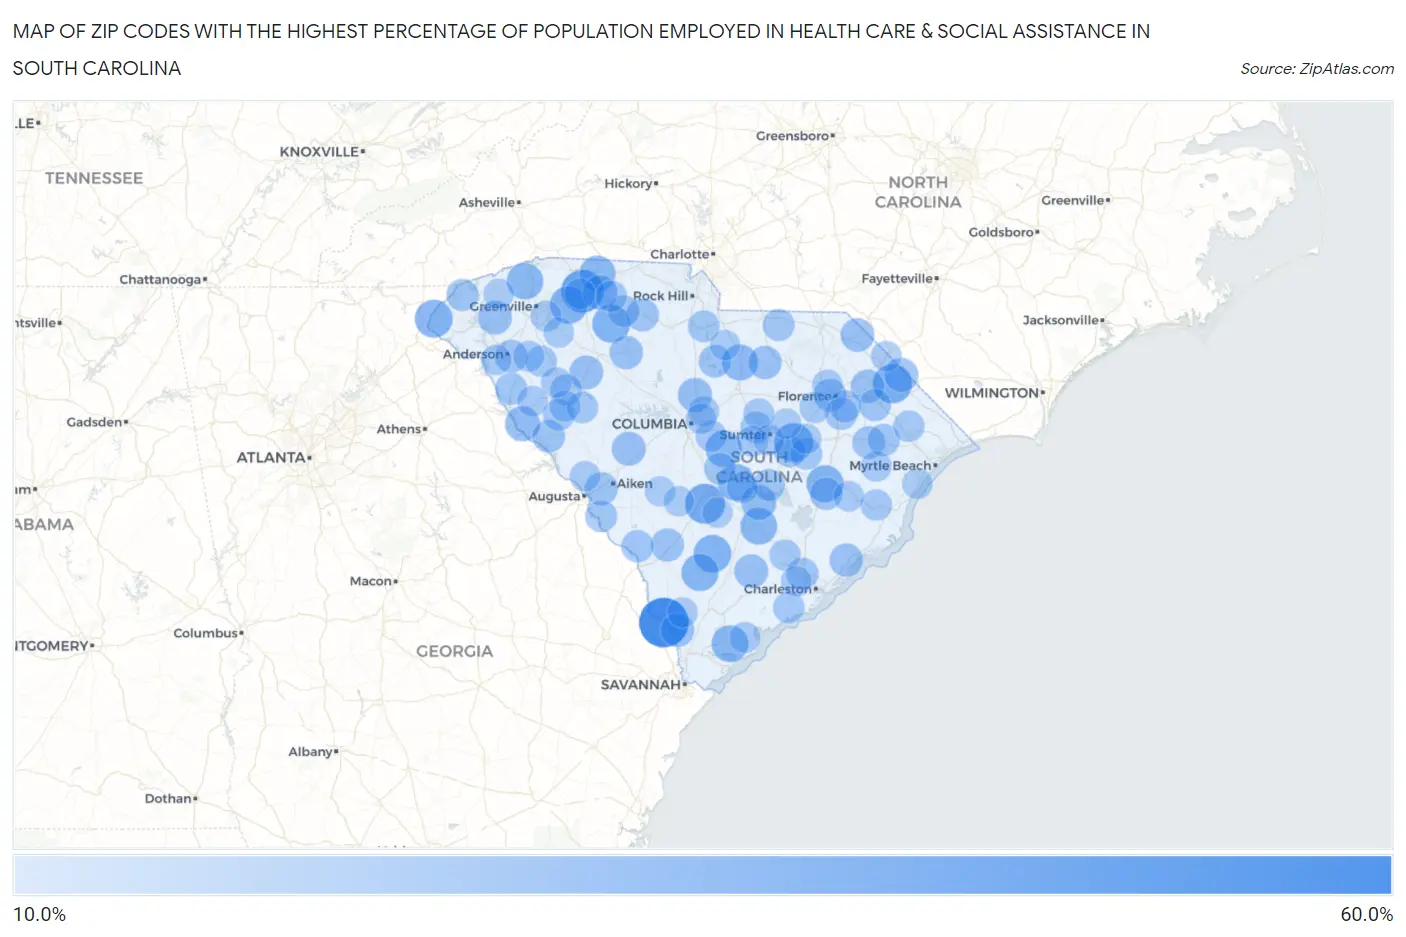
Map of Zip Codes with the Highest Percentage of Population Employed in Health Care & Social Assistance in South Carolina
0.0%
60.0%
Zip Codes with the Highest Percentage of Population Employed in Health Care & Social Assistance in South Carolina
| Zip Code | % Employed | vs State | vs National | |
| 1. | 29922 | 51.1% | 13.1%(+38.0)#1 | 13.9%(+37.2)#205 |
| 2. | 29320 | 38.1% | 13.1%(+25.0)#2 | 13.9%(+24.1)#457 |
| 3. | 29039 | 33.2% | 13.1%(+20.1)#3 | 13.9%(+19.2)#711 |
| 4. | 29543 | 31.5% | 13.1%(+18.4)#4 | 13.9%(+17.5)#812 |
| 5. | 29051 | 31.3% | 13.1%(+18.2)#5 | 13.9%(+17.4)#819 |
| 6. | 29658 | 29.1% | 13.1%(+16.0)#6 | 13.9%(+15.2)#1,034 |
| 7. | 29321 | 29.1% | 13.1%(+16.0)#7 | 13.9%(+15.1)#1,038 |
| 8. | 29493 | 28.9% | 13.1%(+15.9)#8 | 13.9%(+15.0)#1,056 |
| 9. | 29375 | 28.8% | 13.1%(+15.7)#9 | 13.9%(+14.9)#1,084 |
| 10. | 29590 | 27.9% | 13.1%(+14.8)#10 | 13.9%(+14.0)#1,196 |
| 11. | 29929 | 27.8% | 13.1%(+14.7)#11 | 13.9%(+13.9)#1,204 |
| 12. | 29030 | 27.2% | 13.1%(+14.1)#12 | 13.9%(+13.3)#1,308 |
| 13. | 29935 | 27.1% | 13.1%(+14.0)#13 | 13.9%(+13.2)#1,326 |
| 14. | 29448 | 27.1% | 13.1%(+14.0)#14 | 13.9%(+13.1)#1,330 |
| 15. | 29052 | 26.6% | 13.1%(+13.6)#15 | 13.9%(+12.7)#1,402 |
| 16. | 29683 | 26.5% | 13.1%(+13.4)#16 | 13.9%(+12.6)#1,429 |
| 17. | 29368 | 25.8% | 13.1%(+12.7)#17 | 13.9%(+11.9)#1,551 |
| 18. | 29175 | 25.6% | 13.1%(+12.5)#18 | 13.9%(+11.7)#1,591 |
| 19. | 29163 | 24.0% | 13.1%(+10.9)#19 | 13.9%(+10.1)#1,987 |
| 20. | 29840 | 23.9% | 13.1%(+10.8)#20 | 13.9%(+9.96)#2,017 |
| 21. | 29346 | 23.3% | 13.1%(+10.2)#21 | 13.9%(+9.38)#2,218 |
| 22. | 29016 | 22.1% | 13.1%(+9.04)#22 | 13.9%(+8.19)#2,735 |
| 23. | 29667 | 22.1% | 13.1%(+8.99)#23 | 13.9%(+8.14)#2,762 |
| 24. | 29563 | 22.0% | 13.1%(+8.96)#24 | 13.9%(+8.10)#2,781 |
| 25. | 29105 | 21.9% | 13.1%(+8.80)#25 | 13.9%(+7.95)#2,856 |
| 26. | 29370 | 21.8% | 13.1%(+8.76)#26 | 13.9%(+7.91)#2,883 |
| 27. | 29474 | 21.7% | 13.1%(+8.58)#27 | 13.9%(+7.73)#2,970 |
| 28. | 29594 | 21.4% | 13.1%(+8.34)#28 | 13.9%(+7.49)#3,102 |
| 29. | 29943 | 21.4% | 13.1%(+8.31)#29 | 13.9%(+7.45)#3,118 |
| 30. | 29592 | 21.2% | 13.1%(+8.16)#30 | 13.9%(+7.30)#3,211 |
| 31. | 29178 | 21.1% | 13.1%(+8.00)#31 | 13.9%(+7.15)#3,320 |
| 32. | 29009 | 20.8% | 13.1%(+7.73)#32 | 13.9%(+6.88)#3,495 |
| 33. | 29429 | 20.7% | 13.1%(+7.65)#33 | 13.9%(+6.80)#3,554 |
| 34. | 29849 | 20.7% | 13.1%(+7.58)#34 | 13.9%(+6.73)#3,603 |
| 35. | 29828 | 20.5% | 13.1%(+7.44)#35 | 13.9%(+6.59)#3,701 |
| 36. | 29364 | 19.9% | 13.1%(+6.77)#36 | 13.9%(+5.92)#4,186 |
| 37. | 29621 | 19.8% | 13.1%(+6.68)#37 | 13.9%(+5.83)#4,256 |
| 38. | 29555 | 19.8% | 13.1%(+6.68)#38 | 13.9%(+5.83)#4,257 |
| 39. | 29835 | 19.6% | 13.1%(+6.48)#39 | 13.9%(+5.63)#4,438 |
| 40. | 29074 | 19.4% | 13.1%(+6.27)#40 | 13.9%(+5.42)#4,652 |
| 41. | 29501 | 19.3% | 13.1%(+6.17)#41 | 13.9%(+5.32)#4,749 |
| 42. | 29541 | 19.2% | 13.1%(+6.13)#42 | 13.9%(+5.28)#4,785 |
| 43. | 29564 | 19.2% | 13.1%(+6.09)#43 | 13.9%(+5.24)#4,811 |
| 44. | 29836 | 18.9% | 13.1%(+5.84)#44 | 13.9%(+4.98)#5,075 |
| 45. | 29571 | 18.8% | 13.1%(+5.75)#45 | 13.9%(+4.90)#5,169 |
| 46. | 29505 | 18.8% | 13.1%(+5.73)#46 | 13.9%(+4.88)#5,186 |
| 47. | 29546 | 18.7% | 13.1%(+5.64)#47 | 13.9%(+4.78)#5,291 |
| 48. | 29686 | 18.6% | 13.1%(+5.50)#48 | 13.9%(+4.65)#5,443 |
| 49. | 29404 | 18.5% | 13.1%(+5.46)#49 | 13.9%(+4.61)#5,492 |
| 50. | 29655 | 18.4% | 13.1%(+5.32)#50 | 13.9%(+4.47)#5,674 |
| 51. | 29148 | 18.4% | 13.1%(+5.31)#51 | 13.9%(+4.46)#5,689 |
| 52. | 29727 | 18.3% | 13.1%(+5.20)#52 | 13.9%(+4.35)#5,833 |
| 53. | 29111 | 18.2% | 13.1%(+5.13)#53 | 13.9%(+4.28)#5,918 |
| 54. | 29001 | 18.1% | 13.1%(+5.05)#54 | 13.9%(+4.20)#6,031 |
| 55. | 29831 | 18.1% | 13.1%(+4.97)#55 | 13.9%(+4.12)#6,103 |
| 56. | 29135 | 18.0% | 13.1%(+4.95)#56 | 13.9%(+4.10)#6,128 |
| 57. | 29353 | 18.0% | 13.1%(+4.91)#57 | 13.9%(+4.06)#6,185 |
| 58. | 29714 | 18.0% | 13.1%(+4.91)#58 | 13.9%(+4.06)#6,194 |
| 59. | 29152 | 17.9% | 13.1%(+4.77)#59 | 13.9%(+3.92)#6,376 |
| 60. | 29819 | 17.7% | 13.1%(+4.60)#60 | 13.9%(+3.75)#6,656 |
| 61. | 29649 | 17.5% | 13.1%(+4.42)#61 | 13.9%(+3.57)#6,919 |
| 62. | 29666 | 17.5% | 13.1%(+4.39)#62 | 13.9%(+3.54)#6,961 |
| 63. | 29511 | 17.4% | 13.1%(+4.31)#63 | 13.9%(+3.46)#7,108 |
| 64. | 29487 | 17.3% | 13.1%(+4.22)#64 | 13.9%(+3.37)#7,239 |
| 65. | 29373 | 17.3% | 13.1%(+4.19)#65 | 13.9%(+3.34)#7,272 |
| 66. | 29646 | 17.2% | 13.1%(+4.10)#66 | 13.9%(+3.24)#7,419 |
| 67. | 29654 | 17.2% | 13.1%(+4.08)#67 | 13.9%(+3.23)#7,446 |
| 68. | 29061 | 17.2% | 13.1%(+4.07)#68 | 13.9%(+3.22)#7,465 |
| 69. | 29440 | 17.2% | 13.1%(+4.07)#69 | 13.9%(+3.22)#7,480 |
| 70. | 29161 | 17.0% | 13.1%(+3.93)#70 | 13.9%(+3.08)#7,696 |
| 71. | 29047 | 17.0% | 13.1%(+3.92)#71 | 13.9%(+3.06)#7,723 |
| 72. | 29662 | 16.9% | 13.1%(+3.79)#72 | 13.9%(+2.94)#7,926 |
| 73. | 29483 | 16.8% | 13.1%(+3.67)#73 | 13.9%(+2.82)#8,117 |
| 74. | 29301 | 16.6% | 13.1%(+3.56)#74 | 13.9%(+2.71)#8,299 |
| 75. | 29040 | 16.6% | 13.1%(+3.48)#75 | 13.9%(+2.62)#8,445 |
| 76. | 29627 | 16.5% | 13.1%(+3.37)#76 | 13.9%(+2.52)#8,639 |
| 77. | 29907 | 16.4% | 13.1%(+3.31)#77 | 13.9%(+2.46)#8,739 |
| 78. | 29154 | 16.3% | 13.1%(+3.23)#78 | 13.9%(+2.38)#8,899 |
| 79. | 29150 | 16.2% | 13.1%(+3.15)#79 | 13.9%(+2.30)#9,070 |
| 80. | 29532 | 16.2% | 13.1%(+3.10)#80 | 13.9%(+2.25)#9,147 |
| 81. | 29554 | 16.1% | 13.1%(+3.05)#81 | 13.9%(+2.20)#9,239 |
| 82. | 29223 | 16.0% | 13.1%(+2.92)#82 | 13.9%(+2.07)#9,486 |
| 83. | 29653 | 16.0% | 13.1%(+2.90)#83 | 13.9%(+2.05)#9,527 |
| 84. | 29510 | 16.0% | 13.1%(+2.89)#84 | 13.9%(+2.04)#9,540 |
| 85. | 29206 | 15.9% | 13.1%(+2.84)#85 | 13.9%(+1.99)#9,643 |
| 86. | 29547 | 15.9% | 13.1%(+2.83)#86 | 13.9%(+1.97)#9,672 |
| 87. | 29620 | 15.9% | 13.1%(+2.80)#87 | 13.9%(+1.95)#9,731 |
| 88. | 29414 | 15.8% | 13.1%(+2.75)#88 | 13.9%(+1.90)#9,854 |
| 89. | 29626 | 15.8% | 13.1%(+2.71)#89 | 13.9%(+1.86)#9,917 |
| 90. | 29860 | 15.7% | 13.1%(+2.66)#90 | 13.9%(+1.81)#10,026 |
| 91. | 29644 | 15.7% | 13.1%(+2.66)#91 | 13.9%(+1.81)#10,029 |
| 92. | 29576 | 15.7% | 13.1%(+2.59)#92 | 13.9%(+1.74)#10,156 |
| 93. | 29146 | 15.6% | 13.1%(+2.48)#93 | 13.9%(+1.63)#10,358 |
| 94. | 29934 | 15.6% | 13.1%(+2.48)#94 | 13.9%(+1.63)#10,371 |
| 95. | 29058 | 15.5% | 13.1%(+2.37)#95 | 13.9%(+1.52)#10,617 |
| 96. | 29113 | 15.4% | 13.1%(+2.36)#96 | 13.9%(+1.50)#10,652 |
| 97. | 29671 | 15.4% | 13.1%(+2.29)#97 | 13.9%(+1.44)#10,814 |
| 98. | 29162 | 15.4% | 13.1%(+2.28)#98 | 13.9%(+1.42)#10,847 |
| 99. | 29104 | 15.3% | 13.1%(+2.24)#99 | 13.9%(+1.38)#10,941 |
| 100. | 29133 | 15.3% | 13.1%(+2.22)#100 | 13.9%(+1.37)#10,961 |
Common Questions
What are the Top 10 Zip Codes with the Highest Percentage of Population Employed in Health Care & Social Assistance in South Carolina?
Top 10 Zip Codes with the Highest Percentage of Population Employed in Health Care & Social Assistance in South Carolina are:
What zip code has the Highest Percentage of Population Employed in Health Care & Social Assistance in South Carolina?
29922 has the Highest Percentage of Population Employed in Health Care & Social Assistance in South Carolina with 51.1%.
What is the Percentage of Population Employed in Health Care & Social Assistance in the State of South Carolina?
Percentage of Population Employed in Health Care & Social Assistance in South Carolina is 13.1%.
What is the Percentage of Population Employed in Health Care & Social Assistance in the United States?
Percentage of Population Employed in Health Care & Social Assistance in the United States is 13.9%.