Zip Codes with the Highest Percentage of Population Employed in Farming, Fishing & Forestry in Massillon, OH
RELATED REPORTS & OPTIONS
Farming, Fishing & Forestry
Massillon
Compare Zip Codes
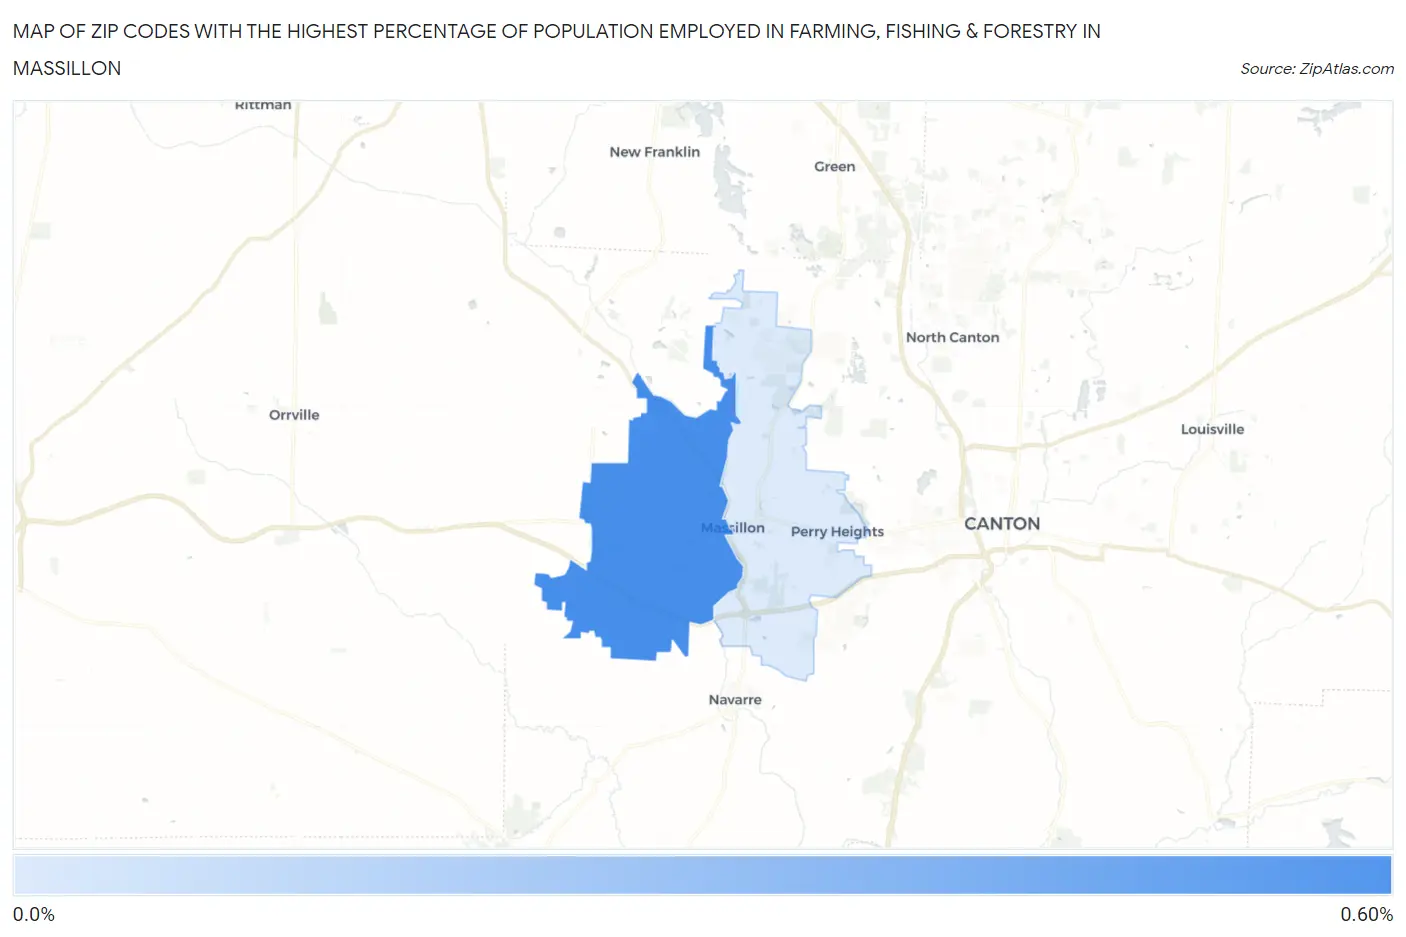
Map of Zip Codes with the Highest Percentage of Population Employed in Farming, Fishing & Forestry in Massillon
0.0%
0.60%
Zip Codes with the Highest Percentage of Population Employed in Farming, Fishing & Forestry in Massillon, OH
| Zip Code | % Employed | vs State | vs National | |
| 1. | 44647 | 0.57% | 0.29%(+0.281)#263 | 0.61%(-0.036)#12,298 |
| 2. | 44646 | 0.063% | 0.29%(-0.226)#530 | 0.61%(-0.542)#18,413 |
1
Common Questions
What are the Top Zip Codes with the Highest Percentage of Population Employed in Farming, Fishing & Forestry in Massillon, OH?
Top Zip Codes with the Highest Percentage of Population Employed in Farming, Fishing & Forestry in Massillon, OH are:
What zip code has the Highest Percentage of Population Employed in Farming, Fishing & Forestry in Massillon, OH?
44647 has the Highest Percentage of Population Employed in Farming, Fishing & Forestry in Massillon, OH with 0.57%.
What is the Percentage of Population Employed in Farming, Fishing & Forestry in Massillon, OH?
Percentage of Population Employed in Farming, Fishing & Forestry in Massillon is 0.24%.
What is the Percentage of Population Employed in Farming, Fishing & Forestry in Ohio?
Percentage of Population Employed in Farming, Fishing & Forestry in Ohio is 0.29%.
What is the Percentage of Population Employed in Farming, Fishing & Forestry in the United States?
Percentage of Population Employed in Farming, Fishing & Forestry in the United States is 0.61%.