Zip Codes with the Highest Percentage of Households With Two or more Vehicles in Rochester, NY

RELATED REPORTS & OPTIONS

Households with 2 or more Cars
Population
Families and Households
Female Fertility
Female Fertility (Unmarried)
Race (Community Size)
Race (Percentage)
Ancestry (Community Size)
AfghanAfricanAlbanianAlsatianAmericanApacheArabArgentineanArmenianAustralianAustrianBahamianBarbadianBasqueBelgianBelizeanBhutaneseBlackfeetBolivianBrazilianBritishBritish West IndianBulgarianBurmeseCambodianCanadianCape VerdeanCelticCentral AmericanCentral American IndianCherokeeChileanChippewaChoctawColombianCosta RicanCroatianCubanCzechCzechoslovakianDanishDominicanDutchEastern EuropeanEcuadorianEgyptianEnglishEstonianEthiopianEuropeanFilipinoFinnishFrenchFrench CanadianGermanGhanaianGreekGuamanian / ChamorroGuatemalanGuyaneseHaitianHonduranHungarianIcelanderIndian (Asian)IndonesianIranianIraqiIrishIroquoisIsraeliItalianJamaicanJapaneseKenyanKoreanLatvianLebaneseLiberianLithuanianLuxembourgerMacedonianMalaysianMexicanMexican American IndianMongolianMoroccanNative HawaiianNavajoNicaraguanNigerianNorthern EuropeanNorwegianPakistaniPalestinianPanamanianParaguayanPennsylvania GermanPeruvianPolishPortuguesePuebloPuerto RicanRomanianRussianSalvadoranSamoanScandinavianScotch-IrishScottishSeminoleSerbianSlavicSlovakSloveneSomaliSouth AfricanSouth AmericanSouth American IndianSpaniardSpanishSri LankanSubsaharan AfricanSudaneseSwedishSwissSyrianThaiTrinidadian and TobagonianTurkishU.S. Virgin IslanderUkrainianVenezuelanVietnameseWelshWest IndianYugoslavianZimbabwean
Ancestry (Percentage)
AfghanAfricanAlbanianAlsatianAmericanApacheArabArgentineanArmenianAustralianAustrianBahamianBarbadianBasqueBelgianBelizeanBhutaneseBlackfeetBolivianBrazilianBritishBritish West IndianBulgarianBurmeseCambodianCanadianCape VerdeanCelticCentral AmericanCentral American IndianCherokeeChileanChippewaChoctawColombianCosta RicanCroatianCubanCzechCzechoslovakianDanishDominicanDutchEastern EuropeanEcuadorianEgyptianEnglishEstonianEthiopianEuropeanFilipinoFinnishFrenchFrench CanadianGermanGhanaianGreekGuamanian / ChamorroGuatemalanGuyaneseHaitianHonduranHungarianIcelanderIndian (Asian)IndonesianIranianIraqiIrishIroquoisIsraeliItalianJamaicanJapaneseKenyanKoreanLatvianLebaneseLiberianLithuanianLuxembourgerMacedonianMalaysianMexicanMexican American IndianMongolianMoroccanNative HawaiianNavajoNicaraguanNigerianNorthern EuropeanNorwegianPakistaniPalestinianPanamanianParaguayanPennsylvania GermanPeruvianPolishPortuguesePuebloPuerto RicanRomanianRussianSalvadoranSamoanScandinavianScotch-IrishScottishSeminoleSerbianSlavicSlovakSloveneSomaliSouth AfricanSouth AmericanSouth American IndianSpaniardSpanishSri LankanSubsaharan AfricanSudaneseSwedishSwissSyrianThaiTrinidadian and TobagonianTurkishU.S. Virgin IslanderUkrainianVenezuelanVietnameseWelshWest IndianYugoslavianZimbabwean
Immigrant Origin (Total)
AfghanistanAfricaAlbaniaArgentinaArmeniaAsiaAustraliaAustriaBangladeshBarbadosBelarusBelgiumBelizeBoliviaBosnia and HerzegovinaBrazilBulgariaBurma / MyanmarCambodiaCameroonCanadaCaribbeanCentral AmericaChileChinaColombiaCongoCosta RicaCroatiaCubaCzechoslovakiaDominican RepublicEastern AfricaEastern AsiaEastern EuropeEcuadorEgyptEl SalvadorEnglandEritreaEthiopiaEuropeFranceGermanyGhanaGreeceGrenadaGuatemalaGuyanaHaitiHondurasHong KongHungaryIndiaIranIraqIrelandIsraelItalyJamaicaJapanKazakhstanKenyaKoreaKuwaitLaosLatin AmericaLebanonLiberiaLithuaniaMalaysiaMexicoMiddle AfricaMoldovaMoroccoNepalNetherlandsNicaraguaNigeriaNorth MacedoniaNorthern AfricaNorthern EuropeOceaniaPakistanPanamaPeruPhilippinesPolandPortugalRomaniaRussiaSaudi ArabiaScotlandSenegalSerbiaSingaporeSomaliaSouth AfricaSouth AmericaSouth Central AsiaSouth Eastern AsiaSouthern EuropeSpainSri LankaSudanSwedenSyriaTaiwanThailandTrinidad and TobagoTurkeyUgandaUkraineUzbekistanVenezuelaVietnamWestern AfricaWestern AsiaWestern EuropeYemenZaireZimbabwe
Immigrant Origin (Percentage)
AfghanistanAfricaAlbaniaArgentinaArmeniaAsiaAustraliaAustriaBangladeshBarbadosBelarusBelgiumBelizeBoliviaBosnia and HerzegovinaBrazilBulgariaBurma / MyanmarCambodiaCameroonCanadaCaribbeanCentral AmericaChileChinaColombiaCongoCosta RicaCroatiaCubaCzechoslovakiaDominican RepublicEastern AfricaEastern AsiaEastern EuropeEcuadorEgyptEl SalvadorEnglandEritreaEthiopiaEuropeFranceGermanyGhanaGreeceGrenadaGuatemalaGuyanaHaitiHondurasHong KongHungaryIndiaIranIraqIrelandIsraelItalyJamaicaJapanKazakhstanKenyaKoreaKuwaitLaosLatin AmericaLebanonLiberiaLithuaniaMalaysiaMexicoMiddle AfricaMoldovaMoroccoNepalNetherlandsNicaraguaNigeriaNorth MacedoniaNorthern AfricaNorthern EuropeOceaniaPakistanPanamaPeruPhilippinesPolandPortugalRomaniaRussiaSaudi ArabiaScotlandSenegalSerbiaSingaporeSomaliaSouth AfricaSouth AmericaSouth Central AsiaSouth Eastern AsiaSouthern EuropeSpainSri LankaSudanSwedenSyriaTaiwanThailandTrinidad and TobagoTurkeyUgandaUkraineUzbekistanVenezuelaVietnamWestern AfricaWestern AsiaWestern EuropeYemenZaireZimbabwe
Income
Income (Families)
Income (Households)
Poverty
Poverty (Families)
Unemployment
Employment Occupations
Employment Industries
Employer Class
Commute Time
Commute Means
School Enrollment
Education by Degree Field
Occupancy
Finances
Physical Characteristics
Rochester
Compare Zip Codes
Comparison Subject

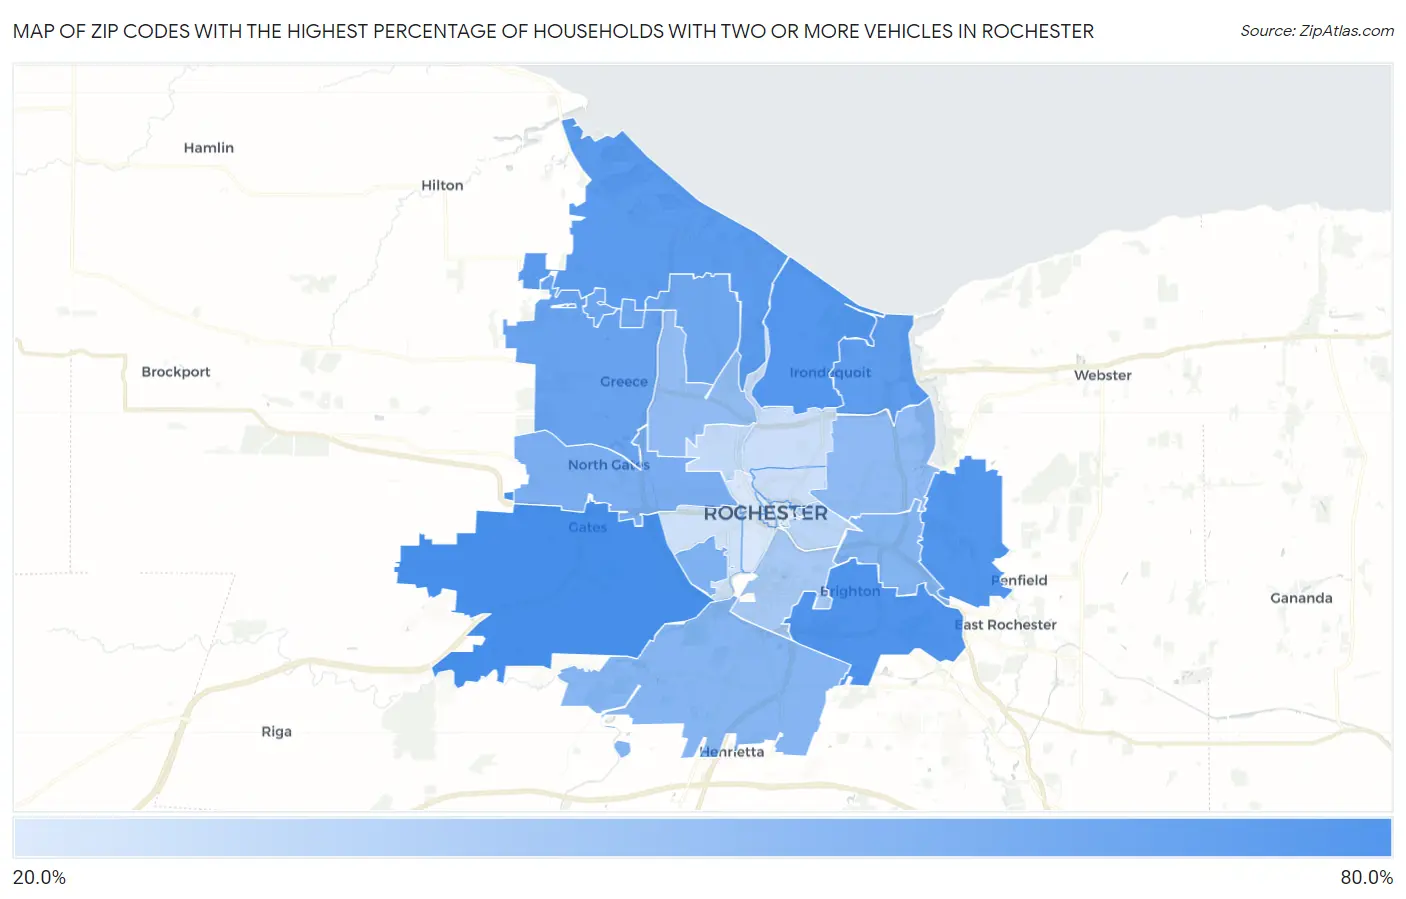
Map of Zip Codes with the Highest Percentage of Households With Two or more Vehicles in Rochester

0.0%
80.0%
Zip Codes with the Highest Percentage of Households With Two or more Vehicles in Rochester Map

Zip Codes with the Highest Percentage of Households With Two or more Vehicles in Rochester, NY

Zip Code Housholds With 2+ Cars vs State vs National
1.1462464.1%38.0%(+26.1)#71859.1%(+5.00)#19,234
2.1461862.0%38.0%(+24.0)#81159.1%(+2.90)#21,081
3.1462560.2%38.0%(+22.2)#89559.1%(+1.10)#22,536
4.1461759.7%38.0%(+21.7)#91659.1%(+0.600)#22,896
5.1461257.0%38.0%(+19.0)#1,03459.1%(-2.10)#24,777
6.1462256.4%38.0%(+18.4)#1,06659.1%(-2.70)#25,136
7.1462653.3%38.0%(+15.3)#1,16859.1%(-5.80)#26,682
8.1461651.1%38.0%(+13.1)#1,23959.1%(-8.00)#27,635
9.1460648.0%38.0%(+10.00)#1,30259.1%(-11.1)#28,729
10.1461946.4%38.0%(+8.40)#1,33759.1%(-12.7)#29,187
11.1461044.7%38.0%(+6.70)#1,37459.1%(-14.4)#29,593
12.1462344.5%38.0%(+6.50)#1,37659.1%(-14.6)#29,635
13.1460941.5%38.0%(+3.50)#1,43259.1%(-17.6)#30,188
14.1461540.5%38.0%(+2.50)#1,45359.1%(-18.6)#30,344
15.1462034.6%38.0%(-3.40)#1,51159.1%(-24.5)#31,087
16.1460729.4%38.0%(-8.60)#1,54459.1%(-29.7)#31,510
17.1461327.2%38.0%(-10.8)#1,56059.1%(-31.9)#31,657
18.1460525.0%38.0%(-13.0)#1,57059.1%(-34.1)#31,778
19.1462124.7%38.0%(-13.3)#1,57359.1%(-34.4)#31,790
20.1461123.9%38.0%(-14.1)#1,57759.1%(-35.2)#31,831
21.1460821.4%38.0%(-16.6)#1,58959.1%(-37.7)#31,950
22.1460420.3%38.0%(-17.7)#1,59359.1%(-38.8)#31,982
23.1461420.2%38.0%(-17.8)#1,59459.1%(-38.9)#31,986

Common Questions

What are the Top 10 Zip Codes with the Highest Percentage of Households With Two or more Vehicles in Rochester, NY?
Top 10 Zip Codes with the Highest Percentage of Households With Two or more Vehicles in Rochester, NY are:
#1
64.1%
#2
62.0%
#3
60.2%
#4
59.7%
#5
57.0%
#6
56.4%
#7
53.3%
#8
51.1%
#9
48.0%
#10
46.4%
What zip code has the Highest Percentage of Households With Two or more Vehicles in Rochester, NY?
14624 has the Highest Percentage of Households With Two or more Vehicles in Rochester, NY with 64.1%.
What is the Percentage of Households With Two or more Vehicles in Rochester, NY?
Percentage of Households With Two or more Vehicles in Rochester is 31.4%.
What is the Percentage of Households With Two or more Vehicles in New York?
Percentage of Households With Two or more Vehicles in New York is 38.0%.
What is the Percentage of Households With Two or more Vehicles in the United States?
Percentage of Households With Two or more Vehicles in the United States is 59.1%.