Zip Codes with the Highest Percentage of Households Heated by Bottled Gas / Liquid Propane in Henderson, NV
RELATED REPORTS & OPTIONS
Bottled Gas / LP Heating
Henderson
Compare Zip Codes
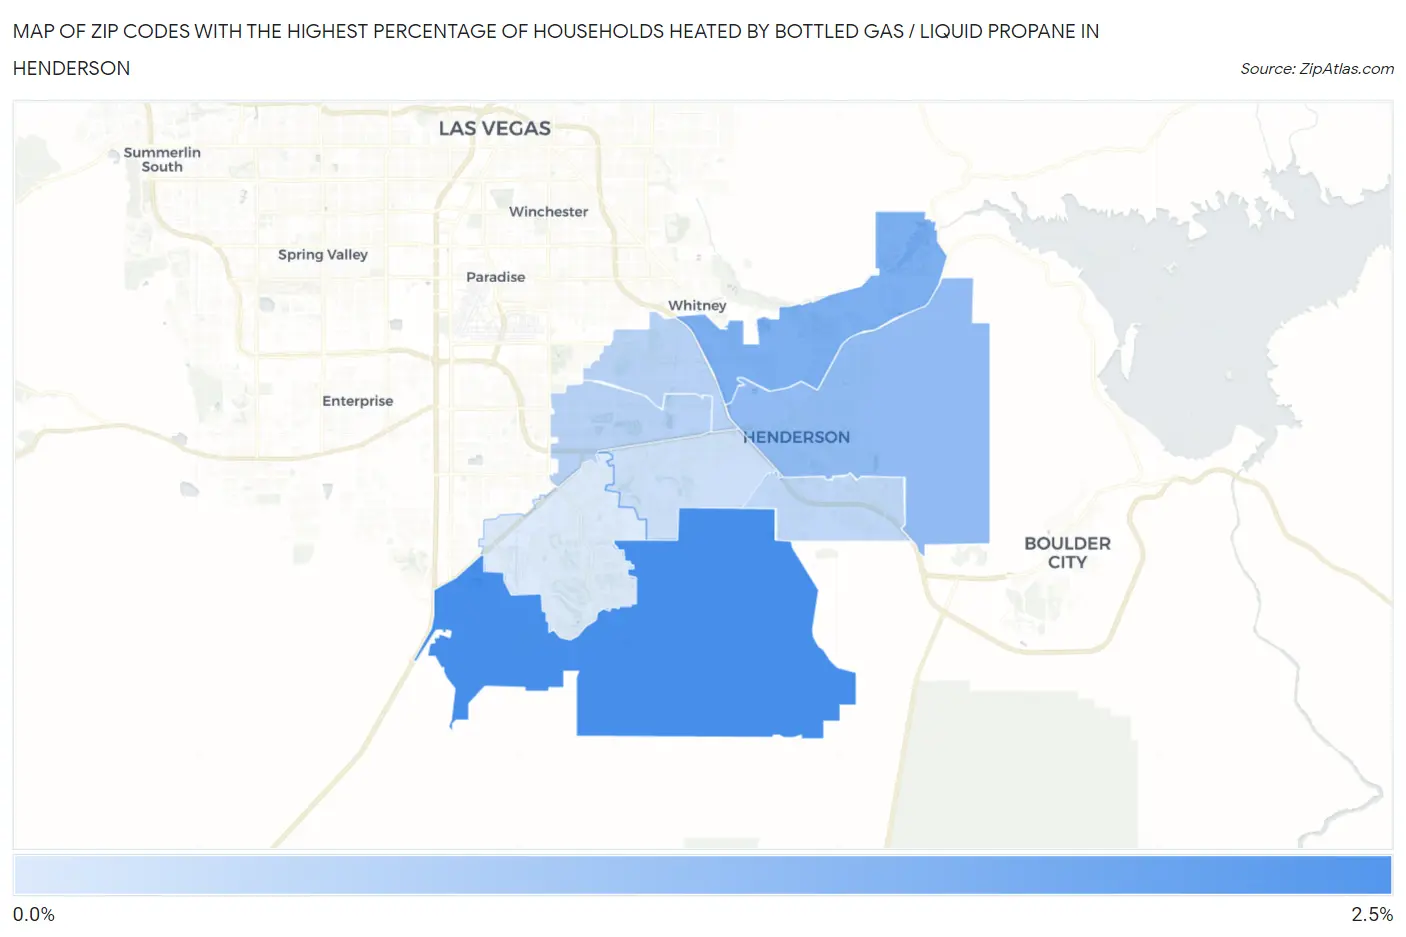
Map of Zip Codes with the Highest Percentage of Households Heated by Bottled Gas / Liquid Propane in Henderson
0.40%
2.4%
Zip Codes with the Highest Percentage of Households Heated by Bottled Gas / Liquid Propane in Henderson, NV
| Zip Code | Bottled Gas / LP Heating | vs State | vs National | |
| 1. | 89044 | 2.4% | 2.8%(-0.400)#83 | 4.9%(-2.50)#22,170 |
| 2. | 89011 | 1.7% | 2.8%(-1.10)#101 | 4.9%(-3.20)#24,020 |
| 3. | 89015 | 1.4% | 2.8%(-1.40)#113 | 4.9%(-3.50)#25,018 |
| 4. | 89074 | 0.90% | 2.8%(-1.90)#132 | 4.9%(-4.00)#26,961 |
| 5. | 89014 | 0.90% | 2.8%(-1.90)#134 | 4.9%(-4.00)#27,008 |
| 6. | 89002 | 0.80% | 2.8%(-2.00)#139 | 4.9%(-4.10)#27,428 |
| 7. | 89012 | 0.60% | 2.8%(-2.20)#146 | 4.9%(-4.30)#28,192 |
| 8. | 89052 | 0.40% | 2.8%(-2.40)#149 | 4.9%(-4.50)#28,810 |
1
Common Questions
What are the Top 5 Zip Codes with the Highest Percentage of Households Heated by Bottled Gas / Liquid Propane in Henderson, NV?
Top 5 Zip Codes with the Highest Percentage of Households Heated by Bottled Gas / Liquid Propane in Henderson, NV are:
What zip code has the Highest Percentage of Households Heated by Bottled Gas / Liquid Propane in Henderson, NV?
89044 has the Highest Percentage of Households Heated by Bottled Gas / Liquid Propane in Henderson, NV with 2.4%.
What is the Percentage of Households Heated by Bottled Gas / Liquid Propane in Henderson, NV?
Percentage of Households Heated by Bottled Gas / Liquid Propane in Henderson is 1.0%.
What is the Percentage of Households Heated by Bottled Gas / Liquid Propane in Nevada?
Percentage of Households Heated by Bottled Gas / Liquid Propane in Nevada is 2.8%.
What is the Percentage of Households Heated by Bottled Gas / Liquid Propane in the United States?
Percentage of Households Heated by Bottled Gas / Liquid Propane in the United States is 4.9%.