York, NE Map & Demographics
York Map
York Overview
$40,704
PER CAPITA INCOME
$84,211
AVG FAMILY INCOME
$68,794
AVG HOUSEHOLD INCOME
44.3%
WAGE / INCOME GAP [ % ]
55.7¢/ $1
WAGE / INCOME GAP [ $ ]
0.50
INEQUALITY / GINI INDEX
8,101
TOTAL POPULATION
4,129
MALE POPULATION
3,972
FEMALE POPULATION
103.95
MALES / 100 FEMALES
96.20
FEMALES / 100 MALES
40.3
MEDIAN AGE
2.9
AVG FAMILY SIZE
2.3
AVG HOUSEHOLD SIZE
4,171
LABOR FORCE [ PEOPLE ]
64.8%
PERCENT IN LABOR FORCE
3.9%
UNEMPLOYMENT RATE
York Zip Codes
York Area Codes
Income in York
Income Overview in York
Per Capita Income in York is $40,704, while median incomes of families and households are $84,211 and $68,794 respectively.
| Characteristic | Number | Measure |
| Per Capita Income | 8,101 | $40,704 |
| Median Family Income | 2,048 | $84,211 |
| Mean Family Income | 2,048 | $109,038 |
| Median Household Income | 3,285 | $68,794 |
| Mean Household Income | 3,285 | $98,833 |
| Income Deficit | 2,048 | $0 |
| Wage / Income Gap (%) | 8,101 | 44.27% |
| Wage / Income Gap ($) | 8,101 | 55.73¢ per $1 |
| Gini / Inequality Index | 8,101 | 0.50 |
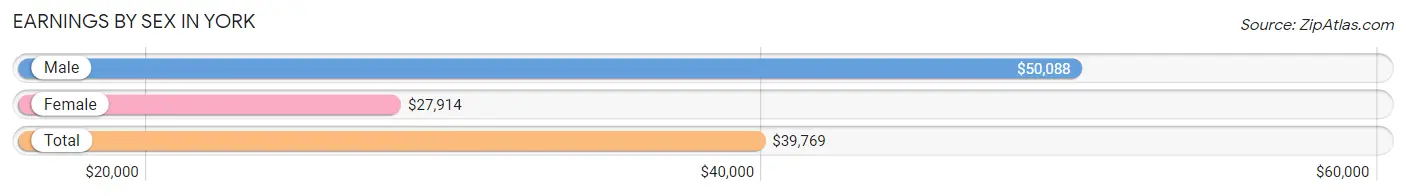
Earnings by Sex in York
Average Earnings in York are $39,769, $50,088 for men and $27,914 for women, a difference of 44.3%.
| Sex | Number | Average Earnings |
| Male | 2,420 (52.8%) | $50,088 |
| Female | 2,167 (47.2%) | $27,914 |
| Total | 4,587 (100.0%) | $39,769 |
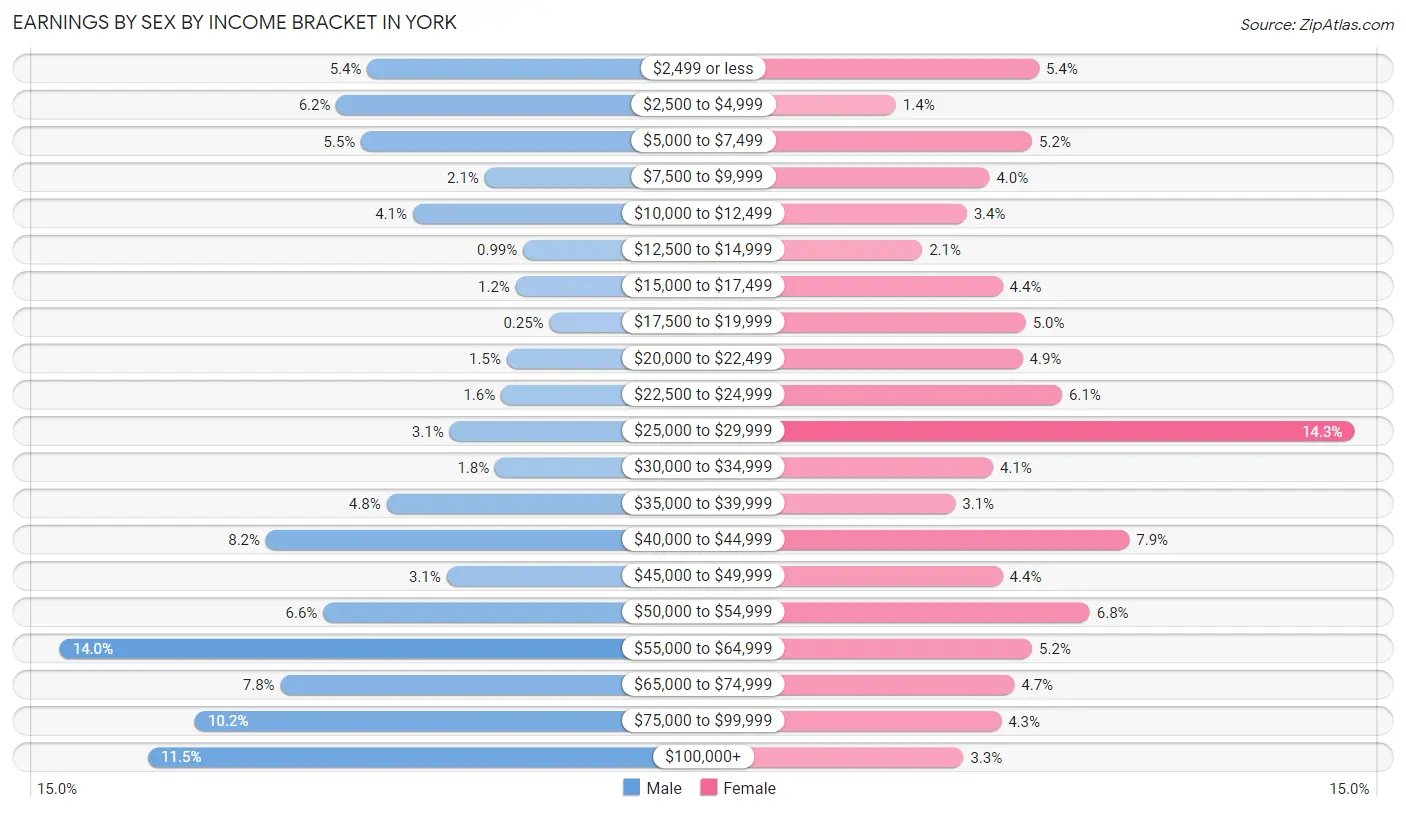
Earnings by Sex by Income Bracket in York
The most common earnings brackets in York are $55,000 to $64,999 for men (339 | 14.0%) and $25,000 to $29,999 for women (309 | 14.3%).
| Income | Male | Female |
| $2,499 or less | 130 (5.4%) | 117 (5.4%) |
| $2,500 to $4,999 | 151 (6.2%) | 30 (1.4%) |
| $5,000 to $7,499 | 134 (5.5%) | 113 (5.2%) |
| $7,500 to $9,999 | 50 (2.1%) | 87 (4.0%) |
| $10,000 to $12,499 | 99 (4.1%) | 73 (3.4%) |
| $12,500 to $14,999 | 24 (1.0%) | 46 (2.1%) |
| $15,000 to $17,499 | 29 (1.2%) | 95 (4.4%) |
| $17,500 to $19,999 | 6 (0.3%) | 109 (5.0%) |
| $20,000 to $22,499 | 35 (1.5%) | 107 (4.9%) |
| $22,500 to $24,999 | 39 (1.6%) | 131 (6.0%) |
| $25,000 to $29,999 | 74 (3.1%) | 309 (14.3%) |
| $30,000 to $34,999 | 43 (1.8%) | 89 (4.1%) |
| $35,000 to $39,999 | 117 (4.8%) | 66 (3.0%) |
| $40,000 to $44,999 | 199 (8.2%) | 172 (7.9%) |
| $45,000 to $49,999 | 76 (3.1%) | 95 (4.4%) |
| $50,000 to $54,999 | 160 (6.6%) | 148 (6.8%) |
| $55,000 to $64,999 | 339 (14.0%) | 113 (5.2%) |
| $65,000 to $74,999 | 189 (7.8%) | 102 (4.7%) |
| $75,000 to $99,999 | 247 (10.2%) | 94 (4.3%) |
| $100,000+ | 279 (11.5%) | 71 (3.3%) |
| Total | 2,420 (100.0%) | 2,167 (100.0%) |
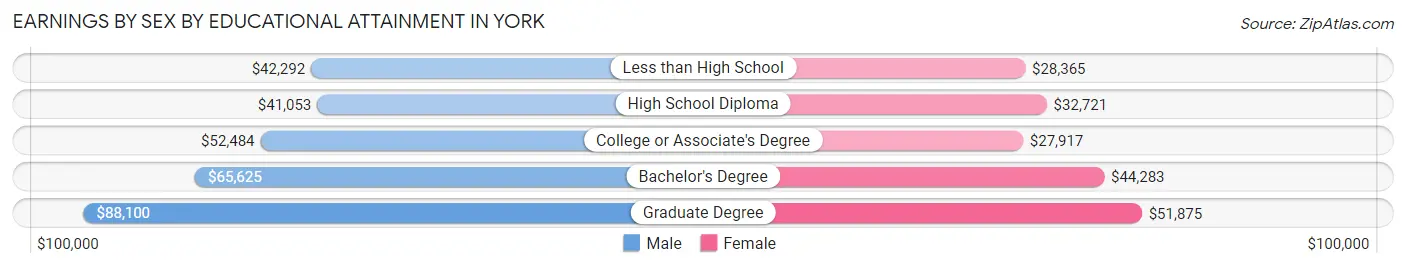
Earnings by Sex by Educational Attainment in York
Average earnings in York are $55,961 for men and $34,600 for women, a difference of 38.2%. Men with an educational attainment of graduate degree enjoy the highest average annual earnings of $88,100, while those with high school diploma education earn the least with $41,053. Women with an educational attainment of graduate degree earn the most with the average annual earnings of $51,875, while those with college or associate's degree education have the smallest earnings of $27,917.
| Educational Attainment | Male Income | Female Income |
| Less than High School | $42,292 | $28,365 |
| High School Diploma | $41,053 | $32,721 |
| College or Associate's Degree | $52,484 | $27,917 |
| Bachelor's Degree | $65,625 | $44,283 |
| Graduate Degree | $88,100 | $51,875 |
| Total | $55,961 | $34,600 |
Family Income in York
Family Income Brackets in York
According to the York family income data, there are 438 families falling into the $75,000 to $99,999 income range, which is the most common income bracket and makes up 21.4% of all families. Conversely, the $10,000 to $14,999 income bracket is the least frequent group with only 12 families (0.6%) belonging to this category.
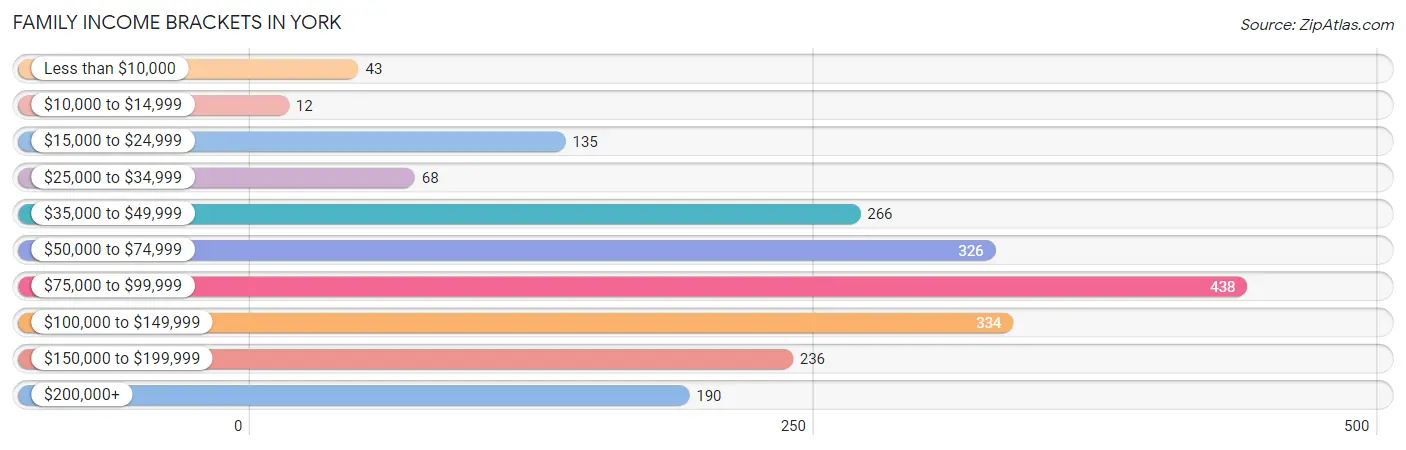
| Income Bracket | # Families | % Families |
| Less than $10,000 | 43 | 2.1% |
| $10,000 to $14,999 | 12 | 0.6% |
| $15,000 to $24,999 | 135 | 6.6% |
| $25,000 to $34,999 | 68 | 3.3% |
| $35,000 to $49,999 | 266 | 13.0% |
| $50,000 to $74,999 | 326 | 15.9% |
| $75,000 to $99,999 | 438 | 21.4% |
| $100,000 to $149,999 | 334 | 16.3% |
| $150,000 to $199,999 | 236 | 11.5% |
| $200,000+ | 190 | 9.3% |
Family Income by Famaliy Size in York
6-person families (45 | 2.2%) account for the highest median family income in York with $96,544 per family, while 2-person families (1,140 | 55.7%) have the highest median income of $39,584 per family member.
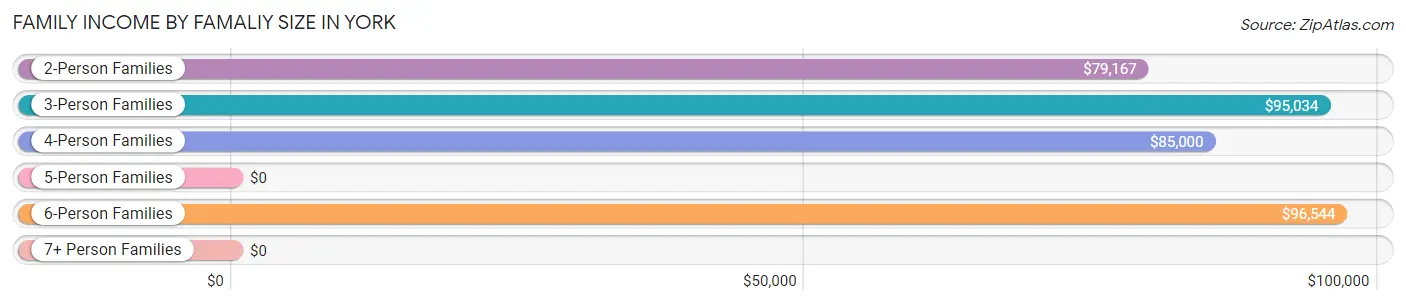
| Income Bracket | # Families | Median Income |
| 2-Person Families | 1,140 (55.7%) | $79,167 |
| 3-Person Families | 417 (20.4%) | $95,034 |
| 4-Person Families | 218 (10.6%) | $85,000 |
| 5-Person Families | 222 (10.8%) | $0 |
| 6-Person Families | 45 (2.2%) | $96,544 |
| 7+ Person Families | 6 (0.3%) | $0 |
| Total | 2,048 (100.0%) | $84,211 |
Family Income by Number of Earners in York
The median family income in York is $84,211, with families comprising 3+ earners (257) having the highest median family income of $138,239, while families with no earners (235) have the lowest median family income of $39,607, accounting for 12.6% and 11.5% of families, respectively.
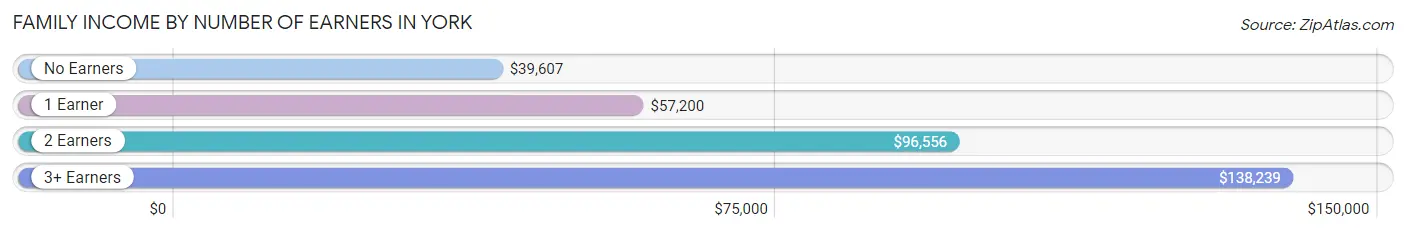
| Number of Earners | # Families | Median Income |
| No Earners | 235 (11.5%) | $39,607 |
| 1 Earner | 660 (32.2%) | $57,200 |
| 2 Earners | 896 (43.8%) | $96,556 |
| 3+ Earners | 257 (12.6%) | $138,239 |
| Total | 2,048 (100.0%) | $84,211 |
Household Income in York
Household Income Brackets in York
With 700 households falling in the category, the $50,000 to $74,999 income range is the most frequent in York, accounting for 21.3% of all households. In contrast, only 141 households (4.3%) fall into the $10,000 to $14,999 income bracket, making it the least populous group.
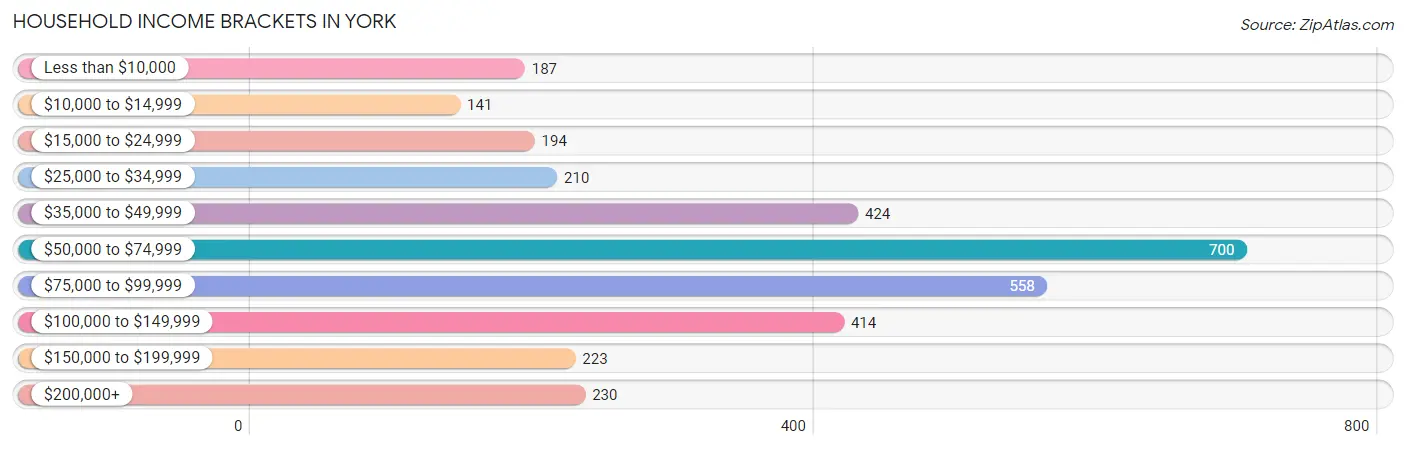
| Income Bracket | # Households | % Households |
| Less than $10,000 | 187 | 5.7% |
| $10,000 to $14,999 | 141 | 4.3% |
| $15,000 to $24,999 | 194 | 5.9% |
| $25,000 to $34,999 | 210 | 6.4% |
| $35,000 to $49,999 | 424 | 12.9% |
| $50,000 to $74,999 | 700 | 21.3% |
| $75,000 to $99,999 | 558 | 17.0% |
| $100,000 to $149,999 | 414 | 12.6% |
| $150,000 to $199,999 | 223 | 6.8% |
| $200,000+ | 230 | 7.0% |
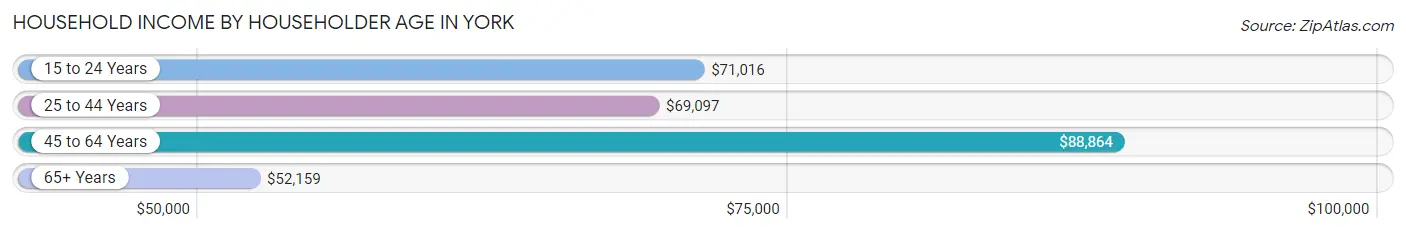
Household Income by Householder Age in York
The median household income in York is $68,794, with the highest median household income of $88,864 found in the 45 to 64 years age bracket for the primary householder. A total of 998 households (30.4%) fall into this category. Meanwhile, the 65+ years age bracket for the primary householder has the lowest median household income of $52,159, with 998 households (30.4%) in this group.
| Income Bracket | # Households | Median Income |
| 15 to 24 Years | 181 (5.5%) | $71,016 |
| 25 to 44 Years | 1,108 (33.7%) | $69,097 |
| 45 to 64 Years | 998 (30.4%) | $88,864 |
| 65+ Years | 998 (30.4%) | $52,159 |
| Total | 3,285 (100.0%) | $68,794 |
Poverty in York
Income Below Poverty by Sex and Age in York
With 10.3% poverty level for males and 12.6% for females among the residents of York, under 5 year old males and 16 and 17 year old females are the most vulnerable to poverty, with 91 males (39.2%) and 39 females (43.3%) in their respective age groups living below the poverty level.
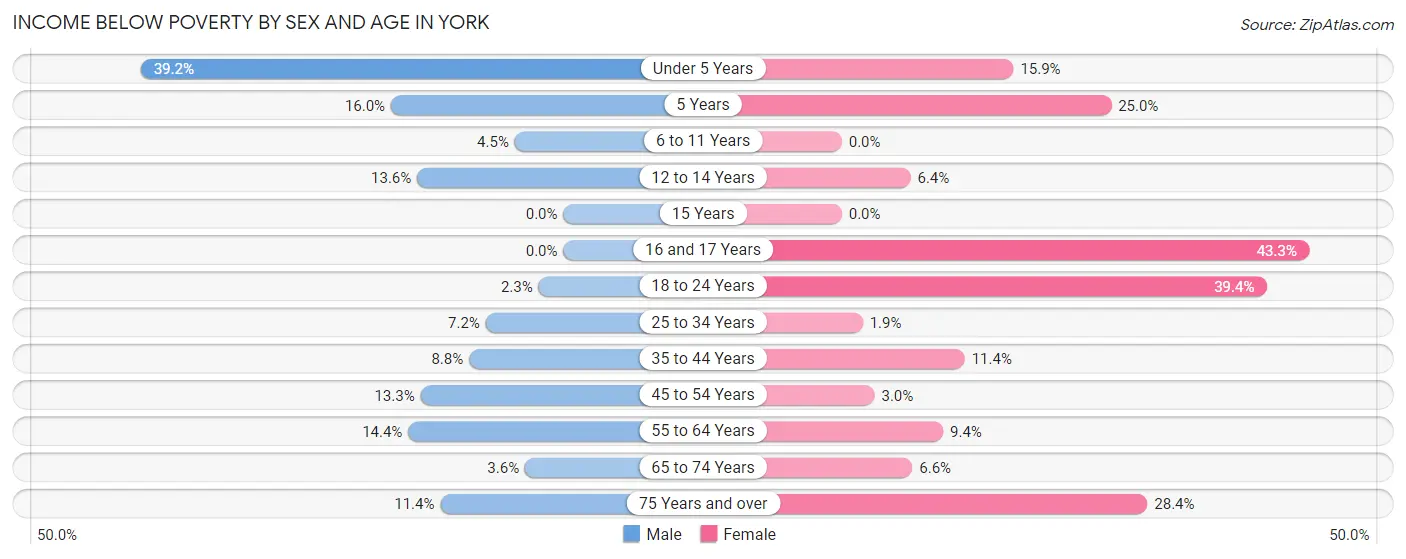
| Age Bracket | Male | Female |
| Under 5 Years | 91 (39.2%) | 29 (15.9%) |
| 5 Years | 8 (16.0%) | 16 (25.0%) |
| 6 to 11 Years | 21 (4.5%) | 0 (0.0%) |
| 12 to 14 Years | 19 (13.6%) | 9 (6.4%) |
| 15 Years | 0 (0.0%) | 0 (0.0%) |
| 16 and 17 Years | 0 (0.0%) | 39 (43.3%) |
| 18 to 24 Years | 4 (2.3%) | 130 (39.4%) |
| 25 to 34 Years | 32 (7.2%) | 8 (1.9%) |
| 35 to 44 Years | 44 (8.7%) | 56 (11.4%) |
| 45 to 54 Years | 61 (13.3%) | 13 (3.0%) |
| 55 to 64 Years | 71 (14.4%) | 44 (9.4%) |
| 65 to 74 Years | 15 (3.6%) | 34 (6.6%) |
| 75 Years and over | 33 (11.4%) | 95 (28.4%) |
| Total | 399 (10.3%) | 473 (12.6%) |
Income Above Poverty by Sex and Age in York
According to the poverty statistics in York, males aged 15 years and females aged 6 to 11 years are the age groups that are most secure financially, with 100.0% of males and 100.0% of females in these age groups living above the poverty line.
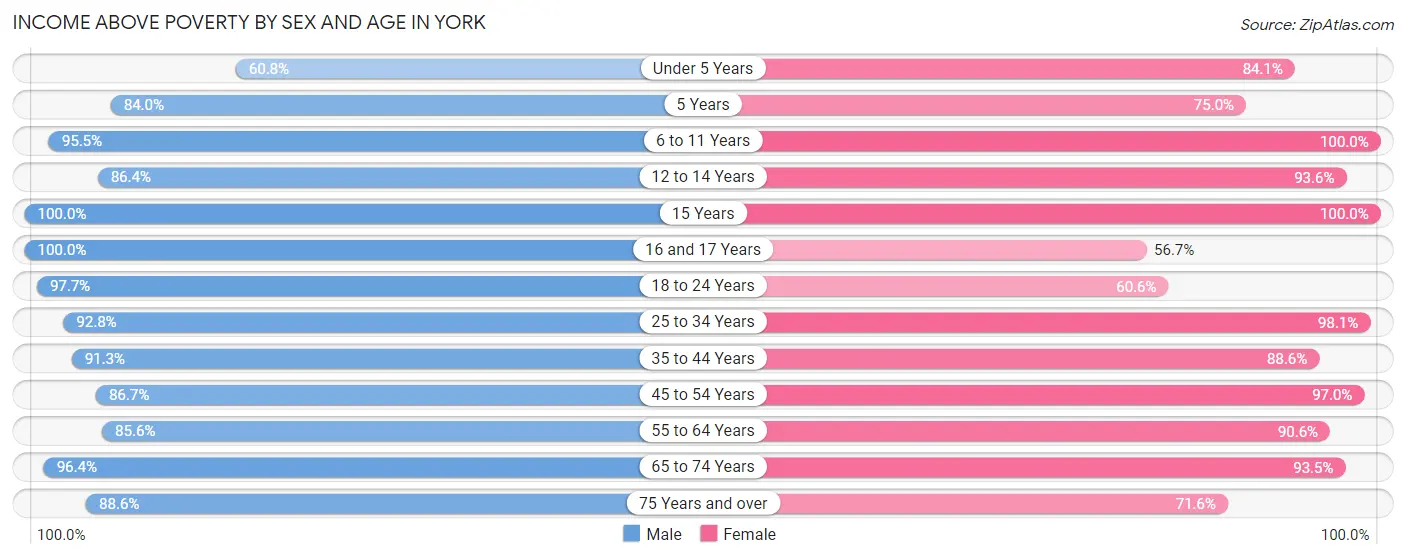
| Age Bracket | Male | Female |
| Under 5 Years | 141 (60.8%) | 153 (84.1%) |
| 5 Years | 42 (84.0%) | 48 (75.0%) |
| 6 to 11 Years | 445 (95.5%) | 254 (100.0%) |
| 12 to 14 Years | 121 (86.4%) | 132 (93.6%) |
| 15 Years | 76 (100.0%) | 48 (100.0%) |
| 16 and 17 Years | 136 (100.0%) | 51 (56.7%) |
| 18 to 24 Years | 170 (97.7%) | 200 (60.6%) |
| 25 to 34 Years | 412 (92.8%) | 404 (98.1%) |
| 35 to 44 Years | 459 (91.2%) | 435 (88.6%) |
| 45 to 54 Years | 399 (86.7%) | 414 (97.0%) |
| 55 to 64 Years | 422 (85.6%) | 424 (90.6%) |
| 65 to 74 Years | 406 (96.4%) | 485 (93.4%) |
| 75 Years and over | 256 (88.6%) | 240 (71.6%) |
| Total | 3,485 (89.7%) | 3,288 (87.4%) |
Income Below Poverty Among Married-Couple Families in York
The poverty statistics for married-couple families in York show that 2.9% or 47 of the total 1,645 families live below the poverty line. Families with 5 or more children have the highest poverty rate of 100.0%, comprising of 6 families. On the other hand, families with no children have the lowest poverty rate of 2.0%, which includes 21 families.
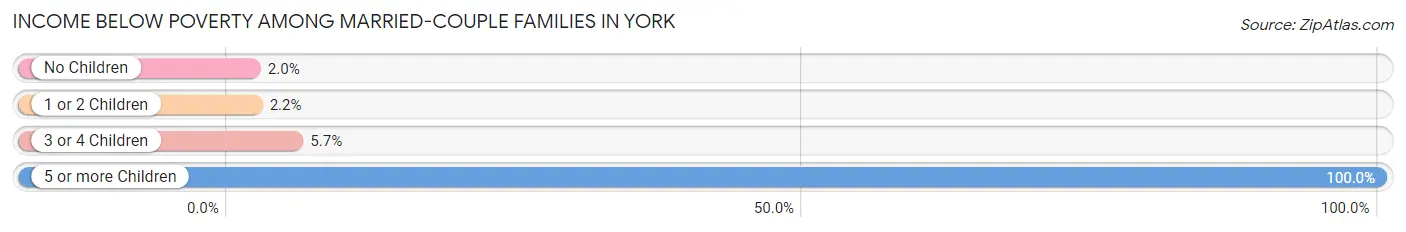
| Children | Above Poverty | Below Poverty |
| No Children | 1,035 (98.0%) | 21 (2.0%) |
| 1 or 2 Children | 364 (97.9%) | 8 (2.1%) |
| 3 or 4 Children | 199 (94.3%) | 12 (5.7%) |
| 5 or more Children | 0 (0.0%) | 6 (100.0%) |
| Total | 1,598 (97.1%) | 47 (2.9%) |
Income Below Poverty Among Single-Parent Households in York
According to the poverty data in York, 3.0% or 4 single-father households and 36.0% or 98 single-mother households are living below the poverty line. Among single-father households, those with 1 or 2 children have the highest poverty rate, with 4 households (17.4%) experiencing poverty. Likewise, among single-mother households, those with 3 or 4 children have the highest poverty rate, with 8 households (57.1%) falling below the poverty line.
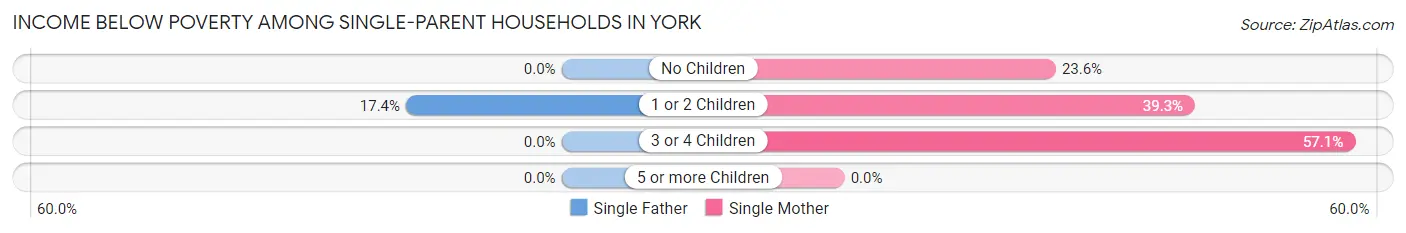
| Children | Single Father | Single Mother |
| No Children | 0 (0.0%) | 17 (23.6%) |
| 1 or 2 Children | 4 (17.4%) | 73 (39.3%) |
| 3 or 4 Children | 0 (0.0%) | 8 (57.1%) |
| 5 or more Children | 0 (0.0%) | 0 (0.0%) |
| Total | 4 (3.0%) | 98 (36.0%) |
Income Below Poverty Among Married-Couple vs Single-Parent Households in York
The poverty data for York shows that 47 of the married-couple family households (2.9%) and 102 of the single-parent households (25.3%) are living below the poverty level. Within the married-couple family households, those with 5 or more children have the highest poverty rate, with 6 households (100.0%) falling below the poverty line. Among the single-parent households, those with 1 or 2 children have the highest poverty rate, with 77 household (36.8%) living below poverty.
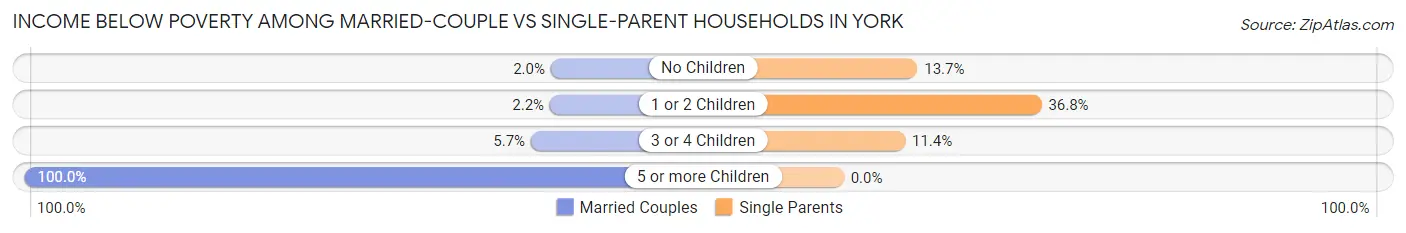
| Children | Married-Couple Families | Single-Parent Households |
| No Children | 21 (2.0%) | 17 (13.7%) |
| 1 or 2 Children | 8 (2.1%) | 77 (36.8%) |
| 3 or 4 Children | 12 (5.7%) | 8 (11.4%) |
| 5 or more Children | 6 (100.0%) | 0 (0.0%) |
| Total | 47 (2.9%) | 102 (25.3%) |
Race in York
The most populous races in York are White / Caucasian (7,493 | 92.5%), Two or more Races (400 | 4.9%), and Hispanic or Latino (356 | 4.4%).
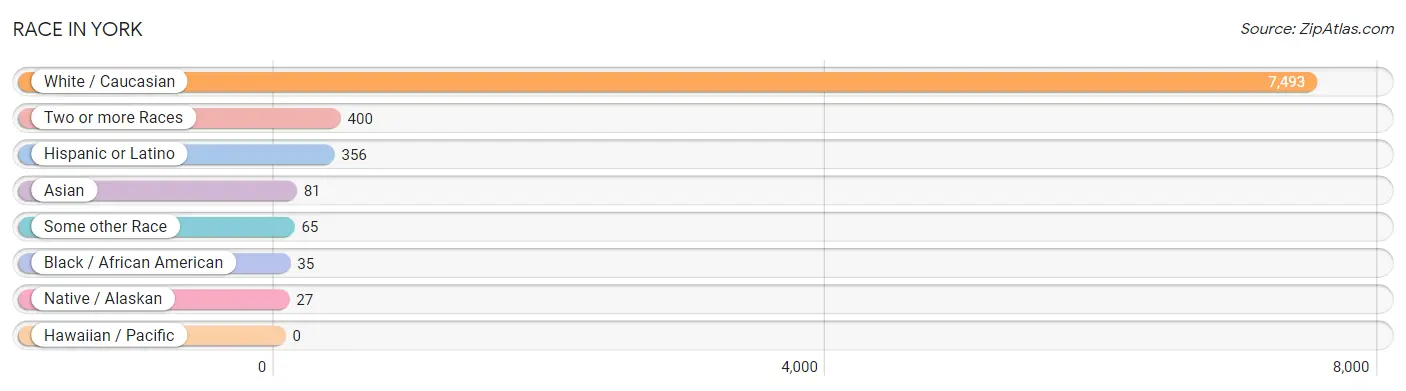
| Race | # Population | % Population |
| Asian | 81 | 1.0% |
| Black / African American | 35 | 0.4% |
| Hawaiian / Pacific | 0 | 0.0% |
| Hispanic or Latino | 356 | 4.4% |
| Native / Alaskan | 27 | 0.3% |
| White / Caucasian | 7,493 | 92.5% |
| Two or more Races | 400 | 4.9% |
| Some other Race | 65 | 0.8% |
| Total | 8,101 | 100.0% |
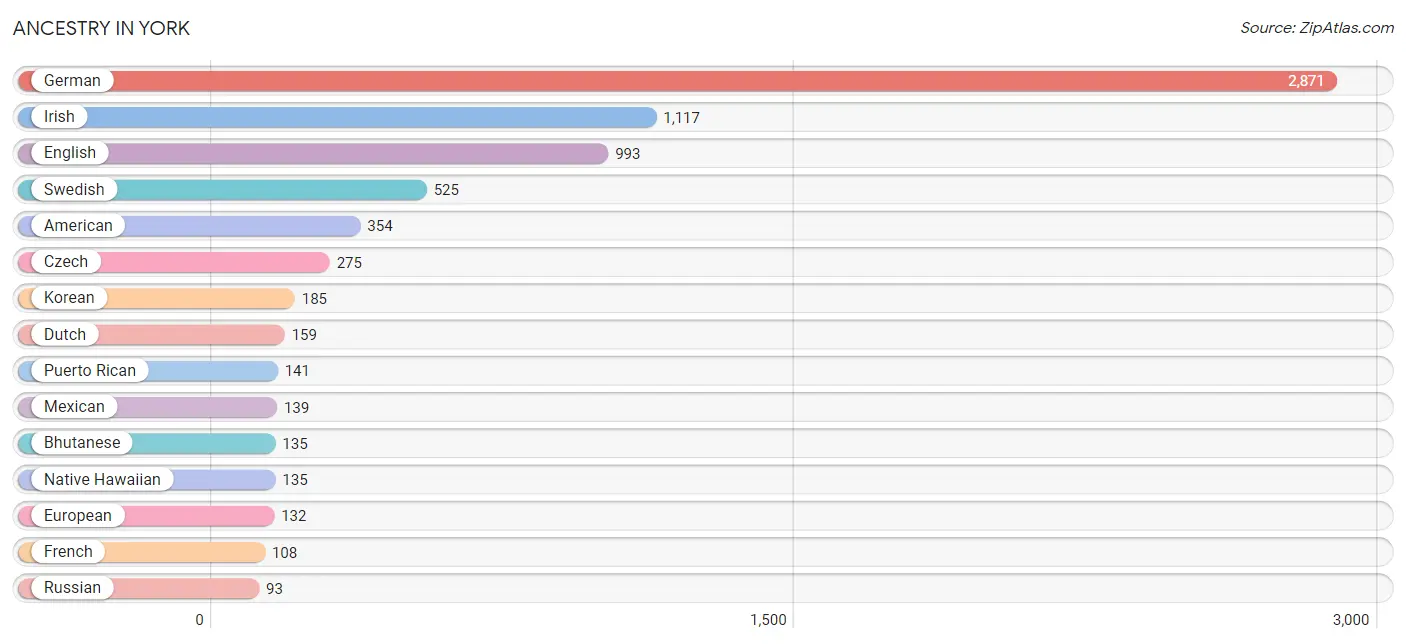
Ancestry in York
The most populous ancestries reported in York are German (2,871 | 35.4%), Irish (1,117 | 13.8%), English (993 | 12.3%), Swedish (525 | 6.5%), and American (354 | 4.4%), together accounting for 72.3% of all York residents.
| Ancestry | # Population | % Population |
| American | 354 | 4.4% |
| Apache | 9 | 0.1% |
| Austrian | 4 | 0.1% |
| Belgian | 6 | 0.1% |
| Bhutanese | 135 | 1.7% |
| British | 54 | 0.7% |
| Central American | 4 | 0.1% |
| Cherokee | 19 | 0.2% |
| Cuban | 23 | 0.3% |
| Czech | 275 | 3.4% |
| Czechoslovakian | 16 | 0.2% |
| Danish | 70 | 0.9% |
| Dutch | 159 | 2.0% |
| Dutch West Indian | 20 | 0.3% |
| Eastern European | 1 | 0.0% |
| English | 993 | 12.3% |
| European | 132 | 1.6% |
| French | 108 | 1.3% |
| French Canadian | 40 | 0.5% |
| German | 2,871 | 35.4% |
| Irish | 1,117 | 13.8% |
| Italian | 87 | 1.1% |
| Korean | 185 | 2.3% |
| Mexican | 139 | 1.7% |
| Native Hawaiian | 135 | 1.7% |
| Northern European | 15 | 0.2% |
| Norwegian | 52 | 0.6% |
| Polish | 58 | 0.7% |
| Puerto Rican | 141 | 1.7% |
| Russian | 93 | 1.1% |
| Salvadoran | 4 | 0.1% |
| Scandinavian | 16 | 0.2% |
| Scotch-Irish | 79 | 1.0% |
| Scottish | 92 | 1.1% |
| Spaniard | 9 | 0.1% |
| Sri Lankan | 8 | 0.1% |
| Subsaharan African | 9 | 0.1% |
| Sudanese | 6 | 0.1% |
| Swedish | 525 | 6.5% |
| Thai | 23 | 0.3% |
| Turkish | 6 | 0.1% |
| Ukrainian | 23 | 0.3% |
| Welsh | 12 | 0.2% | View All 43 Rows |
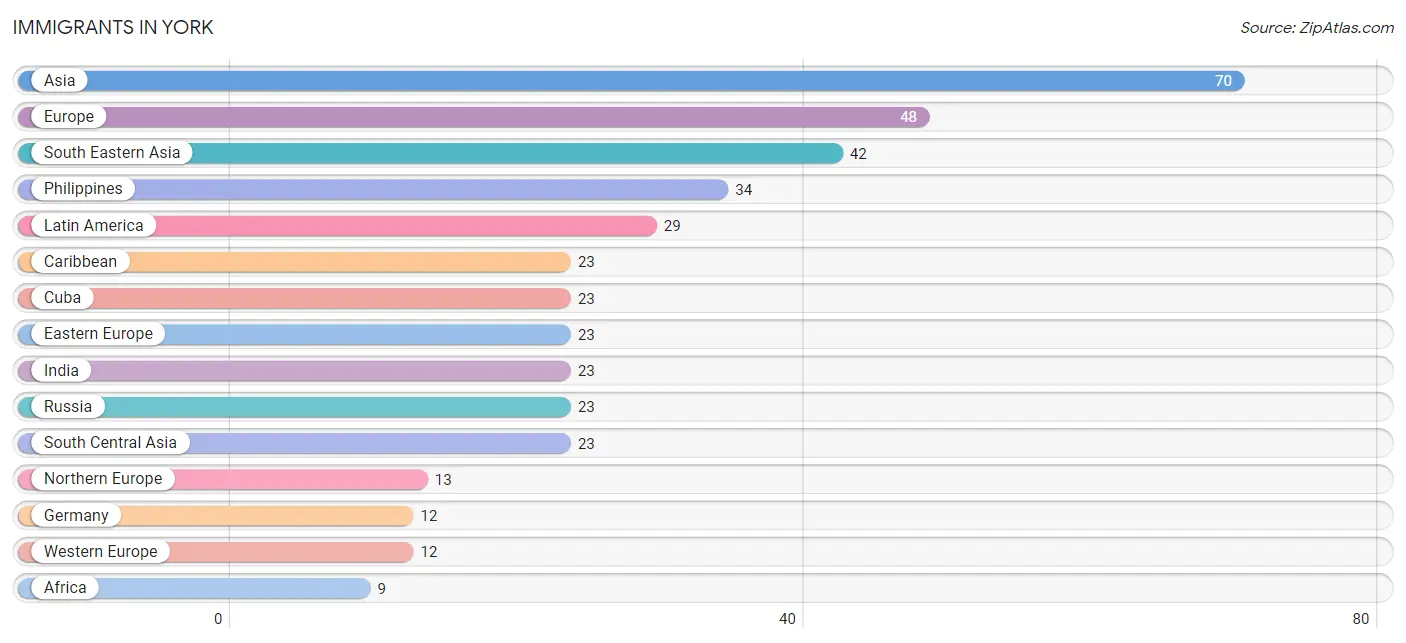
Immigrants in York
The most numerous immigrant groups reported in York came from Asia (70 | 0.9%), Europe (48 | 0.6%), South Eastern Asia (42 | 0.5%), Philippines (34 | 0.4%), and Latin America (29 | 0.4%), together accounting for 2.7% of all York residents.
| Immigration Origin | # Population | % Population |
| Africa | 9 | 0.1% |
| Asia | 70 | 0.9% |
| Caribbean | 23 | 0.3% |
| Central America | 6 | 0.1% |
| China | 5 | 0.1% |
| Cuba | 23 | 0.3% |
| Eastern Africa | 3 | 0.0% |
| Eastern Asia | 5 | 0.1% |
| Eastern Europe | 23 | 0.3% |
| Europe | 48 | 0.6% |
| Germany | 12 | 0.2% |
| India | 23 | 0.3% |
| Latin America | 29 | 0.4% |
| Mexico | 6 | 0.1% |
| Northern Africa | 6 | 0.1% |
| Northern Europe | 13 | 0.2% |
| Philippines | 34 | 0.4% |
| Russia | 23 | 0.3% |
| South Central Asia | 23 | 0.3% |
| South Eastern Asia | 42 | 0.5% |
| Sudan | 6 | 0.1% |
| Vietnam | 8 | 0.1% |
| Western Europe | 12 | 0.2% | View All 23 Rows |
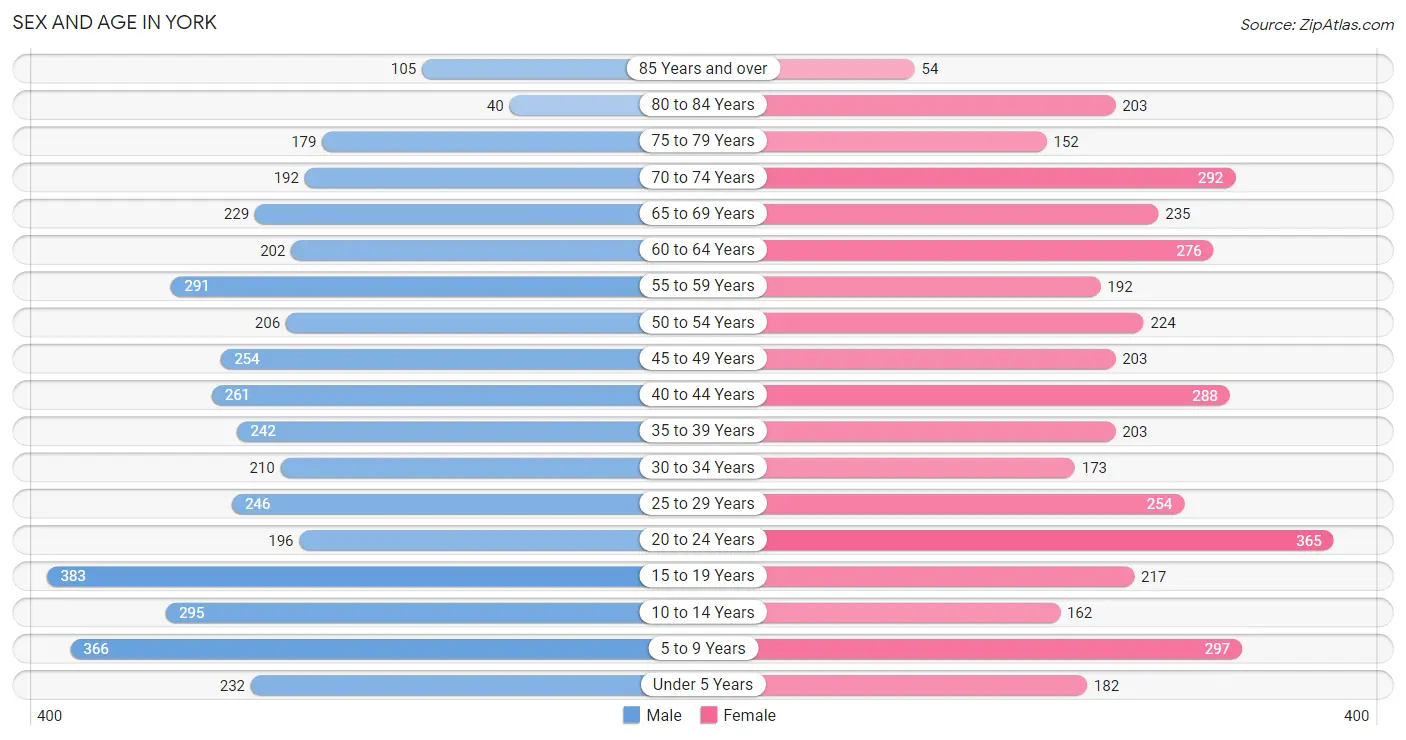
Sex and Age in York
Sex and Age in York
The most populous age groups in York are 15 to 19 Years (383 | 9.3%) for men and 20 to 24 Years (365 | 9.2%) for women.
| Age Bracket | Male | Female |
| Under 5 Years | 232 (5.6%) | 182 (4.6%) |
| 5 to 9 Years | 366 (8.9%) | 297 (7.5%) |
| 10 to 14 Years | 295 (7.1%) | 162 (4.1%) |
| 15 to 19 Years | 383 (9.3%) | 217 (5.5%) |
| 20 to 24 Years | 196 (4.8%) | 365 (9.2%) |
| 25 to 29 Years | 246 (6.0%) | 254 (6.4%) |
| 30 to 34 Years | 210 (5.1%) | 173 (4.4%) |
| 35 to 39 Years | 242 (5.9%) | 203 (5.1%) |
| 40 to 44 Years | 261 (6.3%) | 288 (7.2%) |
| 45 to 49 Years | 254 (6.1%) | 203 (5.1%) |
| 50 to 54 Years | 206 (5.0%) | 224 (5.6%) |
| 55 to 59 Years | 291 (7.0%) | 192 (4.8%) |
| 60 to 64 Years | 202 (4.9%) | 276 (7.0%) |
| 65 to 69 Years | 229 (5.6%) | 235 (5.9%) |
| 70 to 74 Years | 192 (4.6%) | 292 (7.3%) |
| 75 to 79 Years | 179 (4.3%) | 152 (3.8%) |
| 80 to 84 Years | 40 (1.0%) | 203 (5.1%) |
| 85 Years and over | 105 (2.5%) | 54 (1.4%) |
| Total | 4,129 (100.0%) | 3,972 (100.0%) |
Families and Households in York
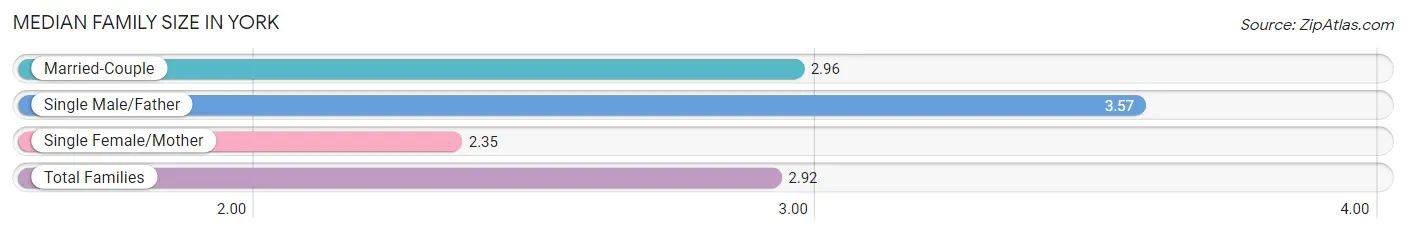
Median Family Size in York
The median family size in York is 2.92 persons per family, with single male/father families (131 | 6.4%) accounting for the largest median family size of 3.57 persons per family. On the other hand, single female/mother families (272 | 13.3%) represent the smallest median family size with 2.35 persons per family.
| Family Type | # Families | Family Size |
| Married-Couple | 1,645 (80.3%) | 2.96 |
| Single Male/Father | 131 (6.4%) | 3.57 |
| Single Female/Mother | 272 (13.3%) | 2.35 |
| Total Families | 2,048 (100.0%) | 2.92 |
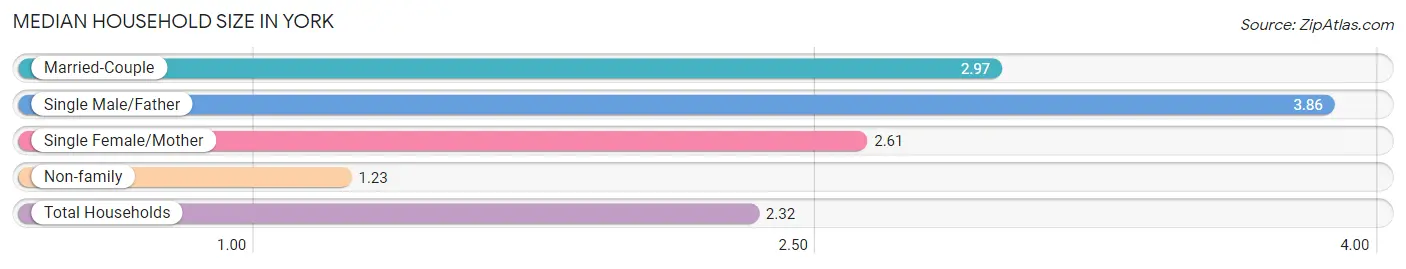
Median Household Size in York
The median household size in York is 2.32 persons per household, with single male/father households (131 | 4.0%) accounting for the largest median household size of 3.86 persons per household. non-family households (1,237 | 37.7%) represent the smallest median household size with 1.23 persons per household.
| Household Type | # Households | Household Size |
| Married-Couple | 1,645 (50.1%) | 2.97 |
| Single Male/Father | 131 (4.0%) | 3.86 |
| Single Female/Mother | 272 (8.3%) | 2.61 |
| Non-family | 1,237 (37.7%) | 1.23 |
| Total Households | 3,285 (100.0%) | 2.32 |
Household Size by Marriage Status in York
Out of a total of 3,285 households in York, 2,048 (62.3%) are family households, while 1,237 (37.7%) are nonfamily households. The most numerous type of family households are 2-person households, comprising 1,121, and the most common type of nonfamily households are 1-person households, comprising 1,005.
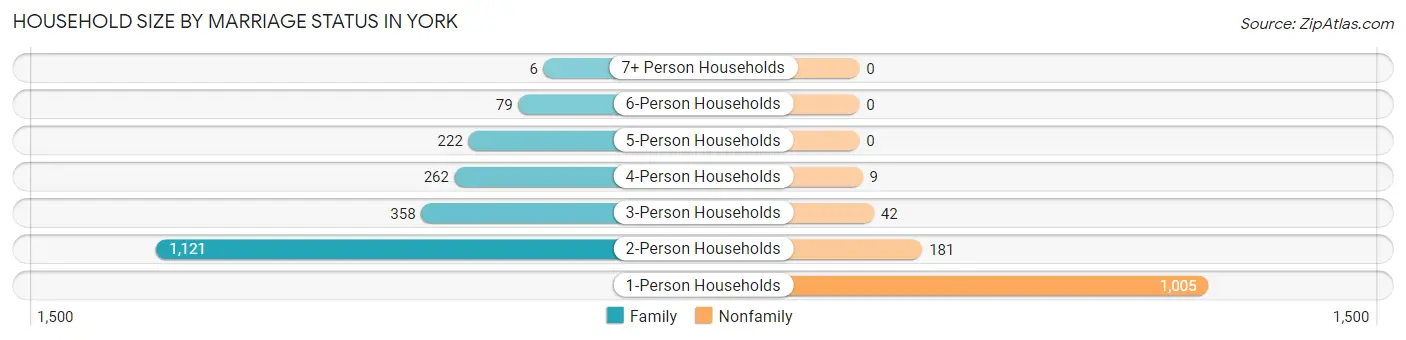
| Household Size | Family Households | Nonfamily Households |
| 1-Person Households | - | 1,005 (30.6%) |
| 2-Person Households | 1,121 (34.1%) | 181 (5.5%) |
| 3-Person Households | 358 (10.9%) | 42 (1.3%) |
| 4-Person Households | 262 (8.0%) | 9 (0.3%) |
| 5-Person Households | 222 (6.8%) | 0 (0.0%) |
| 6-Person Households | 79 (2.4%) | 0 (0.0%) |
| 7+ Person Households | 6 (0.2%) | 0 (0.0%) |
| Total | 2,048 (62.3%) | 1,237 (37.7%) |
Female Fertility in York
Fertility by Age in York
Average fertility rate in York is 26.0 births per 1,000 women. Women in the age bracket of 35 to 50 years have the highest fertility rate with 33.0 births per 1,000 women. Women in the age bracket of 35 to 50 years acount for 51.1% of all women with births.
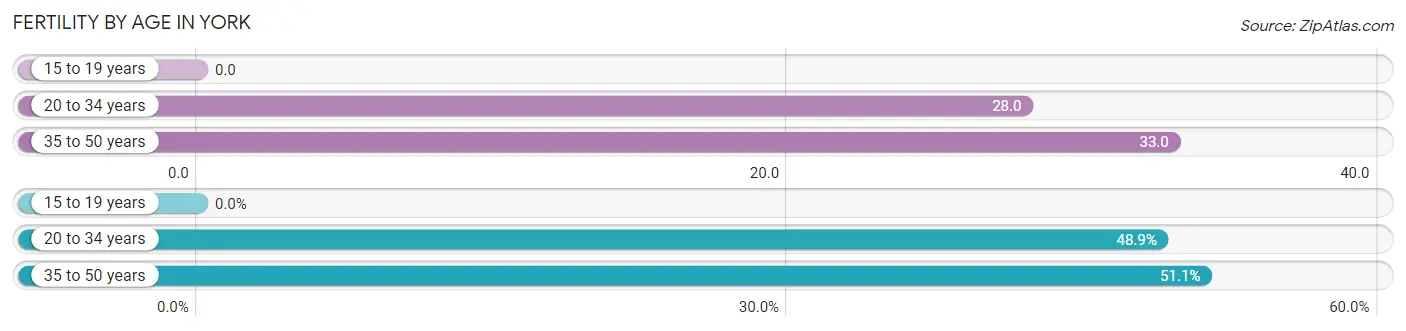
| Age Bracket | Women with Births | Births / 1,000 Women |
| 15 to 19 years | 0 (0.0%) | 0.0 |
| 20 to 34 years | 22 (48.9%) | 28.0 |
| 35 to 50 years | 23 (51.1%) | 33.0 |
| Total | 45 (100.0%) | 26.0 |
Fertility by Age by Marriage Status in York
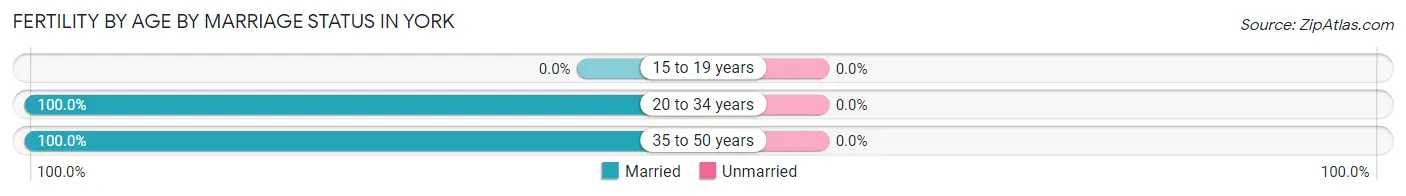
| Age Bracket | Married | Unmarried |
| 15 to 19 years | 0 (0.0%) | 0 (0.0%) |
| 20 to 34 years | 22 (100.0%) | 0 (0.0%) |
| 35 to 50 years | 23 (100.0%) | 0 (0.0%) |
| Total | 45 (100.0%) | 0 (0.0%) |
Fertility by Education in York
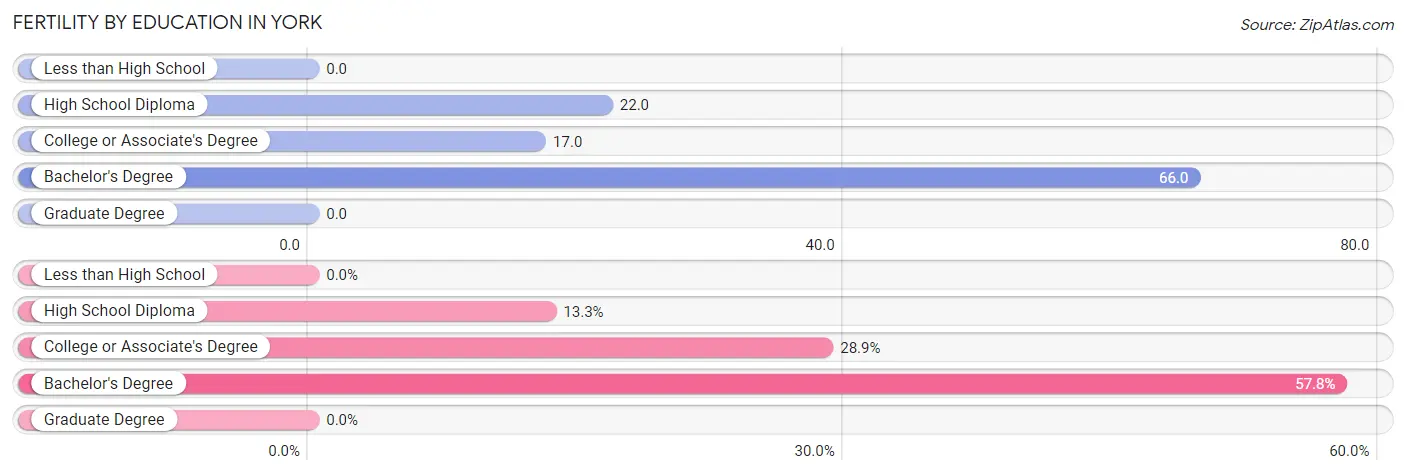
| Educational Attainment | Women with Births | Births / 1,000 Women |
| Less than High School | 0 (0.0%) | 0.0 |
| High School Diploma | 6 (13.3%) | 22.0 |
| College or Associate's Degree | 13 (28.9%) | 17.0 |
| Bachelor's Degree | 26 (57.8%) | 66.0 |
| Graduate Degree | 0 (0.0%) | 0.0 |
| Total | 45 (100.0%) | 26.0 |
Fertility by Education by Marriage Status in York
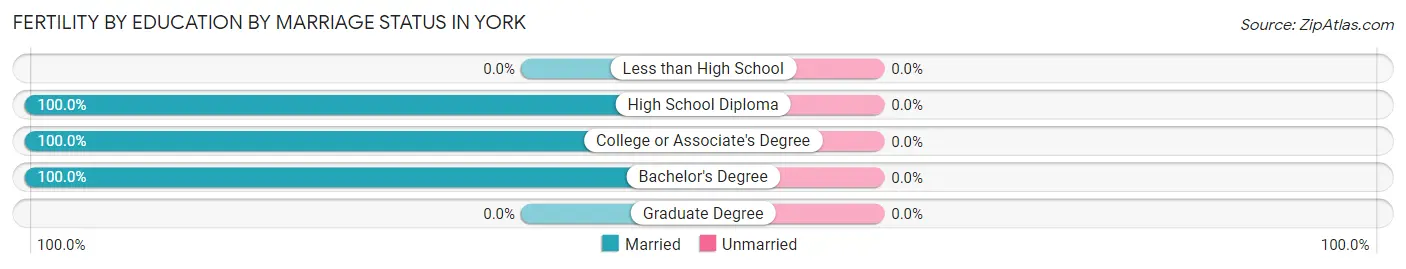
| Educational Attainment | Married | Unmarried |
| Less than High School | 0 (0.0%) | 0 (0.0%) |
| High School Diploma | 6 (100.0%) | 0 (0.0%) |
| College or Associate's Degree | 13 (100.0%) | 0 (0.0%) |
| Bachelor's Degree | 26 (100.0%) | 0 (0.0%) |
| Graduate Degree | 0 (0.0%) | 0 (0.0%) |
| Total | 45 (100.0%) | 0 (0.0%) |
Employment Characteristics in York
Employment by Class of Employer in York
Among the 3,935 employed individuals in York, private company employees (2,606 | 66.2%), local government employees (435 | 11.1%), and not-for-profit organizations (403 | 10.2%) make up the most common classes of employment.
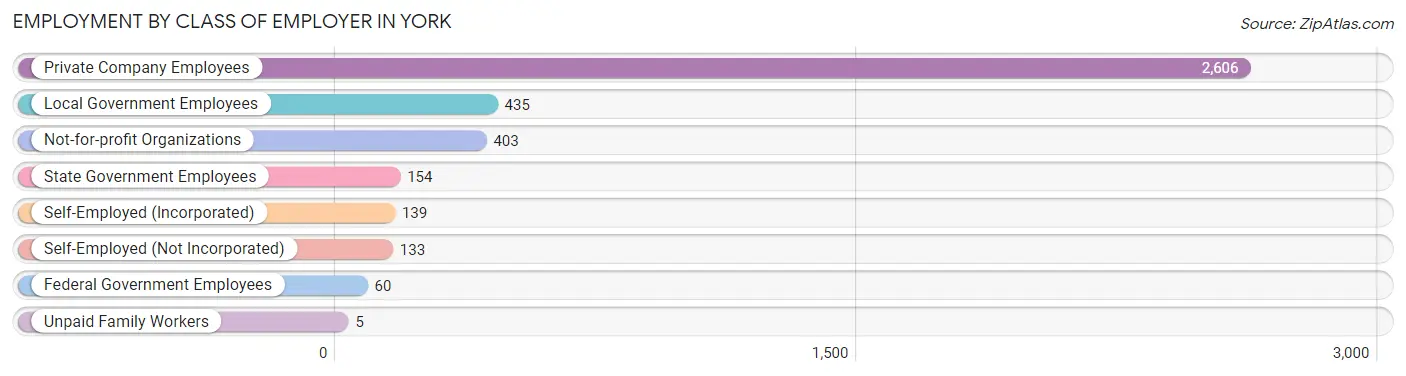
| Employer Class | # Employees | % Employees |
| Private Company Employees | 2,606 | 66.2% |
| Self-Employed (Incorporated) | 139 | 3.5% |
| Self-Employed (Not Incorporated) | 133 | 3.4% |
| Not-for-profit Organizations | 403 | 10.2% |
| Local Government Employees | 435 | 11.1% |
| State Government Employees | 154 | 3.9% |
| Federal Government Employees | 60 | 1.5% |
| Unpaid Family Workers | 5 | 0.1% |
| Total | 3,935 | 100.0% |
Employment Status by Age in York
According to the labor force statistics for York, out of the total population over 16 years of age (6,436), 64.8% or 4,171 individuals are in the labor force, with 3.9% or 163 of them unemployed. The age group with the highest labor force participation rate is 45 to 54 years, with 93.1% or 826 individuals in the labor force. Within the labor force, the 16 to 19 years age range has the highest percentage of unemployed individuals, with 26.7% or 74 of them being unemployed.
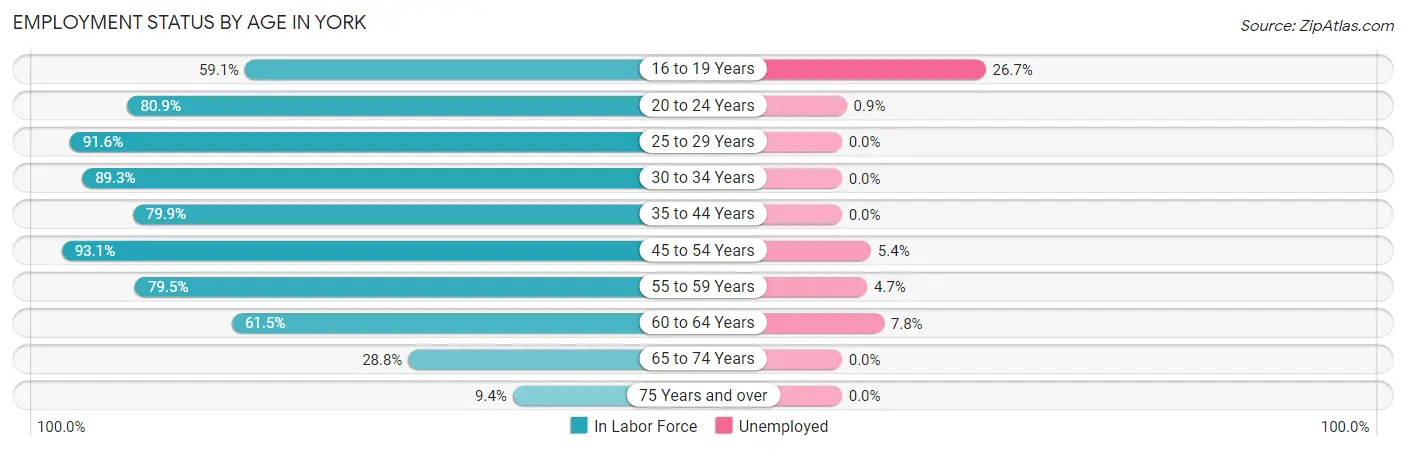
| Age Bracket | In Labor Force | Unemployed |
| 16 to 19 Years | 277 (59.1%) | 74 (26.7%) |
| 20 to 24 Years | 454 (80.9%) | 4 (0.9%) |
| 25 to 29 Years | 458 (91.6%) | 0 (0.0%) |
| 30 to 34 Years | 342 (89.3%) | 0 (0.0%) |
| 35 to 44 Years | 794 (79.9%) | 0 (0.0%) |
| 45 to 54 Years | 826 (93.1%) | 45 (5.4%) |
| 55 to 59 Years | 384 (79.5%) | 18 (4.7%) |
| 60 to 64 Years | 294 (61.5%) | 23 (7.8%) |
| 65 to 74 Years | 273 (28.8%) | 0 (0.0%) |
| 75 Years and over | 69 (9.4%) | 0 (0.0%) |
| Total | 4,171 (64.8%) | 163 (3.9%) |
Employment Status by Educational Attainment in York
According to labor force statistics for York, 83.2% of individuals (3,099) out of the total population between 25 and 64 years of age (3,725) are in the labor force, with 2.8% or 87 of them being unemployed. The group with the highest labor force participation rate are those with the educational attainment of bachelor's degree or higher, with 93.3% or 1,017 individuals in the labor force. Within the labor force, individuals with high school diploma education have the highest percentage of unemployment, with 9.1% or 68 of them being unemployed.
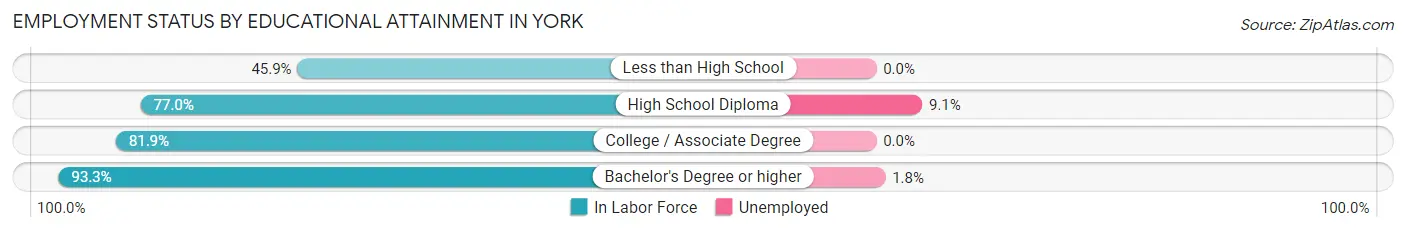
| Educational Attainment | In Labor Force | Unemployed |
| Less than High School | 39 (45.9%) | 0 (0.0%) |
| High School Diploma | 745 (77.0%) | 88 (9.1%) |
| College / Associate Degree | 1,296 (81.9%) | 0 (0.0%) |
| Bachelor's Degree or higher | 1,017 (93.3%) | 20 (1.8%) |
| Total | 3,099 (83.2%) | 104 (2.8%) |
Employment Occupations by Sex in York
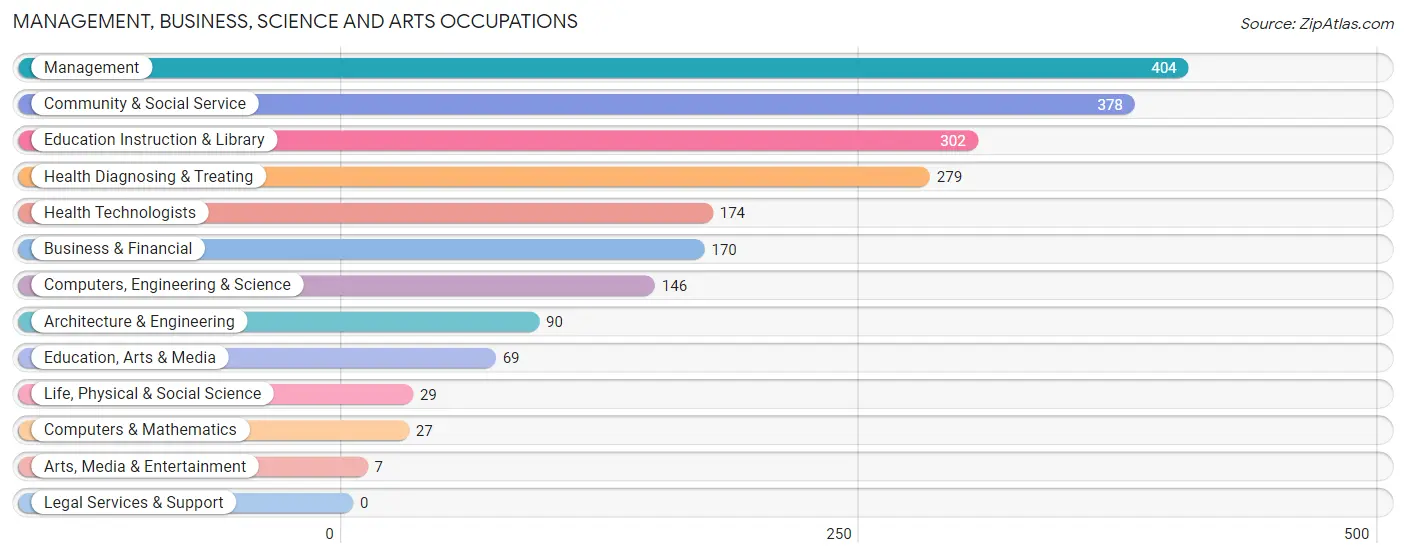
Management, Business, Science and Arts Occupations
The most common Management, Business, Science and Arts occupations in York are Management (404 | 10.1%), Community & Social Service (378 | 9.4%), Education Instruction & Library (302 | 7.5%), Health Diagnosing & Treating (279 | 7.0%), and Health Technologists (174 | 4.3%).
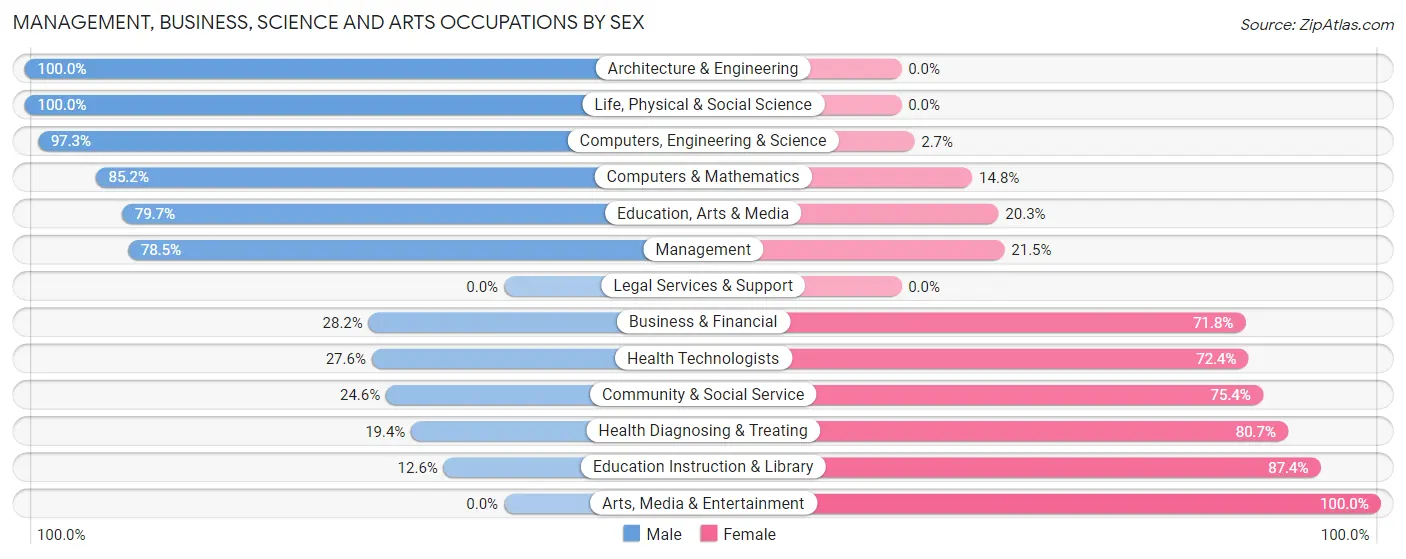
Management, Business, Science and Arts Occupations by Sex
Within the Management, Business, Science and Arts occupations in York, the most male-oriented occupations are Architecture & Engineering (100.0%), Life, Physical & Social Science (100.0%), and Computers, Engineering & Science (97.3%), while the most female-oriented occupations are Arts, Media & Entertainment (100.0%), Education Instruction & Library (87.4%), and Health Diagnosing & Treating (80.6%).
| Occupation | Male | Female |
| Management | 317 (78.5%) | 87 (21.5%) |
| Business & Financial | 48 (28.2%) | 122 (71.8%) |
| Computers, Engineering & Science | 142 (97.3%) | 4 (2.7%) |
| Computers & Mathematics | 23 (85.2%) | 4 (14.8%) |
| Architecture & Engineering | 90 (100.0%) | 0 (0.0%) |
| Life, Physical & Social Science | 29 (100.0%) | 0 (0.0%) |
| Community & Social Service | 93 (24.6%) | 285 (75.4%) |
| Education, Arts & Media | 55 (79.7%) | 14 (20.3%) |
| Legal Services & Support | 0 (0.0%) | 0 (0.0%) |
| Education Instruction & Library | 38 (12.6%) | 264 (87.4%) |
| Arts, Media & Entertainment | 0 (0.0%) | 7 (100.0%) |
| Health Diagnosing & Treating | 54 (19.4%) | 225 (80.6%) |
| Health Technologists | 48 (27.6%) | 126 (72.4%) |
| Total (Category) | 654 (47.5%) | 723 (52.5%) |
| Total (Overall) | 2,060 (51.4%) | 1,947 (48.6%) |
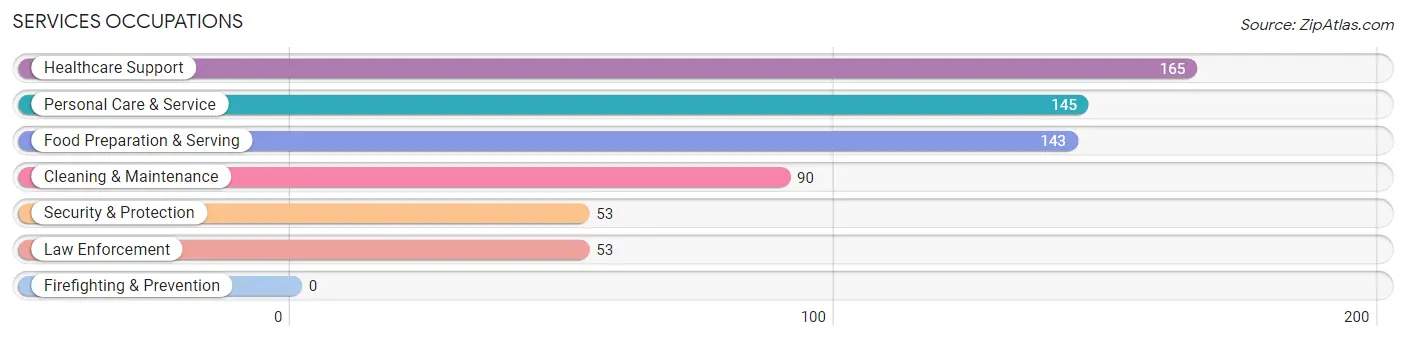
Services Occupations
The most common Services occupations in York are Healthcare Support (165 | 4.1%), Personal Care & Service (145 | 3.6%), Food Preparation & Serving (143 | 3.6%), Cleaning & Maintenance (90 | 2.2%), and Security & Protection (53 | 1.3%).
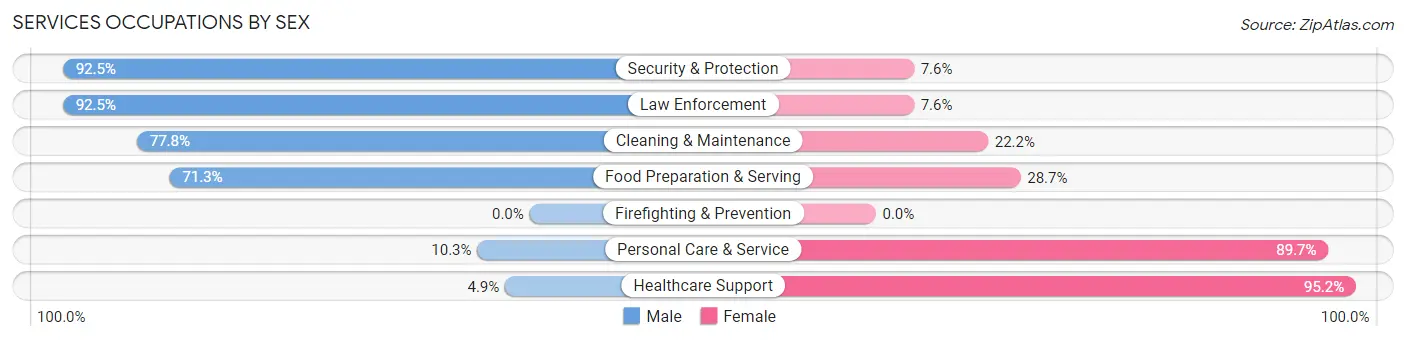
Services Occupations by Sex
Within the Services occupations in York, the most male-oriented occupations are Security & Protection (92.4%), Law Enforcement (92.4%), and Cleaning & Maintenance (77.8%), while the most female-oriented occupations are Healthcare Support (95.2%), Personal Care & Service (89.7%), and Food Preparation & Serving (28.7%).
| Occupation | Male | Female |
| Healthcare Support | 8 (4.9%) | 157 (95.2%) |
| Security & Protection | 49 (92.4%) | 4 (7.5%) |
| Firefighting & Prevention | 0 (0.0%) | 0 (0.0%) |
| Law Enforcement | 49 (92.4%) | 4 (7.5%) |
| Food Preparation & Serving | 102 (71.3%) | 41 (28.7%) |
| Cleaning & Maintenance | 70 (77.8%) | 20 (22.2%) |
| Personal Care & Service | 15 (10.3%) | 130 (89.7%) |
| Total (Category) | 244 (40.9%) | 352 (59.1%) |
| Total (Overall) | 2,060 (51.4%) | 1,947 (48.6%) |
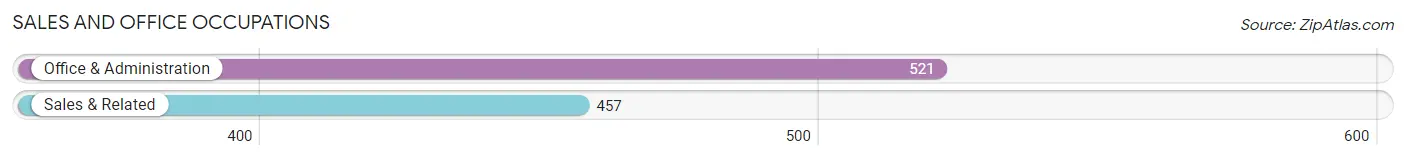
Sales and Office Occupations
The most common Sales and Office occupations in York are Office & Administration (521 | 13.0%), and Sales & Related (457 | 11.4%).
Sales and Office Occupations by Sex
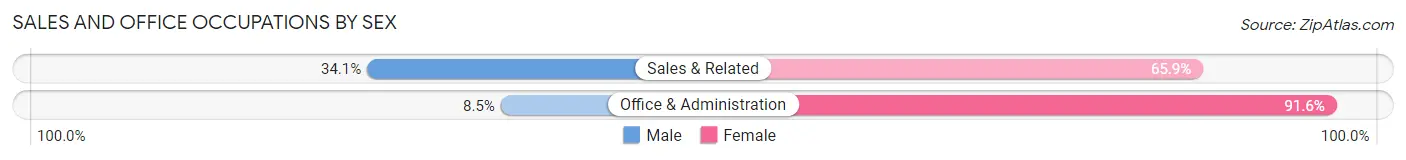
| Occupation | Male | Female |
| Sales & Related | 156 (34.1%) | 301 (65.9%) |
| Office & Administration | 44 (8.5%) | 477 (91.5%) |
| Total (Category) | 200 (20.4%) | 778 (79.5%) |
| Total (Overall) | 2,060 (51.4%) | 1,947 (48.6%) |
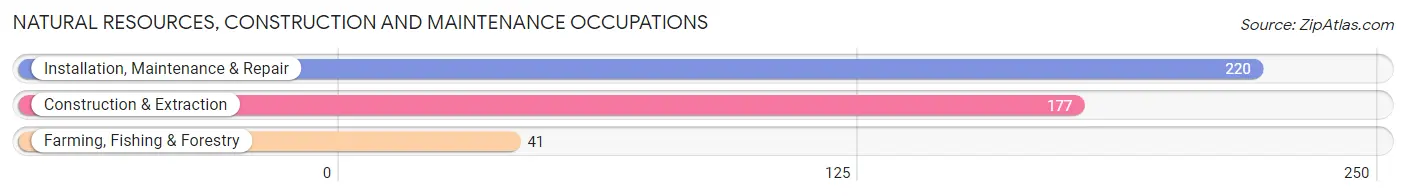
Natural Resources, Construction and Maintenance Occupations
The most common Natural Resources, Construction and Maintenance occupations in York are Installation, Maintenance & Repair (220 | 5.5%), Construction & Extraction (177 | 4.4%), and Farming, Fishing & Forestry (41 | 1.0%).
Natural Resources, Construction and Maintenance Occupations by Sex
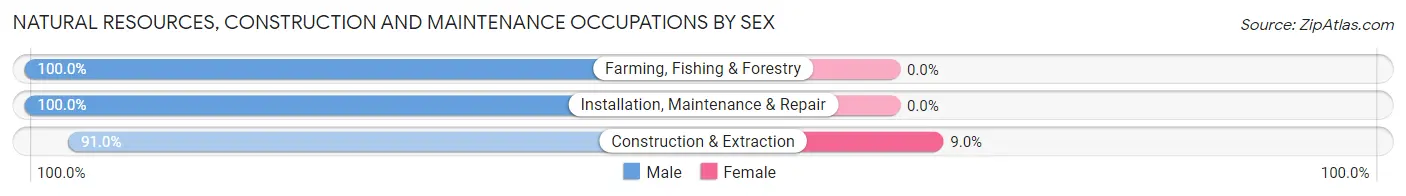
| Occupation | Male | Female |
| Farming, Fishing & Forestry | 41 (100.0%) | 0 (0.0%) |
| Construction & Extraction | 161 (91.0%) | 16 (9.0%) |
| Installation, Maintenance & Repair | 220 (100.0%) | 0 (0.0%) |
| Total (Category) | 422 (96.4%) | 16 (3.6%) |
| Total (Overall) | 2,060 (51.4%) | 1,947 (48.6%) |
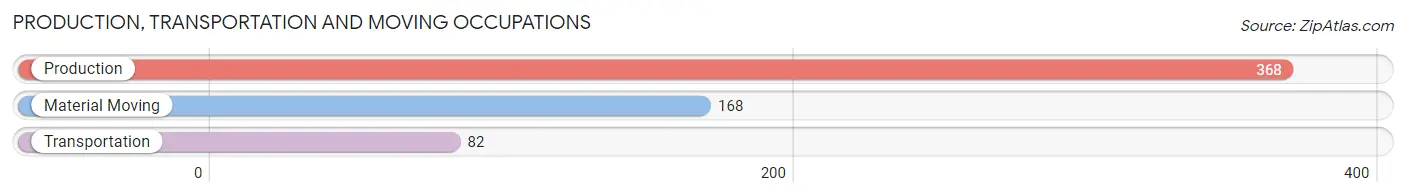
Production, Transportation and Moving Occupations
The most common Production, Transportation and Moving occupations in York are Production (368 | 9.2%), Material Moving (168 | 4.2%), and Transportation (82 | 2.1%).
Production, Transportation and Moving Occupations by Sex
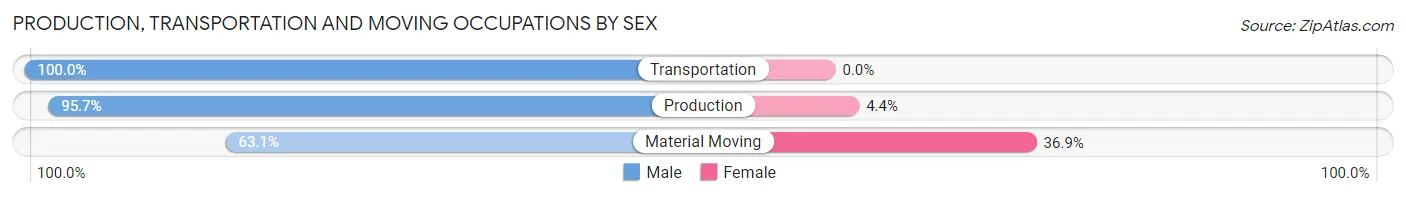
| Occupation | Male | Female |
| Production | 352 (95.7%) | 16 (4.3%) |
| Transportation | 82 (100.0%) | 0 (0.0%) |
| Material Moving | 106 (63.1%) | 62 (36.9%) |
| Total (Category) | 540 (87.4%) | 78 (12.6%) |
| Total (Overall) | 2,060 (51.4%) | 1,947 (48.6%) |
Employment Industries by Sex in York
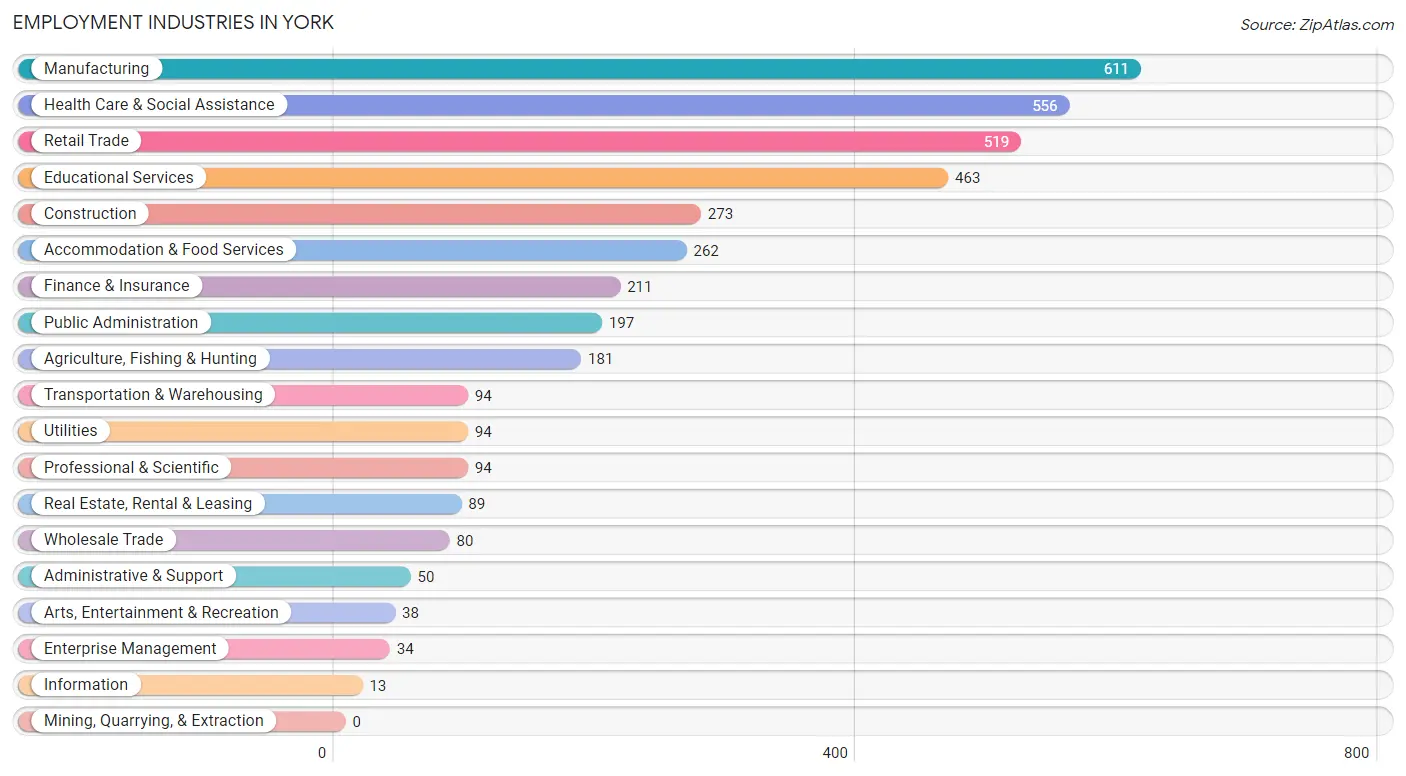
Employment Industries in York
The major employment industries in York include Manufacturing (611 | 15.2%), Health Care & Social Assistance (556 | 13.9%), Retail Trade (519 | 13.0%), Educational Services (463 | 11.6%), and Construction (273 | 6.8%).
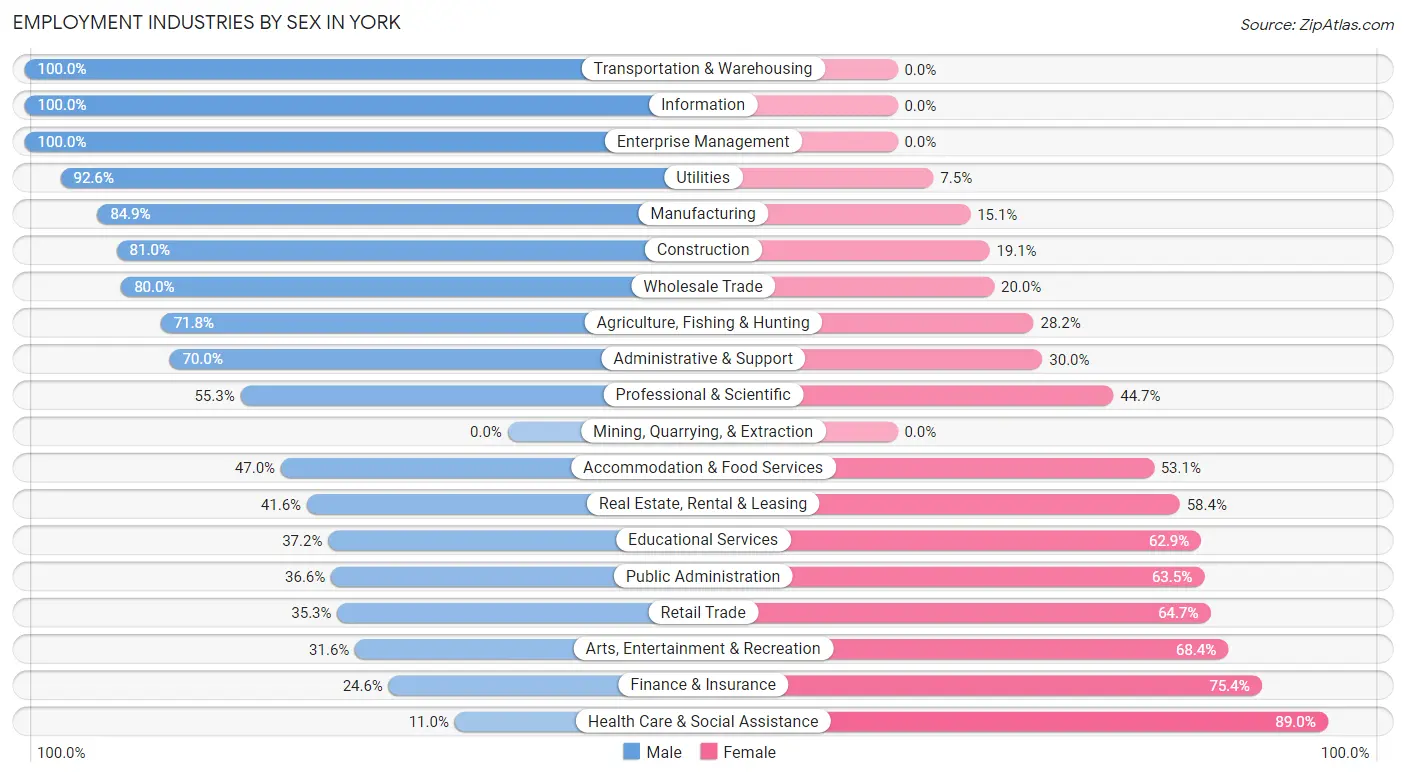
Employment Industries by Sex in York
The York industries that see more men than women are Transportation & Warehousing (100.0%), Information (100.0%), and Enterprise Management (100.0%), whereas the industries that tend to have a higher number of women are Health Care & Social Assistance (89.0%), Finance & Insurance (75.4%), and Arts, Entertainment & Recreation (68.4%).
| Industry | Male | Female |
| Agriculture, Fishing & Hunting | 130 (71.8%) | 51 (28.2%) |
| Mining, Quarrying, & Extraction | 0 (0.0%) | 0 (0.0%) |
| Construction | 221 (80.9%) | 52 (19.1%) |
| Manufacturing | 519 (84.9%) | 92 (15.1%) |
| Wholesale Trade | 64 (80.0%) | 16 (20.0%) |
| Retail Trade | 183 (35.3%) | 336 (64.7%) |
| Transportation & Warehousing | 94 (100.0%) | 0 (0.0%) |
| Utilities | 87 (92.5%) | 7 (7.4%) |
| Information | 13 (100.0%) | 0 (0.0%) |
| Finance & Insurance | 52 (24.6%) | 159 (75.4%) |
| Real Estate, Rental & Leasing | 37 (41.6%) | 52 (58.4%) |
| Professional & Scientific | 52 (55.3%) | 42 (44.7%) |
| Enterprise Management | 34 (100.0%) | 0 (0.0%) |
| Administrative & Support | 35 (70.0%) | 15 (30.0%) |
| Educational Services | 172 (37.1%) | 291 (62.8%) |
| Health Care & Social Assistance | 61 (11.0%) | 495 (89.0%) |
| Arts, Entertainment & Recreation | 12 (31.6%) | 26 (68.4%) |
| Accommodation & Food Services | 123 (46.9%) | 139 (53.0%) |
| Public Administration | 72 (36.5%) | 125 (63.4%) |
| Total | 2,060 (51.4%) | 1,947 (48.6%) |
Education in York
School Enrollment in York
The most common levels of schooling among the 2,072 students in York are elementary school (592 | 28.6%), high school (451 | 21.8%), and college / undergraduate (405 | 19.6%).
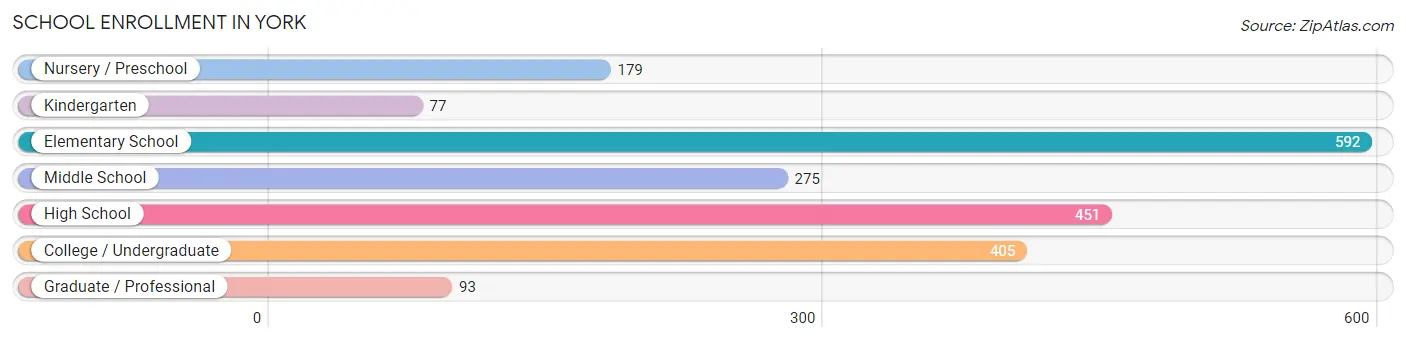
| School Level | # Students | % Students |
| Nursery / Preschool | 179 | 8.6% |
| Kindergarten | 77 | 3.7% |
| Elementary School | 592 | 28.6% |
| Middle School | 275 | 13.3% |
| High School | 451 | 21.8% |
| College / Undergraduate | 405 | 19.6% |
| Graduate / Professional | 93 | 4.5% |
| Total | 2,072 | 100.0% |
School Enrollment by Age by Funding Source in York
Out of a total of 2,072 students who are enrolled in schools in York, 667 (32.2%) attend a private institution, while the remaining 1,405 (67.8%) are enrolled in public schools. The age group of 3 to 4 year olds has the highest likelihood of being enrolled in private schools, with 51 (47.2% in the age bracket) enrolled. Conversely, the age group of 25 to 34 year olds has the lowest likelihood of being enrolled in a private school, with 65 (100.0% in the age bracket) attending a public institution.
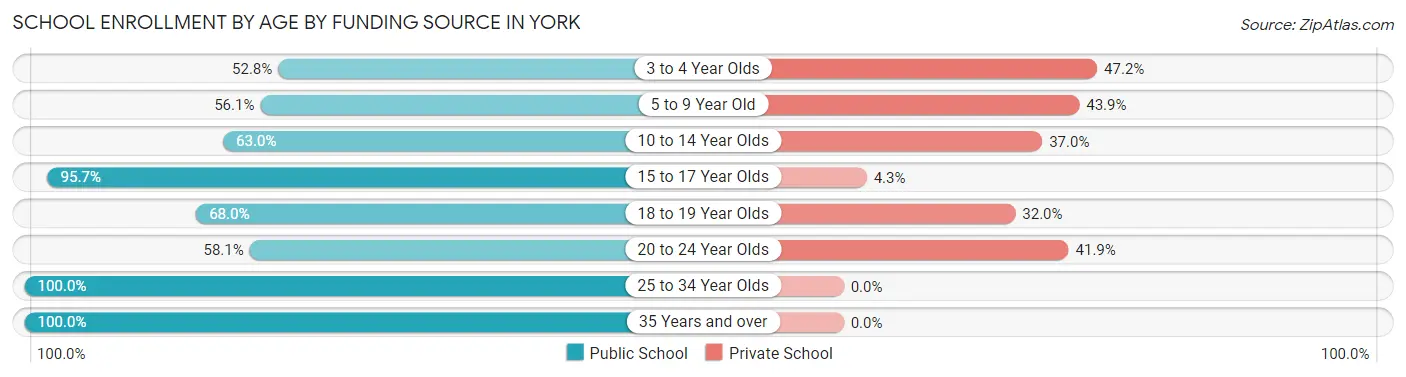
| Age Bracket | Public School | Private School |
| 3 to 4 Year Olds | 57 (52.8%) | 51 (47.2%) |
| 5 to 9 Year Old | 349 (56.1%) | 273 (43.9%) |
| 10 to 14 Year Olds | 288 (63.0%) | 169 (37.0%) |
| 15 to 17 Year Olds | 335 (95.7%) | 15 (4.3%) |
| 18 to 19 Year Olds | 151 (68.0%) | 71 (32.0%) |
| 20 to 24 Year Olds | 122 (58.1%) | 88 (41.9%) |
| 25 to 34 Year Olds | 65 (100.0%) | 0 (0.0%) |
| 35 Years and over | 38 (100.0%) | 0 (0.0%) |
| Total | 1,405 (67.8%) | 667 (32.2%) |
Educational Attainment by Field of Study in York
Business (278 | 17.7%), education (258 | 16.5%), bio, nature & agricultural (254 | 16.2%), science & technology (205 | 13.1%), and arts & humanities (177 | 11.3%) are the most common fields of study among 1,568 individuals in York who have obtained a bachelor's degree or higher.
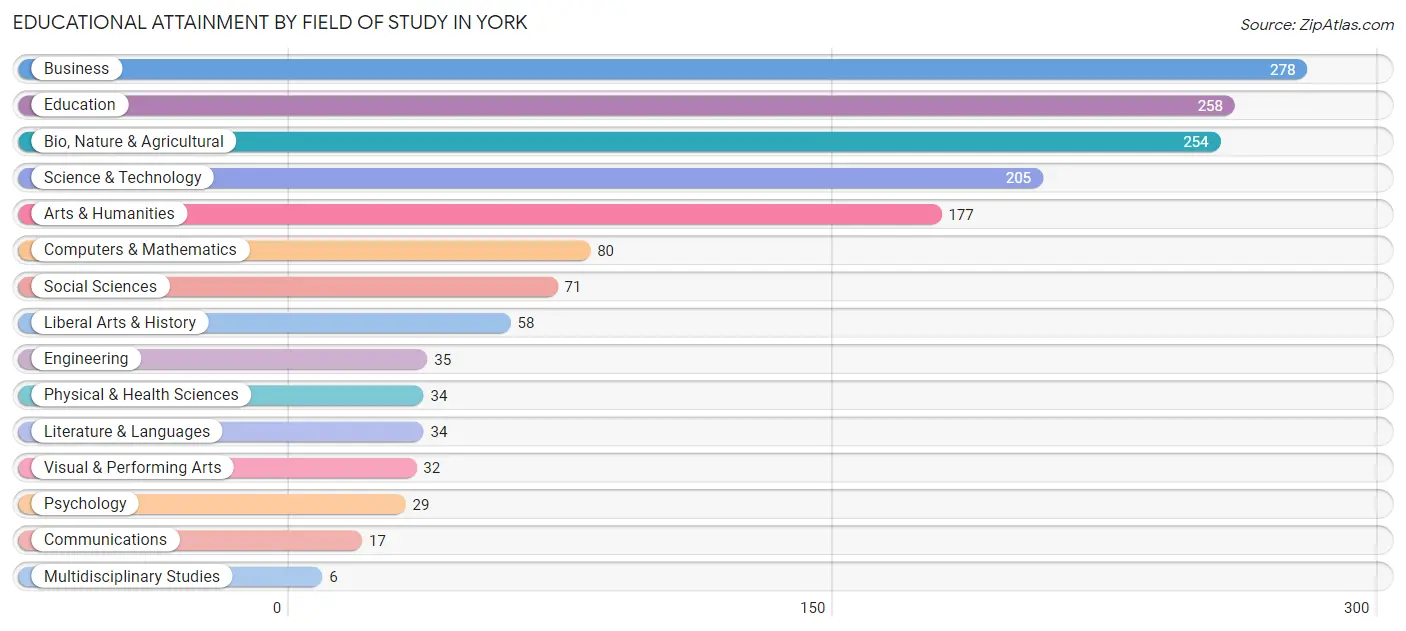
| Field of Study | # Graduates | % Graduates |
| Computers & Mathematics | 80 | 5.1% |
| Bio, Nature & Agricultural | 254 | 16.2% |
| Physical & Health Sciences | 34 | 2.2% |
| Psychology | 29 | 1.8% |
| Social Sciences | 71 | 4.5% |
| Engineering | 35 | 2.2% |
| Multidisciplinary Studies | 6 | 0.4% |
| Science & Technology | 205 | 13.1% |
| Business | 278 | 17.7% |
| Education | 258 | 16.5% |
| Literature & Languages | 34 | 2.2% |
| Liberal Arts & History | 58 | 3.7% |
| Visual & Performing Arts | 32 | 2.0% |
| Communications | 17 | 1.1% |
| Arts & Humanities | 177 | 11.3% |
| Total | 1,568 | 100.0% |
Transportation & Commute in York
Vehicle Availability by Sex in York
The most prevalent vehicle ownership categories in York are males with 2 vehicles (979, accounting for 49.8%) and females with 2 vehicles (887, making up 52.3%).
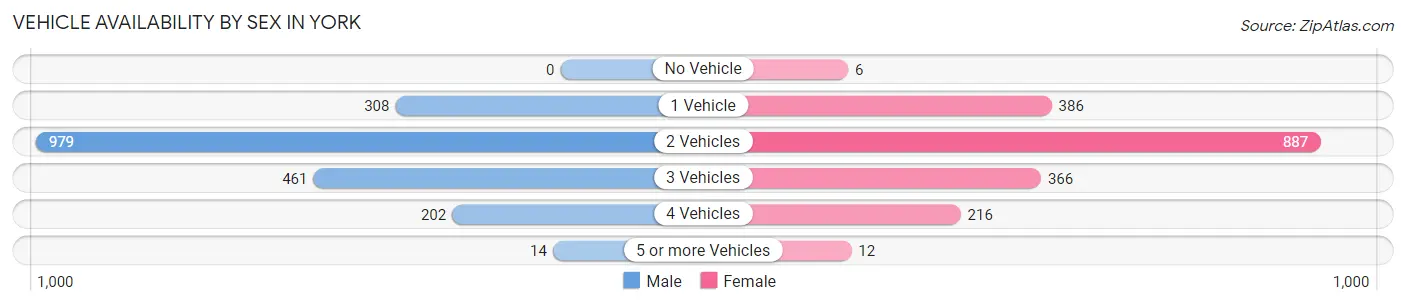
| Vehicles Available | Male | Female |
| No Vehicle | 0 (0.0%) | 6 (0.3%) |
| 1 Vehicle | 308 (15.7%) | 386 (20.6%) |
| 2 Vehicles | 979 (49.8%) | 887 (47.4%) |
| 3 Vehicles | 461 (23.5%) | 366 (19.5%) |
| 4 Vehicles | 202 (10.3%) | 216 (11.5%) |
| 5 or more Vehicles | 14 (0.7%) | 12 (0.6%) |
| Total | 1,964 (100.0%) | 1,873 (100.0%) |
Commute Time in York
The most frequently occuring commute durations in York are 5 to 9 minutes (1,468 commuters, 39.3%), 10 to 14 minutes (885 commuters, 23.7%), and less than 5 minutes (513 commuters, 13.7%).
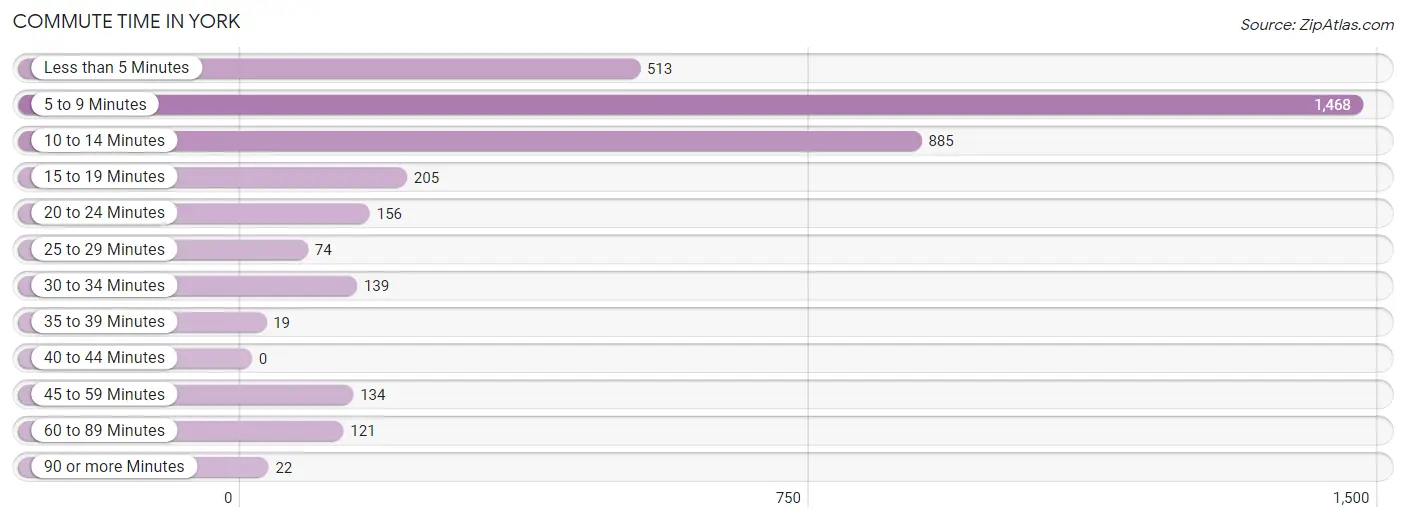
| Commute Time | # Commuters | % Commuters |
| Less than 5 Minutes | 513 | 13.7% |
| 5 to 9 Minutes | 1,468 | 39.3% |
| 10 to 14 Minutes | 885 | 23.7% |
| 15 to 19 Minutes | 205 | 5.5% |
| 20 to 24 Minutes | 156 | 4.2% |
| 25 to 29 Minutes | 74 | 2.0% |
| 30 to 34 Minutes | 139 | 3.7% |
| 35 to 39 Minutes | 19 | 0.5% |
| 40 to 44 Minutes | 0 | 0.0% |
| 45 to 59 Minutes | 134 | 3.6% |
| 60 to 89 Minutes | 121 | 3.2% |
| 90 or more Minutes | 22 | 0.6% |
Commute Time by Sex in York
The most common commute times in York are 5 to 9 minutes (769 commuters, 40.1%) for males and 5 to 9 minutes (699 commuters, 38.5%) for females.
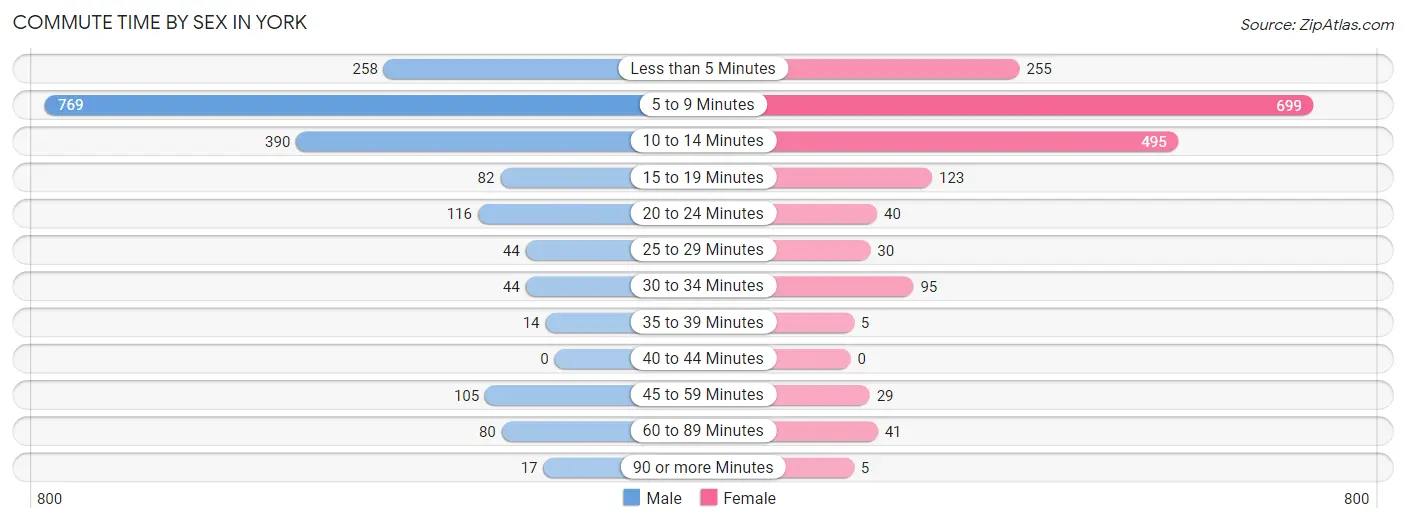
| Commute Time | Male | Female |
| Less than 5 Minutes | 258 (13.4%) | 255 (14.0%) |
| 5 to 9 Minutes | 769 (40.1%) | 699 (38.5%) |
| 10 to 14 Minutes | 390 (20.3%) | 495 (27.2%) |
| 15 to 19 Minutes | 82 (4.3%) | 123 (6.8%) |
| 20 to 24 Minutes | 116 (6.0%) | 40 (2.2%) |
| 25 to 29 Minutes | 44 (2.3%) | 30 (1.7%) |
| 30 to 34 Minutes | 44 (2.3%) | 95 (5.2%) |
| 35 to 39 Minutes | 14 (0.7%) | 5 (0.3%) |
| 40 to 44 Minutes | 0 (0.0%) | 0 (0.0%) |
| 45 to 59 Minutes | 105 (5.5%) | 29 (1.6%) |
| 60 to 89 Minutes | 80 (4.2%) | 41 (2.3%) |
| 90 or more Minutes | 17 (0.9%) | 5 (0.3%) |
Time of Departure to Work by Sex in York
The most frequent times of departure to work in York are 7:30 AM to 7:59 AM (376, 19.6%) for males and 7:30 AM to 7:59 AM (316, 17.4%) for females.
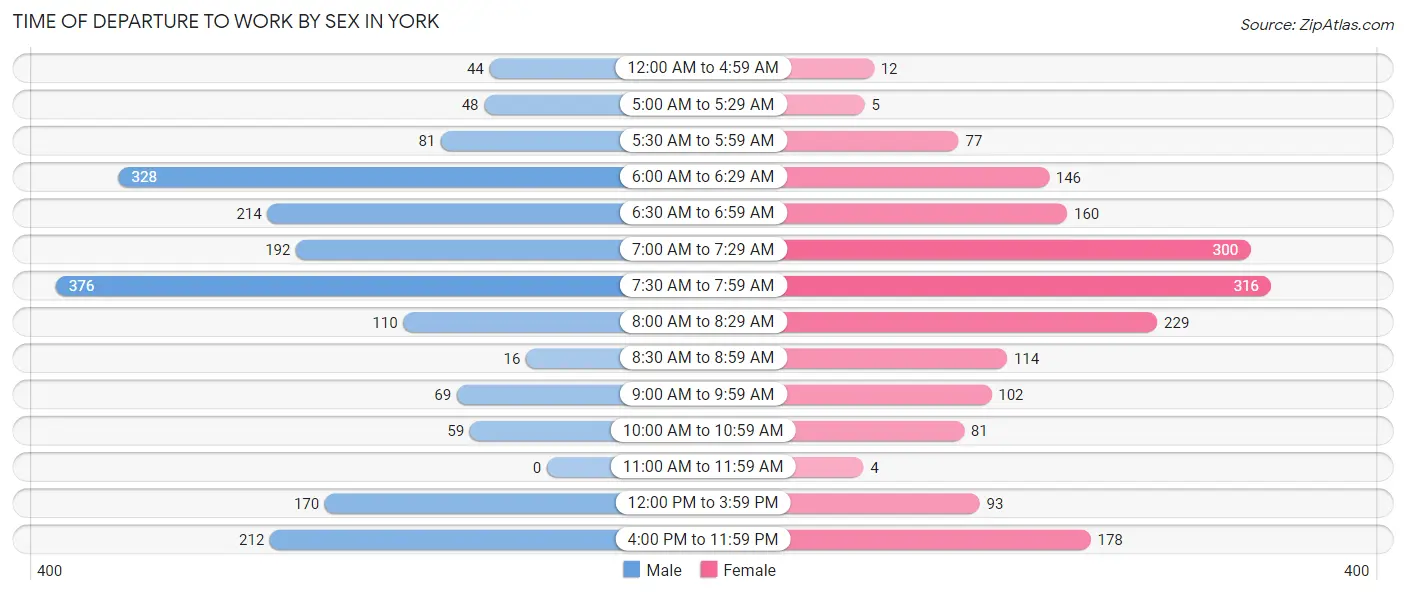
| Time of Departure | Male | Female |
| 12:00 AM to 4:59 AM | 44 (2.3%) | 12 (0.7%) |
| 5:00 AM to 5:29 AM | 48 (2.5%) | 5 (0.3%) |
| 5:30 AM to 5:59 AM | 81 (4.2%) | 77 (4.2%) |
| 6:00 AM to 6:29 AM | 328 (17.1%) | 146 (8.0%) |
| 6:30 AM to 6:59 AM | 214 (11.2%) | 160 (8.8%) |
| 7:00 AM to 7:29 AM | 192 (10.0%) | 300 (16.5%) |
| 7:30 AM to 7:59 AM | 376 (19.6%) | 316 (17.4%) |
| 8:00 AM to 8:29 AM | 110 (5.7%) | 229 (12.6%) |
| 8:30 AM to 8:59 AM | 16 (0.8%) | 114 (6.3%) |
| 9:00 AM to 9:59 AM | 69 (3.6%) | 102 (5.6%) |
| 10:00 AM to 10:59 AM | 59 (3.1%) | 81 (4.5%) |
| 11:00 AM to 11:59 AM | 0 (0.0%) | 4 (0.2%) |
| 12:00 PM to 3:59 PM | 170 (8.9%) | 93 (5.1%) |
| 4:00 PM to 11:59 PM | 212 (11.1%) | 178 (9.8%) |
| Total | 1,919 (100.0%) | 1,817 (100.0%) |
Housing Occupancy in York
Occupancy by Ownership in York
Of the total 3,285 dwellings in York, owner-occupied units account for 2,232 (67.9%), while renter-occupied units make up 1,053 (32.1%).
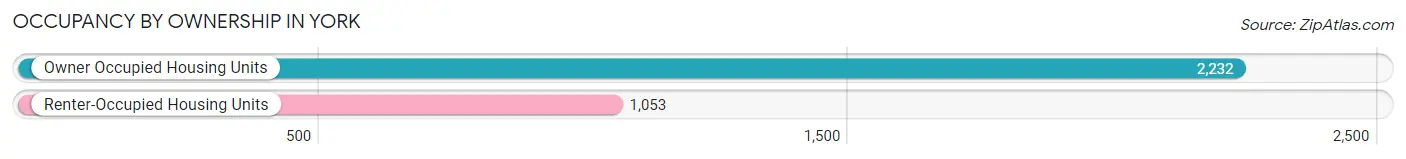
| Occupancy | # Housing Units | % Housing Units |
| Owner Occupied Housing Units | 2,232 | 67.9% |
| Renter-Occupied Housing Units | 1,053 | 32.1% |
| Total Occupied Housing Units | 3,285 | 100.0% |
Occupancy by Household Size in York
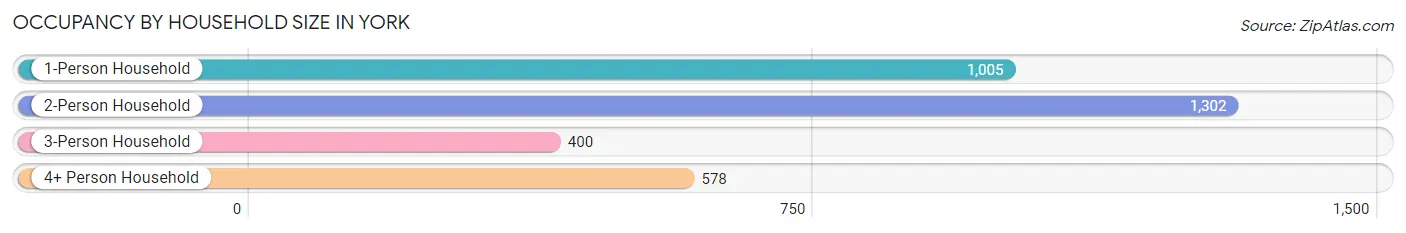
| Household Size | # Housing Units | % Housing Units |
| 1-Person Household | 1,005 | 30.6% |
| 2-Person Household | 1,302 | 39.6% |
| 3-Person Household | 400 | 12.2% |
| 4+ Person Household | 578 | 17.6% |
| Total Housing Units | 3,285 | 100.0% |
Occupancy by Ownership by Household Size in York
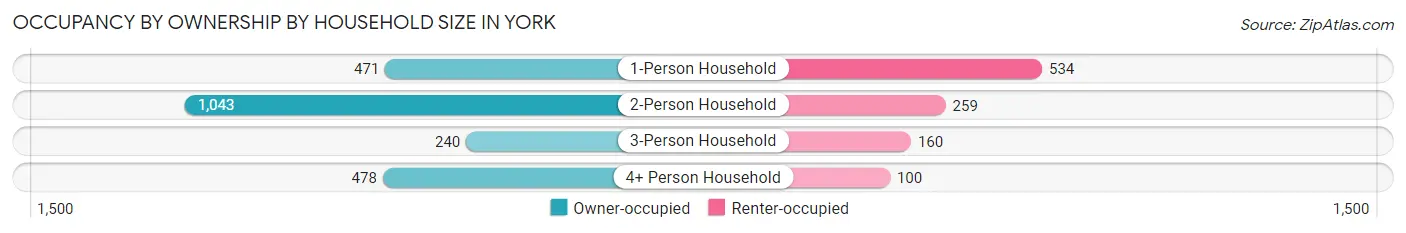
| Household Size | Owner-occupied | Renter-occupied |
| 1-Person Household | 471 (46.9%) | 534 (53.1%) |
| 2-Person Household | 1,043 (80.1%) | 259 (19.9%) |
| 3-Person Household | 240 (60.0%) | 160 (40.0%) |
| 4+ Person Household | 478 (82.7%) | 100 (17.3%) |
| Total Housing Units | 2,232 (67.9%) | 1,053 (32.1%) |
Occupancy by Educational Attainment in York
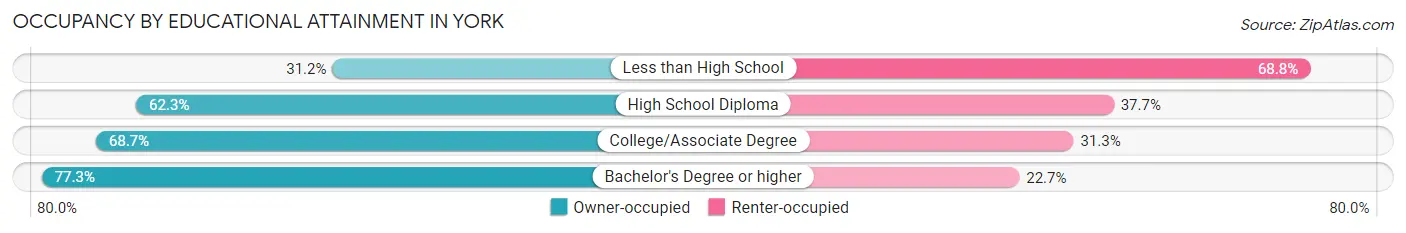
| Household Size | Owner-occupied | Renter-occupied |
| Less than High School | 39 (31.2%) | 86 (68.8%) |
| High School Diploma | 549 (62.3%) | 332 (37.7%) |
| College/Associate Degree | 939 (68.7%) | 428 (31.3%) |
| Bachelor's Degree or higher | 705 (77.3%) | 207 (22.7%) |
Occupancy by Age of Householder in York
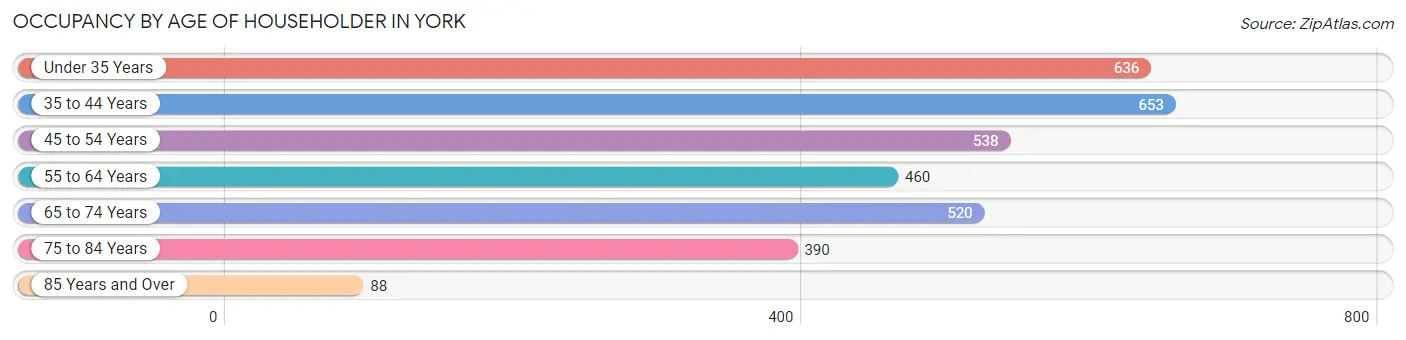
| Age Bracket | # Households | % Households |
| Under 35 Years | 636 | 19.4% |
| 35 to 44 Years | 653 | 19.9% |
| 45 to 54 Years | 538 | 16.4% |
| 55 to 64 Years | 460 | 14.0% |
| 65 to 74 Years | 520 | 15.8% |
| 75 to 84 Years | 390 | 11.9% |
| 85 Years and Over | 88 | 2.7% |
| Total | 3,285 | 100.0% |
Housing Finances in York
Median Income by Occupancy in York
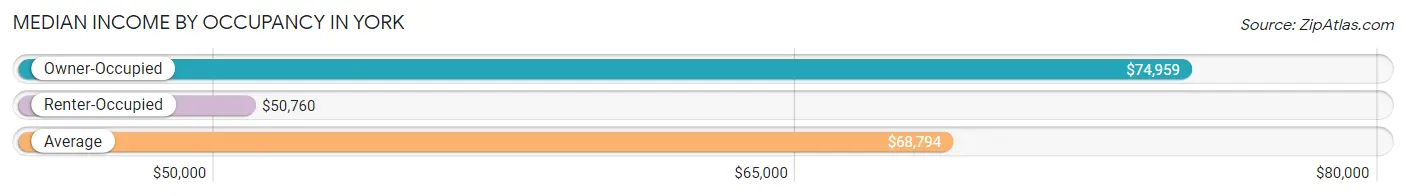
| Occupancy Type | # Households | Median Income |
| Owner-Occupied | 2,232 (67.9%) | $74,959 |
| Renter-Occupied | 1,053 (32.1%) | $50,760 |
| Average | 3,285 (100.0%) | $68,794 |
Occupancy by Householder Income Bracket in York
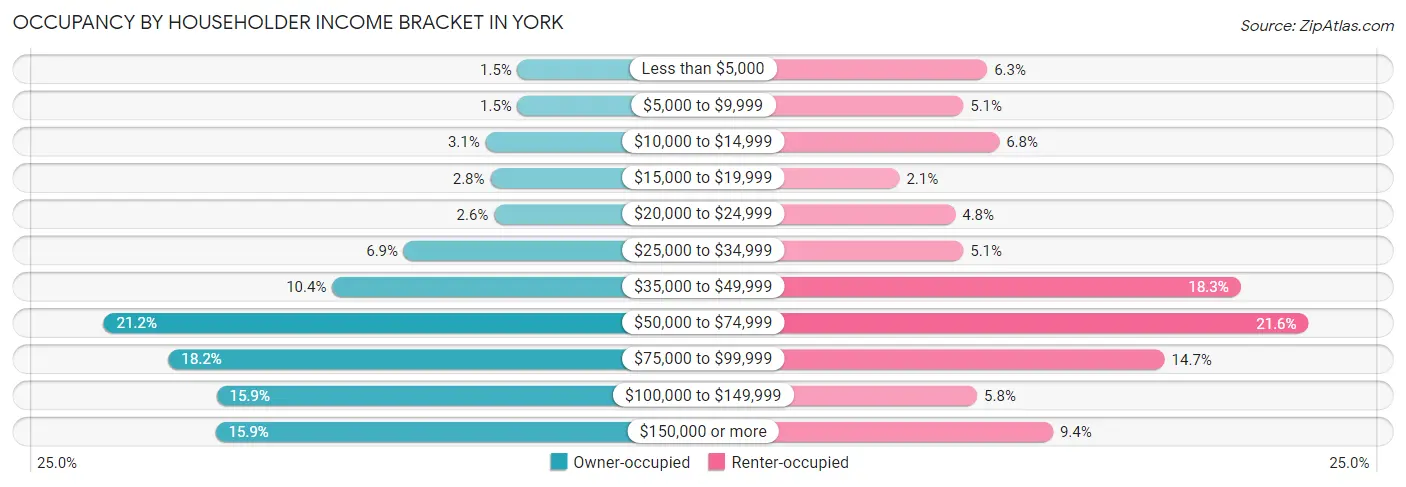
| Income Bracket | Owner-occupied | Renter-occupied |
| Less than $5,000 | 34 (1.5%) | 66 (6.3%) |
| $5,000 to $9,999 | 34 (1.5%) | 54 (5.1%) |
| $10,000 to $14,999 | 68 (3.0%) | 72 (6.8%) |
| $15,000 to $19,999 | 63 (2.8%) | 22 (2.1%) |
| $20,000 to $24,999 | 59 (2.6%) | 50 (4.8%) |
| $25,000 to $34,999 | 155 (6.9%) | 54 (5.1%) |
| $35,000 to $49,999 | 231 (10.3%) | 193 (18.3%) |
| $50,000 to $74,999 | 474 (21.2%) | 227 (21.6%) |
| $75,000 to $99,999 | 405 (18.1%) | 155 (14.7%) |
| $100,000 to $149,999 | 354 (15.9%) | 61 (5.8%) |
| $150,000 or more | 355 (15.9%) | 99 (9.4%) |
| Total | 2,232 (100.0%) | 1,053 (100.0%) |
Monthly Housing Cost Tiers in York
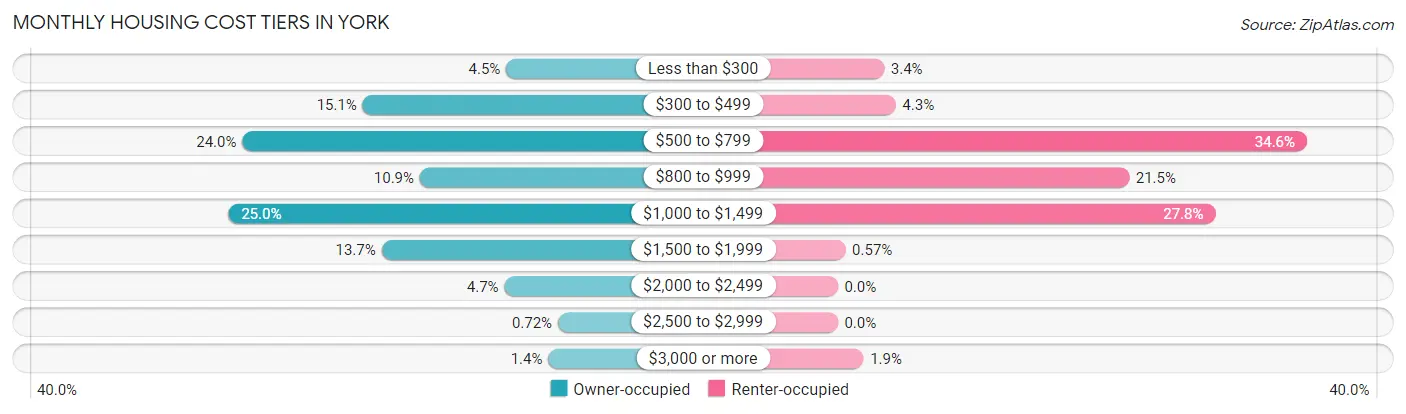
| Monthly Cost | Owner-occupied | Renter-occupied |
| Less than $300 | 101 (4.5%) | 36 (3.4%) |
| $300 to $499 | 337 (15.1%) | 45 (4.3%) |
| $500 to $799 | 535 (24.0%) | 364 (34.6%) |
| $800 to $999 | 243 (10.9%) | 226 (21.5%) |
| $1,000 to $1,499 | 558 (25.0%) | 293 (27.8%) |
| $1,500 to $1,999 | 306 (13.7%) | 6 (0.6%) |
| $2,000 to $2,499 | 104 (4.7%) | 0 (0.0%) |
| $2,500 to $2,999 | 16 (0.7%) | 0 (0.0%) |
| $3,000 or more | 32 (1.4%) | 20 (1.9%) |
| Total | 2,232 (100.0%) | 1,053 (100.0%) |
Physical Housing Characteristics in York
Housing Structures in York
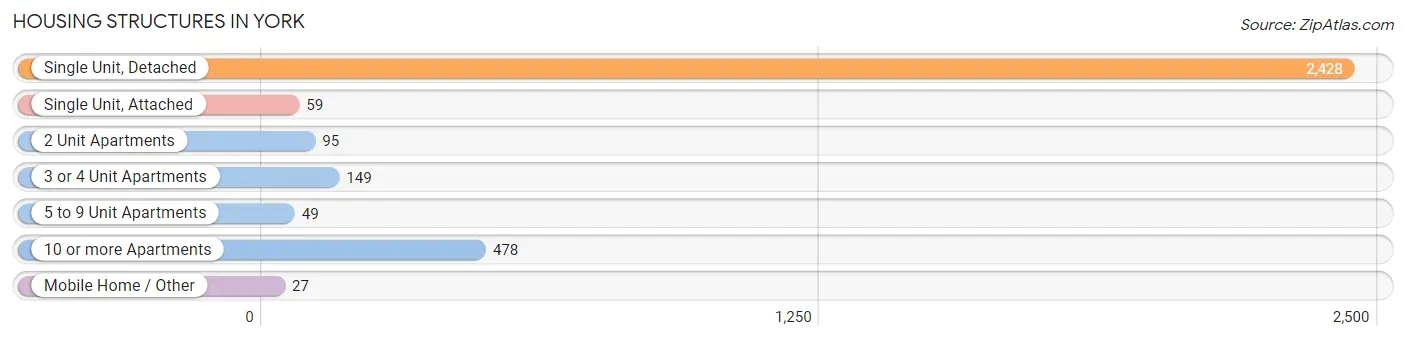
| Structure Type | # Housing Units | % Housing Units |
| Single Unit, Detached | 2,428 | 73.9% |
| Single Unit, Attached | 59 | 1.8% |
| 2 Unit Apartments | 95 | 2.9% |
| 3 or 4 Unit Apartments | 149 | 4.5% |
| 5 to 9 Unit Apartments | 49 | 1.5% |
| 10 or more Apartments | 478 | 14.5% |
| Mobile Home / Other | 27 | 0.8% |
| Total | 3,285 | 100.0% |
Housing Structures by Occupancy in York
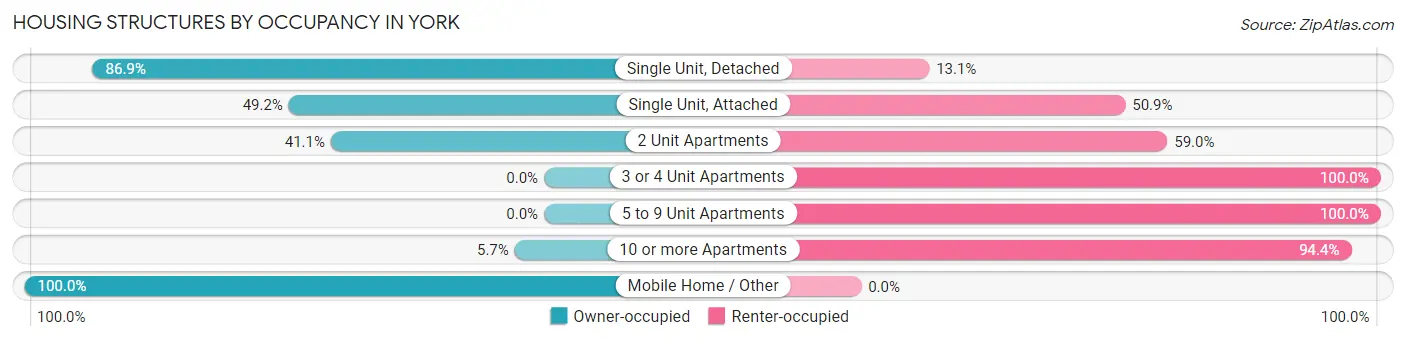
| Structure Type | Owner-occupied | Renter-occupied |
| Single Unit, Detached | 2,110 (86.9%) | 318 (13.1%) |
| Single Unit, Attached | 29 (49.1%) | 30 (50.8%) |
| 2 Unit Apartments | 39 (41.0%) | 56 (59.0%) |
| 3 or 4 Unit Apartments | 0 (0.0%) | 149 (100.0%) |
| 5 to 9 Unit Apartments | 0 (0.0%) | 49 (100.0%) |
| 10 or more Apartments | 27 (5.7%) | 451 (94.4%) |
| Mobile Home / Other | 27 (100.0%) | 0 (0.0%) |
| Total | 2,232 (67.9%) | 1,053 (32.1%) |
Housing Structures by Number of Rooms in York
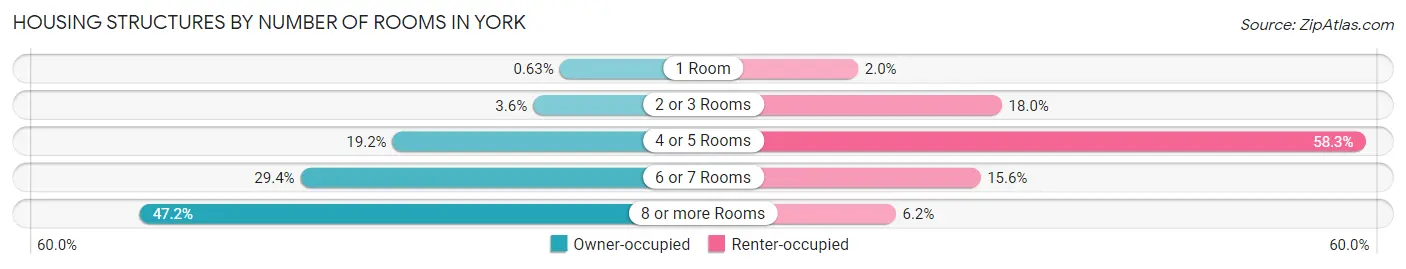
| Number of Rooms | Owner-occupied | Renter-occupied |
| 1 Room | 14 (0.6%) | 21 (2.0%) |
| 2 or 3 Rooms | 80 (3.6%) | 189 (17.9%) |
| 4 or 5 Rooms | 428 (19.2%) | 614 (58.3%) |
| 6 or 7 Rooms | 656 (29.4%) | 164 (15.6%) |
| 8 or more Rooms | 1,054 (47.2%) | 65 (6.2%) |
| Total | 2,232 (100.0%) | 1,053 (100.0%) |
Housing Structure by Heating Type in York
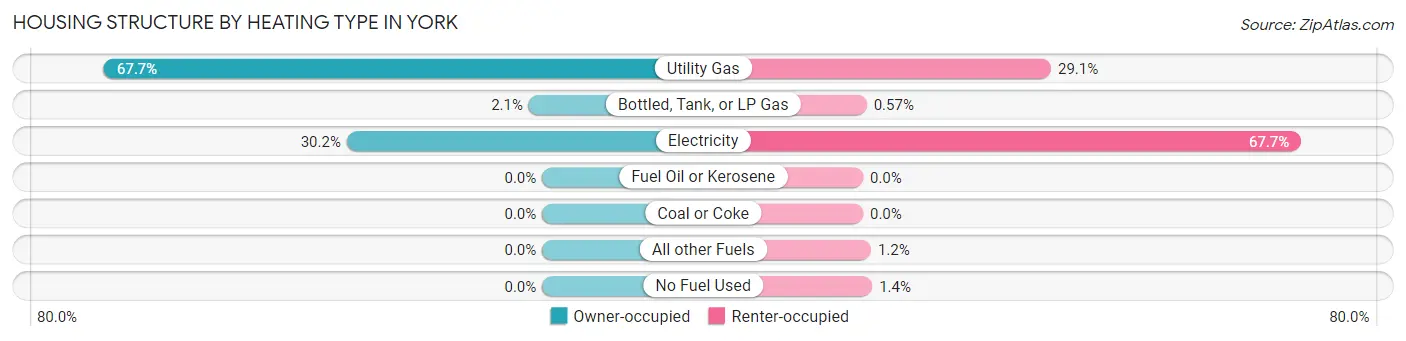
| Heating Type | Owner-occupied | Renter-occupied |
| Utility Gas | 1,512 (67.7%) | 306 (29.1%) |
| Bottled, Tank, or LP Gas | 46 (2.1%) | 6 (0.6%) |
| Electricity | 674 (30.2%) | 713 (67.7%) |
| Fuel Oil or Kerosene | 0 (0.0%) | 0 (0.0%) |
| Coal or Coke | 0 (0.0%) | 0 (0.0%) |
| All other Fuels | 0 (0.0%) | 13 (1.2%) |
| No Fuel Used | 0 (0.0%) | 15 (1.4%) |
| Total | 2,232 (100.0%) | 1,053 (100.0%) |
Household Vehicle Usage in York
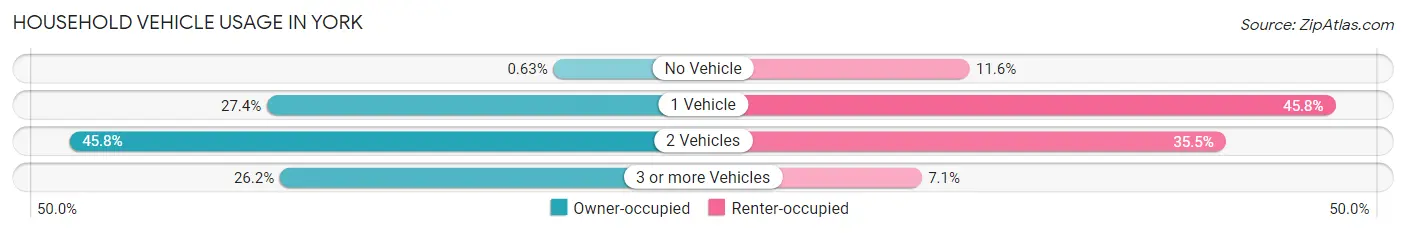
| Vehicles per Household | Owner-occupied | Renter-occupied |
| No Vehicle | 14 (0.6%) | 122 (11.6%) |
| 1 Vehicle | 611 (27.4%) | 482 (45.8%) |
| 2 Vehicles | 1,023 (45.8%) | 374 (35.5%) |
| 3 or more Vehicles | 584 (26.2%) | 75 (7.1%) |
| Total | 2,232 (100.0%) | 1,053 (100.0%) |
Real Estate & Mortgages in York
Real Estate and Mortgage Overview in York
| Characteristic | Without Mortgage | With Mortgage |
| Housing Units | 929 | 1,303 |
| Median Property Value | $149,700 | $159,800 |
| Median Household Income | $72,019 | $227 |
| Monthly Housing Costs | $541 | $32 |
| Real Estate Taxes | $1,949 | $33 |
Property Value by Mortgage Status in York
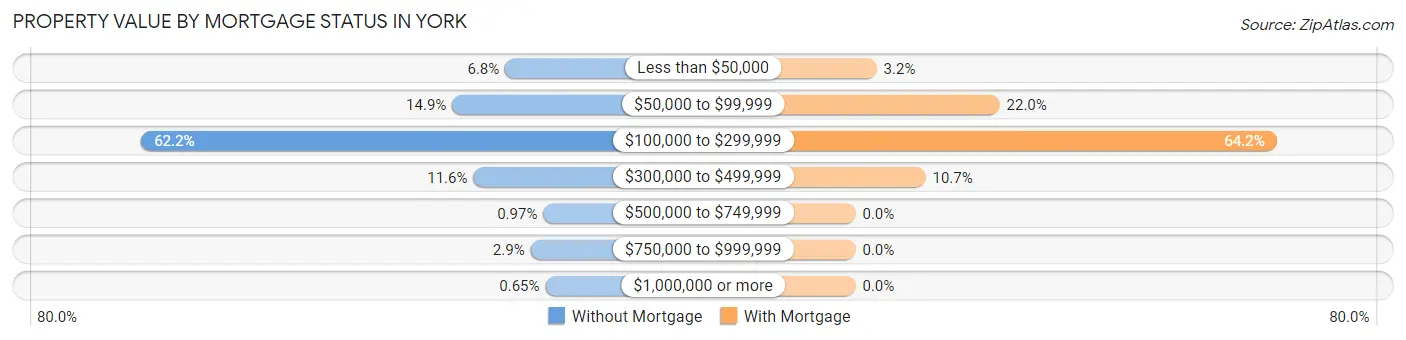
| Property Value | Without Mortgage | With Mortgage |
| Less than $50,000 | 63 (6.8%) | 42 (3.2%) |
| $50,000 to $99,999 | 138 (14.8%) | 286 (22.0%) |
| $100,000 to $299,999 | 578 (62.2%) | 836 (64.2%) |
| $300,000 to $499,999 | 108 (11.6%) | 139 (10.7%) |
| $500,000 to $749,999 | 9 (1.0%) | 0 (0.0%) |
| $750,000 to $999,999 | 27 (2.9%) | 0 (0.0%) |
| $1,000,000 or more | 6 (0.6%) | 0 (0.0%) |
| Total | 929 (100.0%) | 1,303 (100.0%) |
Household Income by Mortgage Status in York
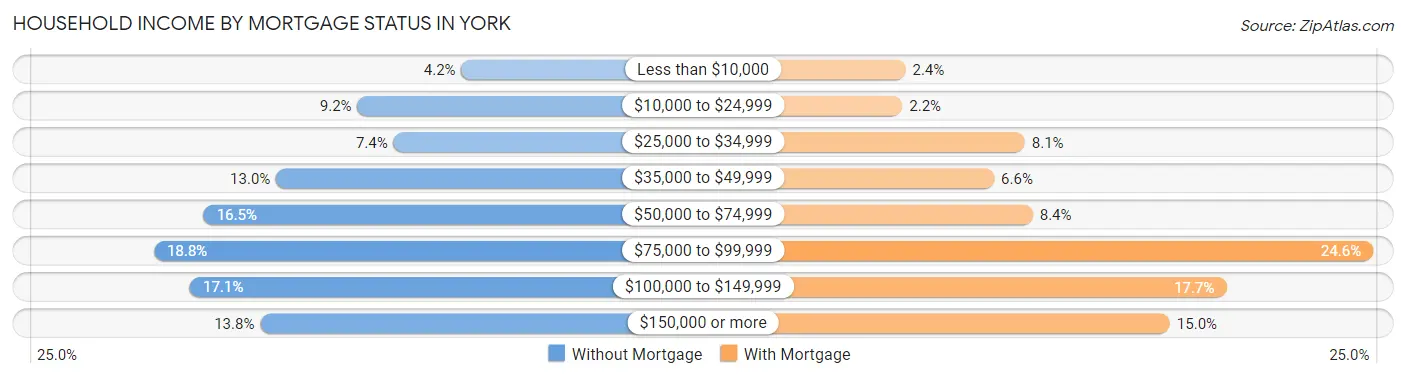
| Household Income | Without Mortgage | With Mortgage |
| Less than $10,000 | 39 (4.2%) | 31 (2.4%) |
| $10,000 to $24,999 | 85 (9.1%) | 29 (2.2%) |
| $25,000 to $34,999 | 69 (7.4%) | 105 (8.1%) |
| $35,000 to $49,999 | 121 (13.0%) | 86 (6.6%) |
| $50,000 to $74,999 | 153 (16.5%) | 110 (8.4%) |
| $75,000 to $99,999 | 175 (18.8%) | 321 (24.6%) |
| $100,000 to $149,999 | 159 (17.1%) | 230 (17.6%) |
| $150,000 or more | 128 (13.8%) | 195 (15.0%) |
| Total | 929 (100.0%) | 1,303 (100.0%) |
Property Value to Household Income Ratio in York
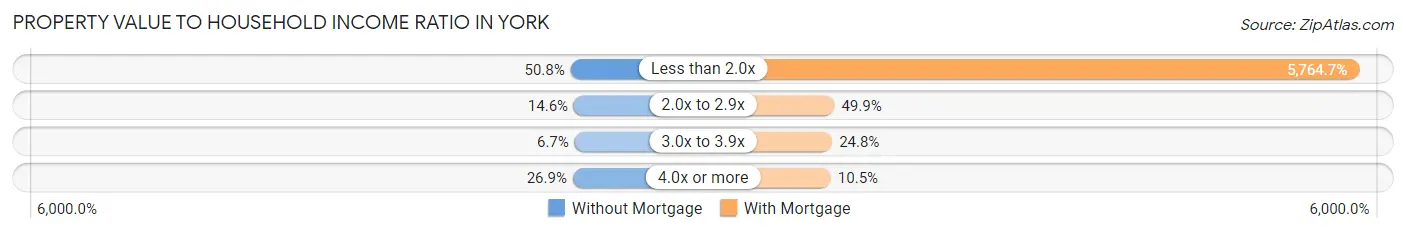
| Value-to-Income Ratio | Without Mortgage | With Mortgage |
| Less than 2.0x | 472 (50.8%) | 75,114 (5,764.7%) |
| 2.0x to 2.9x | 136 (14.6%) | 650 (49.9%) |
| 3.0x to 3.9x | 62 (6.7%) | 323 (24.8%) |
| 4.0x or more | 250 (26.9%) | 137 (10.5%) |
| Total | 929 (100.0%) | 1,303 (100.0%) |
Real Estate Taxes by Mortgage Status in York
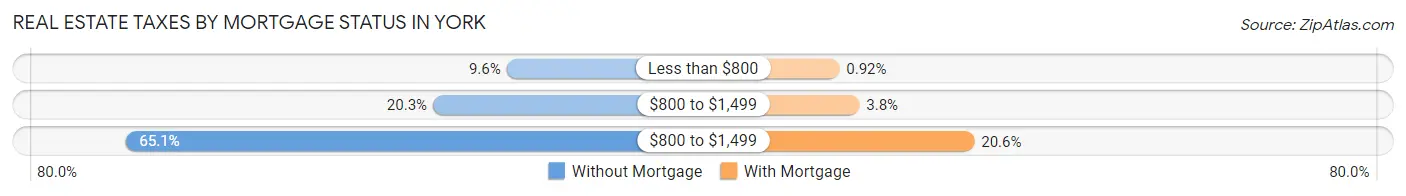
| Property Taxes | Without Mortgage | With Mortgage |
| Less than $800 | 89 (9.6%) | 12 (0.9%) |
| $800 to $1,499 | 189 (20.3%) | 50 (3.8%) |
| $800 to $1,499 | 605 (65.1%) | 269 (20.6%) |
| Total | 929 (100.0%) | 1,303 (100.0%) |
Health & Disability in York
Health Insurance Coverage by Age in York
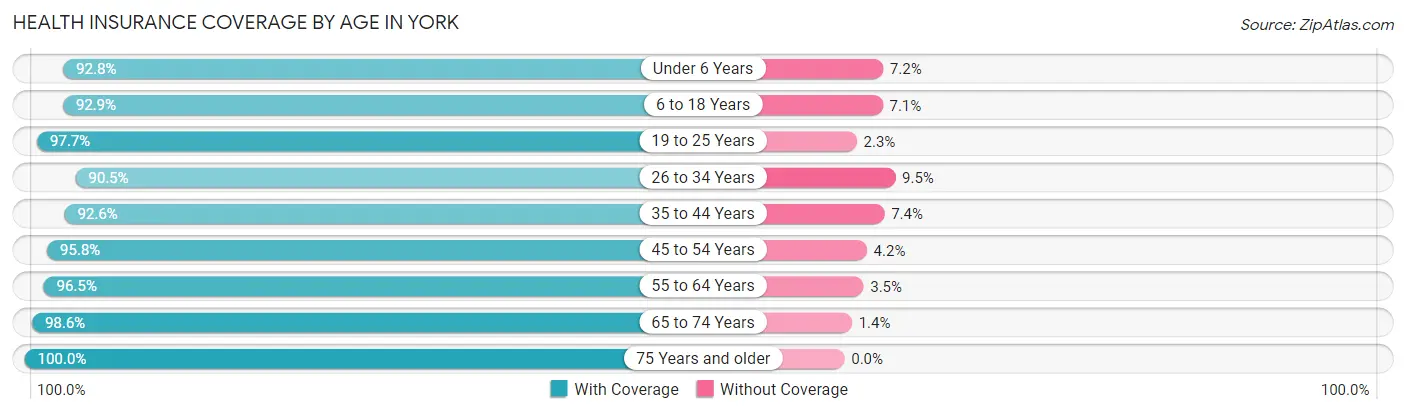
| Age Bracket | With Coverage | Without Coverage |
| Under 6 Years | 490 (92.8%) | 38 (7.2%) |
| 6 to 18 Years | 1,381 (92.9%) | 106 (7.1%) |
| 19 to 25 Years | 722 (97.7%) | 17 (2.3%) |
| 26 to 34 Years | 698 (90.5%) | 73 (9.5%) |
| 35 to 44 Years | 920 (92.6%) | 74 (7.4%) |
| 45 to 54 Years | 850 (95.8%) | 37 (4.2%) |
| 55 to 64 Years | 927 (96.5%) | 34 (3.5%) |
| 65 to 74 Years | 927 (98.6%) | 13 (1.4%) |
| 75 Years and older | 624 (100.0%) | 0 (0.0%) |
| Total | 7,539 (95.1%) | 392 (4.9%) |
Health Insurance Coverage by Citizenship Status in York
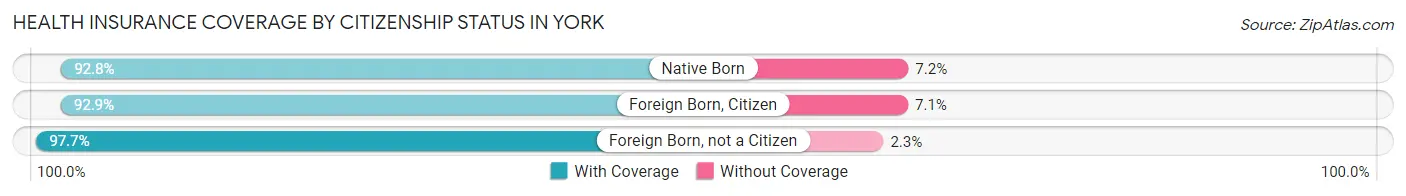
| Citizenship Status | With Coverage | Without Coverage |
| Native Born | 490 (92.8%) | 38 (7.2%) |
| Foreign Born, Citizen | 1,381 (92.9%) | 106 (7.1%) |
| Foreign Born, not a Citizen | 722 (97.7%) | 17 (2.3%) |
Health Insurance Coverage by Household Income in York
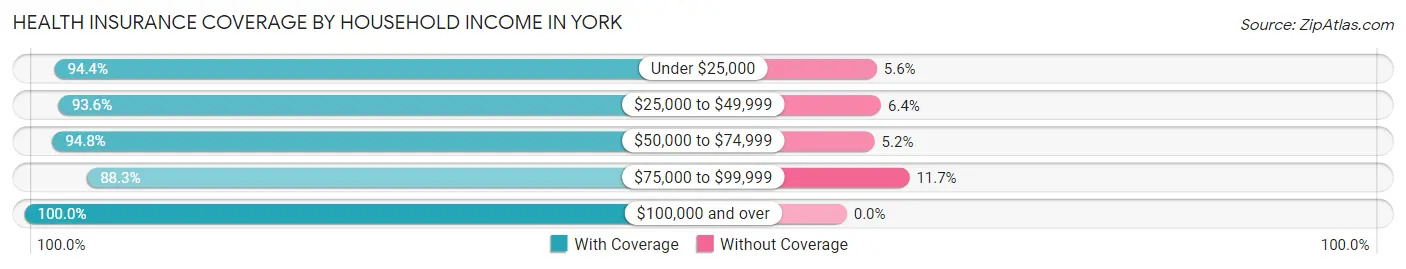
| Household Income | With Coverage | Without Coverage |
| Under $25,000 | 603 (94.4%) | 36 (5.6%) |
| $25,000 to $49,999 | 1,457 (93.6%) | 100 (6.4%) |
| $50,000 to $74,999 | 1,306 (94.8%) | 72 (5.2%) |
| $75,000 to $99,999 | 1,331 (88.3%) | 177 (11.7%) |
| $100,000 and over | 2,534 (100.0%) | 0 (0.0%) |
Public vs Private Health Insurance Coverage by Age in York
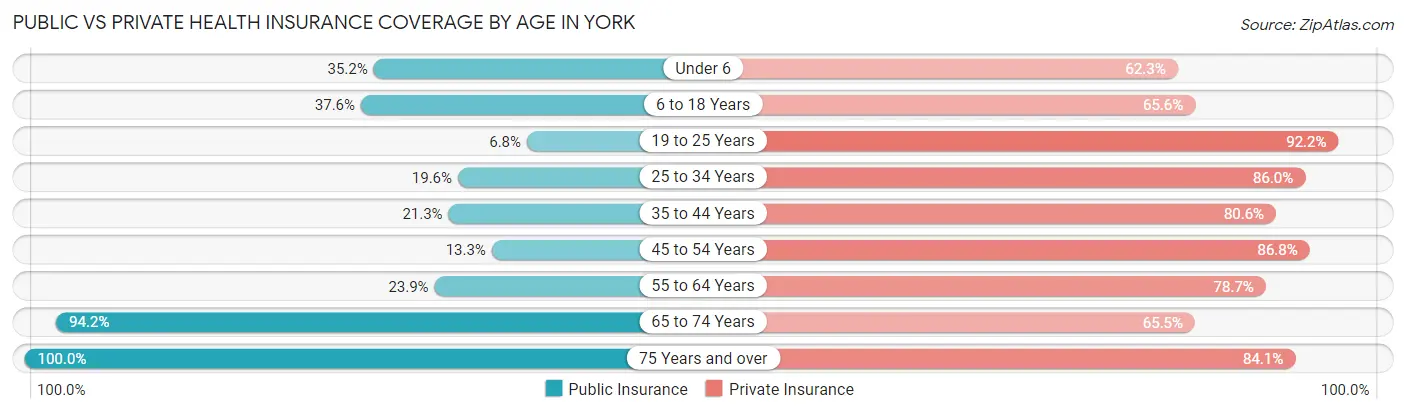
| Age Bracket | Public Insurance | Private Insurance |
| Under 6 | 186 (35.2%) | 329 (62.3%) |
| 6 to 18 Years | 559 (37.6%) | 975 (65.6%) |
| 19 to 25 Years | 50 (6.8%) | 681 (92.1%) |
| 25 to 34 Years | 151 (19.6%) | 663 (86.0%) |
| 35 to 44 Years | 212 (21.3%) | 801 (80.6%) |
| 45 to 54 Years | 118 (13.3%) | 770 (86.8%) |
| 55 to 64 Years | 230 (23.9%) | 756 (78.7%) |
| 65 to 74 Years | 885 (94.2%) | 616 (65.5%) |
| 75 Years and over | 624 (100.0%) | 525 (84.1%) |
| Total | 3,015 (38.0%) | 6,116 (77.1%) |
Disability Status by Sex by Age in York
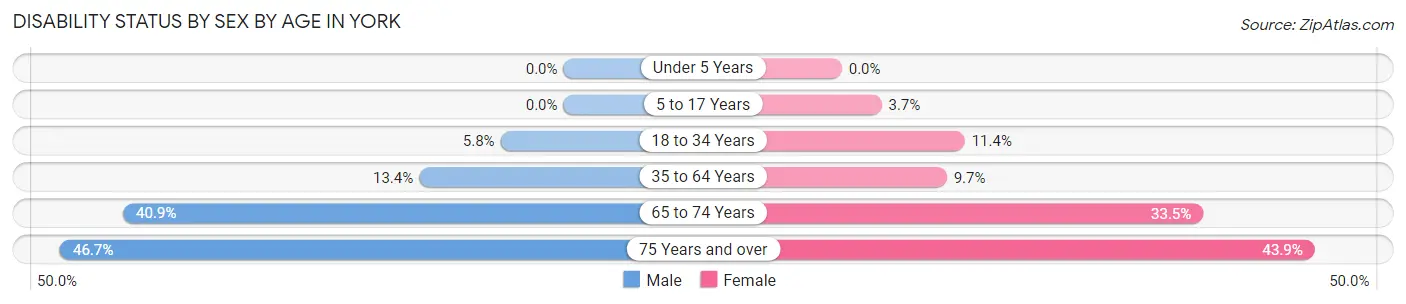
| Age Bracket | Male | Female |
| Under 5 Years | 0 (0.0%) | 0 (0.0%) |
| 5 to 17 Years | 0 (0.0%) | 22 (3.7%) |
| 18 to 34 Years | 47 (5.8%) | 96 (11.4%) |
| 35 to 64 Years | 195 (13.4%) | 135 (9.7%) |
| 65 to 74 Years | 172 (40.9%) | 174 (33.5%) |
| 75 Years and over | 135 (46.7%) | 147 (43.9%) |
Disability Class by Sex by Age in York
Disability Class: Hearing Difficulty
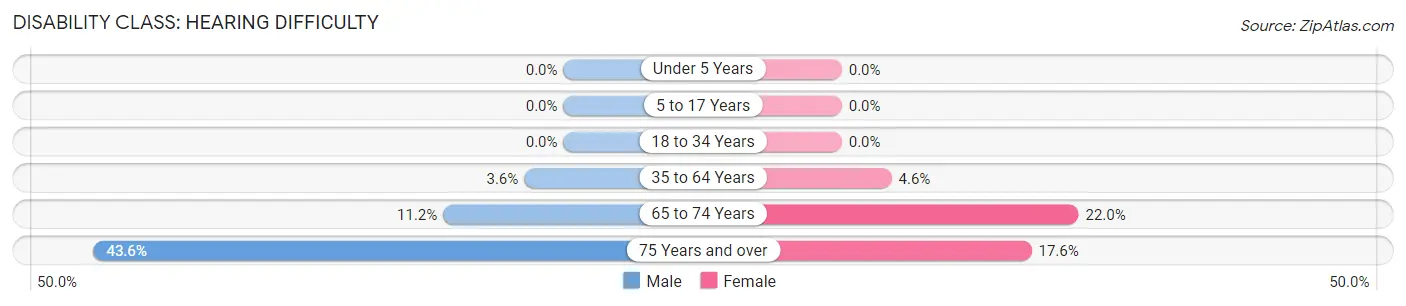
| Age Bracket | Male | Female |
| Under 5 Years | 0 (0.0%) | 0 (0.0%) |
| 5 to 17 Years | 0 (0.0%) | 0 (0.0%) |
| 18 to 34 Years | 0 (0.0%) | 0 (0.0%) |
| 35 to 64 Years | 53 (3.6%) | 64 (4.6%) |
| 65 to 74 Years | 47 (11.2%) | 114 (22.0%) |
| 75 Years and over | 126 (43.6%) | 59 (17.6%) |
Disability Class: Vision Difficulty
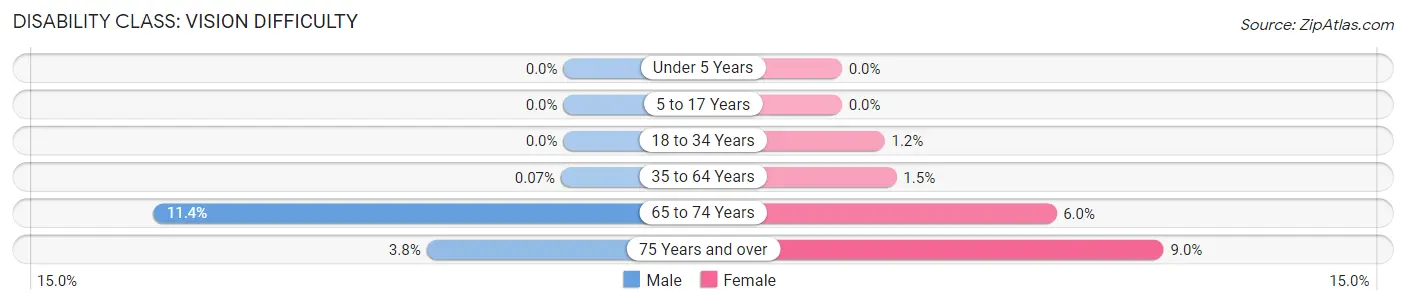
| Age Bracket | Male | Female |
| Under 5 Years | 0 (0.0%) | 0 (0.0%) |
| 5 to 17 Years | 0 (0.0%) | 0 (0.0%) |
| 18 to 34 Years | 0 (0.0%) | 10 (1.2%) |
| 35 to 64 Years | 1 (0.1%) | 21 (1.5%) |
| 65 to 74 Years | 48 (11.4%) | 31 (6.0%) |
| 75 Years and over | 11 (3.8%) | 30 (9.0%) |
Disability Class: Cognitive Difficulty
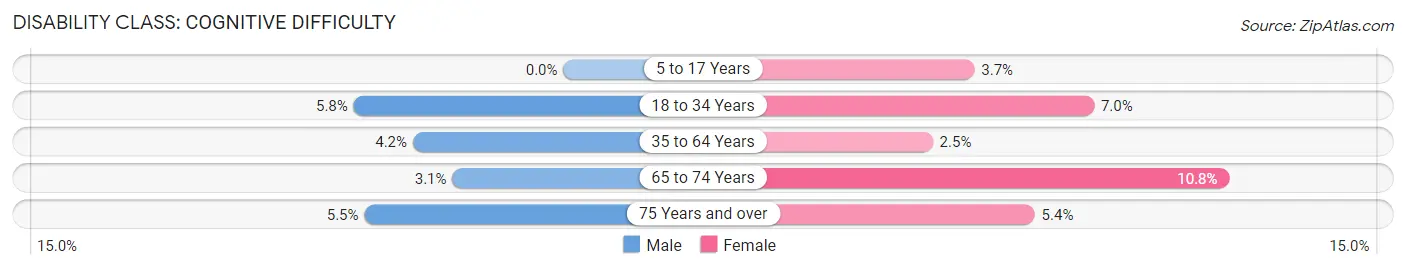
| Age Bracket | Male | Female |
| 5 to 17 Years | 0 (0.0%) | 22 (3.7%) |
| 18 to 34 Years | 47 (5.8%) | 59 (7.0%) |
| 35 to 64 Years | 61 (4.2%) | 35 (2.5%) |
| 65 to 74 Years | 13 (3.1%) | 56 (10.8%) |
| 75 Years and over | 16 (5.5%) | 18 (5.4%) |
Disability Class: Ambulatory Difficulty
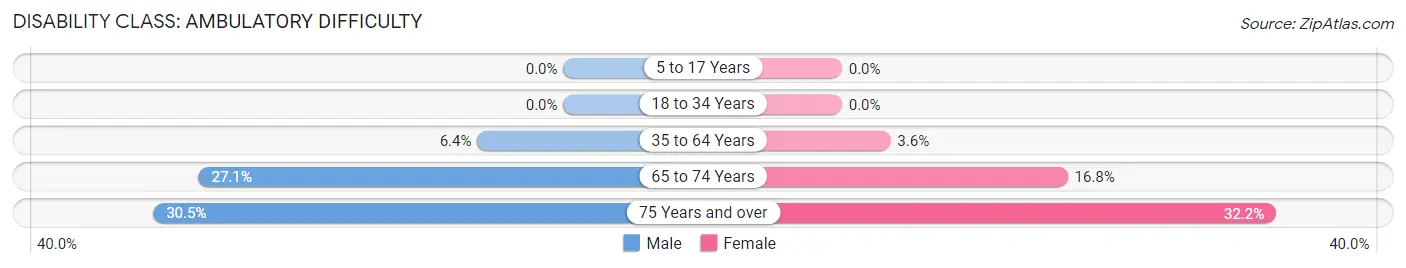
| Age Bracket | Male | Female |
| 5 to 17 Years | 0 (0.0%) | 0 (0.0%) |
| 18 to 34 Years | 0 (0.0%) | 0 (0.0%) |
| 35 to 64 Years | 93 (6.4%) | 50 (3.6%) |
| 65 to 74 Years | 114 (27.1%) | 87 (16.8%) |
| 75 Years and over | 88 (30.4%) | 108 (32.2%) |
Disability Class: Self-Care Difficulty
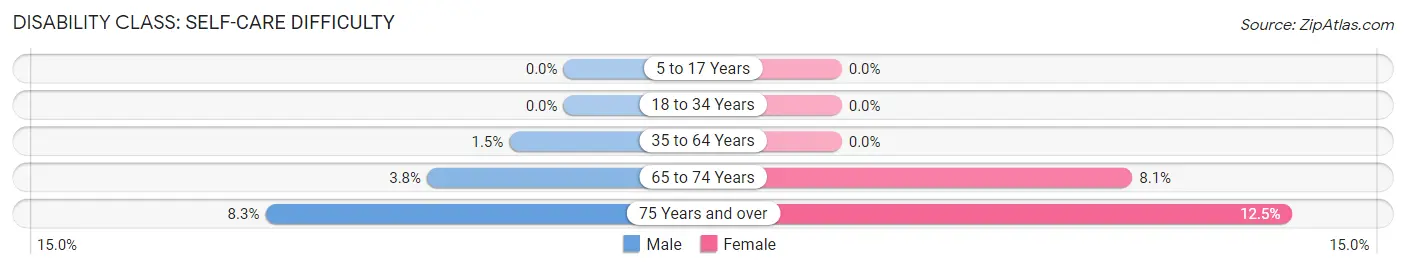
| Age Bracket | Male | Female |
| 5 to 17 Years | 0 (0.0%) | 0 (0.0%) |
| 18 to 34 Years | 0 (0.0%) | 0 (0.0%) |
| 35 to 64 Years | 22 (1.5%) | 0 (0.0%) |
| 65 to 74 Years | 16 (3.8%) | 42 (8.1%) |
| 75 Years and over | 24 (8.3%) | 42 (12.5%) |
Technology Access in York
Computing Device Access in York
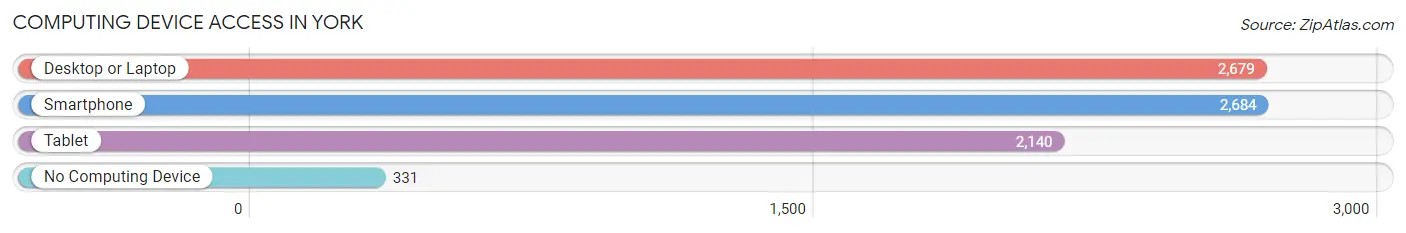
| Device Type | # Households | % Households |
| Desktop or Laptop | 2,679 | 81.6% |
| Smartphone | 2,684 | 81.7% |
| Tablet | 2,140 | 65.1% |
| No Computing Device | 331 | 10.1% |
| Total | 3,285 | 100.0% |
Internet Access in York
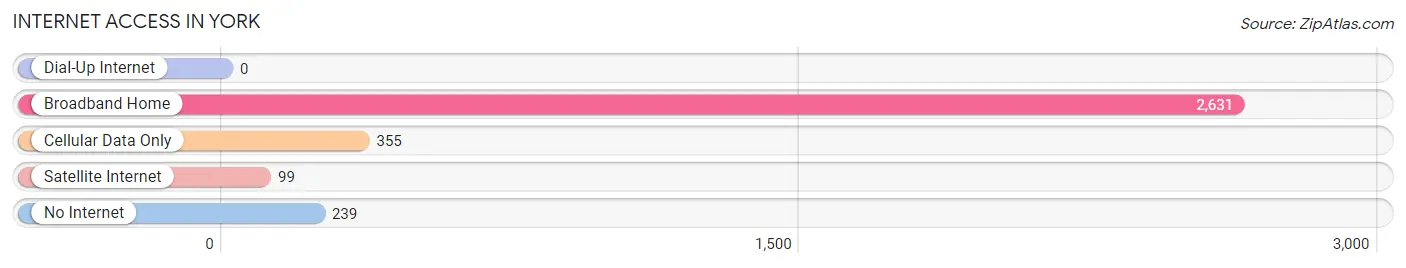
| Internet Type | # Households | % Households |
| Dial-Up Internet | 0 | 0.0% |
| Broadband Home | 2,631 | 80.1% |
| Cellular Data Only | 355 | 10.8% |
| Satellite Internet | 99 | 3.0% |
| No Internet | 239 | 7.3% |
| Total | 3,285 | 100.0% |
York Summary
York is a city located in the state of Nebraska in the United States of America. It is the county seat of York County and is located in the southeastern part of the state. The city has a population of 8,945 as of the 2020 census, making it the tenth-largest city in Nebraska.
Geography
York is located in southeastern Nebraska, in York County. It is situated on the banks of the Big Blue River, which flows through the city. The city is located at an elevation of 1,845 feet (562 m) above sea level. The city has a total area of 5.3 square miles (13.7 km2), of which 5.2 square miles (13.5 km2) is land and 0.1 square miles (0.2 km2) is water.
Climate
York has a humid continental climate, with hot summers and cold winters. The average annual temperature is 50.2 °F (10.1 °C). The average high temperature in July is 87.2 °F (30.7 °C), and the average low temperature in January is 11.2 °F (-11.6 °C). The average annual precipitation is 24.3 inches (617 mm).
Economy
York is a major agricultural center in Nebraska. The city is home to several large agricultural companies, including Cargill, J.R. Simplot, and Tyson Foods. The city is also home to several manufacturing companies, including York Manufacturing, York Plastics, and York Industries.
The city is also home to several retail stores, including Walmart, Target, and Kmart. The city is also home to several restaurants, including Applebee's, Chili's, and Olive Garden.
Demographics
As of the 2020 census, the population of York was 8,945. The racial makeup of the city was 91.2% White, 0.7% African American, 0.3% Native American, 0.7% Asian, 0.1% Pacific Islander, 5.2% from other races, and 1.9% from two or more races. Hispanic or Latino of any race were 11.2% of the population.
The median income for a household in York was $45,945, and the median income for a family was $54,945. The per capita income for the city was $21,945. About 8.2% of families and 10.2% of the population were below the poverty line, including 14.2% of those under age 18 and 8.2% of those age 65 or over.
Education
York is served by the York Public Schools district. The district operates four elementary schools, one middle school, and one high school. The city is also home to York College, a private liberal arts college.
Conclusion
York is a city located in southeastern Nebraska. It is the county seat of York County and has a population of 8,945 as of the 2020 census. The city is a major agricultural center and is home to several large agricultural companies, manufacturing companies, and retail stores. The city is served by the York Public Schools district and is home to York College.
Common Questions
What is Per Capita Income in York?
Per Capita income in York is $40,704.
What is the Median Family Income in York?
Median Family Income in York is $84,211.
What is the Median Household income in York?
Median Household Income in York is $68,794.
What is Income or Wage Gap in York?
Income or Wage Gap in York is 44.3%.
Women in York earn 55.7 cents for every dollar earned by a man.
What is Inequality or Gini Index in York?
Inequality or Gini Index in York is 0.50.
What is the Total Population of York?
Total Population of York is 8,101.
What is the Total Male Population of York?
Total Male Population of York is 4,129.
What is the Total Female Population of York?
Total Female Population of York is 3,972.
What is the Ratio of Males per 100 Females in York?
There are 103.95 Males per 100 Females in York.
What is the Ratio of Females per 100 Males in York?
There are 96.20 Females per 100 Males in York.
What is the Median Population Age in York?
Median Population Age in York is 40.3 Years.
What is the Average Family Size in York
Average Family Size in York is 2.9 People.
What is the Average Household Size in York
Average Household Size in York is 2.3 People.
How Large is the Labor Force in York?
There are 4,171 People in the Labor Forcein in York.
What is the Percentage of People in the Labor Force in York?
64.8% of People are in the Labor Force in York.
What is the Unemployment Rate in York?
Unemployment Rate in York is 3.9%.