Woodland Park, NE Map & Demographics
Woodland Park Map
Woodland Park Overview
$31,203
PER CAPITA INCOME
$86,042
AVG FAMILY INCOME
$68,977
AVG HOUSEHOLD INCOME
25.4%
WAGE / INCOME GAP [ % ]
74.6¢/ $1
WAGE / INCOME GAP [ $ ]
0.35
INEQUALITY / GINI INDEX
1,655
TOTAL POPULATION
902
MALE POPULATION
753
FEMALE POPULATION
119.79
MALES / 100 FEMALES
83.48
FEMALES / 100 MALES
36.2
MEDIAN AGE
3.3
AVG FAMILY SIZE
2.6
AVG HOUSEHOLD SIZE
974
LABOR FORCE [ PEOPLE ]
83.8%
PERCENT IN LABOR FORCE
0.7%
UNEMPLOYMENT RATE
Income in Woodland Park
Income Overview in Woodland Park
Per Capita Income in Woodland Park is $31,203, while median incomes of families and households are $86,042 and $68,977 respectively.
| Characteristic | Number | Measure |
| Per Capita Income | 1,655 | $31,203 |
| Median Family Income | 420 | $86,042 |
| Mean Family Income | 420 | $101,907 |
| Median Household Income | 629 | $68,977 |
| Mean Household Income | 629 | $84,763 |
| Income Deficit | 420 | $0 |
| Wage / Income Gap (%) | 1,655 | 25.44% |
| Wage / Income Gap ($) | 1,655 | 74.56¢ per $1 |
| Gini / Inequality Index | 1,655 | 0.35 |
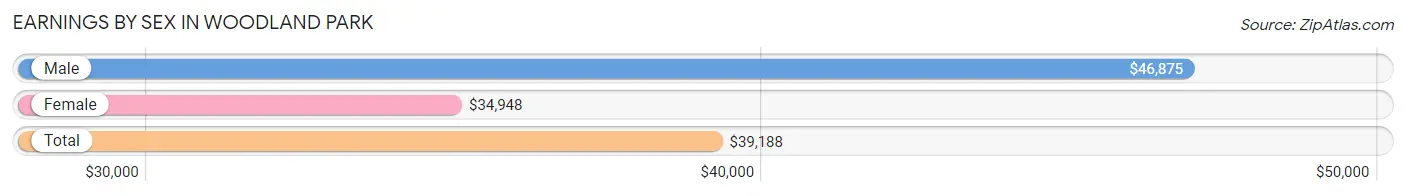
Earnings by Sex in Woodland Park
Average Earnings in Woodland Park are $39,188, $46,875 for men and $34,948 for women, a difference of 25.4%.
| Sex | Number | Average Earnings |
| Male | 541 (55.1%) | $46,875 |
| Female | 441 (44.9%) | $34,948 |
| Total | 982 (100.0%) | $39,188 |
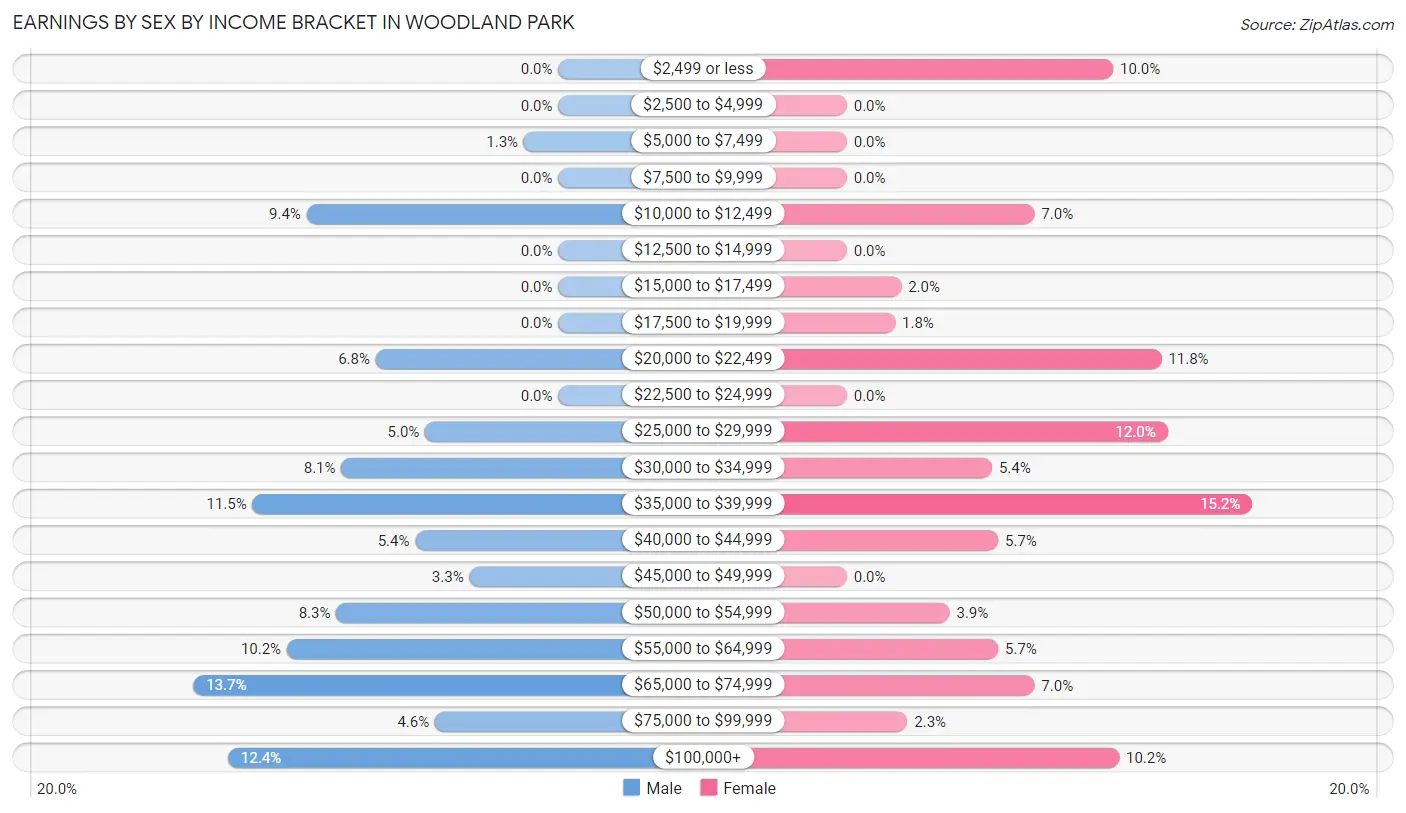
Earnings by Sex by Income Bracket in Woodland Park
The most common earnings brackets in Woodland Park are $65,000 to $74,999 for men (74 | 13.7%) and $35,000 to $39,999 for women (67 | 15.2%).
| Income | Male | Female |
| $2,499 or less | 0 (0.0%) | 44 (10.0%) |
| $2,500 to $4,999 | 0 (0.0%) | 0 (0.0%) |
| $5,000 to $7,499 | 7 (1.3%) | 0 (0.0%) |
| $7,500 to $9,999 | 0 (0.0%) | 0 (0.0%) |
| $10,000 to $12,499 | 51 (9.4%) | 31 (7.0%) |
| $12,500 to $14,999 | 0 (0.0%) | 0 (0.0%) |
| $15,000 to $17,499 | 0 (0.0%) | 9 (2.0%) |
| $17,500 to $19,999 | 0 (0.0%) | 8 (1.8%) |
| $20,000 to $22,499 | 37 (6.8%) | 52 (11.8%) |
| $22,500 to $24,999 | 0 (0.0%) | 0 (0.0%) |
| $25,000 to $29,999 | 27 (5.0%) | 53 (12.0%) |
| $30,000 to $34,999 | 44 (8.1%) | 24 (5.4%) |
| $35,000 to $39,999 | 62 (11.5%) | 67 (15.2%) |
| $40,000 to $44,999 | 29 (5.4%) | 25 (5.7%) |
| $45,000 to $49,999 | 18 (3.3%) | 0 (0.0%) |
| $50,000 to $54,999 | 45 (8.3%) | 17 (3.8%) |
| $55,000 to $64,999 | 55 (10.2%) | 25 (5.7%) |
| $65,000 to $74,999 | 74 (13.7%) | 31 (7.0%) |
| $75,000 to $99,999 | 25 (4.6%) | 10 (2.3%) |
| $100,000+ | 67 (12.4%) | 45 (10.2%) |
| Total | 541 (100.0%) | 441 (100.0%) |
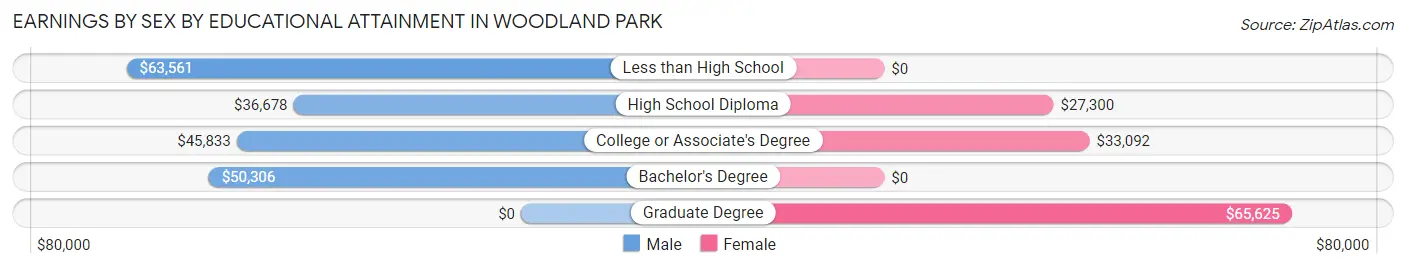
Earnings by Sex by Educational Attainment in Woodland Park
Average earnings in Woodland Park are $50,889 for men and $37,665 for women, a difference of 26.0%. Men with an educational attainment of less than high school enjoy the highest average annual earnings of $63,561, while those with high school diploma education earn the least with $36,678. Women with an educational attainment of graduate degree earn the most with the average annual earnings of $65,625, while those with high school diploma education have the smallest earnings of $27,300.
| Educational Attainment | Male Income | Female Income |
| Less than High School | $63,561 | $0 |
| High School Diploma | $36,678 | $27,300 |
| College or Associate's Degree | $45,833 | $33,092 |
| Bachelor's Degree | $50,306 | $0 |
| Graduate Degree | - | - |
| Total | $50,889 | $37,665 |
Family Income in Woodland Park
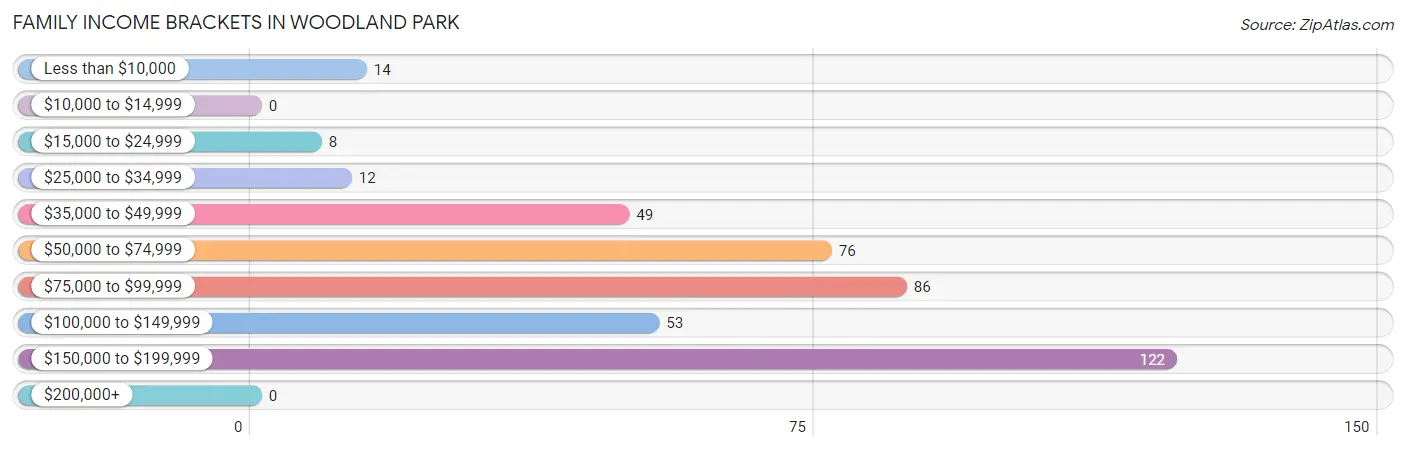
Family Income Brackets in Woodland Park
According to the Woodland Park family income data, there are 122 families falling into the $150,000 to $199,999 income range, which is the most common income bracket and makes up 29.0% of all families.
| Income Bracket | # Families | % Families |
| Less than $10,000 | 14 | 3.3% |
| $10,000 to $14,999 | 0 | 0.0% |
| $15,000 to $24,999 | 8 | 1.9% |
| $25,000 to $34,999 | 12 | 2.9% |
| $35,000 to $49,999 | 49 | 11.7% |
| $50,000 to $74,999 | 76 | 18.1% |
| $75,000 to $99,999 | 86 | 20.5% |
| $100,000 to $149,999 | 53 | 12.6% |
| $150,000 to $199,999 | 122 | 29.0% |
| $200,000+ | 0 | 0.0% |
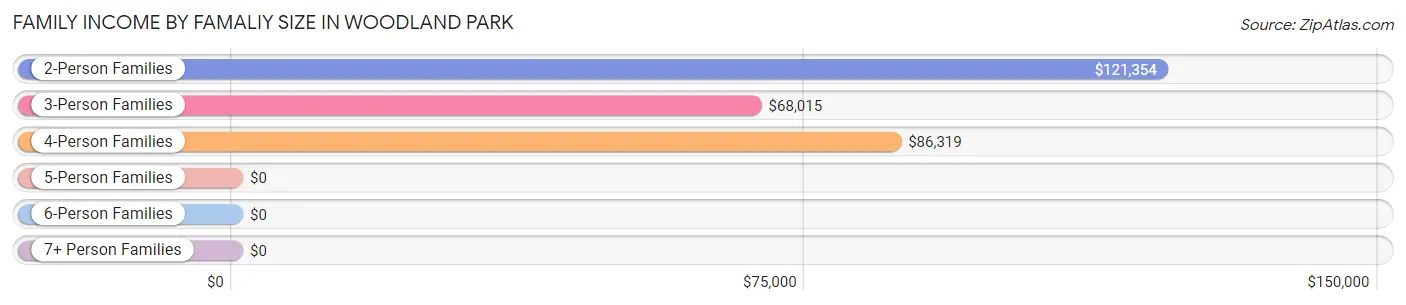
Family Income by Famaliy Size in Woodland Park
2-person families (167 | 39.8%) account for the highest median family income in Woodland Park with $121,354 per family, while 2-person families (167 | 39.8%) have the highest median income of $60,677 per family member.
| Income Bracket | # Families | Median Income |
| 2-Person Families | 167 (39.8%) | $121,354 |
| 3-Person Families | 95 (22.6%) | $68,015 |
| 4-Person Families | 118 (28.1%) | $86,319 |
| 5-Person Families | 12 (2.9%) | $0 |
| 6-Person Families | 9 (2.1%) | $0 |
| 7+ Person Families | 19 (4.5%) | $0 |
| Total | 420 (100.0%) | $86,042 |
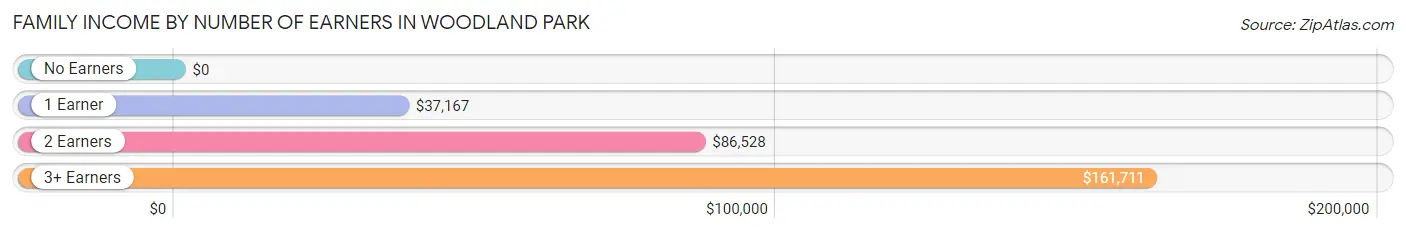
Family Income by Number of Earners in Woodland Park
| Number of Earners | # Families | Median Income |
| No Earners | 28 (6.7%) | $0 |
| 1 Earner | 50 (11.9%) | $37,167 |
| 2 Earners | 296 (70.5%) | $86,528 |
| 3+ Earners | 46 (11.0%) | $161,711 |
| Total | 420 (100.0%) | $86,042 |
Household Income in Woodland Park
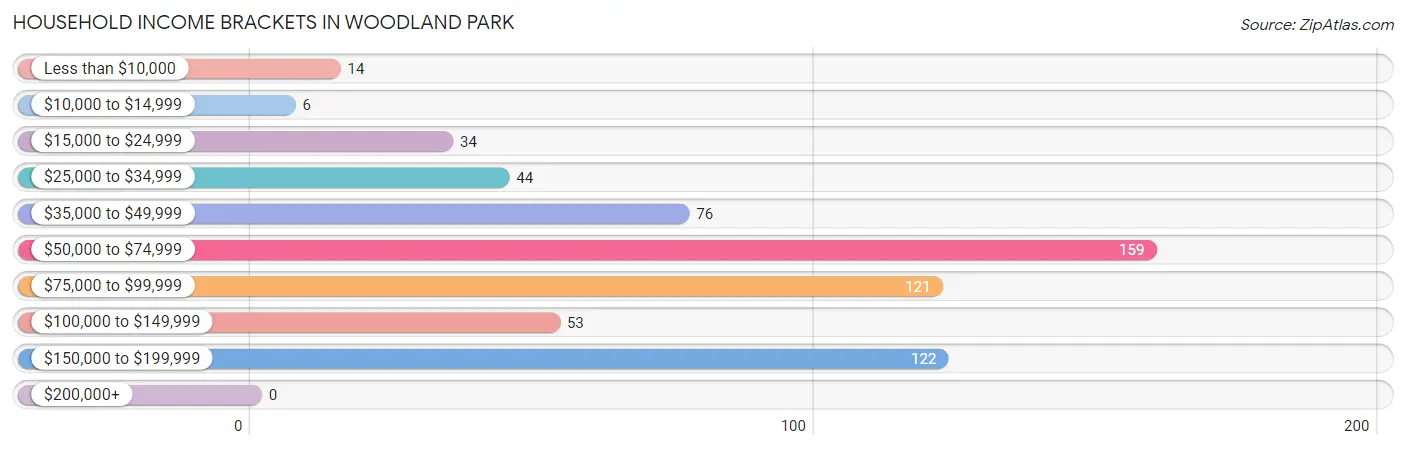
Household Income Brackets in Woodland Park
With 159 households falling in the category, the $50,000 to $74,999 income range is the most frequent in Woodland Park, accounting for 25.3% of all households.
| Income Bracket | # Households | % Households |
| Less than $10,000 | 14 | 2.2% |
| $10,000 to $14,999 | 6 | 1.0% |
| $15,000 to $24,999 | 34 | 5.4% |
| $25,000 to $34,999 | 44 | 7.0% |
| $35,000 to $49,999 | 76 | 12.1% |
| $50,000 to $74,999 | 159 | 25.3% |
| $75,000 to $99,999 | 121 | 19.2% |
| $100,000 to $149,999 | 53 | 8.4% |
| $150,000 to $199,999 | 122 | 19.4% |
| $200,000+ | 0 | 0.0% |
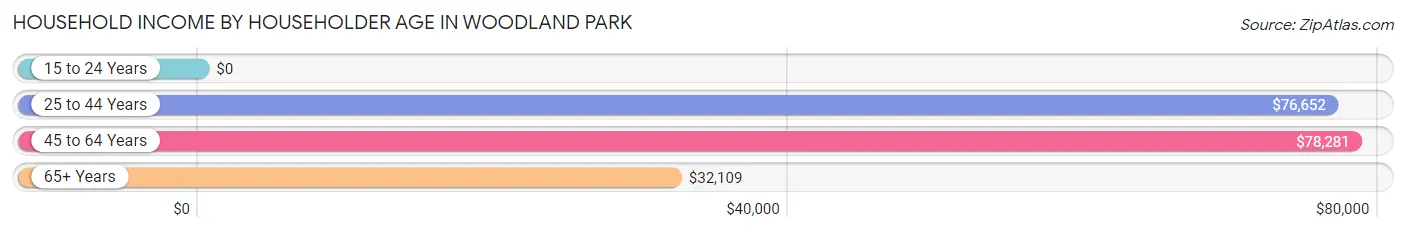
Household Income by Householder Age in Woodland Park
The median household income in Woodland Park is $68,977, with the highest median household income of $78,281 found in the 45 to 64 years age bracket for the primary householder. A total of 273 households (43.4%) fall into this category. Meanwhile, the 15 to 24 years age bracket for the primary householder has the lowest median household income of $0, with 36 households (5.7%) in this group.
| Income Bracket | # Households | Median Income |
| 15 to 24 Years | 36 (5.7%) | $0 |
| 25 to 44 Years | 185 (29.4%) | $76,652 |
| 45 to 64 Years | 273 (43.4%) | $78,281 |
| 65+ Years | 135 (21.5%) | $32,109 |
| Total | 629 (100.0%) | $68,977 |
Poverty in Woodland Park
Income Below Poverty by Sex and Age in Woodland Park
With 5.9% poverty level for males and 9.2% for females among the residents of Woodland Park, 75 year old and over males and 5 year old females are the most vulnerable to poverty, with 14 males (66.7%) and 23 females (82.1%) in their respective age groups living below the poverty level.
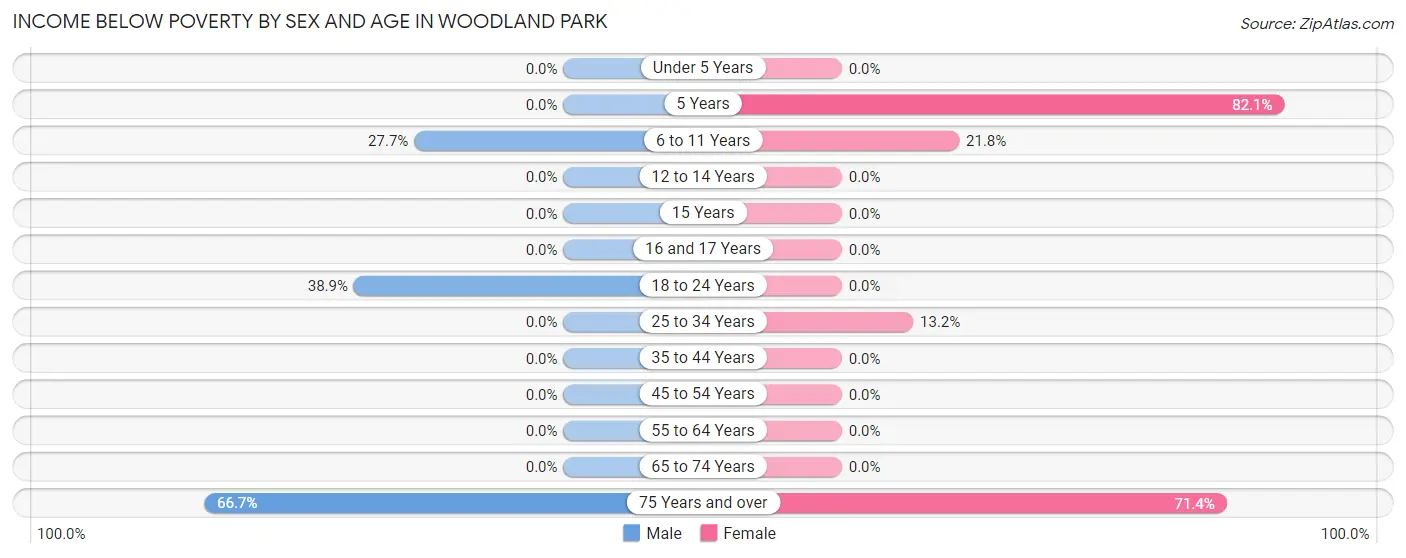
| Age Bracket | Male | Female |
| Under 5 Years | 0 (0.0%) | 0 (0.0%) |
| 5 Years | 0 (0.0%) | 23 (82.1%) |
| 6 to 11 Years | 18 (27.7%) | 22 (21.8%) |
| 12 to 14 Years | 0 (0.0%) | 0 (0.0%) |
| 15 Years | 0 (0.0%) | 0 (0.0%) |
| 16 and 17 Years | 0 (0.0%) | 0 (0.0%) |
| 18 to 24 Years | 21 (38.9%) | 0 (0.0%) |
| 25 to 34 Years | 0 (0.0%) | 9 (13.2%) |
| 35 to 44 Years | 0 (0.0%) | 0 (0.0%) |
| 45 to 54 Years | 0 (0.0%) | 0 (0.0%) |
| 55 to 64 Years | 0 (0.0%) | 0 (0.0%) |
| 65 to 74 Years | 0 (0.0%) | 0 (0.0%) |
| 75 Years and over | 14 (66.7%) | 15 (71.4%) |
| Total | 53 (5.9%) | 69 (9.2%) |
Income Above Poverty by Sex and Age in Woodland Park
According to the poverty statistics in Woodland Park, males aged under 5 years and females aged under 5 years are the age groups that are most secure financially, with 100.0% of males and 100.0% of females in these age groups living above the poverty line.
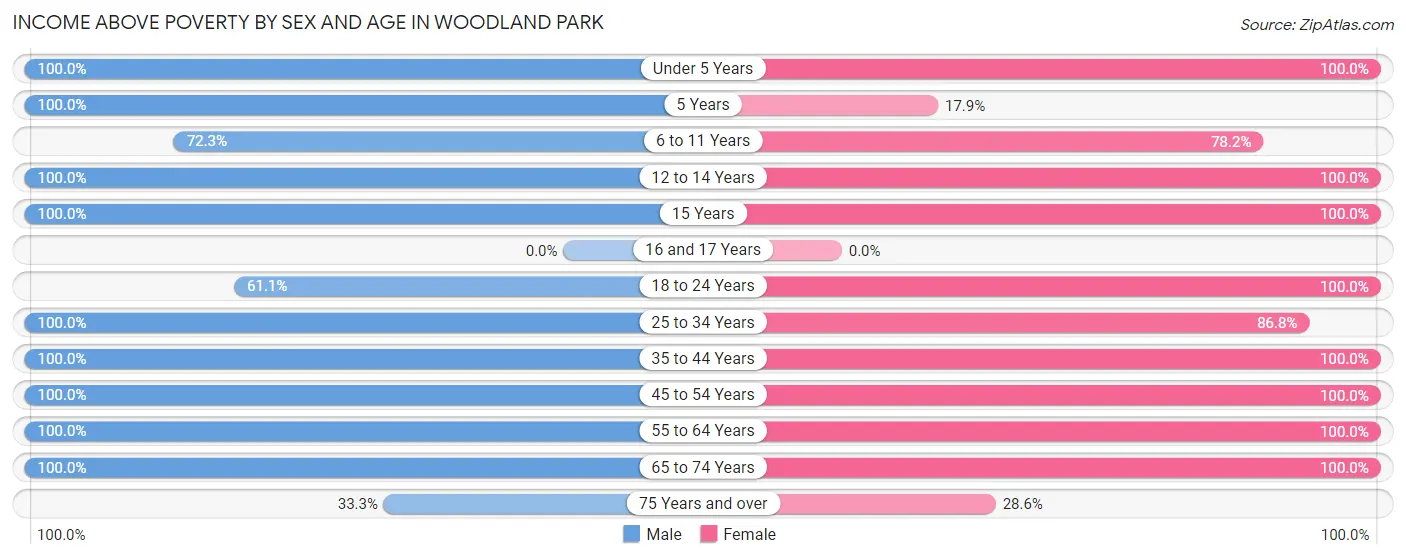
| Age Bracket | Male | Female |
| Under 5 Years | 83 (100.0%) | 101 (100.0%) |
| 5 Years | 50 (100.0%) | 5 (17.9%) |
| 6 to 11 Years | 47 (72.3%) | 79 (78.2%) |
| 12 to 14 Years | 8 (100.0%) | 6 (100.0%) |
| 15 Years | 42 (100.0%) | 9 (100.0%) |
| 16 and 17 Years | 0 (0.0%) | 0 (0.0%) |
| 18 to 24 Years | 33 (61.1%) | 36 (100.0%) |
| 25 to 34 Years | 86 (100.0%) | 59 (86.8%) |
| 35 to 44 Years | 176 (100.0%) | 82 (100.0%) |
| 45 to 54 Years | 114 (100.0%) | 67 (100.0%) |
| 55 to 64 Years | 146 (100.0%) | 151 (100.0%) |
| 65 to 74 Years | 56 (100.0%) | 83 (100.0%) |
| 75 Years and over | 7 (33.3%) | 6 (28.6%) |
| Total | 848 (94.1%) | 684 (90.8%) |
Income Below Poverty Among Married-Couple Families in Woodland Park
The poverty statistics for married-couple families in Woodland Park show that 3.7% or 14 of the total 379 families live below the poverty line. Families with no children have the highest poverty rate of 7.2%, comprising of 14 families. On the other hand, families with 1 or 2 children have the lowest poverty rate of 0.0%, which includes 0 families.
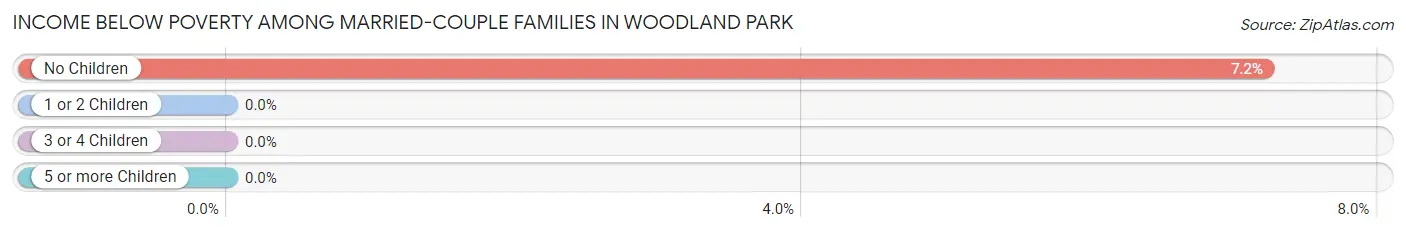
| Children | Above Poverty | Below Poverty |
| No Children | 180 (92.8%) | 14 (7.2%) |
| 1 or 2 Children | 154 (100.0%) | 0 (0.0%) |
| 3 or 4 Children | 31 (100.0%) | 0 (0.0%) |
| 5 or more Children | 0 (0.0%) | 0 (0.0%) |
| Total | 365 (96.3%) | 14 (3.7%) |
Income Below Poverty Among Single-Parent Households in Woodland Park
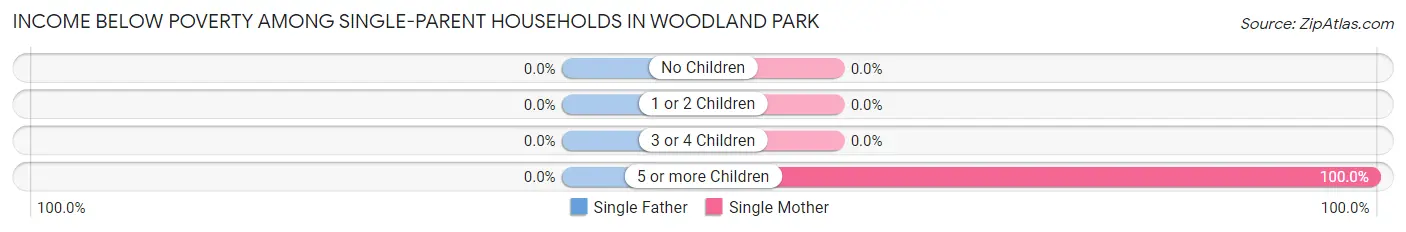
| Children | Single Father | Single Mother |
| No Children | 0 (0.0%) | 0 (0.0%) |
| 1 or 2 Children | 0 (0.0%) | 0 (0.0%) |
| 3 or 4 Children | 0 (0.0%) | 0 (0.0%) |
| 5 or more Children | 0 (0.0%) | 9 (100.0%) |
| Total | 0 (0.0%) | 9 (22.0%) |
Income Below Poverty Among Married-Couple vs Single-Parent Households in Woodland Park
The poverty data for Woodland Park shows that 14 of the married-couple family households (3.7%) and 9 of the single-parent households (22.0%) are living below the poverty level. Within the married-couple family households, those with no children have the highest poverty rate, with 14 households (7.2%) falling below the poverty line. Among the single-parent households, those with 5 or more children have the highest poverty rate, with 9 household (100.0%) living below poverty.
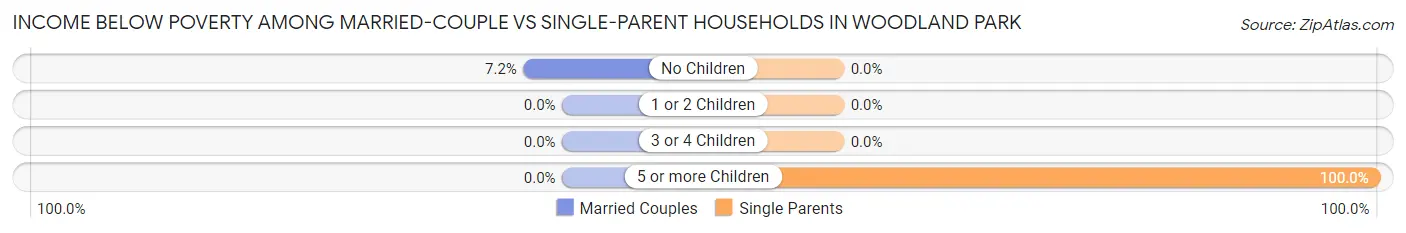
| Children | Married-Couple Families | Single-Parent Households |
| No Children | 14 (7.2%) | 0 (0.0%) |
| 1 or 2 Children | 0 (0.0%) | 0 (0.0%) |
| 3 or 4 Children | 0 (0.0%) | 0 (0.0%) |
| 5 or more Children | 0 (0.0%) | 9 (100.0%) |
| Total | 14 (3.7%) | 9 (22.0%) |
Race in Woodland Park
The most populous races in Woodland Park are White / Caucasian (1,497 | 90.4%), Hispanic or Latino (247 | 14.9%), and Some other Race (158 | 9.6%).
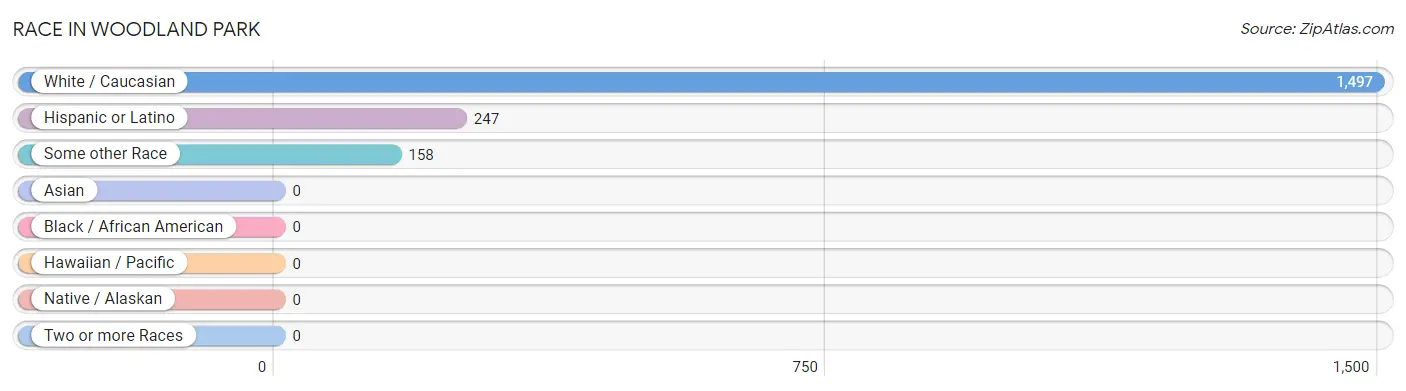
| Race | # Population | % Population |
| Asian | 0 | 0.0% |
| Black / African American | 0 | 0.0% |
| Hawaiian / Pacific | 0 | 0.0% |
| Hispanic or Latino | 247 | 14.9% |
| Native / Alaskan | 0 | 0.0% |
| White / Caucasian | 1,497 | 90.4% |
| Two or more Races | 0 | 0.0% |
| Some other Race | 158 | 9.6% |
| Total | 1,655 | 100.0% |
Ancestry in Woodland Park
The most populous ancestries reported in Woodland Park are German (533 | 32.2%), Mexican (227 | 13.7%), Polish (134 | 8.1%), American (124 | 7.5%), and Swedish (113 | 6.8%), together accounting for 68.3% of all Woodland Park residents.
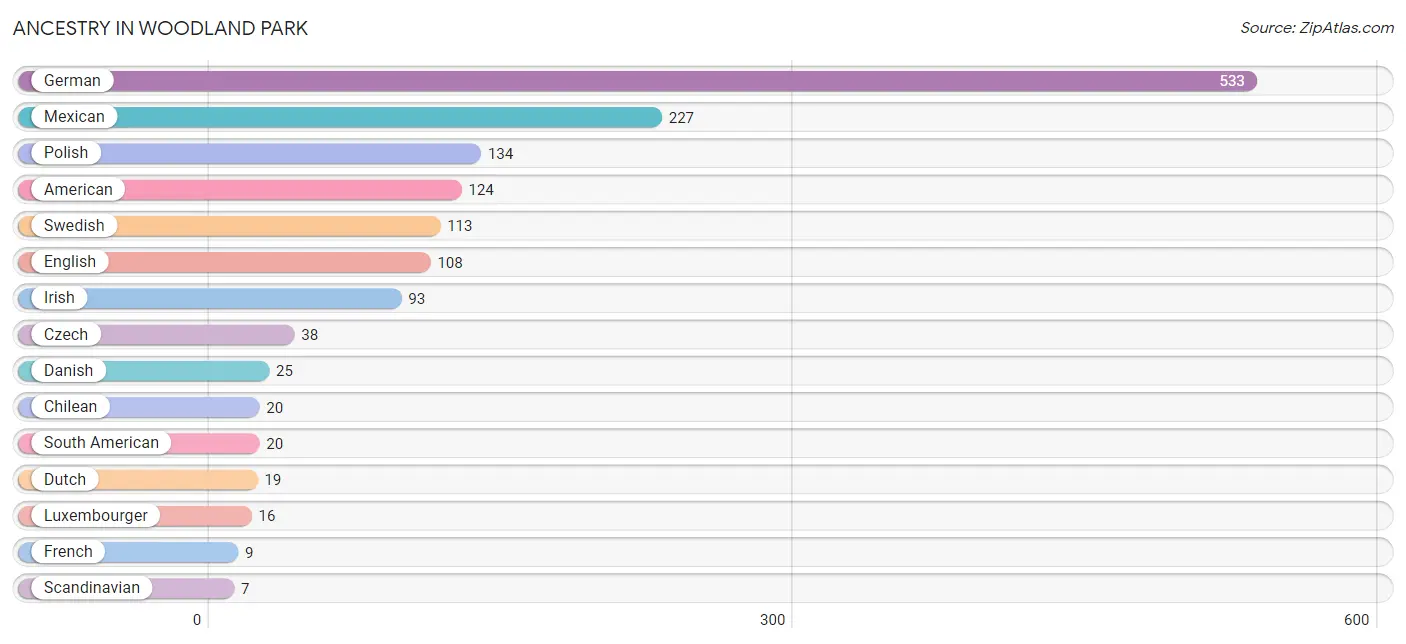
| Ancestry | # Population | % Population |
| American | 124 | 7.5% |
| British | 6 | 0.4% |
| Chilean | 20 | 1.2% |
| Czech | 38 | 2.3% |
| Danish | 25 | 1.5% |
| Dutch | 19 | 1.1% |
| English | 108 | 6.5% |
| French | 9 | 0.5% |
| German | 533 | 32.2% |
| Icelander | 5 | 0.3% |
| Irish | 93 | 5.6% |
| Italian | 6 | 0.4% |
| Luxembourger | 16 | 1.0% |
| Mexican | 227 | 13.7% |
| Norwegian | 4 | 0.2% |
| Polish | 134 | 8.1% |
| Scandinavian | 7 | 0.4% |
| South American | 20 | 1.2% |
| Swedish | 113 | 6.8% |
| Swiss | 7 | 0.4% |
| Yugoslavian | 1 | 0.1% | View All 21 Rows |
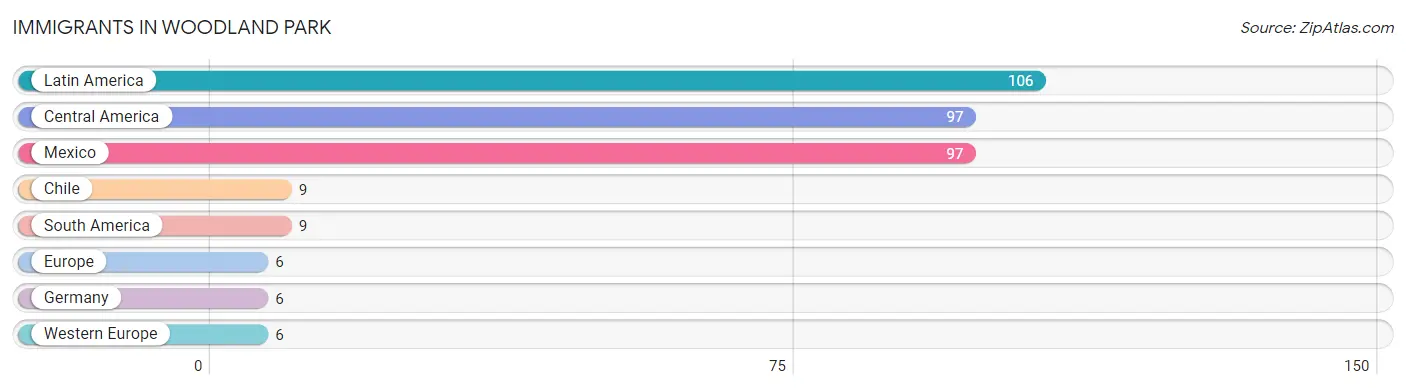
Immigrants in Woodland Park
The most numerous immigrant groups reported in Woodland Park came from Latin America (106 | 6.4%), Central America (97 | 5.9%), Mexico (97 | 5.9%), Chile (9 | 0.5%), and South America (9 | 0.5%), together accounting for 19.2% of all Woodland Park residents.
| Immigration Origin | # Population | % Population |
| Central America | 97 | 5.9% |
| Chile | 9 | 0.5% |
| Europe | 6 | 0.4% |
| Germany | 6 | 0.4% |
| Latin America | 106 | 6.4% |
| Mexico | 97 | 5.9% |
| South America | 9 | 0.5% |
| Western Europe | 6 | 0.4% | View All 8 Rows |
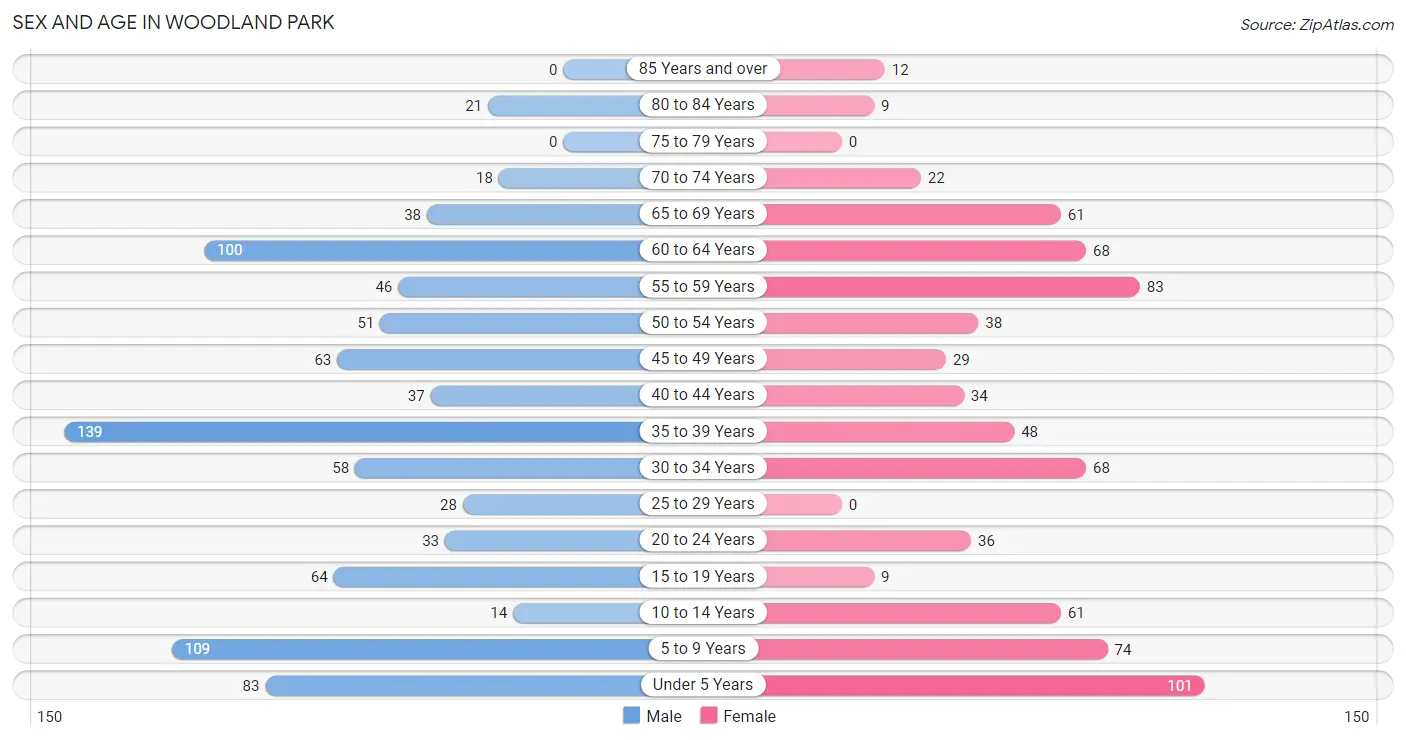
Sex and Age in Woodland Park
Sex and Age in Woodland Park
The most populous age groups in Woodland Park are 35 to 39 Years (139 | 15.4%) for men and Under 5 Years (101 | 13.4%) for women.
| Age Bracket | Male | Female |
| Under 5 Years | 83 (9.2%) | 101 (13.4%) |
| 5 to 9 Years | 109 (12.1%) | 74 (9.8%) |
| 10 to 14 Years | 14 (1.5%) | 61 (8.1%) |
| 15 to 19 Years | 64 (7.1%) | 9 (1.2%) |
| 20 to 24 Years | 33 (3.7%) | 36 (4.8%) |
| 25 to 29 Years | 28 (3.1%) | 0 (0.0%) |
| 30 to 34 Years | 58 (6.4%) | 68 (9.0%) |
| 35 to 39 Years | 139 (15.4%) | 48 (6.4%) |
| 40 to 44 Years | 37 (4.1%) | 34 (4.5%) |
| 45 to 49 Years | 63 (7.0%) | 29 (3.8%) |
| 50 to 54 Years | 51 (5.7%) | 38 (5.1%) |
| 55 to 59 Years | 46 (5.1%) | 83 (11.0%) |
| 60 to 64 Years | 100 (11.1%) | 68 (9.0%) |
| 65 to 69 Years | 38 (4.2%) | 61 (8.1%) |
| 70 to 74 Years | 18 (2.0%) | 22 (2.9%) |
| 75 to 79 Years | 0 (0.0%) | 0 (0.0%) |
| 80 to 84 Years | 21 (2.3%) | 9 (1.2%) |
| 85 Years and over | 0 (0.0%) | 12 (1.6%) |
| Total | 902 (100.0%) | 753 (100.0%) |
Families and Households in Woodland Park
Median Family Size in Woodland Park
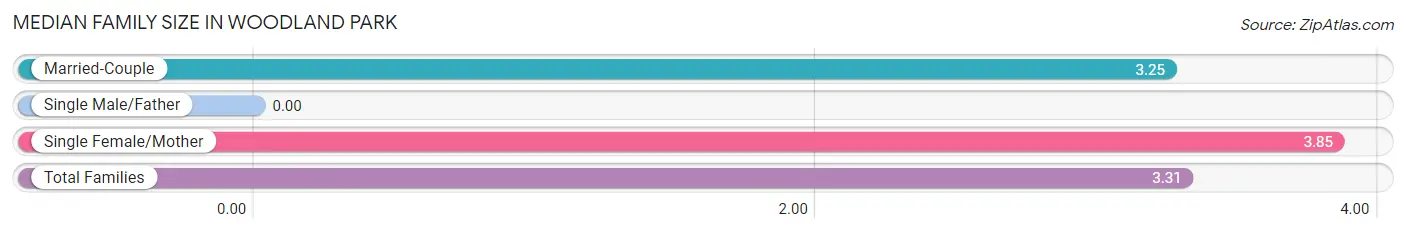
| Family Type | # Families | Family Size |
| Married-Couple | 379 (90.2%) | 3.25 |
| Single Male/Father | 0 (0.0%) | - |
| Single Female/Mother | 41 (9.8%) | 3.85 |
| Total Families | 420 (100.0%) | 3.31 |
Median Household Size in Woodland Park
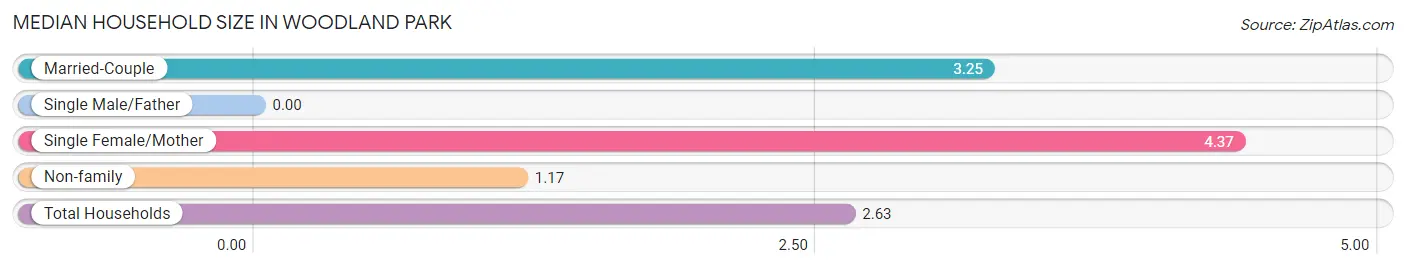
| Household Type | # Households | Household Size |
| Married-Couple | 379 (60.3%) | 3.25 |
| Single Male/Father | 0 (0.0%) | - |
| Single Female/Mother | 41 (6.5%) | 4.37 |
| Non-family | 209 (33.2%) | 1.17 |
| Total Households | 629 (100.0%) | 2.63 |
Household Size by Marriage Status in Woodland Park
Out of a total of 629 households in Woodland Park, 420 (66.8%) are family households, while 209 (33.2%) are nonfamily households. The most numerous type of family households are 2-person households, comprising 167, and the most common type of nonfamily households are 1-person households, comprising 192.
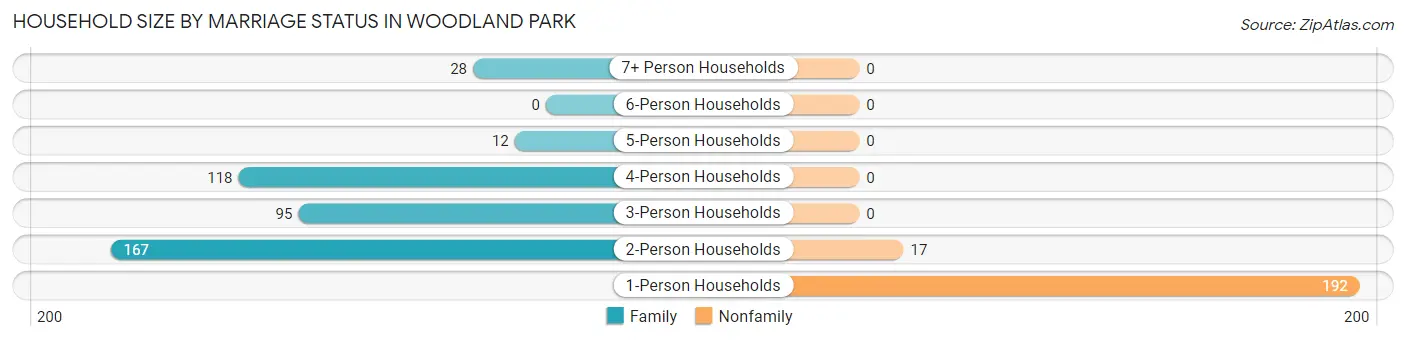
| Household Size | Family Households | Nonfamily Households |
| 1-Person Households | - | 192 (30.5%) |
| 2-Person Households | 167 (26.6%) | 17 (2.7%) |
| 3-Person Households | 95 (15.1%) | 0 (0.0%) |
| 4-Person Households | 118 (18.8%) | 0 (0.0%) |
| 5-Person Households | 12 (1.9%) | 0 (0.0%) |
| 6-Person Households | 0 (0.0%) | 0 (0.0%) |
| 7+ Person Households | 28 (4.4%) | 0 (0.0%) |
| Total | 420 (66.8%) | 209 (33.2%) |
Female Fertility in Woodland Park
Fertility by Age in Woodland Park
Average fertility rate in Woodland Park is 161.0 births per 1,000 women. Women in the age bracket of 20 to 34 years have the highest fertility rate with 346.0 births per 1,000 women. Women in the age bracket of 20 to 34 years acount for 100.0% of all women with births.
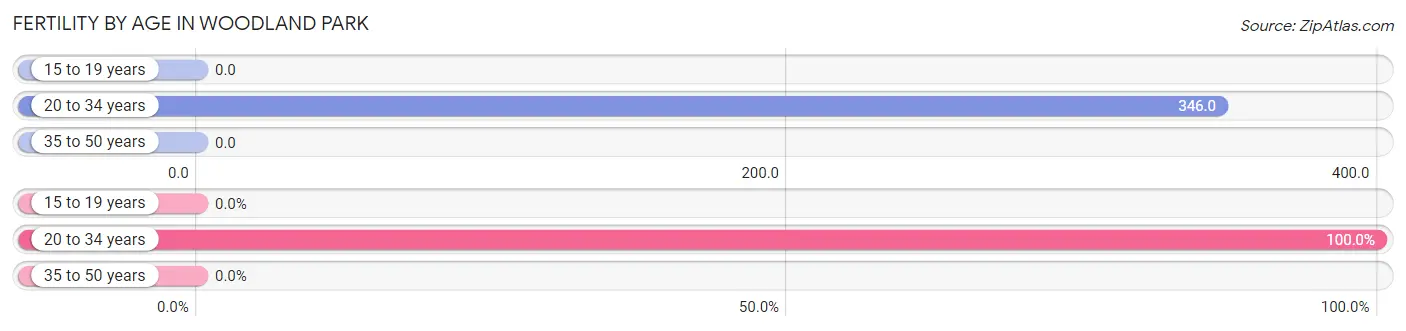
| Age Bracket | Women with Births | Births / 1,000 Women |
| 15 to 19 years | 0 (0.0%) | 0.0 |
| 20 to 34 years | 36 (100.0%) | 346.0 |
| 35 to 50 years | 0 (0.0%) | 0.0 |
| Total | 36 (100.0%) | 161.0 |
Fertility by Age by Marriage Status in Woodland Park
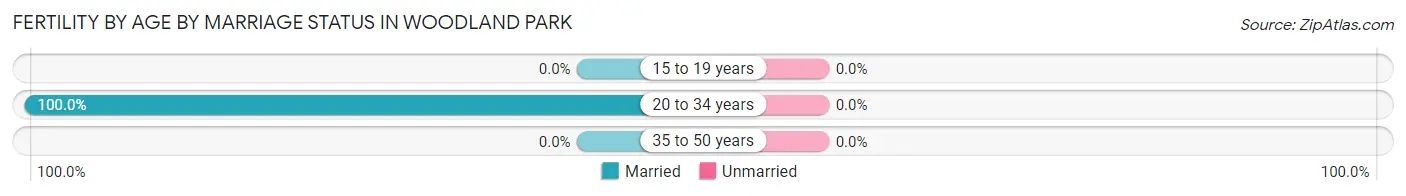
| Age Bracket | Married | Unmarried |
| 15 to 19 years | 0 (0.0%) | 0 (0.0%) |
| 20 to 34 years | 36 (100.0%) | 0 (0.0%) |
| 35 to 50 years | 0 (0.0%) | 0 (0.0%) |
| Total | 36 (100.0%) | 0 (0.0%) |
Fertility by Education in Woodland Park
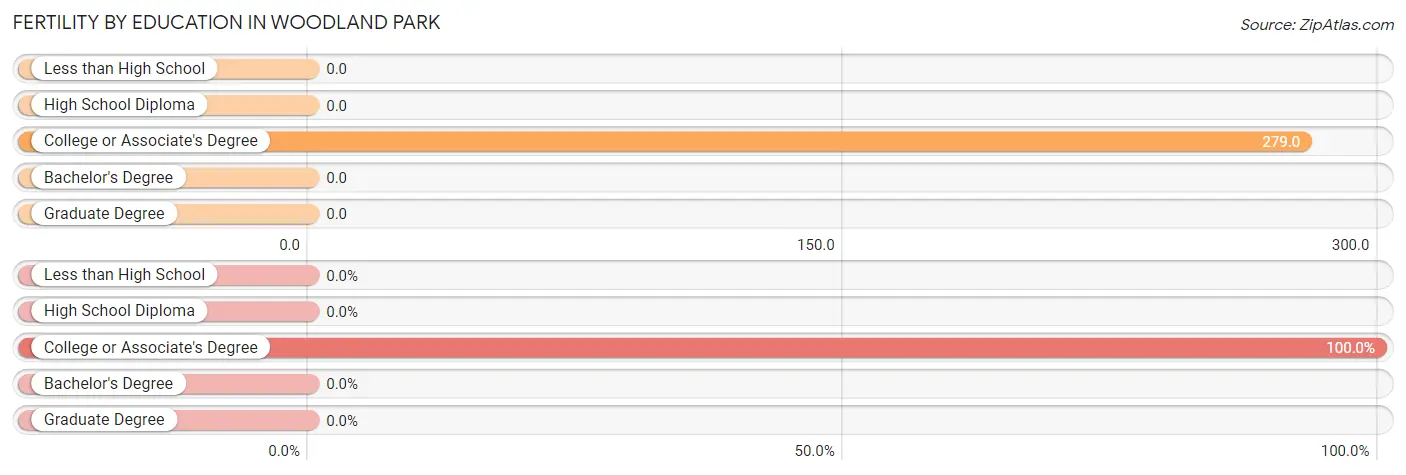
| Educational Attainment | Women with Births | Births / 1,000 Women |
| Less than High School | 0 (0.0%) | 0.0 |
| High School Diploma | 0 (0.0%) | 0.0 |
| College or Associate's Degree | 36 (100.0%) | 279.0 |
| Bachelor's Degree | 0 (0.0%) | 0.0 |
| Graduate Degree | 0 (0.0%) | 0.0 |
| Total | 36 (100.0%) | 161.0 |
Fertility by Education by Marriage Status in Woodland Park
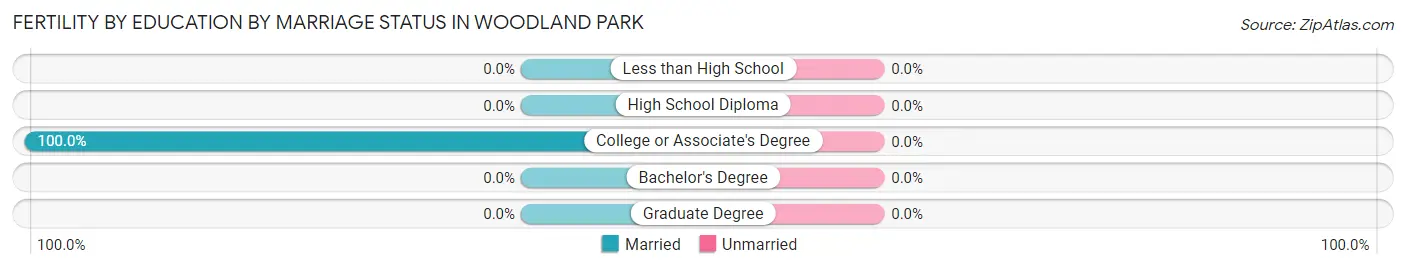
| Educational Attainment | Married | Unmarried |
| Less than High School | 0 (0.0%) | 0 (0.0%) |
| High School Diploma | 0 (0.0%) | 0 (0.0%) |
| College or Associate's Degree | 36 (100.0%) | 0 (0.0%) |
| Bachelor's Degree | 0 (0.0%) | 0 (0.0%) |
| Graduate Degree | 0 (0.0%) | 0 (0.0%) |
| Total | 36 (100.0%) | 0 (0.0%) |
Employment Characteristics in Woodland Park
Employment by Class of Employer in Woodland Park
Among the 944 employed individuals in Woodland Park, private company employees (705 | 74.7%), local government employees (109 | 11.6%), and self-employed (not incorporated) (78 | 8.3%) make up the most common classes of employment.
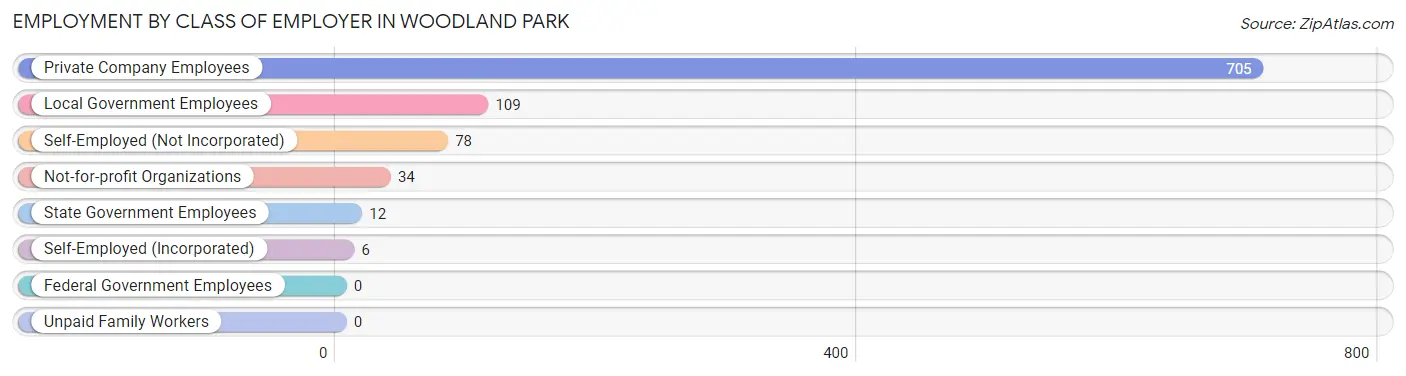
| Employer Class | # Employees | % Employees |
| Private Company Employees | 705 | 74.7% |
| Self-Employed (Incorporated) | 6 | 0.6% |
| Self-Employed (Not Incorporated) | 78 | 8.3% |
| Not-for-profit Organizations | 34 | 3.6% |
| Local Government Employees | 109 | 11.6% |
| State Government Employees | 12 | 1.3% |
| Federal Government Employees | 0 | 0.0% |
| Unpaid Family Workers | 0 | 0.0% |
| Total | 944 | 100.0% |
Employment Status by Age in Woodland Park
According to the labor force statistics for Woodland Park, out of the total population over 16 years of age (1,162), 83.8% or 974 individuals are in the labor force, with 0.7% or 7 of them unemployed. The age group with the highest labor force participation rate is 20 to 24 years, with 100.0% or 69 individuals in the labor force. Within the labor force, the 16 to 19 years age range has the highest percentage of unemployed individuals, with 46.7% or 7 of them being unemployed.
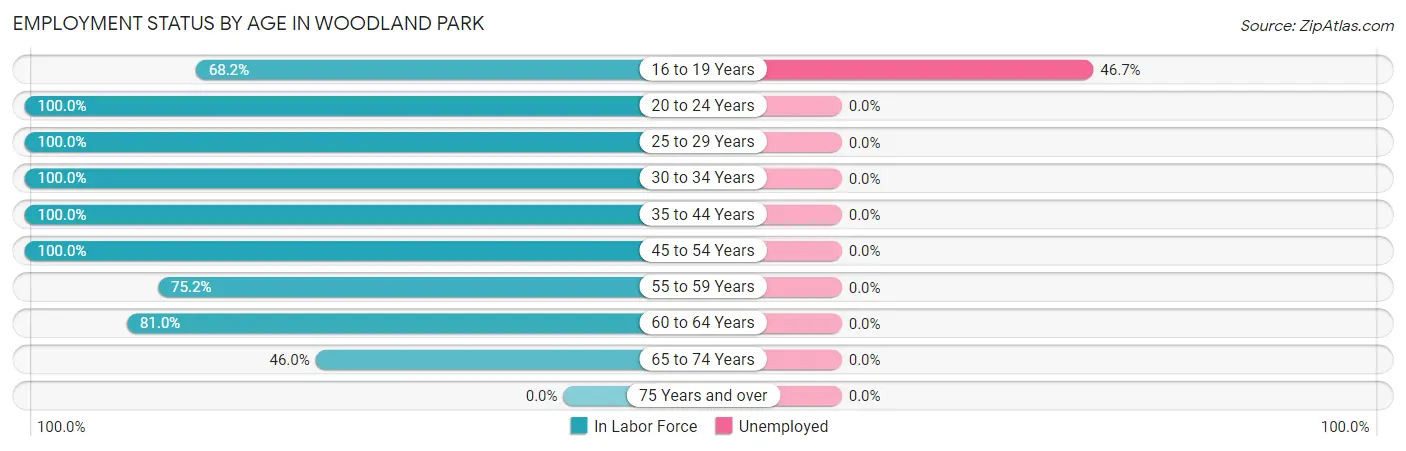
| Age Bracket | In Labor Force | Unemployed |
| 16 to 19 Years | 15 (68.2%) | 7 (46.7%) |
| 20 to 24 Years | 69 (100.0%) | 0 (0.0%) |
| 25 to 29 Years | 28 (100.0%) | 0 (0.0%) |
| 30 to 34 Years | 126 (100.0%) | 0 (0.0%) |
| 35 to 44 Years | 258 (100.0%) | 0 (0.0%) |
| 45 to 54 Years | 181 (100.0%) | 0 (0.0%) |
| 55 to 59 Years | 97 (75.2%) | 0 (0.0%) |
| 60 to 64 Years | 136 (81.0%) | 0 (0.0%) |
| 65 to 74 Years | 64 (46.0%) | 0 (0.0%) |
| 75 Years and over | 0 (0.0%) | 0 (0.0%) |
| Total | 974 (83.8%) | 7 (0.7%) |
Employment Status by Educational Attainment in Woodland Park
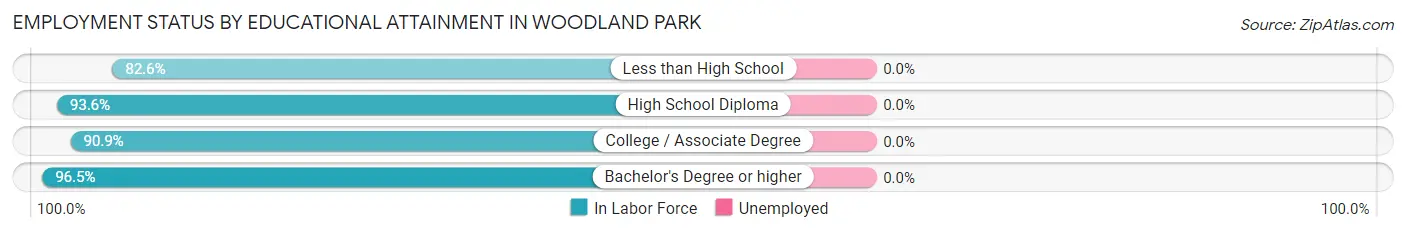
| Educational Attainment | In Labor Force | Unemployed |
| Less than High School | 38 (82.6%) | 0 (0.0%) |
| High School Diploma | 218 (93.6%) | 0 (0.0%) |
| College / Associate Degree | 321 (90.9%) | 0 (0.0%) |
| Bachelor's Degree or higher | 249 (96.5%) | 0 (0.0%) |
| Total | 826 (92.8%) | 0 (0.0%) |
Employment Occupations by Sex in Woodland Park
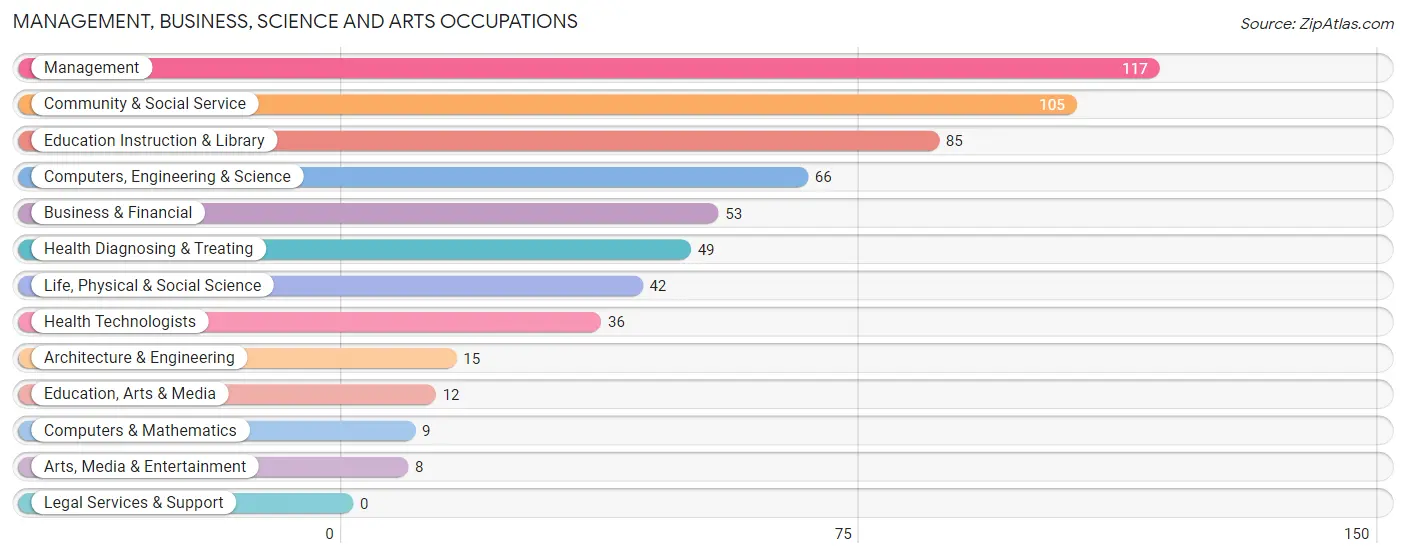
Management, Business, Science and Arts Occupations
The most common Management, Business, Science and Arts occupations in Woodland Park are Management (117 | 12.1%), Community & Social Service (105 | 10.9%), Education Instruction & Library (85 | 8.8%), Computers, Engineering & Science (66 | 6.8%), and Business & Financial (53 | 5.5%).
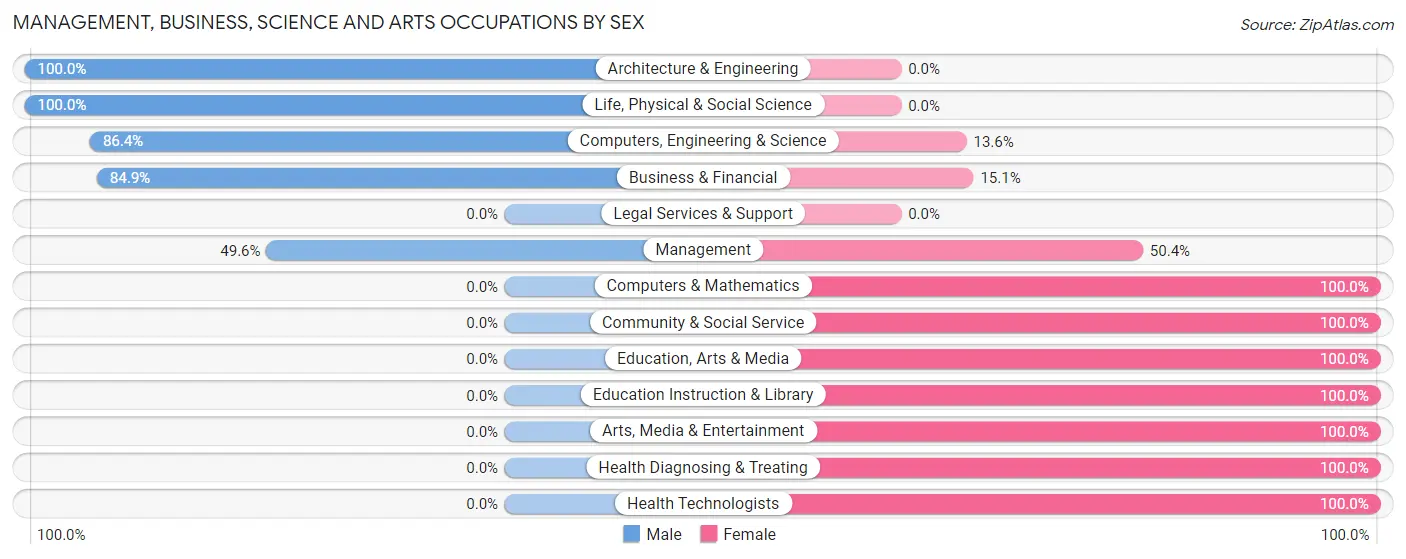
Management, Business, Science and Arts Occupations by Sex
Within the Management, Business, Science and Arts occupations in Woodland Park, the most male-oriented occupations are Architecture & Engineering (100.0%), Life, Physical & Social Science (100.0%), and Computers, Engineering & Science (86.4%), while the most female-oriented occupations are Computers & Mathematics (100.0%), Community & Social Service (100.0%), and Education, Arts & Media (100.0%).
| Occupation | Male | Female |
| Management | 58 (49.6%) | 59 (50.4%) |
| Business & Financial | 45 (84.9%) | 8 (15.1%) |
| Computers, Engineering & Science | 57 (86.4%) | 9 (13.6%) |
| Computers & Mathematics | 0 (0.0%) | 9 (100.0%) |
| Architecture & Engineering | 15 (100.0%) | 0 (0.0%) |
| Life, Physical & Social Science | 42 (100.0%) | 0 (0.0%) |
| Community & Social Service | 0 (0.0%) | 105 (100.0%) |
| Education, Arts & Media | 0 (0.0%) | 12 (100.0%) |
| Legal Services & Support | 0 (0.0%) | 0 (0.0%) |
| Education Instruction & Library | 0 (0.0%) | 85 (100.0%) |
| Arts, Media & Entertainment | 0 (0.0%) | 8 (100.0%) |
| Health Diagnosing & Treating | 0 (0.0%) | 49 (100.0%) |
| Health Technologists | 0 (0.0%) | 36 (100.0%) |
| Total (Category) | 160 (41.0%) | 230 (59.0%) |
| Total (Overall) | 531 (54.9%) | 436 (45.1%) |
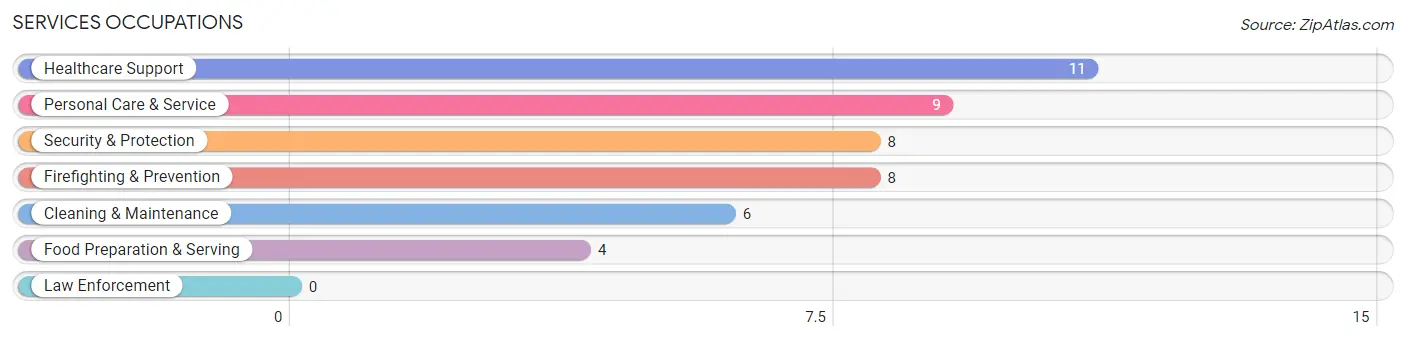
Services Occupations
The most common Services occupations in Woodland Park are Healthcare Support (11 | 1.1%), Personal Care & Service (9 | 0.9%), Security & Protection (8 | 0.8%), Firefighting & Prevention (8 | 0.8%), and Cleaning & Maintenance (6 | 0.6%).
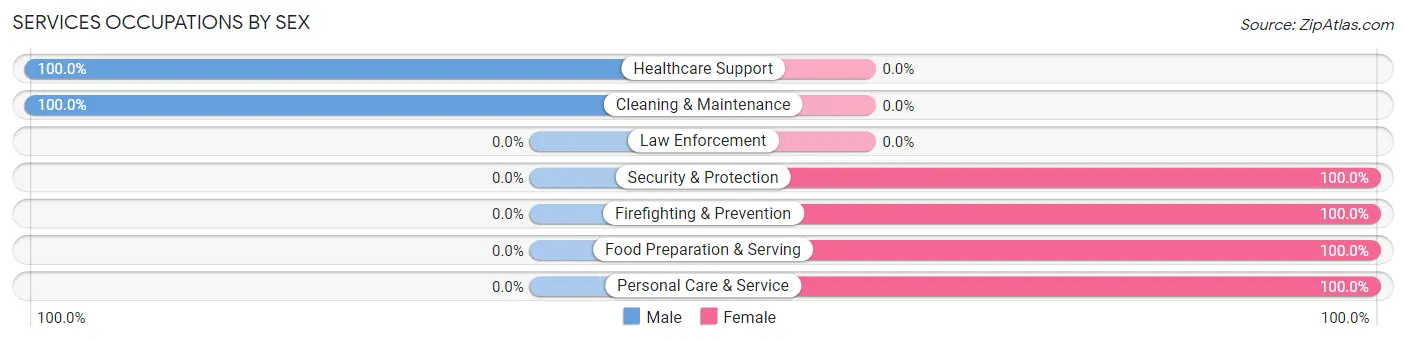
Services Occupations by Sex
Within the Services occupations in Woodland Park, the most male-oriented occupations are Healthcare Support (100.0%), and Cleaning & Maintenance (100.0%), while the most female-oriented occupations are Security & Protection (100.0%), Firefighting & Prevention (100.0%), and Food Preparation & Serving (100.0%).
| Occupation | Male | Female |
| Healthcare Support | 11 (100.0%) | 0 (0.0%) |
| Security & Protection | 0 (0.0%) | 8 (100.0%) |
| Firefighting & Prevention | 0 (0.0%) | 8 (100.0%) |
| Law Enforcement | 0 (0.0%) | 0 (0.0%) |
| Food Preparation & Serving | 0 (0.0%) | 4 (100.0%) |
| Cleaning & Maintenance | 6 (100.0%) | 0 (0.0%) |
| Personal Care & Service | 0 (0.0%) | 9 (100.0%) |
| Total (Category) | 17 (44.7%) | 21 (55.3%) |
| Total (Overall) | 531 (54.9%) | 436 (45.1%) |
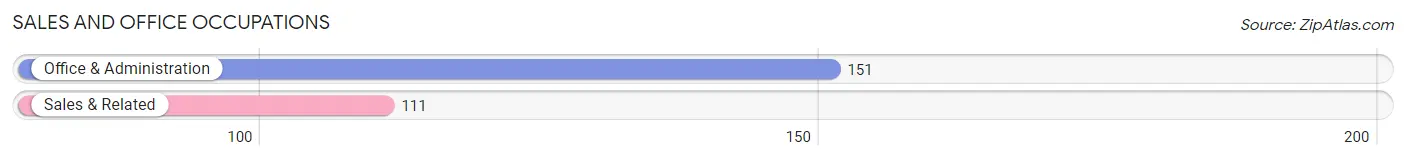
Sales and Office Occupations
The most common Sales and Office occupations in Woodland Park are Office & Administration (151 | 15.6%), and Sales & Related (111 | 11.5%).
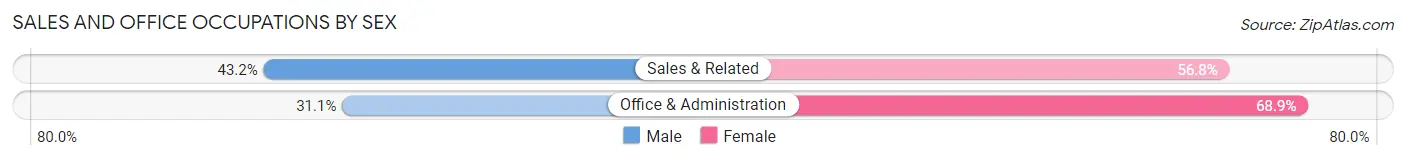
Sales and Office Occupations by Sex
| Occupation | Male | Female |
| Sales & Related | 48 (43.2%) | 63 (56.8%) |
| Office & Administration | 47 (31.1%) | 104 (68.9%) |
| Total (Category) | 95 (36.3%) | 167 (63.7%) |
| Total (Overall) | 531 (54.9%) | 436 (45.1%) |
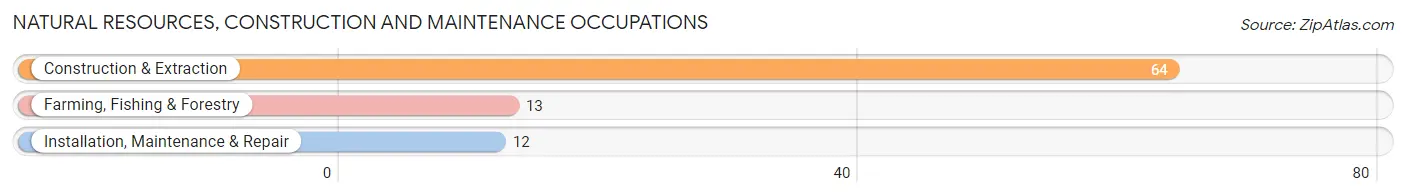
Natural Resources, Construction and Maintenance Occupations
The most common Natural Resources, Construction and Maintenance occupations in Woodland Park are Construction & Extraction (64 | 6.6%), Farming, Fishing & Forestry (13 | 1.3%), and Installation, Maintenance & Repair (12 | 1.2%).
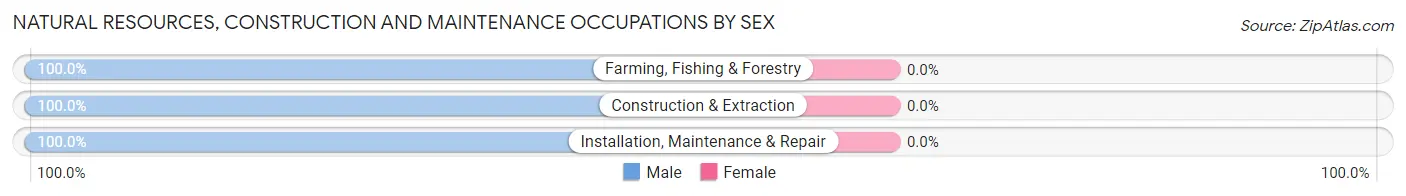
Natural Resources, Construction and Maintenance Occupations by Sex
| Occupation | Male | Female |
| Farming, Fishing & Forestry | 13 (100.0%) | 0 (0.0%) |
| Construction & Extraction | 64 (100.0%) | 0 (0.0%) |
| Installation, Maintenance & Repair | 12 (100.0%) | 0 (0.0%) |
| Total (Category) | 89 (100.0%) | 0 (0.0%) |
| Total (Overall) | 531 (54.9%) | 436 (45.1%) |
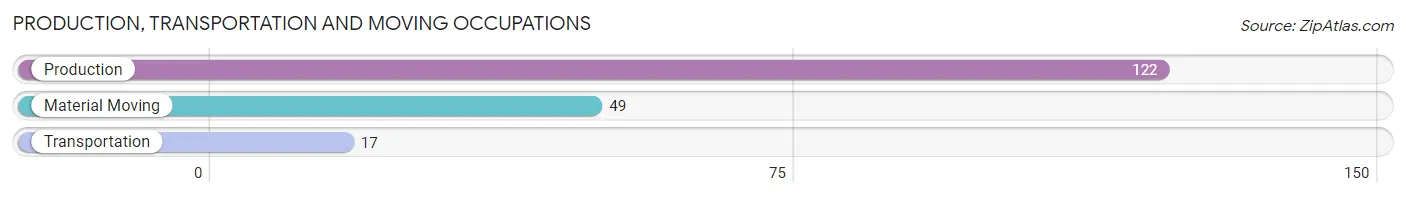
Production, Transportation and Moving Occupations
The most common Production, Transportation and Moving occupations in Woodland Park are Production (122 | 12.6%), Material Moving (49 | 5.1%), and Transportation (17 | 1.8%).
Production, Transportation and Moving Occupations by Sex
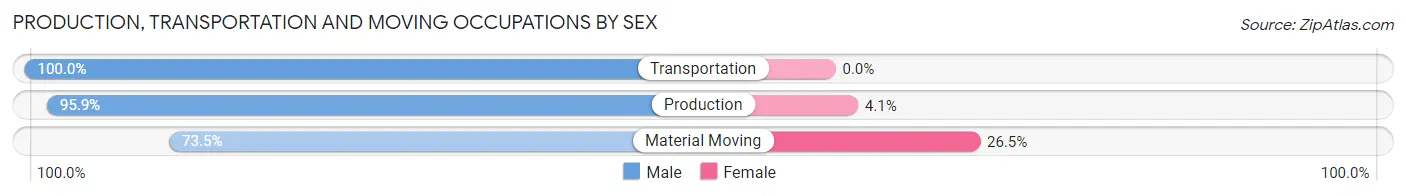
| Occupation | Male | Female |
| Production | 117 (95.9%) | 5 (4.1%) |
| Transportation | 17 (100.0%) | 0 (0.0%) |
| Material Moving | 36 (73.5%) | 13 (26.5%) |
| Total (Category) | 170 (90.4%) | 18 (9.6%) |
| Total (Overall) | 531 (54.9%) | 436 (45.1%) |
Employment Industries by Sex in Woodland Park
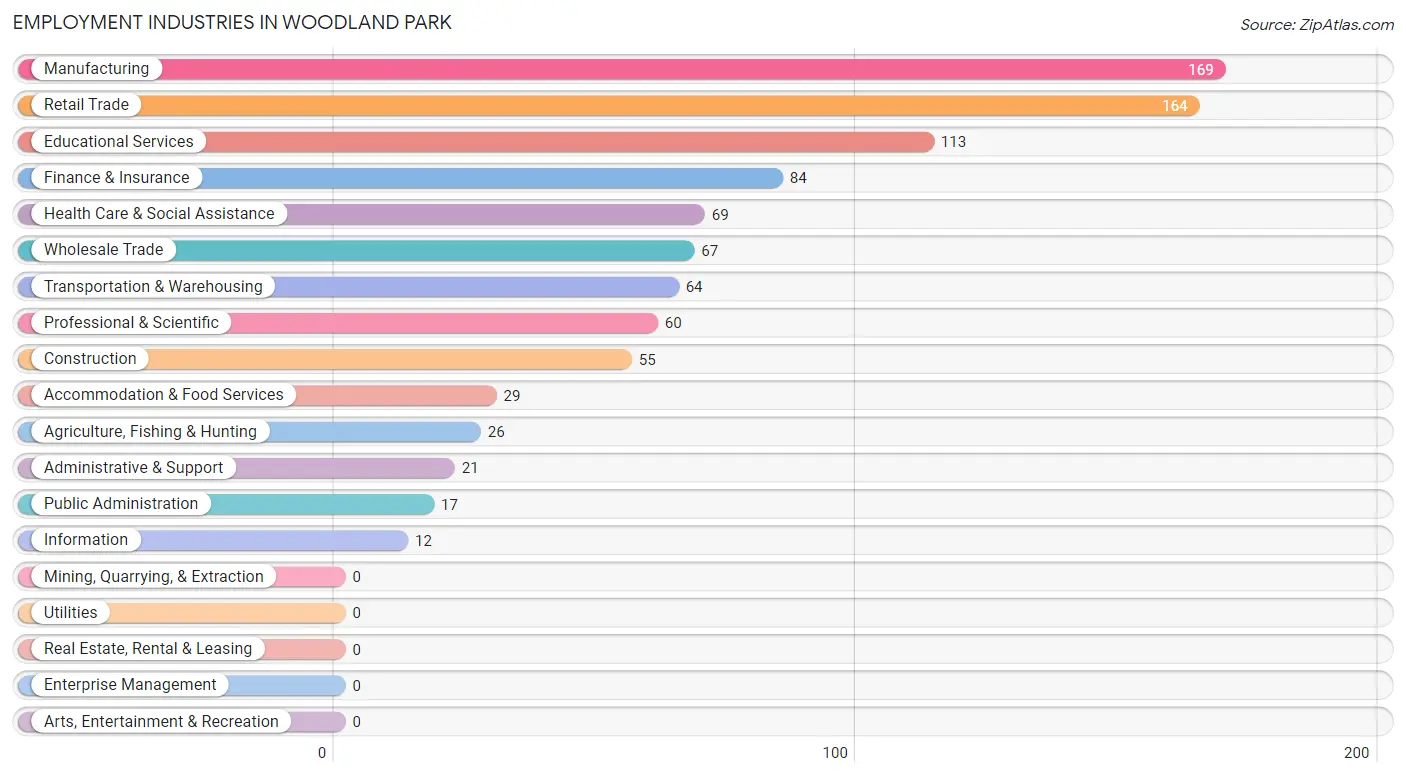
Employment Industries in Woodland Park
The major employment industries in Woodland Park include Manufacturing (169 | 17.5%), Retail Trade (164 | 17.0%), Educational Services (113 | 11.7%), Finance & Insurance (84 | 8.7%), and Health Care & Social Assistance (69 | 7.1%).
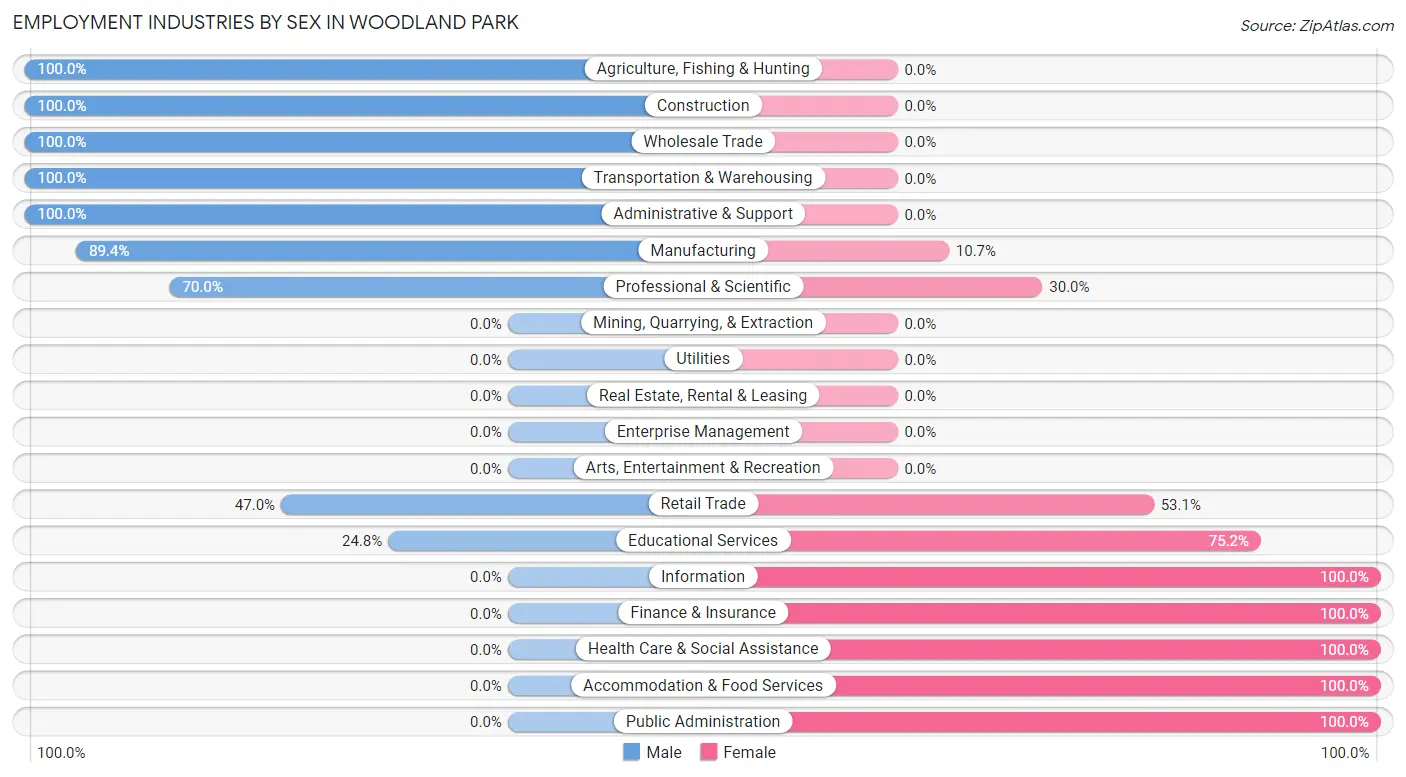
Employment Industries by Sex in Woodland Park
The Woodland Park industries that see more men than women are Agriculture, Fishing & Hunting (100.0%), Construction (100.0%), and Wholesale Trade (100.0%), whereas the industries that tend to have a higher number of women are Information (100.0%), Finance & Insurance (100.0%), and Health Care & Social Assistance (100.0%).
| Industry | Male | Female |
| Agriculture, Fishing & Hunting | 26 (100.0%) | 0 (0.0%) |
| Mining, Quarrying, & Extraction | 0 (0.0%) | 0 (0.0%) |
| Construction | 55 (100.0%) | 0 (0.0%) |
| Manufacturing | 151 (89.3%) | 18 (10.6%) |
| Wholesale Trade | 67 (100.0%) | 0 (0.0%) |
| Retail Trade | 77 (46.9%) | 87 (53.0%) |
| Transportation & Warehousing | 64 (100.0%) | 0 (0.0%) |
| Utilities | 0 (0.0%) | 0 (0.0%) |
| Information | 0 (0.0%) | 12 (100.0%) |
| Finance & Insurance | 0 (0.0%) | 84 (100.0%) |
| Real Estate, Rental & Leasing | 0 (0.0%) | 0 (0.0%) |
| Professional & Scientific | 42 (70.0%) | 18 (30.0%) |
| Enterprise Management | 0 (0.0%) | 0 (0.0%) |
| Administrative & Support | 21 (100.0%) | 0 (0.0%) |
| Educational Services | 28 (24.8%) | 85 (75.2%) |
| Health Care & Social Assistance | 0 (0.0%) | 69 (100.0%) |
| Arts, Entertainment & Recreation | 0 (0.0%) | 0 (0.0%) |
| Accommodation & Food Services | 0 (0.0%) | 29 (100.0%) |
| Public Administration | 0 (0.0%) | 17 (100.0%) |
| Total | 531 (54.9%) | 436 (45.1%) |
Education in Woodland Park
School Enrollment in Woodland Park
The most common levels of schooling among the 356 students in Woodland Park are elementary school (111 | 31.2%), middle school (69 | 19.4%), and high school (58 | 16.3%).
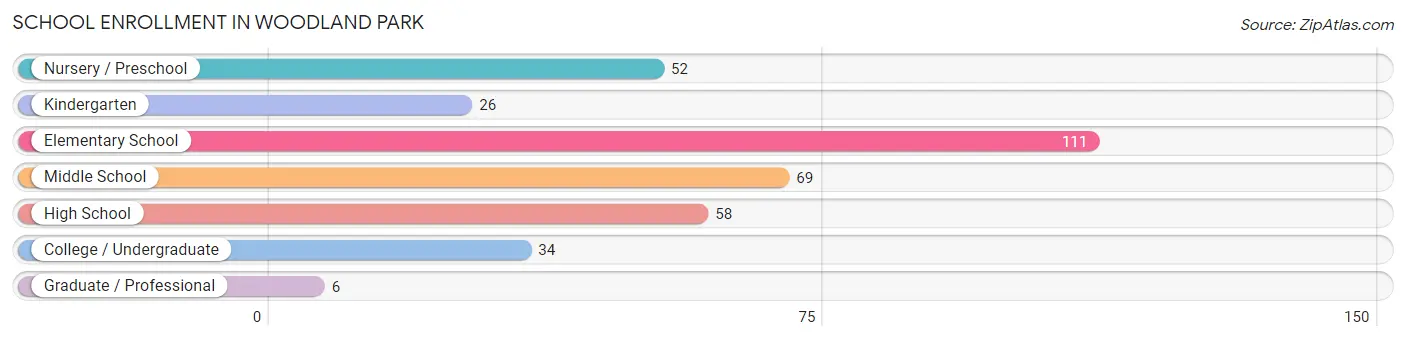
| School Level | # Students | % Students |
| Nursery / Preschool | 52 | 14.6% |
| Kindergarten | 26 | 7.3% |
| Elementary School | 111 | 31.2% |
| Middle School | 69 | 19.4% |
| High School | 58 | 16.3% |
| College / Undergraduate | 34 | 9.6% |
| Graduate / Professional | 6 | 1.7% |
| Total | 356 | 100.0% |
School Enrollment by Age by Funding Source in Woodland Park
Out of a total of 356 students who are enrolled in schools in Woodland Park, 38 (10.7%) attend a private institution, while the remaining 318 (89.3%) are enrolled in public schools. The age group of 10 to 14 year olds has the highest likelihood of being enrolled in private schools, with 38 (50.7% in the age bracket) enrolled. Conversely, the age group of 3 to 4 year olds has the lowest likelihood of being enrolled in a private school, with 24 (100.0% in the age bracket) attending a public institution.
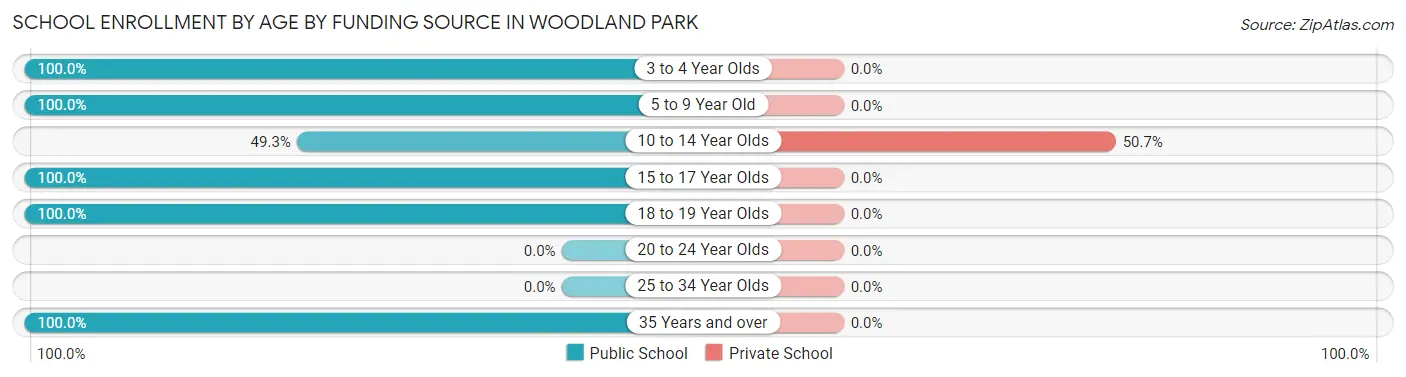
| Age Bracket | Public School | Private School |
| 3 to 4 Year Olds | 24 (100.0%) | 0 (0.0%) |
| 5 to 9 Year Old | 159 (100.0%) | 0 (0.0%) |
| 10 to 14 Year Olds | 37 (49.3%) | 38 (50.7%) |
| 15 to 17 Year Olds | 52 (100.0%) | 0 (0.0%) |
| 18 to 19 Year Olds | 14 (100.0%) | 0 (0.0%) |
| 20 to 24 Year Olds | 0 (0.0%) | 0 (0.0%) |
| 25 to 34 Year Olds | 0 (0.0%) | 0 (0.0%) |
| 35 Years and over | 32 (100.0%) | 0 (0.0%) |
| Total | 318 (89.3%) | 38 (10.7%) |
Educational Attainment by Field of Study in Woodland Park
Science & technology (85 | 27.1%), arts & humanities (81 | 25.8%), education (42 | 13.4%), liberal arts & history (23 | 7.3%), and psychology (17 | 5.4%) are the most common fields of study among 314 individuals in Woodland Park who have obtained a bachelor's degree or higher.
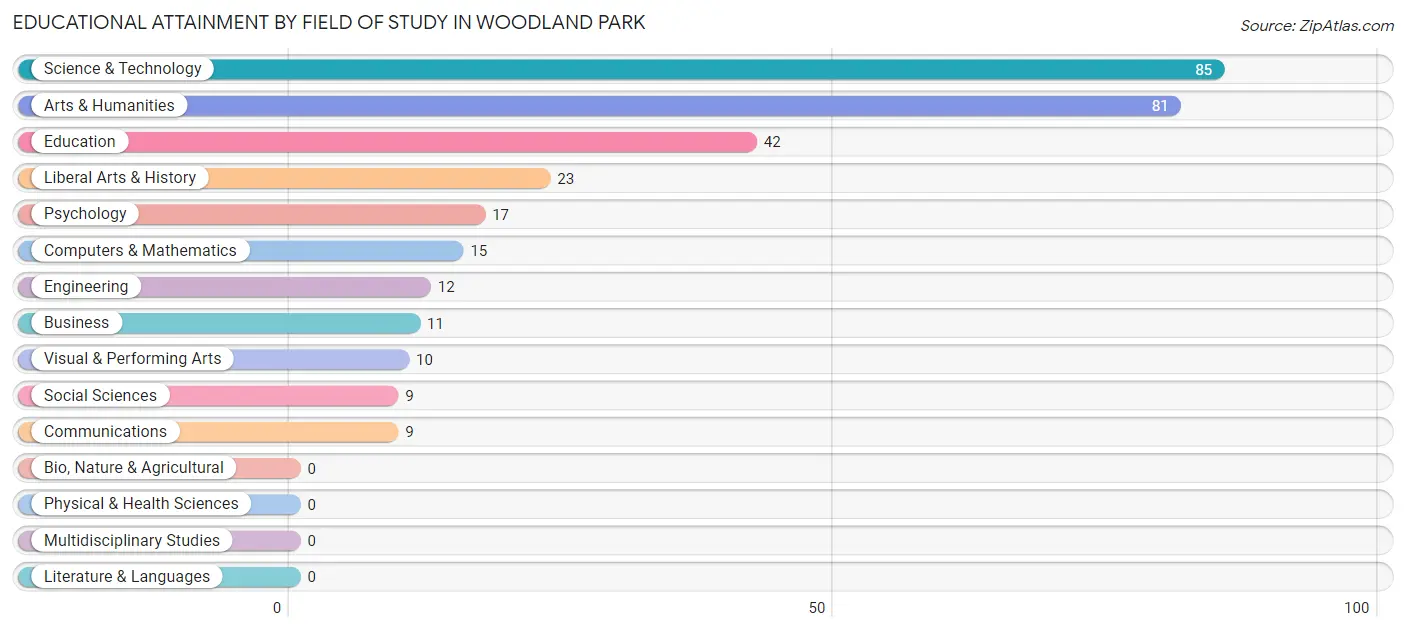
| Field of Study | # Graduates | % Graduates |
| Computers & Mathematics | 15 | 4.8% |
| Bio, Nature & Agricultural | 0 | 0.0% |
| Physical & Health Sciences | 0 | 0.0% |
| Psychology | 17 | 5.4% |
| Social Sciences | 9 | 2.9% |
| Engineering | 12 | 3.8% |
| Multidisciplinary Studies | 0 | 0.0% |
| Science & Technology | 85 | 27.1% |
| Business | 11 | 3.5% |
| Education | 42 | 13.4% |
| Literature & Languages | 0 | 0.0% |
| Liberal Arts & History | 23 | 7.3% |
| Visual & Performing Arts | 10 | 3.2% |
| Communications | 9 | 2.9% |
| Arts & Humanities | 81 | 25.8% |
| Total | 314 | 100.0% |
Transportation & Commute in Woodland Park
Vehicle Availability by Sex in Woodland Park
The most prevalent vehicle ownership categories in Woodland Park are males with 2 vehicles (203, accounting for 38.9%) and females with 2 vehicles (177, making up 48.1%).
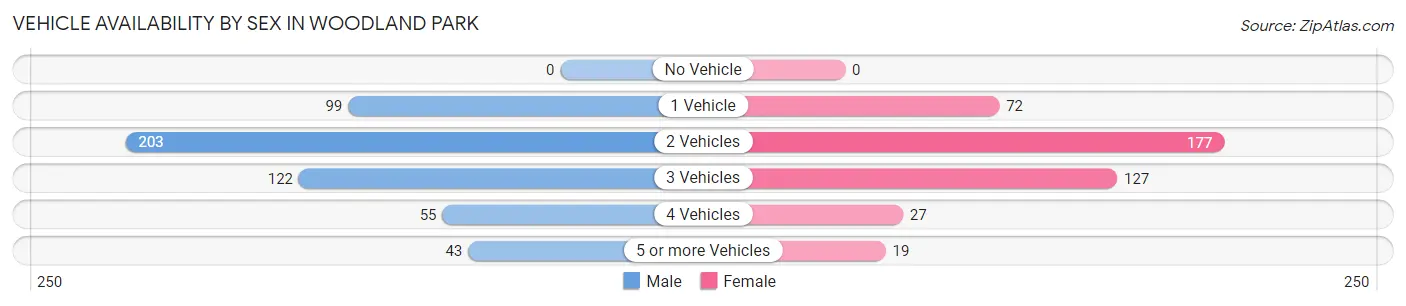
| Vehicles Available | Male | Female |
| No Vehicle | 0 (0.0%) | 0 (0.0%) |
| 1 Vehicle | 99 (19.0%) | 72 (17.1%) |
| 2 Vehicles | 203 (38.9%) | 177 (41.9%) |
| 3 Vehicles | 122 (23.4%) | 127 (30.1%) |
| 4 Vehicles | 55 (10.5%) | 27 (6.4%) |
| 5 or more Vehicles | 43 (8.2%) | 19 (4.5%) |
| Total | 522 (100.0%) | 422 (100.0%) |
Commute Time in Woodland Park
The most frequently occuring commute durations in Woodland Park are 10 to 14 minutes (297 commuters, 34.9%), 15 to 19 minutes (116 commuters, 13.6%), and 30 to 34 minutes (109 commuters, 12.8%).
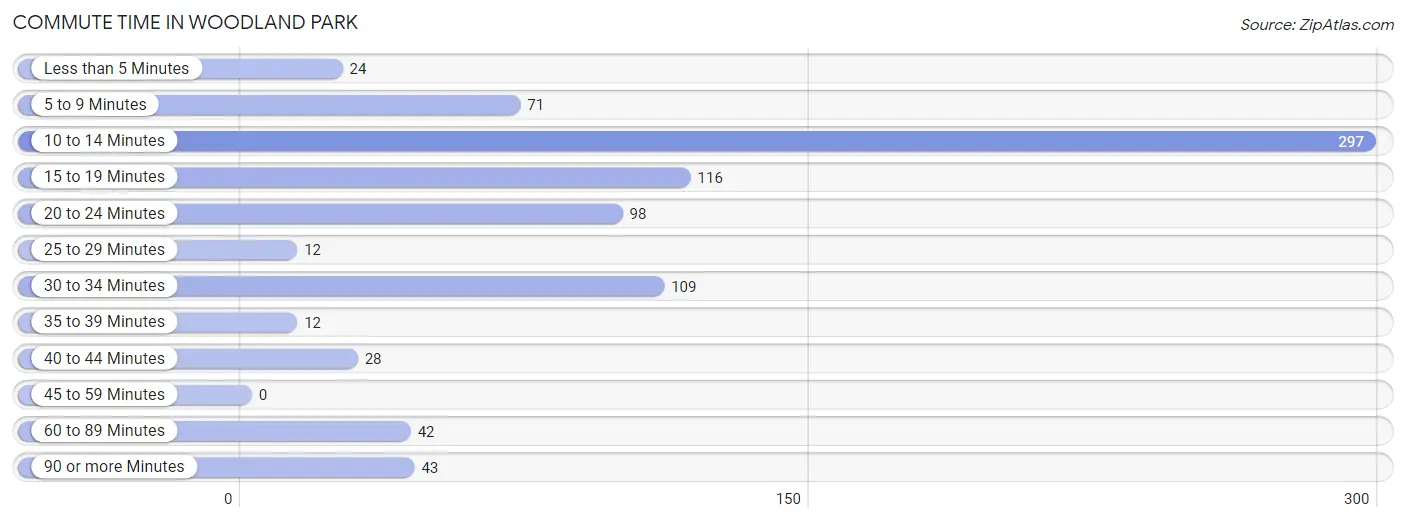
| Commute Time | # Commuters | % Commuters |
| Less than 5 Minutes | 24 | 2.8% |
| 5 to 9 Minutes | 71 | 8.3% |
| 10 to 14 Minutes | 297 | 34.9% |
| 15 to 19 Minutes | 116 | 13.6% |
| 20 to 24 Minutes | 98 | 11.5% |
| 25 to 29 Minutes | 12 | 1.4% |
| 30 to 34 Minutes | 109 | 12.8% |
| 35 to 39 Minutes | 12 | 1.4% |
| 40 to 44 Minutes | 28 | 3.3% |
| 45 to 59 Minutes | 0 | 0.0% |
| 60 to 89 Minutes | 42 | 4.9% |
| 90 or more Minutes | 43 | 5.1% |
Commute Time by Sex in Woodland Park
The most common commute times in Woodland Park are 10 to 14 minutes (125 commuters, 26.0%) for males and 10 to 14 minutes (172 commuters, 46.2%) for females.
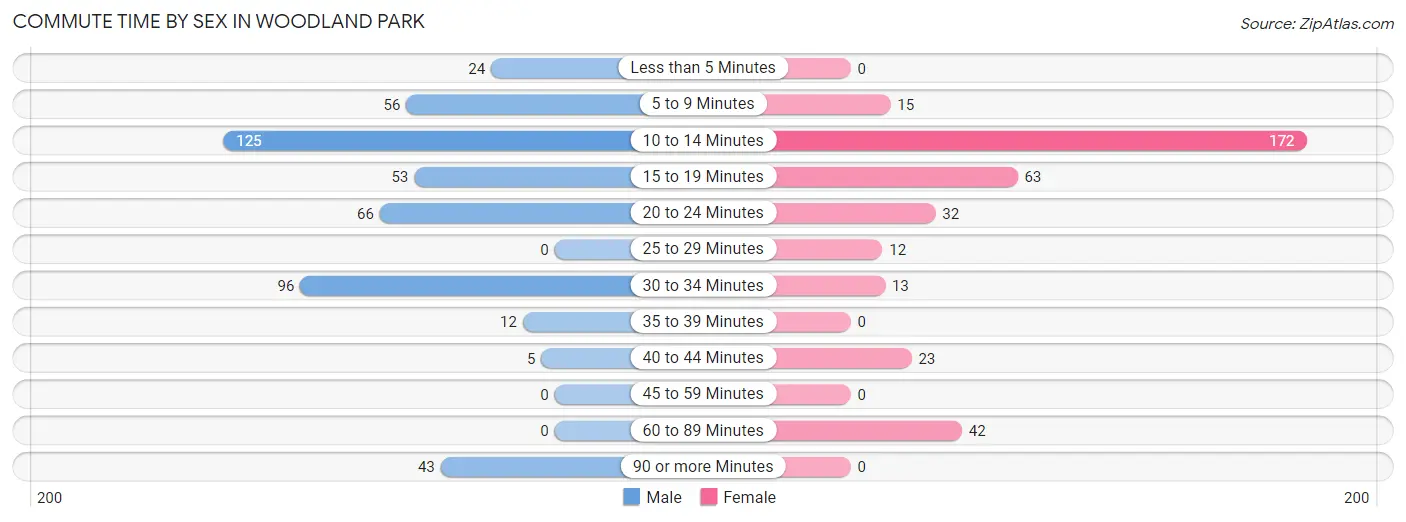
| Commute Time | Male | Female |
| Less than 5 Minutes | 24 (5.0%) | 0 (0.0%) |
| 5 to 9 Minutes | 56 (11.7%) | 15 (4.0%) |
| 10 to 14 Minutes | 125 (26.0%) | 172 (46.2%) |
| 15 to 19 Minutes | 53 (11.0%) | 63 (16.9%) |
| 20 to 24 Minutes | 66 (13.8%) | 32 (8.6%) |
| 25 to 29 Minutes | 0 (0.0%) | 12 (3.2%) |
| 30 to 34 Minutes | 96 (20.0%) | 13 (3.5%) |
| 35 to 39 Minutes | 12 (2.5%) | 0 (0.0%) |
| 40 to 44 Minutes | 5 (1.0%) | 23 (6.2%) |
| 45 to 59 Minutes | 0 (0.0%) | 0 (0.0%) |
| 60 to 89 Minutes | 0 (0.0%) | 42 (11.3%) |
| 90 or more Minutes | 43 (9.0%) | 0 (0.0%) |
Time of Departure to Work by Sex in Woodland Park
The most frequent times of departure to work in Woodland Park are 7:30 AM to 7:59 AM (76, 15.8%) for males and 7:30 AM to 7:59 AM (117, 31.5%) for females.
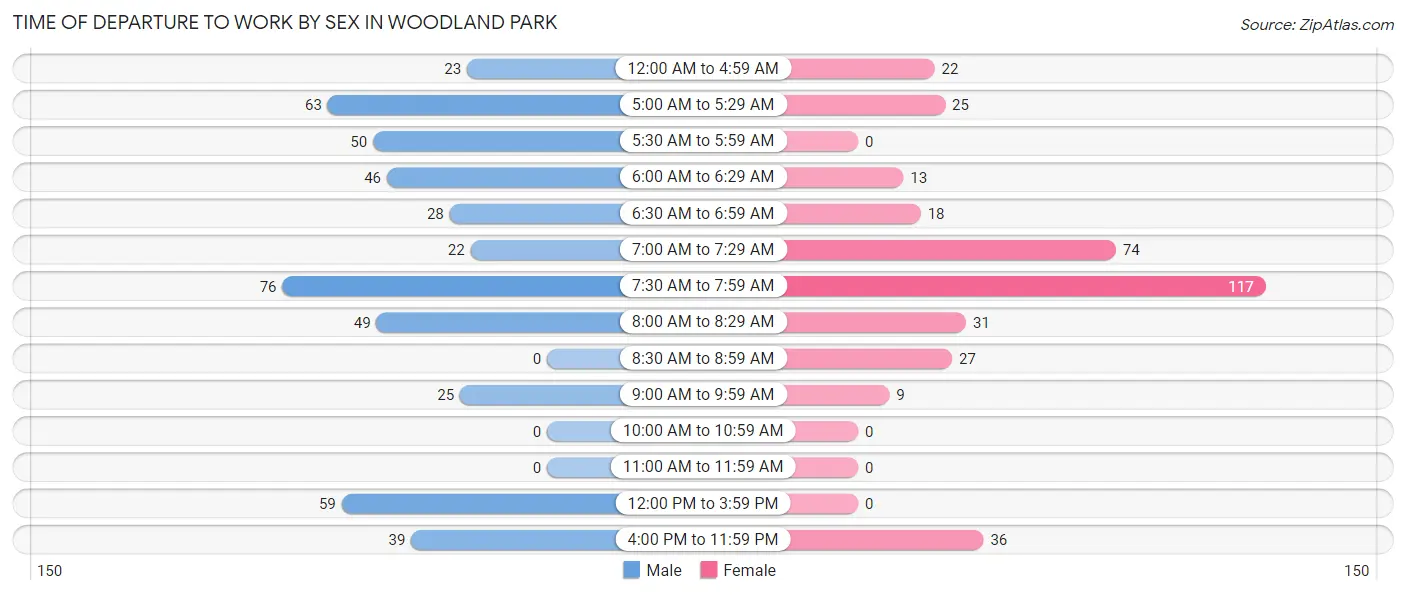
| Time of Departure | Male | Female |
| 12:00 AM to 4:59 AM | 23 (4.8%) | 22 (5.9%) |
| 5:00 AM to 5:29 AM | 63 (13.1%) | 25 (6.7%) |
| 5:30 AM to 5:59 AM | 50 (10.4%) | 0 (0.0%) |
| 6:00 AM to 6:29 AM | 46 (9.6%) | 13 (3.5%) |
| 6:30 AM to 6:59 AM | 28 (5.8%) | 18 (4.8%) |
| 7:00 AM to 7:29 AM | 22 (4.6%) | 74 (19.9%) |
| 7:30 AM to 7:59 AM | 76 (15.8%) | 117 (31.5%) |
| 8:00 AM to 8:29 AM | 49 (10.2%) | 31 (8.3%) |
| 8:30 AM to 8:59 AM | 0 (0.0%) | 27 (7.3%) |
| 9:00 AM to 9:59 AM | 25 (5.2%) | 9 (2.4%) |
| 10:00 AM to 10:59 AM | 0 (0.0%) | 0 (0.0%) |
| 11:00 AM to 11:59 AM | 0 (0.0%) | 0 (0.0%) |
| 12:00 PM to 3:59 PM | 59 (12.3%) | 0 (0.0%) |
| 4:00 PM to 11:59 PM | 39 (8.1%) | 36 (9.7%) |
| Total | 480 (100.0%) | 372 (100.0%) |
Housing Occupancy in Woodland Park
Occupancy by Ownership in Woodland Park
Of the total 629 dwellings in Woodland Park, owner-occupied units account for 592 (94.1%), while renter-occupied units make up 37 (5.9%).
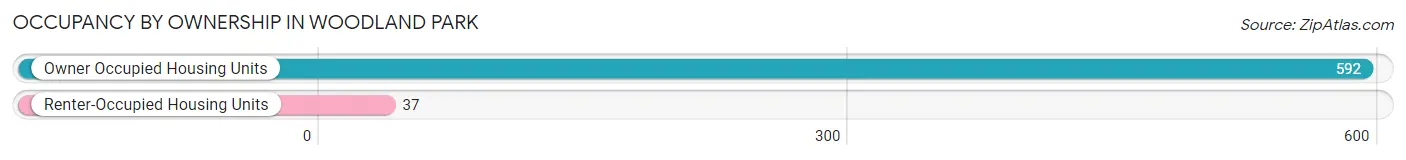
| Occupancy | # Housing Units | % Housing Units |
| Owner Occupied Housing Units | 592 | 94.1% |
| Renter-Occupied Housing Units | 37 | 5.9% |
| Total Occupied Housing Units | 629 | 100.0% |
Occupancy by Household Size in Woodland Park
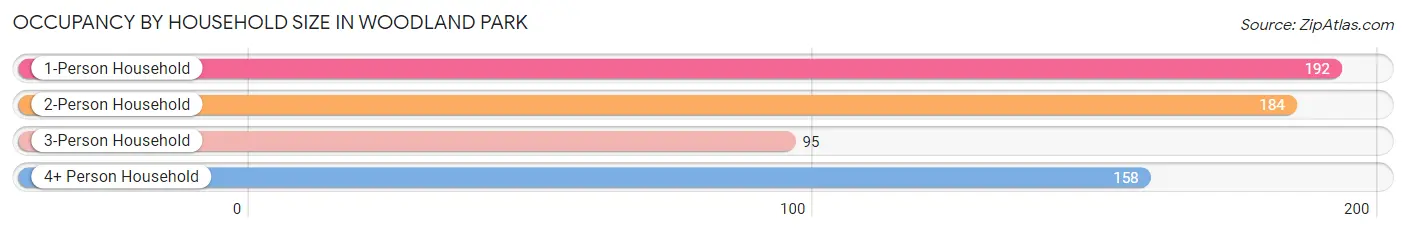
| Household Size | # Housing Units | % Housing Units |
| 1-Person Household | 192 | 30.5% |
| 2-Person Household | 184 | 29.2% |
| 3-Person Household | 95 | 15.1% |
| 4+ Person Household | 158 | 25.1% |
| Total Housing Units | 629 | 100.0% |
Occupancy by Ownership by Household Size in Woodland Park
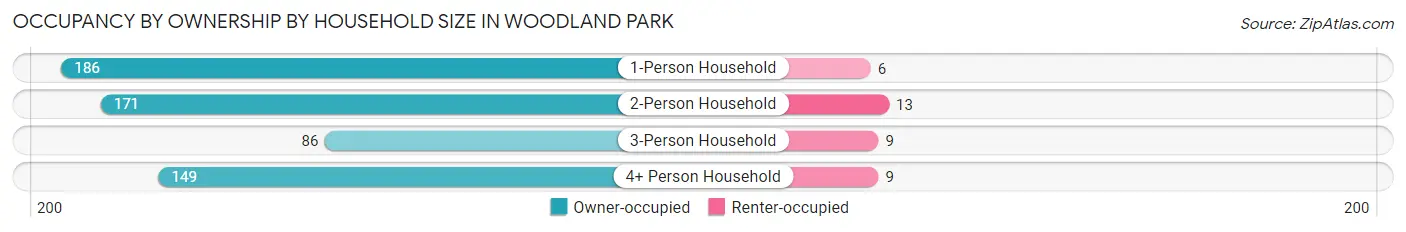
| Household Size | Owner-occupied | Renter-occupied |
| 1-Person Household | 186 (96.9%) | 6 (3.1%) |
| 2-Person Household | 171 (92.9%) | 13 (7.1%) |
| 3-Person Household | 86 (90.5%) | 9 (9.5%) |
| 4+ Person Household | 149 (94.3%) | 9 (5.7%) |
| Total Housing Units | 592 (94.1%) | 37 (5.9%) |
Occupancy by Educational Attainment in Woodland Park
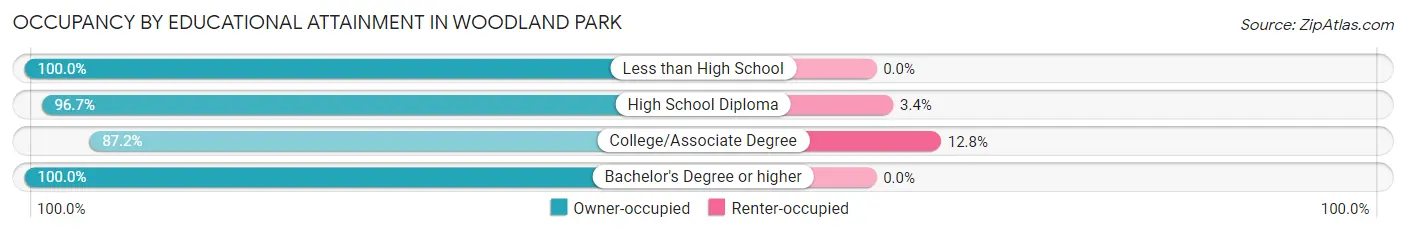
| Household Size | Owner-occupied | Renter-occupied |
| Less than High School | 33 (100.0%) | 0 (0.0%) |
| High School Diploma | 173 (96.7%) | 6 (3.4%) |
| College/Associate Degree | 211 (87.2%) | 31 (12.8%) |
| Bachelor's Degree or higher | 175 (100.0%) | 0 (0.0%) |
Occupancy by Age of Householder in Woodland Park
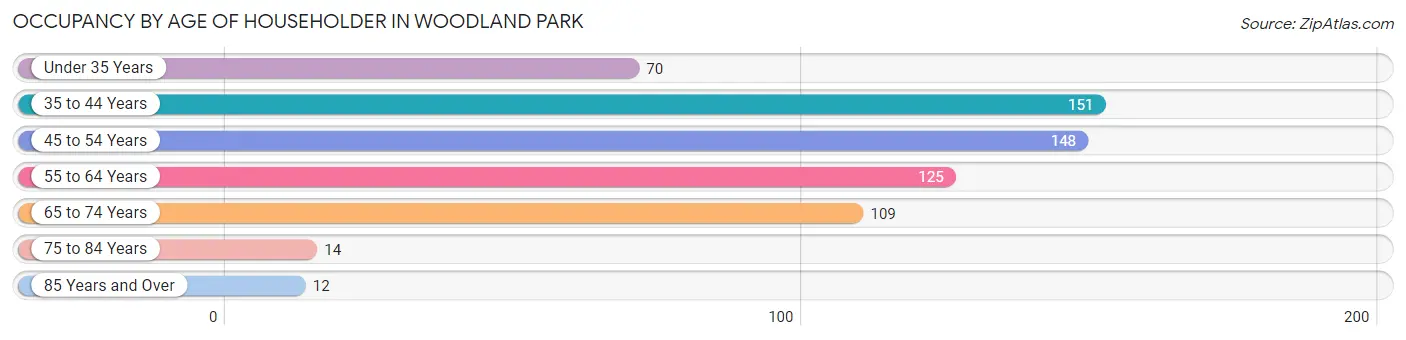
| Age Bracket | # Households | % Households |
| Under 35 Years | 70 | 11.1% |
| 35 to 44 Years | 151 | 24.0% |
| 45 to 54 Years | 148 | 23.5% |
| 55 to 64 Years | 125 | 19.9% |
| 65 to 74 Years | 109 | 17.3% |
| 75 to 84 Years | 14 | 2.2% |
| 85 Years and Over | 12 | 1.9% |
| Total | 629 | 100.0% |
Housing Finances in Woodland Park
Median Income by Occupancy in Woodland Park
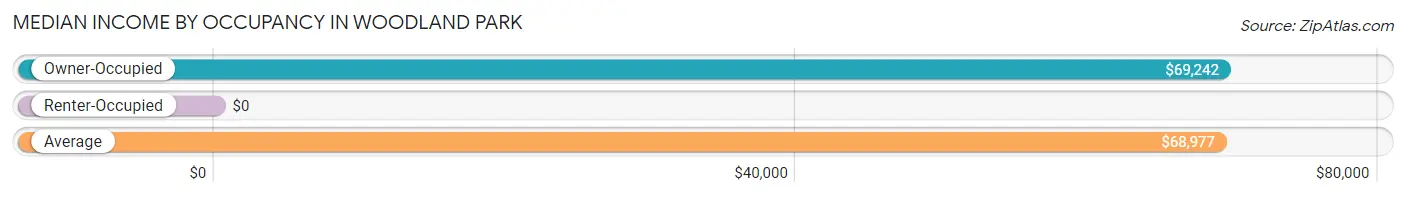
| Occupancy Type | # Households | Median Income |
| Owner-Occupied | 592 (94.1%) | $69,242 |
| Renter-Occupied | 37 (5.9%) | $0 |
| Average | 629 (100.0%) | $68,977 |
Occupancy by Householder Income Bracket in Woodland Park
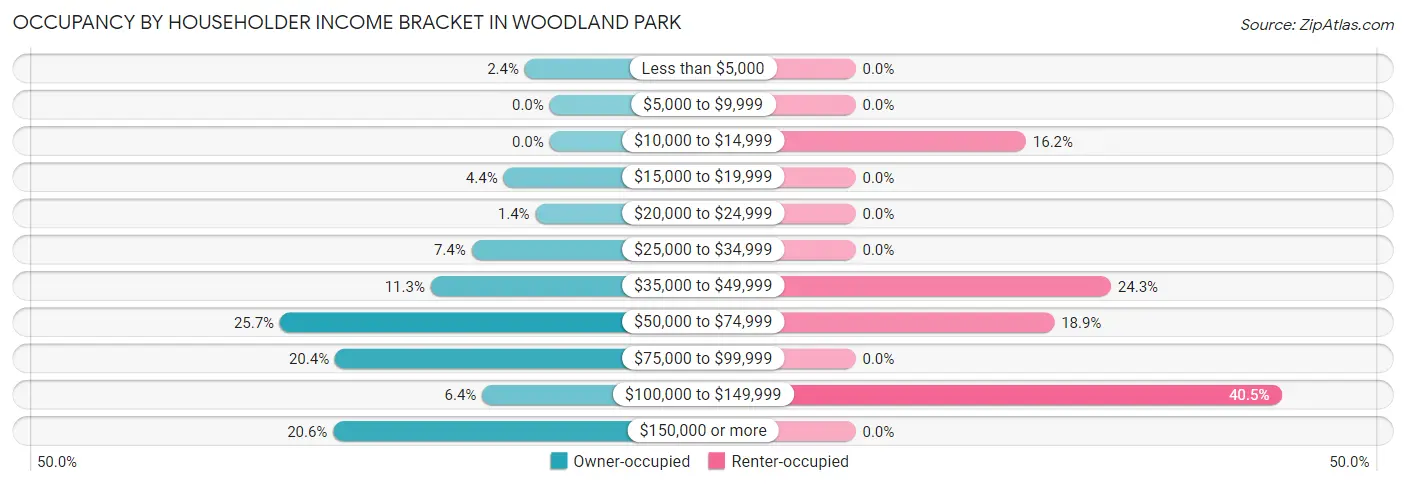
| Income Bracket | Owner-occupied | Renter-occupied |
| Less than $5,000 | 14 (2.4%) | 0 (0.0%) |
| $5,000 to $9,999 | 0 (0.0%) | 0 (0.0%) |
| $10,000 to $14,999 | 0 (0.0%) | 6 (16.2%) |
| $15,000 to $19,999 | 26 (4.4%) | 0 (0.0%) |
| $20,000 to $24,999 | 8 (1.3%) | 0 (0.0%) |
| $25,000 to $34,999 | 44 (7.4%) | 0 (0.0%) |
| $35,000 to $49,999 | 67 (11.3%) | 9 (24.3%) |
| $50,000 to $74,999 | 152 (25.7%) | 7 (18.9%) |
| $75,000 to $99,999 | 121 (20.4%) | 0 (0.0%) |
| $100,000 to $149,999 | 38 (6.4%) | 15 (40.5%) |
| $150,000 or more | 122 (20.6%) | 0 (0.0%) |
| Total | 592 (100.0%) | 37 (100.0%) |
Monthly Housing Cost Tiers in Woodland Park
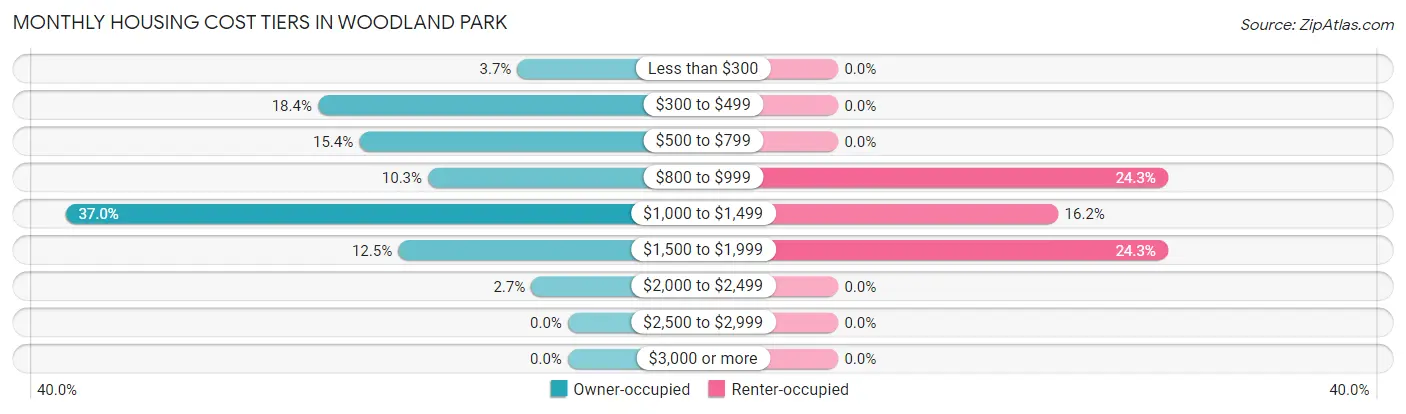
| Monthly Cost | Owner-occupied | Renter-occupied |
| Less than $300 | 22 (3.7%) | 0 (0.0%) |
| $300 to $499 | 109 (18.4%) | 0 (0.0%) |
| $500 to $799 | 91 (15.4%) | 0 (0.0%) |
| $800 to $999 | 61 (10.3%) | 9 (24.3%) |
| $1,000 to $1,499 | 219 (37.0%) | 6 (16.2%) |
| $1,500 to $1,999 | 74 (12.5%) | 9 (24.3%) |
| $2,000 to $2,499 | 16 (2.7%) | 0 (0.0%) |
| $2,500 to $2,999 | 0 (0.0%) | 0 (0.0%) |
| $3,000 or more | 0 (0.0%) | 0 (0.0%) |
| Total | 592 (100.0%) | 37 (100.0%) |
Physical Housing Characteristics in Woodland Park
Housing Structures in Woodland Park
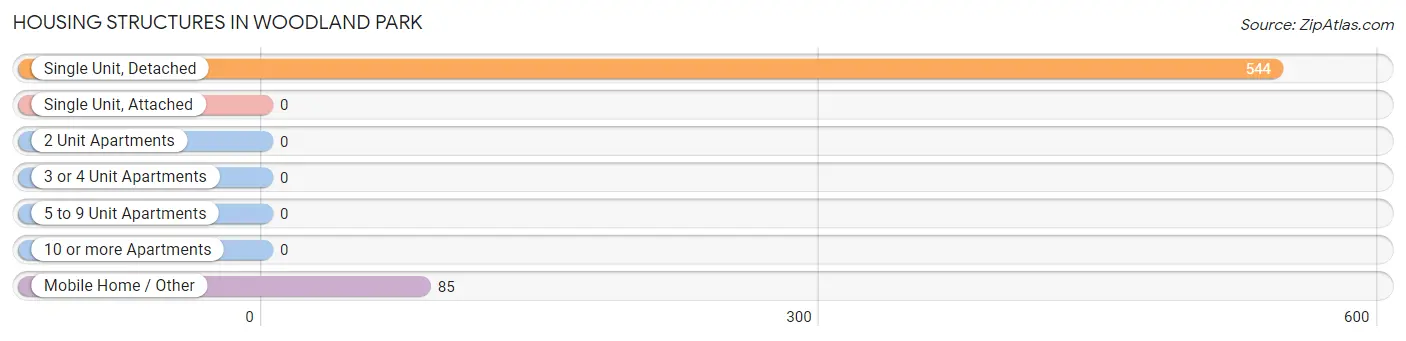
| Structure Type | # Housing Units | % Housing Units |
| Single Unit, Detached | 544 | 86.5% |
| Single Unit, Attached | 0 | 0.0% |
| 2 Unit Apartments | 0 | 0.0% |
| 3 or 4 Unit Apartments | 0 | 0.0% |
| 5 to 9 Unit Apartments | 0 | 0.0% |
| 10 or more Apartments | 0 | 0.0% |
| Mobile Home / Other | 85 | 13.5% |
| Total | 629 | 100.0% |
Housing Structures by Occupancy in Woodland Park
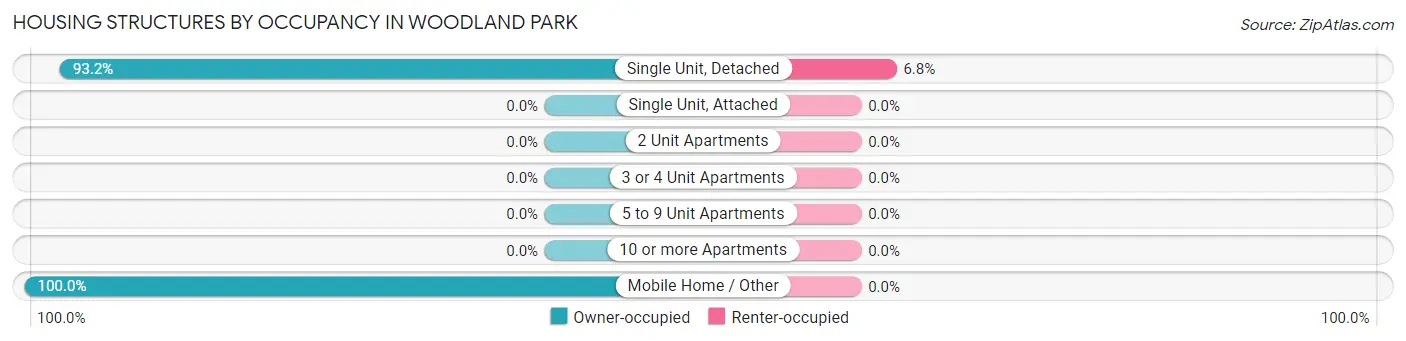
| Structure Type | Owner-occupied | Renter-occupied |
| Single Unit, Detached | 507 (93.2%) | 37 (6.8%) |
| Single Unit, Attached | 0 (0.0%) | 0 (0.0%) |
| 2 Unit Apartments | 0 (0.0%) | 0 (0.0%) |
| 3 or 4 Unit Apartments | 0 (0.0%) | 0 (0.0%) |
| 5 to 9 Unit Apartments | 0 (0.0%) | 0 (0.0%) |
| 10 or more Apartments | 0 (0.0%) | 0 (0.0%) |
| Mobile Home / Other | 85 (100.0%) | 0 (0.0%) |
| Total | 592 (94.1%) | 37 (5.9%) |
Housing Structures by Number of Rooms in Woodland Park
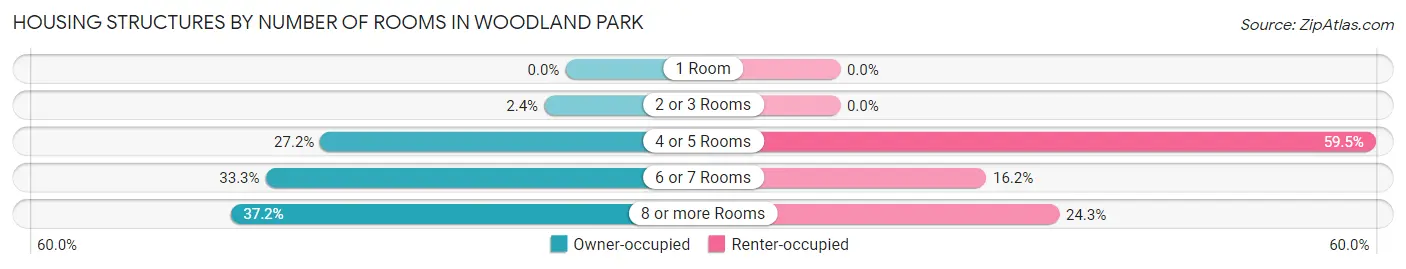
| Number of Rooms | Owner-occupied | Renter-occupied |
| 1 Room | 0 (0.0%) | 0 (0.0%) |
| 2 or 3 Rooms | 14 (2.4%) | 0 (0.0%) |
| 4 or 5 Rooms | 161 (27.2%) | 22 (59.5%) |
| 6 or 7 Rooms | 197 (33.3%) | 6 (16.2%) |
| 8 or more Rooms | 220 (37.2%) | 9 (24.3%) |
| Total | 592 (100.0%) | 37 (100.0%) |
Housing Structure by Heating Type in Woodland Park
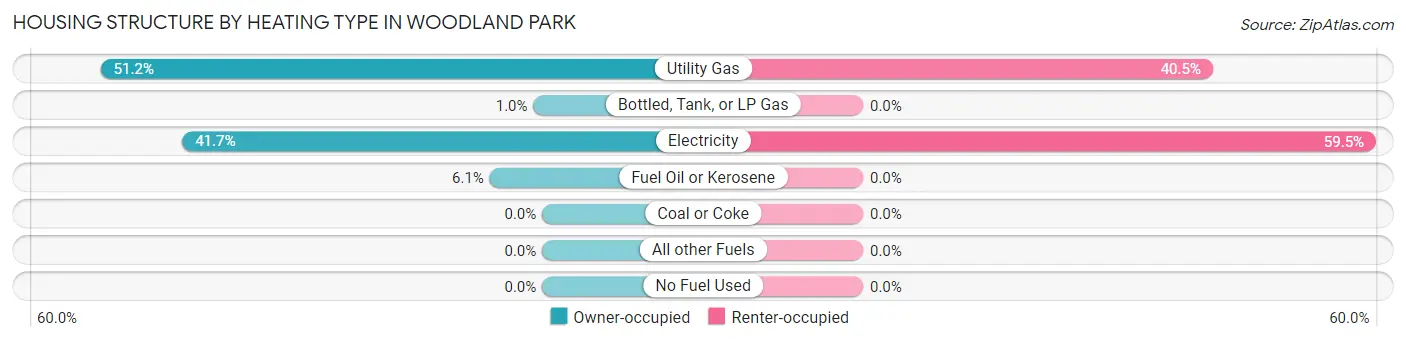
| Heating Type | Owner-occupied | Renter-occupied |
| Utility Gas | 303 (51.2%) | 15 (40.5%) |
| Bottled, Tank, or LP Gas | 6 (1.0%) | 0 (0.0%) |
| Electricity | 247 (41.7%) | 22 (59.5%) |
| Fuel Oil or Kerosene | 36 (6.1%) | 0 (0.0%) |
| Coal or Coke | 0 (0.0%) | 0 (0.0%) |
| All other Fuels | 0 (0.0%) | 0 (0.0%) |
| No Fuel Used | 0 (0.0%) | 0 (0.0%) |
| Total | 592 (100.0%) | 37 (100.0%) |
Household Vehicle Usage in Woodland Park
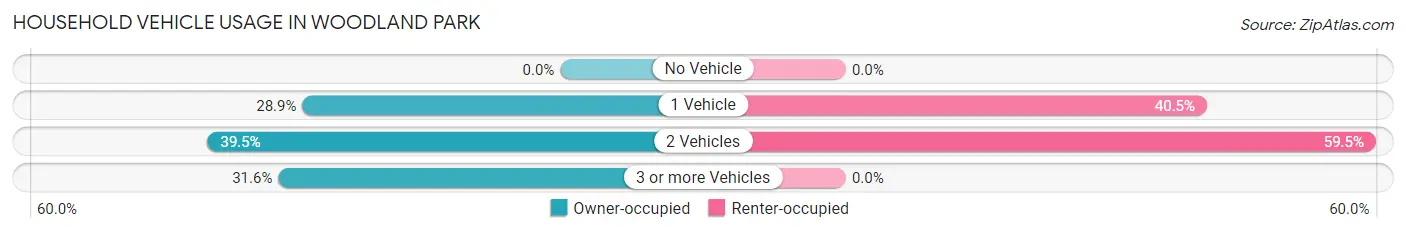
| Vehicles per Household | Owner-occupied | Renter-occupied |
| No Vehicle | 0 (0.0%) | 0 (0.0%) |
| 1 Vehicle | 171 (28.9%) | 15 (40.5%) |
| 2 Vehicles | 234 (39.5%) | 22 (59.5%) |
| 3 or more Vehicles | 187 (31.6%) | 0 (0.0%) |
| Total | 592 (100.0%) | 37 (100.0%) |
Real Estate & Mortgages in Woodland Park
Real Estate and Mortgage Overview in Woodland Park
| Characteristic | Without Mortgage | With Mortgage |
| Housing Units | 197 | 395 |
| Median Property Value | - | - |
| Median Household Income | $47,188 | $122 |
| Monthly Housing Costs | $486 | $0 |
| Real Estate Taxes | $1,528 | $0 |
Property Value by Mortgage Status in Woodland Park
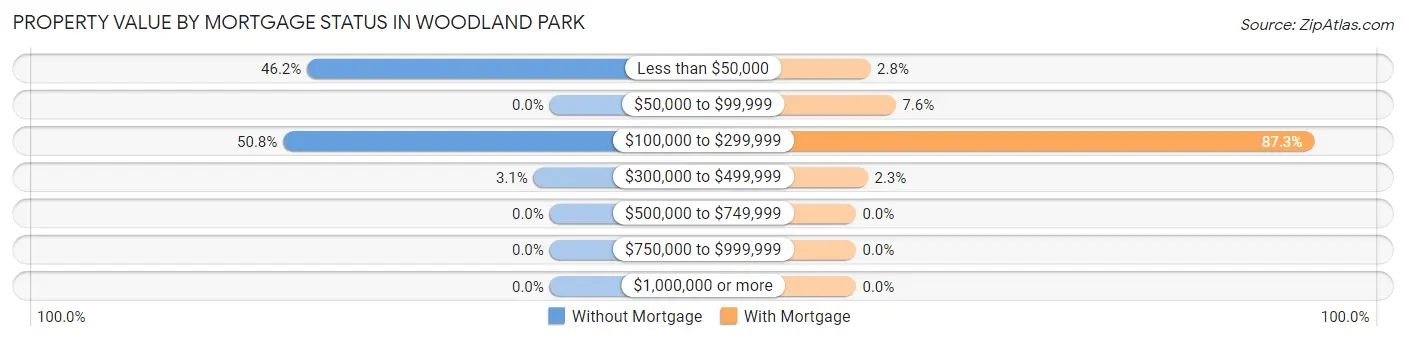
| Property Value | Without Mortgage | With Mortgage |
| Less than $50,000 | 91 (46.2%) | 11 (2.8%) |
| $50,000 to $99,999 | 0 (0.0%) | 30 (7.6%) |
| $100,000 to $299,999 | 100 (50.8%) | 345 (87.3%) |
| $300,000 to $499,999 | 6 (3.0%) | 9 (2.3%) |
| $500,000 to $749,999 | 0 (0.0%) | 0 (0.0%) |
| $750,000 to $999,999 | 0 (0.0%) | 0 (0.0%) |
| $1,000,000 or more | 0 (0.0%) | 0 (0.0%) |
| Total | 197 (100.0%) | 395 (100.0%) |
Household Income by Mortgage Status in Woodland Park
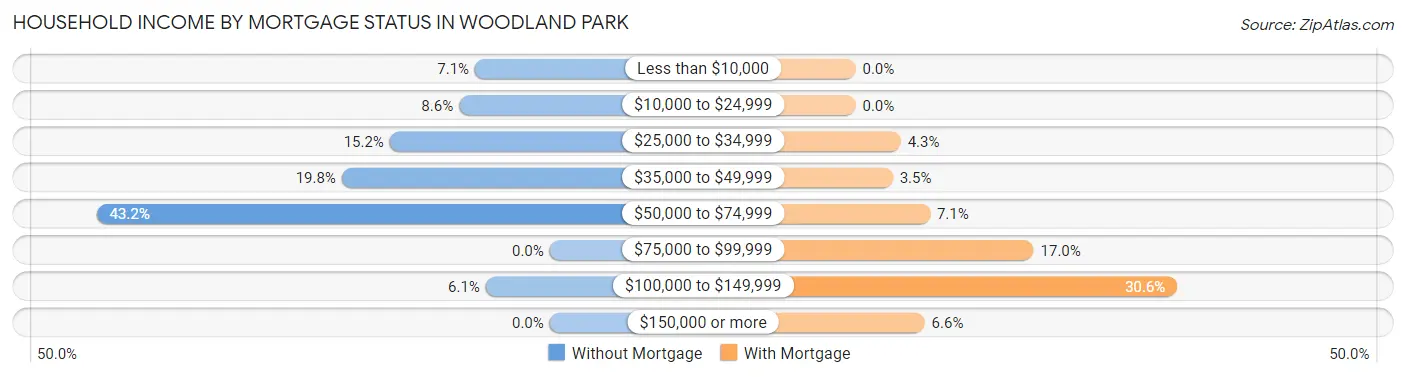
| Household Income | Without Mortgage | With Mortgage |
| Less than $10,000 | 14 (7.1%) | 0 (0.0%) |
| $10,000 to $24,999 | 17 (8.6%) | 0 (0.0%) |
| $25,000 to $34,999 | 30 (15.2%) | 17 (4.3%) |
| $35,000 to $49,999 | 39 (19.8%) | 14 (3.5%) |
| $50,000 to $74,999 | 85 (43.1%) | 28 (7.1%) |
| $75,000 to $99,999 | 0 (0.0%) | 67 (17.0%) |
| $100,000 to $149,999 | 12 (6.1%) | 121 (30.6%) |
| $150,000 or more | 0 (0.0%) | 26 (6.6%) |
| Total | 197 (100.0%) | 395 (100.0%) |
Property Value to Household Income Ratio in Woodland Park
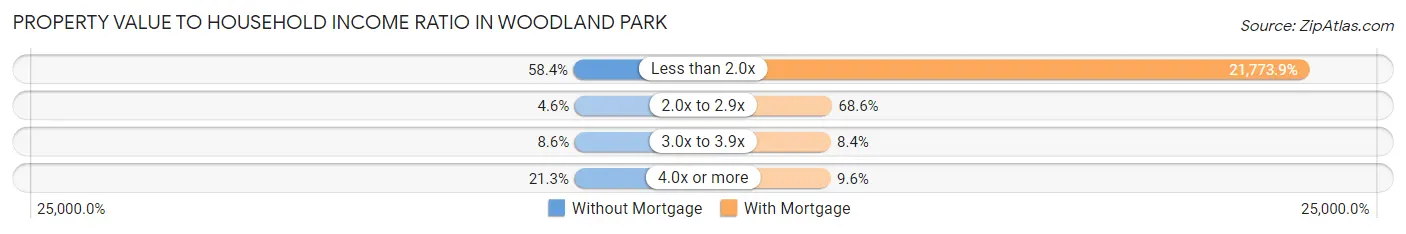
| Value-to-Income Ratio | Without Mortgage | With Mortgage |
| Less than 2.0x | 115 (58.4%) | 86,007 (21,773.9%) |
| 2.0x to 2.9x | 9 (4.6%) | 271 (68.6%) |
| 3.0x to 3.9x | 17 (8.6%) | 33 (8.4%) |
| 4.0x or more | 42 (21.3%) | 38 (9.6%) |
| Total | 197 (100.0%) | 395 (100.0%) |
Real Estate Taxes by Mortgage Status in Woodland Park
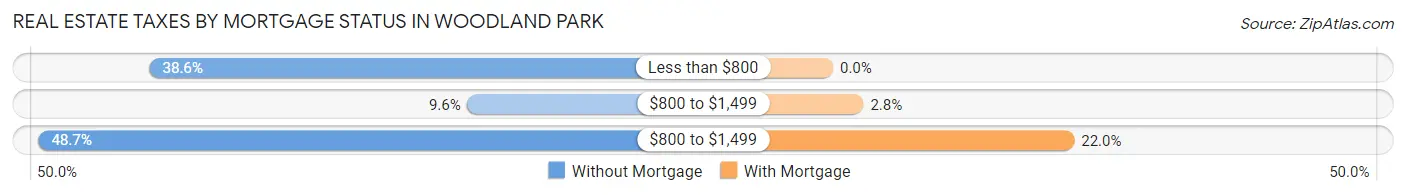
| Property Taxes | Without Mortgage | With Mortgage |
| Less than $800 | 76 (38.6%) | 0 (0.0%) |
| $800 to $1,499 | 19 (9.6%) | 11 (2.8%) |
| $800 to $1,499 | 96 (48.7%) | 87 (22.0%) |
| Total | 197 (100.0%) | 395 (100.0%) |
Health & Disability in Woodland Park
Health Insurance Coverage by Age in Woodland Park
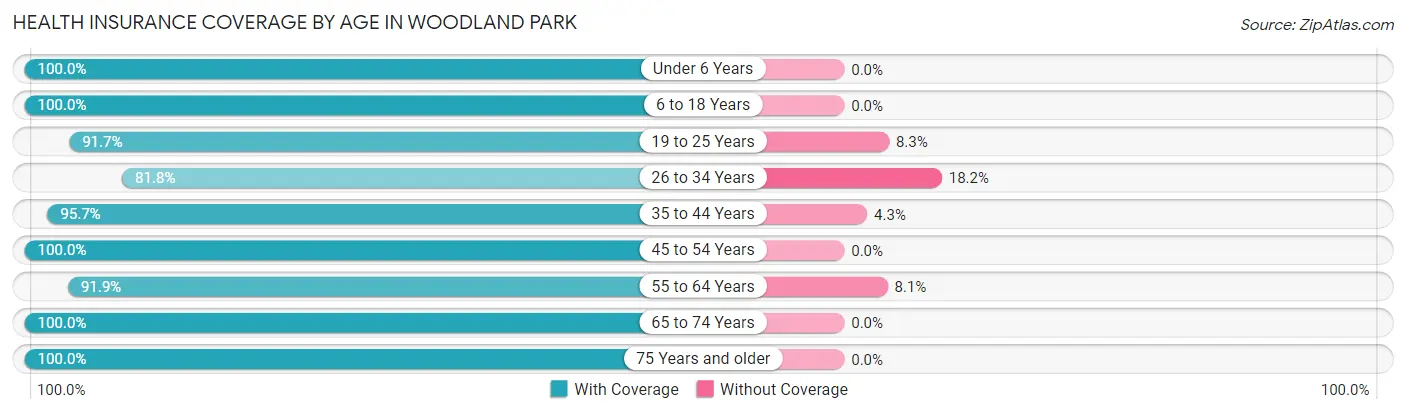
| Age Bracket | With Coverage | Without Coverage |
| Under 6 Years | 262 (100.0%) | 0 (0.0%) |
| 6 to 18 Years | 237 (100.0%) | 0 (0.0%) |
| 19 to 25 Years | 77 (91.7%) | 7 (8.3%) |
| 26 to 34 Years | 126 (81.8%) | 28 (18.2%) |
| 35 to 44 Years | 247 (95.7%) | 11 (4.3%) |
| 45 to 54 Years | 181 (100.0%) | 0 (0.0%) |
| 55 to 64 Years | 273 (91.9%) | 24 (8.1%) |
| 65 to 74 Years | 139 (100.0%) | 0 (0.0%) |
| 75 Years and older | 42 (100.0%) | 0 (0.0%) |
| Total | 1,584 (95.8%) | 70 (4.2%) |
Health Insurance Coverage by Citizenship Status in Woodland Park
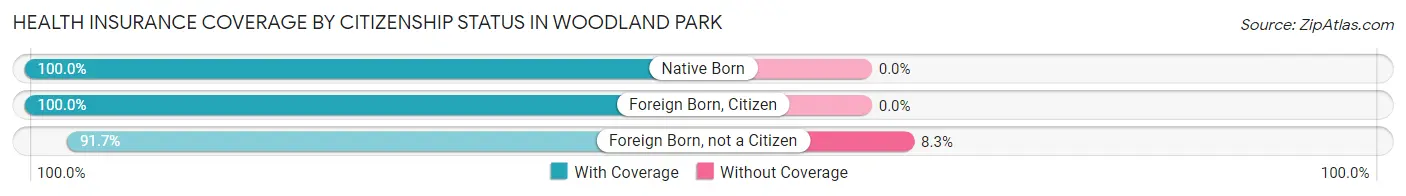
| Citizenship Status | With Coverage | Without Coverage |
| Native Born | 262 (100.0%) | 0 (0.0%) |
| Foreign Born, Citizen | 237 (100.0%) | 0 (0.0%) |
| Foreign Born, not a Citizen | 77 (91.7%) | 7 (8.3%) |
Health Insurance Coverage by Household Income in Woodland Park
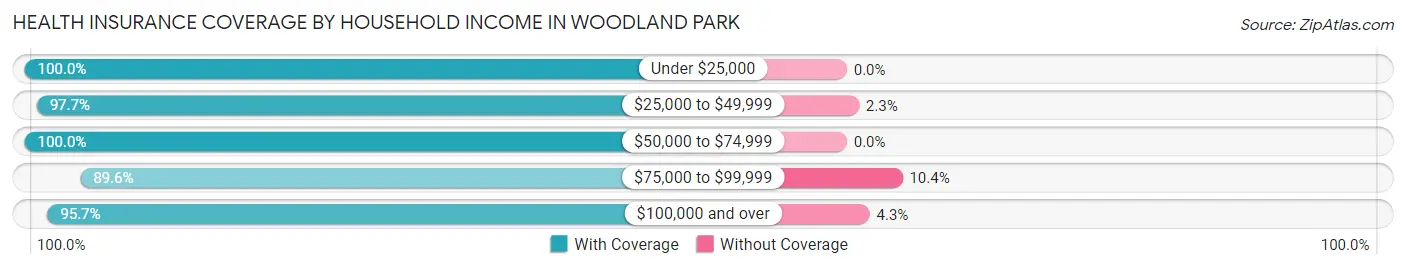
| Household Income | With Coverage | Without Coverage |
| Under $25,000 | 71 (100.0%) | 0 (0.0%) |
| $25,000 to $49,999 | 302 (97.7%) | 7 (2.3%) |
| $50,000 to $74,999 | 338 (100.0%) | 0 (0.0%) |
| $75,000 to $99,999 | 335 (89.6%) | 39 (10.4%) |
| $100,000 and over | 538 (95.7%) | 24 (4.3%) |
Public vs Private Health Insurance Coverage by Age in Woodland Park
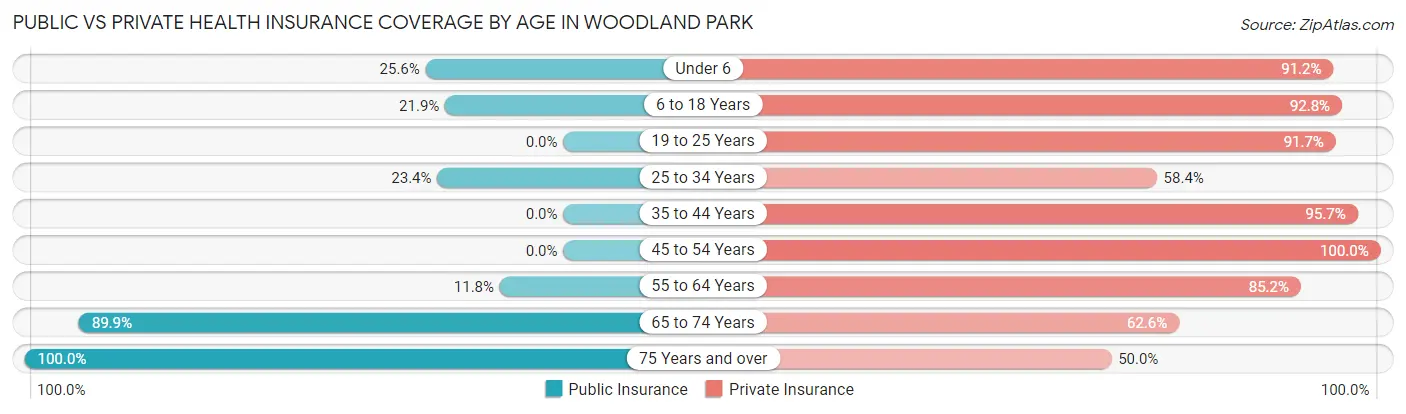
| Age Bracket | Public Insurance | Private Insurance |
| Under 6 | 67 (25.6%) | 239 (91.2%) |
| 6 to 18 Years | 52 (21.9%) | 220 (92.8%) |
| 19 to 25 Years | 0 (0.0%) | 77 (91.7%) |
| 25 to 34 Years | 36 (23.4%) | 90 (58.4%) |
| 35 to 44 Years | 0 (0.0%) | 247 (95.7%) |
| 45 to 54 Years | 0 (0.0%) | 181 (100.0%) |
| 55 to 64 Years | 35 (11.8%) | 253 (85.2%) |
| 65 to 74 Years | 125 (89.9%) | 87 (62.6%) |
| 75 Years and over | 42 (100.0%) | 21 (50.0%) |
| Total | 357 (21.6%) | 1,415 (85.6%) |
Disability Status by Sex by Age in Woodland Park
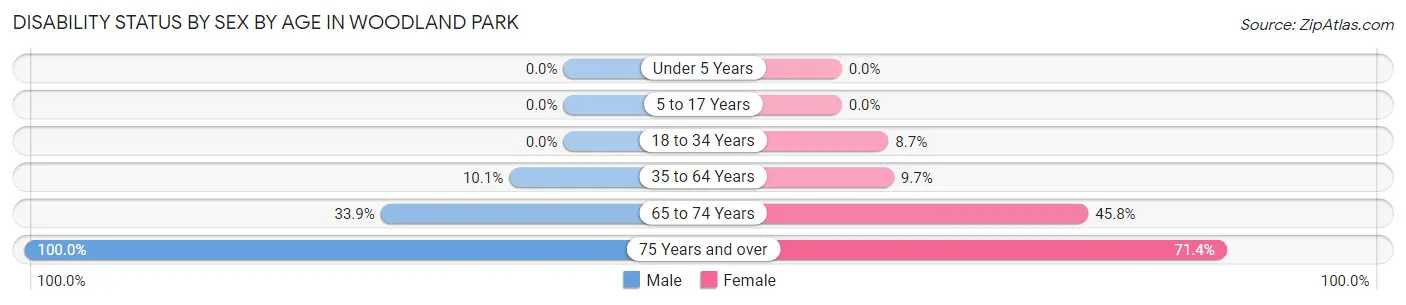
| Age Bracket | Male | Female |
| Under 5 Years | 0 (0.0%) | 0 (0.0%) |
| 5 to 17 Years | 0 (0.0%) | 0 (0.0%) |
| 18 to 34 Years | 0 (0.0%) | 9 (8.6%) |
| 35 to 64 Years | 44 (10.1%) | 29 (9.7%) |
| 65 to 74 Years | 19 (33.9%) | 38 (45.8%) |
| 75 Years and over | 21 (100.0%) | 15 (71.4%) |
Disability Class by Sex by Age in Woodland Park
Disability Class: Hearing Difficulty
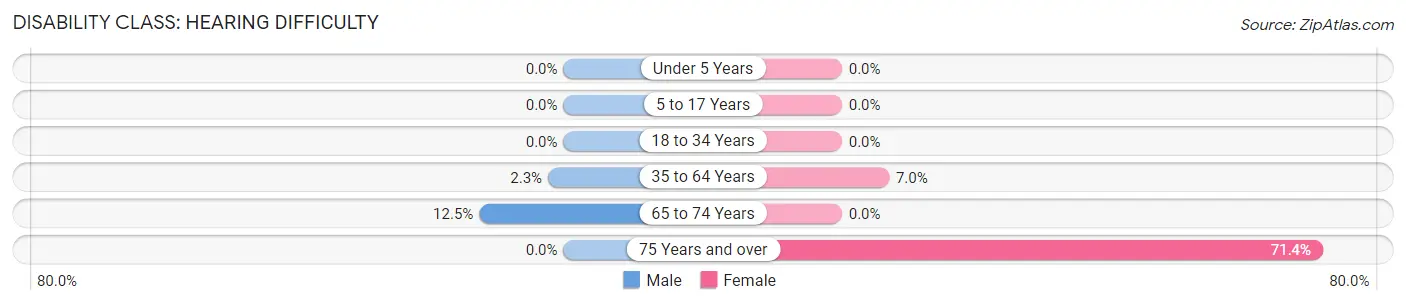
| Age Bracket | Male | Female |
| Under 5 Years | 0 (0.0%) | 0 (0.0%) |
| 5 to 17 Years | 0 (0.0%) | 0 (0.0%) |
| 18 to 34 Years | 0 (0.0%) | 0 (0.0%) |
| 35 to 64 Years | 10 (2.3%) | 21 (7.0%) |
| 65 to 74 Years | 7 (12.5%) | 0 (0.0%) |
| 75 Years and over | 0 (0.0%) | 15 (71.4%) |
Disability Class: Vision Difficulty
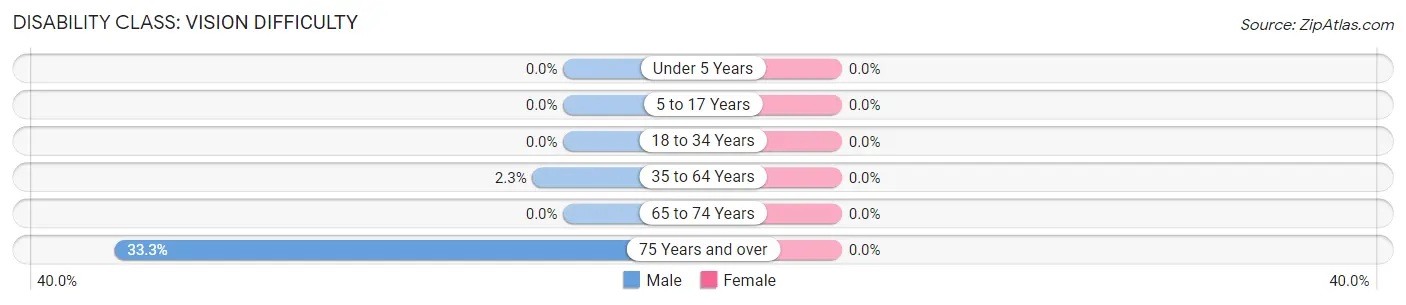
| Age Bracket | Male | Female |
| Under 5 Years | 0 (0.0%) | 0 (0.0%) |
| 5 to 17 Years | 0 (0.0%) | 0 (0.0%) |
| 18 to 34 Years | 0 (0.0%) | 0 (0.0%) |
| 35 to 64 Years | 10 (2.3%) | 0 (0.0%) |
| 65 to 74 Years | 0 (0.0%) | 0 (0.0%) |
| 75 Years and over | 7 (33.3%) | 0 (0.0%) |
Disability Class: Cognitive Difficulty
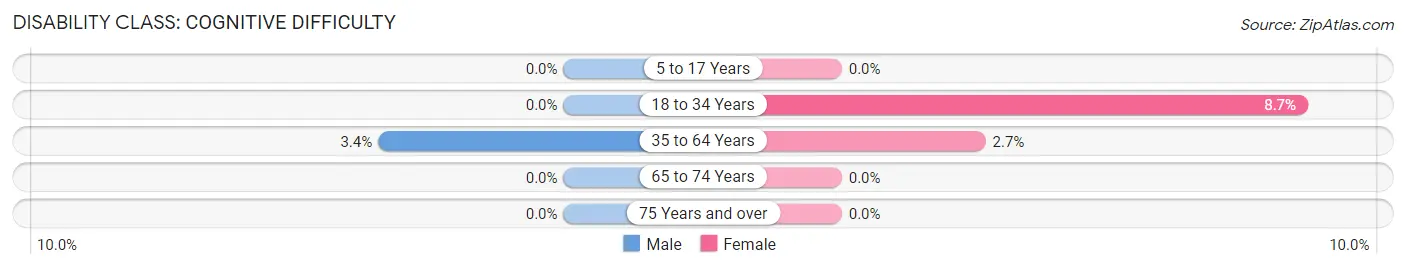
| Age Bracket | Male | Female |
| 5 to 17 Years | 0 (0.0%) | 0 (0.0%) |
| 18 to 34 Years | 0 (0.0%) | 9 (8.6%) |
| 35 to 64 Years | 15 (3.4%) | 8 (2.7%) |
| 65 to 74 Years | 0 (0.0%) | 0 (0.0%) |
| 75 Years and over | 0 (0.0%) | 0 (0.0%) |
Disability Class: Ambulatory Difficulty
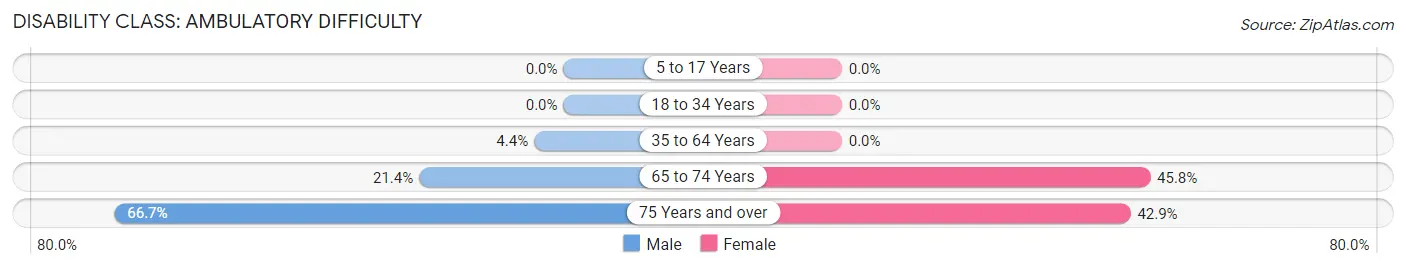
| Age Bracket | Male | Female |
| 5 to 17 Years | 0 (0.0%) | 0 (0.0%) |
| 18 to 34 Years | 0 (0.0%) | 0 (0.0%) |
| 35 to 64 Years | 19 (4.4%) | 0 (0.0%) |
| 65 to 74 Years | 12 (21.4%) | 38 (45.8%) |
| 75 Years and over | 14 (66.7%) | 9 (42.9%) |
Disability Class: Self-Care Difficulty
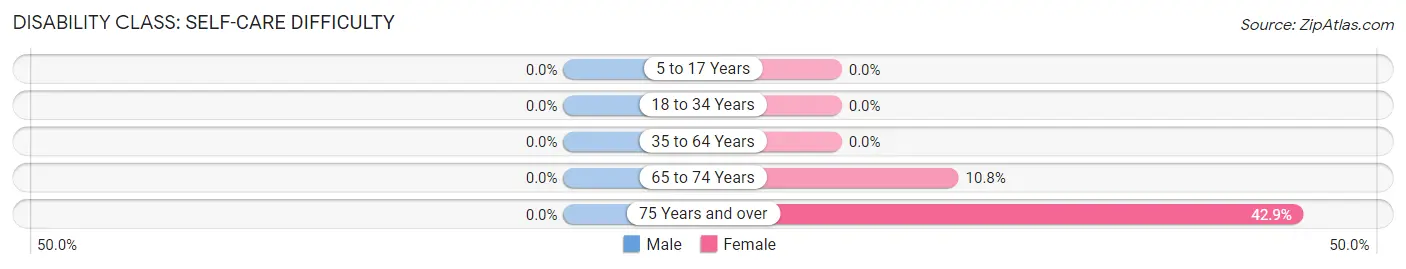
| Age Bracket | Male | Female |
| 5 to 17 Years | 0 (0.0%) | 0 (0.0%) |
| 18 to 34 Years | 0 (0.0%) | 0 (0.0%) |
| 35 to 64 Years | 0 (0.0%) | 0 (0.0%) |
| 65 to 74 Years | 0 (0.0%) | 9 (10.8%) |
| 75 Years and over | 0 (0.0%) | 9 (42.9%) |
Technology Access in Woodland Park
Computing Device Access in Woodland Park
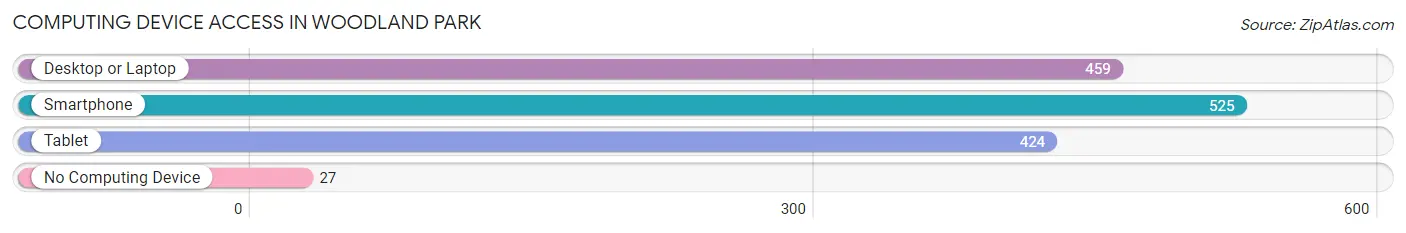
| Device Type | # Households | % Households |
| Desktop or Laptop | 459 | 73.0% |
| Smartphone | 525 | 83.5% |
| Tablet | 424 | 67.4% |
| No Computing Device | 27 | 4.3% |
| Total | 629 | 100.0% |
Internet Access in Woodland Park
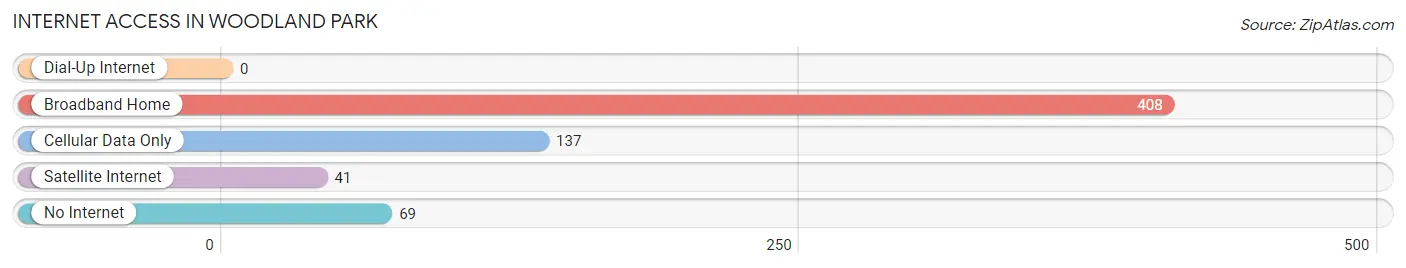
| Internet Type | # Households | % Households |
| Dial-Up Internet | 0 | 0.0% |
| Broadband Home | 408 | 64.9% |
| Cellular Data Only | 137 | 21.8% |
| Satellite Internet | 41 | 6.5% |
| No Internet | 69 | 11.0% |
| Total | 629 | 100.0% |
Woodland Park Summary
Woodland Park is a small city located in Douglas County, Nebraska. It is situated on the banks of the Platte River, just south of Omaha. The city has a population of approximately 4,000 people and is part of the Omaha-Council Bluffs metropolitan area.
Geography
Woodland Park is located in the eastern part of Douglas County, Nebraska. It is situated on the banks of the Platte River, just south of Omaha. The city has a total area of 1.3 square miles, all of which is land. The terrain is mostly flat, with some rolling hills in the area. The climate is humid continental, with hot summers and cold winters.
History
Woodland Park was founded in 1887 by a group of settlers from Iowa. The city was originally known as “Woodland”, but the name was changed to “Woodland Park” in 1895. The city was incorporated in 1902.
In the early 1900s, the city was a popular destination for tourists, who came to enjoy the natural beauty of the area. The city was also home to a number of resorts, including the Woodland Park Hotel, which was built in 1906.
In the 1950s, the city began to experience a decline in population as people moved to larger cities. However, in the late 1980s, the city began to experience a resurgence in population as people moved back to the area.
Economy
The economy of Woodland Park is largely based on tourism and retail. The city is home to a number of small businesses, including restaurants, shops, and other services. The city is also home to a number of manufacturing companies, including a plastics factory and a metal fabrication plant.
The city is also home to a number of educational institutions, including the University of Nebraska at Omaha and the University of Nebraska Medical Center.
Demographics
As of the 2010 census, the population of Woodland Park was 4,000. The racial makeup of the city was 90.2% White, 4.2% African American, 0.7% Native American, 1.2% Asian, 0.1% Pacific Islander, 1.2% from other races, and 2.6% from two or more races. Hispanic or Latino of any race were 4.2% of the population.
The median income for a household in the city was $45,000, and the median income for a family was $50,000. The per capita income for the city was $20,000. About 8.2% of families and 10.2% of the population were below the poverty line, including 14.2% of those under age 18 and 6.2% of those age 65 or over.
Conclusion
Woodland Park is a small city located in Douglas County, Nebraska. It is situated on the banks of the Platte River, just south of Omaha. The city has a population of approximately 4,000 people and is part of the Omaha-Council Bluffs metropolitan area. The economy of Woodland Park is largely based on tourism and retail, and the city is home to a number of educational institutions. The racial makeup of the city is mostly White, with a small percentage of African American, Native American, Asian, and Pacific Islander residents. The median income for a household in the city is $45,000, and the per capita income is $20,000.
Common Questions
What is Per Capita Income in Woodland Park?
Per Capita income in Woodland Park is $31,203.
What is the Median Family Income in Woodland Park?
Median Family Income in Woodland Park is $86,042.
What is the Median Household income in Woodland Park?
Median Household Income in Woodland Park is $68,977.
What is Income or Wage Gap in Woodland Park?
Income or Wage Gap in Woodland Park is 25.4%.
Women in Woodland Park earn 74.6 cents for every dollar earned by a man.
What is Inequality or Gini Index in Woodland Park?
Inequality or Gini Index in Woodland Park is 0.35.
What is the Total Population of Woodland Park?
Total Population of Woodland Park is 1,655.
What is the Total Male Population of Woodland Park?
Total Male Population of Woodland Park is 902.
What is the Total Female Population of Woodland Park?
Total Female Population of Woodland Park is 753.
What is the Ratio of Males per 100 Females in Woodland Park?
There are 119.79 Males per 100 Females in Woodland Park.
What is the Ratio of Females per 100 Males in Woodland Park?
There are 83.48 Females per 100 Males in Woodland Park.
What is the Median Population Age in Woodland Park?
Median Population Age in Woodland Park is 36.2 Years.
What is the Average Family Size in Woodland Park
Average Family Size in Woodland Park is 3.3 People.
What is the Average Household Size in Woodland Park
Average Household Size in Woodland Park is 2.6 People.
How Large is the Labor Force in Woodland Park?
There are 974 People in the Labor Forcein in Woodland Park.
What is the Percentage of People in the Labor Force in Woodland Park?
83.8% of People are in the Labor Force in Woodland Park.
What is the Unemployment Rate in Woodland Park?
Unemployment Rate in Woodland Park is 0.7%.