Wood River, NE Map & Demographics
Wood River Map
Wood River Overview
$28,560
PER CAPITA INCOME
$83,194
AVG FAMILY INCOME
$69,459
AVG HOUSEHOLD INCOME
32.2%
WAGE / INCOME GAP [ % ]
67.8¢/ $1
WAGE / INCOME GAP [ $ ]
0.34
INEQUALITY / GINI INDEX
1,405
TOTAL POPULATION
740
MALE POPULATION
665
FEMALE POPULATION
111.28
MALES / 100 FEMALES
89.86
FEMALES / 100 MALES
35.6
MEDIAN AGE
3.2
AVG FAMILY SIZE
2.8
AVG HOUSEHOLD SIZE
752
LABOR FORCE [ PEOPLE ]
68.3%
PERCENT IN LABOR FORCE
5.2%
UNEMPLOYMENT RATE
Wood River Zip Codes
Wood River Area Codes
Income in Wood River
Income Overview in Wood River
Per Capita Income in Wood River is $28,560, while median incomes of families and households are $83,194 and $69,459 respectively.
| Characteristic | Number | Measure |
| Per Capita Income | 1,405 | $28,560 |
| Median Family Income | 361 | $83,194 |
| Mean Family Income | 361 | $87,003 |
| Median Household Income | 486 | $69,459 |
| Mean Household Income | 486 | $79,069 |
| Income Deficit | 361 | $0 |
| Wage / Income Gap (%) | 1,405 | 32.17% |
| Wage / Income Gap ($) | 1,405 | 67.83¢ per $1 |
| Gini / Inequality Index | 1,405 | 0.34 |
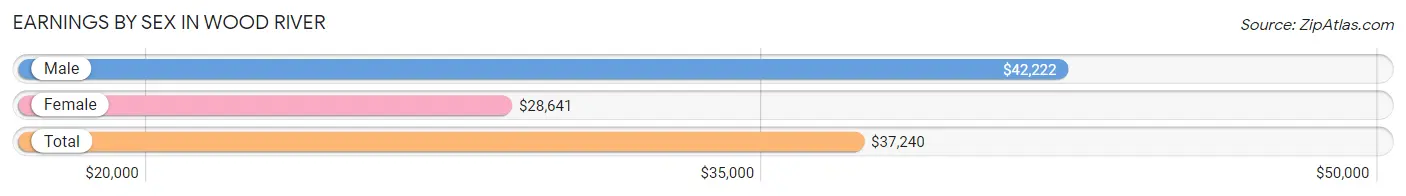
Earnings by Sex in Wood River
Average Earnings in Wood River are $37,240, $42,222 for men and $28,641 for women, a difference of 32.2%.
| Sex | Number | Average Earnings |
| Male | 452 (56.7%) | $42,222 |
| Female | 345 (43.3%) | $28,641 |
| Total | 797 (100.0%) | $37,240 |
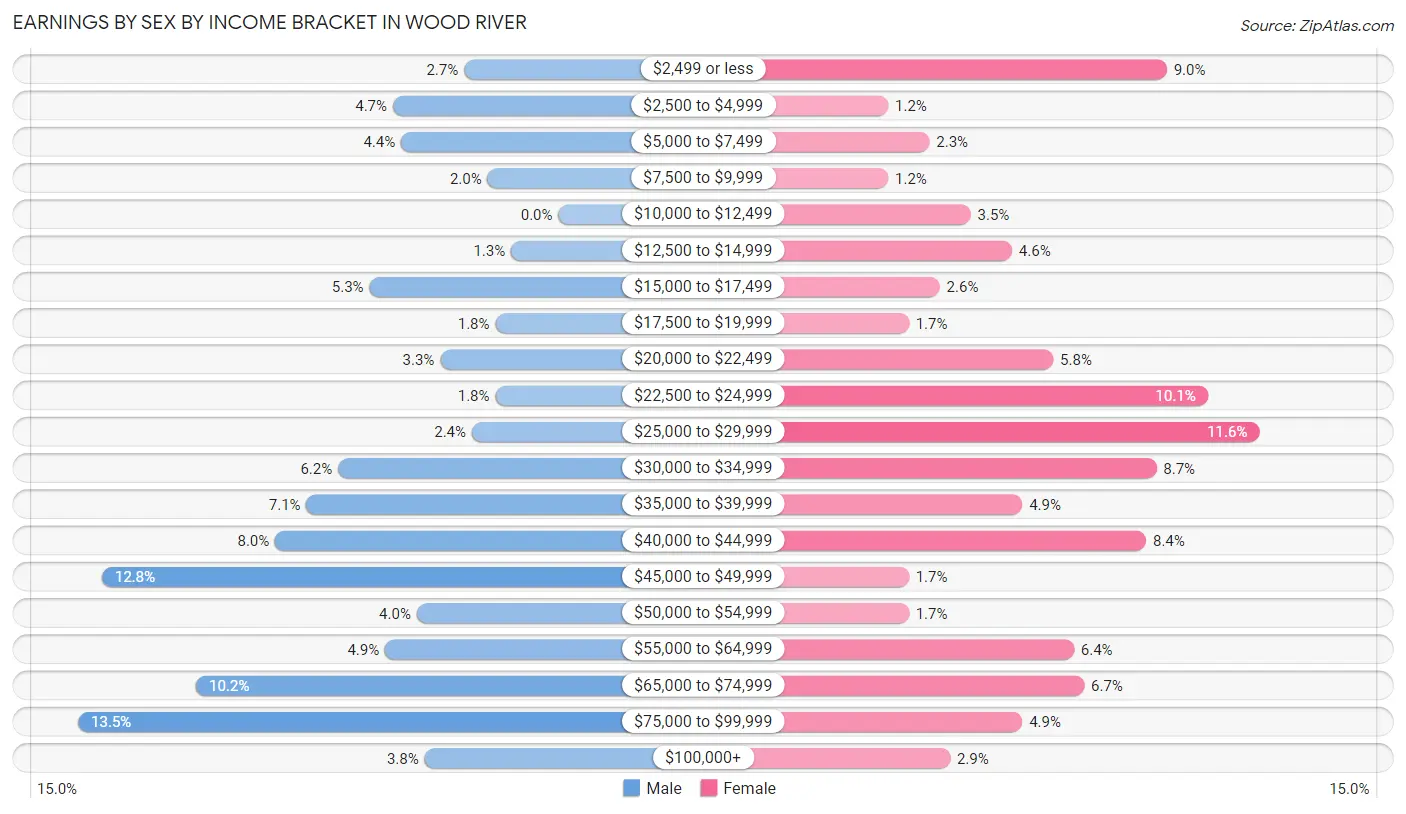
Earnings by Sex by Income Bracket in Wood River
The most common earnings brackets in Wood River are $75,000 to $99,999 for men (61 | 13.5%) and $25,000 to $29,999 for women (40 | 11.6%).
| Income | Male | Female |
| $2,499 or less | 12 (2.6%) | 31 (9.0%) |
| $2,500 to $4,999 | 21 (4.6%) | 4 (1.2%) |
| $5,000 to $7,499 | 20 (4.4%) | 8 (2.3%) |
| $7,500 to $9,999 | 9 (2.0%) | 4 (1.2%) |
| $10,000 to $12,499 | 0 (0.0%) | 12 (3.5%) |
| $12,500 to $14,999 | 6 (1.3%) | 16 (4.6%) |
| $15,000 to $17,499 | 24 (5.3%) | 9 (2.6%) |
| $17,500 to $19,999 | 8 (1.8%) | 6 (1.7%) |
| $20,000 to $22,499 | 15 (3.3%) | 20 (5.8%) |
| $22,500 to $24,999 | 8 (1.8%) | 35 (10.1%) |
| $25,000 to $29,999 | 11 (2.4%) | 40 (11.6%) |
| $30,000 to $34,999 | 28 (6.2%) | 30 (8.7%) |
| $35,000 to $39,999 | 32 (7.1%) | 17 (4.9%) |
| $40,000 to $44,999 | 36 (8.0%) | 29 (8.4%) |
| $45,000 to $49,999 | 58 (12.8%) | 6 (1.7%) |
| $50,000 to $54,999 | 18 (4.0%) | 6 (1.7%) |
| $55,000 to $64,999 | 22 (4.9%) | 22 (6.4%) |
| $65,000 to $74,999 | 46 (10.2%) | 23 (6.7%) |
| $75,000 to $99,999 | 61 (13.5%) | 17 (4.9%) |
| $100,000+ | 17 (3.8%) | 10 (2.9%) |
| Total | 452 (100.0%) | 345 (100.0%) |
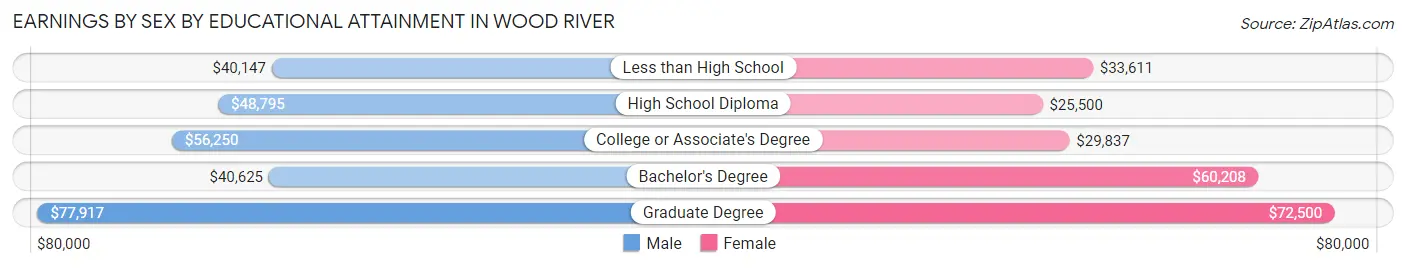
Earnings by Sex by Educational Attainment in Wood River
Average earnings in Wood River are $48,711 for men and $33,036 for women, a difference of 32.2%. Men with an educational attainment of graduate degree enjoy the highest average annual earnings of $77,917, while those with less than high school education earn the least with $40,147. Women with an educational attainment of graduate degree earn the most with the average annual earnings of $72,500, while those with high school diploma education have the smallest earnings of $25,500.
| Educational Attainment | Male Income | Female Income |
| Less than High School | $40,147 | $33,611 |
| High School Diploma | $48,795 | $25,500 |
| College or Associate's Degree | $56,250 | $29,837 |
| Bachelor's Degree | $40,625 | $60,208 |
| Graduate Degree | $77,917 | $72,500 |
| Total | $48,711 | $33,036 |
Family Income in Wood River
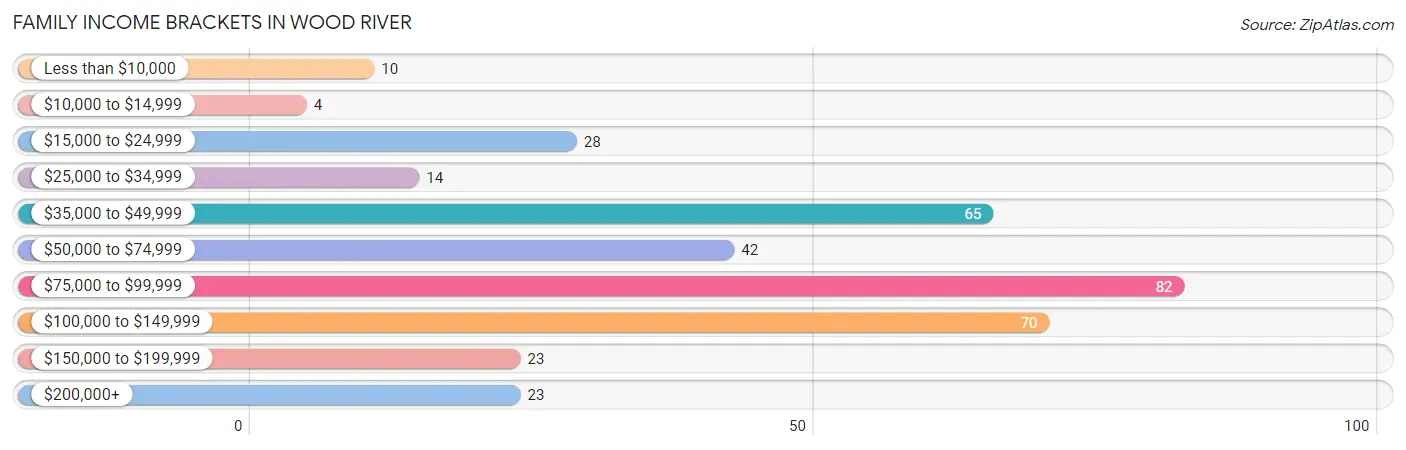
Family Income Brackets in Wood River
According to the Wood River family income data, there are 82 families falling into the $75,000 to $99,999 income range, which is the most common income bracket and makes up 22.7% of all families. Conversely, the $10,000 to $14,999 income bracket is the least frequent group with only 4 families (1.1%) belonging to this category.
| Income Bracket | # Families | % Families |
| Less than $10,000 | 10 | 2.8% |
| $10,000 to $14,999 | 4 | 1.1% |
| $15,000 to $24,999 | 28 | 7.8% |
| $25,000 to $34,999 | 14 | 3.9% |
| $35,000 to $49,999 | 65 | 18.0% |
| $50,000 to $74,999 | 42 | 11.6% |
| $75,000 to $99,999 | 82 | 22.7% |
| $100,000 to $149,999 | 70 | 19.4% |
| $150,000 to $199,999 | 23 | 6.4% |
| $200,000+ | 23 | 6.4% |
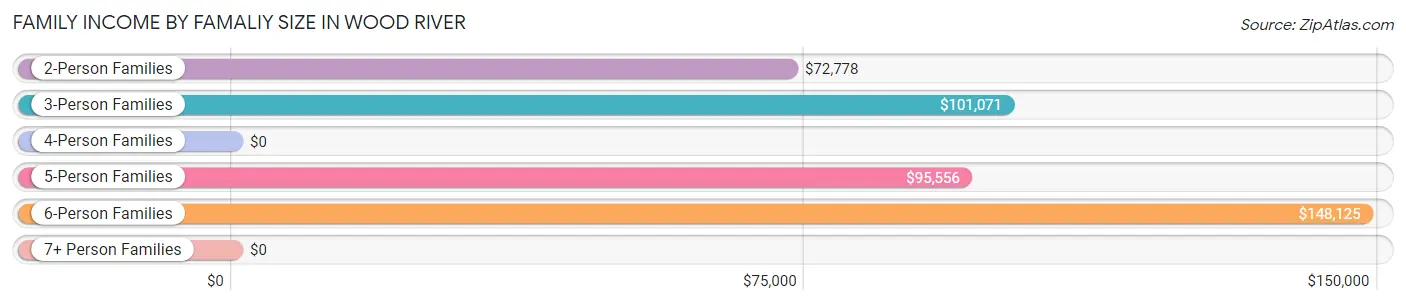
Family Income by Famaliy Size in Wood River
6-person families (7 | 1.9%) account for the highest median family income in Wood River with $148,125 per family, while 2-person families (178 | 49.3%) have the highest median income of $36,389 per family member.
| Income Bracket | # Families | Median Income |
| 2-Person Families | 178 (49.3%) | $72,778 |
| 3-Person Families | 54 (15.0%) | $101,071 |
| 4-Person Families | 80 (22.2%) | $0 |
| 5-Person Families | 42 (11.6%) | $95,556 |
| 6-Person Families | 7 (1.9%) | $148,125 |
| 7+ Person Families | 0 (0.0%) | $0 |
| Total | 361 (100.0%) | $83,194 |
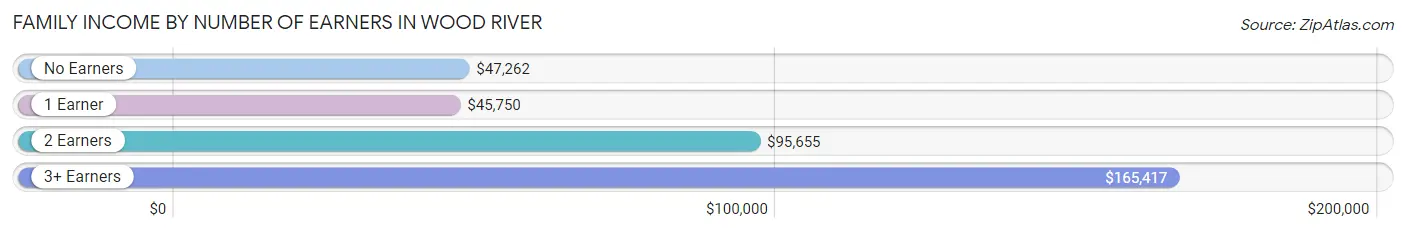
Family Income by Number of Earners in Wood River
The median family income in Wood River is $83,194, with families comprising 3+ earners (49) having the highest median family income of $165,417, while families with 1 earner (93) have the lowest median family income of $45,750, accounting for 13.6% and 25.8% of families, respectively.
| Number of Earners | # Families | Median Income |
| No Earners | 58 (16.1%) | $47,262 |
| 1 Earner | 93 (25.8%) | $45,750 |
| 2 Earners | 161 (44.6%) | $95,655 |
| 3+ Earners | 49 (13.6%) | $165,417 |
| Total | 361 (100.0%) | $83,194 |
Household Income in Wood River
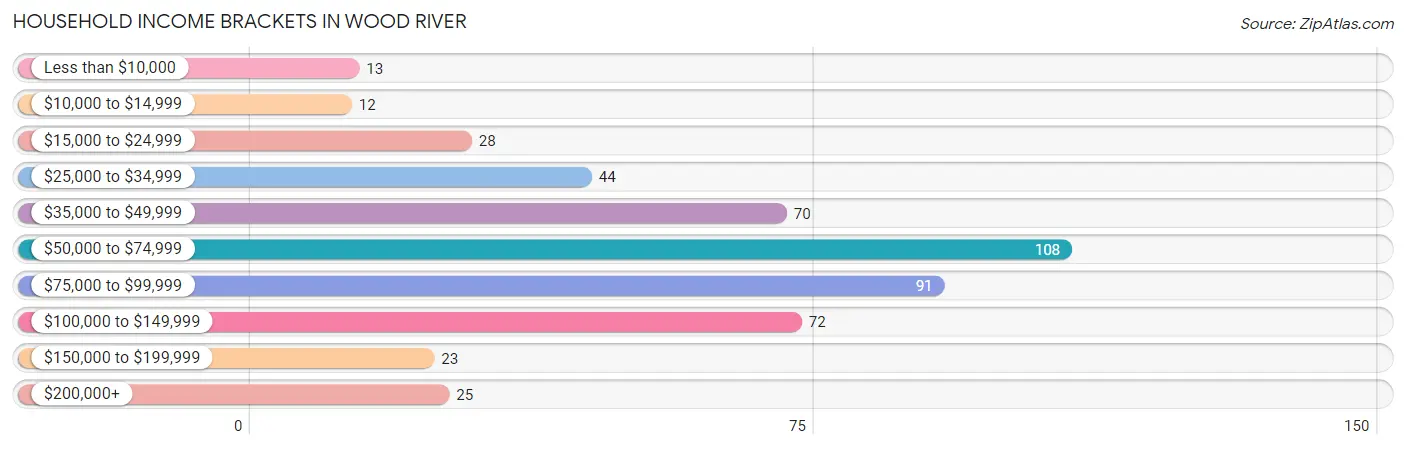
Household Income Brackets in Wood River
With 108 households falling in the category, the $50,000 to $74,999 income range is the most frequent in Wood River, accounting for 22.2% of all households. In contrast, only 12 households (2.5%) fall into the $10,000 to $14,999 income bracket, making it the least populous group.
| Income Bracket | # Households | % Households |
| Less than $10,000 | 13 | 2.7% |
| $10,000 to $14,999 | 12 | 2.5% |
| $15,000 to $24,999 | 28 | 5.8% |
| $25,000 to $34,999 | 44 | 9.1% |
| $35,000 to $49,999 | 70 | 14.4% |
| $50,000 to $74,999 | 108 | 22.2% |
| $75,000 to $99,999 | 91 | 18.7% |
| $100,000 to $149,999 | 72 | 14.8% |
| $150,000 to $199,999 | 23 | 4.7% |
| $200,000+ | 25 | 5.1% |
Household Income by Householder Age in Wood River
The median household income in Wood River is $69,459, with the highest median household income of $98,250 found in the 45 to 64 years age bracket for the primary householder. A total of 149 households (30.7%) fall into this category. Meanwhile, the 65+ years age bracket for the primary householder has the lowest median household income of $45,769, with 126 households (25.9%) in this group.
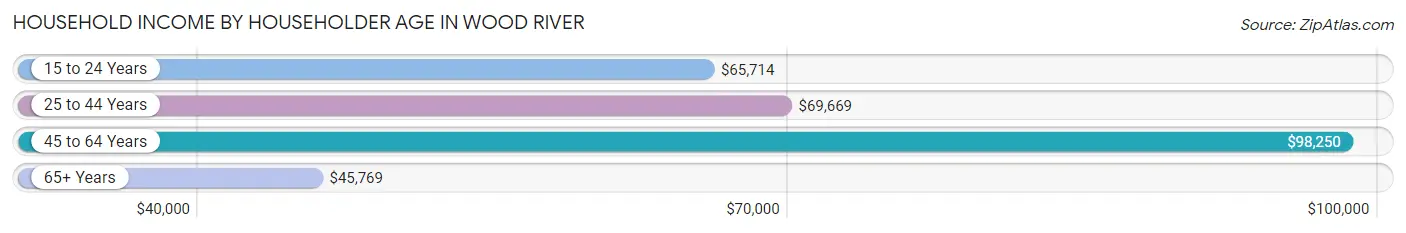
| Income Bracket | # Households | Median Income |
| 15 to 24 Years | 28 (5.8%) | $65,714 |
| 25 to 44 Years | 183 (37.7%) | $69,669 |
| 45 to 64 Years | 149 (30.7%) | $98,250 |
| 65+ Years | 126 (25.9%) | $45,769 |
| Total | 486 (100.0%) | $69,459 |
Poverty in Wood River
Income Below Poverty by Sex and Age in Wood River
With 9.6% poverty level for males and 16.2% for females among the residents of Wood River, 16 and 17 year old males and 5 year old females are the most vulnerable to poverty, with 25 males (52.1%) and 12 females (60.0%) in their respective age groups living below the poverty level.
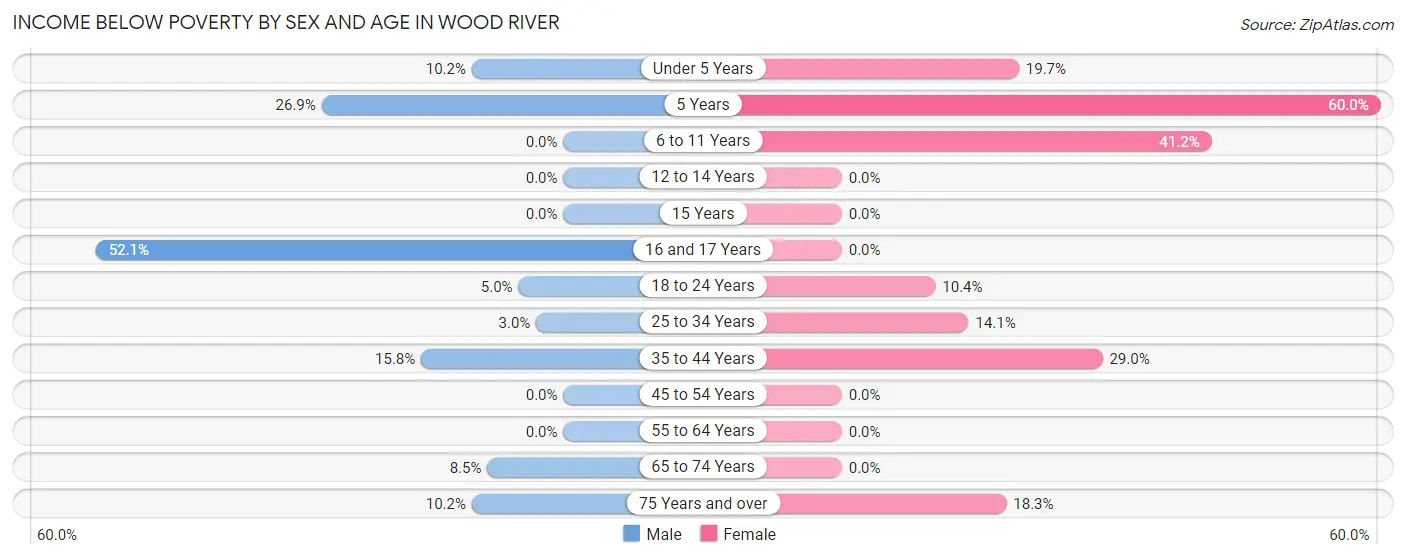
| Age Bracket | Male | Female |
| Under 5 Years | 5 (10.2%) | 14 (19.7%) |
| 5 Years | 7 (26.9%) | 12 (60.0%) |
| 6 to 11 Years | 0 (0.0%) | 21 (41.2%) |
| 12 to 14 Years | 0 (0.0%) | 0 (0.0%) |
| 15 Years | 0 (0.0%) | 0 (0.0%) |
| 16 and 17 Years | 25 (52.1%) | 0 (0.0%) |
| 18 to 24 Years | 4 (5.0%) | 5 (10.4%) |
| 25 to 34 Years | 3 (3.0%) | 12 (14.1%) |
| 35 to 44 Years | 16 (15.8%) | 27 (29.0%) |
| 45 to 54 Years | 0 (0.0%) | 0 (0.0%) |
| 55 to 64 Years | 0 (0.0%) | 0 (0.0%) |
| 65 to 74 Years | 5 (8.5%) | 0 (0.0%) |
| 75 Years and over | 5 (10.2%) | 11 (18.3%) |
| Total | 70 (9.6%) | 102 (16.2%) |
Income Above Poverty by Sex and Age in Wood River
According to the poverty statistics in Wood River, males aged 6 to 11 years and females aged 12 to 14 years are the age groups that are most secure financially, with 100.0% of males and 100.0% of females in these age groups living above the poverty line.
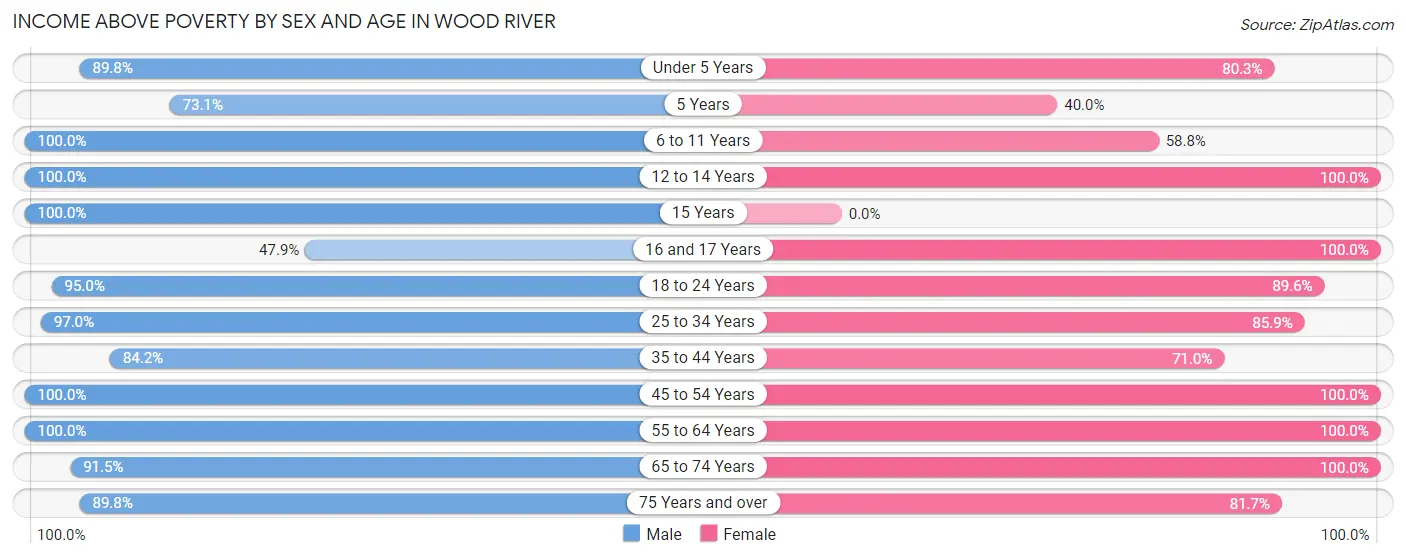
| Age Bracket | Male | Female |
| Under 5 Years | 44 (89.8%) | 57 (80.3%) |
| 5 Years | 19 (73.1%) | 8 (40.0%) |
| 6 to 11 Years | 22 (100.0%) | 30 (58.8%) |
| 12 to 14 Years | 24 (100.0%) | 26 (100.0%) |
| 15 Years | 15 (100.0%) | 0 (0.0%) |
| 16 and 17 Years | 23 (47.9%) | 21 (100.0%) |
| 18 to 24 Years | 76 (95.0%) | 43 (89.6%) |
| 25 to 34 Years | 96 (97.0%) | 73 (85.9%) |
| 35 to 44 Years | 85 (84.2%) | 66 (71.0%) |
| 45 to 54 Years | 87 (100.0%) | 63 (100.0%) |
| 55 to 64 Years | 73 (100.0%) | 64 (100.0%) |
| 65 to 74 Years | 54 (91.5%) | 26 (100.0%) |
| 75 Years and over | 44 (89.8%) | 49 (81.7%) |
| Total | 662 (90.4%) | 526 (83.8%) |
Income Below Poverty Among Married-Couple Families in Wood River
The poverty statistics for married-couple families in Wood River show that 1.5% or 4 of the total 269 families live below the poverty line. Families with 1 or 2 children have the highest poverty rate of 4.8%, comprising of 4 families. On the other hand, families with no children have the lowest poverty rate of 0.0%, which includes 0 families.
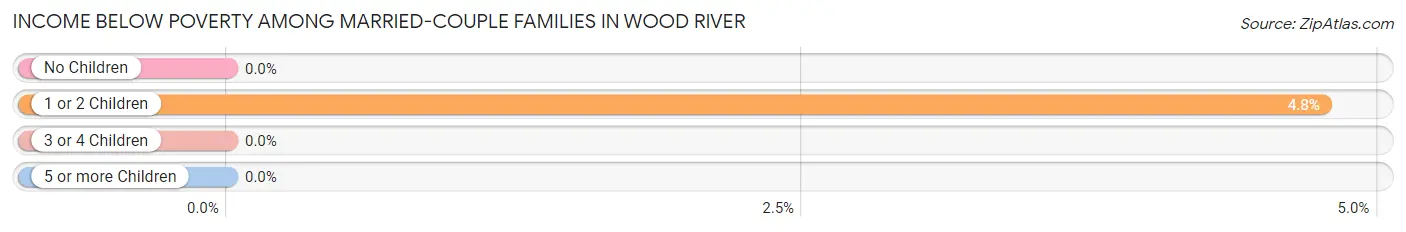
| Children | Above Poverty | Below Poverty |
| No Children | 159 (100.0%) | 0 (0.0%) |
| 1 or 2 Children | 80 (95.2%) | 4 (4.8%) |
| 3 or 4 Children | 26 (100.0%) | 0 (0.0%) |
| 5 or more Children | 0 (0.0%) | 0 (0.0%) |
| Total | 265 (98.5%) | 4 (1.5%) |
Income Below Poverty Among Single-Parent Households in Wood River
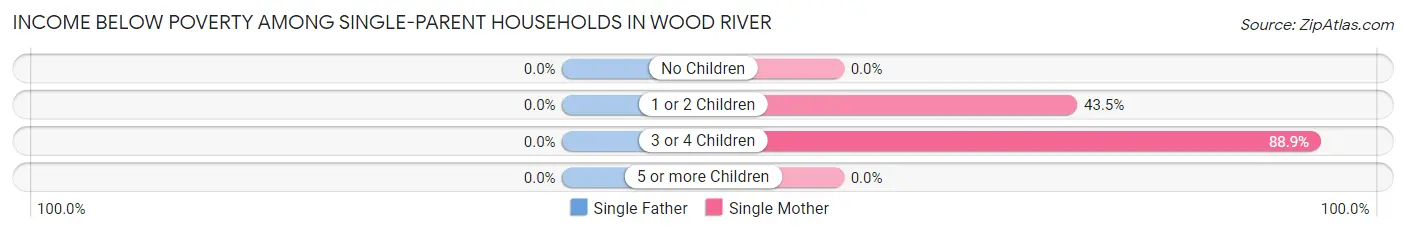
| Children | Single Father | Single Mother |
| No Children | 0 (0.0%) | 0 (0.0%) |
| 1 or 2 Children | 0 (0.0%) | 10 (43.5%) |
| 3 or 4 Children | 0 (0.0%) | 24 (88.9%) |
| 5 or more Children | 0 (0.0%) | 0 (0.0%) |
| Total | 0 (0.0%) | 34 (52.3%) |
Income Below Poverty Among Married-Couple vs Single-Parent Households in Wood River
The poverty data for Wood River shows that 4 of the married-couple family households (1.5%) and 34 of the single-parent households (37.0%) are living below the poverty level. Within the married-couple family households, those with 1 or 2 children have the highest poverty rate, with 4 households (4.8%) falling below the poverty line. Among the single-parent households, those with 3 or 4 children have the highest poverty rate, with 24 household (66.7%) living below poverty.
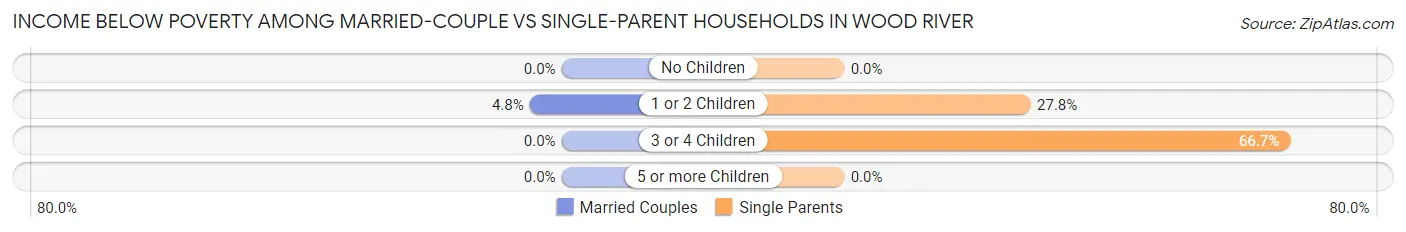
| Children | Married-Couple Families | Single-Parent Households |
| No Children | 0 (0.0%) | 0 (0.0%) |
| 1 or 2 Children | 4 (4.8%) | 10 (27.8%) |
| 3 or 4 Children | 0 (0.0%) | 24 (66.7%) |
| 5 or more Children | 0 (0.0%) | 0 (0.0%) |
| Total | 4 (1.5%) | 34 (37.0%) |
Race in Wood River
The most populous races in Wood River are White / Caucasian (1,185 | 84.3%), Hispanic or Latino (386 | 27.5%), and Some other Race (142 | 10.1%).
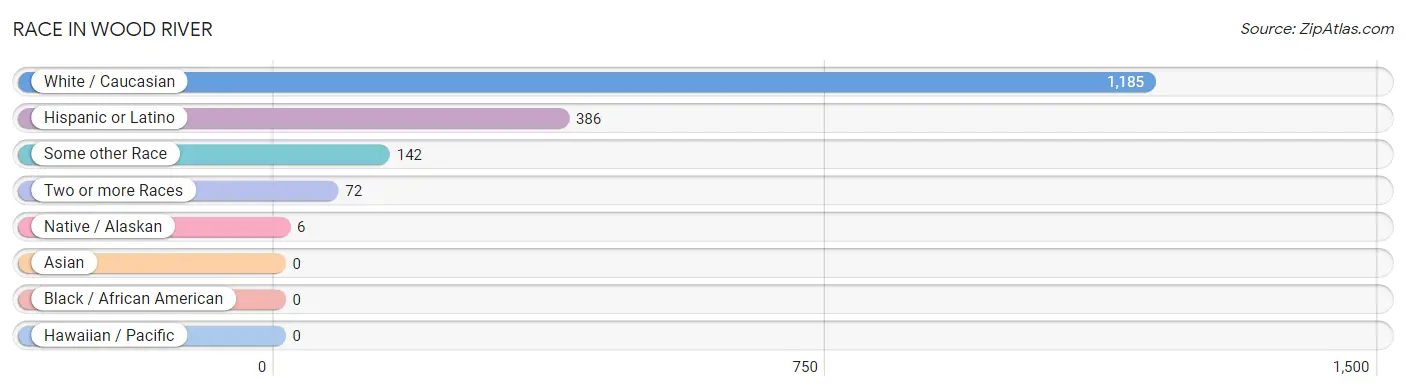
| Race | # Population | % Population |
| Asian | 0 | 0.0% |
| Black / African American | 0 | 0.0% |
| Hawaiian / Pacific | 0 | 0.0% |
| Hispanic or Latino | 386 | 27.5% |
| Native / Alaskan | 6 | 0.4% |
| White / Caucasian | 1,185 | 84.3% |
| Two or more Races | 72 | 5.1% |
| Some other Race | 142 | 10.1% |
| Total | 1,405 | 100.0% |
Ancestry in Wood River
The most populous ancestries reported in Wood River are German (444 | 31.6%), Mexican (359 | 25.6%), Irish (219 | 15.6%), Czech (102 | 7.3%), and English (90 | 6.4%), together accounting for 86.4% of all Wood River residents.
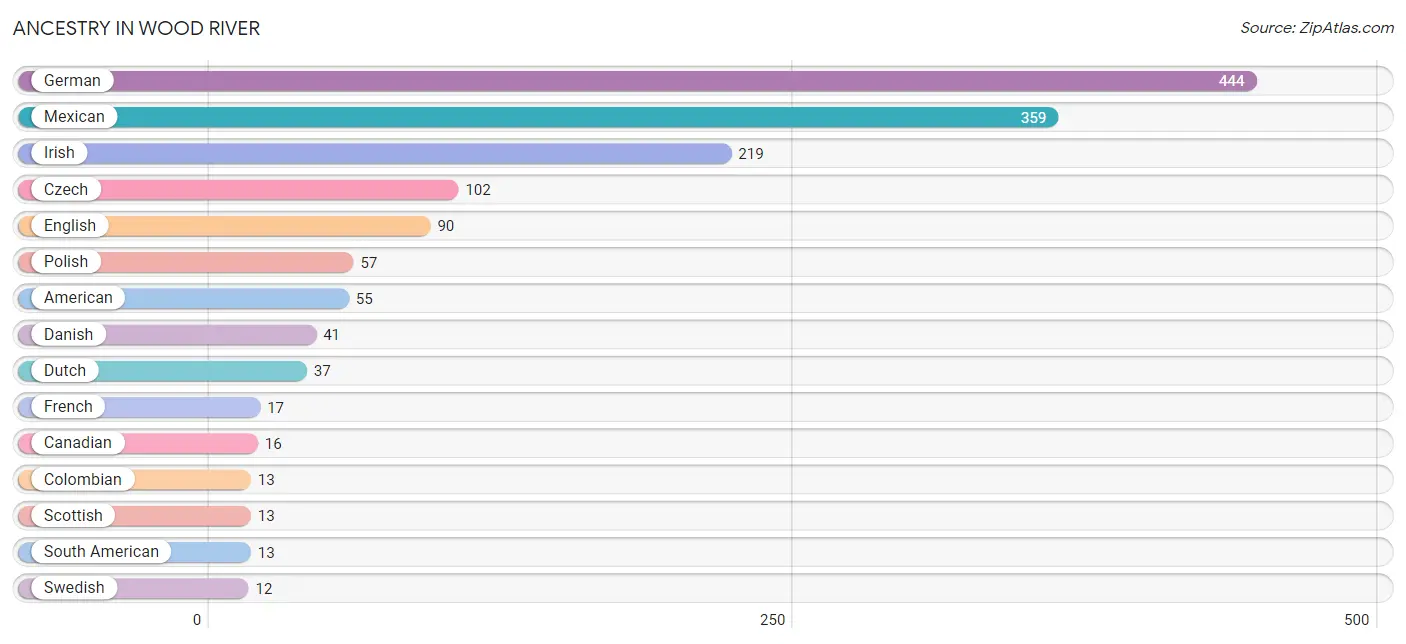
| Ancestry | # Population | % Population |
| American | 55 | 3.9% |
| British | 4 | 0.3% |
| Canadian | 16 | 1.1% |
| Central American | 9 | 0.6% |
| Colombian | 13 | 0.9% |
| Czech | 102 | 7.3% |
| Danish | 41 | 2.9% |
| Dutch | 37 | 2.6% |
| Eastern European | 5 | 0.4% |
| English | 90 | 6.4% |
| European | 11 | 0.8% |
| French | 17 | 1.2% |
| German | 444 | 31.6% |
| Guatemalan | 6 | 0.4% |
| Irish | 219 | 15.6% |
| Italian | 4 | 0.3% |
| Mexican | 359 | 25.6% |
| Pennsylvania German | 11 | 0.8% |
| Polish | 57 | 4.1% |
| Russian | 7 | 0.5% |
| Salvadoran | 3 | 0.2% |
| Scotch-Irish | 9 | 0.6% |
| Scottish | 13 | 0.9% |
| Sioux | 5 | 0.4% |
| South American | 13 | 0.9% |
| Swedish | 12 | 0.9% |
| Welsh | 2 | 0.1% | View All 27 Rows |
Immigrants in Wood River
The most numerous immigrant groups reported in Wood River came from Latin America (77 | 5.5%), Central America (74 | 5.3%), Mexico (71 | 5.1%), Colombia (3 | 0.2%), and El Salvador (3 | 0.2%), together accounting for 16.2% of all Wood River residents.
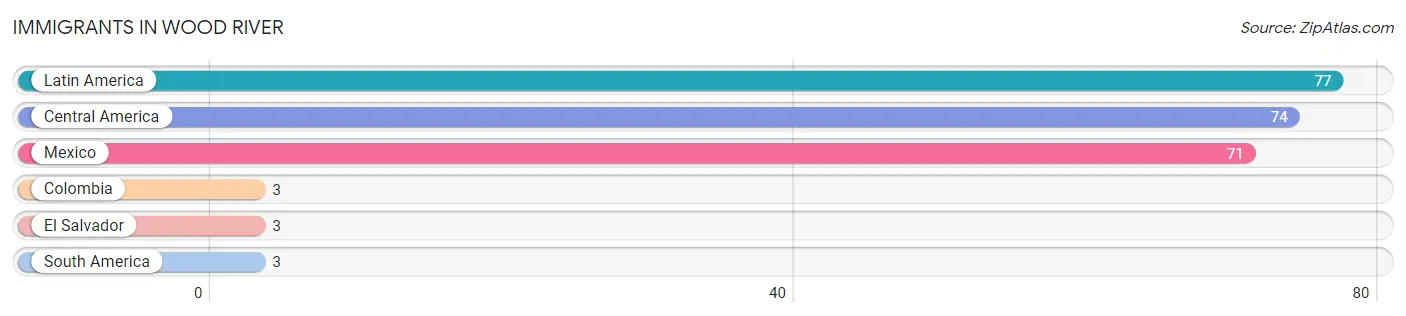
| Immigration Origin | # Population | % Population |
| Central America | 74 | 5.3% |
| Colombia | 3 | 0.2% |
| El Salvador | 3 | 0.2% |
| Latin America | 77 | 5.5% |
| Mexico | 71 | 5.1% |
| South America | 3 | 0.2% | View All 6 Rows |
Sex and Age in Wood River
Sex and Age in Wood River
The most populous age groups in Wood River are 15 to 19 Years (95 | 12.8%) for men and Under 5 Years (71 | 10.7%) for women.
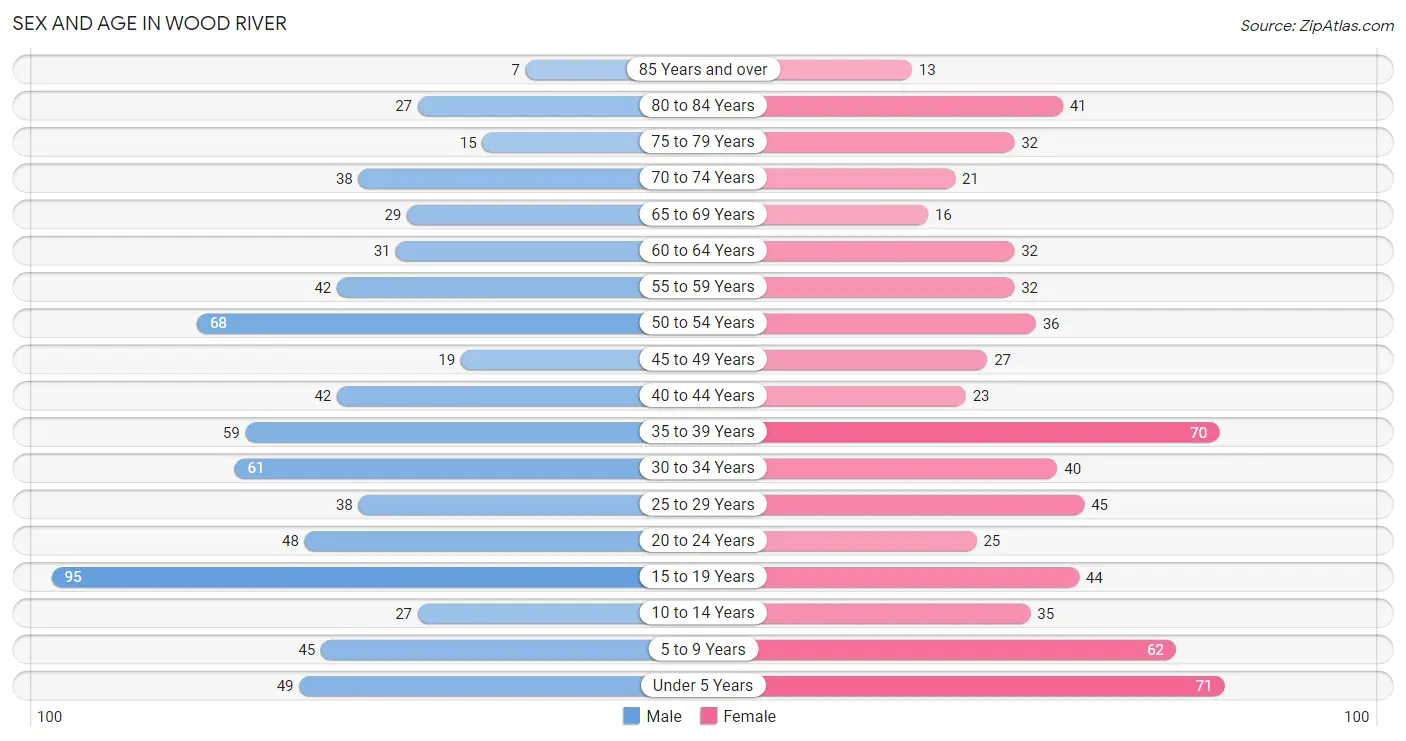
| Age Bracket | Male | Female |
| Under 5 Years | 49 (6.6%) | 71 (10.7%) |
| 5 to 9 Years | 45 (6.1%) | 62 (9.3%) |
| 10 to 14 Years | 27 (3.6%) | 35 (5.3%) |
| 15 to 19 Years | 95 (12.8%) | 44 (6.6%) |
| 20 to 24 Years | 48 (6.5%) | 25 (3.8%) |
| 25 to 29 Years | 38 (5.1%) | 45 (6.8%) |
| 30 to 34 Years | 61 (8.2%) | 40 (6.0%) |
| 35 to 39 Years | 59 (8.0%) | 70 (10.5%) |
| 40 to 44 Years | 42 (5.7%) | 23 (3.5%) |
| 45 to 49 Years | 19 (2.6%) | 27 (4.1%) |
| 50 to 54 Years | 68 (9.2%) | 36 (5.4%) |
| 55 to 59 Years | 42 (5.7%) | 32 (4.8%) |
| 60 to 64 Years | 31 (4.2%) | 32 (4.8%) |
| 65 to 69 Years | 29 (3.9%) | 16 (2.4%) |
| 70 to 74 Years | 38 (5.1%) | 21 (3.2%) |
| 75 to 79 Years | 15 (2.0%) | 32 (4.8%) |
| 80 to 84 Years | 27 (3.6%) | 41 (6.2%) |
| 85 Years and over | 7 (0.9%) | 13 (1.9%) |
| Total | 740 (100.0%) | 665 (100.0%) |
Families and Households in Wood River
Median Family Size in Wood River
The median family size in Wood River is 3.17 persons per family, with married-couple families (269 | 74.5%) accounting for the largest median family size of 3.2 persons per family. On the other hand, single male/father families (27 | 7.5%) represent the smallest median family size with 2.89 persons per family.
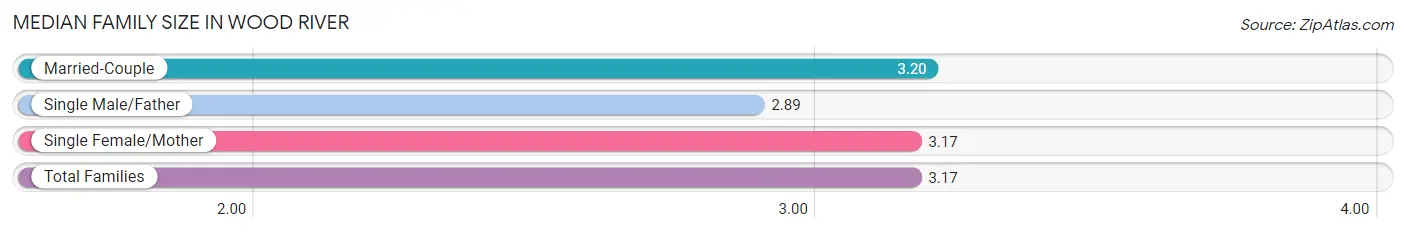
| Family Type | # Families | Family Size |
| Married-Couple | 269 (74.5%) | 3.20 |
| Single Male/Father | 27 (7.5%) | 2.89 |
| Single Female/Mother | 65 (18.0%) | 3.17 |
| Total Families | 361 (100.0%) | 3.17 |
Median Household Size in Wood River
The median household size in Wood River is 2.80 persons per household, with single female/mother households (65 | 13.4%) accounting for the largest median household size of 3.97 persons per household. non-family households (125 | 25.7%) represent the smallest median household size with 1.23 persons per household.
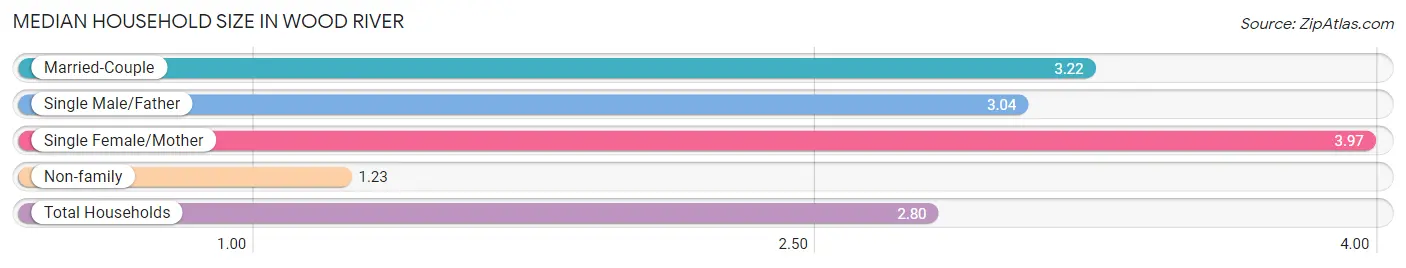
| Household Type | # Households | Household Size |
| Married-Couple | 269 (55.3%) | 3.22 |
| Single Male/Father | 27 (5.6%) | 3.04 |
| Single Female/Mother | 65 (13.4%) | 3.97 |
| Non-family | 125 (25.7%) | 1.23 |
| Total Households | 486 (100.0%) | 2.80 |
Household Size by Marriage Status in Wood River
Out of a total of 486 households in Wood River, 361 (74.3%) are family households, while 125 (25.7%) are nonfamily households. The most numerous type of family households are 2-person households, comprising 157, and the most common type of nonfamily households are 1-person households, comprising 90.
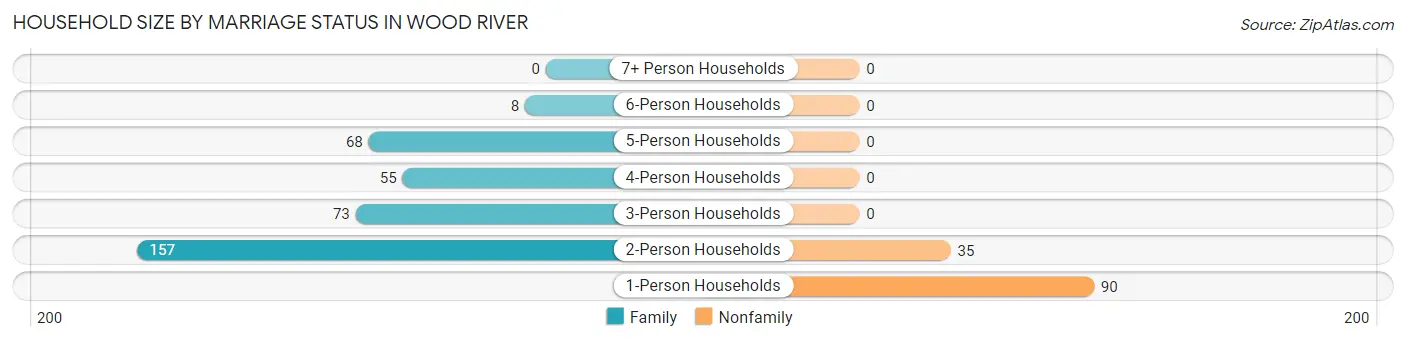
| Household Size | Family Households | Nonfamily Households |
| 1-Person Households | - | 90 (18.5%) |
| 2-Person Households | 157 (32.3%) | 35 (7.2%) |
| 3-Person Households | 73 (15.0%) | 0 (0.0%) |
| 4-Person Households | 55 (11.3%) | 0 (0.0%) |
| 5-Person Households | 68 (14.0%) | 0 (0.0%) |
| 6-Person Households | 8 (1.7%) | 0 (0.0%) |
| 7+ Person Households | 0 (0.0%) | 0 (0.0%) |
| Total | 361 (74.3%) | 125 (25.7%) |
Female Fertility in Wood River
Fertility by Age in Wood River
Average fertility rate in Wood River is 85.0 births per 1,000 women. Women in the age bracket of 20 to 34 years have the highest fertility rate with 218.0 births per 1,000 women. Women in the age bracket of 20 to 34 years acount for 100.0% of all women with births.
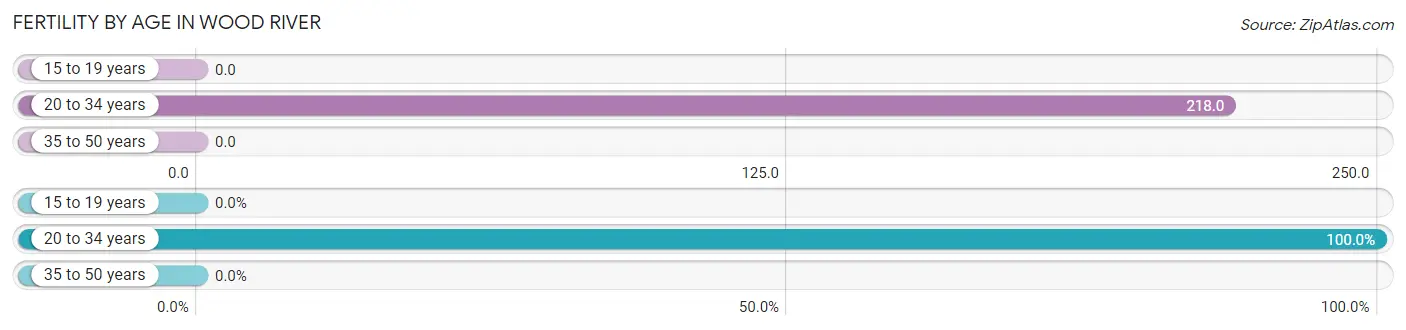
| Age Bracket | Women with Births | Births / 1,000 Women |
| 15 to 19 years | 0 (0.0%) | 0.0 |
| 20 to 34 years | 24 (100.0%) | 218.0 |
| 35 to 50 years | 0 (0.0%) | 0.0 |
| Total | 24 (100.0%) | 85.0 |
Fertility by Age by Marriage Status in Wood River
83.3% of women with births (24) in Wood River are married. The highest percentage of unmarried women with births falls into 20 to 34 years age bracket with 16.7% of them unmarried at the time of birth, while the lowest percentage of unmarried women with births belong to 20 to 34 years age bracket with 16.7% of them unmarried.
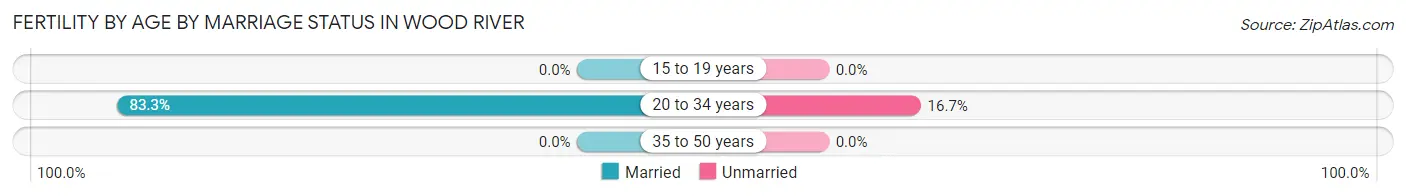
| Age Bracket | Married | Unmarried |
| 15 to 19 years | 0 (0.0%) | 0 (0.0%) |
| 20 to 34 years | 20 (83.3%) | 4 (16.7%) |
| 35 to 50 years | 0 (0.0%) | 0 (0.0%) |
| Total | 20 (83.3%) | 4 (16.7%) |
Fertility by Education in Wood River
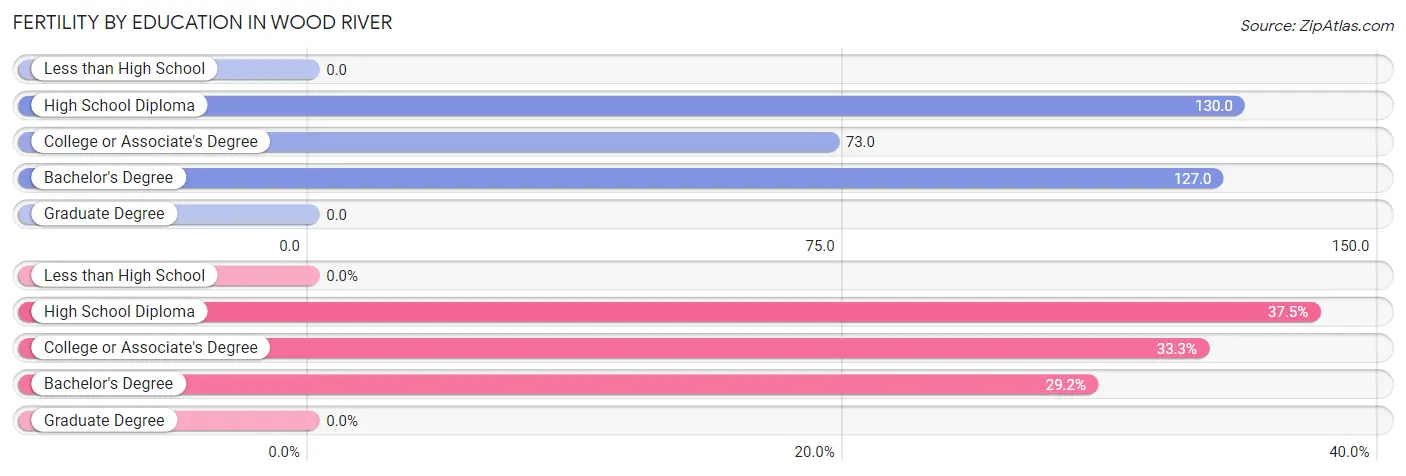
| Educational Attainment | Women with Births | Births / 1,000 Women |
| Less than High School | 0 (0.0%) | 0.0 |
| High School Diploma | 9 (37.5%) | 130.0 |
| College or Associate's Degree | 8 (33.3%) | 73.0 |
| Bachelor's Degree | 7 (29.2%) | 127.0 |
| Graduate Degree | 0 (0.0%) | 0.0 |
| Total | 24 (100.0%) | 85.0 |
Fertility by Education by Marriage Status in Wood River
16.7% of women with births in Wood River are unmarried. Women with the educational attainment of high school diploma are most likely to be married with 100.0% of them married at childbirth, while women with the educational attainment of college or associate's degree are least likely to be married with 50.0% of them unmarried at childbirth.
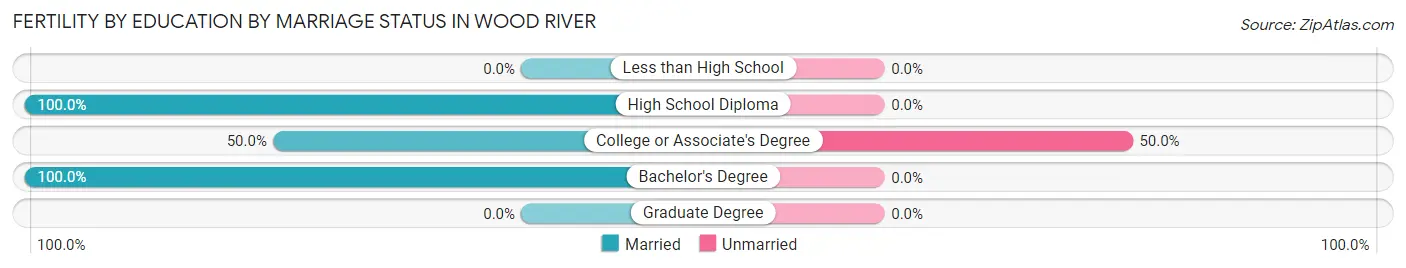
| Educational Attainment | Married | Unmarried |
| Less than High School | 0 (0.0%) | 0 (0.0%) |
| High School Diploma | 9 (100.0%) | 0 (0.0%) |
| College or Associate's Degree | 4 (50.0%) | 4 (50.0%) |
| Bachelor's Degree | 7 (100.0%) | 0 (0.0%) |
| Graduate Degree | 0 (0.0%) | 0 (0.0%) |
| Total | 20 (83.3%) | 4 (16.7%) |
Employment Characteristics in Wood River
Employment by Class of Employer in Wood River
Among the 708 employed individuals in Wood River, private company employees (501 | 70.8%), not-for-profit organizations (61 | 8.6%), and local government employees (49 | 6.9%) make up the most common classes of employment.
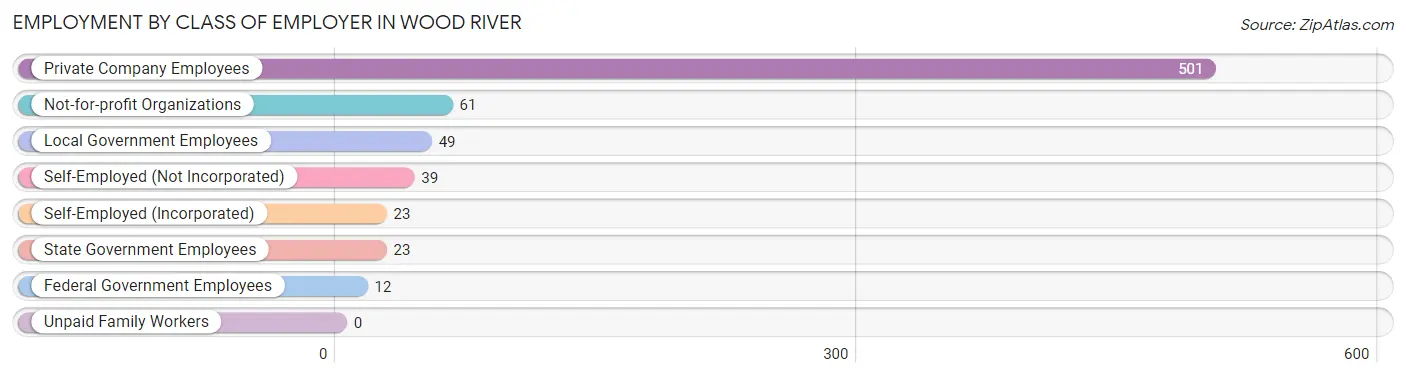
| Employer Class | # Employees | % Employees |
| Private Company Employees | 501 | 70.8% |
| Self-Employed (Incorporated) | 23 | 3.3% |
| Self-Employed (Not Incorporated) | 39 | 5.5% |
| Not-for-profit Organizations | 61 | 8.6% |
| Local Government Employees | 49 | 6.9% |
| State Government Employees | 23 | 3.3% |
| Federal Government Employees | 12 | 1.7% |
| Unpaid Family Workers | 0 | 0.0% |
| Total | 708 | 100.0% |
Employment Status by Age in Wood River
According to the labor force statistics for Wood River, out of the total population over 16 years of age (1,101), 68.3% or 752 individuals are in the labor force, with 5.2% or 39 of them unemployed. The age group with the highest labor force participation rate is 30 to 34 years, with 95.0% or 96 individuals in the labor force. Within the labor force, the 16 to 19 years age range has the highest percentage of unemployed individuals, with 18.0% or 11 of them being unemployed.
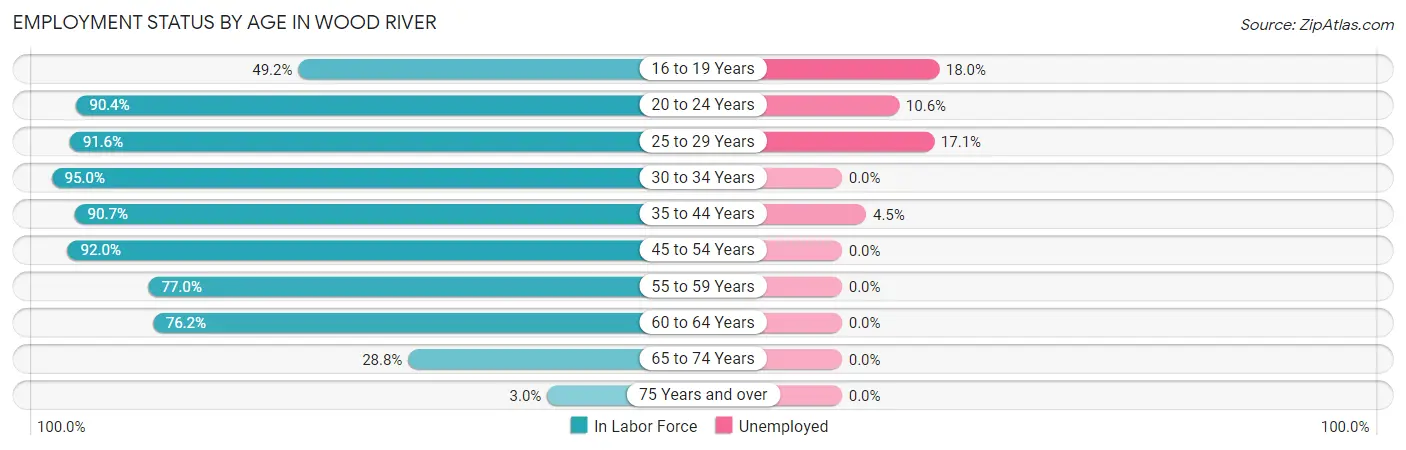
| Age Bracket | In Labor Force | Unemployed |
| 16 to 19 Years | 61 (49.2%) | 11 (18.0%) |
| 20 to 24 Years | 66 (90.4%) | 7 (10.6%) |
| 25 to 29 Years | 76 (91.6%) | 13 (17.1%) |
| 30 to 34 Years | 96 (95.0%) | 0 (0.0%) |
| 35 to 44 Years | 176 (90.7%) | 8 (4.5%) |
| 45 to 54 Years | 138 (92.0%) | 0 (0.0%) |
| 55 to 59 Years | 57 (77.0%) | 0 (0.0%) |
| 60 to 64 Years | 48 (76.2%) | 0 (0.0%) |
| 65 to 74 Years | 30 (28.8%) | 0 (0.0%) |
| 75 Years and over | 4 (3.0%) | 0 (0.0%) |
| Total | 752 (68.3%) | 39 (5.2%) |
Employment Status by Educational Attainment in Wood River
According to labor force statistics for Wood River, 88.9% of individuals (591) out of the total population between 25 and 64 years of age (665) are in the labor force, with 3.6% or 21 of them being unemployed. The group with the highest labor force participation rate are those with the educational attainment of less than high school, with 98.8% or 80 individuals in the labor force. Within the labor force, individuals with less than high school education have the highest percentage of unemployment, with 26.3% or 21 of them being unemployed.
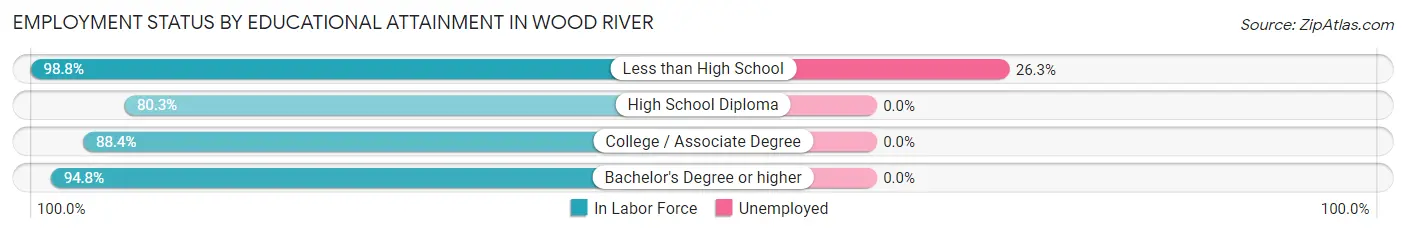
| Educational Attainment | In Labor Force | Unemployed |
| Less than High School | 80 (98.8%) | 21 (26.3%) |
| High School Diploma | 151 (80.3%) | 0 (0.0%) |
| College / Associate Degree | 213 (88.4%) | 0 (0.0%) |
| Bachelor's Degree or higher | 147 (94.8%) | 0 (0.0%) |
| Total | 591 (88.9%) | 24 (3.6%) |
Employment Occupations by Sex in Wood River
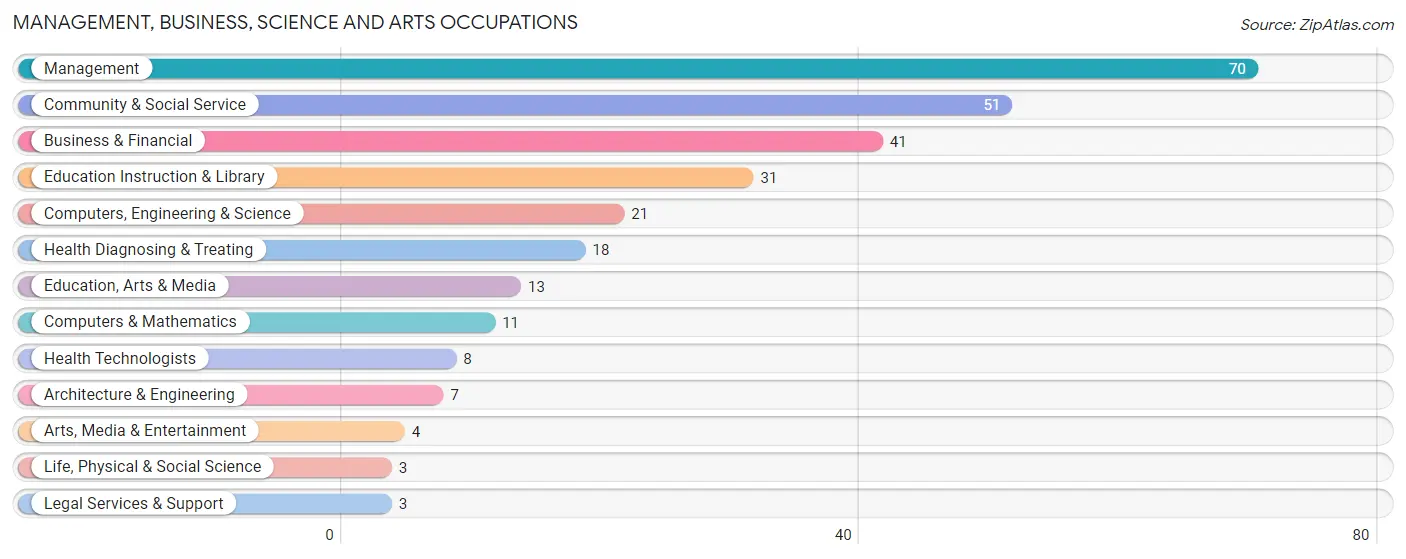
Management, Business, Science and Arts Occupations
The most common Management, Business, Science and Arts occupations in Wood River are Management (70 | 9.8%), Community & Social Service (51 | 7.1%), Business & Financial (41 | 5.8%), Education Instruction & Library (31 | 4.3%), and Computers, Engineering & Science (21 | 2.9%).
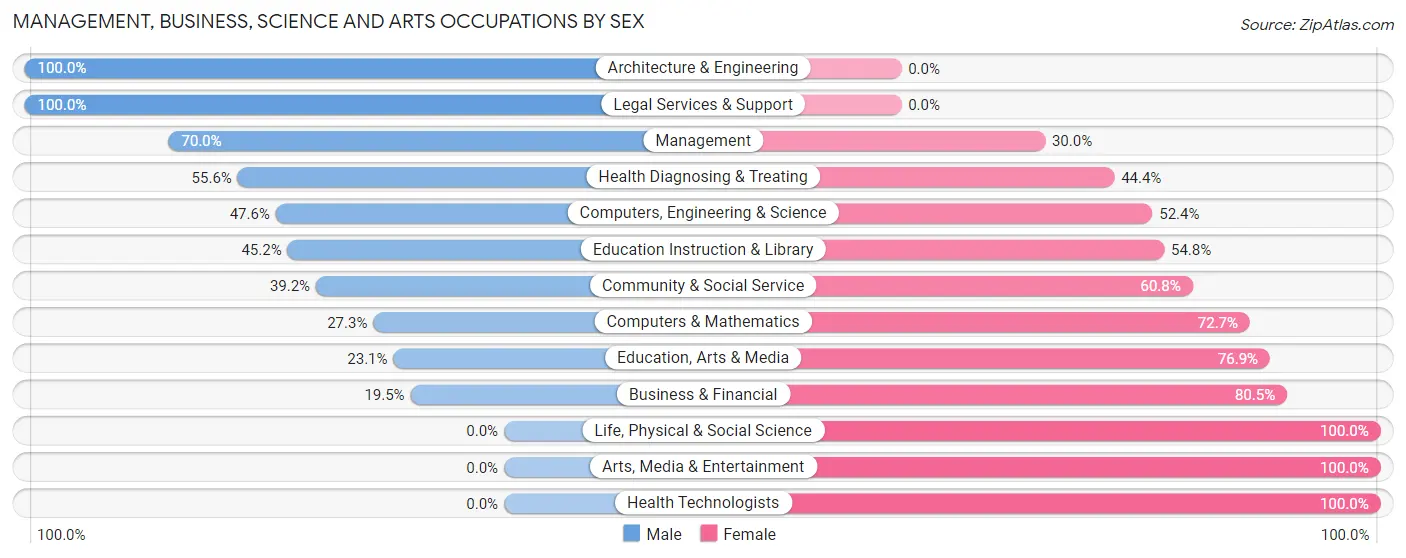
Management, Business, Science and Arts Occupations by Sex
Within the Management, Business, Science and Arts occupations in Wood River, the most male-oriented occupations are Architecture & Engineering (100.0%), Legal Services & Support (100.0%), and Management (70.0%), while the most female-oriented occupations are Life, Physical & Social Science (100.0%), Arts, Media & Entertainment (100.0%), and Health Technologists (100.0%).
| Occupation | Male | Female |
| Management | 49 (70.0%) | 21 (30.0%) |
| Business & Financial | 8 (19.5%) | 33 (80.5%) |
| Computers, Engineering & Science | 10 (47.6%) | 11 (52.4%) |
| Computers & Mathematics | 3 (27.3%) | 8 (72.7%) |
| Architecture & Engineering | 7 (100.0%) | 0 (0.0%) |
| Life, Physical & Social Science | 0 (0.0%) | 3 (100.0%) |
| Community & Social Service | 20 (39.2%) | 31 (60.8%) |
| Education, Arts & Media | 3 (23.1%) | 10 (76.9%) |
| Legal Services & Support | 3 (100.0%) | 0 (0.0%) |
| Education Instruction & Library | 14 (45.2%) | 17 (54.8%) |
| Arts, Media & Entertainment | 0 (0.0%) | 4 (100.0%) |
| Health Diagnosing & Treating | 10 (55.6%) | 8 (44.4%) |
| Health Technologists | 0 (0.0%) | 8 (100.0%) |
| Total (Category) | 97 (48.3%) | 104 (51.7%) |
| Total (Overall) | 392 (55.0%) | 321 (45.0%) |
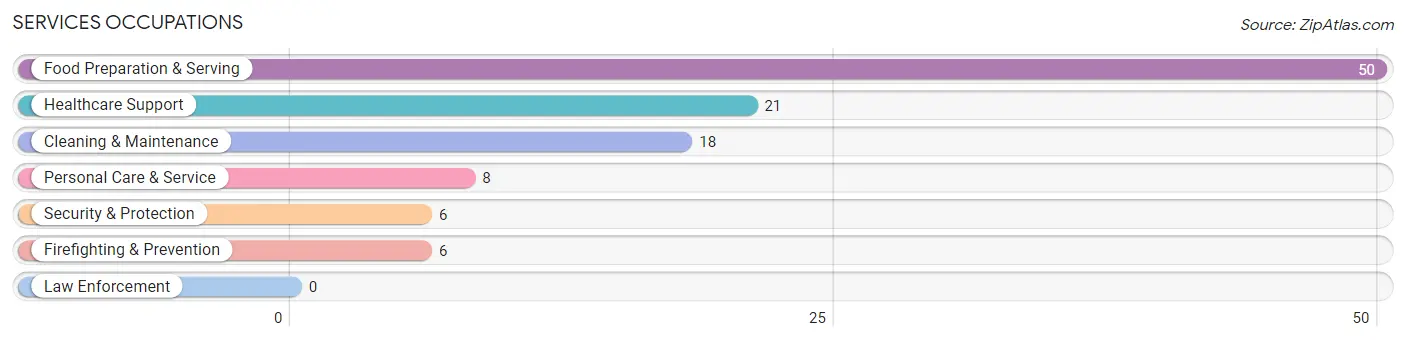
Services Occupations
The most common Services occupations in Wood River are Food Preparation & Serving (50 | 7.0%), Healthcare Support (21 | 2.9%), Cleaning & Maintenance (18 | 2.5%), Personal Care & Service (8 | 1.1%), and Security & Protection (6 | 0.8%).
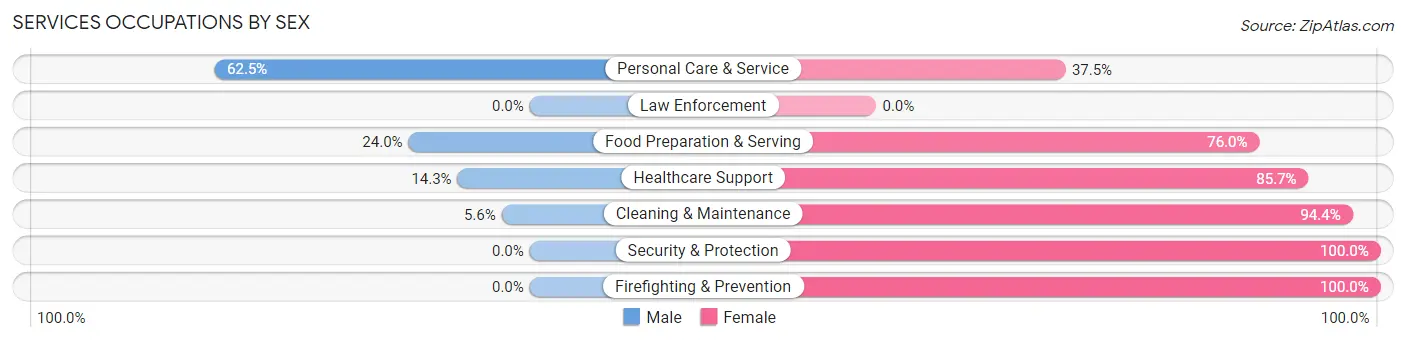
Services Occupations by Sex
Within the Services occupations in Wood River, the most male-oriented occupations are Personal Care & Service (62.5%), Food Preparation & Serving (24.0%), and Healthcare Support (14.3%), while the most female-oriented occupations are Security & Protection (100.0%), Firefighting & Prevention (100.0%), and Cleaning & Maintenance (94.4%).
| Occupation | Male | Female |
| Healthcare Support | 3 (14.3%) | 18 (85.7%) |
| Security & Protection | 0 (0.0%) | 6 (100.0%) |
| Firefighting & Prevention | 0 (0.0%) | 6 (100.0%) |
| Law Enforcement | 0 (0.0%) | 0 (0.0%) |
| Food Preparation & Serving | 12 (24.0%) | 38 (76.0%) |
| Cleaning & Maintenance | 1 (5.6%) | 17 (94.4%) |
| Personal Care & Service | 5 (62.5%) | 3 (37.5%) |
| Total (Category) | 21 (20.4%) | 82 (79.6%) |
| Total (Overall) | 392 (55.0%) | 321 (45.0%) |
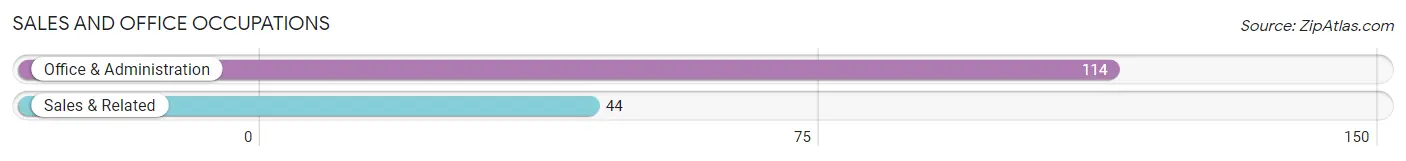
Sales and Office Occupations
The most common Sales and Office occupations in Wood River are Office & Administration (114 | 16.0%), and Sales & Related (44 | 6.2%).
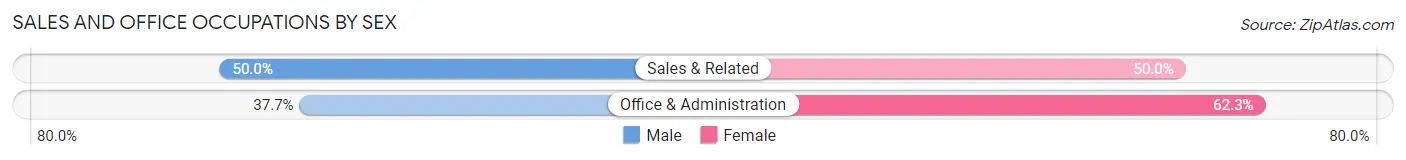
Sales and Office Occupations by Sex
| Occupation | Male | Female |
| Sales & Related | 22 (50.0%) | 22 (50.0%) |
| Office & Administration | 43 (37.7%) | 71 (62.3%) |
| Total (Category) | 65 (41.1%) | 93 (58.9%) |
| Total (Overall) | 392 (55.0%) | 321 (45.0%) |
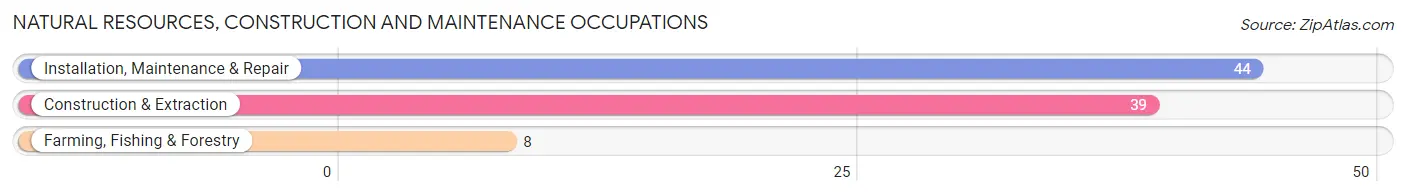
Natural Resources, Construction and Maintenance Occupations
The most common Natural Resources, Construction and Maintenance occupations in Wood River are Installation, Maintenance & Repair (44 | 6.2%), Construction & Extraction (39 | 5.5%), and Farming, Fishing & Forestry (8 | 1.1%).
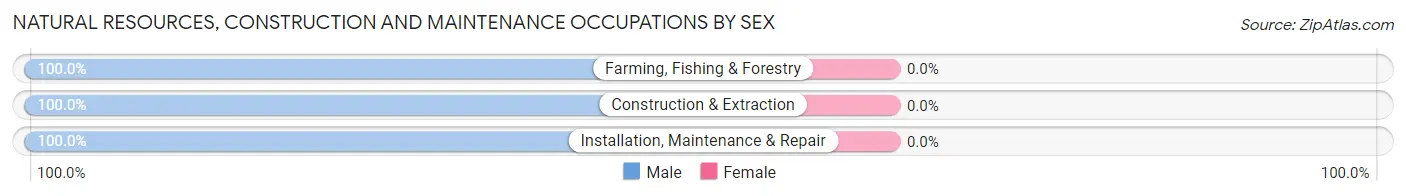
Natural Resources, Construction and Maintenance Occupations by Sex
| Occupation | Male | Female |
| Farming, Fishing & Forestry | 8 (100.0%) | 0 (0.0%) |
| Construction & Extraction | 39 (100.0%) | 0 (0.0%) |
| Installation, Maintenance & Repair | 44 (100.0%) | 0 (0.0%) |
| Total (Category) | 91 (100.0%) | 0 (0.0%) |
| Total (Overall) | 392 (55.0%) | 321 (45.0%) |
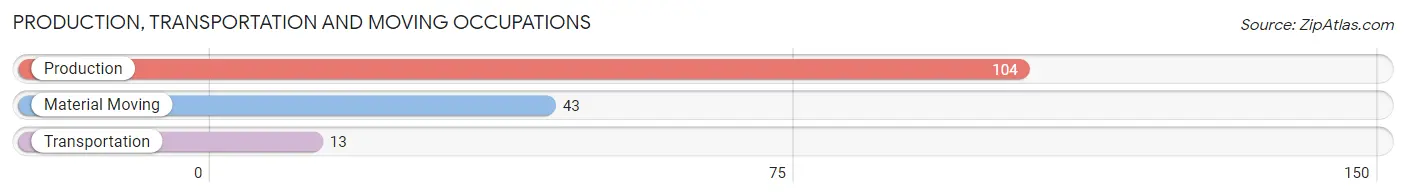
Production, Transportation and Moving Occupations
The most common Production, Transportation and Moving occupations in Wood River are Production (104 | 14.6%), Material Moving (43 | 6.0%), and Transportation (13 | 1.8%).
Production, Transportation and Moving Occupations by Sex
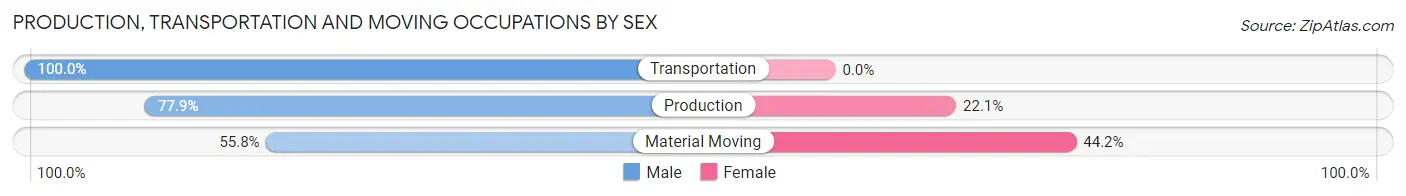
| Occupation | Male | Female |
| Production | 81 (77.9%) | 23 (22.1%) |
| Transportation | 13 (100.0%) | 0 (0.0%) |
| Material Moving | 24 (55.8%) | 19 (44.2%) |
| Total (Category) | 118 (73.8%) | 42 (26.3%) |
| Total (Overall) | 392 (55.0%) | 321 (45.0%) |
Employment Industries by Sex in Wood River
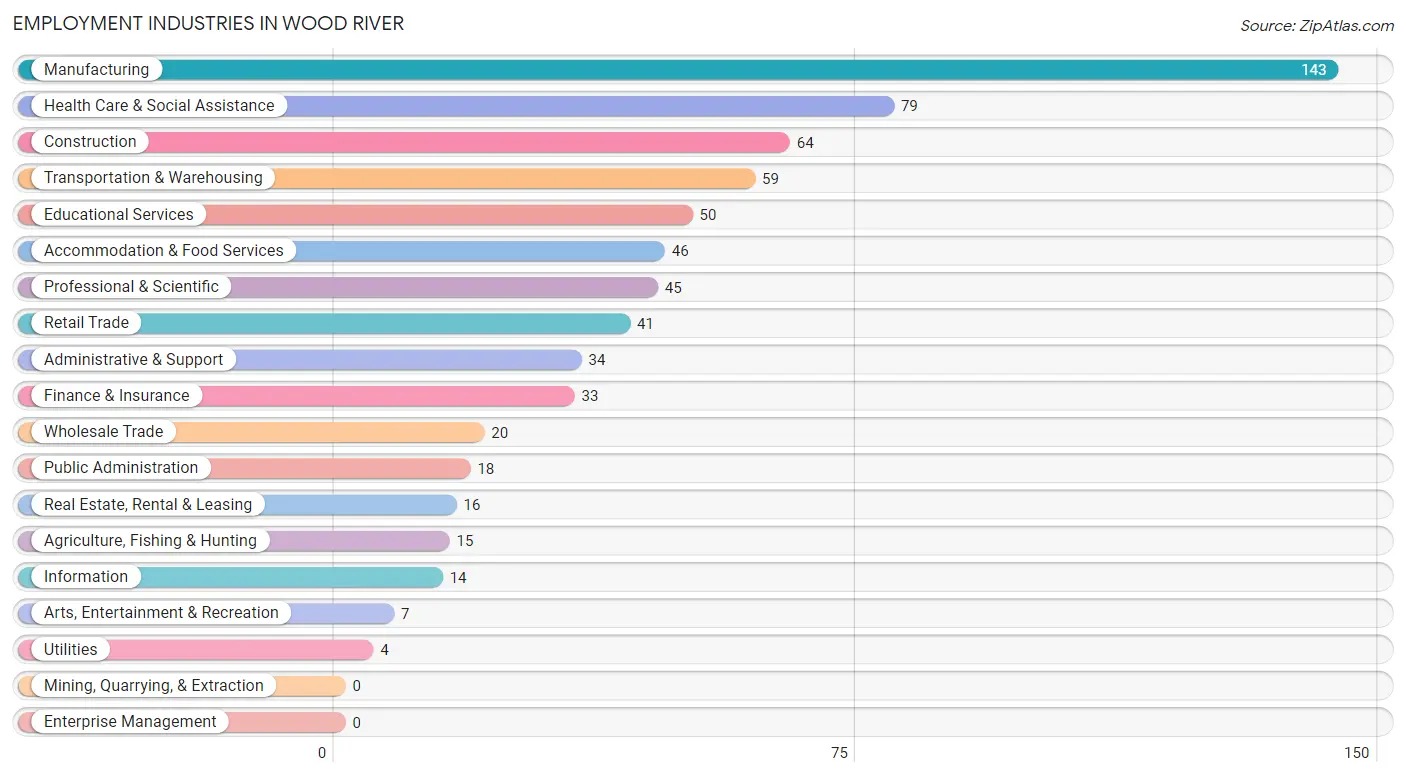
Employment Industries in Wood River
The major employment industries in Wood River include Manufacturing (143 | 20.1%), Health Care & Social Assistance (79 | 11.1%), Construction (64 | 9.0%), Transportation & Warehousing (59 | 8.3%), and Educational Services (50 | 7.0%).
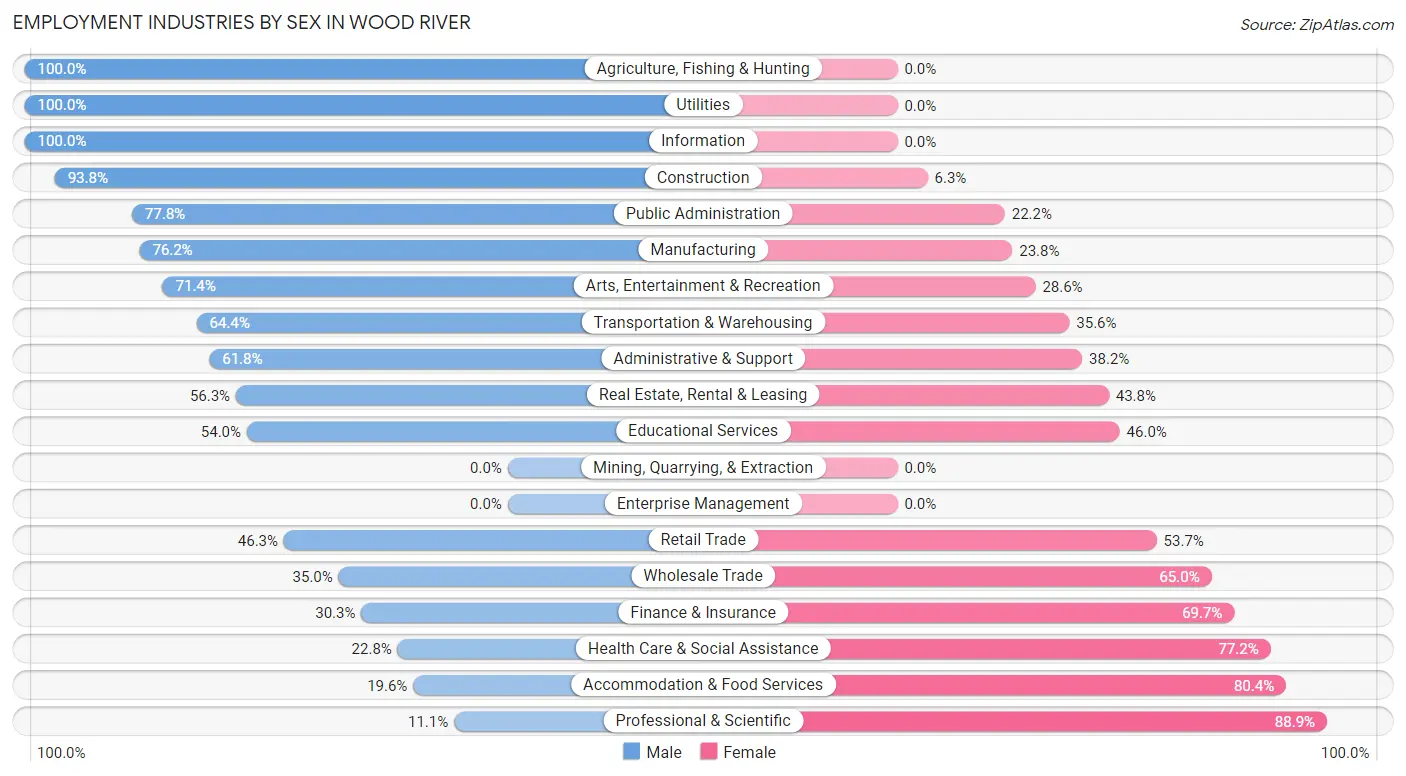
Employment Industries by Sex in Wood River
The Wood River industries that see more men than women are Agriculture, Fishing & Hunting (100.0%), Utilities (100.0%), and Information (100.0%), whereas the industries that tend to have a higher number of women are Professional & Scientific (88.9%), Accommodation & Food Services (80.4%), and Health Care & Social Assistance (77.2%).
| Industry | Male | Female |
| Agriculture, Fishing & Hunting | 15 (100.0%) | 0 (0.0%) |
| Mining, Quarrying, & Extraction | 0 (0.0%) | 0 (0.0%) |
| Construction | 60 (93.8%) | 4 (6.2%) |
| Manufacturing | 109 (76.2%) | 34 (23.8%) |
| Wholesale Trade | 7 (35.0%) | 13 (65.0%) |
| Retail Trade | 19 (46.3%) | 22 (53.7%) |
| Transportation & Warehousing | 38 (64.4%) | 21 (35.6%) |
| Utilities | 4 (100.0%) | 0 (0.0%) |
| Information | 14 (100.0%) | 0 (0.0%) |
| Finance & Insurance | 10 (30.3%) | 23 (69.7%) |
| Real Estate, Rental & Leasing | 9 (56.2%) | 7 (43.8%) |
| Professional & Scientific | 5 (11.1%) | 40 (88.9%) |
| Enterprise Management | 0 (0.0%) | 0 (0.0%) |
| Administrative & Support | 21 (61.8%) | 13 (38.2%) |
| Educational Services | 27 (54.0%) | 23 (46.0%) |
| Health Care & Social Assistance | 18 (22.8%) | 61 (77.2%) |
| Arts, Entertainment & Recreation | 5 (71.4%) | 2 (28.6%) |
| Accommodation & Food Services | 9 (19.6%) | 37 (80.4%) |
| Public Administration | 14 (77.8%) | 4 (22.2%) |
| Total | 392 (55.0%) | 321 (45.0%) |
Education in Wood River
School Enrollment in Wood River
The most common levels of schooling among the 368 students in Wood River are high school (120 | 32.6%), middle school (62 | 16.9%), and nursery / preschool (57 | 15.5%).
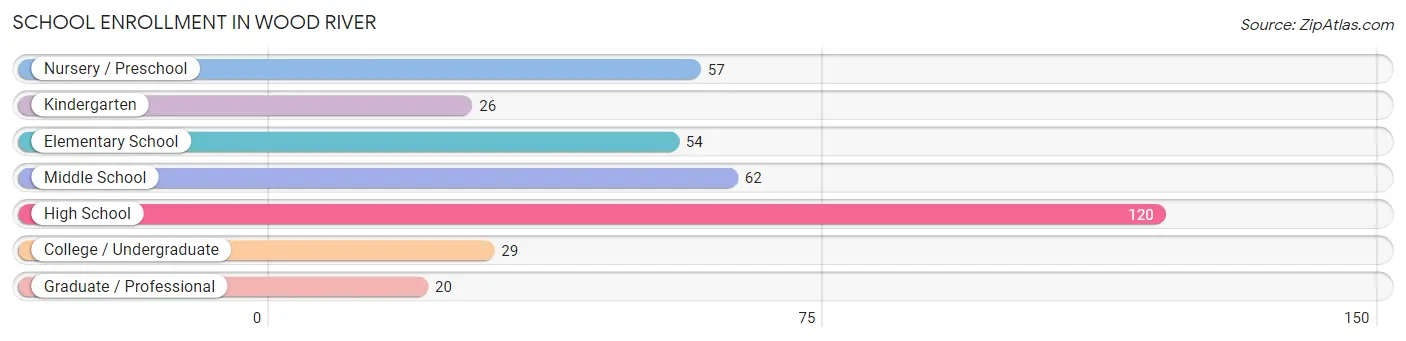
| School Level | # Students | % Students |
| Nursery / Preschool | 57 | 15.5% |
| Kindergarten | 26 | 7.1% |
| Elementary School | 54 | 14.7% |
| Middle School | 62 | 16.9% |
| High School | 120 | 32.6% |
| College / Undergraduate | 29 | 7.9% |
| Graduate / Professional | 20 | 5.4% |
| Total | 368 | 100.0% |
School Enrollment by Age by Funding Source in Wood River
Out of a total of 368 students who are enrolled in schools in Wood River, 29 (7.9%) attend a private institution, while the remaining 339 (92.1%) are enrolled in public schools. The age group of 35 years and over has the highest likelihood of being enrolled in private schools, with 3 (60.0% in the age bracket) enrolled. Conversely, the age group of 3 to 4 year olds has the lowest likelihood of being enrolled in a private school, with 34 (100.0% in the age bracket) attending a public institution.
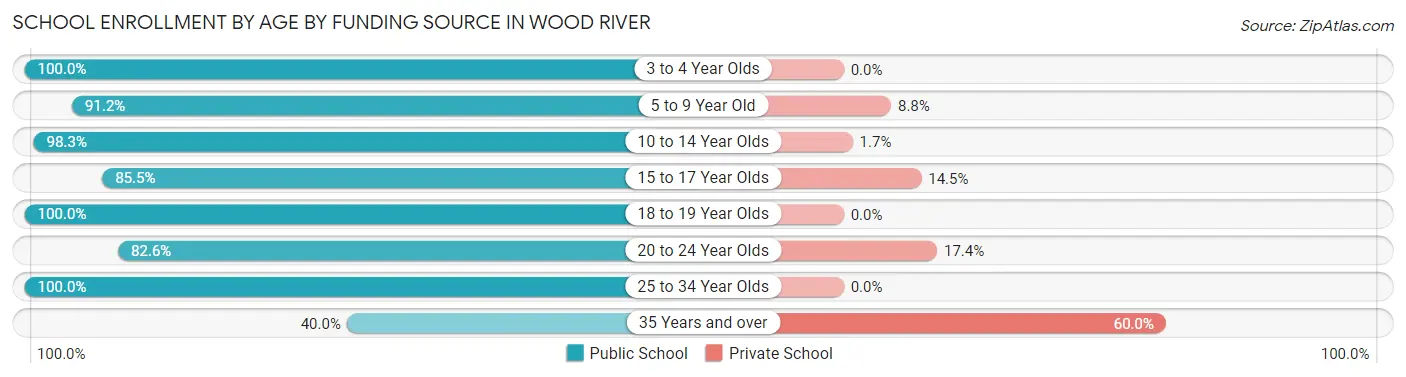
| Age Bracket | Public School | Private School |
| 3 to 4 Year Olds | 34 (100.0%) | 0 (0.0%) |
| 5 to 9 Year Old | 93 (91.2%) | 9 (8.8%) |
| 10 to 14 Year Olds | 59 (98.3%) | 1 (1.7%) |
| 15 to 17 Year Olds | 71 (85.5%) | 12 (14.5%) |
| 18 to 19 Year Olds | 51 (100.0%) | 0 (0.0%) |
| 20 to 24 Year Olds | 19 (82.6%) | 4 (17.4%) |
| 25 to 34 Year Olds | 10 (100.0%) | 0 (0.0%) |
| 35 Years and over | 2 (40.0%) | 3 (60.0%) |
| Total | 339 (92.1%) | 29 (7.9%) |
Educational Attainment by Field of Study in Wood River
Education (58 | 28.3%), business (44 | 21.5%), science & technology (18 | 8.8%), arts & humanities (18 | 8.8%), and social sciences (14 | 6.8%) are the most common fields of study among 205 individuals in Wood River who have obtained a bachelor's degree or higher.
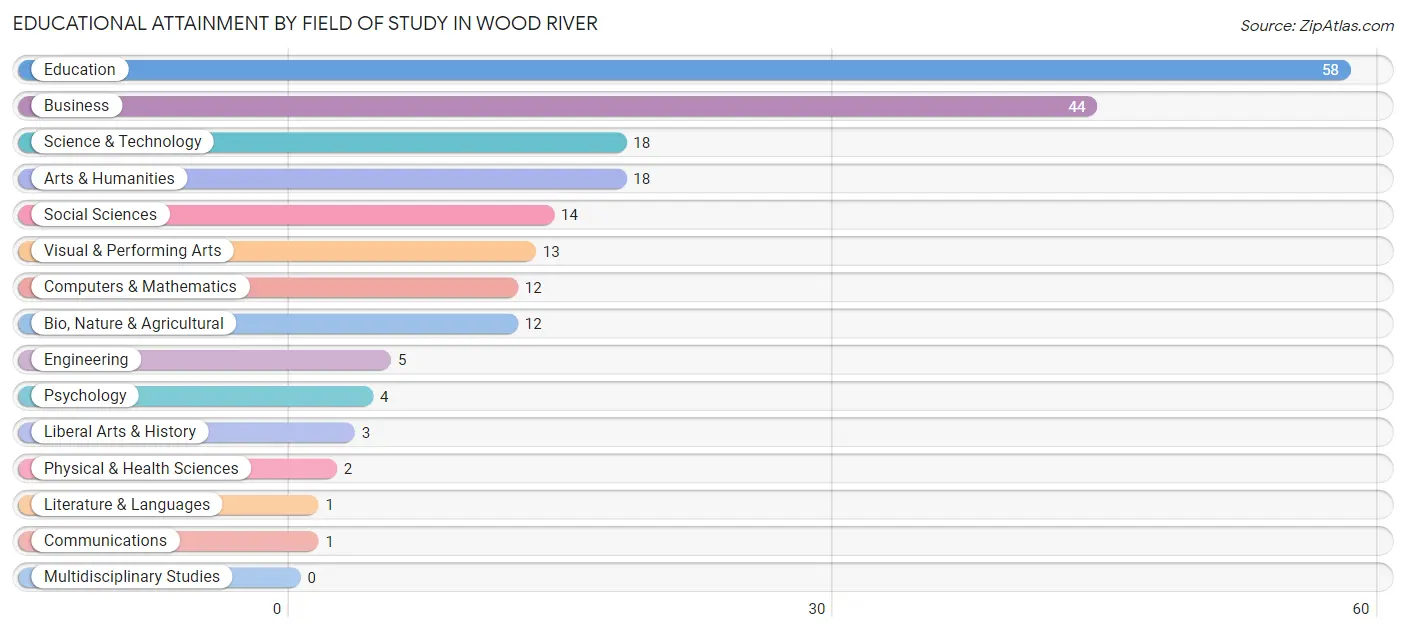
| Field of Study | # Graduates | % Graduates |
| Computers & Mathematics | 12 | 5.9% |
| Bio, Nature & Agricultural | 12 | 5.9% |
| Physical & Health Sciences | 2 | 1.0% |
| Psychology | 4 | 1.9% |
| Social Sciences | 14 | 6.8% |
| Engineering | 5 | 2.4% |
| Multidisciplinary Studies | 0 | 0.0% |
| Science & Technology | 18 | 8.8% |
| Business | 44 | 21.5% |
| Education | 58 | 28.3% |
| Literature & Languages | 1 | 0.5% |
| Liberal Arts & History | 3 | 1.5% |
| Visual & Performing Arts | 13 | 6.3% |
| Communications | 1 | 0.5% |
| Arts & Humanities | 18 | 8.8% |
| Total | 205 | 100.0% |
Transportation & Commute in Wood River
Vehicle Availability by Sex in Wood River
The most prevalent vehicle ownership categories in Wood River are males with 2 vehicles (135, accounting for 34.9%) and females with 2 vehicles (101, making up 42.1%).
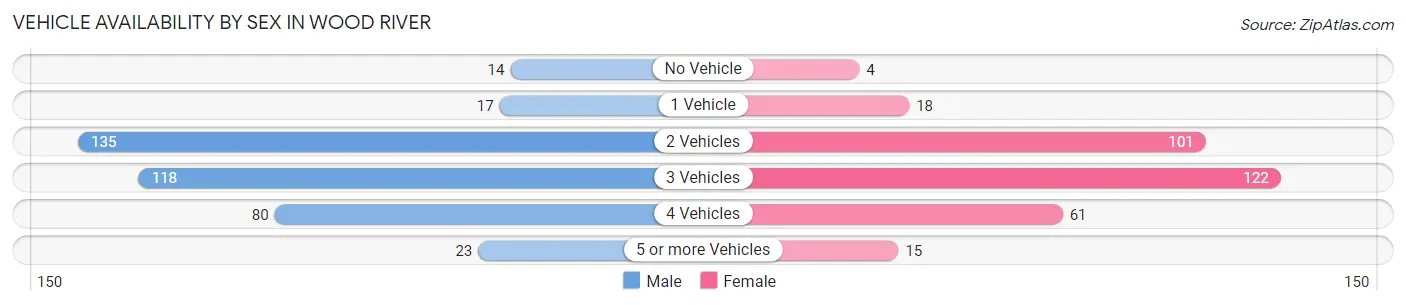
| Vehicles Available | Male | Female |
| No Vehicle | 14 (3.6%) | 4 (1.3%) |
| 1 Vehicle | 17 (4.4%) | 18 (5.6%) |
| 2 Vehicles | 135 (34.9%) | 101 (31.5%) |
| 3 Vehicles | 118 (30.5%) | 122 (38.0%) |
| 4 Vehicles | 80 (20.7%) | 61 (19.0%) |
| 5 or more Vehicles | 23 (5.9%) | 15 (4.7%) |
| Total | 387 (100.0%) | 321 (100.0%) |
Commute Time in Wood River
The most frequently occuring commute durations in Wood River are 20 to 24 minutes (157 commuters, 22.8%), 25 to 29 minutes (117 commuters, 17.0%), and less than 5 minutes (78 commuters, 11.3%).
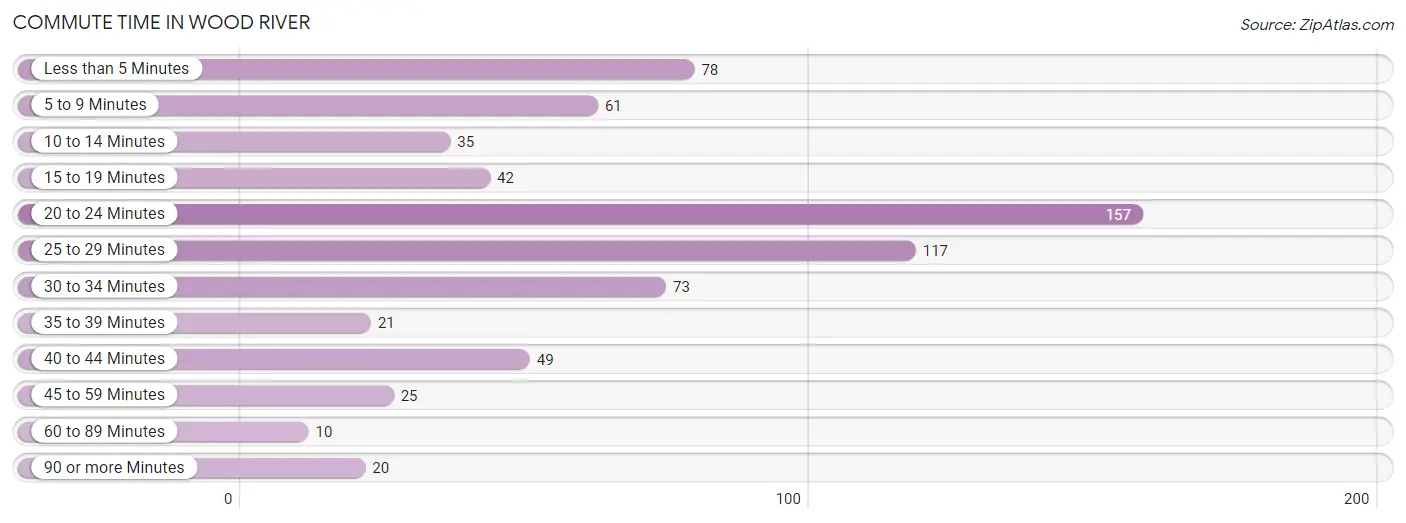
| Commute Time | # Commuters | % Commuters |
| Less than 5 Minutes | 78 | 11.3% |
| 5 to 9 Minutes | 61 | 8.9% |
| 10 to 14 Minutes | 35 | 5.1% |
| 15 to 19 Minutes | 42 | 6.1% |
| 20 to 24 Minutes | 157 | 22.8% |
| 25 to 29 Minutes | 117 | 17.0% |
| 30 to 34 Minutes | 73 | 10.6% |
| 35 to 39 Minutes | 21 | 3.0% |
| 40 to 44 Minutes | 49 | 7.1% |
| 45 to 59 Minutes | 25 | 3.6% |
| 60 to 89 Minutes | 10 | 1.5% |
| 90 or more Minutes | 20 | 2.9% |
Commute Time by Sex in Wood River
The most common commute times in Wood River are less than 5 minutes (65 commuters, 17.1%) for males and 20 to 24 minutes (110 commuters, 35.7%) for females.
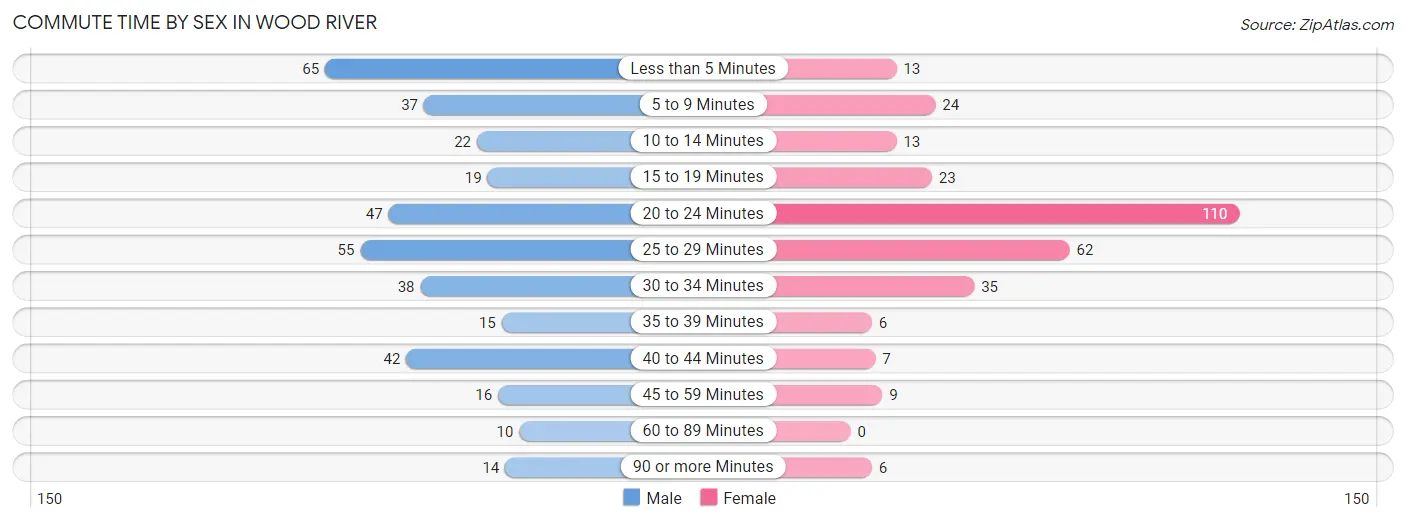
| Commute Time | Male | Female |
| Less than 5 Minutes | 65 (17.1%) | 13 (4.2%) |
| 5 to 9 Minutes | 37 (9.7%) | 24 (7.8%) |
| 10 to 14 Minutes | 22 (5.8%) | 13 (4.2%) |
| 15 to 19 Minutes | 19 (5.0%) | 23 (7.5%) |
| 20 to 24 Minutes | 47 (12.4%) | 110 (35.7%) |
| 25 to 29 Minutes | 55 (14.5%) | 62 (20.1%) |
| 30 to 34 Minutes | 38 (10.0%) | 35 (11.4%) |
| 35 to 39 Minutes | 15 (4.0%) | 6 (1.9%) |
| 40 to 44 Minutes | 42 (11.1%) | 7 (2.3%) |
| 45 to 59 Minutes | 16 (4.2%) | 9 (2.9%) |
| 60 to 89 Minutes | 10 (2.6%) | 0 (0.0%) |
| 90 or more Minutes | 14 (3.7%) | 6 (1.9%) |
Time of Departure to Work by Sex in Wood River
The most frequent times of departure to work in Wood River are 7:00 AM to 7:29 AM (86, 22.6%) for males and 7:30 AM to 7:59 AM (98, 31.8%) for females.
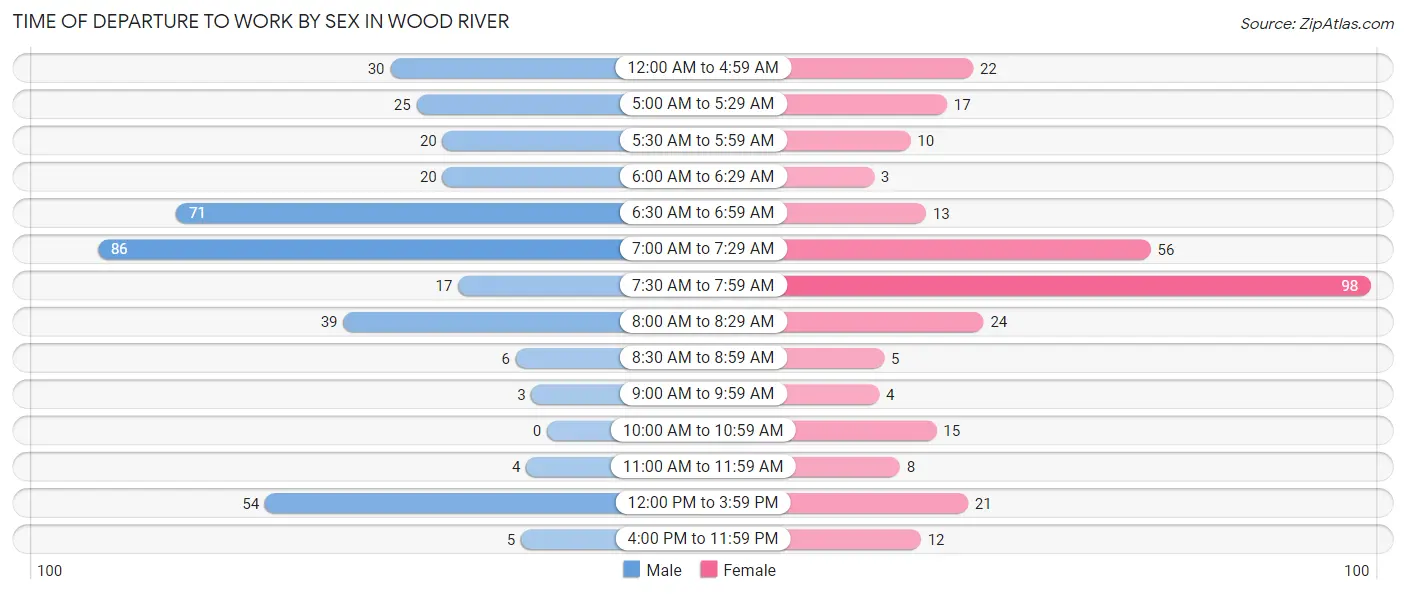
| Time of Departure | Male | Female |
| 12:00 AM to 4:59 AM | 30 (7.9%) | 22 (7.1%) |
| 5:00 AM to 5:29 AM | 25 (6.6%) | 17 (5.5%) |
| 5:30 AM to 5:59 AM | 20 (5.3%) | 10 (3.3%) |
| 6:00 AM to 6:29 AM | 20 (5.3%) | 3 (1.0%) |
| 6:30 AM to 6:59 AM | 71 (18.7%) | 13 (4.2%) |
| 7:00 AM to 7:29 AM | 86 (22.6%) | 56 (18.2%) |
| 7:30 AM to 7:59 AM | 17 (4.5%) | 98 (31.8%) |
| 8:00 AM to 8:29 AM | 39 (10.3%) | 24 (7.8%) |
| 8:30 AM to 8:59 AM | 6 (1.6%) | 5 (1.6%) |
| 9:00 AM to 9:59 AM | 3 (0.8%) | 4 (1.3%) |
| 10:00 AM to 10:59 AM | 0 (0.0%) | 15 (4.9%) |
| 11:00 AM to 11:59 AM | 4 (1.1%) | 8 (2.6%) |
| 12:00 PM to 3:59 PM | 54 (14.2%) | 21 (6.8%) |
| 4:00 PM to 11:59 PM | 5 (1.3%) | 12 (3.9%) |
| Total | 380 (100.0%) | 308 (100.0%) |
Housing Occupancy in Wood River
Occupancy by Ownership in Wood River
Of the total 486 dwellings in Wood River, owner-occupied units account for 366 (75.3%), while renter-occupied units make up 120 (24.7%).
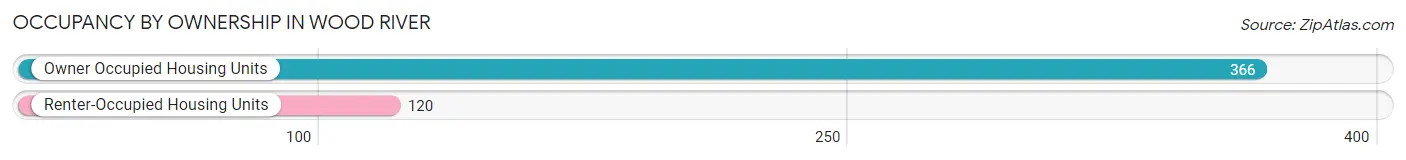
| Occupancy | # Housing Units | % Housing Units |
| Owner Occupied Housing Units | 366 | 75.3% |
| Renter-Occupied Housing Units | 120 | 24.7% |
| Total Occupied Housing Units | 486 | 100.0% |
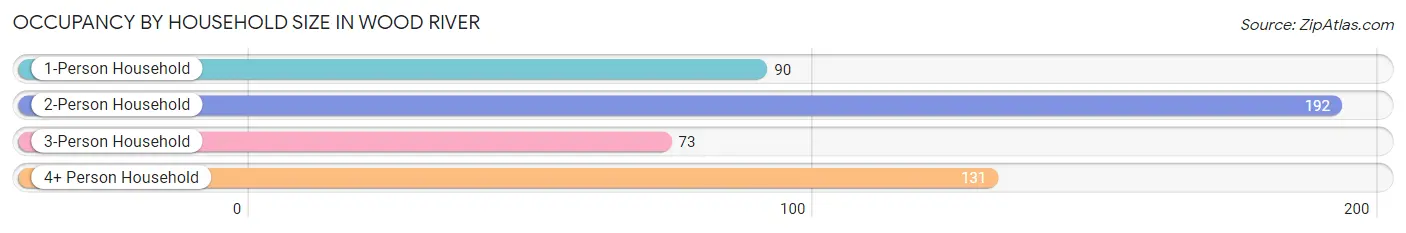
Occupancy by Household Size in Wood River
| Household Size | # Housing Units | % Housing Units |
| 1-Person Household | 90 | 18.5% |
| 2-Person Household | 192 | 39.5% |
| 3-Person Household | 73 | 15.0% |
| 4+ Person Household | 131 | 27.0% |
| Total Housing Units | 486 | 100.0% |
Occupancy by Ownership by Household Size in Wood River
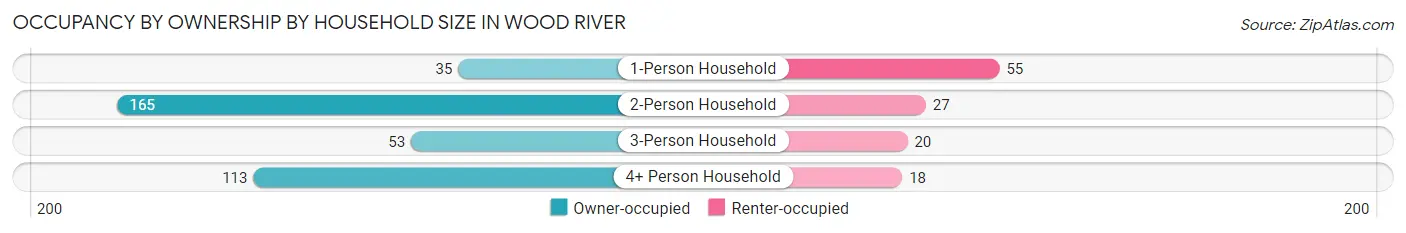
| Household Size | Owner-occupied | Renter-occupied |
| 1-Person Household | 35 (38.9%) | 55 (61.1%) |
| 2-Person Household | 165 (85.9%) | 27 (14.1%) |
| 3-Person Household | 53 (72.6%) | 20 (27.4%) |
| 4+ Person Household | 113 (86.3%) | 18 (13.7%) |
| Total Housing Units | 366 (75.3%) | 120 (24.7%) |
Occupancy by Educational Attainment in Wood River
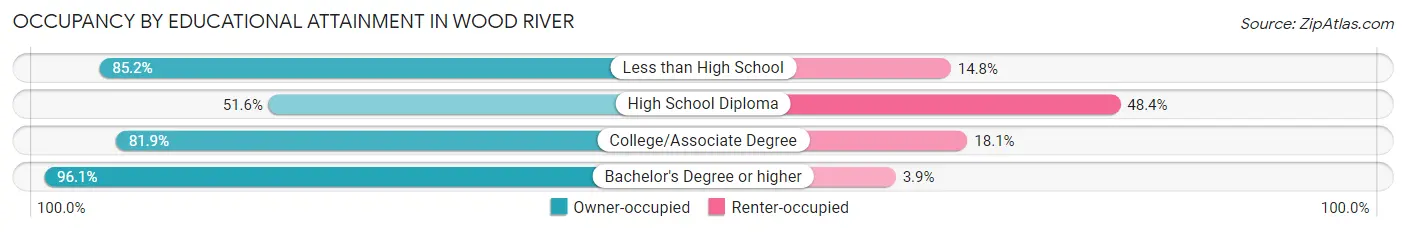
| Household Size | Owner-occupied | Renter-occupied |
| Less than High School | 23 (85.2%) | 4 (14.8%) |
| High School Diploma | 81 (51.6%) | 76 (48.4%) |
| College/Associate Degree | 163 (81.9%) | 36 (18.1%) |
| Bachelor's Degree or higher | 99 (96.1%) | 4 (3.9%) |
Occupancy by Age of Householder in Wood River
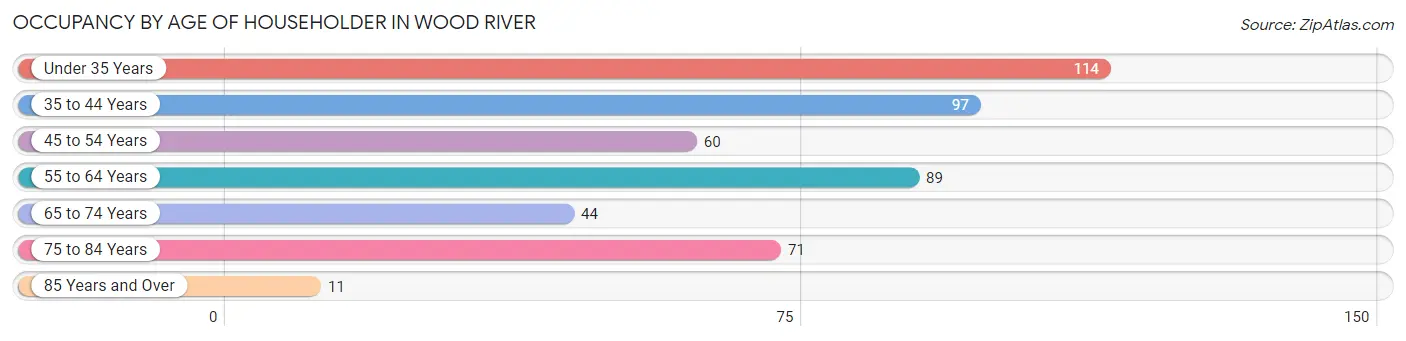
| Age Bracket | # Households | % Households |
| Under 35 Years | 114 | 23.5% |
| 35 to 44 Years | 97 | 20.0% |
| 45 to 54 Years | 60 | 12.3% |
| 55 to 64 Years | 89 | 18.3% |
| 65 to 74 Years | 44 | 9.0% |
| 75 to 84 Years | 71 | 14.6% |
| 85 Years and Over | 11 | 2.3% |
| Total | 486 | 100.0% |
Housing Finances in Wood River
Median Income by Occupancy in Wood River
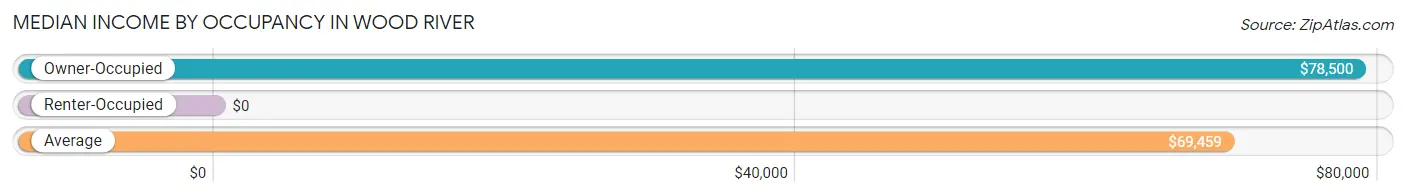
| Occupancy Type | # Households | Median Income |
| Owner-Occupied | 366 (75.3%) | $78,500 |
| Renter-Occupied | 120 (24.7%) | $0 |
| Average | 486 (100.0%) | $69,459 |
Occupancy by Householder Income Bracket in Wood River
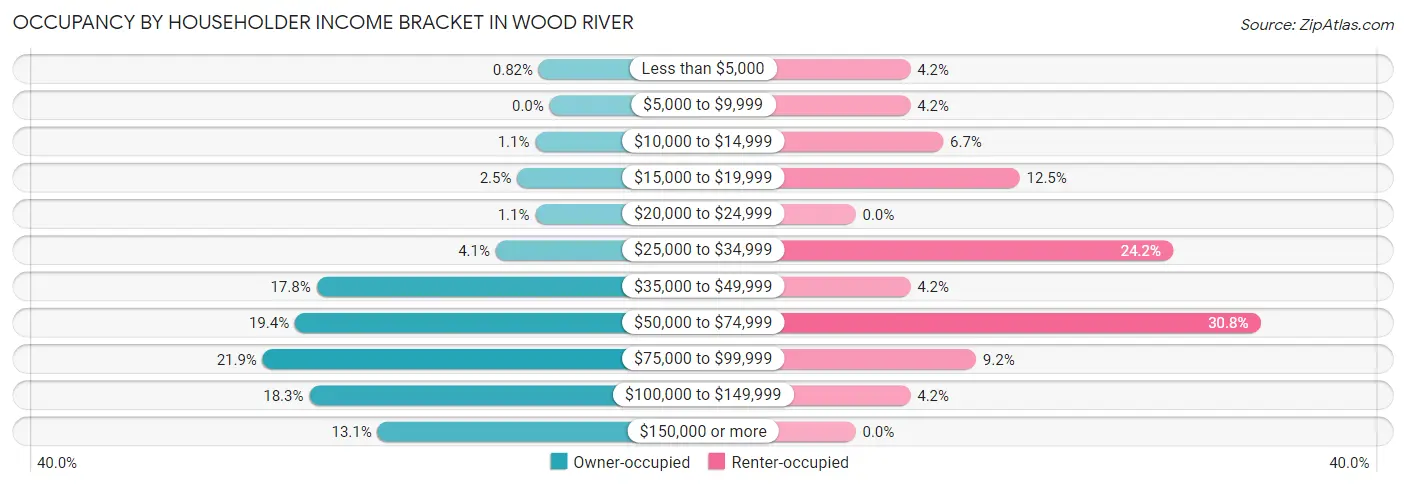
| Income Bracket | Owner-occupied | Renter-occupied |
| Less than $5,000 | 3 (0.8%) | 5 (4.2%) |
| $5,000 to $9,999 | 0 (0.0%) | 5 (4.2%) |
| $10,000 to $14,999 | 4 (1.1%) | 8 (6.7%) |
| $15,000 to $19,999 | 9 (2.5%) | 15 (12.5%) |
| $20,000 to $24,999 | 4 (1.1%) | 0 (0.0%) |
| $25,000 to $34,999 | 15 (4.1%) | 29 (24.2%) |
| $35,000 to $49,999 | 65 (17.8%) | 5 (4.2%) |
| $50,000 to $74,999 | 71 (19.4%) | 37 (30.8%) |
| $75,000 to $99,999 | 80 (21.9%) | 11 (9.2%) |
| $100,000 to $149,999 | 67 (18.3%) | 5 (4.2%) |
| $150,000 or more | 48 (13.1%) | 0 (0.0%) |
| Total | 366 (100.0%) | 120 (100.0%) |
Monthly Housing Cost Tiers in Wood River
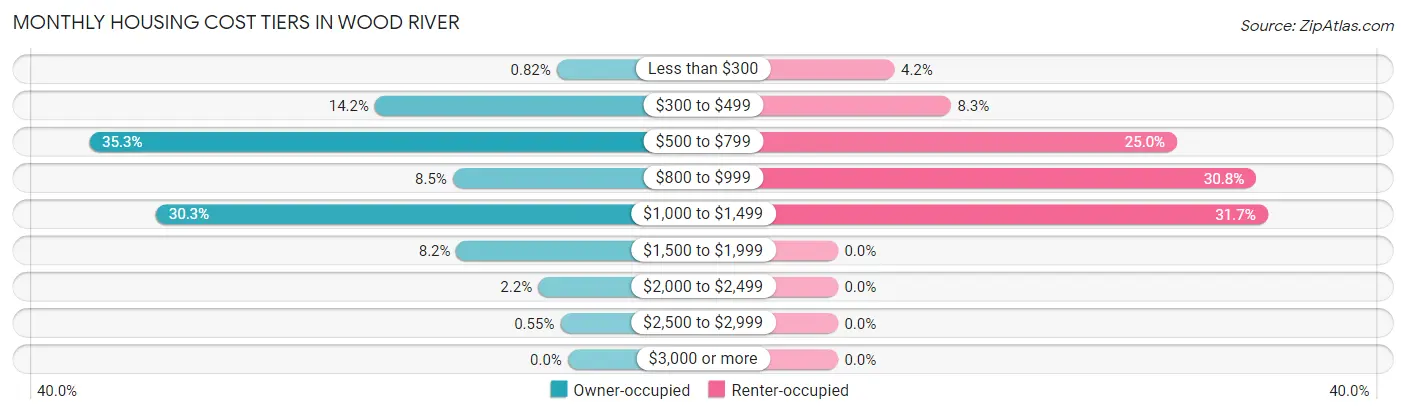
| Monthly Cost | Owner-occupied | Renter-occupied |
| Less than $300 | 3 (0.8%) | 5 (4.2%) |
| $300 to $499 | 52 (14.2%) | 10 (8.3%) |
| $500 to $799 | 129 (35.2%) | 30 (25.0%) |
| $800 to $999 | 31 (8.5%) | 37 (30.8%) |
| $1,000 to $1,499 | 111 (30.3%) | 38 (31.7%) |
| $1,500 to $1,999 | 30 (8.2%) | 0 (0.0%) |
| $2,000 to $2,499 | 8 (2.2%) | 0 (0.0%) |
| $2,500 to $2,999 | 2 (0.5%) | 0 (0.0%) |
| $3,000 or more | 0 (0.0%) | 0 (0.0%) |
| Total | 366 (100.0%) | 120 (100.0%) |
Physical Housing Characteristics in Wood River
Housing Structures in Wood River
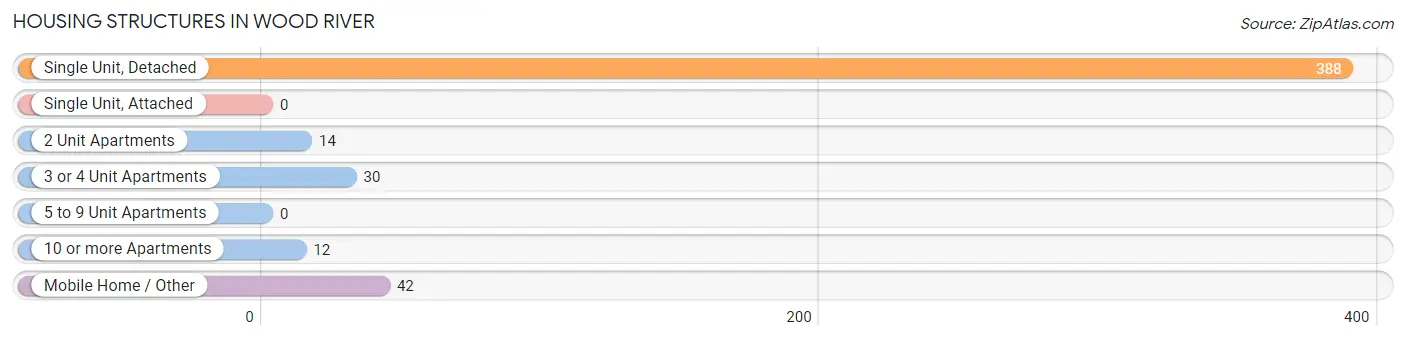
| Structure Type | # Housing Units | % Housing Units |
| Single Unit, Detached | 388 | 79.8% |
| Single Unit, Attached | 0 | 0.0% |
| 2 Unit Apartments | 14 | 2.9% |
| 3 or 4 Unit Apartments | 30 | 6.2% |
| 5 to 9 Unit Apartments | 0 | 0.0% |
| 10 or more Apartments | 12 | 2.5% |
| Mobile Home / Other | 42 | 8.6% |
| Total | 486 | 100.0% |
Housing Structures by Occupancy in Wood River
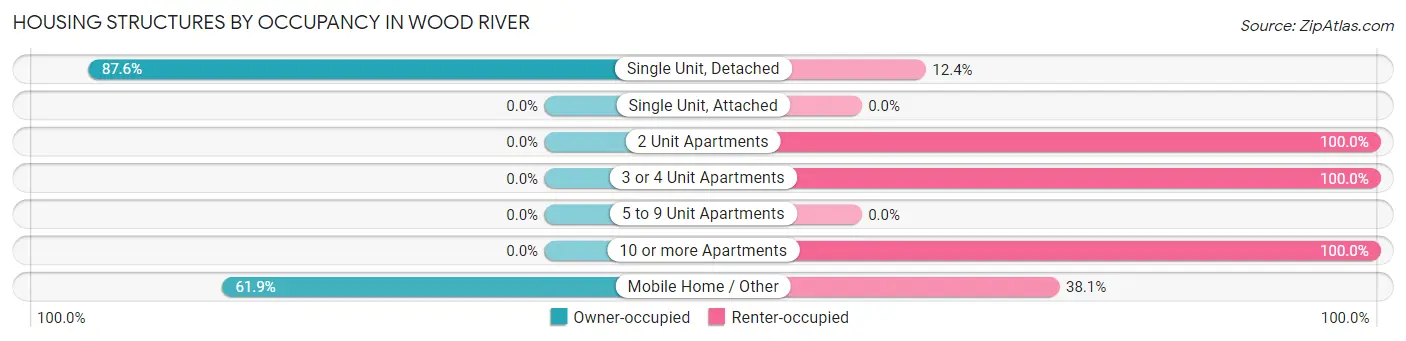
| Structure Type | Owner-occupied | Renter-occupied |
| Single Unit, Detached | 340 (87.6%) | 48 (12.4%) |
| Single Unit, Attached | 0 (0.0%) | 0 (0.0%) |
| 2 Unit Apartments | 0 (0.0%) | 14 (100.0%) |
| 3 or 4 Unit Apartments | 0 (0.0%) | 30 (100.0%) |
| 5 to 9 Unit Apartments | 0 (0.0%) | 0 (0.0%) |
| 10 or more Apartments | 0 (0.0%) | 12 (100.0%) |
| Mobile Home / Other | 26 (61.9%) | 16 (38.1%) |
| Total | 366 (75.3%) | 120 (24.7%) |
Housing Structures by Number of Rooms in Wood River
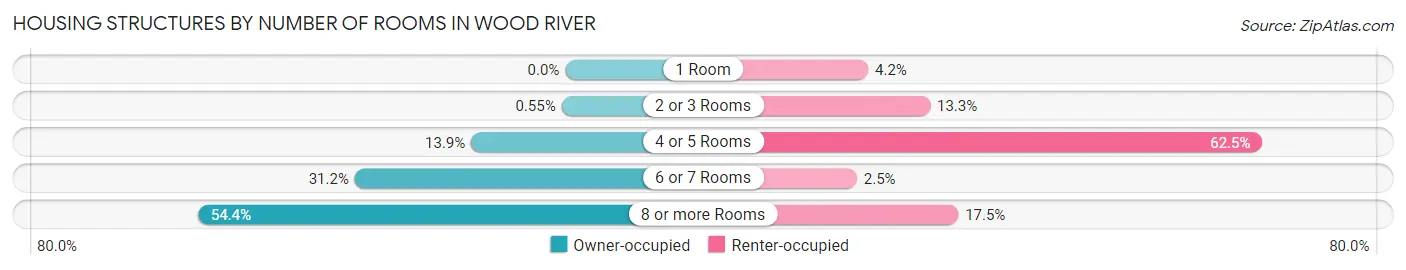
| Number of Rooms | Owner-occupied | Renter-occupied |
| 1 Room | 0 (0.0%) | 5 (4.2%) |
| 2 or 3 Rooms | 2 (0.5%) | 16 (13.3%) |
| 4 or 5 Rooms | 51 (13.9%) | 75 (62.5%) |
| 6 or 7 Rooms | 114 (31.1%) | 3 (2.5%) |
| 8 or more Rooms | 199 (54.4%) | 21 (17.5%) |
| Total | 366 (100.0%) | 120 (100.0%) |
Housing Structure by Heating Type in Wood River
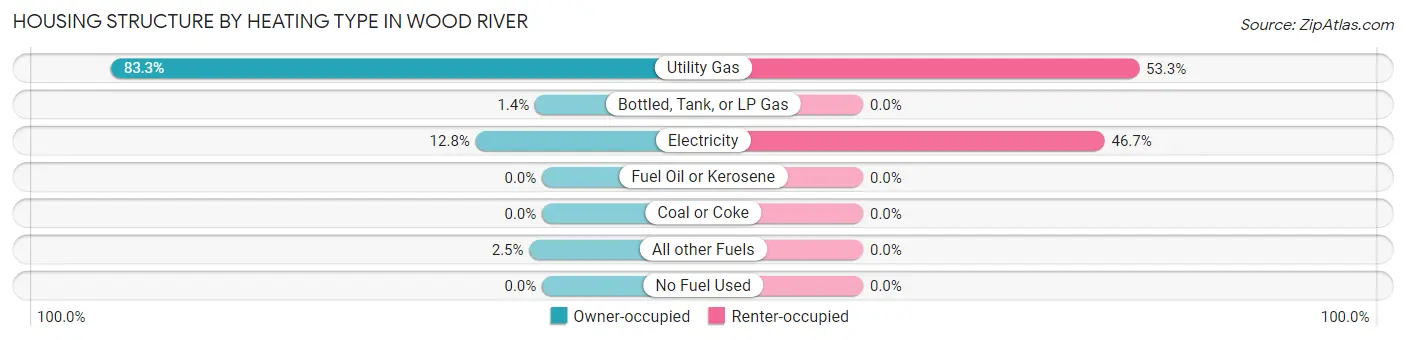
| Heating Type | Owner-occupied | Renter-occupied |
| Utility Gas | 305 (83.3%) | 64 (53.3%) |
| Bottled, Tank, or LP Gas | 5 (1.4%) | 0 (0.0%) |
| Electricity | 47 (12.8%) | 56 (46.7%) |
| Fuel Oil or Kerosene | 0 (0.0%) | 0 (0.0%) |
| Coal or Coke | 0 (0.0%) | 0 (0.0%) |
| All other Fuels | 9 (2.5%) | 0 (0.0%) |
| No Fuel Used | 0 (0.0%) | 0 (0.0%) |
| Total | 366 (100.0%) | 120 (100.0%) |
Household Vehicle Usage in Wood River
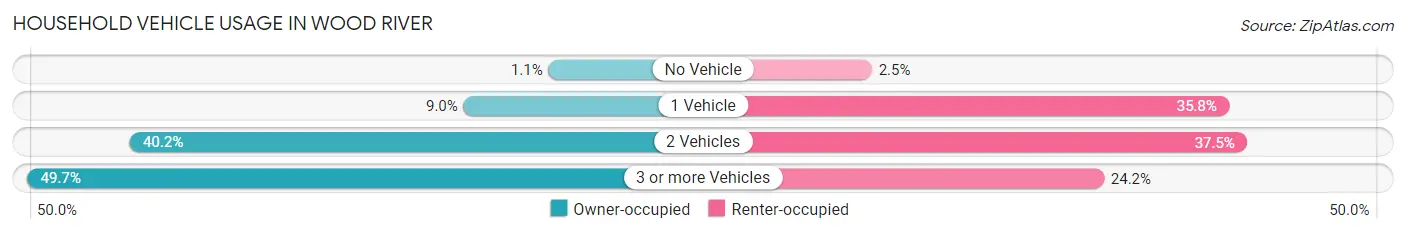
| Vehicles per Household | Owner-occupied | Renter-occupied |
| No Vehicle | 4 (1.1%) | 3 (2.5%) |
| 1 Vehicle | 33 (9.0%) | 43 (35.8%) |
| 2 Vehicles | 147 (40.2%) | 45 (37.5%) |
| 3 or more Vehicles | 182 (49.7%) | 29 (24.2%) |
| Total | 366 (100.0%) | 120 (100.0%) |
Real Estate & Mortgages in Wood River
Real Estate and Mortgage Overview in Wood River
| Characteristic | Without Mortgage | With Mortgage |
| Housing Units | 186 | 180 |
| Median Property Value | $109,700 | $157,700 |
| Median Household Income | $73,409 | $25 |
| Monthly Housing Costs | $630 | $0 |
| Real Estate Taxes | $1,662 | $10 |
Property Value by Mortgage Status in Wood River
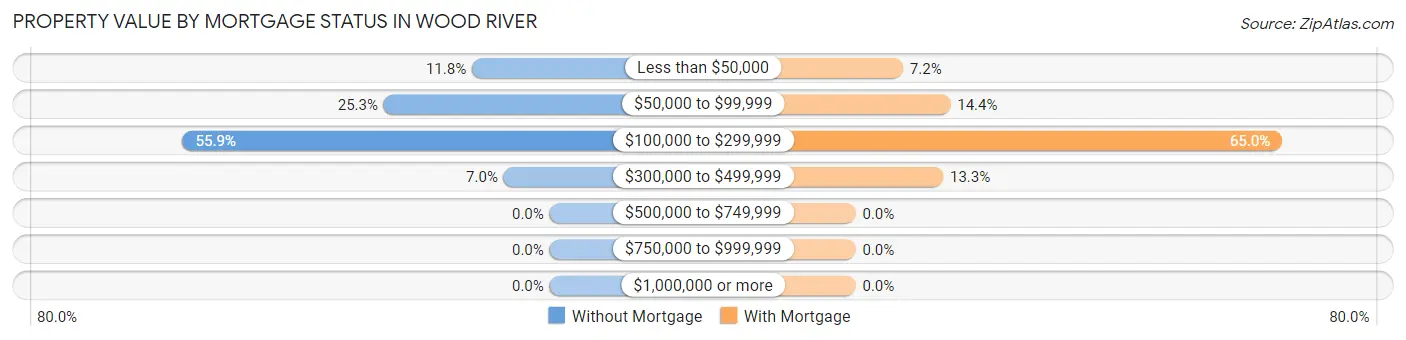
| Property Value | Without Mortgage | With Mortgage |
| Less than $50,000 | 22 (11.8%) | 13 (7.2%) |
| $50,000 to $99,999 | 47 (25.3%) | 26 (14.4%) |
| $100,000 to $299,999 | 104 (55.9%) | 117 (65.0%) |
| $300,000 to $499,999 | 13 (7.0%) | 24 (13.3%) |
| $500,000 to $749,999 | 0 (0.0%) | 0 (0.0%) |
| $750,000 to $999,999 | 0 (0.0%) | 0 (0.0%) |
| $1,000,000 or more | 0 (0.0%) | 0 (0.0%) |
| Total | 186 (100.0%) | 180 (100.0%) |
Household Income by Mortgage Status in Wood River
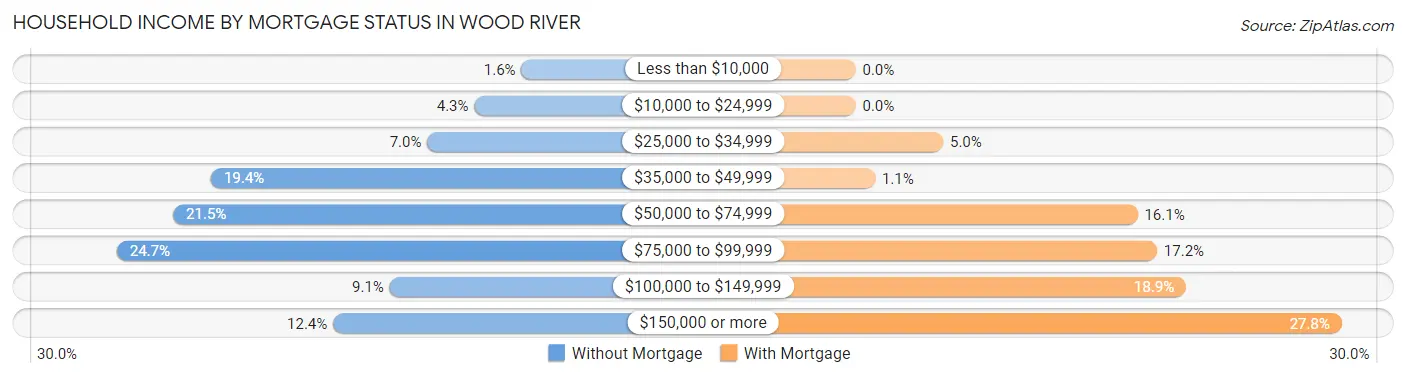
| Household Income | Without Mortgage | With Mortgage |
| Less than $10,000 | 3 (1.6%) | 0 (0.0%) |
| $10,000 to $24,999 | 8 (4.3%) | 0 (0.0%) |
| $25,000 to $34,999 | 13 (7.0%) | 9 (5.0%) |
| $35,000 to $49,999 | 36 (19.4%) | 2 (1.1%) |
| $50,000 to $74,999 | 40 (21.5%) | 29 (16.1%) |
| $75,000 to $99,999 | 46 (24.7%) | 31 (17.2%) |
| $100,000 to $149,999 | 17 (9.1%) | 34 (18.9%) |
| $150,000 or more | 23 (12.4%) | 50 (27.8%) |
| Total | 186 (100.0%) | 180 (100.0%) |
Property Value to Household Income Ratio in Wood River
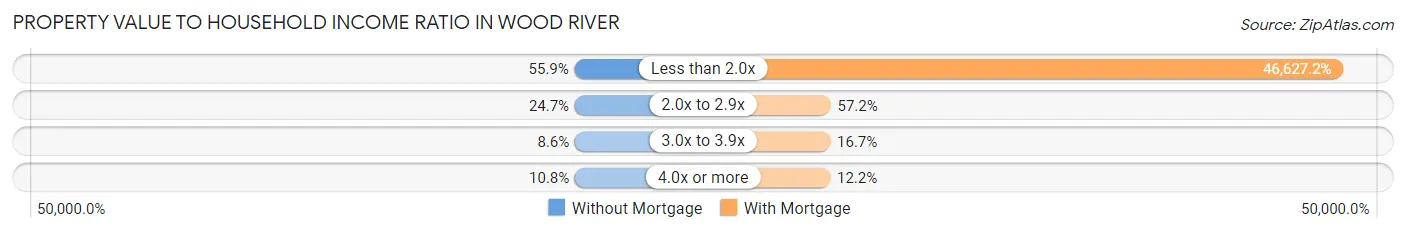
| Value-to-Income Ratio | Without Mortgage | With Mortgage |
| Less than 2.0x | 104 (55.9%) | 83,929 (46,627.2%) |
| 2.0x to 2.9x | 46 (24.7%) | 103 (57.2%) |
| 3.0x to 3.9x | 16 (8.6%) | 30 (16.7%) |
| 4.0x or more | 20 (10.7%) | 22 (12.2%) |
| Total | 186 (100.0%) | 180 (100.0%) |
Real Estate Taxes by Mortgage Status in Wood River
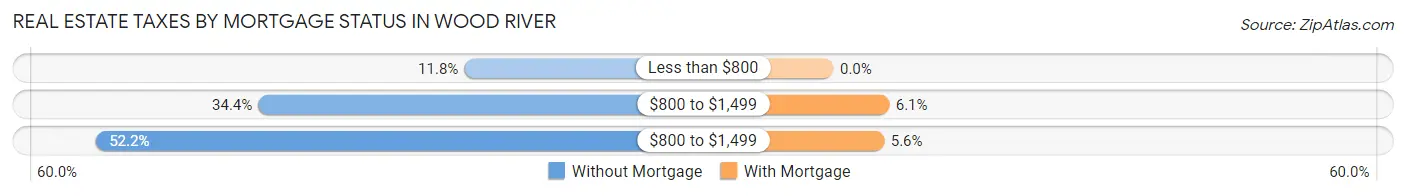
| Property Taxes | Without Mortgage | With Mortgage |
| Less than $800 | 22 (11.8%) | 0 (0.0%) |
| $800 to $1,499 | 64 (34.4%) | 11 (6.1%) |
| $800 to $1,499 | 97 (52.1%) | 10 (5.6%) |
| Total | 186 (100.0%) | 180 (100.0%) |
Health & Disability in Wood River
Health Insurance Coverage by Age in Wood River
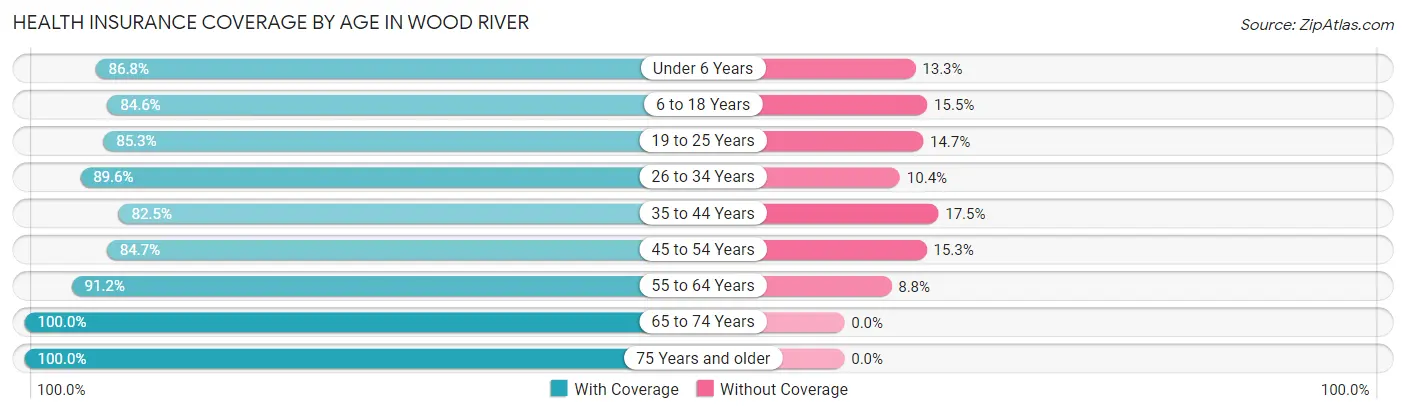
| Age Bracket | With Coverage | Without Coverage |
| Under 6 Years | 144 (86.8%) | 22 (13.3%) |
| 6 to 18 Years | 208 (84.6%) | 38 (15.4%) |
| 19 to 25 Years | 93 (85.3%) | 16 (14.7%) |
| 26 to 34 Years | 147 (89.6%) | 17 (10.4%) |
| 35 to 44 Years | 160 (82.5%) | 34 (17.5%) |
| 45 to 54 Years | 127 (84.7%) | 23 (15.3%) |
| 55 to 64 Years | 125 (91.2%) | 12 (8.8%) |
| 65 to 74 Years | 85 (100.0%) | 0 (0.0%) |
| 75 Years and older | 109 (100.0%) | 0 (0.0%) |
| Total | 1,198 (88.1%) | 162 (11.9%) |
Health Insurance Coverage by Citizenship Status in Wood River
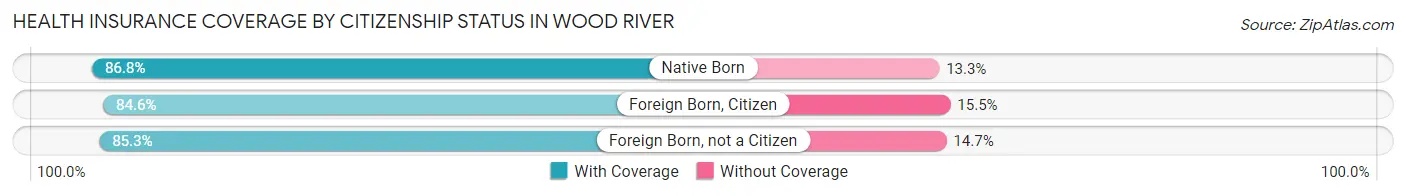
| Citizenship Status | With Coverage | Without Coverage |
| Native Born | 144 (86.8%) | 22 (13.3%) |
| Foreign Born, Citizen | 208 (84.6%) | 38 (15.4%) |
| Foreign Born, not a Citizen | 93 (85.3%) | 16 (14.7%) |
Health Insurance Coverage by Household Income in Wood River
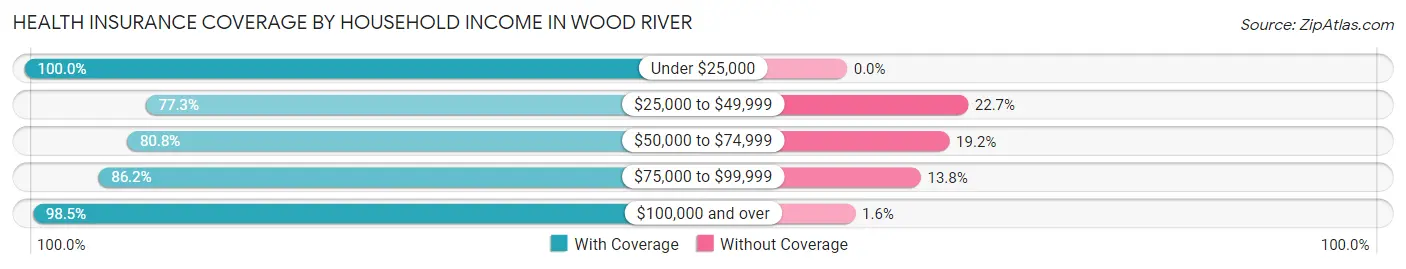
| Household Income | With Coverage | Without Coverage |
| Under $25,000 | 70 (100.0%) | 0 (0.0%) |
| $25,000 to $49,999 | 208 (77.3%) | 61 (22.7%) |
| $50,000 to $74,999 | 236 (80.8%) | 56 (19.2%) |
| $75,000 to $99,999 | 237 (86.2%) | 38 (13.8%) |
| $100,000 and over | 446 (98.5%) | 7 (1.5%) |
Public vs Private Health Insurance Coverage by Age in Wood River
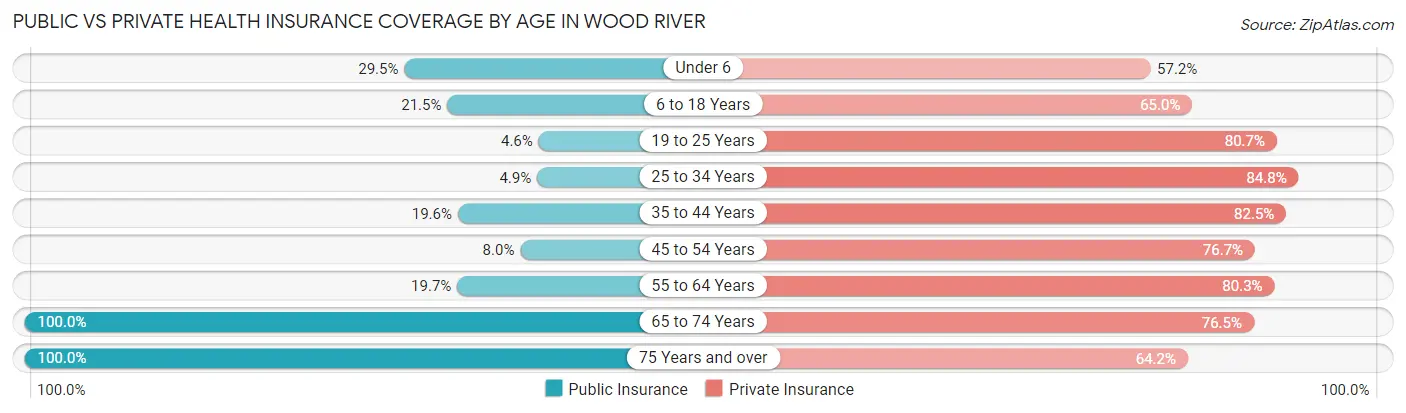
| Age Bracket | Public Insurance | Private Insurance |
| Under 6 | 49 (29.5%) | 95 (57.2%) |
| 6 to 18 Years | 53 (21.5%) | 160 (65.0%) |
| 19 to 25 Years | 5 (4.6%) | 88 (80.7%) |
| 25 to 34 Years | 8 (4.9%) | 139 (84.8%) |
| 35 to 44 Years | 38 (19.6%) | 160 (82.5%) |
| 45 to 54 Years | 12 (8.0%) | 115 (76.7%) |
| 55 to 64 Years | 27 (19.7%) | 110 (80.3%) |
| 65 to 74 Years | 85 (100.0%) | 65 (76.5%) |
| 75 Years and over | 109 (100.0%) | 70 (64.2%) |
| Total | 386 (28.4%) | 1,002 (73.7%) |
Disability Status by Sex by Age in Wood River
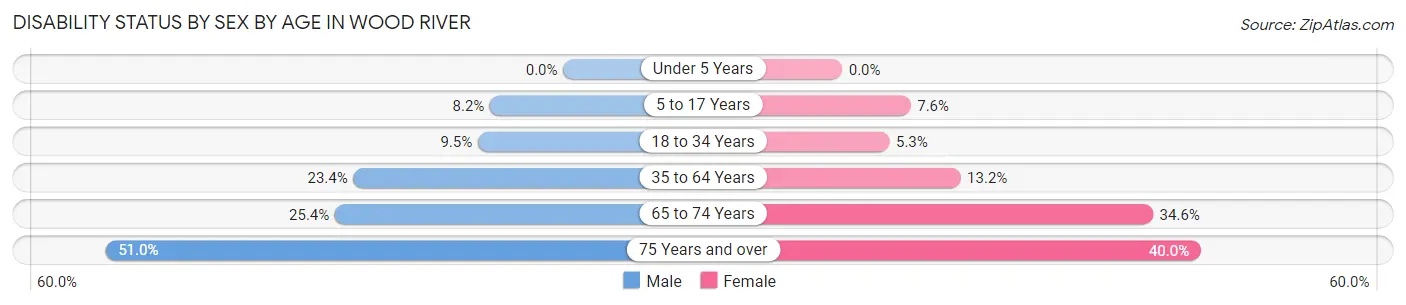
| Age Bracket | Male | Female |
| Under 5 Years | 0 (0.0%) | 0 (0.0%) |
| 5 to 17 Years | 11 (8.2%) | 9 (7.6%) |
| 18 to 34 Years | 17 (9.5%) | 7 (5.3%) |
| 35 to 64 Years | 61 (23.4%) | 29 (13.2%) |
| 65 to 74 Years | 15 (25.4%) | 9 (34.6%) |
| 75 Years and over | 25 (51.0%) | 24 (40.0%) |
Disability Class by Sex by Age in Wood River
Disability Class: Hearing Difficulty
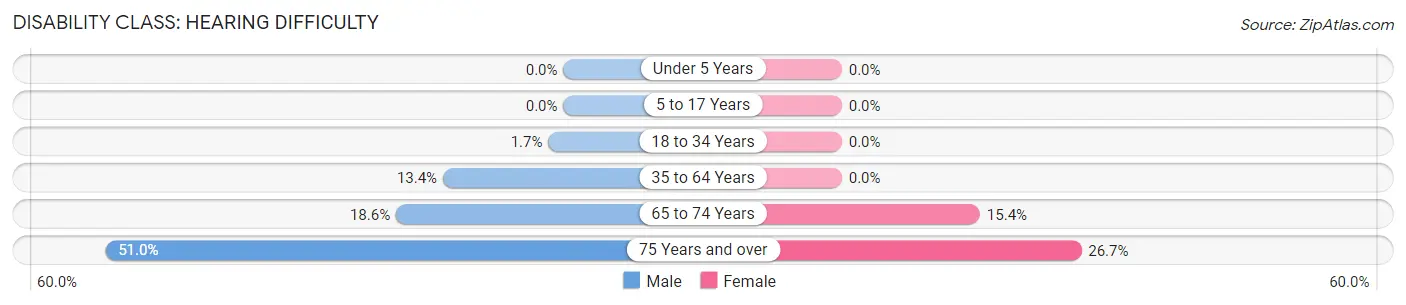
| Age Bracket | Male | Female |
| Under 5 Years | 0 (0.0%) | 0 (0.0%) |
| 5 to 17 Years | 0 (0.0%) | 0 (0.0%) |
| 18 to 34 Years | 3 (1.7%) | 0 (0.0%) |
| 35 to 64 Years | 35 (13.4%) | 0 (0.0%) |
| 65 to 74 Years | 11 (18.6%) | 4 (15.4%) |
| 75 Years and over | 25 (51.0%) | 16 (26.7%) |
Disability Class: Vision Difficulty
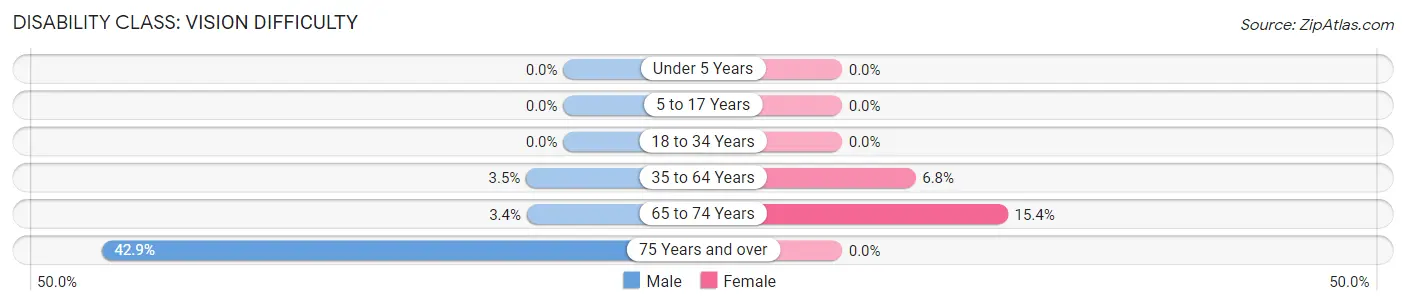
| Age Bracket | Male | Female |
| Under 5 Years | 0 (0.0%) | 0 (0.0%) |
| 5 to 17 Years | 0 (0.0%) | 0 (0.0%) |
| 18 to 34 Years | 0 (0.0%) | 0 (0.0%) |
| 35 to 64 Years | 9 (3.5%) | 15 (6.8%) |
| 65 to 74 Years | 2 (3.4%) | 4 (15.4%) |
| 75 Years and over | 21 (42.9%) | 0 (0.0%) |
Disability Class: Cognitive Difficulty
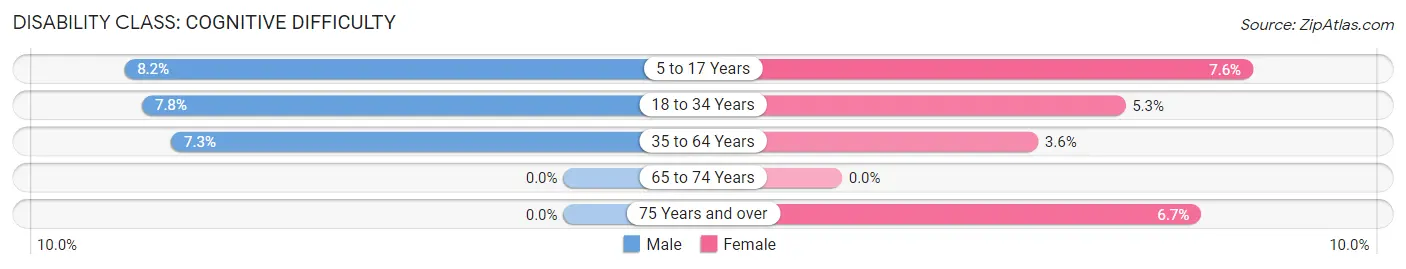
| Age Bracket | Male | Female |
| 5 to 17 Years | 11 (8.2%) | 9 (7.6%) |
| 18 to 34 Years | 14 (7.8%) | 7 (5.3%) |
| 35 to 64 Years | 19 (7.3%) | 8 (3.6%) |
| 65 to 74 Years | 0 (0.0%) | 0 (0.0%) |
| 75 Years and over | 0 (0.0%) | 4 (6.7%) |
Disability Class: Ambulatory Difficulty
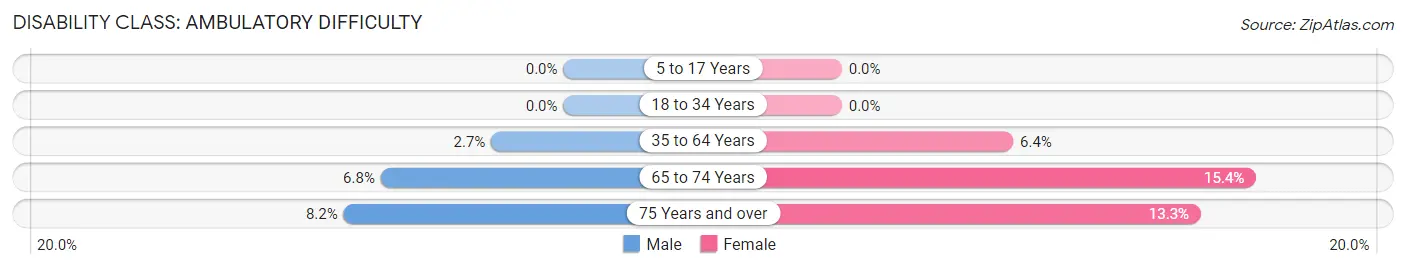
| Age Bracket | Male | Female |
| 5 to 17 Years | 0 (0.0%) | 0 (0.0%) |
| 18 to 34 Years | 0 (0.0%) | 0 (0.0%) |
| 35 to 64 Years | 7 (2.7%) | 14 (6.4%) |
| 65 to 74 Years | 4 (6.8%) | 4 (15.4%) |
| 75 Years and over | 4 (8.2%) | 8 (13.3%) |
Disability Class: Self-Care Difficulty
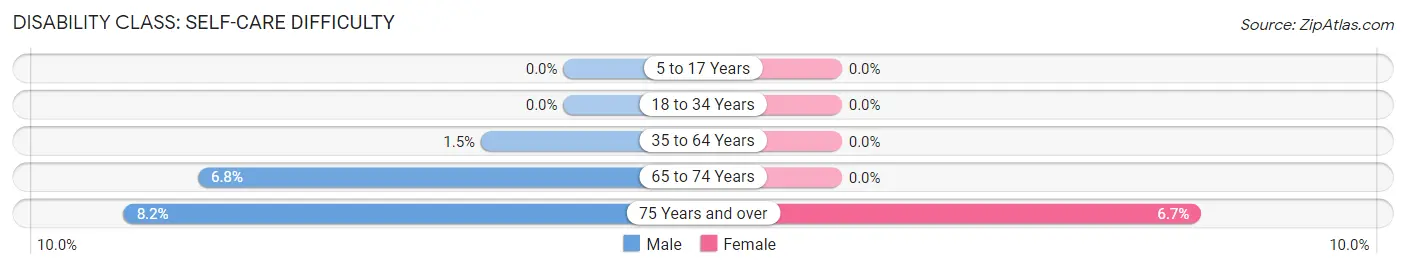
| Age Bracket | Male | Female |
| 5 to 17 Years | 0 (0.0%) | 0 (0.0%) |
| 18 to 34 Years | 0 (0.0%) | 0 (0.0%) |
| 35 to 64 Years | 4 (1.5%) | 0 (0.0%) |
| 65 to 74 Years | 4 (6.8%) | 0 (0.0%) |
| 75 Years and over | 4 (8.2%) | 4 (6.7%) |
Technology Access in Wood River
Computing Device Access in Wood River
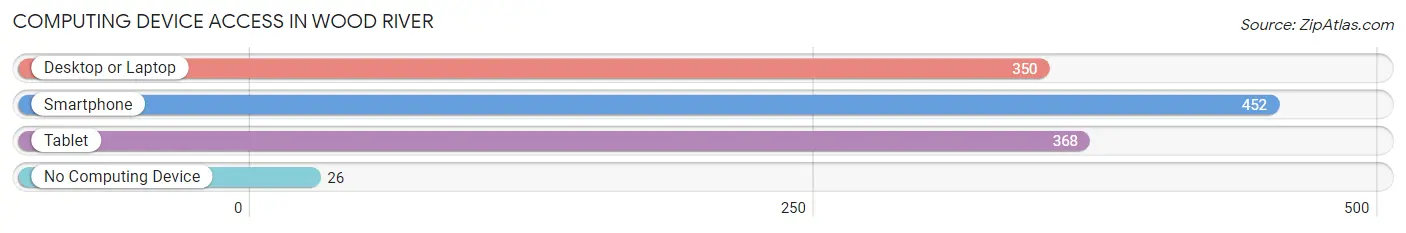
| Device Type | # Households | % Households |
| Desktop or Laptop | 350 | 72.0% |
| Smartphone | 452 | 93.0% |
| Tablet | 368 | 75.7% |
| No Computing Device | 26 | 5.3% |
| Total | 486 | 100.0% |
Internet Access in Wood River
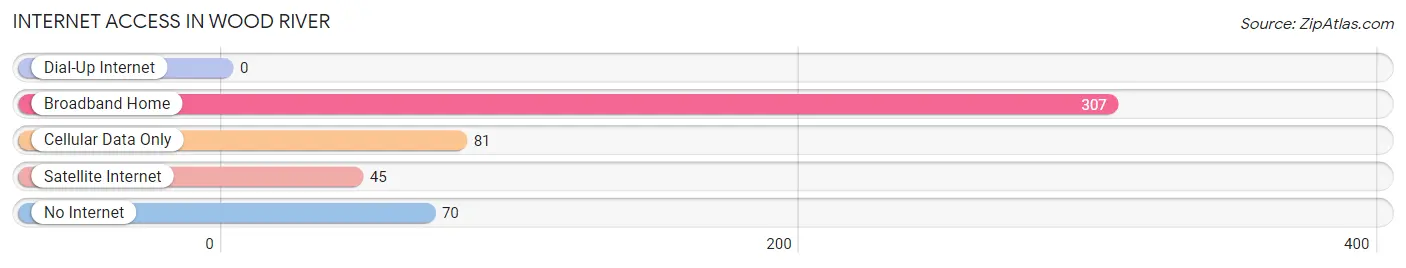
| Internet Type | # Households | % Households |
| Dial-Up Internet | 0 | 0.0% |
| Broadband Home | 307 | 63.2% |
| Cellular Data Only | 81 | 16.7% |
| Satellite Internet | 45 | 9.3% |
| No Internet | 70 | 14.4% |
| Total | 486 | 100.0% |
Wood River Summary
River Wood, Nebraska is a small town located in the southeastern corner of the state. It is situated in the heart of the Sandhills region, which is known for its rolling hills and sandy soils. The town was founded in 1887 and has a population of approximately 1,000 people.
The town of River Wood is located in the Platte River Valley, which is a major tributary of the Missouri River. The Platte River Valley is known for its rich agricultural land, which has been used for farming and ranching for centuries. The town is also located near the Niobrara River, which is a popular destination for fishing and boating.
The town of River Wood is located in the Nebraska Panhandle, which is a region of the state that is known for its wide open spaces and sparse population. The town is located in the western part of the state, which is known for its dry climate and hot summers. The town is also located near the Nebraska Sandhills, which is a region of the state that is known for its rolling hills and sandy soils.
The economy of River Wood is largely based on agriculture and ranching. The town is home to several large farms and ranches, which produce a variety of crops and livestock. The town is also home to several small businesses, including a grocery store, a hardware store, and a few restaurants.
The demographics of River Wood are largely white, with a small percentage of African Americans and Hispanics. The town is also home to a small Native American population. The median household income in River Wood is approximately $35,000, which is slightly lower than the state average.
River Wood is served by the Platte County School District, which is comprised of three elementary schools, one middle school, and one high school. The town is also home to a small library and a few churches.
River Wood is a small town with a rich history and a bright future. The town is home to a variety of businesses and industries, and its residents enjoy a high quality of life. The town is also located in a beautiful part of the state, which makes it a great place to live and visit.
Common Questions
What is Per Capita Income in Wood River?
Per Capita income in Wood River is $28,560.
What is the Median Family Income in Wood River?
Median Family Income in Wood River is $83,194.
What is the Median Household income in Wood River?
Median Household Income in Wood River is $69,459.
What is Income or Wage Gap in Wood River?
Income or Wage Gap in Wood River is 32.2%.
Women in Wood River earn 67.8 cents for every dollar earned by a man.
What is Inequality or Gini Index in Wood River?
Inequality or Gini Index in Wood River is 0.34.
What is the Total Population of Wood River?
Total Population of Wood River is 1,405.
What is the Total Male Population of Wood River?
Total Male Population of Wood River is 740.
What is the Total Female Population of Wood River?
Total Female Population of Wood River is 665.
What is the Ratio of Males per 100 Females in Wood River?
There are 111.28 Males per 100 Females in Wood River.
What is the Ratio of Females per 100 Males in Wood River?
There are 89.86 Females per 100 Males in Wood River.
What is the Median Population Age in Wood River?
Median Population Age in Wood River is 35.6 Years.
What is the Average Family Size in Wood River
Average Family Size in Wood River is 3.2 People.
What is the Average Household Size in Wood River
Average Household Size in Wood River is 2.8 People.
How Large is the Labor Force in Wood River?
There are 752 People in the Labor Forcein in Wood River.
What is the Percentage of People in the Labor Force in Wood River?
68.3% of People are in the Labor Force in Wood River.
What is the Unemployment Rate in Wood River?
Unemployment Rate in Wood River is 5.2%.