Wood Lake, NE Map & Demographics
Wood Lake Map
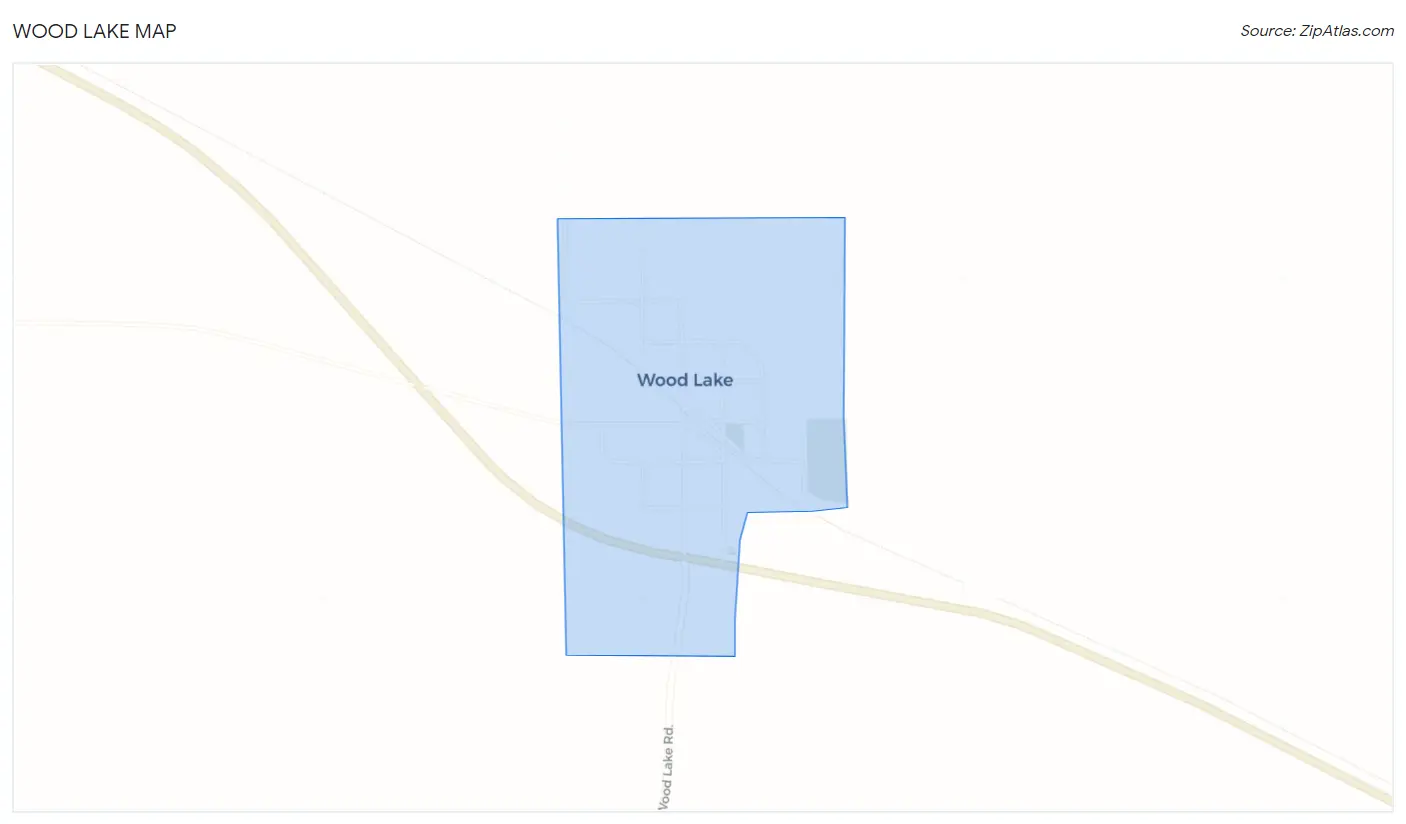
Wood Lake Overview
$23,878
PER CAPITA INCOME
0.28
INEQUALITY / GINI INDEX
23
TOTAL POPULATION
11
MALE POPULATION
12
FEMALE POPULATION
91.67
MALES / 100 FEMALES
109.09
FEMALES / 100 MALES
74.4
MEDIAN AGE
1.8
AVG FAMILY SIZE
1.6
AVG HOUSEHOLD SIZE
9
LABOR FORCE [ PEOPLE ]
39.1%
PERCENT IN LABOR FORCE
Wood Lake Zip Codes
Wood Lake Area Codes
Income in Wood Lake
Income Overview in Wood Lake
| Characteristic | Number | Measure |
| Per Capita Income | 23 | $23,878 |
| Median Family Income | 11 | $0 |
| Mean Family Income | 11 | $54,191 |
| Median Household Income | 14 | $0 |
| Mean Household Income | 14 | $47,243 |
| Income Deficit | 11 | $0 |
| Wage / Income Gap (%) | 23 | 0.00% |
| Wage / Income Gap ($) | 23 | 100.00¢ per $1 |
| Gini / Inequality Index | 23 | 0.28 |
Earnings by Sex in Wood Lake
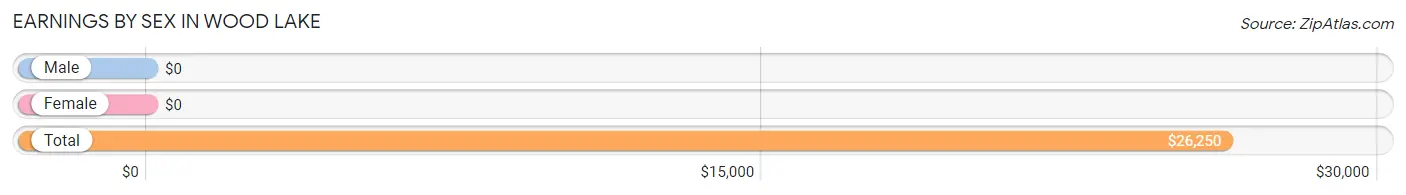
| Sex | Number | Average Earnings |
| Male | 4 (36.4%) | $0 |
| Female | 7 (63.6%) | $0 |
| Total | 11 (100.0%) | $26,250 |
Earnings by Sex by Income Bracket in Wood Lake
The most common earnings brackets in Wood Lake are $25,000 to $29,999 for men (2 | 50.0%) and $25,000 to $29,999 for women (3 | 42.9%).
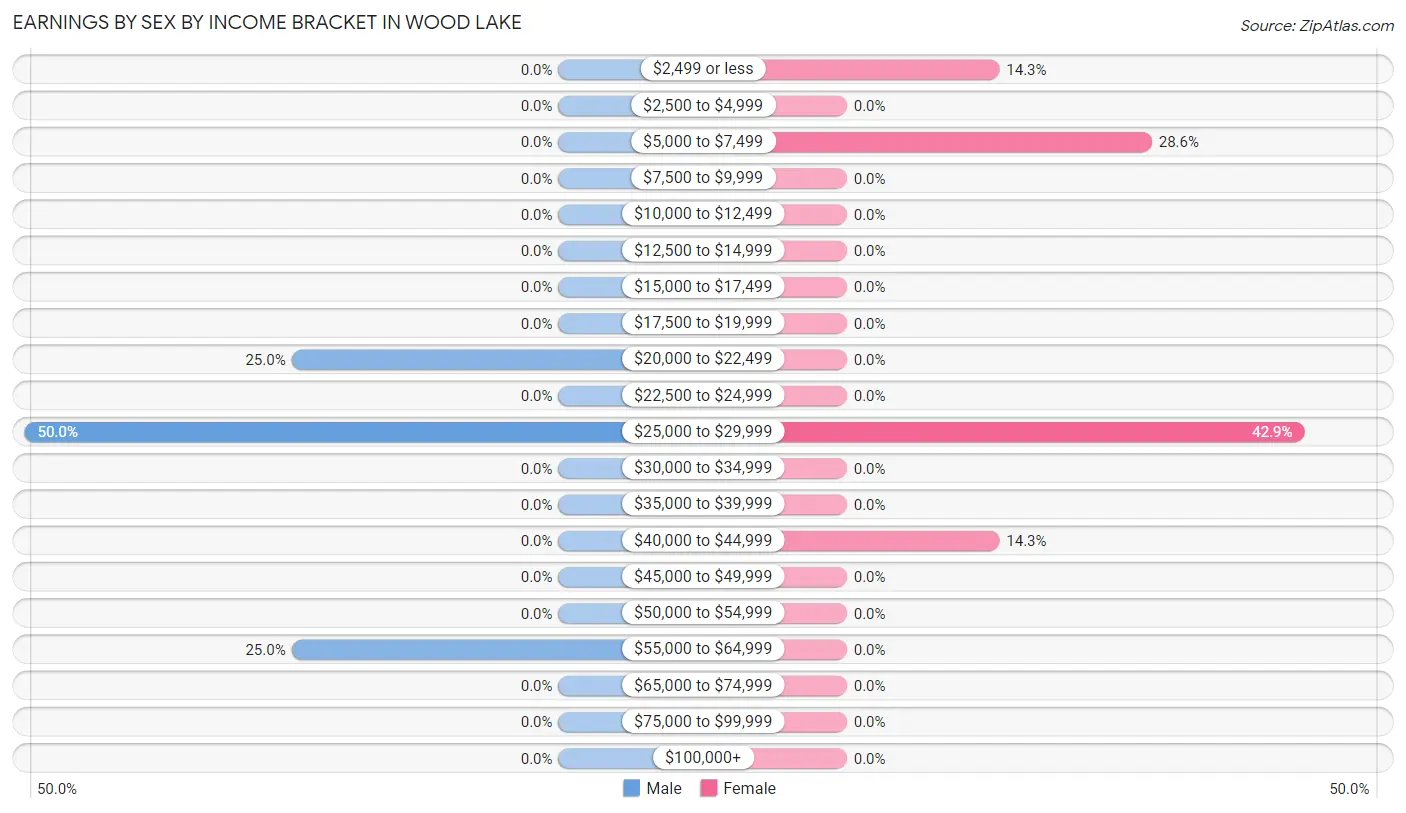
| Income | Male | Female |
| $2,499 or less | 0 (0.0%) | 1 (14.3%) |
| $2,500 to $4,999 | 0 (0.0%) | 0 (0.0%) |
| $5,000 to $7,499 | 0 (0.0%) | 2 (28.6%) |
| $7,500 to $9,999 | 0 (0.0%) | 0 (0.0%) |
| $10,000 to $12,499 | 0 (0.0%) | 0 (0.0%) |
| $12,500 to $14,999 | 0 (0.0%) | 0 (0.0%) |
| $15,000 to $17,499 | 0 (0.0%) | 0 (0.0%) |
| $17,500 to $19,999 | 0 (0.0%) | 0 (0.0%) |
| $20,000 to $22,499 | 1 (25.0%) | 0 (0.0%) |
| $22,500 to $24,999 | 0 (0.0%) | 0 (0.0%) |
| $25,000 to $29,999 | 2 (50.0%) | 3 (42.9%) |
| $30,000 to $34,999 | 0 (0.0%) | 0 (0.0%) |
| $35,000 to $39,999 | 0 (0.0%) | 0 (0.0%) |
| $40,000 to $44,999 | 0 (0.0%) | 1 (14.3%) |
| $45,000 to $49,999 | 0 (0.0%) | 0 (0.0%) |
| $50,000 to $54,999 | 0 (0.0%) | 0 (0.0%) |
| $55,000 to $64,999 | 1 (25.0%) | 0 (0.0%) |
| $65,000 to $74,999 | 0 (0.0%) | 0 (0.0%) |
| $75,000 to $99,999 | 0 (0.0%) | 0 (0.0%) |
| $100,000+ | 0 (0.0%) | 0 (0.0%) |
| Total | 4 (100.0%) | 7 (100.0%) |
Earnings by Sex by Educational Attainment in Wood Lake
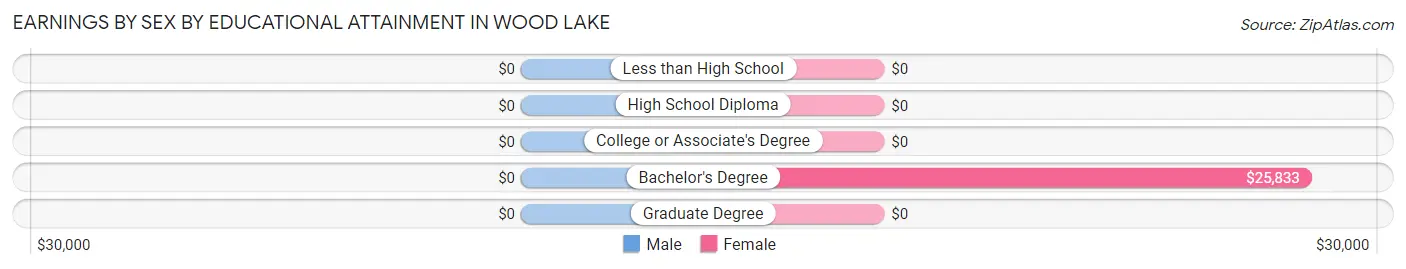
| Educational Attainment | Male Income | Female Income |
| Less than High School | - | - |
| High School Diploma | - | - |
| College or Associate's Degree | - | - |
| Bachelor's Degree | - | - |
| Graduate Degree | - | - |
| Total | - | - |
Family Income in Wood Lake
Family Income Brackets in Wood Lake
According to the Wood Lake family income data, there are 5 families falling into the $25,000 to $34,999 income range, which is the most common income bracket and makes up 45.5% of all families.
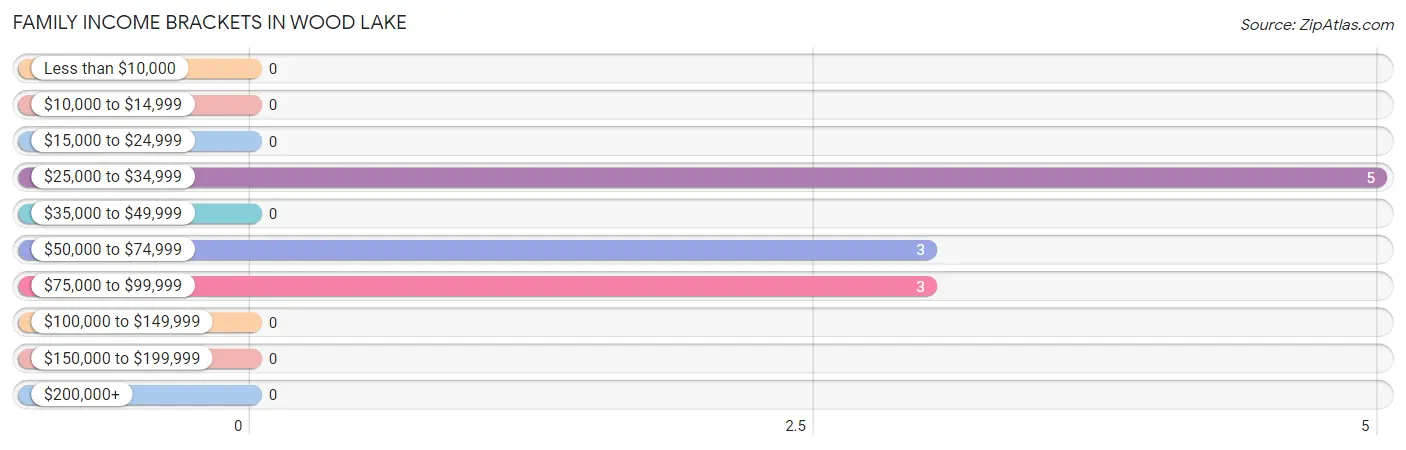
| Income Bracket | # Families | % Families |
| Less than $10,000 | 0 | 0.0% |
| $10,000 to $14,999 | 0 | 0.0% |
| $15,000 to $24,999 | 0 | 0.0% |
| $25,000 to $34,999 | 5 | 45.5% |
| $35,000 to $49,999 | 0 | 0.0% |
| $50,000 to $74,999 | 3 | 27.3% |
| $75,000 to $99,999 | 3 | 27.3% |
| $100,000 to $149,999 | 0 | 0.0% |
| $150,000 to $199,999 | 0 | 0.0% |
| $200,000+ | 0 | 0.0% |
Family Income by Famaliy Size in Wood Lake
| Income Bracket | # Families | Median Income |
| 2-Person Families | 11 (100.0%) | $0 |
| 3-Person Families | 0 (0.0%) | $0 |
| 4-Person Families | 0 (0.0%) | $0 |
| 5-Person Families | 0 (0.0%) | $0 |
| 6-Person Families | 0 (0.0%) | $0 |
| 7+ Person Families | 0 (0.0%) | $0 |
| Total | 11 (100.0%) | $0 |
Family Income by Number of Earners in Wood Lake
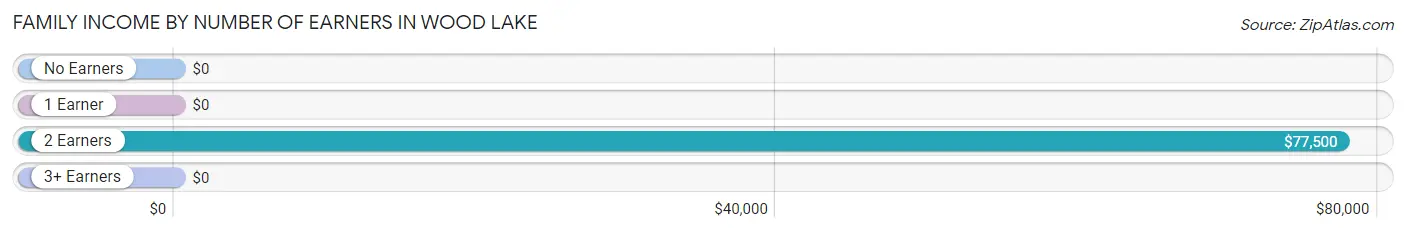
| Number of Earners | # Families | Median Income |
| No Earners | 5 (45.5%) | $0 |
| 1 Earner | 0 (0.0%) | $0 |
| 2 Earners | 6 (54.5%) | $77,500 |
| 3+ Earners | 0 (0.0%) | $0 |
| Total | 11 (100.0%) | $0 |
Household Income in Wood Lake
Household Income Brackets in Wood Lake
With 5 households falling in the category, the $25,000 to $34,999 income range is the most frequent in Wood Lake, accounting for 35.7% of all households.
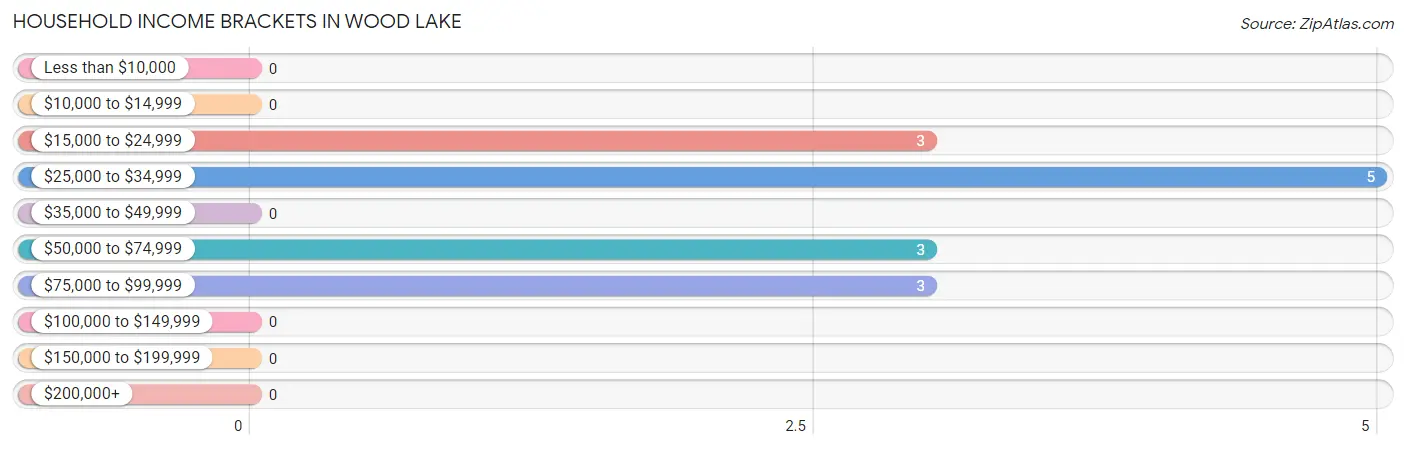
| Income Bracket | # Households | % Households |
| Less than $10,000 | 0 | 0.0% |
| $10,000 to $14,999 | 0 | 0.0% |
| $15,000 to $24,999 | 3 | 21.4% |
| $25,000 to $34,999 | 5 | 35.7% |
| $35,000 to $49,999 | 0 | 0.0% |
| $50,000 to $74,999 | 3 | 21.4% |
| $75,000 to $99,999 | 3 | 21.4% |
| $100,000 to $149,999 | 0 | 0.0% |
| $150,000 to $199,999 | 0 | 0.0% |
| $200,000+ | 0 | 0.0% |
Household Income by Householder Age in Wood Lake
The median household income in Wood Lake is $0, with the highest median household income of $28,500 found in the 65+ years age bracket for the primary householder. A total of 10 households (71.4%) fall into this category.
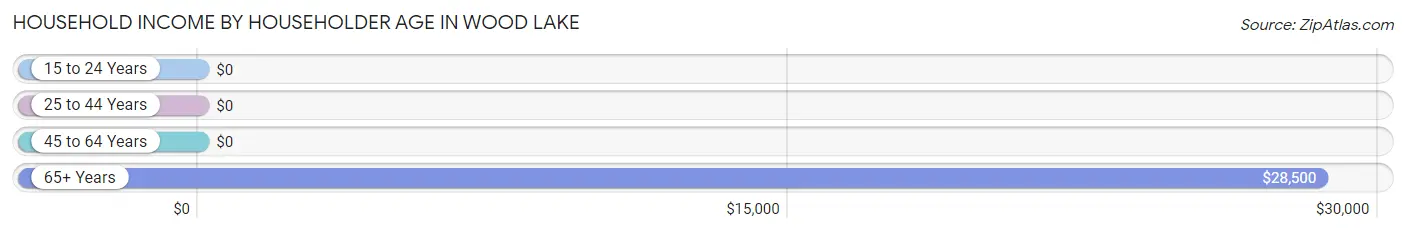
| Income Bracket | # Households | Median Income |
| 15 to 24 Years | 0 (0.0%) | $0 |
| 25 to 44 Years | 3 (21.4%) | $0 |
| 45 to 64 Years | 1 (7.1%) | $0 |
| 65+ Years | 10 (71.4%) | $28,500 |
| Total | 14 (100.0%) | $0 |
Poverty in Wood Lake
Income Below Poverty by Sex and Age in Wood Lake
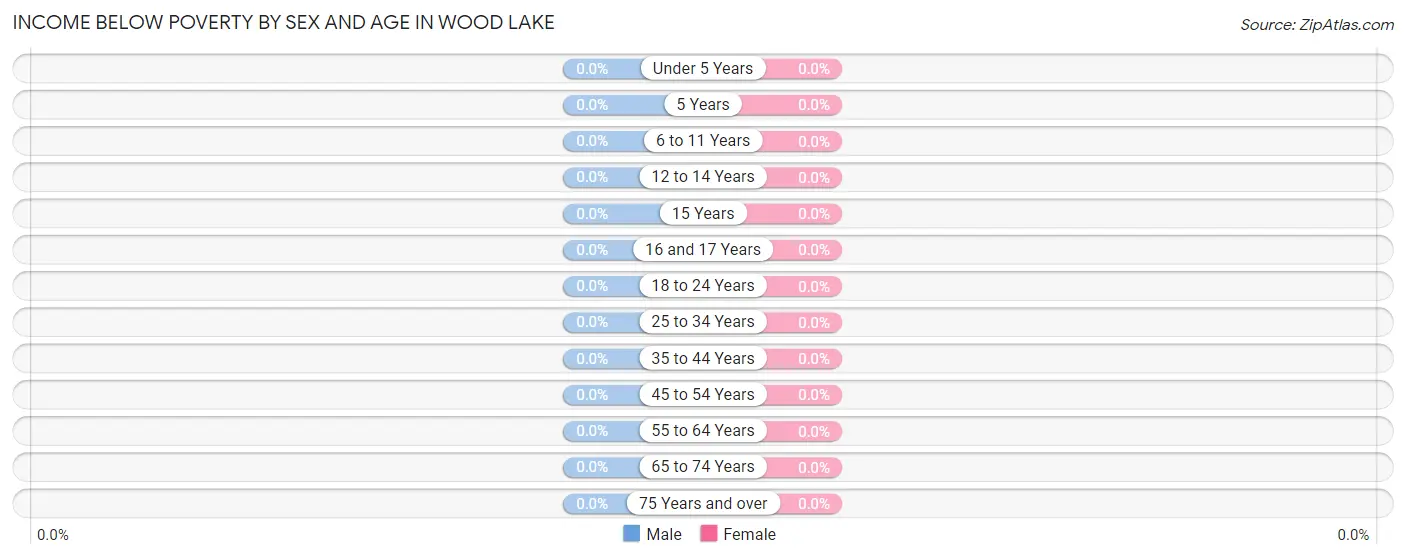
| Age Bracket | Male | Female |
| Under 5 Years | 0 (0.0%) | 0 (0.0%) |
| 5 Years | 0 (0.0%) | 0 (0.0%) |
| 6 to 11 Years | 0 (0.0%) | 0 (0.0%) |
| 12 to 14 Years | 0 (0.0%) | 0 (0.0%) |
| 15 Years | 0 (0.0%) | 0 (0.0%) |
| 16 and 17 Years | 0 (0.0%) | 0 (0.0%) |
| 18 to 24 Years | 0 (0.0%) | 0 (0.0%) |
| 25 to 34 Years | 0 (0.0%) | 0 (0.0%) |
| 35 to 44 Years | 0 (0.0%) | 0 (0.0%) |
| 45 to 54 Years | 0 (0.0%) | 0 (0.0%) |
| 55 to 64 Years | 0 (0.0%) | 0 (0.0%) |
| 65 to 74 Years | 0 (0.0%) | 0 (0.0%) |
| 75 Years and over | 0 (0.0%) | 0 (0.0%) |
| Total | 0 (0.0%) | 0 (0.0%) |
Income Above Poverty by Sex and Age in Wood Lake
According to the poverty statistics in Wood Lake, males aged 25 to 34 years and females aged 25 to 34 years are the age groups that are most secure financially, with 100.0% of males and 100.0% of females in these age groups living above the poverty line.
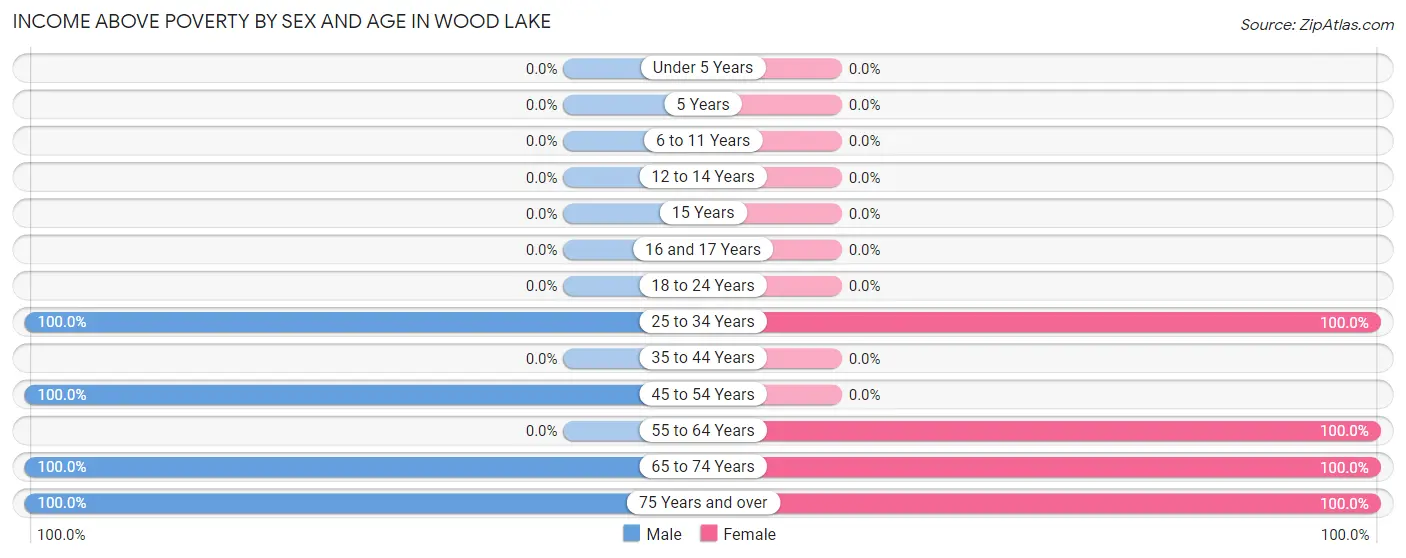
| Age Bracket | Male | Female |
| Under 5 Years | 0 (0.0%) | 0 (0.0%) |
| 5 Years | 0 (0.0%) | 0 (0.0%) |
| 6 to 11 Years | 0 (0.0%) | 0 (0.0%) |
| 12 to 14 Years | 0 (0.0%) | 0 (0.0%) |
| 15 Years | 0 (0.0%) | 0 (0.0%) |
| 16 and 17 Years | 0 (0.0%) | 0 (0.0%) |
| 18 to 24 Years | 0 (0.0%) | 0 (0.0%) |
| 25 to 34 Years | 1 (100.0%) | 3 (100.0%) |
| 35 to 44 Years | 0 (0.0%) | 0 (0.0%) |
| 45 to 54 Years | 1 (100.0%) | 0 (0.0%) |
| 55 to 64 Years | 0 (0.0%) | 1 (100.0%) |
| 65 to 74 Years | 7 (100.0%) | 5 (100.0%) |
| 75 Years and over | 2 (100.0%) | 3 (100.0%) |
| Total | 11 (100.0%) | 12 (100.0%) |
Income Below Poverty Among Married-Couple Families in Wood Lake
| Children | Above Poverty | Below Poverty |
| No Children | 11 (100.0%) | 0 (0.0%) |
| 1 or 2 Children | 0 (0.0%) | 0 (0.0%) |
| 3 or 4 Children | 0 (0.0%) | 0 (0.0%) |
| 5 or more Children | 0 (0.0%) | 0 (0.0%) |
| Total | 11 (100.0%) | 0 (0.0%) |
Income Below Poverty Among Single-Parent Households in Wood Lake
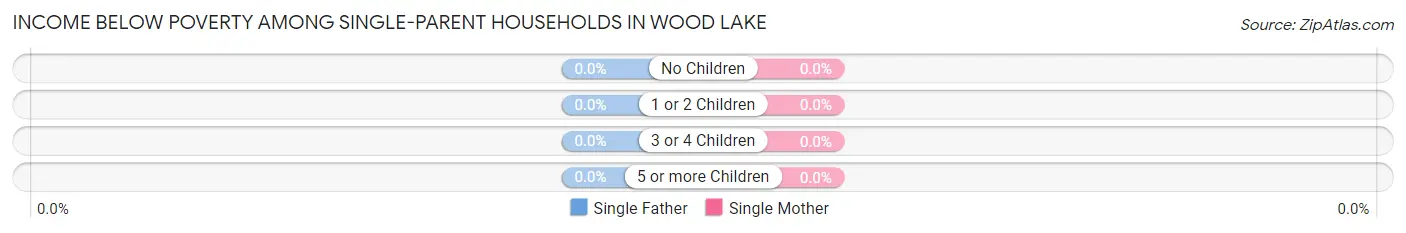
| Children | Single Father | Single Mother |
| No Children | 0 (0.0%) | 0 (0.0%) |
| 1 or 2 Children | 0 (0.0%) | 0 (0.0%) |
| 3 or 4 Children | 0 (0.0%) | 0 (0.0%) |
| 5 or more Children | 0 (0.0%) | 0 (0.0%) |
| Total | 0 (0.0%) | 0 (0.0%) |
Income Below Poverty Among Married-Couple vs Single-Parent Households in Wood Lake
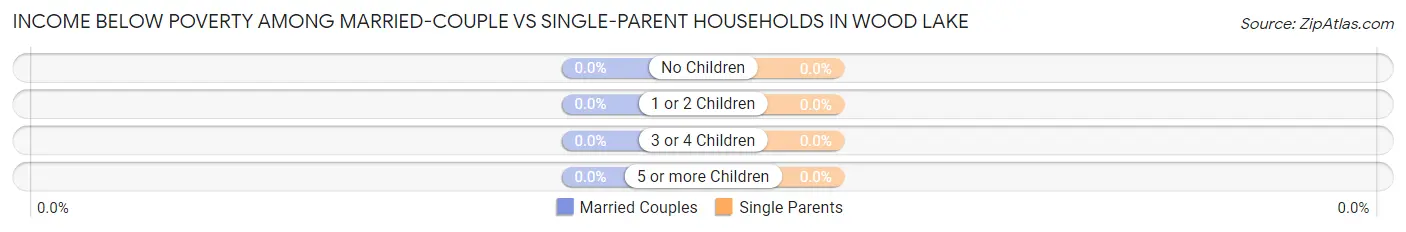
| Children | Married-Couple Families | Single-Parent Households |
| No Children | 0 (0.0%) | 0 (0.0%) |
| 1 or 2 Children | 0 (0.0%) | 0 (0.0%) |
| 3 or 4 Children | 0 (0.0%) | 0 (0.0%) |
| 5 or more Children | 0 (0.0%) | 0 (0.0%) |
| Total | 0 (0.0%) | 0 (0.0%) |
Race in Wood Lake
The most populous races in Wood Lake are White / Caucasian (21 | 91.3%), and Native / Alaskan (2 | 8.7%).
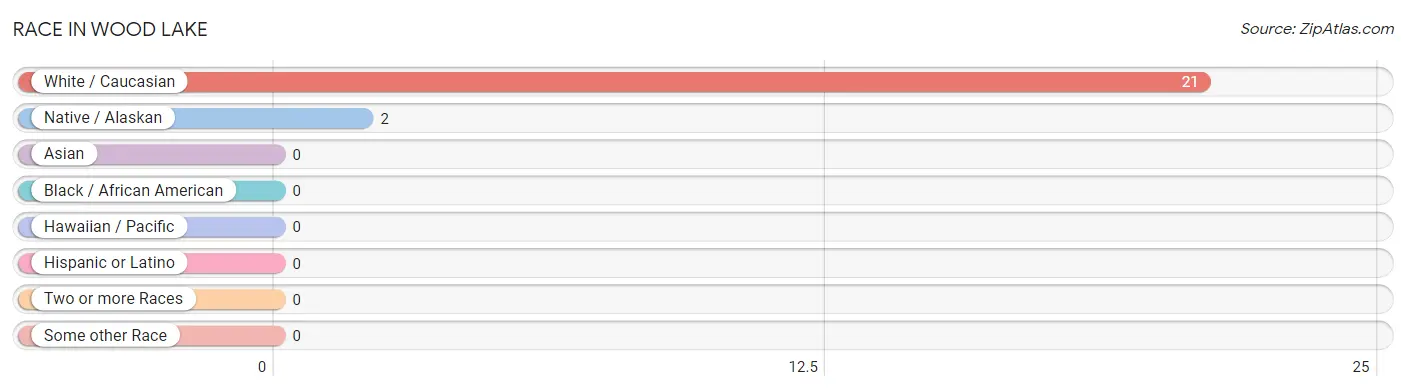
| Race | # Population | % Population |
| Asian | 0 | 0.0% |
| Black / African American | 0 | 0.0% |
| Hawaiian / Pacific | 0 | 0.0% |
| Hispanic or Latino | 0 | 0.0% |
| Native / Alaskan | 2 | 8.7% |
| White / Caucasian | 21 | 91.3% |
| Two or more Races | 0 | 0.0% |
| Some other Race | 0 | 0.0% |
| Total | 23 | 100.0% |
Ancestry in Wood Lake
The most populous ancestries reported in Wood Lake are French (4 | 17.4%), Danish (3 | 13.0%), English (3 | 13.0%), Scottish (3 | 13.0%), and Sioux (2 | 8.7%), together accounting for 65.2% of all Wood Lake residents.
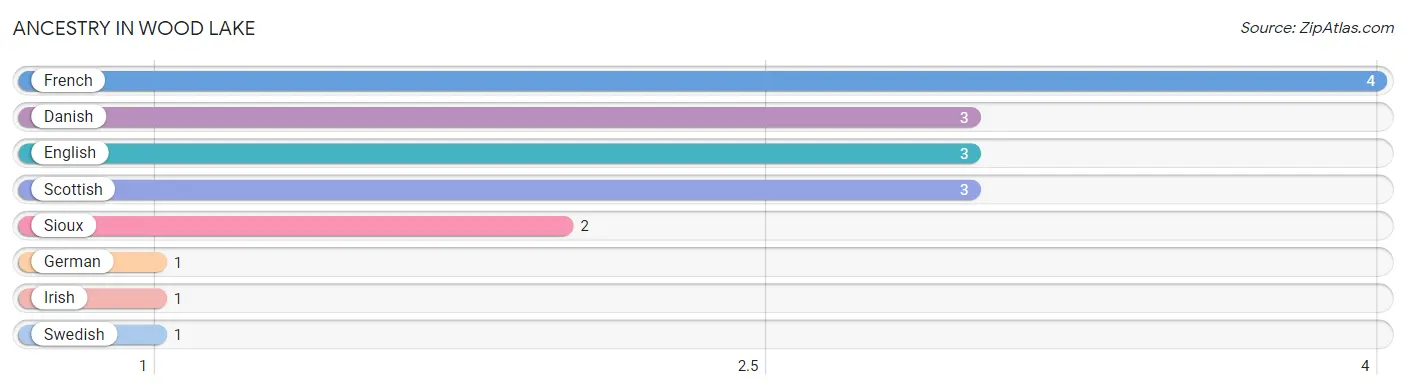
| Ancestry | # Population | % Population |
| Danish | 3 | 13.0% |
| English | 3 | 13.0% |
| French | 4 | 17.4% |
| German | 1 | 4.3% |
| Irish | 1 | 4.3% |
| Scottish | 3 | 13.0% |
| Sioux | 2 | 8.7% |
| Swedish | 1 | 4.3% | View All 8 Rows |
Immigrants in Wood Lake

| Immigration Origin | # Population | % Population | View All 0 Rows |
Sex and Age in Wood Lake
Sex and Age in Wood Lake
The most populous age groups in Wood Lake are 70 to 74 Years (5 | 45.5%) for men and 70 to 74 Years (5 | 41.7%) for women.
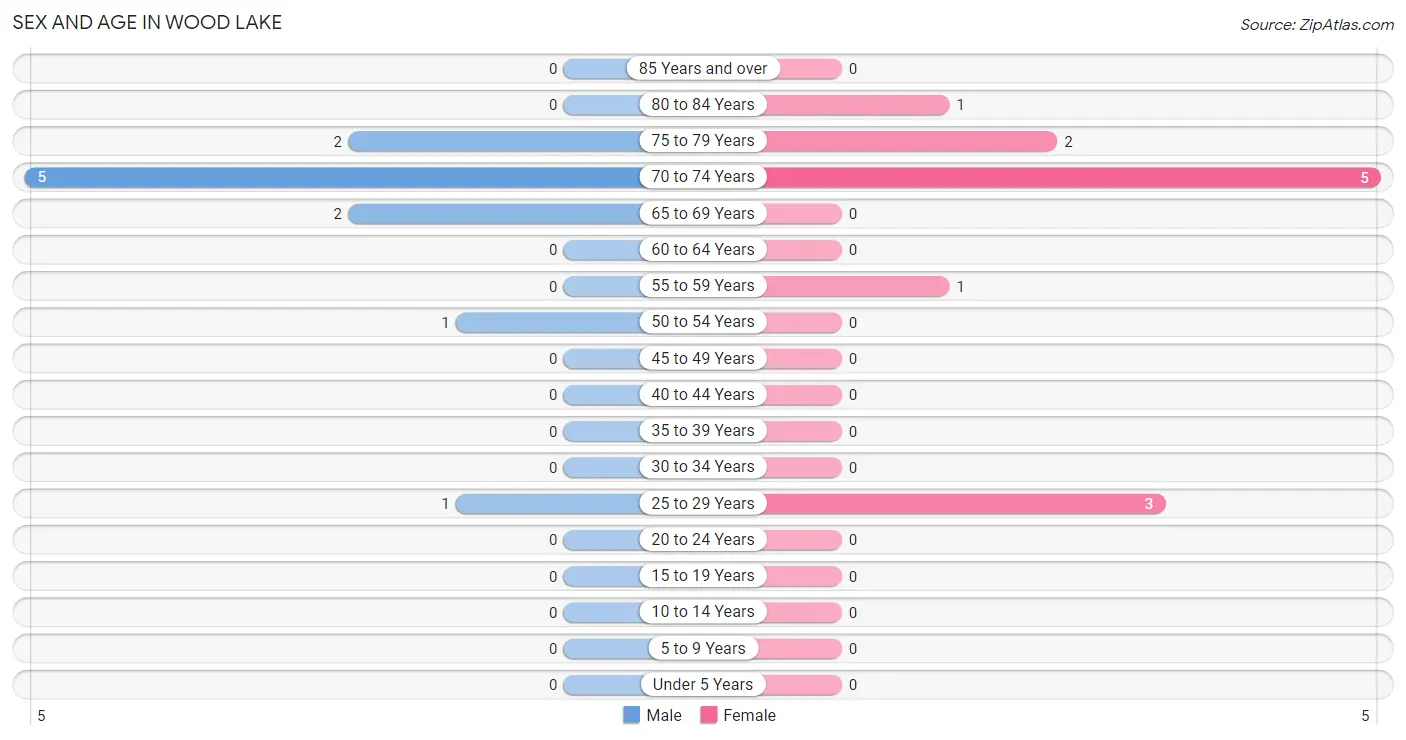
| Age Bracket | Male | Female |
| Under 5 Years | 0 (0.0%) | 0 (0.0%) |
| 5 to 9 Years | 0 (0.0%) | 0 (0.0%) |
| 10 to 14 Years | 0 (0.0%) | 0 (0.0%) |
| 15 to 19 Years | 0 (0.0%) | 0 (0.0%) |
| 20 to 24 Years | 0 (0.0%) | 0 (0.0%) |
| 25 to 29 Years | 1 (9.1%) | 3 (25.0%) |
| 30 to 34 Years | 0 (0.0%) | 0 (0.0%) |
| 35 to 39 Years | 0 (0.0%) | 0 (0.0%) |
| 40 to 44 Years | 0 (0.0%) | 0 (0.0%) |
| 45 to 49 Years | 0 (0.0%) | 0 (0.0%) |
| 50 to 54 Years | 1 (9.1%) | 0 (0.0%) |
| 55 to 59 Years | 0 (0.0%) | 1 (8.3%) |
| 60 to 64 Years | 0 (0.0%) | 0 (0.0%) |
| 65 to 69 Years | 2 (18.2%) | 0 (0.0%) |
| 70 to 74 Years | 5 (45.5%) | 5 (41.7%) |
| 75 to 79 Years | 2 (18.2%) | 2 (16.7%) |
| 80 to 84 Years | 0 (0.0%) | 1 (8.3%) |
| 85 Years and over | 0 (0.0%) | 0 (0.0%) |
| Total | 11 (100.0%) | 12 (100.0%) |
Families and Households in Wood Lake
Median Family Size in Wood Lake
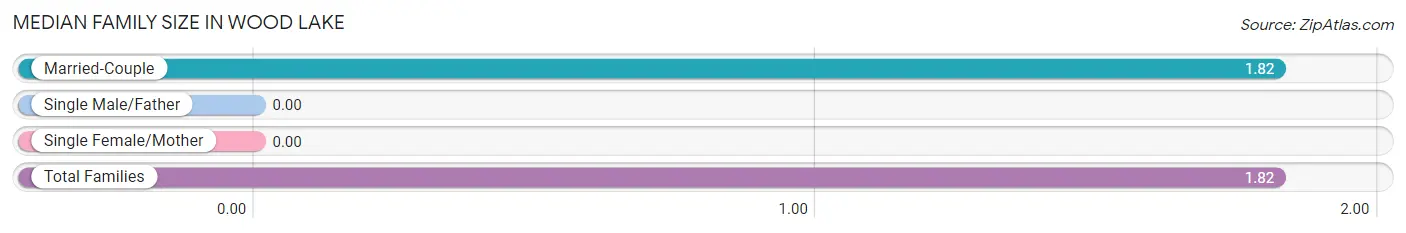
| Family Type | # Families | Family Size |
| Married-Couple | 11 (100.0%) | 1.82 |
| Single Male/Father | 0 (0.0%) | - |
| Single Female/Mother | 0 (0.0%) | - |
| Total Families | 11 (100.0%) | 1.82 |
Median Household Size in Wood Lake
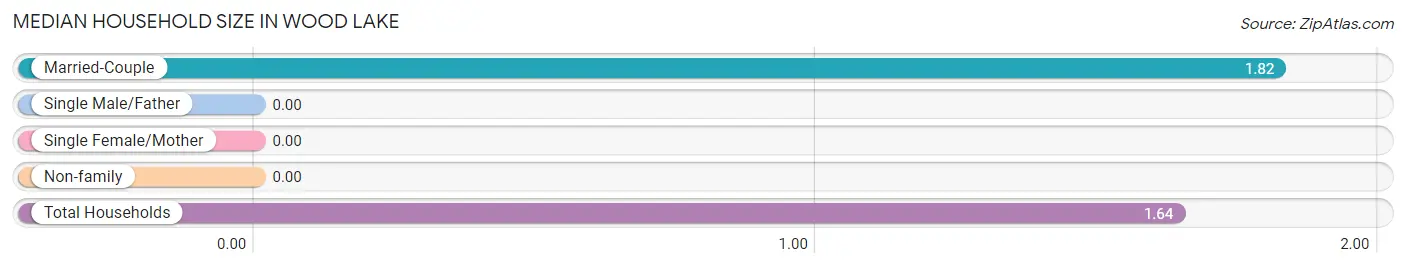
| Household Type | # Households | Household Size |
| Married-Couple | 11 (78.6%) | 1.82 |
| Single Male/Father | 0 (0.0%) | - |
| Single Female/Mother | 0 (0.0%) | - |
| Non-family | 3 (21.4%) | - |
| Total Households | 14 (100.0%) | 1.64 |
Household Size by Marriage Status in Wood Lake
Out of a total of 14 households in Wood Lake, 11 (78.6%) are family households, while 3 (21.4%) are nonfamily households. The most numerous type of family households are 2-person households, comprising 11, and the most common type of nonfamily households are 1-person households, comprising 3.
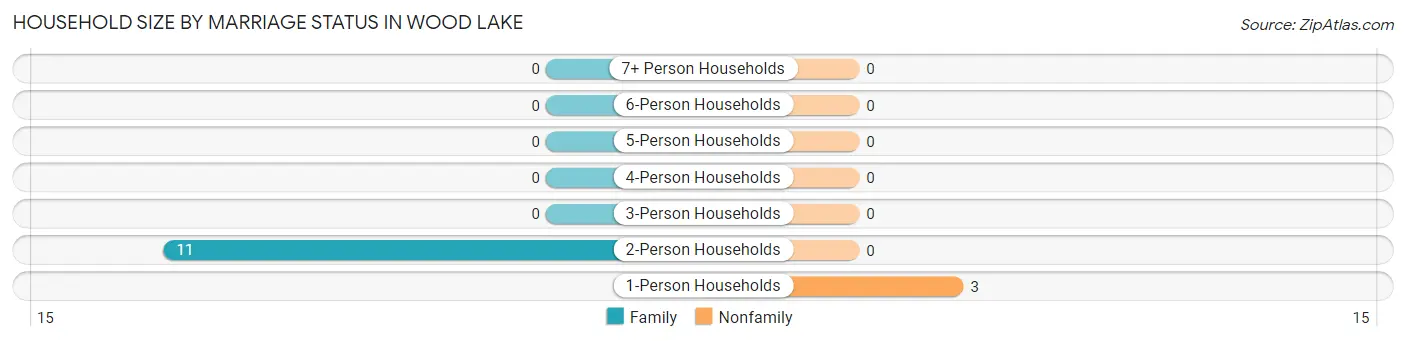
| Household Size | Family Households | Nonfamily Households |
| 1-Person Households | - | 3 (21.4%) |
| 2-Person Households | 11 (78.6%) | 0 (0.0%) |
| 3-Person Households | 0 (0.0%) | 0 (0.0%) |
| 4-Person Households | 0 (0.0%) | 0 (0.0%) |
| 5-Person Households | 0 (0.0%) | 0 (0.0%) |
| 6-Person Households | 0 (0.0%) | 0 (0.0%) |
| 7+ Person Households | 0 (0.0%) | 0 (0.0%) |
| Total | 11 (78.6%) | 3 (21.4%) |
Female Fertility in Wood Lake
Fertility by Age in Wood Lake
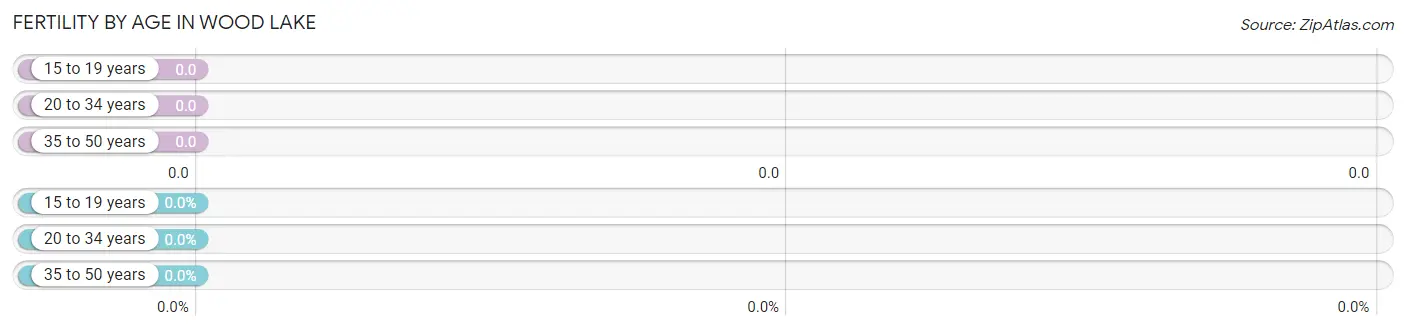
| Age Bracket | Women with Births | Births / 1,000 Women |
| 15 to 19 years | 0 (0.0%) | 0.0 |
| 20 to 34 years | 0 (0.0%) | 0.0 |
| 35 to 50 years | 0 (0.0%) | 0.0 |
| Total | 0 (0.0%) | 0.0 |
Fertility by Age by Marriage Status in Wood Lake
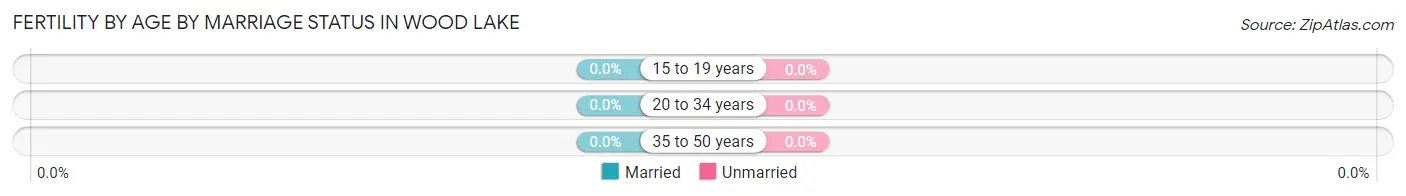
| Age Bracket | Married | Unmarried |
| 15 to 19 years | 0 (0.0%) | 0 (0.0%) |
| 20 to 34 years | 0 (0.0%) | 0 (0.0%) |
| 35 to 50 years | 0 (0.0%) | 0 (0.0%) |
| Total | 0 (0.0%) | 0 (0.0%) |
Fertility by Education in Wood Lake
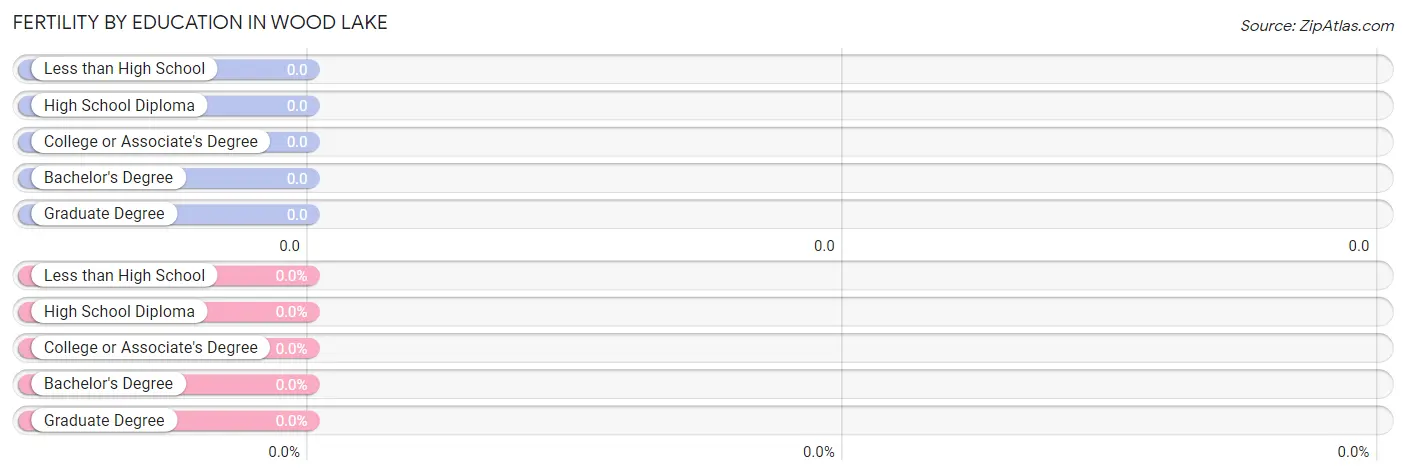
| Educational Attainment | Women with Births | Births / 1,000 Women |
| Less than High School | 0 (0.0%) | 0.0 |
| High School Diploma | 0 (0.0%) | 0.0 |
| College or Associate's Degree | 0 (0.0%) | 0.0 |
| Bachelor's Degree | 0 (0.0%) | 0.0 |
| Graduate Degree | 0 (0.0%) | 0.0 |
| Total | 0 (0.0%) | 0.0 |
Fertility by Education by Marriage Status in Wood Lake
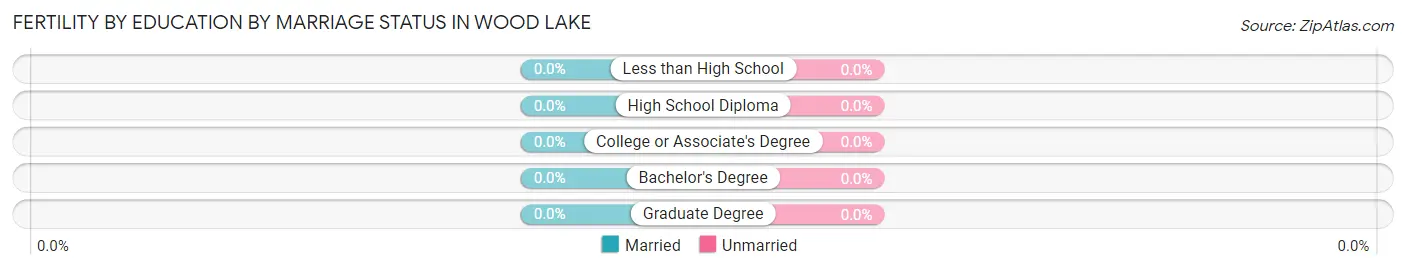
| Educational Attainment | Married | Unmarried |
| Less than High School | 0 (0.0%) | 0 (0.0%) |
| High School Diploma | 0 (0.0%) | 0 (0.0%) |
| College or Associate's Degree | 0 (0.0%) | 0 (0.0%) |
| Bachelor's Degree | 0 (0.0%) | 0 (0.0%) |
| Graduate Degree | 0 (0.0%) | 0 (0.0%) |
| Total | 0 (0.0%) | 0 (0.0%) |
Employment Characteristics in Wood Lake
Employment by Class of Employer in Wood Lake
Among the 9 employed individuals in Wood Lake, private company employees (3 | 33.3%), state government employees (3 | 33.3%), and not-for-profit organizations (2 | 22.2%) make up the most common classes of employment.
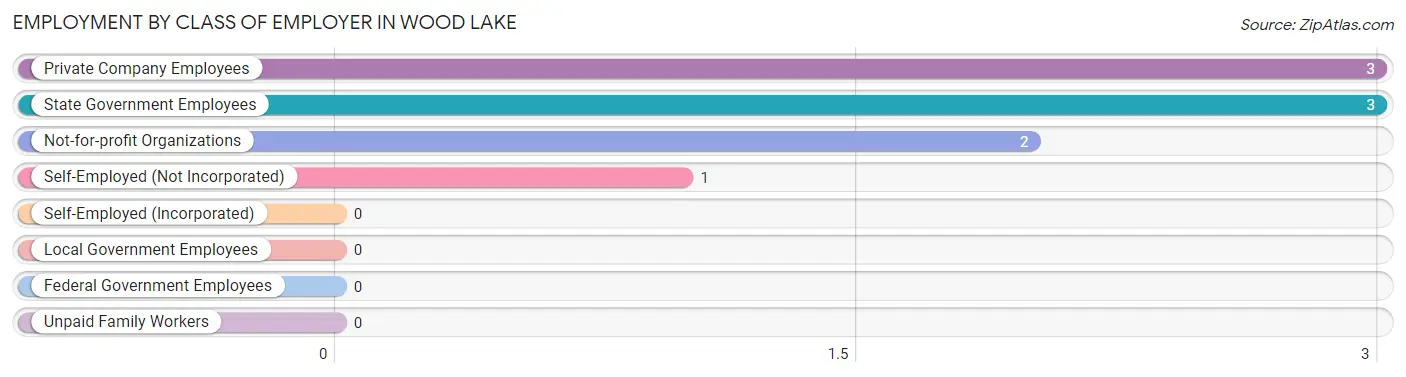
| Employer Class | # Employees | % Employees |
| Private Company Employees | 3 | 33.3% |
| Self-Employed (Incorporated) | 0 | 0.0% |
| Self-Employed (Not Incorporated) | 1 | 11.1% |
| Not-for-profit Organizations | 2 | 22.2% |
| Local Government Employees | 0 | 0.0% |
| State Government Employees | 3 | 33.3% |
| Federal Government Employees | 0 | 0.0% |
| Unpaid Family Workers | 0 | 0.0% |
| Total | 9 | 100.0% |
Employment Status by Age in Wood Lake
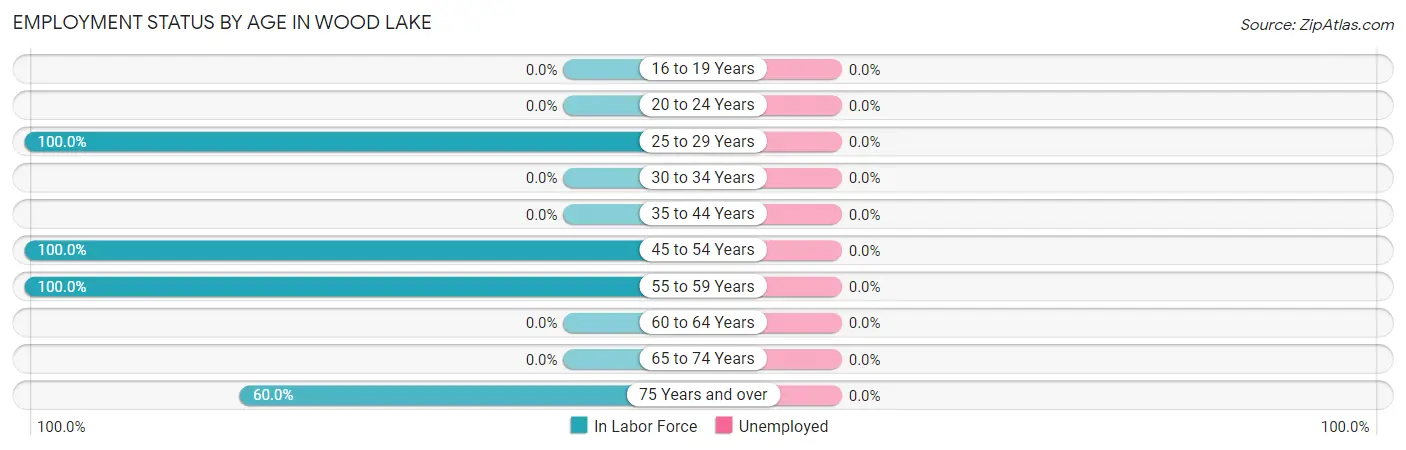
| Age Bracket | In Labor Force | Unemployed |
| 16 to 19 Years | 0 (0.0%) | 0 (0.0%) |
| 20 to 24 Years | 0 (0.0%) | 0 (0.0%) |
| 25 to 29 Years | 4 (100.0%) | 0 (0.0%) |
| 30 to 34 Years | 0 (0.0%) | 0 (0.0%) |
| 35 to 44 Years | 0 (0.0%) | 0 (0.0%) |
| 45 to 54 Years | 1 (100.0%) | 0 (0.0%) |
| 55 to 59 Years | 1 (100.0%) | 0 (0.0%) |
| 60 to 64 Years | 0 (0.0%) | 0 (0.0%) |
| 65 to 74 Years | 0 (0.0%) | 0 (0.0%) |
| 75 Years and over | 3 (60.0%) | 0 (0.0%) |
| Total | 9 (39.1%) | 0 (0.0%) |
Employment Status by Educational Attainment in Wood Lake
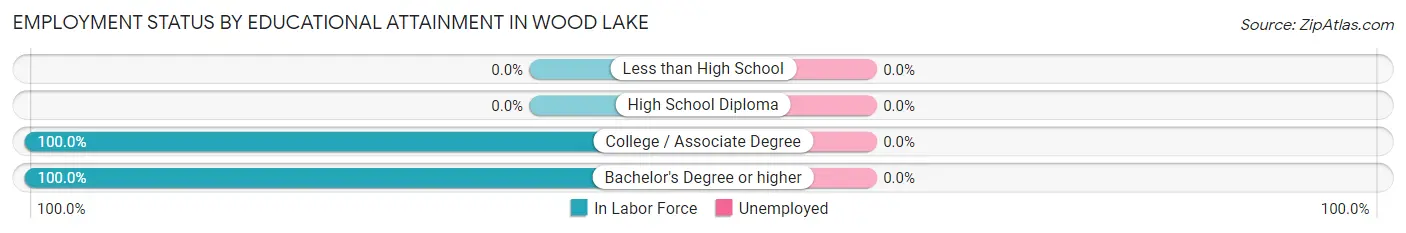
| Educational Attainment | In Labor Force | Unemployed |
| Less than High School | 0 (0.0%) | 0 (0.0%) |
| High School Diploma | 0 (0.0%) | 0 (0.0%) |
| College / Associate Degree | 2 (100.0%) | 0 (0.0%) |
| Bachelor's Degree or higher | 4 (100.0%) | 0 (0.0%) |
| Total | 6 (100.0%) | 0 (0.0%) |
Employment Occupations by Sex in Wood Lake
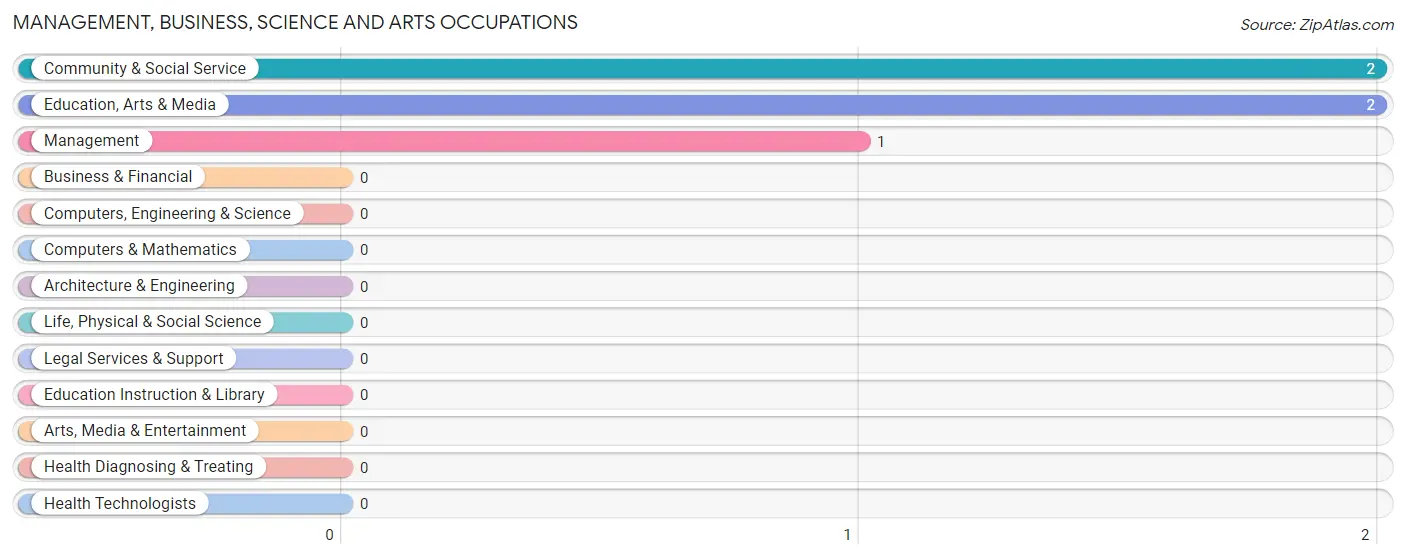
Management, Business, Science and Arts Occupations
The most common Management, Business, Science and Arts occupations in Wood Lake are Community & Social Service (2 | 22.2%), Education, Arts & Media (2 | 22.2%), and Management (1 | 11.1%).
Management, Business, Science and Arts Occupations by Sex
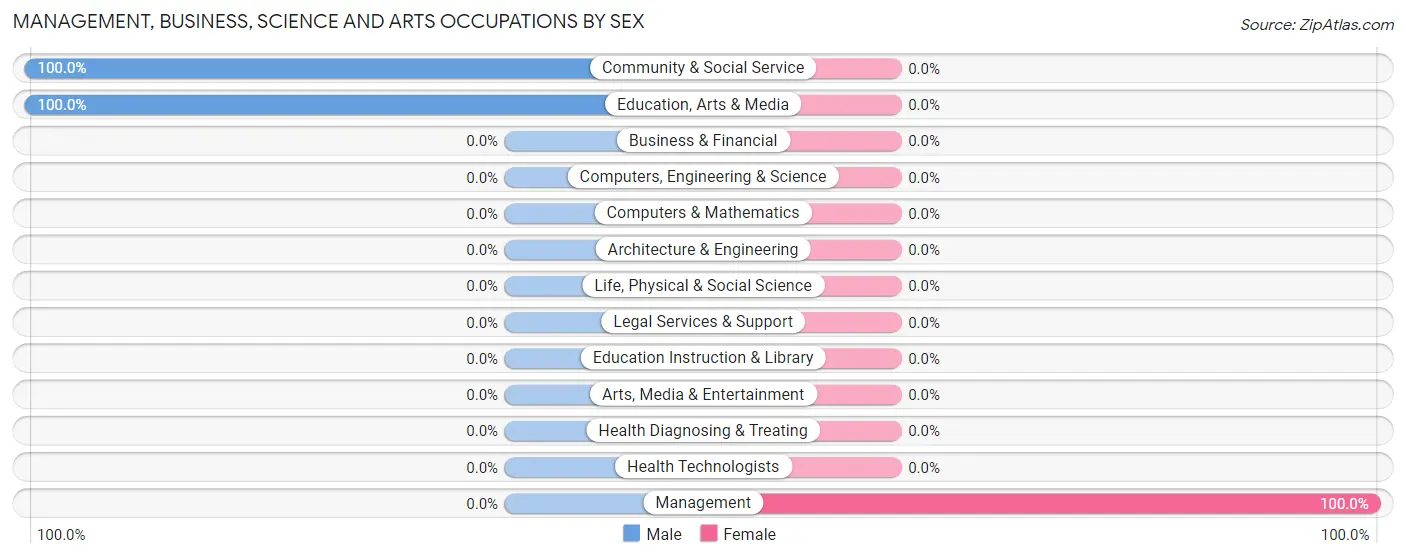
| Occupation | Male | Female |
| Management | 0 (0.0%) | 1 (100.0%) |
| Business & Financial | 0 (0.0%) | 0 (0.0%) |
| Computers, Engineering & Science | 0 (0.0%) | 0 (0.0%) |
| Computers & Mathematics | 0 (0.0%) | 0 (0.0%) |
| Architecture & Engineering | 0 (0.0%) | 0 (0.0%) |
| Life, Physical & Social Science | 0 (0.0%) | 0 (0.0%) |
| Community & Social Service | 2 (100.0%) | 0 (0.0%) |
| Education, Arts & Media | 2 (100.0%) | 0 (0.0%) |
| Legal Services & Support | 0 (0.0%) | 0 (0.0%) |
| Education Instruction & Library | 0 (0.0%) | 0 (0.0%) |
| Arts, Media & Entertainment | 0 (0.0%) | 0 (0.0%) |
| Health Diagnosing & Treating | 0 (0.0%) | 0 (0.0%) |
| Health Technologists | 0 (0.0%) | 0 (0.0%) |
| Total (Category) | 2 (66.7%) | 1 (33.3%) |
| Total (Overall) | 4 (44.4%) | 5 (55.6%) |
Services Occupations
Services Occupations by Sex
| Occupation | Male | Female |
| Healthcare Support | 0 (0.0%) | 0 (0.0%) |
| Security & Protection | 0 (0.0%) | 0 (0.0%) |
| Firefighting & Prevention | 0 (0.0%) | 0 (0.0%) |
| Law Enforcement | 0 (0.0%) | 0 (0.0%) |
| Food Preparation & Serving | 0 (0.0%) | 0 (0.0%) |
| Cleaning & Maintenance | 0 (0.0%) | 0 (0.0%) |
| Personal Care & Service | 0 (0.0%) | 0 (0.0%) |
| Total (Category) | 0 (0.0%) | 0 (0.0%) |
| Total (Overall) | 4 (44.4%) | 5 (55.6%) |
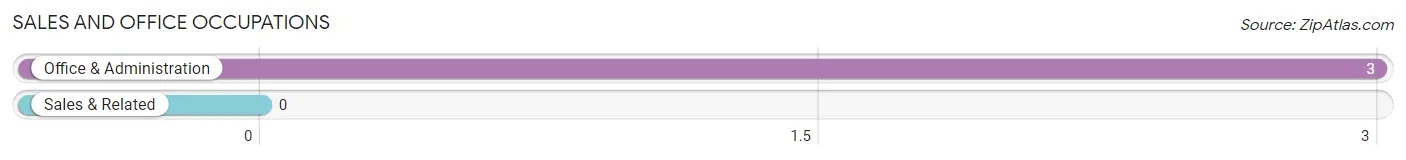
Sales and Office Occupations
The most common Sales and Office occupations in Wood Lake are , and Office & Administration (3 | 33.3%).
Sales and Office Occupations by Sex
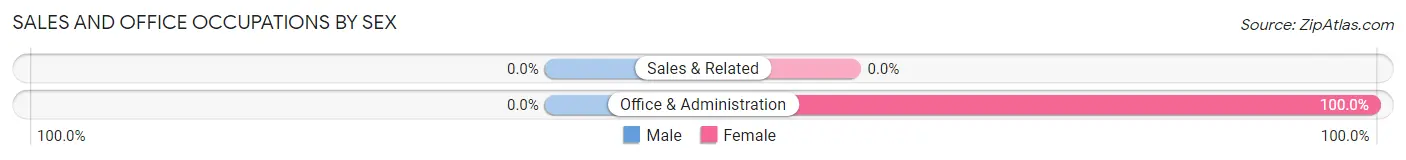
| Occupation | Male | Female |
| Sales & Related | 0 (0.0%) | 0 (0.0%) |
| Office & Administration | 0 (0.0%) | 3 (100.0%) |
| Total (Category) | 0 (0.0%) | 3 (100.0%) |
| Total (Overall) | 4 (44.4%) | 5 (55.6%) |
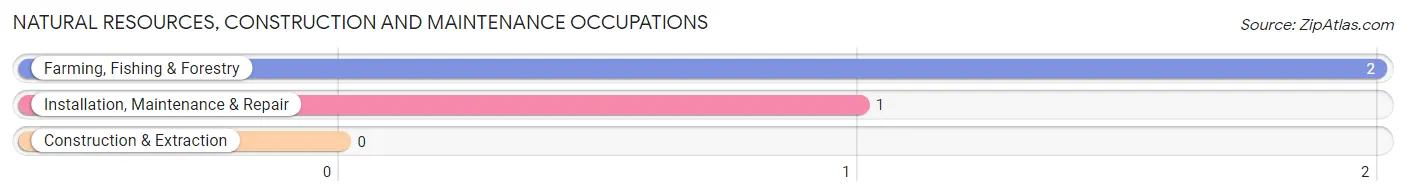
Natural Resources, Construction and Maintenance Occupations
The most common Natural Resources, Construction and Maintenance occupations in Wood Lake are Farming, Fishing & Forestry (2 | 22.2%), and Installation, Maintenance & Repair (1 | 11.1%).
Natural Resources, Construction and Maintenance Occupations by Sex
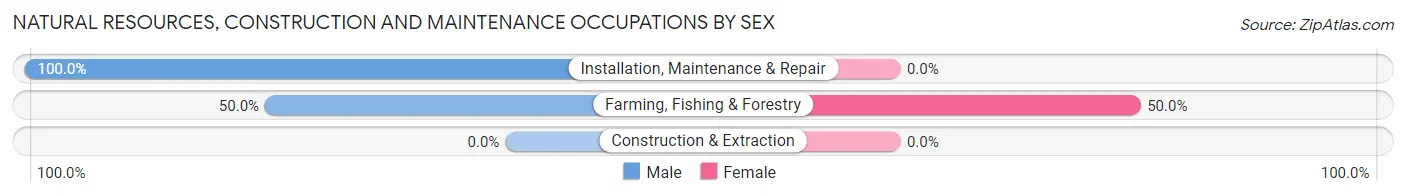
| Occupation | Male | Female |
| Farming, Fishing & Forestry | 1 (50.0%) | 1 (50.0%) |
| Construction & Extraction | 0 (0.0%) | 0 (0.0%) |
| Installation, Maintenance & Repair | 1 (100.0%) | 0 (0.0%) |
| Total (Category) | 2 (66.7%) | 1 (33.3%) |
| Total (Overall) | 4 (44.4%) | 5 (55.6%) |
Production, Transportation and Moving Occupations
Production, Transportation and Moving Occupations by Sex
| Occupation | Male | Female |
| Production | 0 (0.0%) | 0 (0.0%) |
| Transportation | 0 (0.0%) | 0 (0.0%) |
| Material Moving | 0 (0.0%) | 0 (0.0%) |
| Total (Category) | 0 (0.0%) | 0 (0.0%) |
| Total (Overall) | 4 (44.4%) | 5 (55.6%) |
Employment Industries by Sex in Wood Lake
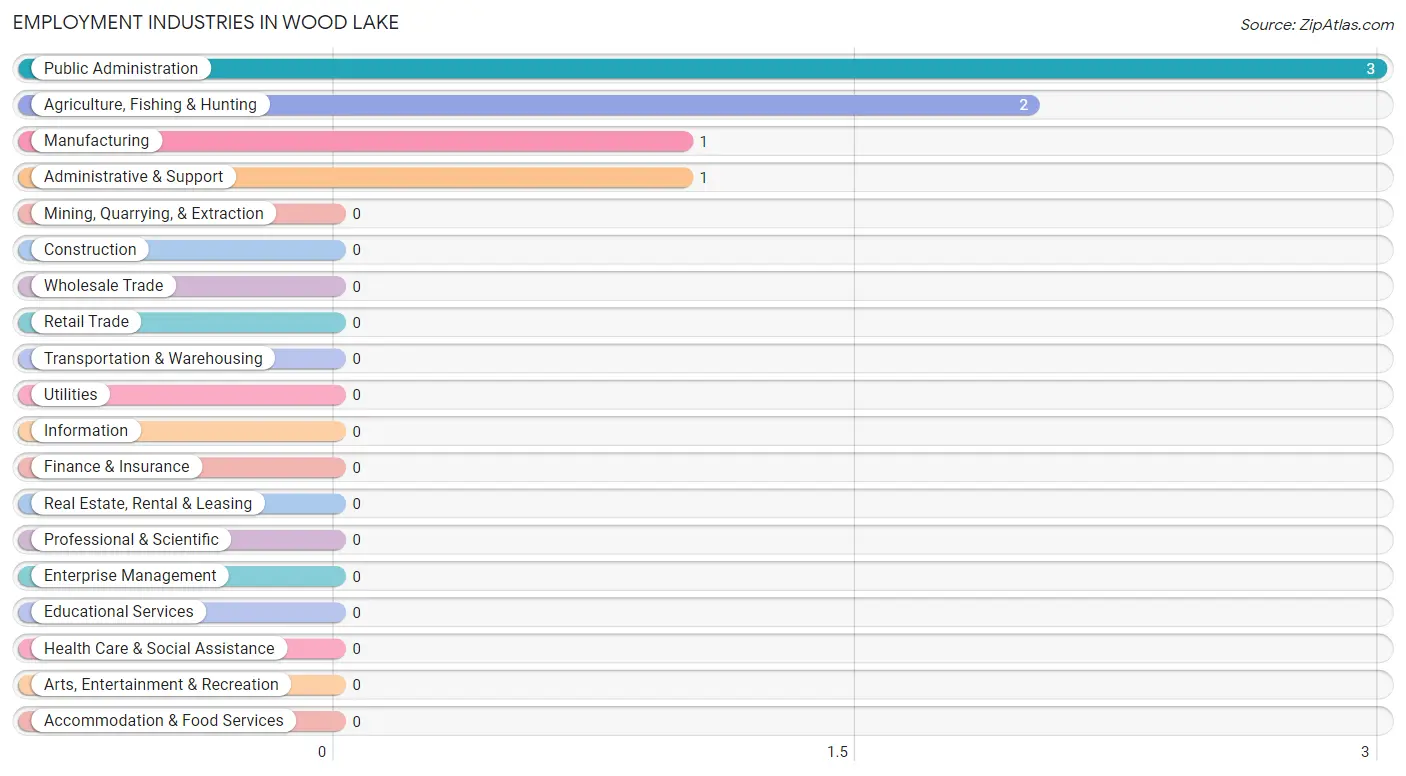
Employment Industries in Wood Lake
The major employment industries in Wood Lake include Public Administration (3 | 33.3%), Agriculture, Fishing & Hunting (2 | 22.2%), Manufacturing (1 | 11.1%), and Administrative & Support (1 | 11.1%).
Employment Industries by Sex in Wood Lake
The Wood Lake industries that see more men than women are Manufacturing (100.0%), and Agriculture, Fishing & Hunting (50.0%), whereas the industries that tend to have a higher number of women are Administrative & Support (100.0%), Public Administration (100.0%), and Agriculture, Fishing & Hunting (50.0%).
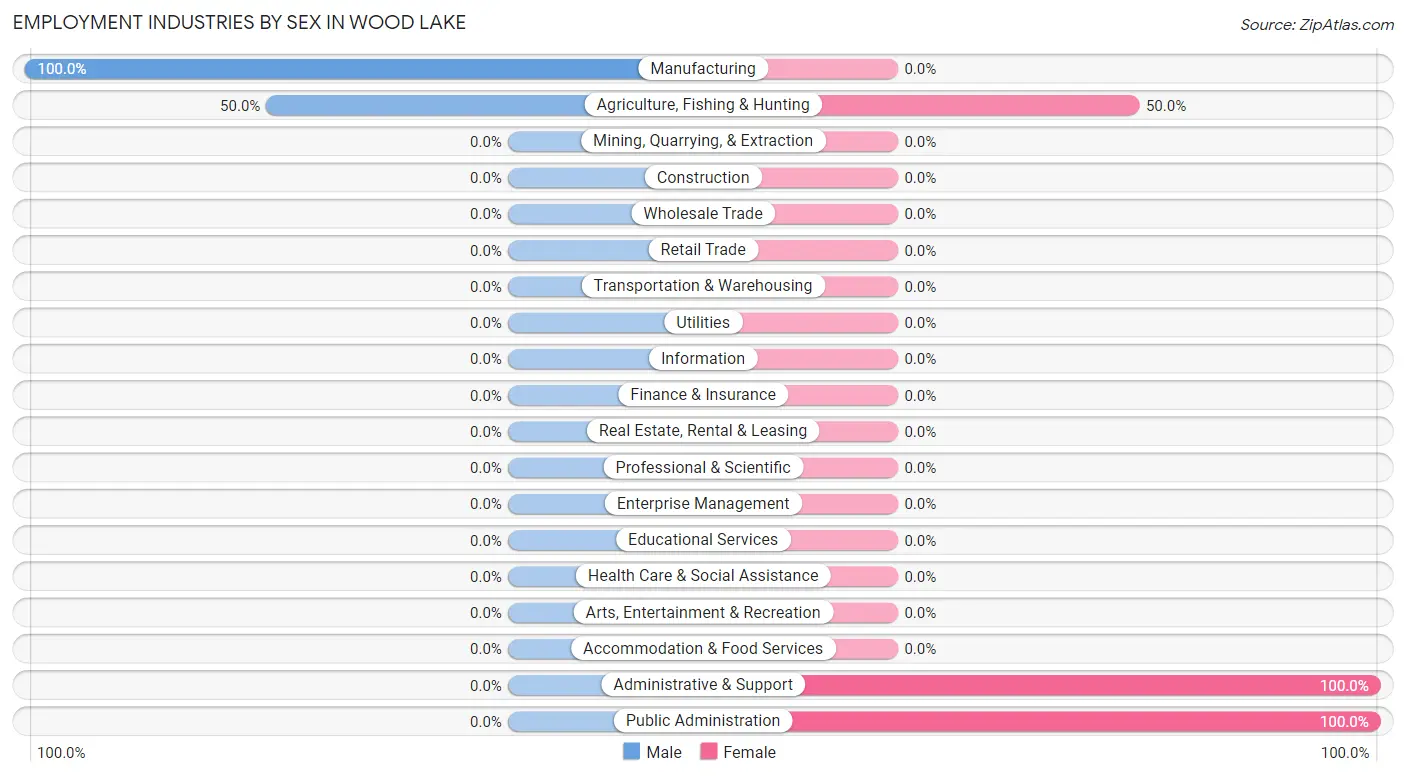
| Industry | Male | Female |
| Agriculture, Fishing & Hunting | 1 (50.0%) | 1 (50.0%) |
| Mining, Quarrying, & Extraction | 0 (0.0%) | 0 (0.0%) |
| Construction | 0 (0.0%) | 0 (0.0%) |
| Manufacturing | 1 (100.0%) | 0 (0.0%) |
| Wholesale Trade | 0 (0.0%) | 0 (0.0%) |
| Retail Trade | 0 (0.0%) | 0 (0.0%) |
| Transportation & Warehousing | 0 (0.0%) | 0 (0.0%) |
| Utilities | 0 (0.0%) | 0 (0.0%) |
| Information | 0 (0.0%) | 0 (0.0%) |
| Finance & Insurance | 0 (0.0%) | 0 (0.0%) |
| Real Estate, Rental & Leasing | 0 (0.0%) | 0 (0.0%) |
| Professional & Scientific | 0 (0.0%) | 0 (0.0%) |
| Enterprise Management | 0 (0.0%) | 0 (0.0%) |
| Administrative & Support | 0 (0.0%) | 1 (100.0%) |
| Educational Services | 0 (0.0%) | 0 (0.0%) |
| Health Care & Social Assistance | 0 (0.0%) | 0 (0.0%) |
| Arts, Entertainment & Recreation | 0 (0.0%) | 0 (0.0%) |
| Accommodation & Food Services | 0 (0.0%) | 0 (0.0%) |
| Public Administration | 0 (0.0%) | 3 (100.0%) |
| Total | 4 (44.4%) | 5 (55.6%) |
Education in Wood Lake
School Enrollment in Wood Lake
| School Level | # Students | % Students |
| Nursery / Preschool | 0 | 0.0% |
| Kindergarten | 0 | 0.0% |
| Elementary School | 0 | 0.0% |
| Middle School | 0 | 0.0% |
| High School | 0 | 0.0% |
| College / Undergraduate | 0 | 0.0% |
| Graduate / Professional | 0 | 0.0% |
| Total | 0 | 0.0% |
School Enrollment by Age by Funding Source in Wood Lake
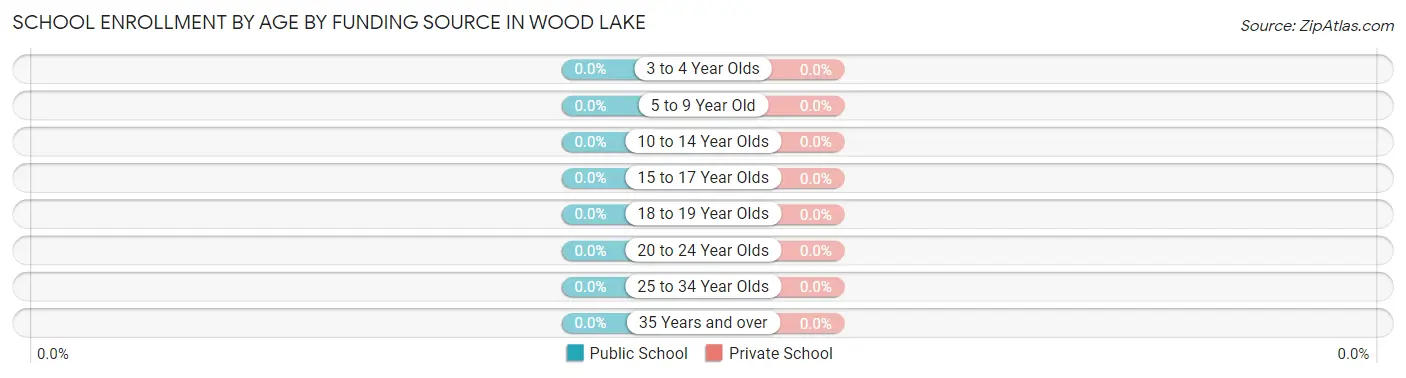
| Age Bracket | Public School | Private School |
| 3 to 4 Year Olds | 0 (0.0%) | 0 (0.0%) |
| 5 to 9 Year Old | 0 (0.0%) | 0 (0.0%) |
| 10 to 14 Year Olds | 0 (0.0%) | 0 (0.0%) |
| 15 to 17 Year Olds | 0 (0.0%) | 0 (0.0%) |
| 18 to 19 Year Olds | 0 (0.0%) | 0 (0.0%) |
| 20 to 24 Year Olds | 0 (0.0%) | 0 (0.0%) |
| 25 to 34 Year Olds | 0 (0.0%) | 0 (0.0%) |
| 35 Years and over | 0 (0.0%) | 0 (0.0%) |
| Total | 0 (0.0%) | 0 (0.0%) |
Educational Attainment by Field of Study in Wood Lake
Bio, nature & agricultural (3 | 37.5%), education (2 | 25.0%), liberal arts & history (2 | 25.0%), and business (1 | 12.5%) are the most common fields of study among 8 individuals in Wood Lake who have obtained a bachelor's degree or higher.
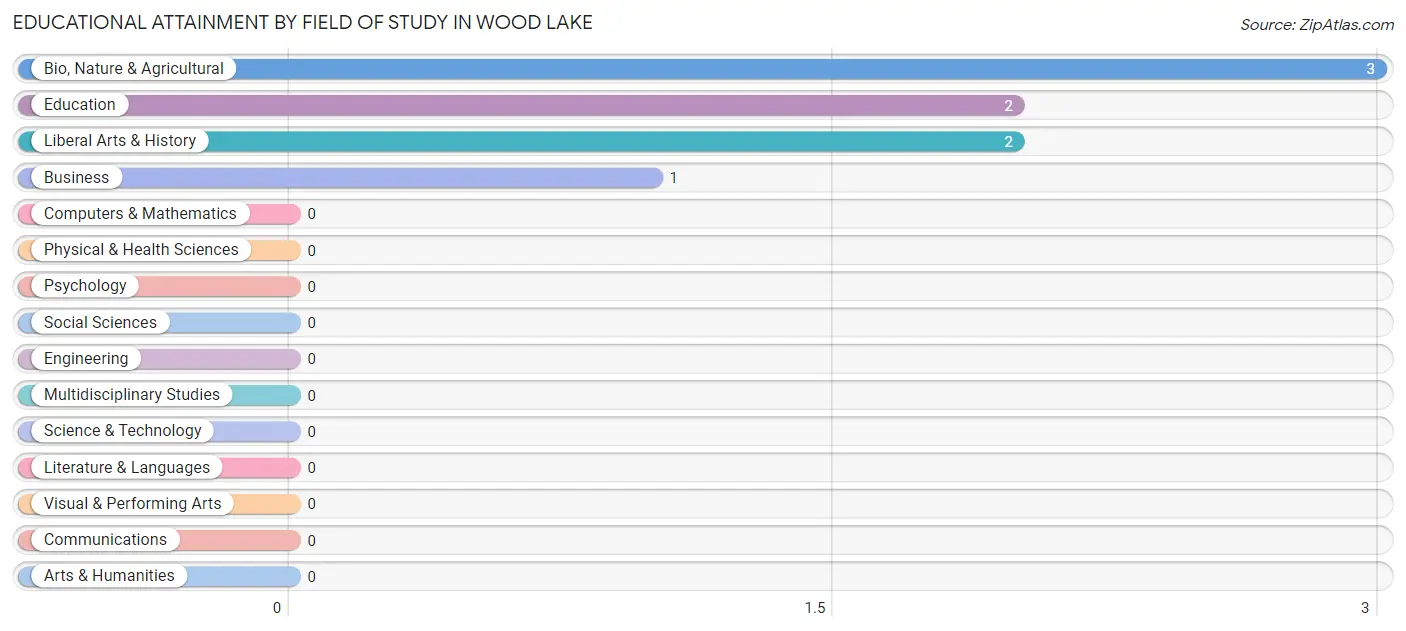
| Field of Study | # Graduates | % Graduates |
| Computers & Mathematics | 0 | 0.0% |
| Bio, Nature & Agricultural | 3 | 37.5% |
| Physical & Health Sciences | 0 | 0.0% |
| Psychology | 0 | 0.0% |
| Social Sciences | 0 | 0.0% |
| Engineering | 0 | 0.0% |
| Multidisciplinary Studies | 0 | 0.0% |
| Science & Technology | 0 | 0.0% |
| Business | 1 | 12.5% |
| Education | 2 | 25.0% |
| Literature & Languages | 0 | 0.0% |
| Liberal Arts & History | 2 | 25.0% |
| Visual & Performing Arts | 0 | 0.0% |
| Communications | 0 | 0.0% |
| Arts & Humanities | 0 | 0.0% |
| Total | 8 | 100.0% |
Transportation & Commute in Wood Lake
Vehicle Availability by Sex in Wood Lake
The most prevalent vehicle ownership categories in Wood Lake are males with 3 vehicles (3, accounting for 75.0%) and females with 3 vehicles (1, making up 60.0%).
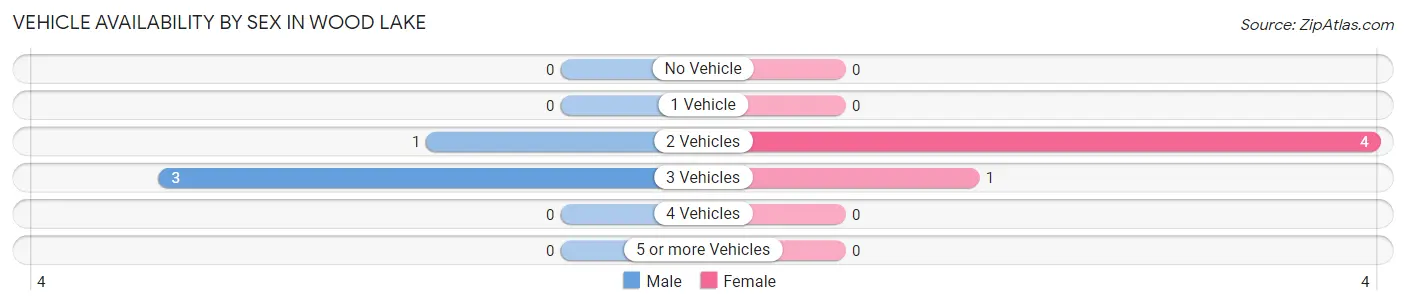
| Vehicles Available | Male | Female |
| No Vehicle | 0 (0.0%) | 0 (0.0%) |
| 1 Vehicle | 0 (0.0%) | 0 (0.0%) |
| 2 Vehicles | 1 (25.0%) | 4 (80.0%) |
| 3 Vehicles | 3 (75.0%) | 1 (20.0%) |
| 4 Vehicles | 0 (0.0%) | 0 (0.0%) |
| 5 or more Vehicles | 0 (0.0%) | 0 (0.0%) |
| Total | 4 (100.0%) | 5 (100.0%) |
Commute Time in Wood Lake
The most frequently occuring commute durations in Wood Lake are 20 to 24 minutes (4 commuters, 44.4%), less than 5 minutes (2 commuters, 22.2%), and 25 to 29 minutes (1 commuters, 11.1%).
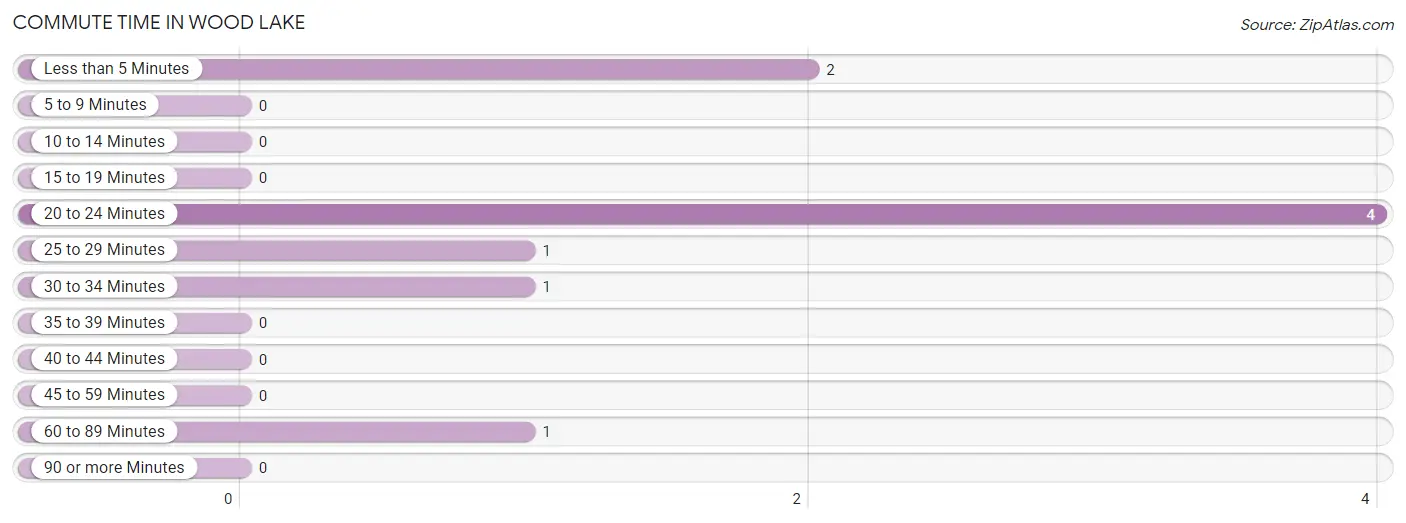
| Commute Time | # Commuters | % Commuters |
| Less than 5 Minutes | 2 | 22.2% |
| 5 to 9 Minutes | 0 | 0.0% |
| 10 to 14 Minutes | 0 | 0.0% |
| 15 to 19 Minutes | 0 | 0.0% |
| 20 to 24 Minutes | 4 | 44.4% |
| 25 to 29 Minutes | 1 | 11.1% |
| 30 to 34 Minutes | 1 | 11.1% |
| 35 to 39 Minutes | 0 | 0.0% |
| 40 to 44 Minutes | 0 | 0.0% |
| 45 to 59 Minutes | 0 | 0.0% |
| 60 to 89 Minutes | 1 | 11.1% |
| 90 or more Minutes | 0 | 0.0% |
Commute Time by Sex in Wood Lake
The most common commute times in Wood Lake are less than 5 minutes (2 commuters, 50.0%) for males and 20 to 24 minutes (3 commuters, 60.0%) for females.
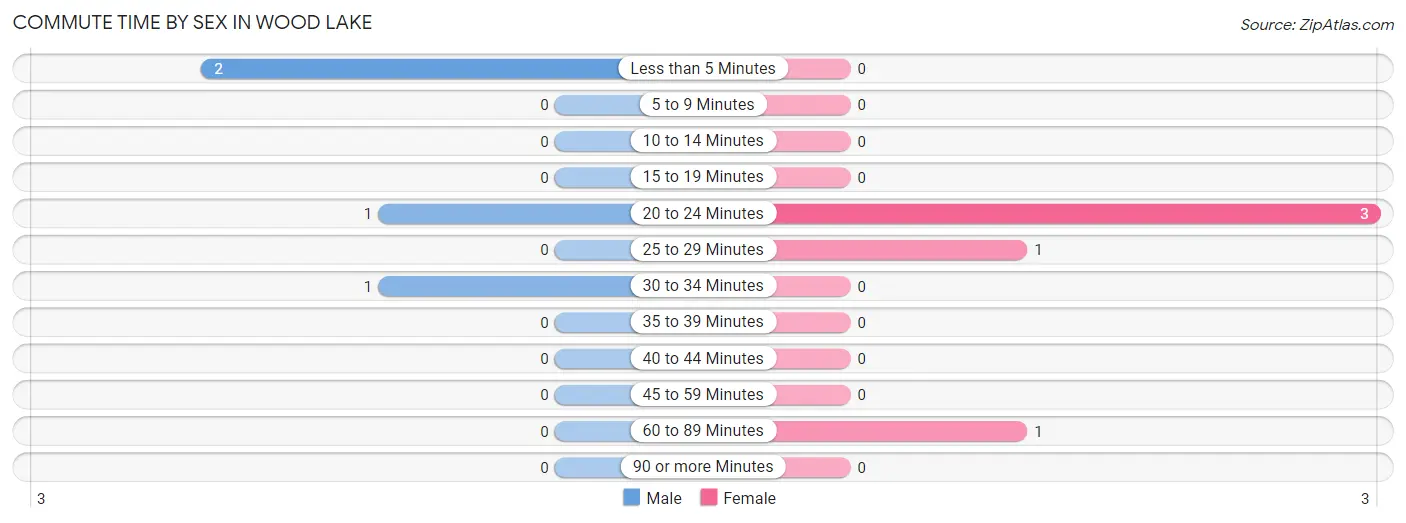
| Commute Time | Male | Female |
| Less than 5 Minutes | 2 (50.0%) | 0 (0.0%) |
| 5 to 9 Minutes | 0 (0.0%) | 0 (0.0%) |
| 10 to 14 Minutes | 0 (0.0%) | 0 (0.0%) |
| 15 to 19 Minutes | 0 (0.0%) | 0 (0.0%) |
| 20 to 24 Minutes | 1 (25.0%) | 3 (60.0%) |
| 25 to 29 Minutes | 0 (0.0%) | 1 (20.0%) |
| 30 to 34 Minutes | 1 (25.0%) | 0 (0.0%) |
| 35 to 39 Minutes | 0 (0.0%) | 0 (0.0%) |
| 40 to 44 Minutes | 0 (0.0%) | 0 (0.0%) |
| 45 to 59 Minutes | 0 (0.0%) | 0 (0.0%) |
| 60 to 89 Minutes | 0 (0.0%) | 1 (20.0%) |
| 90 or more Minutes | 0 (0.0%) | 0 (0.0%) |
Time of Departure to Work by Sex in Wood Lake
The most frequent times of departure to work in Wood Lake are 9:00 AM to 9:59 AM (3, 75.0%) for males and 7:30 AM to 7:59 AM (3, 60.0%) for females.
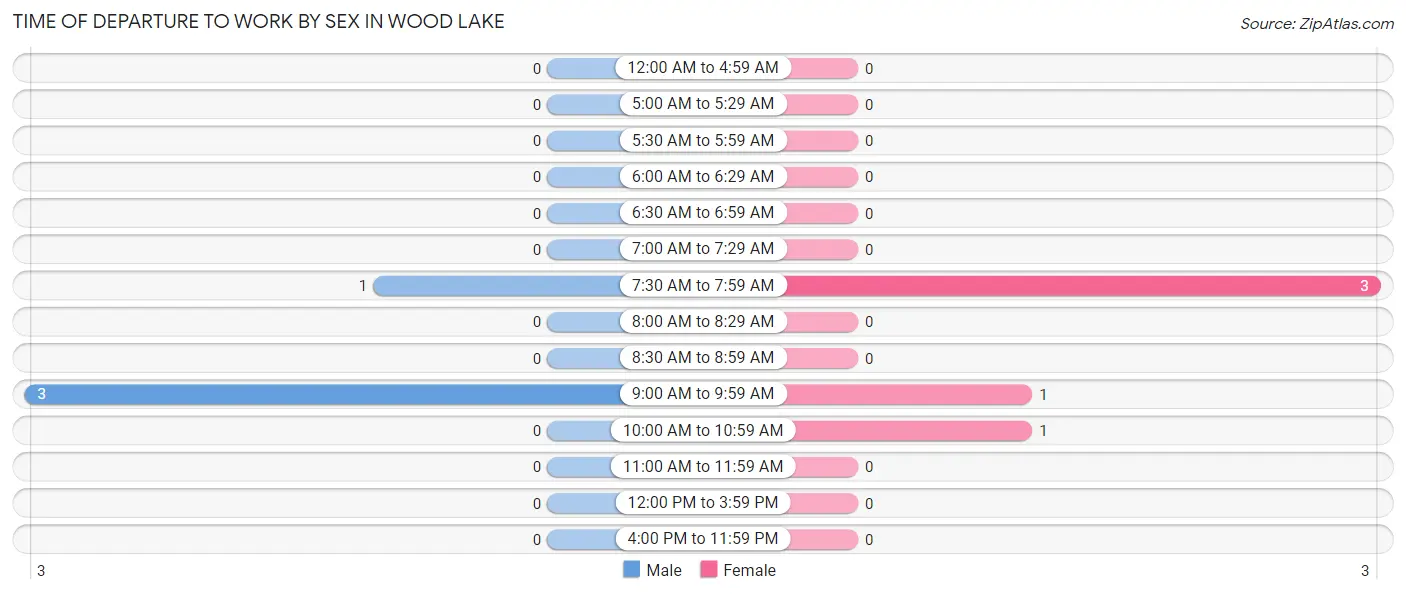
| Time of Departure | Male | Female |
| 12:00 AM to 4:59 AM | 0 (0.0%) | 0 (0.0%) |
| 5:00 AM to 5:29 AM | 0 (0.0%) | 0 (0.0%) |
| 5:30 AM to 5:59 AM | 0 (0.0%) | 0 (0.0%) |
| 6:00 AM to 6:29 AM | 0 (0.0%) | 0 (0.0%) |
| 6:30 AM to 6:59 AM | 0 (0.0%) | 0 (0.0%) |
| 7:00 AM to 7:29 AM | 0 (0.0%) | 0 (0.0%) |
| 7:30 AM to 7:59 AM | 1 (25.0%) | 3 (60.0%) |
| 8:00 AM to 8:29 AM | 0 (0.0%) | 0 (0.0%) |
| 8:30 AM to 8:59 AM | 0 (0.0%) | 0 (0.0%) |
| 9:00 AM to 9:59 AM | 3 (75.0%) | 1 (20.0%) |
| 10:00 AM to 10:59 AM | 0 (0.0%) | 1 (20.0%) |
| 11:00 AM to 11:59 AM | 0 (0.0%) | 0 (0.0%) |
| 12:00 PM to 3:59 PM | 0 (0.0%) | 0 (0.0%) |
| 4:00 PM to 11:59 PM | 0 (0.0%) | 0 (0.0%) |
| Total | 4 (100.0%) | 5 (100.0%) |
Housing Occupancy in Wood Lake
Occupancy by Ownership in Wood Lake
Of the total 14 dwellings in Wood Lake, owner-occupied units account for 11 (78.6%), while renter-occupied units make up 3 (21.4%).
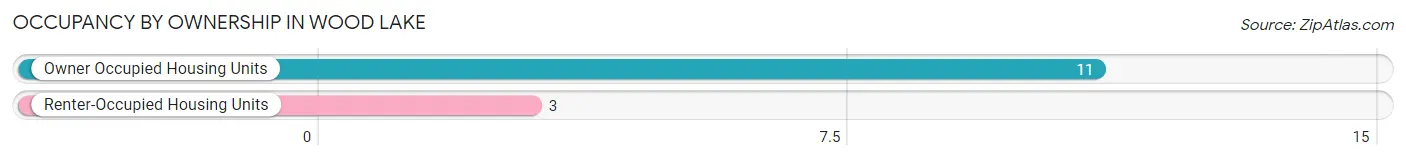
| Occupancy | # Housing Units | % Housing Units |
| Owner Occupied Housing Units | 11 | 78.6% |
| Renter-Occupied Housing Units | 3 | 21.4% |
| Total Occupied Housing Units | 14 | 100.0% |
Occupancy by Household Size in Wood Lake
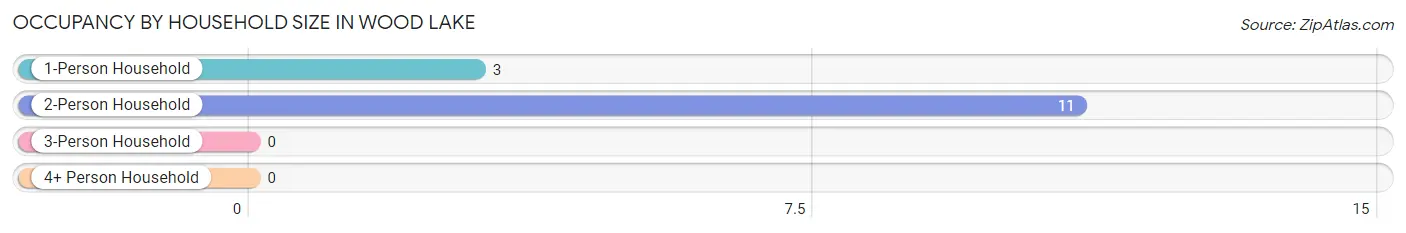
| Household Size | # Housing Units | % Housing Units |
| 1-Person Household | 3 | 21.4% |
| 2-Person Household | 11 | 78.6% |
| 3-Person Household | 0 | 0.0% |
| 4+ Person Household | 0 | 0.0% |
| Total Housing Units | 14 | 100.0% |
Occupancy by Ownership by Household Size in Wood Lake
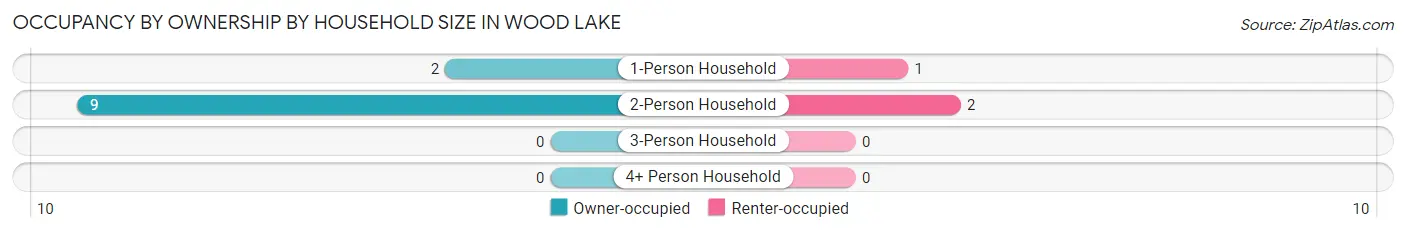
| Household Size | Owner-occupied | Renter-occupied |
| 1-Person Household | 2 (66.7%) | 1 (33.3%) |
| 2-Person Household | 9 (81.8%) | 2 (18.2%) |
| 3-Person Household | 0 (0.0%) | 0 (0.0%) |
| 4+ Person Household | 0 (0.0%) | 0 (0.0%) |
| Total Housing Units | 11 (78.6%) | 3 (21.4%) |
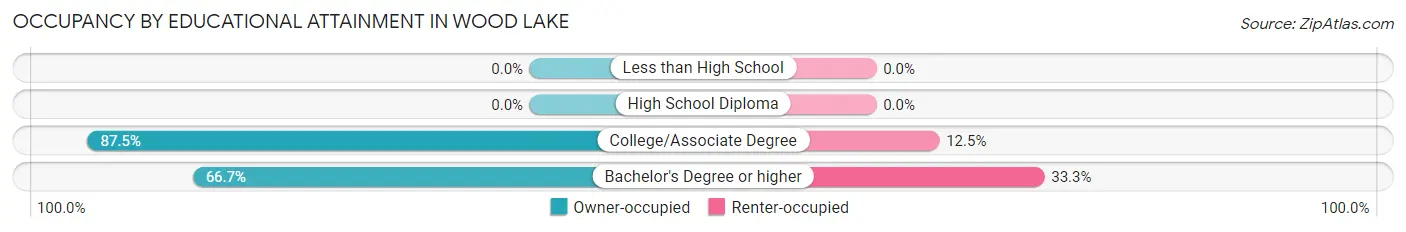
Occupancy by Educational Attainment in Wood Lake
| Household Size | Owner-occupied | Renter-occupied |
| Less than High School | 0 (0.0%) | 0 (0.0%) |
| High School Diploma | 0 (0.0%) | 0 (0.0%) |
| College/Associate Degree | 7 (87.5%) | 1 (12.5%) |
| Bachelor's Degree or higher | 4 (66.7%) | 2 (33.3%) |
Occupancy by Age of Householder in Wood Lake
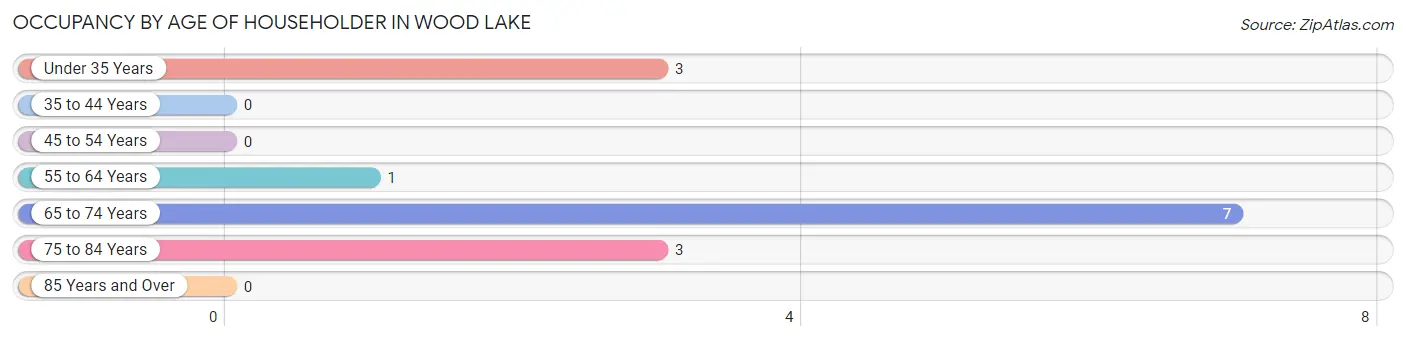
| Age Bracket | # Households | % Households |
| Under 35 Years | 3 | 21.4% |
| 35 to 44 Years | 0 | 0.0% |
| 45 to 54 Years | 0 | 0.0% |
| 55 to 64 Years | 1 | 7.1% |
| 65 to 74 Years | 7 | 50.0% |
| 75 to 84 Years | 3 | 21.4% |
| 85 Years and Over | 0 | 0.0% |
| Total | 14 | 100.0% |
Housing Finances in Wood Lake
Median Income by Occupancy in Wood Lake
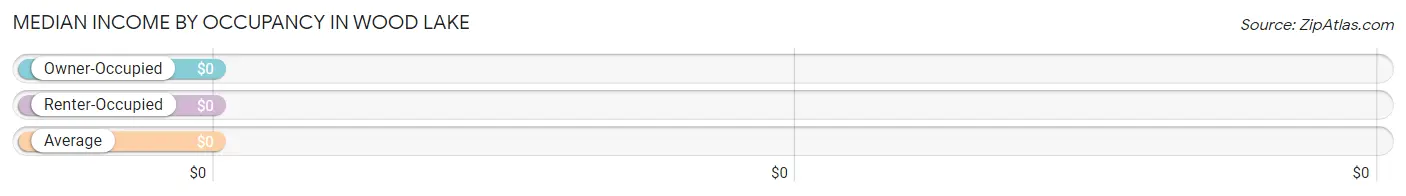
| Occupancy Type | # Households | Median Income |
| Owner-Occupied | 11 (78.6%) | $0 |
| Renter-Occupied | 3 (21.4%) | $0 |
| Average | 14 (100.0%) | $0 |
Occupancy by Householder Income Bracket in Wood Lake
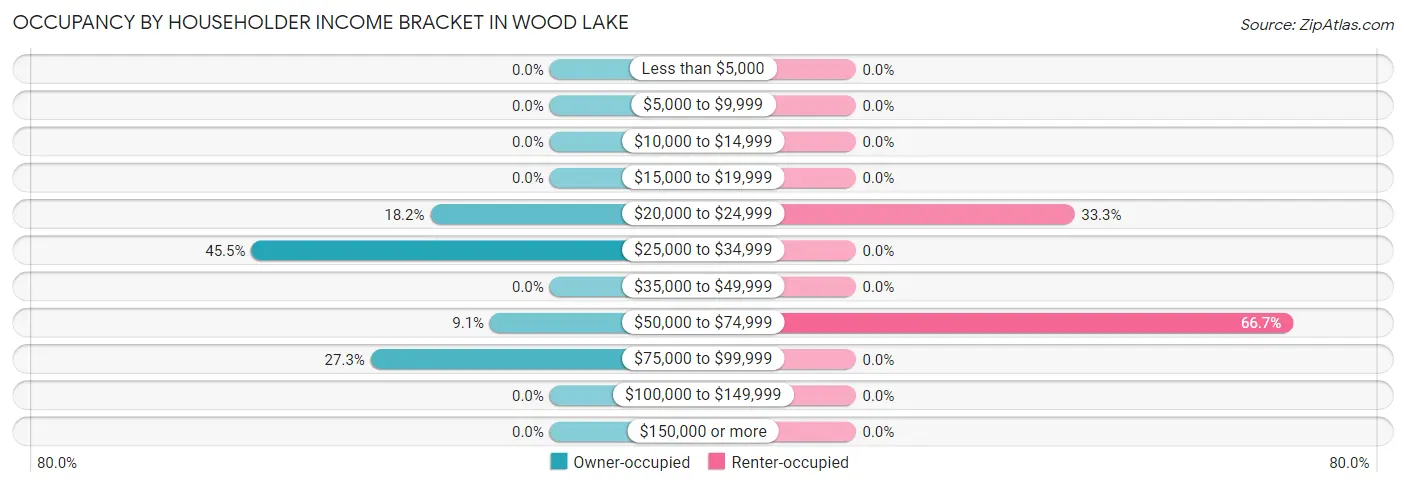
| Income Bracket | Owner-occupied | Renter-occupied |
| Less than $5,000 | 0 (0.0%) | 0 (0.0%) |
| $5,000 to $9,999 | 0 (0.0%) | 0 (0.0%) |
| $10,000 to $14,999 | 0 (0.0%) | 0 (0.0%) |
| $15,000 to $19,999 | 0 (0.0%) | 0 (0.0%) |
| $20,000 to $24,999 | 2 (18.2%) | 1 (33.3%) |
| $25,000 to $34,999 | 5 (45.5%) | 0 (0.0%) |
| $35,000 to $49,999 | 0 (0.0%) | 0 (0.0%) |
| $50,000 to $74,999 | 1 (9.1%) | 2 (66.7%) |
| $75,000 to $99,999 | 3 (27.3%) | 0 (0.0%) |
| $100,000 to $149,999 | 0 (0.0%) | 0 (0.0%) |
| $150,000 or more | 0 (0.0%) | 0 (0.0%) |
| Total | 11 (100.0%) | 3 (100.0%) |
Monthly Housing Cost Tiers in Wood Lake
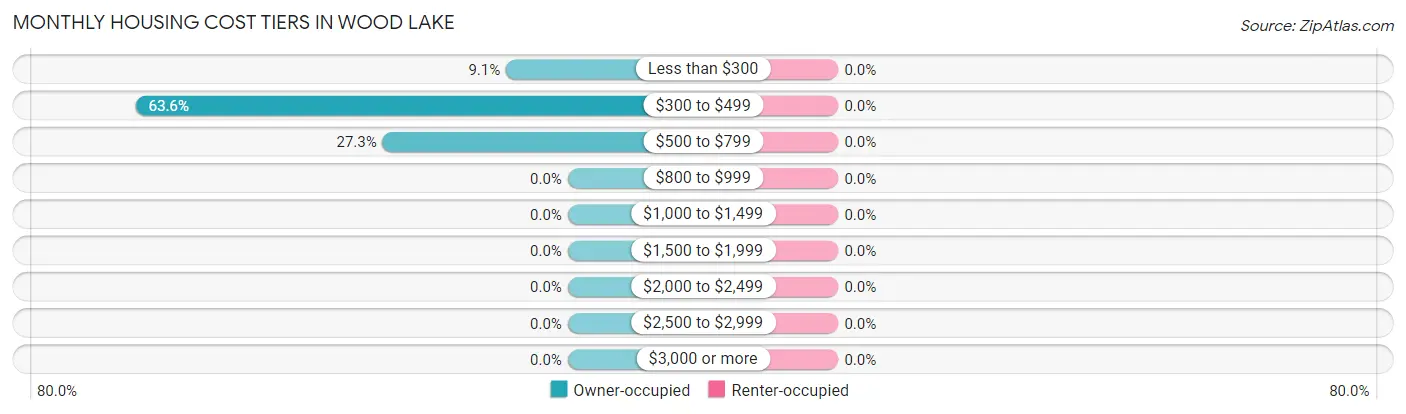
| Monthly Cost | Owner-occupied | Renter-occupied |
| Less than $300 | 1 (9.1%) | 0 (0.0%) |
| $300 to $499 | 7 (63.6%) | 0 (0.0%) |
| $500 to $799 | 3 (27.3%) | 0 (0.0%) |
| $800 to $999 | 0 (0.0%) | 0 (0.0%) |
| $1,000 to $1,499 | 0 (0.0%) | 0 (0.0%) |
| $1,500 to $1,999 | 0 (0.0%) | 0 (0.0%) |
| $2,000 to $2,499 | 0 (0.0%) | 0 (0.0%) |
| $2,500 to $2,999 | 0 (0.0%) | 0 (0.0%) |
| $3,000 or more | 0 (0.0%) | 0 (0.0%) |
| Total | 11 (100.0%) | 3 (100.0%) |
Physical Housing Characteristics in Wood Lake
Housing Structures in Wood Lake
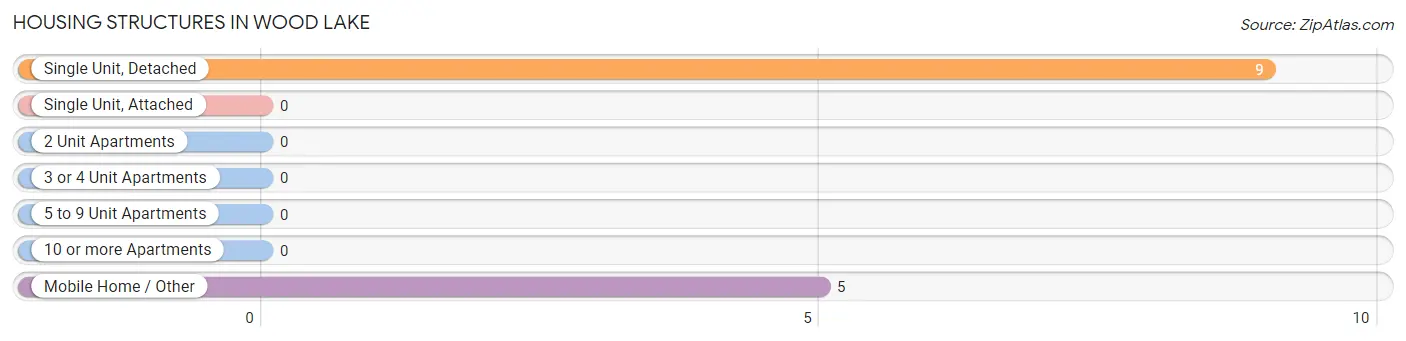
| Structure Type | # Housing Units | % Housing Units |
| Single Unit, Detached | 9 | 64.3% |
| Single Unit, Attached | 0 | 0.0% |
| 2 Unit Apartments | 0 | 0.0% |
| 3 or 4 Unit Apartments | 0 | 0.0% |
| 5 to 9 Unit Apartments | 0 | 0.0% |
| 10 or more Apartments | 0 | 0.0% |
| Mobile Home / Other | 5 | 35.7% |
| Total | 14 | 100.0% |
Housing Structures by Occupancy in Wood Lake
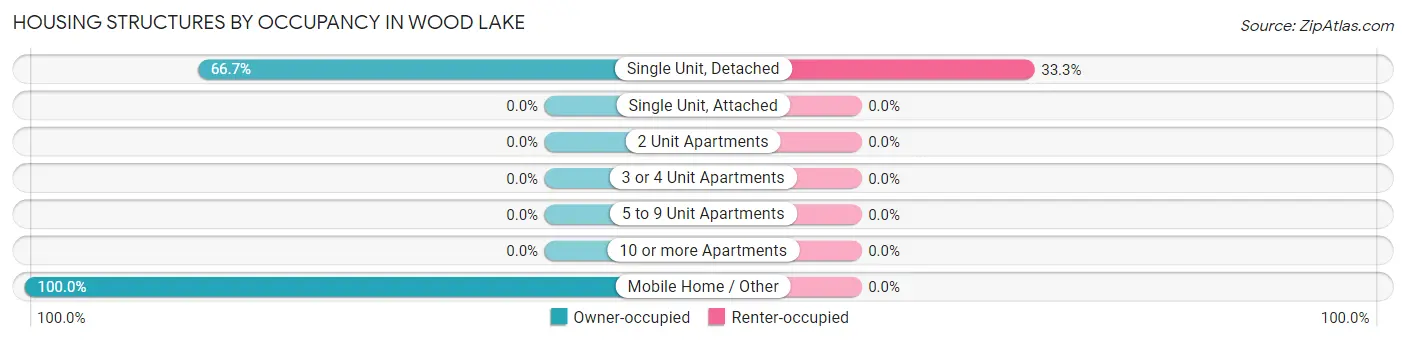
| Structure Type | Owner-occupied | Renter-occupied |
| Single Unit, Detached | 6 (66.7%) | 3 (33.3%) |
| Single Unit, Attached | 0 (0.0%) | 0 (0.0%) |
| 2 Unit Apartments | 0 (0.0%) | 0 (0.0%) |
| 3 or 4 Unit Apartments | 0 (0.0%) | 0 (0.0%) |
| 5 to 9 Unit Apartments | 0 (0.0%) | 0 (0.0%) |
| 10 or more Apartments | 0 (0.0%) | 0 (0.0%) |
| Mobile Home / Other | 5 (100.0%) | 0 (0.0%) |
| Total | 11 (78.6%) | 3 (21.4%) |
Housing Structures by Number of Rooms in Wood Lake
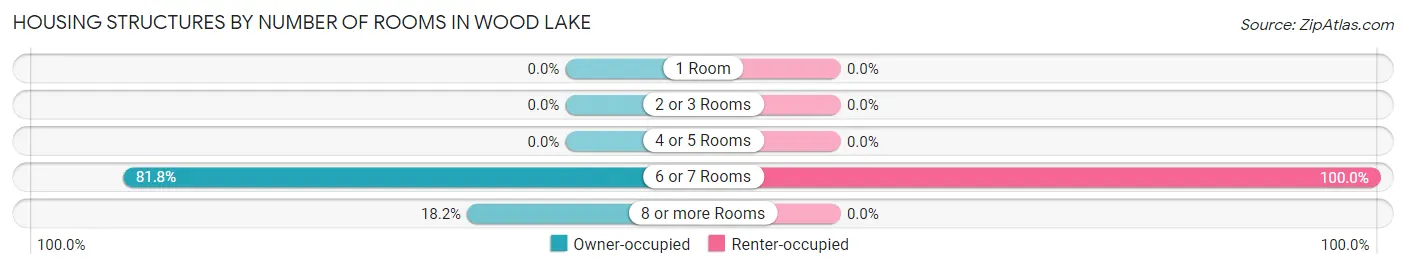
| Number of Rooms | Owner-occupied | Renter-occupied |
| 1 Room | 0 (0.0%) | 0 (0.0%) |
| 2 or 3 Rooms | 0 (0.0%) | 0 (0.0%) |
| 4 or 5 Rooms | 0 (0.0%) | 0 (0.0%) |
| 6 or 7 Rooms | 9 (81.8%) | 3 (100.0%) |
| 8 or more Rooms | 2 (18.2%) | 0 (0.0%) |
| Total | 11 (100.0%) | 3 (100.0%) |
Housing Structure by Heating Type in Wood Lake
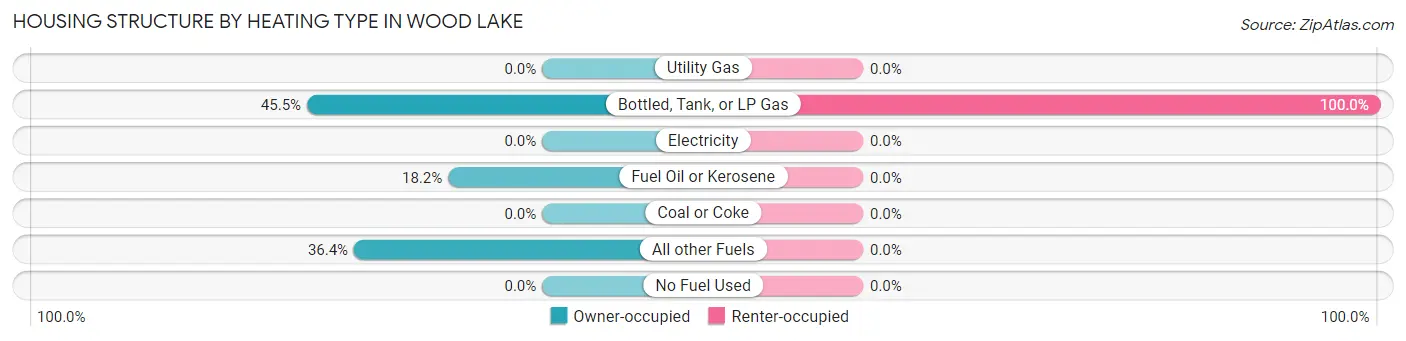
| Heating Type | Owner-occupied | Renter-occupied |
| Utility Gas | 0 (0.0%) | 0 (0.0%) |
| Bottled, Tank, or LP Gas | 5 (45.5%) | 3 (100.0%) |
| Electricity | 0 (0.0%) | 0 (0.0%) |
| Fuel Oil or Kerosene | 2 (18.2%) | 0 (0.0%) |
| Coal or Coke | 0 (0.0%) | 0 (0.0%) |
| All other Fuels | 4 (36.4%) | 0 (0.0%) |
| No Fuel Used | 0 (0.0%) | 0 (0.0%) |
| Total | 11 (100.0%) | 3 (100.0%) |
Household Vehicle Usage in Wood Lake
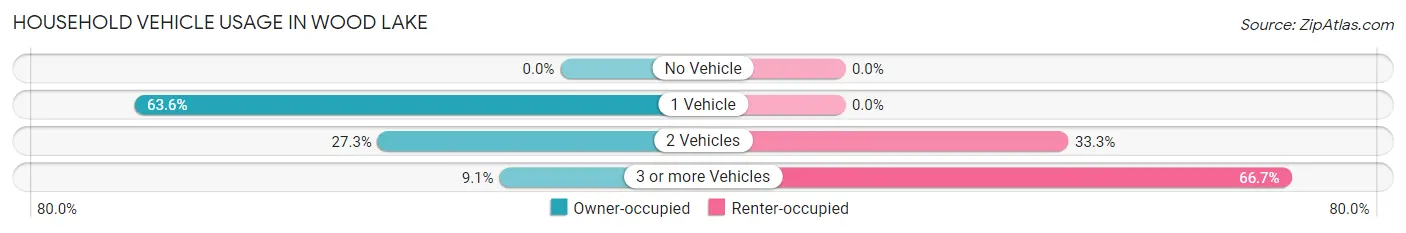
| Vehicles per Household | Owner-occupied | Renter-occupied |
| No Vehicle | 0 (0.0%) | 0 (0.0%) |
| 1 Vehicle | 7 (63.6%) | 0 (0.0%) |
| 2 Vehicles | 3 (27.3%) | 1 (33.3%) |
| 3 or more Vehicles | 1 (9.1%) | 2 (66.7%) |
| Total | 11 (100.0%) | 3 (100.0%) |
Real Estate & Mortgages in Wood Lake
Real Estate and Mortgage Overview in Wood Lake
| Characteristic | Without Mortgage | With Mortgage |
| Housing Units | 3 | 8 |
| Median Property Value | - | - |
| Median Household Income | - | - |
| Monthly Housing Costs | - | - |
| Real Estate Taxes | - | - |
Property Value by Mortgage Status in Wood Lake
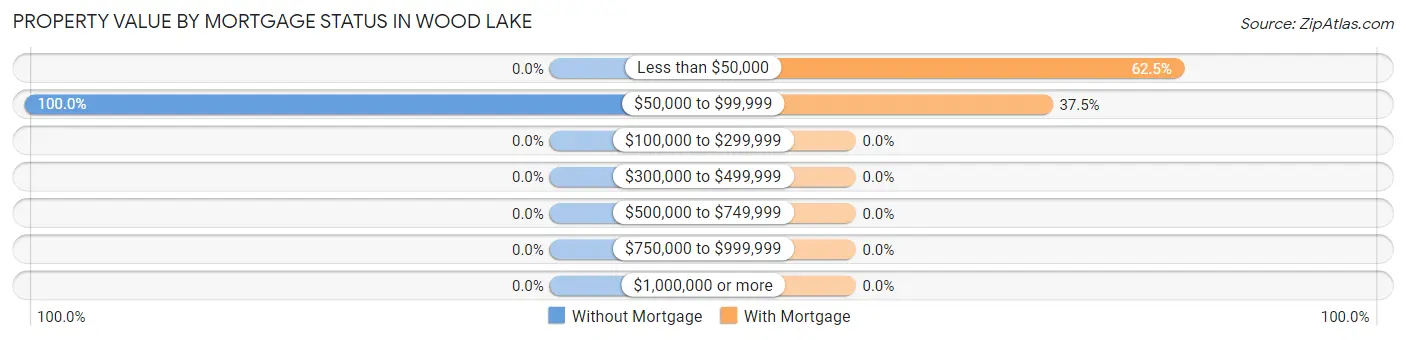
| Property Value | Without Mortgage | With Mortgage |
| Less than $50,000 | 0 (0.0%) | 5 (62.5%) |
| $50,000 to $99,999 | 3 (100.0%) | 3 (37.5%) |
| $100,000 to $299,999 | 0 (0.0%) | 0 (0.0%) |
| $300,000 to $499,999 | 0 (0.0%) | 0 (0.0%) |
| $500,000 to $749,999 | 0 (0.0%) | 0 (0.0%) |
| $750,000 to $999,999 | 0 (0.0%) | 0 (0.0%) |
| $1,000,000 or more | 0 (0.0%) | 0 (0.0%) |
| Total | 3 (100.0%) | 8 (100.0%) |
Household Income by Mortgage Status in Wood Lake
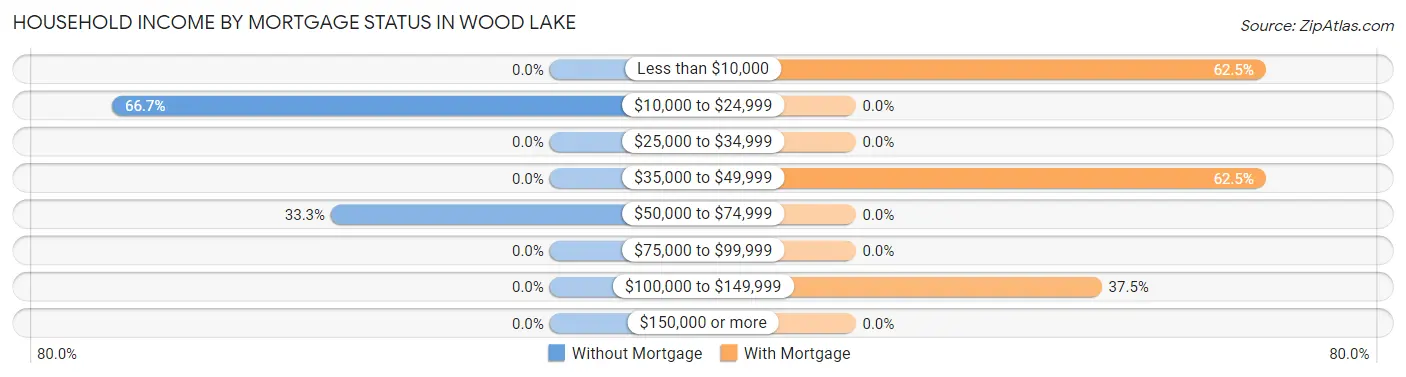
| Household Income | Without Mortgage | With Mortgage |
| Less than $10,000 | 0 (0.0%) | 5 (62.5%) |
| $10,000 to $24,999 | 2 (66.7%) | 0 (0.0%) |
| $25,000 to $34,999 | 0 (0.0%) | 0 (0.0%) |
| $35,000 to $49,999 | 0 (0.0%) | 5 (62.5%) |
| $50,000 to $74,999 | 1 (33.3%) | 0 (0.0%) |
| $75,000 to $99,999 | 0 (0.0%) | 0 (0.0%) |
| $100,000 to $149,999 | 0 (0.0%) | 3 (37.5%) |
| $150,000 or more | 0 (0.0%) | 0 (0.0%) |
| Total | 3 (100.0%) | 8 (100.0%) |
Property Value to Household Income Ratio in Wood Lake
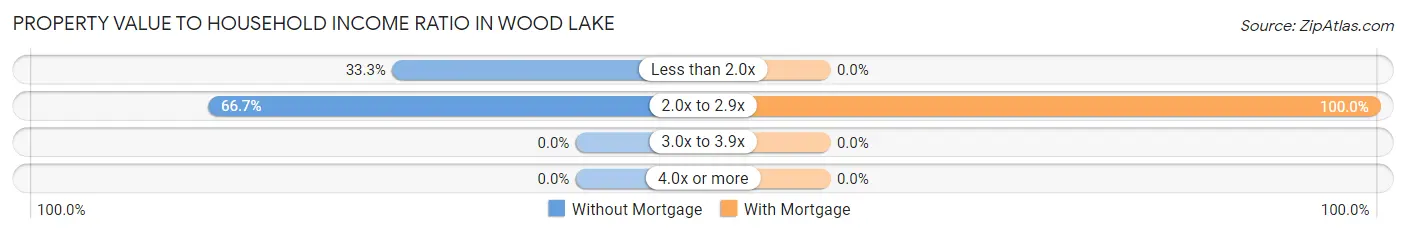
| Value-to-Income Ratio | Without Mortgage | With Mortgage |
| Less than 2.0x | 1 (33.3%) | 0 (0.0%) |
| 2.0x to 2.9x | 2 (66.7%) | 8 (100.0%) |
| 3.0x to 3.9x | 0 (0.0%) | 0 (0.0%) |
| 4.0x or more | 0 (0.0%) | 0 (0.0%) |
| Total | 3 (100.0%) | 8 (100.0%) |
Real Estate Taxes by Mortgage Status in Wood Lake
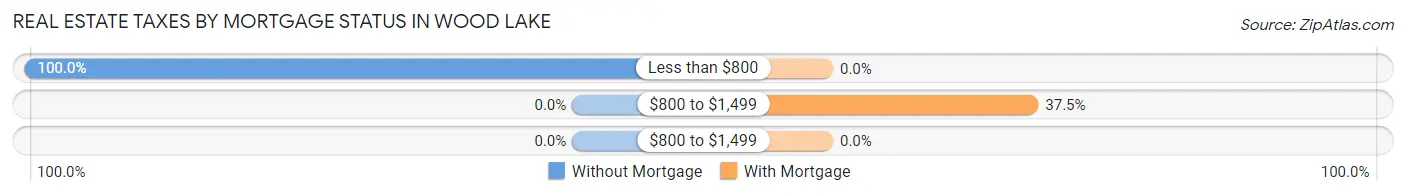
| Property Taxes | Without Mortgage | With Mortgage |
| Less than $800 | 3 (100.0%) | 0 (0.0%) |
| $800 to $1,499 | 0 (0.0%) | 3 (37.5%) |
| $800 to $1,499 | 0 (0.0%) | 0 (0.0%) |
| Total | 3 (100.0%) | 8 (100.0%) |
Health & Disability in Wood Lake
Health Insurance Coverage by Age in Wood Lake
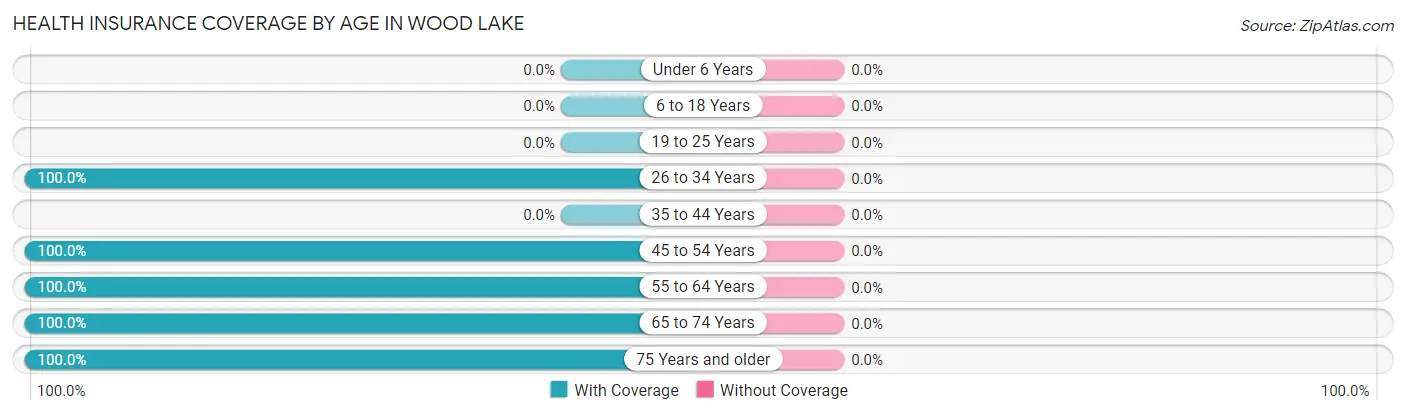
| Age Bracket | With Coverage | Without Coverage |
| Under 6 Years | 0 (0.0%) | 0 (0.0%) |
| 6 to 18 Years | 0 (0.0%) | 0 (0.0%) |
| 19 to 25 Years | 0 (0.0%) | 0 (0.0%) |
| 26 to 34 Years | 4 (100.0%) | 0 (0.0%) |
| 35 to 44 Years | 0 (0.0%) | 0 (0.0%) |
| 45 to 54 Years | 1 (100.0%) | 0 (0.0%) |
| 55 to 64 Years | 1 (100.0%) | 0 (0.0%) |
| 65 to 74 Years | 12 (100.0%) | 0 (0.0%) |
| 75 Years and older | 5 (100.0%) | 0 (0.0%) |
| Total | 23 (100.0%) | 0 (0.0%) |
Health Insurance Coverage by Citizenship Status in Wood Lake
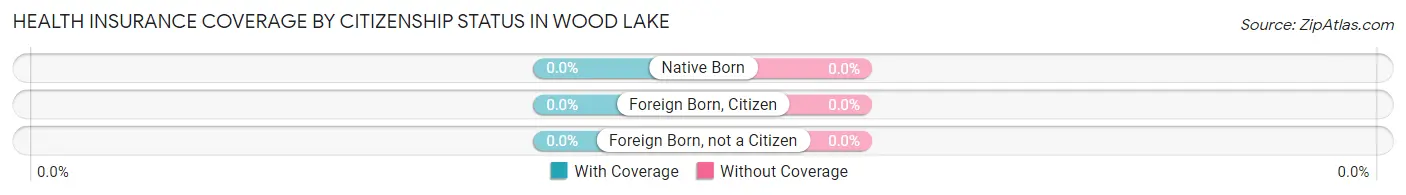
| Citizenship Status | With Coverage | Without Coverage |
| Native Born | 0 (0.0%) | 0 (0.0%) |
| Foreign Born, Citizen | 0 (0.0%) | 0 (0.0%) |
| Foreign Born, not a Citizen | 0 (0.0%) | 0 (0.0%) |
Health Insurance Coverage by Household Income in Wood Lake
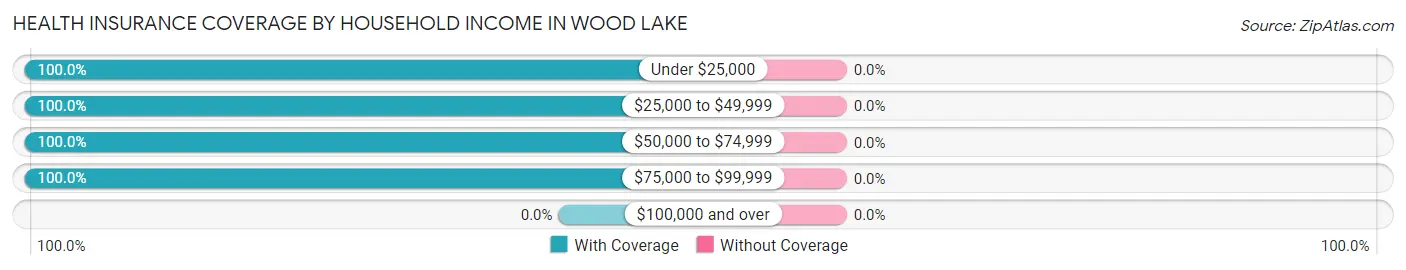
| Household Income | With Coverage | Without Coverage |
| Under $25,000 | 3 (100.0%) | 0 (0.0%) |
| $25,000 to $49,999 | 10 (100.0%) | 0 (0.0%) |
| $50,000 to $74,999 | 6 (100.0%) | 0 (0.0%) |
| $75,000 to $99,999 | 4 (100.0%) | 0 (0.0%) |
| $100,000 and over | 0 (0.0%) | 0 (0.0%) |
Public vs Private Health Insurance Coverage by Age in Wood Lake
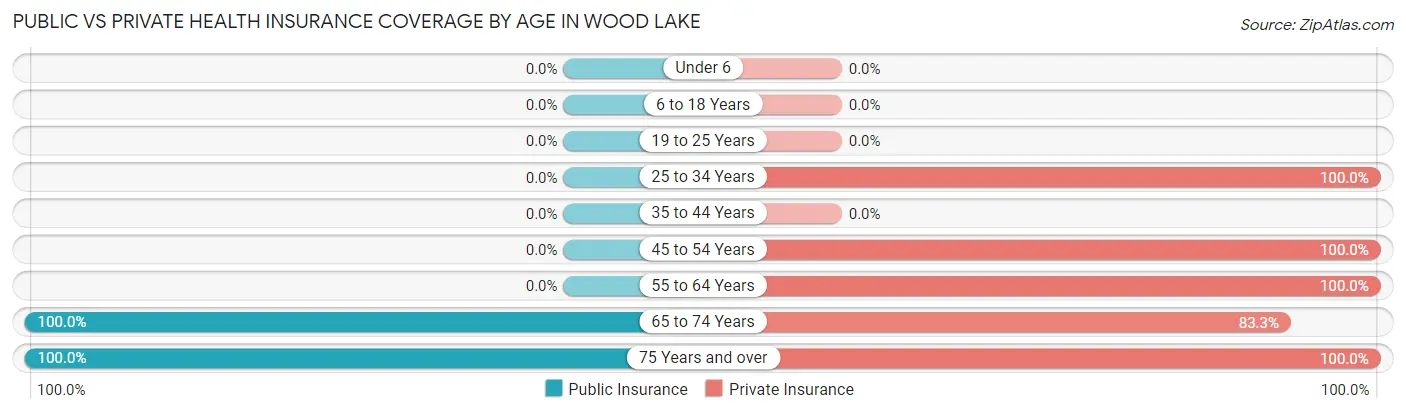
| Age Bracket | Public Insurance | Private Insurance |
| Under 6 | 0 (0.0%) | 0 (0.0%) |
| 6 to 18 Years | 0 (0.0%) | 0 (0.0%) |
| 19 to 25 Years | 0 (0.0%) | 0 (0.0%) |
| 25 to 34 Years | 0 (0.0%) | 4 (100.0%) |
| 35 to 44 Years | 0 (0.0%) | 0 (0.0%) |
| 45 to 54 Years | 0 (0.0%) | 1 (100.0%) |
| 55 to 64 Years | 0 (0.0%) | 1 (100.0%) |
| 65 to 74 Years | 12 (100.0%) | 10 (83.3%) |
| 75 Years and over | 5 (100.0%) | 5 (100.0%) |
| Total | 17 (73.9%) | 21 (91.3%) |
Disability Status by Sex by Age in Wood Lake
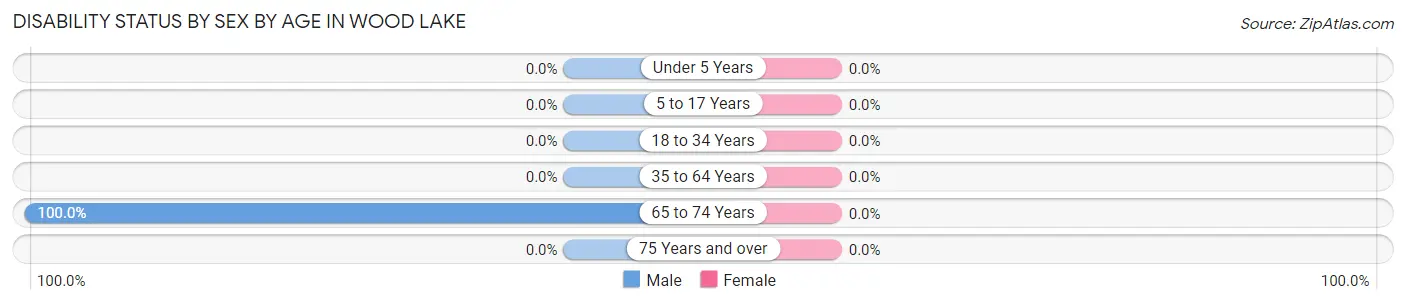
| Age Bracket | Male | Female |
| Under 5 Years | 0 (0.0%) | 0 (0.0%) |
| 5 to 17 Years | 0 (0.0%) | 0 (0.0%) |
| 18 to 34 Years | 0 (0.0%) | 0 (0.0%) |
| 35 to 64 Years | 0 (0.0%) | 0 (0.0%) |
| 65 to 74 Years | 7 (100.0%) | 0 (0.0%) |
| 75 Years and over | 0 (0.0%) | 0 (0.0%) |
Disability Class by Sex by Age in Wood Lake
Disability Class: Hearing Difficulty
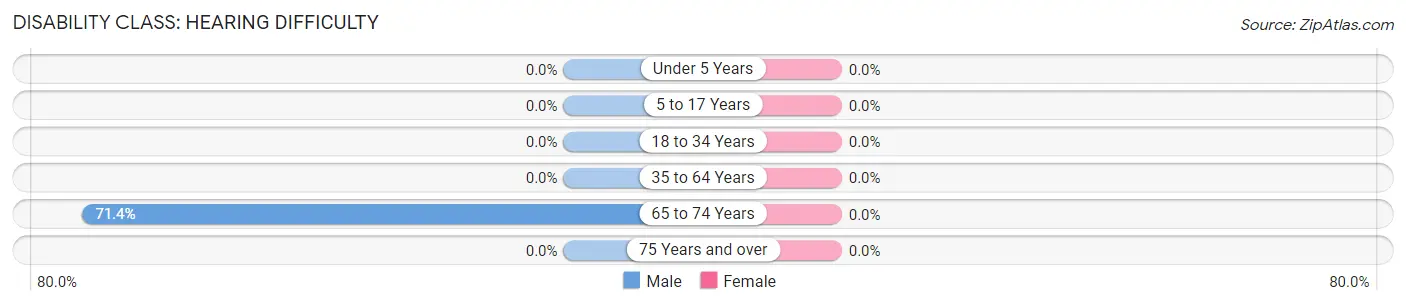
| Age Bracket | Male | Female |
| Under 5 Years | 0 (0.0%) | 0 (0.0%) |
| 5 to 17 Years | 0 (0.0%) | 0 (0.0%) |
| 18 to 34 Years | 0 (0.0%) | 0 (0.0%) |
| 35 to 64 Years | 0 (0.0%) | 0 (0.0%) |
| 65 to 74 Years | 5 (71.4%) | 0 (0.0%) |
| 75 Years and over | 0 (0.0%) | 0 (0.0%) |
Disability Class: Vision Difficulty
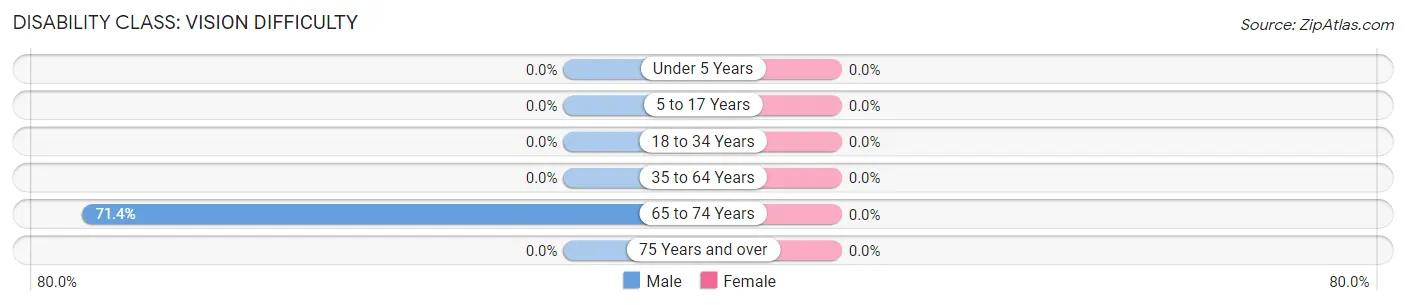
| Age Bracket | Male | Female |
| Under 5 Years | 0 (0.0%) | 0 (0.0%) |
| 5 to 17 Years | 0 (0.0%) | 0 (0.0%) |
| 18 to 34 Years | 0 (0.0%) | 0 (0.0%) |
| 35 to 64 Years | 0 (0.0%) | 0 (0.0%) |
| 65 to 74 Years | 5 (71.4%) | 0 (0.0%) |
| 75 Years and over | 0 (0.0%) | 0 (0.0%) |
Disability Class: Cognitive Difficulty
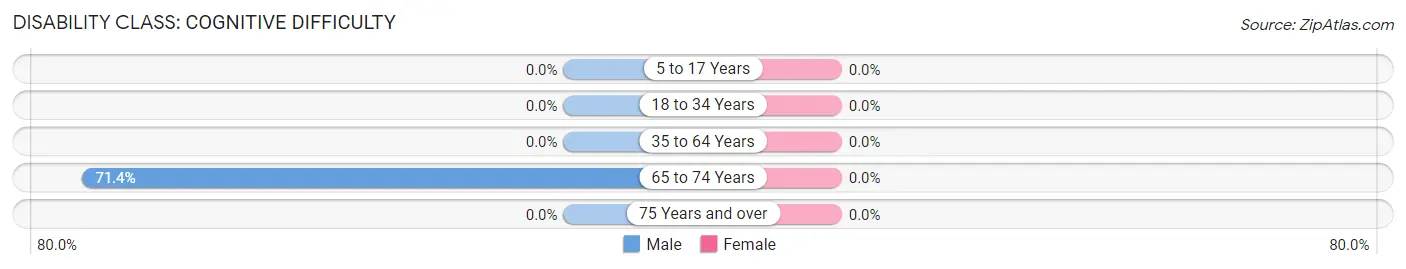
| Age Bracket | Male | Female |
| 5 to 17 Years | 0 (0.0%) | 0 (0.0%) |
| 18 to 34 Years | 0 (0.0%) | 0 (0.0%) |
| 35 to 64 Years | 0 (0.0%) | 0 (0.0%) |
| 65 to 74 Years | 5 (71.4%) | 0 (0.0%) |
| 75 Years and over | 0 (0.0%) | 0 (0.0%) |
Disability Class: Ambulatory Difficulty
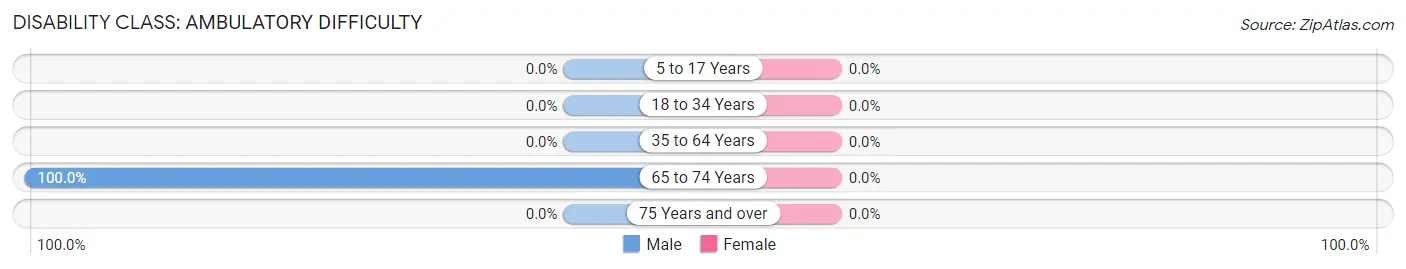
| Age Bracket | Male | Female |
| 5 to 17 Years | 0 (0.0%) | 0 (0.0%) |
| 18 to 34 Years | 0 (0.0%) | 0 (0.0%) |
| 35 to 64 Years | 0 (0.0%) | 0 (0.0%) |
| 65 to 74 Years | 7 (100.0%) | 0 (0.0%) |
| 75 Years and over | 0 (0.0%) | 0 (0.0%) |
Disability Class: Self-Care Difficulty
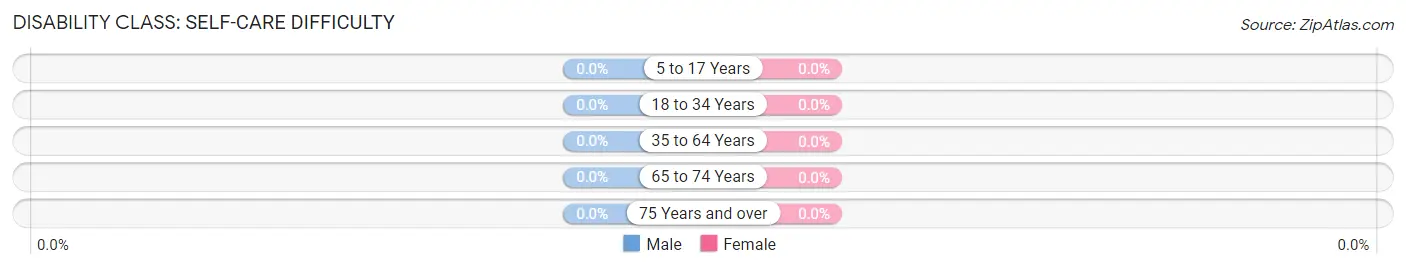
| Age Bracket | Male | Female |
| 5 to 17 Years | 0 (0.0%) | 0 (0.0%) |
| 18 to 34 Years | 0 (0.0%) | 0 (0.0%) |
| 35 to 64 Years | 0 (0.0%) | 0 (0.0%) |
| 65 to 74 Years | 0 (0.0%) | 0 (0.0%) |
| 75 Years and over | 0 (0.0%) | 0 (0.0%) |
Technology Access in Wood Lake
Computing Device Access in Wood Lake
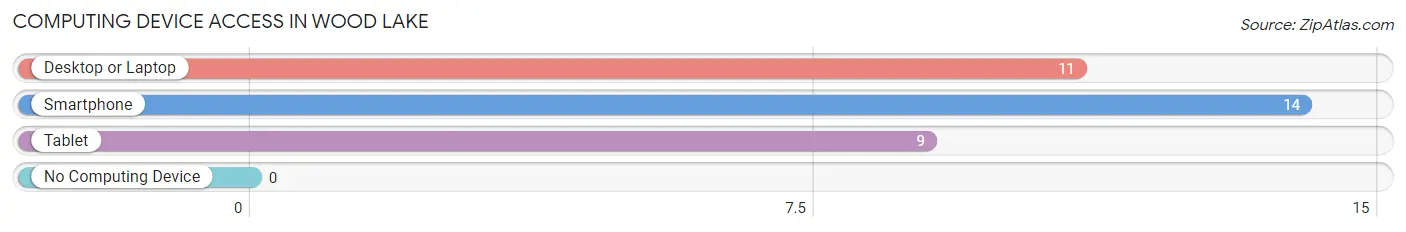
| Device Type | # Households | % Households |
| Desktop or Laptop | 11 | 78.6% |
| Smartphone | 14 | 100.0% |
| Tablet | 9 | 64.3% |
| No Computing Device | 0 | 0.0% |
| Total | 14 | 100.0% |
Internet Access in Wood Lake
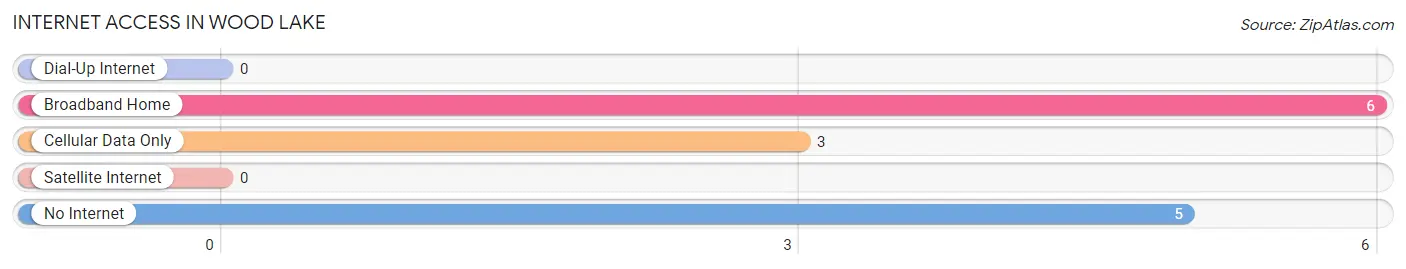
| Internet Type | # Households | % Households |
| Dial-Up Internet | 0 | 0.0% |
| Broadband Home | 6 | 42.9% |
| Cellular Data Only | 3 | 21.4% |
| Satellite Internet | 0 | 0.0% |
| No Internet | 5 | 35.7% |
| Total | 14 | 100.0% |
Wood Lake Summary
Wood Lake is a small village located in the state of Nebraska, in the United States. It is situated in the southeastern corner of the state, in Cherry County. The village is located on the banks of the Wood Lake, which is a natural lake that is fed by the Niobrara River. The village has a population of approximately 200 people, and is a rural community that is surrounded by agricultural land.
History
The area around Wood Lake has been inhabited by Native Americans for centuries. The first Europeans to settle in the area were French fur traders, who arrived in the late 1700s. The area was part of the Louisiana Purchase in 1803, and was later part of the Nebraska Territory in 1854.
The village of Wood Lake was founded in 1883, when the Union Pacific Railroad built a line through the area. The village was named after the nearby lake, which was named after the wooded area that surrounded it. The village was incorporated in 1887, and the first post office was established in 1888.
Geography
Wood Lake is located in the southeastern corner of Nebraska, in Cherry County. The village is situated on the banks of the Wood Lake, which is a natural lake that is fed by the Niobrara River. The village is surrounded by agricultural land, and is located approximately 30 miles from the nearest major city, Valentine.
The climate in Wood Lake is classified as humid continental, with hot summers and cold winters. The average annual temperature is around 50 degrees Fahrenheit, and the average annual precipitation is around 20 inches.
Economy
The economy of Wood Lake is largely based on agriculture. The village is surrounded by agricultural land, and the main crops grown in the area are corn, soybeans, and wheat. The village also has a small manufacturing sector, which produces a variety of products, including furniture and clothing.
The village also has a small tourism industry, which is centered around the Wood Lake. The lake is a popular destination for fishing, boating, and swimming. The village also has a few small shops and restaurants, which cater to tourists and locals alike.
Demographics
As of the 2010 census, the population of Wood Lake was approximately 200 people. The racial makeup of the village was 97.5% White, 0.5% African American, 0.5% Native American, and 1.5% from other races. The median household income was $37,500, and the median age was 44 years.
Wood Lake is a small rural community that is surrounded by agricultural land. The village has a small population, and the economy is largely based on agriculture. The village also has a small tourism industry, which is centered around the Wood Lake. The village has a diverse population, and is a peaceful and quiet place to live.
Common Questions
What is Per Capita Income in Wood Lake?
Per Capita income in Wood Lake is $23,878.
What is Inequality or Gini Index in Wood Lake?
Inequality or Gini Index in Wood Lake is 0.28.
What is the Total Population of Wood Lake?
Total Population of Wood Lake is 23.
What is the Total Male Population of Wood Lake?
Total Male Population of Wood Lake is 11.
What is the Total Female Population of Wood Lake?
Total Female Population of Wood Lake is 12.
What is the Ratio of Males per 100 Females in Wood Lake?
There are 91.67 Males per 100 Females in Wood Lake.
What is the Ratio of Females per 100 Males in Wood Lake?
There are 109.09 Females per 100 Males in Wood Lake.
What is the Median Population Age in Wood Lake?
Median Population Age in Wood Lake is 74.4 Years.
What is the Average Family Size in Wood Lake
Average Family Size in Wood Lake is 1.8 People.
What is the Average Household Size in Wood Lake
Average Household Size in Wood Lake is 1.6 People.
How Large is the Labor Force in Wood Lake?
There are 9 People in the Labor Forcein in Wood Lake.
What is the Percentage of People in the Labor Force in Wood Lake?
39.1% of People are in the Labor Force in Wood Lake.