Waverly, NE Map & Demographics
Waverly Map
Waverly Overview
$37,561
PER CAPITA INCOME
$112,731
AVG FAMILY INCOME
$103,373
AVG HOUSEHOLD INCOME
45.1%
WAGE / INCOME GAP [ % ]
54.9¢/ $1
WAGE / INCOME GAP [ $ ]
0.31
INEQUALITY / GINI INDEX
4,289
TOTAL POPULATION
2,058
MALE POPULATION
2,231
FEMALE POPULATION
92.25
MALES / 100 FEMALES
108.41
FEMALES / 100 MALES
35.2
MEDIAN AGE
3.1
AVG FAMILY SIZE
2.9
AVG HOUSEHOLD SIZE
1,991
LABOR FORCE [ PEOPLE ]
68.2%
PERCENT IN LABOR FORCE
0.3%
UNEMPLOYMENT RATE
Waverly Zip Codes
Waverly Area Codes
Income in Waverly
Income Overview in Waverly
Per Capita Income in Waverly is $37,561, while median incomes of families and households are $112,731 and $103,373 respectively.
| Characteristic | Number | Measure |
| Per Capita Income | 4,289 | $37,561 |
| Median Family Income | 1,270 | $112,731 |
| Mean Family Income | 1,270 | $119,649 |
| Median Household Income | 1,471 | $103,373 |
| Mean Household Income | 1,471 | $111,148 |
| Income Deficit | 1,270 | $0 |
| Wage / Income Gap (%) | 4,289 | 45.10% |
| Wage / Income Gap ($) | 4,289 | 54.90¢ per $1 |
| Gini / Inequality Index | 4,289 | 0.31 |
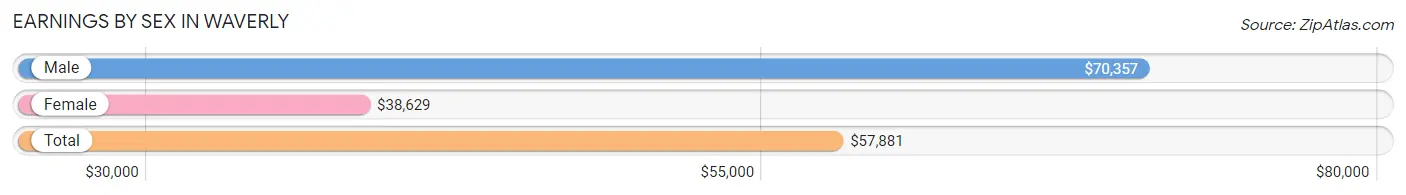
Earnings by Sex in Waverly
Average Earnings in Waverly are $57,881, $70,357 for men and $38,629 for women, a difference of 45.1%.
| Sex | Number | Average Earnings |
| Male | 1,080 (52.6%) | $70,357 |
| Female | 974 (47.4%) | $38,629 |
| Total | 2,054 (100.0%) | $57,881 |
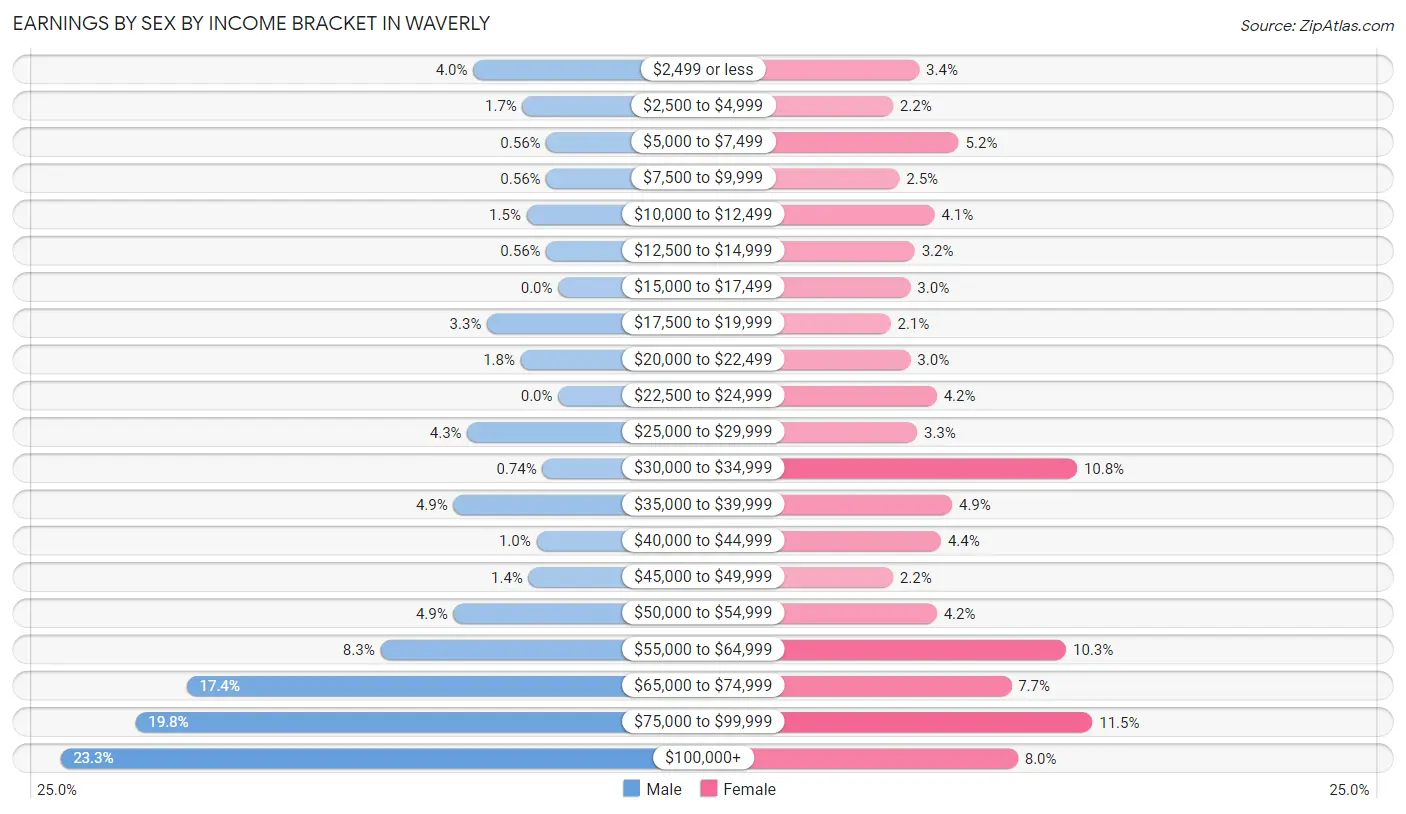
Earnings by Sex by Income Bracket in Waverly
The most common earnings brackets in Waverly are $100,000+ for men (252 | 23.3%) and $75,000 to $99,999 for women (112 | 11.5%).
| Income | Male | Female |
| $2,499 or less | 43 (4.0%) | 33 (3.4%) |
| $2,500 to $4,999 | 18 (1.7%) | 21 (2.2%) |
| $5,000 to $7,499 | 6 (0.6%) | 51 (5.2%) |
| $7,500 to $9,999 | 6 (0.6%) | 24 (2.5%) |
| $10,000 to $12,499 | 16 (1.5%) | 40 (4.1%) |
| $12,500 to $14,999 | 6 (0.6%) | 31 (3.2%) |
| $15,000 to $17,499 | 0 (0.0%) | 29 (3.0%) |
| $17,500 to $19,999 | 36 (3.3%) | 20 (2.1%) |
| $20,000 to $22,499 | 19 (1.8%) | 29 (3.0%) |
| $22,500 to $24,999 | 0 (0.0%) | 41 (4.2%) |
| $25,000 to $29,999 | 46 (4.3%) | 32 (3.3%) |
| $30,000 to $34,999 | 8 (0.7%) | 105 (10.8%) |
| $35,000 to $39,999 | 53 (4.9%) | 48 (4.9%) |
| $40,000 to $44,999 | 11 (1.0%) | 43 (4.4%) |
| $45,000 to $49,999 | 15 (1.4%) | 21 (2.2%) |
| $50,000 to $54,999 | 53 (4.9%) | 41 (4.2%) |
| $55,000 to $64,999 | 90 (8.3%) | 100 (10.3%) |
| $65,000 to $74,999 | 188 (17.4%) | 75 (7.7%) |
| $75,000 to $99,999 | 214 (19.8%) | 112 (11.5%) |
| $100,000+ | 252 (23.3%) | 78 (8.0%) |
| Total | 1,080 (100.0%) | 974 (100.0%) |
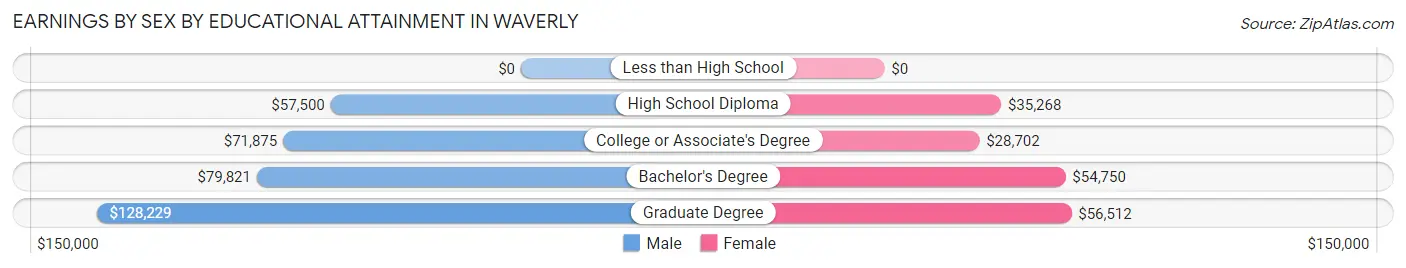
Earnings by Sex by Educational Attainment in Waverly
Average earnings in Waverly are $73,725 for men and $44,960 for women, a difference of 39.0%. Men with an educational attainment of graduate degree enjoy the highest average annual earnings of $128,229, while those with high school diploma education earn the least with $57,500. Women with an educational attainment of graduate degree earn the most with the average annual earnings of $56,512, while those with college or associate's degree education have the smallest earnings of $28,702.
| Educational Attainment | Male Income | Female Income |
| Less than High School | - | - |
| High School Diploma | $57,500 | $35,268 |
| College or Associate's Degree | $71,875 | $28,702 |
| Bachelor's Degree | $79,821 | $54,750 |
| Graduate Degree | $128,229 | $56,512 |
| Total | $73,725 | $44,960 |
Family Income in Waverly
Family Income Brackets in Waverly
According to the Waverly family income data, there are 384 families falling into the $100,000 to $149,999 income range, which is the most common income bracket and makes up 30.2% of all families.
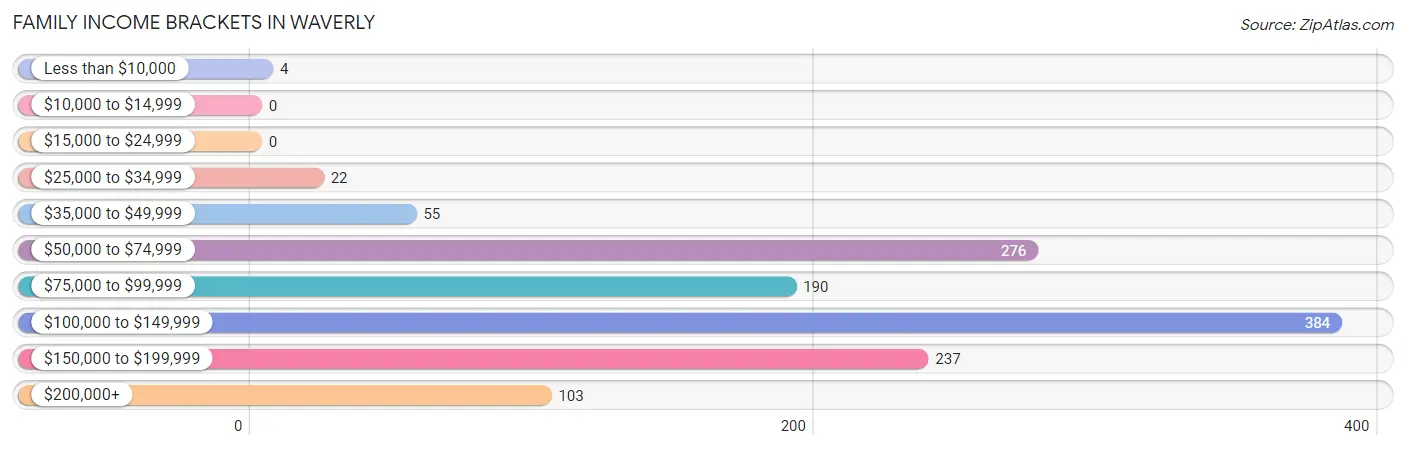
| Income Bracket | # Families | % Families |
| Less than $10,000 | 4 | 0.3% |
| $10,000 to $14,999 | 0 | 0.0% |
| $15,000 to $24,999 | 0 | 0.0% |
| $25,000 to $34,999 | 22 | 1.7% |
| $35,000 to $49,999 | 55 | 4.3% |
| $50,000 to $74,999 | 276 | 21.7% |
| $75,000 to $99,999 | 190 | 15.0% |
| $100,000 to $149,999 | 384 | 30.2% |
| $150,000 to $199,999 | 237 | 18.7% |
| $200,000+ | 103 | 8.1% |
Family Income by Famaliy Size in Waverly
4-person families (225 | 17.7%) account for the highest median family income in Waverly with $141,713 per family, while 2-person families (604 | 47.6%) have the highest median income of $42,150 per family member.
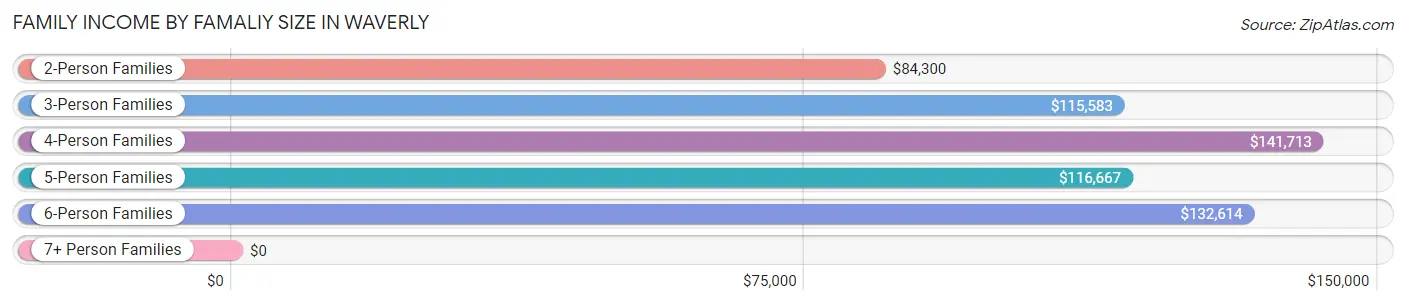
| Income Bracket | # Families | Median Income |
| 2-Person Families | 604 (47.6%) | $84,300 |
| 3-Person Families | 231 (18.2%) | $115,583 |
| 4-Person Families | 225 (17.7%) | $141,713 |
| 5-Person Families | 158 (12.4%) | $116,667 |
| 6-Person Families | 21 (1.7%) | $132,614 |
| 7+ Person Families | 31 (2.4%) | $0 |
| Total | 1,270 (100.0%) | $112,731 |
Family Income by Number of Earners in Waverly
The median family income in Waverly is $112,731, with families comprising 2 earners (620) having the highest median family income of $127,500, while families with no earners (236) have the lowest median family income of $66,111, accounting for 48.8% and 18.6% of families, respectively.
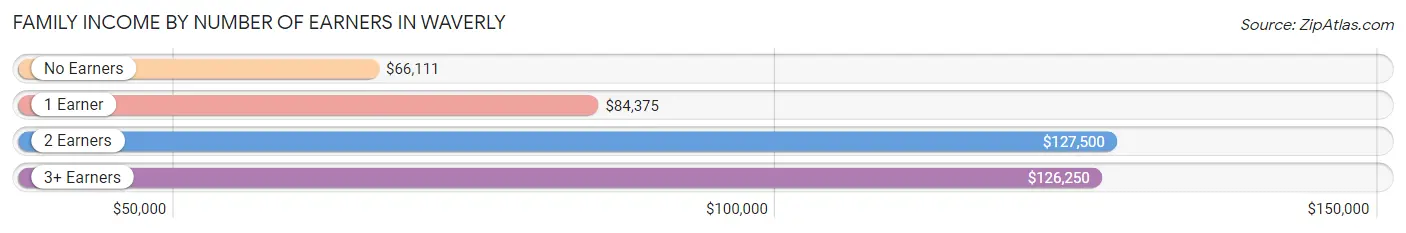
| Number of Earners | # Families | Median Income |
| No Earners | 236 (18.6%) | $66,111 |
| 1 Earner | 296 (23.3%) | $84,375 |
| 2 Earners | 620 (48.8%) | $127,500 |
| 3+ Earners | 118 (9.3%) | $126,250 |
| Total | 1,270 (100.0%) | $112,731 |
Household Income in Waverly
Household Income Brackets in Waverly
With 437 households falling in the category, the $100,000 to $149,999 income range is the most frequent in Waverly, accounting for 29.7% of all households. In contrast, only 9 households (0.6%) fall into the less than $10,000 income bracket, making it the least populous group.
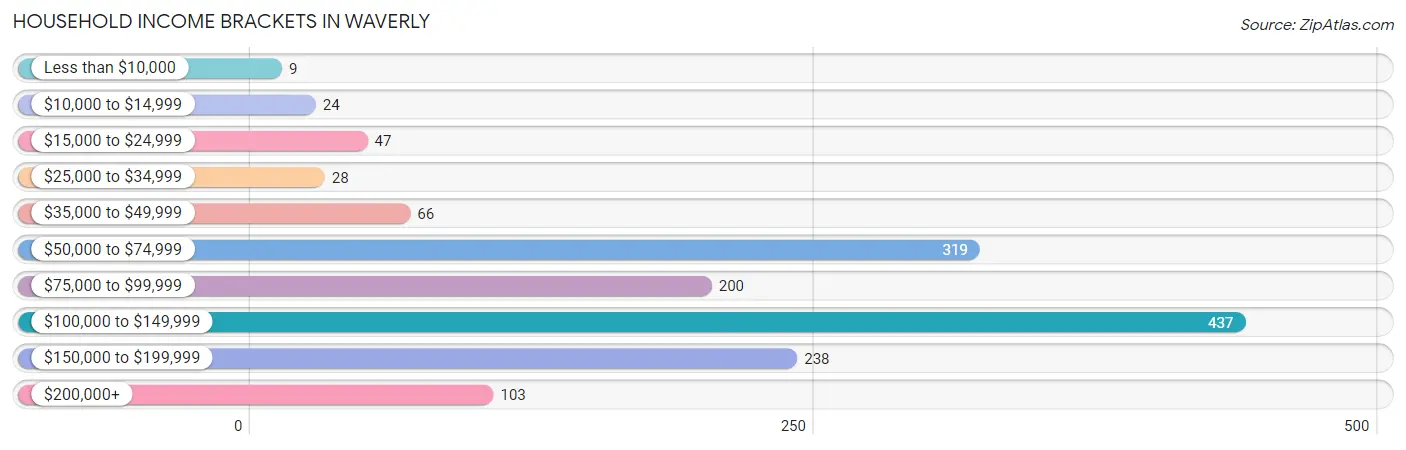
| Income Bracket | # Households | % Households |
| Less than $10,000 | 9 | 0.6% |
| $10,000 to $14,999 | 24 | 1.6% |
| $15,000 to $24,999 | 47 | 3.2% |
| $25,000 to $34,999 | 28 | 1.9% |
| $35,000 to $49,999 | 66 | 4.5% |
| $50,000 to $74,999 | 319 | 21.7% |
| $75,000 to $99,999 | 200 | 13.6% |
| $100,000 to $149,999 | 437 | 29.7% |
| $150,000 to $199,999 | 238 | 16.2% |
| $200,000+ | 103 | 7.0% |
Household Income by Householder Age in Waverly
The median household income in Waverly is $103,373, with the highest median household income of $116,510 found in the 45 to 64 years age bracket for the primary householder. A total of 449 households (30.5%) fall into this category. Meanwhile, the 15 to 24 years age bracket for the primary householder has the lowest median household income of $0, with 71 households (4.8%) in this group.
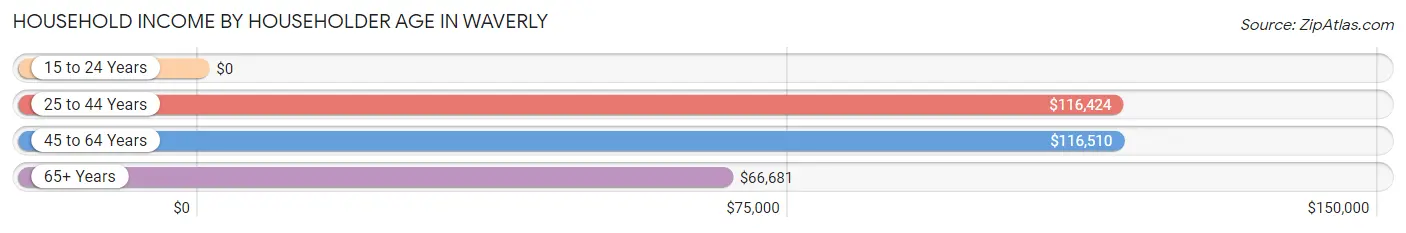
| Income Bracket | # Households | Median Income |
| 15 to 24 Years | 71 (4.8%) | $0 |
| 25 to 44 Years | 543 (36.9%) | $116,424 |
| 45 to 64 Years | 449 (30.5%) | $116,510 |
| 65+ Years | 408 (27.7%) | $66,681 |
| Total | 1,471 (100.0%) | $103,373 |
Poverty in Waverly
Income Below Poverty by Sex and Age in Waverly
With 1.2% poverty level for males and 2.1% for females among the residents of Waverly, 18 to 24 year old males and 15 year old females are the most vulnerable to poverty, with 8 males (9.2%) and 11 females (14.5%) in their respective age groups living below the poverty level.
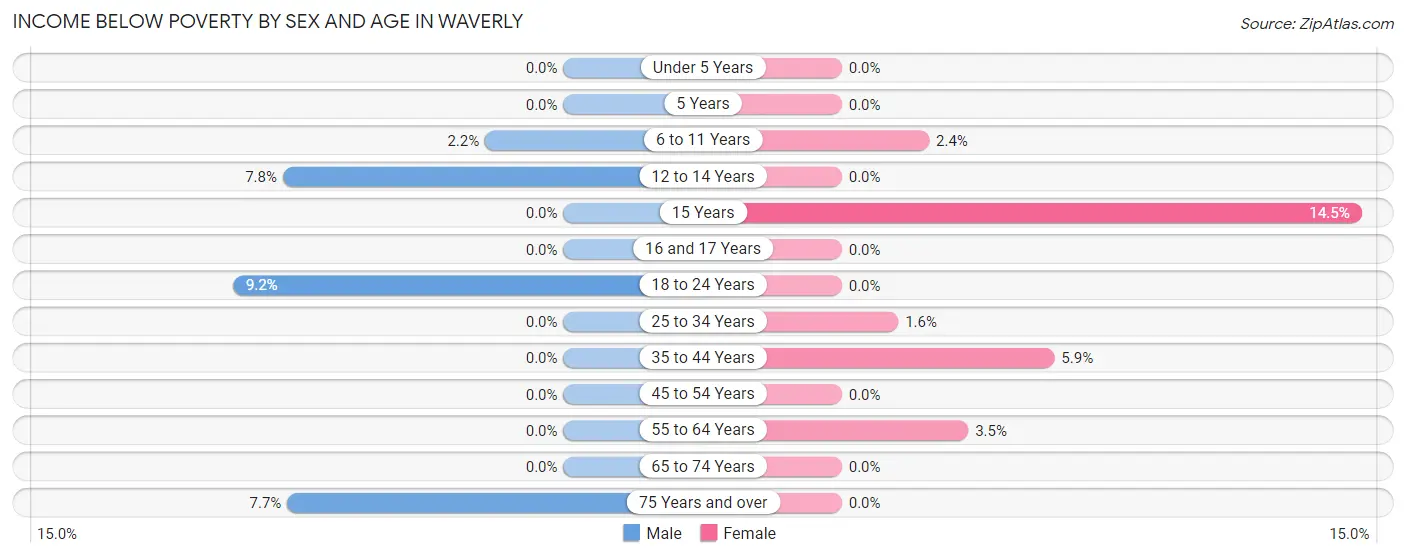
| Age Bracket | Male | Female |
| Under 5 Years | 0 (0.0%) | 0 (0.0%) |
| 5 Years | 0 (0.0%) | 0 (0.0%) |
| 6 to 11 Years | 6 (2.2%) | 7 (2.4%) |
| 12 to 14 Years | 5 (7.8%) | 0 (0.0%) |
| 15 Years | 0 (0.0%) | 11 (14.5%) |
| 16 and 17 Years | 0 (0.0%) | 0 (0.0%) |
| 18 to 24 Years | 8 (9.2%) | 0 (0.0%) |
| 25 to 34 Years | 0 (0.0%) | 4 (1.6%) |
| 35 to 44 Years | 0 (0.0%) | 19 (5.9%) |
| 45 to 54 Years | 0 (0.0%) | 0 (0.0%) |
| 55 to 64 Years | 0 (0.0%) | 5 (3.5%) |
| 65 to 74 Years | 0 (0.0%) | 0 (0.0%) |
| 75 Years and over | 5 (7.7%) | 0 (0.0%) |
| Total | 24 (1.2%) | 46 (2.1%) |
Income Above Poverty by Sex and Age in Waverly
According to the poverty statistics in Waverly, males aged under 5 years and females aged under 5 years are the age groups that are most secure financially, with 100.0% of males and 100.0% of females in these age groups living above the poverty line.
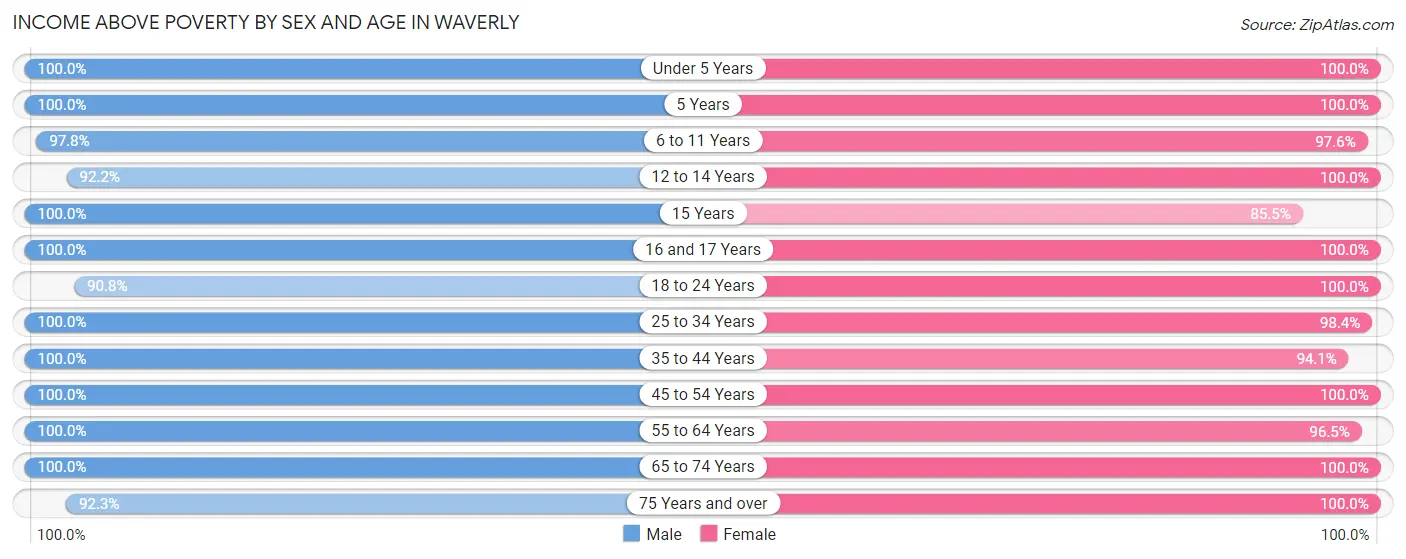
| Age Bracket | Male | Female |
| Under 5 Years | 140 (100.0%) | 175 (100.0%) |
| 5 Years | 95 (100.0%) | 28 (100.0%) |
| 6 to 11 Years | 269 (97.8%) | 281 (97.6%) |
| 12 to 14 Years | 59 (92.2%) | 173 (100.0%) |
| 15 Years | 52 (100.0%) | 65 (85.5%) |
| 16 and 17 Years | 33 (100.0%) | 56 (100.0%) |
| 18 to 24 Years | 79 (90.8%) | 105 (100.0%) |
| 25 to 34 Years | 230 (100.0%) | 251 (98.4%) |
| 35 to 44 Years | 252 (100.0%) | 302 (94.1%) |
| 45 to 54 Years | 311 (100.0%) | 224 (100.0%) |
| 55 to 64 Years | 121 (100.0%) | 137 (96.5%) |
| 65 to 74 Years | 302 (100.0%) | 320 (100.0%) |
| 75 Years and over | 60 (92.3%) | 45 (100.0%) |
| Total | 2,003 (98.8%) | 2,162 (97.9%) |
Income Below Poverty Among Married-Couple Families in Waverly
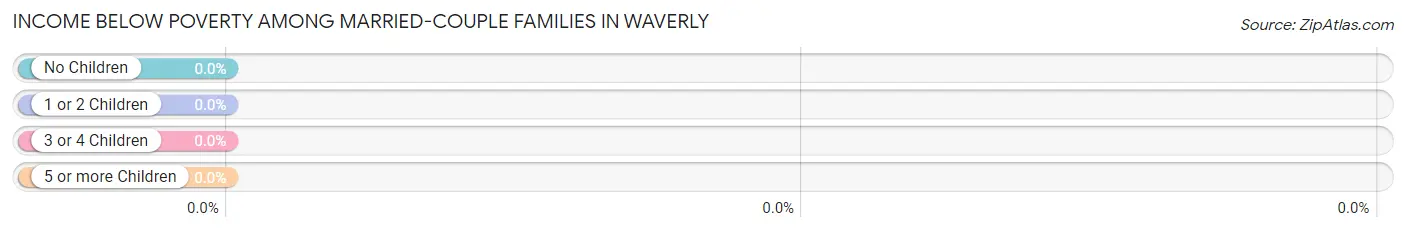
| Children | Above Poverty | Below Poverty |
| No Children | 537 (100.0%) | 0 (0.0%) |
| 1 or 2 Children | 371 (100.0%) | 0 (0.0%) |
| 3 or 4 Children | 157 (100.0%) | 0 (0.0%) |
| 5 or more Children | 15 (100.0%) | 0 (0.0%) |
| Total | 1,080 (100.0%) | 0 (0.0%) |
Income Below Poverty Among Single-Parent Households in Waverly
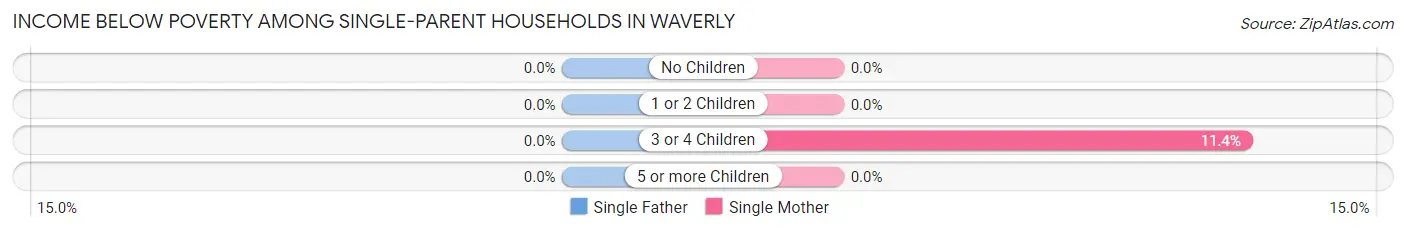
| Children | Single Father | Single Mother |
| No Children | 0 (0.0%) | 0 (0.0%) |
| 1 or 2 Children | 0 (0.0%) | 0 (0.0%) |
| 3 or 4 Children | 0 (0.0%) | 4 (11.4%) |
| 5 or more Children | 0 (0.0%) | 0 (0.0%) |
| Total | 0 (0.0%) | 4 (3.9%) |
Income Below Poverty Among Married-Couple vs Single-Parent Households in Waverly
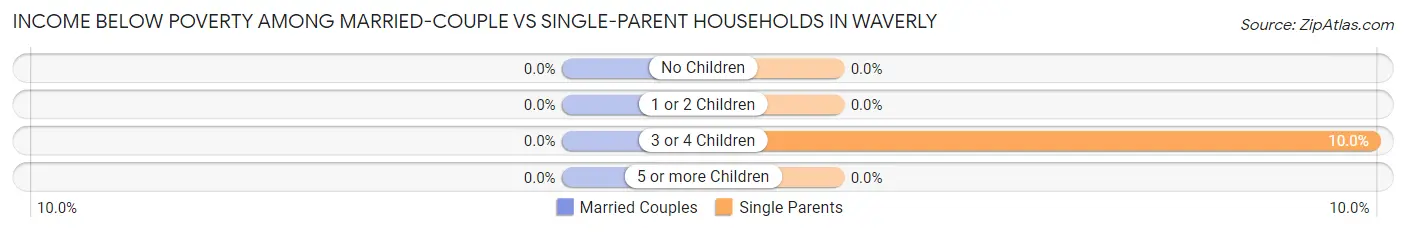
| Children | Married-Couple Families | Single-Parent Households |
| No Children | 0 (0.0%) | 0 (0.0%) |
| 1 or 2 Children | 0 (0.0%) | 0 (0.0%) |
| 3 or 4 Children | 0 (0.0%) | 4 (10.0%) |
| 5 or more Children | 0 (0.0%) | 0 (0.0%) |
| Total | 0 (0.0%) | 4 (2.1%) |
Race in Waverly
The most populous races in Waverly are White / Caucasian (4,228 | 98.6%), Hispanic or Latino (243 | 5.7%), and Two or more Races (56 | 1.3%).
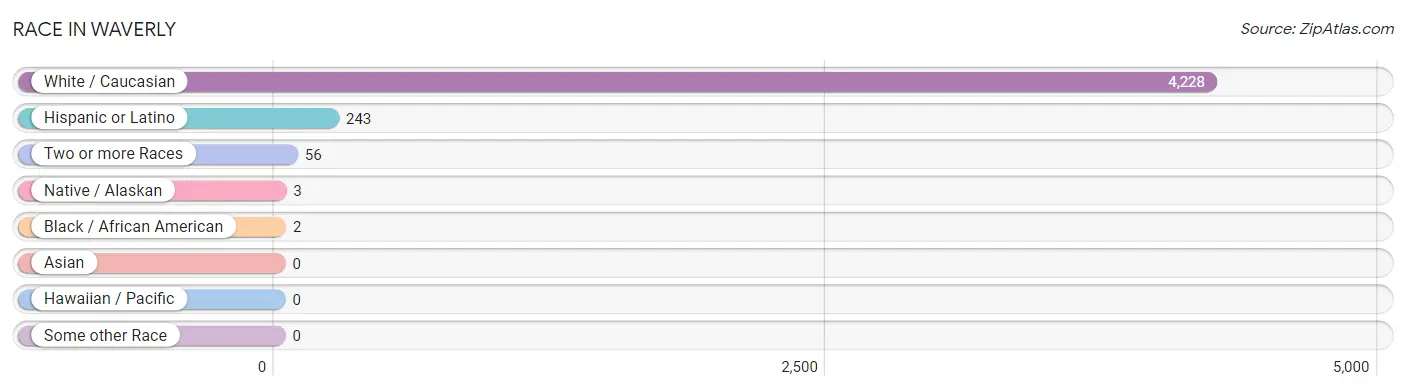
| Race | # Population | % Population |
| Asian | 0 | 0.0% |
| Black / African American | 2 | 0.1% |
| Hawaiian / Pacific | 0 | 0.0% |
| Hispanic or Latino | 243 | 5.7% |
| Native / Alaskan | 3 | 0.1% |
| White / Caucasian | 4,228 | 98.6% |
| Two or more Races | 56 | 1.3% |
| Some other Race | 0 | 0.0% |
| Total | 4,289 | 100.0% |
Ancestry in Waverly
The most populous ancestries reported in Waverly are German (1,771 | 41.3%), Irish (496 | 11.6%), Swedish (365 | 8.5%), English (278 | 6.5%), and Mexican (229 | 5.3%), together accounting for 73.2% of all Waverly residents.
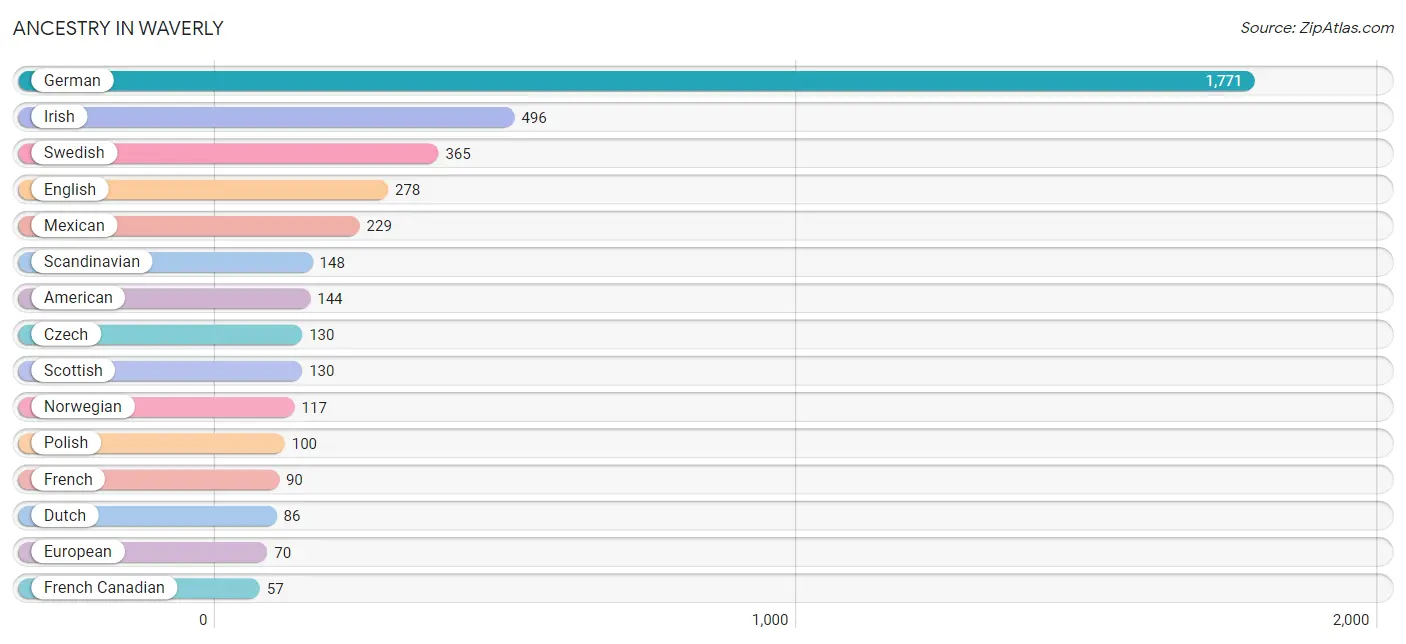
| Ancestry | # Population | % Population |
| African | 18 | 0.4% |
| American | 144 | 3.4% |
| Arab | 5 | 0.1% |
| Austrian | 52 | 1.2% |
| British | 3 | 0.1% |
| Czech | 130 | 3.0% |
| Danish | 31 | 0.7% |
| Dutch | 86 | 2.0% |
| Eastern European | 31 | 0.7% |
| English | 278 | 6.5% |
| European | 70 | 1.6% |
| French | 90 | 2.1% |
| French Canadian | 57 | 1.3% |
| German | 1,771 | 41.3% |
| Irish | 496 | 11.6% |
| Italian | 48 | 1.1% |
| Mexican | 229 | 5.3% |
| Norwegian | 117 | 2.7% |
| Polish | 100 | 2.3% |
| Russian | 6 | 0.1% |
| Scandinavian | 148 | 3.5% |
| Scotch-Irish | 20 | 0.5% |
| Scottish | 130 | 3.0% |
| Sioux | 5 | 0.1% |
| Subsaharan African | 18 | 0.4% |
| Swedish | 365 | 8.5% |
| Swiss | 21 | 0.5% |
| Syrian | 5 | 0.1% |
| Ukrainian | 4 | 0.1% |
| Welsh | 14 | 0.3% | View All 30 Rows |
Immigrants in Waverly
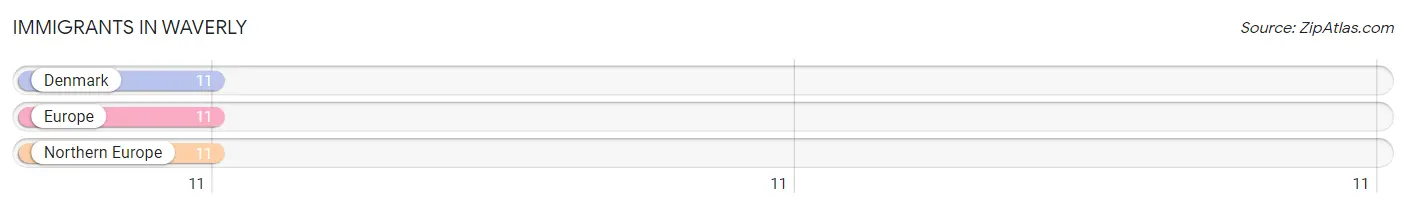
The most numerous immigrant groups reported in Waverly came from Denmark (11 | 0.3%), Europe (11 | 0.3%), and Northern Europe (11 | 0.3%), together accounting for 0.8% of all Waverly residents.
| Immigration Origin | # Population | % Population |
| Denmark | 11 | 0.3% |
| Europe | 11 | 0.3% |
| Northern Europe | 11 | 0.3% | View All 3 Rows |
Sex and Age in Waverly
Sex and Age in Waverly
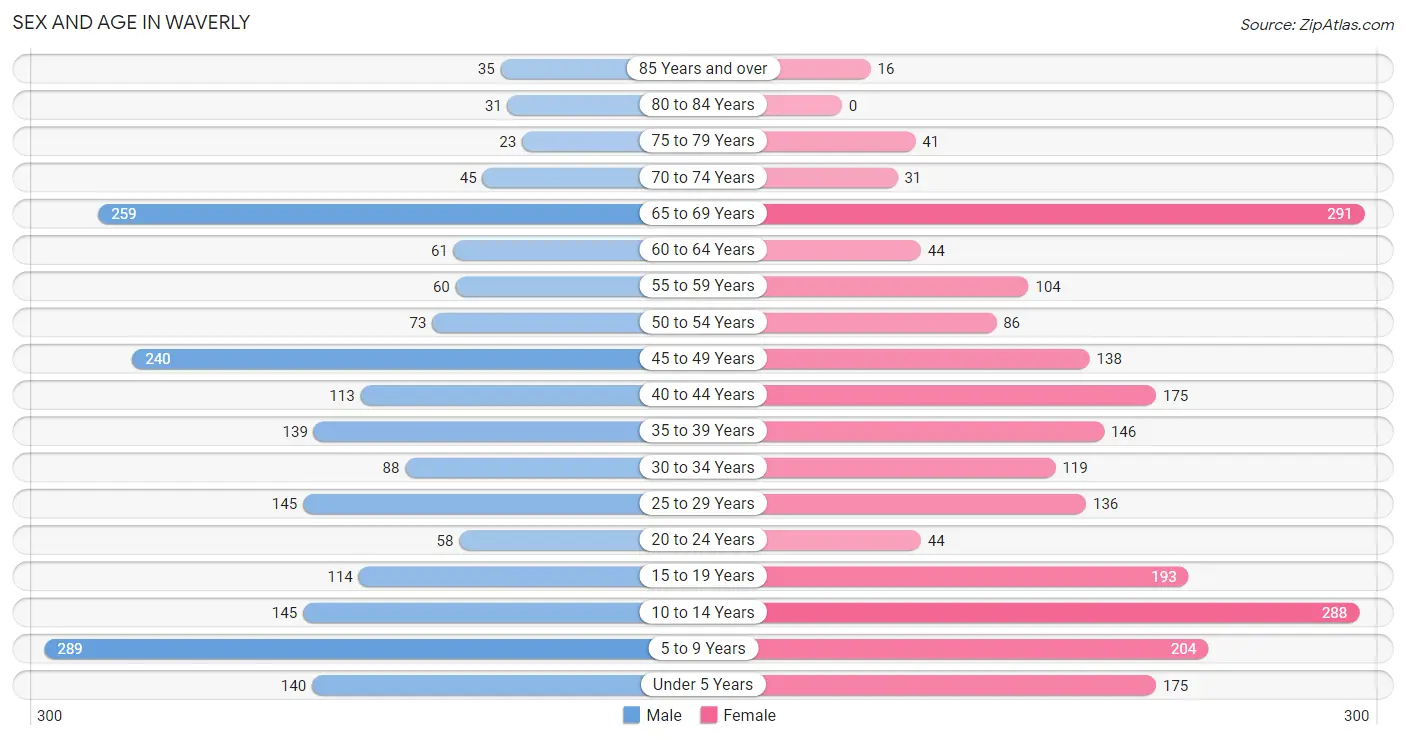
The most populous age groups in Waverly are 5 to 9 Years (289 | 14.0%) for men and 65 to 69 Years (291 | 13.0%) for women.
| Age Bracket | Male | Female |
| Under 5 Years | 140 (6.8%) | 175 (7.8%) |
| 5 to 9 Years | 289 (14.0%) | 204 (9.1%) |
| 10 to 14 Years | 145 (7.0%) | 288 (12.9%) |
| 15 to 19 Years | 114 (5.5%) | 193 (8.6%) |
| 20 to 24 Years | 58 (2.8%) | 44 (2.0%) |
| 25 to 29 Years | 145 (7.0%) | 136 (6.1%) |
| 30 to 34 Years | 88 (4.3%) | 119 (5.3%) |
| 35 to 39 Years | 139 (6.8%) | 146 (6.5%) |
| 40 to 44 Years | 113 (5.5%) | 175 (7.8%) |
| 45 to 49 Years | 240 (11.7%) | 138 (6.2%) |
| 50 to 54 Years | 73 (3.5%) | 86 (3.8%) |
| 55 to 59 Years | 60 (2.9%) | 104 (4.7%) |
| 60 to 64 Years | 61 (3.0%) | 44 (2.0%) |
| 65 to 69 Years | 259 (12.6%) | 291 (13.0%) |
| 70 to 74 Years | 45 (2.2%) | 31 (1.4%) |
| 75 to 79 Years | 23 (1.1%) | 41 (1.8%) |
| 80 to 84 Years | 31 (1.5%) | 0 (0.0%) |
| 85 Years and over | 35 (1.7%) | 16 (0.7%) |
| Total | 2,058 (100.0%) | 2,231 (100.0%) |
Families and Households in Waverly
Median Family Size in Waverly
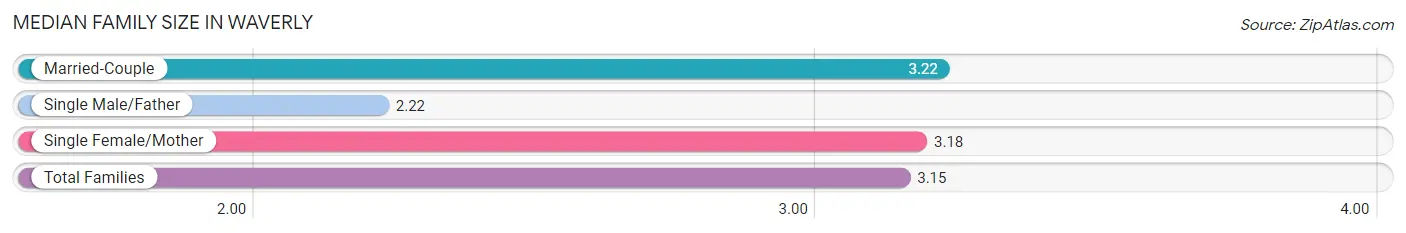
The median family size in Waverly is 3.15 persons per family, with married-couple families (1,080 | 85.0%) accounting for the largest median family size of 3.22 persons per family. On the other hand, single male/father families (88 | 6.9%) represent the smallest median family size with 2.22 persons per family.
| Family Type | # Families | Family Size |
| Married-Couple | 1,080 (85.0%) | 3.22 |
| Single Male/Father | 88 (6.9%) | 2.22 |
| Single Female/Mother | 102 (8.0%) | 3.18 |
| Total Families | 1,270 (100.0%) | 3.15 |
Median Household Size in Waverly
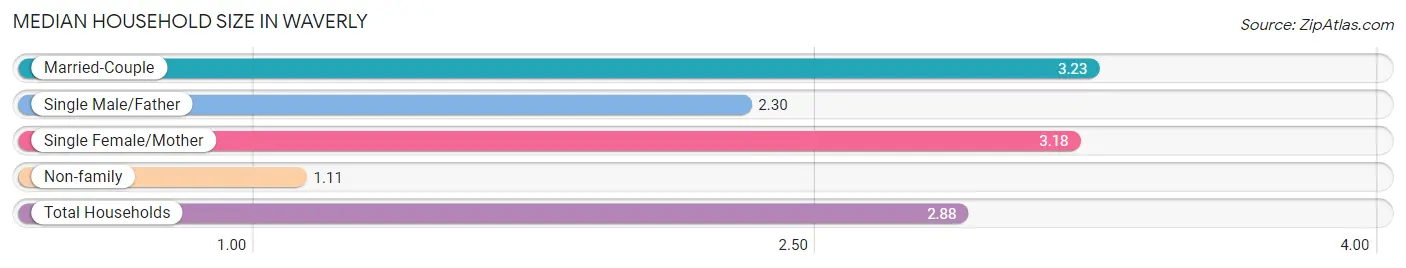
The median household size in Waverly is 2.88 persons per household, with married-couple households (1,080 | 73.4%) accounting for the largest median household size of 3.23 persons per household. non-family households (201 | 13.7%) represent the smallest median household size with 1.11 persons per household.
| Household Type | # Households | Household Size |
| Married-Couple | 1,080 (73.4%) | 3.23 |
| Single Male/Father | 88 (6.0%) | 2.30 |
| Single Female/Mother | 102 (6.9%) | 3.18 |
| Non-family | 201 (13.7%) | 1.11 |
| Total Households | 1,471 (100.0%) | 2.88 |
Household Size by Marriage Status in Waverly
Out of a total of 1,471 households in Waverly, 1,270 (86.3%) are family households, while 201 (13.7%) are nonfamily households. The most numerous type of family households are 2-person households, comprising 600, and the most common type of nonfamily households are 1-person households, comprising 175.
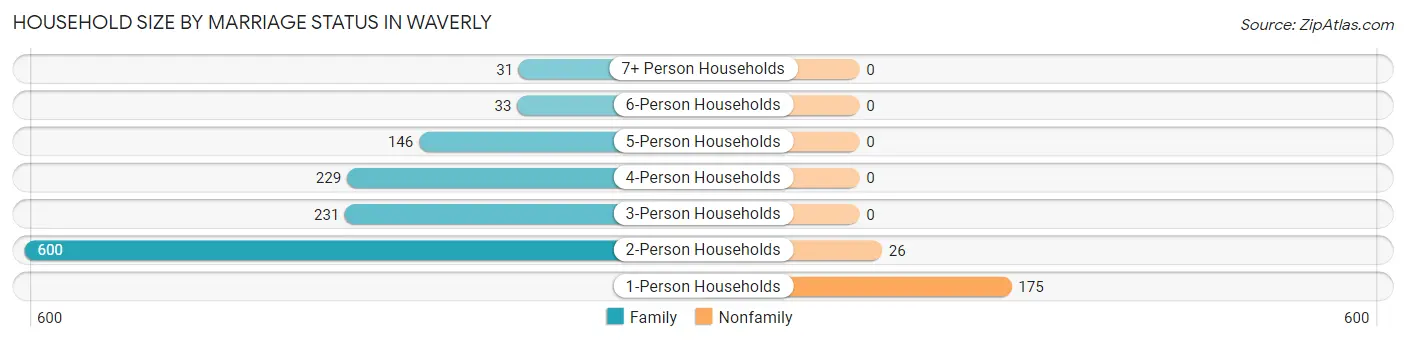
| Household Size | Family Households | Nonfamily Households |
| 1-Person Households | - | 175 (11.9%) |
| 2-Person Households | 600 (40.8%) | 26 (1.8%) |
| 3-Person Households | 231 (15.7%) | 0 (0.0%) |
| 4-Person Households | 229 (15.6%) | 0 (0.0%) |
| 5-Person Households | 146 (9.9%) | 0 (0.0%) |
| 6-Person Households | 33 (2.2%) | 0 (0.0%) |
| 7+ Person Households | 31 (2.1%) | 0 (0.0%) |
| Total | 1,270 (86.3%) | 201 (13.7%) |
Female Fertility in Waverly
Fertility by Age in Waverly
Average fertility rate in Waverly is 61.0 births per 1,000 women. Women in the age bracket of 20 to 34 years have the highest fertility rate with 154.0 births per 1,000 women. Women in the age bracket of 20 to 34 years acount for 75.4% of all women with births.
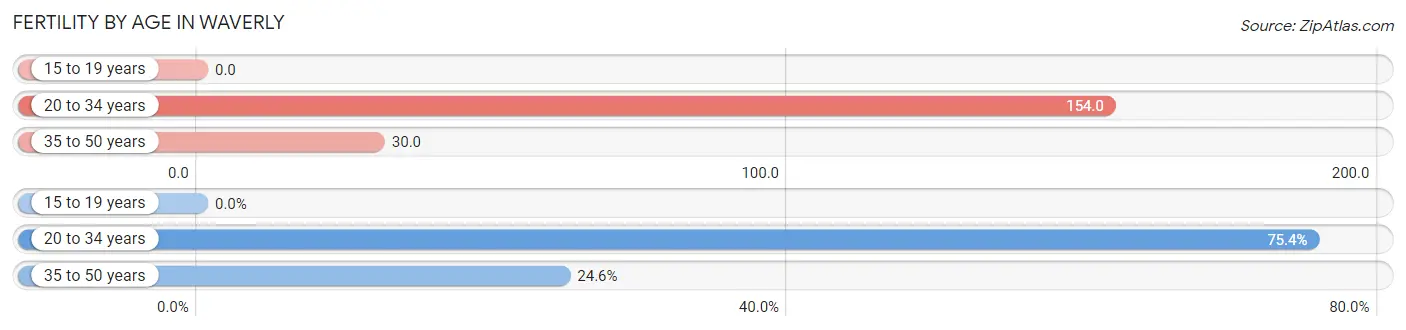
| Age Bracket | Women with Births | Births / 1,000 Women |
| 15 to 19 years | 0 (0.0%) | 0.0 |
| 20 to 34 years | 46 (75.4%) | 154.0 |
| 35 to 50 years | 15 (24.6%) | 30.0 |
| Total | 61 (100.0%) | 61.0 |
Fertility by Age by Marriage Status in Waverly
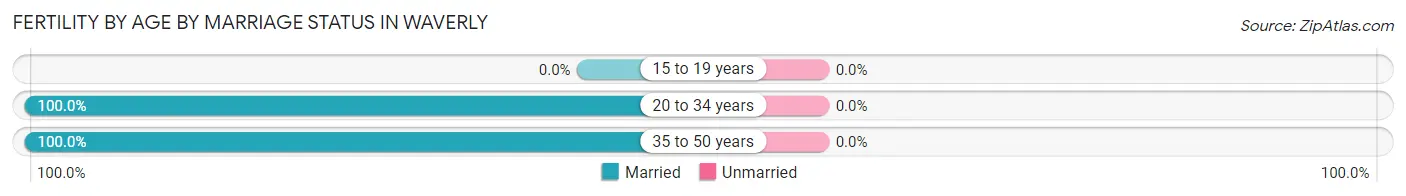
| Age Bracket | Married | Unmarried |
| 15 to 19 years | 0 (0.0%) | 0 (0.0%) |
| 20 to 34 years | 46 (100.0%) | 0 (0.0%) |
| 35 to 50 years | 15 (100.0%) | 0 (0.0%) |
| Total | 61 (100.0%) | 0 (0.0%) |
Fertility by Education in Waverly
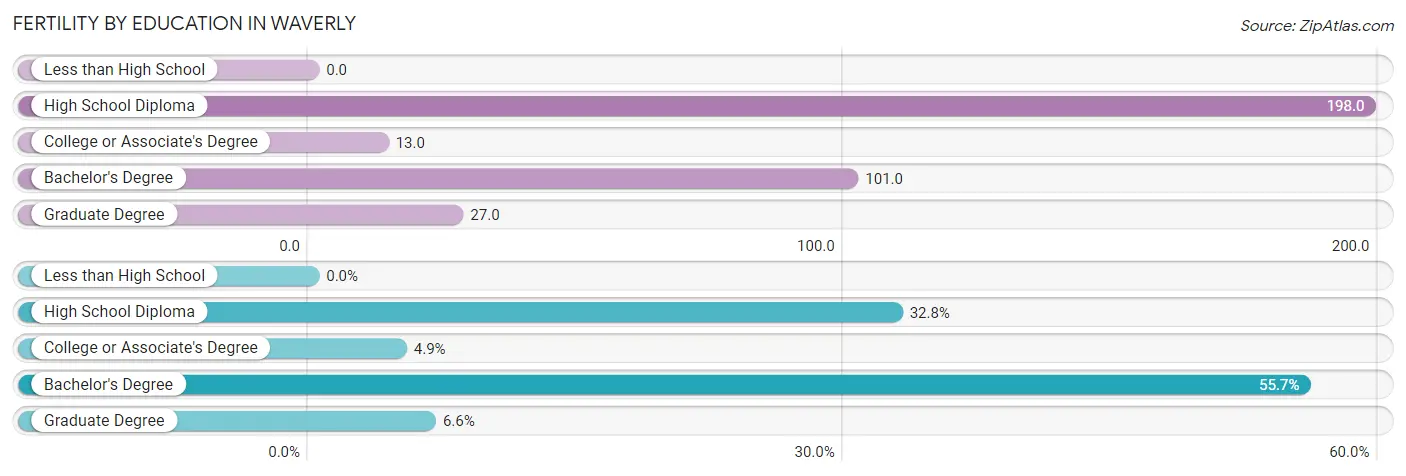
| Educational Attainment | Women with Births | Births / 1,000 Women |
| Less than High School | 0 (0.0%) | 0.0 |
| High School Diploma | 20 (32.8%) | 198.0 |
| College or Associate's Degree | 3 (4.9%) | 13.0 |
| Bachelor's Degree | 34 (55.7%) | 101.0 |
| Graduate Degree | 4 (6.6%) | 27.0 |
| Total | 61 (100.0%) | 61.0 |
Fertility by Education by Marriage Status in Waverly
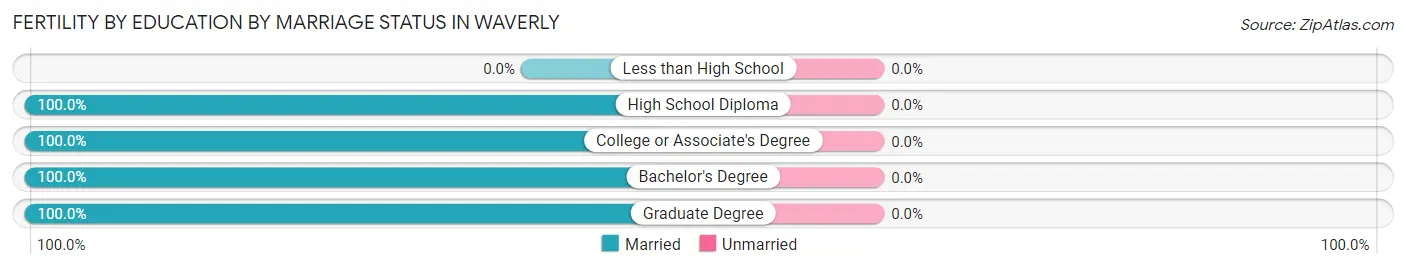
| Educational Attainment | Married | Unmarried |
| Less than High School | 0 (0.0%) | 0 (0.0%) |
| High School Diploma | 20 (100.0%) | 0 (0.0%) |
| College or Associate's Degree | 3 (100.0%) | 0 (0.0%) |
| Bachelor's Degree | 34 (100.0%) | 0 (0.0%) |
| Graduate Degree | 4 (100.0%) | 0 (0.0%) |
| Total | 61 (100.0%) | 0 (0.0%) |
Employment Characteristics in Waverly
Employment by Class of Employer in Waverly
Among the 1,982 employed individuals in Waverly, private company employees (1,273 | 64.2%), state government employees (158 | 8.0%), and local government employees (155 | 7.8%) make up the most common classes of employment.
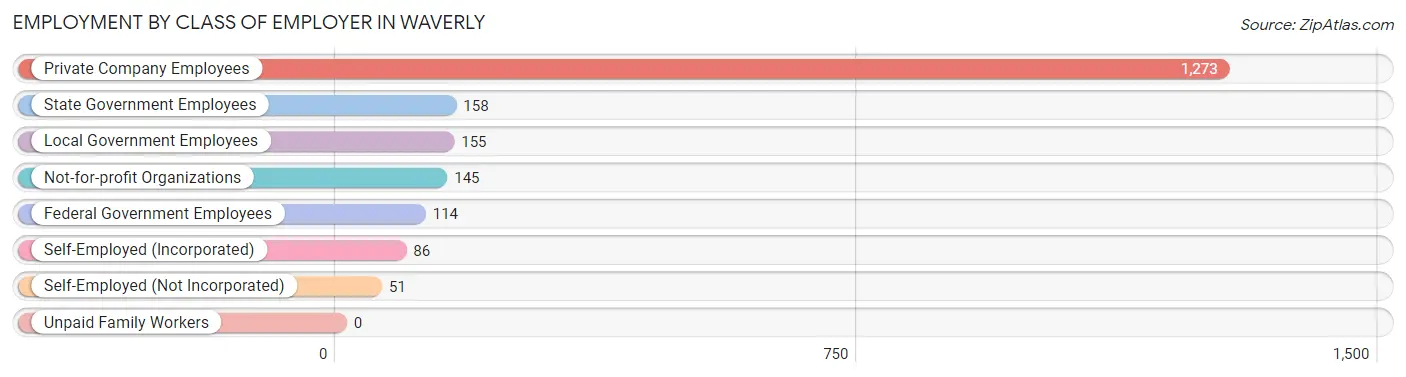
| Employer Class | # Employees | % Employees |
| Private Company Employees | 1,273 | 64.2% |
| Self-Employed (Incorporated) | 86 | 4.3% |
| Self-Employed (Not Incorporated) | 51 | 2.6% |
| Not-for-profit Organizations | 145 | 7.3% |
| Local Government Employees | 155 | 7.8% |
| State Government Employees | 158 | 8.0% |
| Federal Government Employees | 114 | 5.8% |
| Unpaid Family Workers | 0 | 0.0% |
| Total | 1,982 | 100.0% |
Employment Status by Age in Waverly
According to the labor force statistics for Waverly, out of the total population over 16 years of age (2,920), 68.2% or 1,991 individuals are in the labor force, with 0.3% or 6 of them unemployed. The age group with the highest labor force participation rate is 20 to 24 years, with 100.0% or 102 individuals in the labor force. Within the labor force, the 55 to 59 years age range has the highest percentage of unemployed individuals, with 3.7% or 5 of them being unemployed.
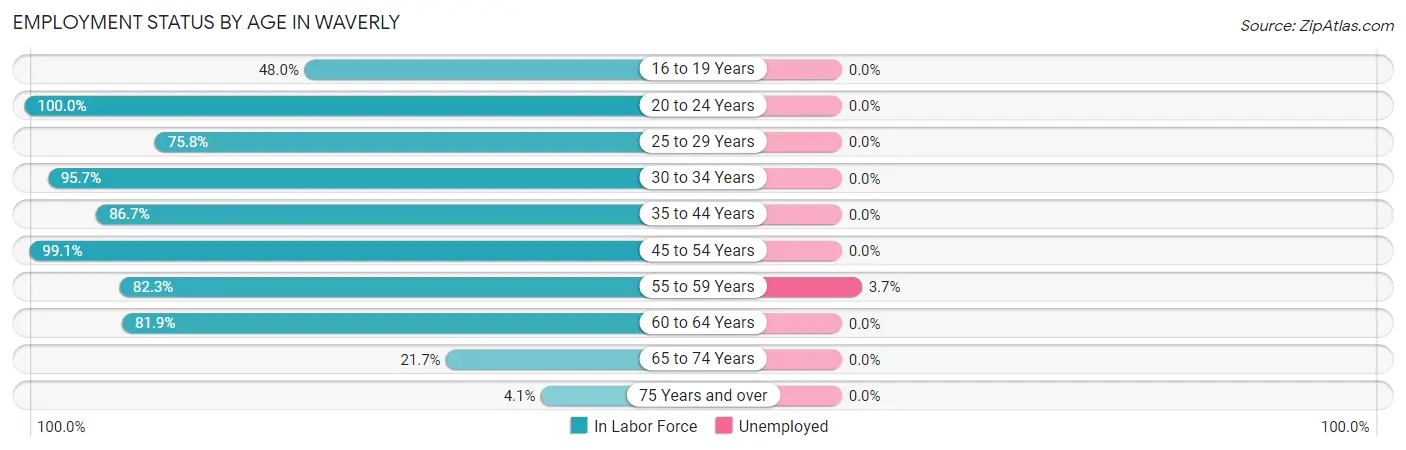
| Age Bracket | In Labor Force | Unemployed |
| 16 to 19 Years | 86 (48.0%) | 0 (0.0%) |
| 20 to 24 Years | 102 (100.0%) | 0 (0.0%) |
| 25 to 29 Years | 213 (75.8%) | 0 (0.0%) |
| 30 to 34 Years | 198 (95.7%) | 0 (0.0%) |
| 35 to 44 Years | 497 (86.7%) | 0 (0.0%) |
| 45 to 54 Years | 532 (99.1%) | 0 (0.0%) |
| 55 to 59 Years | 135 (82.3%) | 5 (3.7%) |
| 60 to 64 Years | 86 (81.9%) | 0 (0.0%) |
| 65 to 74 Years | 136 (21.7%) | 0 (0.0%) |
| 75 Years and over | 6 (4.1%) | 0 (0.0%) |
| Total | 1,991 (68.2%) | 6 (0.3%) |
Employment Status by Educational Attainment in Waverly
According to labor force statistics for Waverly, 89.0% of individuals (1,662) out of the total population between 25 and 64 years of age (1,867) are in the labor force, with 0.3% or 5 of them being unemployed. The group with the highest labor force participation rate are those with the educational attainment of bachelor's degree or higher, with 96.2% or 817 individuals in the labor force. Within the labor force, individuals with college / associate degree education have the highest percentage of unemployment, with 0.9% or 5 of them being unemployed.
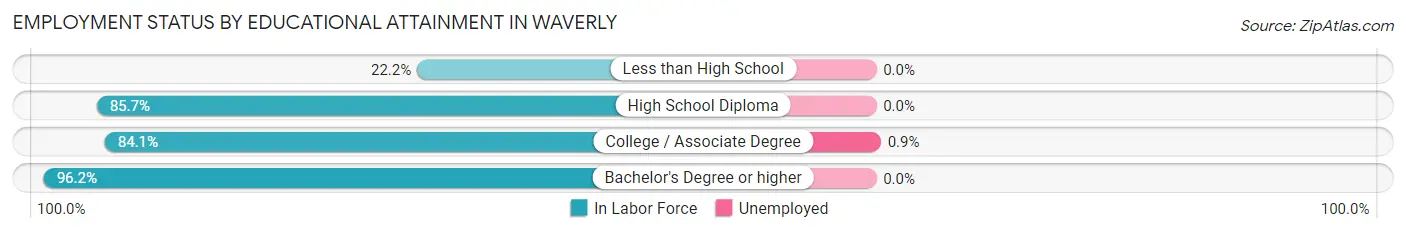
| Educational Attainment | In Labor Force | Unemployed |
| Less than High School | 6 (22.2%) | 0 (0.0%) |
| High School Diploma | 258 (85.7%) | 0 (0.0%) |
| College / Associate Degree | 580 (84.1%) | 6 (0.9%) |
| Bachelor's Degree or higher | 817 (96.2%) | 0 (0.0%) |
| Total | 1,662 (89.0%) | 6 (0.3%) |
Employment Occupations by Sex in Waverly
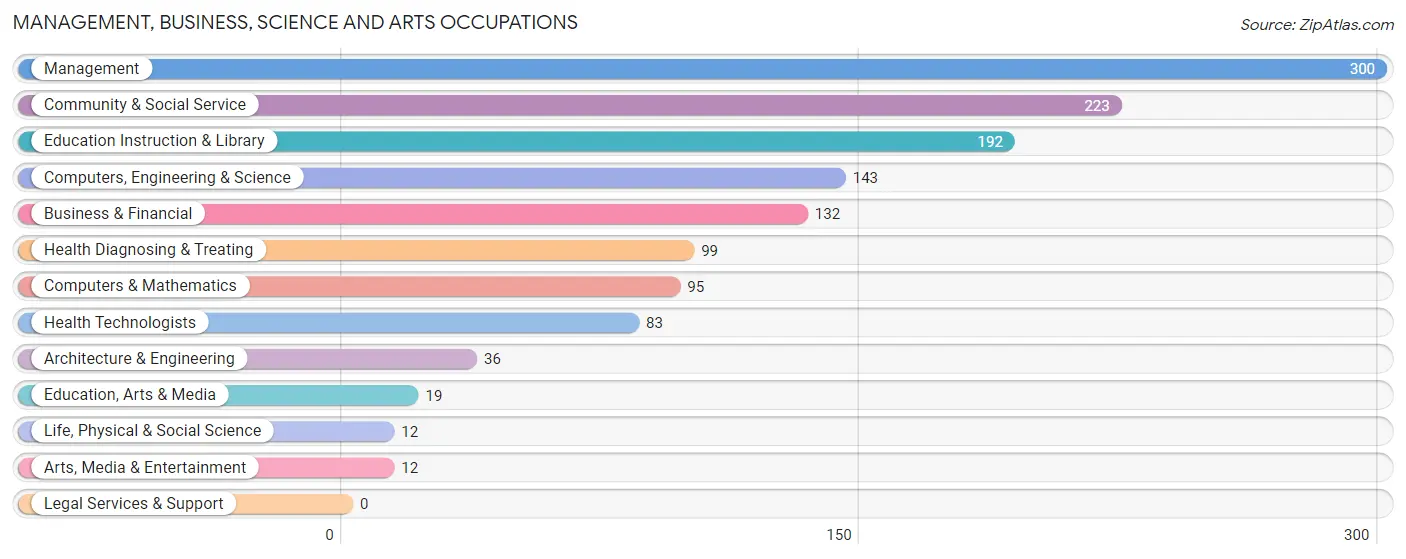
Management, Business, Science and Arts Occupations
The most common Management, Business, Science and Arts occupations in Waverly are Management (300 | 15.5%), Community & Social Service (223 | 11.5%), Education Instruction & Library (192 | 9.9%), Computers, Engineering & Science (143 | 7.4%), and Business & Financial (132 | 6.8%).
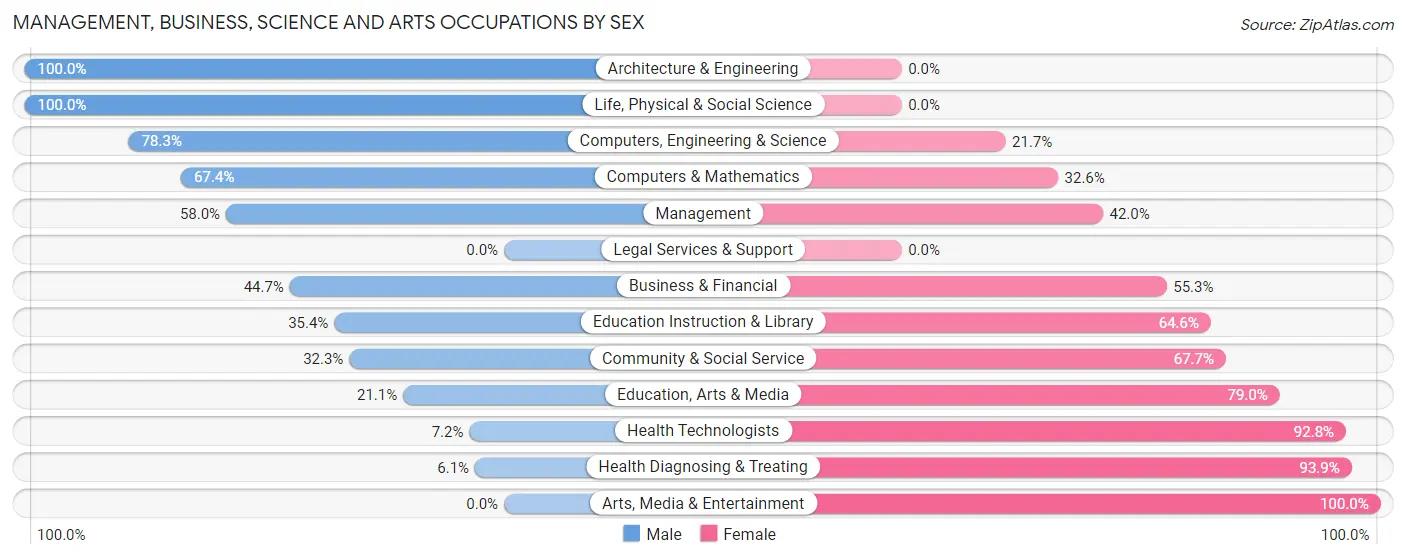
Management, Business, Science and Arts Occupations by Sex
Within the Management, Business, Science and Arts occupations in Waverly, the most male-oriented occupations are Architecture & Engineering (100.0%), Life, Physical & Social Science (100.0%), and Computers, Engineering & Science (78.3%), while the most female-oriented occupations are Arts, Media & Entertainment (100.0%), Health Diagnosing & Treating (93.9%), and Health Technologists (92.8%).
| Occupation | Male | Female |
| Management | 174 (58.0%) | 126 (42.0%) |
| Business & Financial | 59 (44.7%) | 73 (55.3%) |
| Computers, Engineering & Science | 112 (78.3%) | 31 (21.7%) |
| Computers & Mathematics | 64 (67.4%) | 31 (32.6%) |
| Architecture & Engineering | 36 (100.0%) | 0 (0.0%) |
| Life, Physical & Social Science | 12 (100.0%) | 0 (0.0%) |
| Community & Social Service | 72 (32.3%) | 151 (67.7%) |
| Education, Arts & Media | 4 (21.0%) | 15 (78.9%) |
| Legal Services & Support | 0 (0.0%) | 0 (0.0%) |
| Education Instruction & Library | 68 (35.4%) | 124 (64.6%) |
| Arts, Media & Entertainment | 0 (0.0%) | 12 (100.0%) |
| Health Diagnosing & Treating | 6 (6.1%) | 93 (93.9%) |
| Health Technologists | 6 (7.2%) | 77 (92.8%) |
| Total (Category) | 423 (47.2%) | 474 (52.8%) |
| Total (Overall) | 1,001 (51.6%) | 937 (48.3%) |
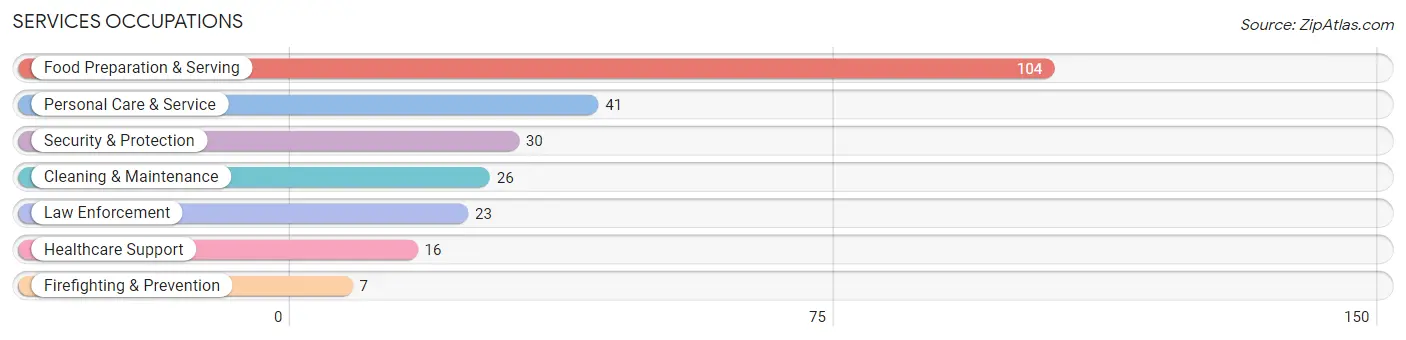
Services Occupations
The most common Services occupations in Waverly are Food Preparation & Serving (104 | 5.4%), Personal Care & Service (41 | 2.1%), Security & Protection (30 | 1.5%), Cleaning & Maintenance (26 | 1.3%), and Law Enforcement (23 | 1.2%).
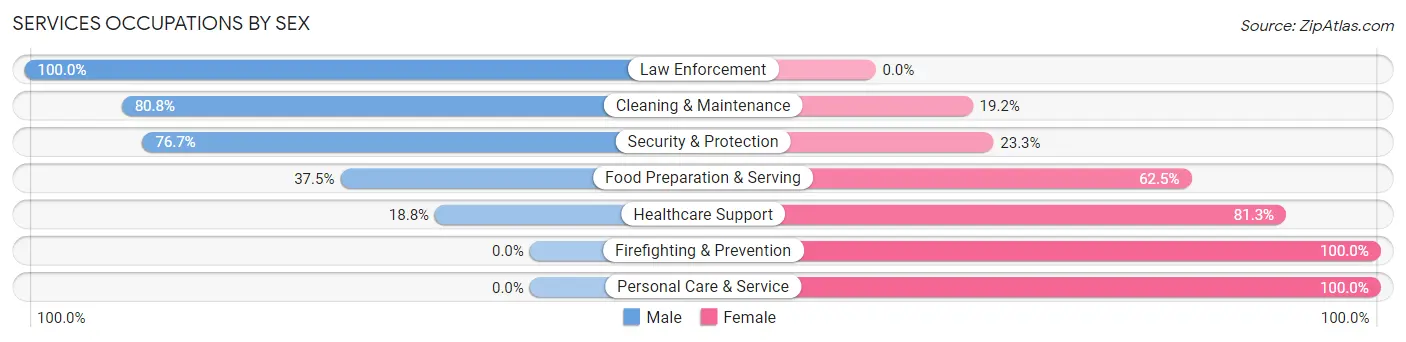
Services Occupations by Sex
Within the Services occupations in Waverly, the most male-oriented occupations are Law Enforcement (100.0%), Cleaning & Maintenance (80.8%), and Security & Protection (76.7%), while the most female-oriented occupations are Firefighting & Prevention (100.0%), Personal Care & Service (100.0%), and Healthcare Support (81.2%).
| Occupation | Male | Female |
| Healthcare Support | 3 (18.8%) | 13 (81.2%) |
| Security & Protection | 23 (76.7%) | 7 (23.3%) |
| Firefighting & Prevention | 0 (0.0%) | 7 (100.0%) |
| Law Enforcement | 23 (100.0%) | 0 (0.0%) |
| Food Preparation & Serving | 39 (37.5%) | 65 (62.5%) |
| Cleaning & Maintenance | 21 (80.8%) | 5 (19.2%) |
| Personal Care & Service | 0 (0.0%) | 41 (100.0%) |
| Total (Category) | 86 (39.6%) | 131 (60.4%) |
| Total (Overall) | 1,001 (51.6%) | 937 (48.3%) |
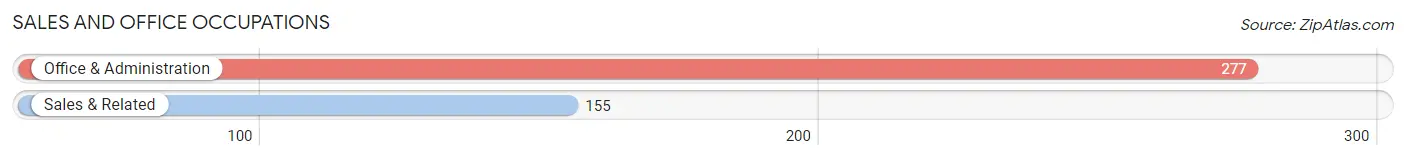
Sales and Office Occupations
The most common Sales and Office occupations in Waverly are Office & Administration (277 | 14.3%), and Sales & Related (155 | 8.0%).
Sales and Office Occupations by Sex
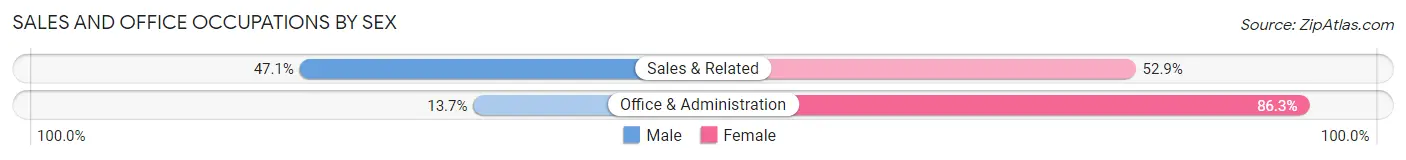
| Occupation | Male | Female |
| Sales & Related | 73 (47.1%) | 82 (52.9%) |
| Office & Administration | 38 (13.7%) | 239 (86.3%) |
| Total (Category) | 111 (25.7%) | 321 (74.3%) |
| Total (Overall) | 1,001 (51.6%) | 937 (48.3%) |
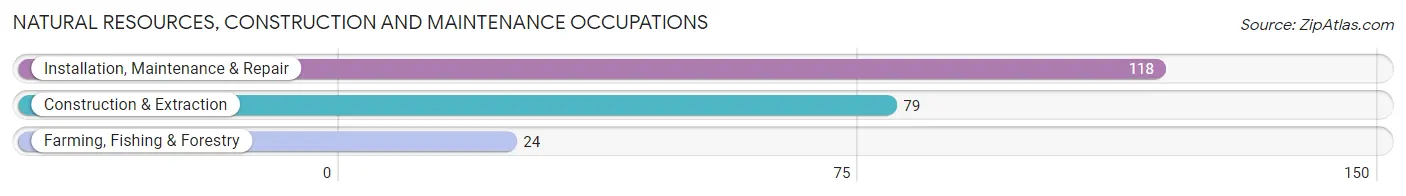
Natural Resources, Construction and Maintenance Occupations
The most common Natural Resources, Construction and Maintenance occupations in Waverly are Installation, Maintenance & Repair (118 | 6.1%), Construction & Extraction (79 | 4.1%), and Farming, Fishing & Forestry (24 | 1.2%).
Natural Resources, Construction and Maintenance Occupations by Sex
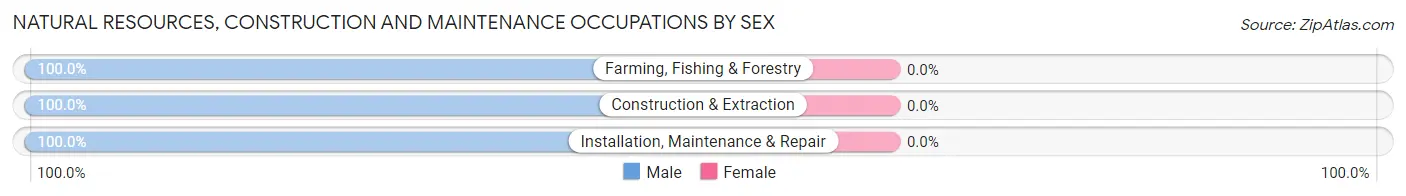
| Occupation | Male | Female |
| Farming, Fishing & Forestry | 24 (100.0%) | 0 (0.0%) |
| Construction & Extraction | 79 (100.0%) | 0 (0.0%) |
| Installation, Maintenance & Repair | 118 (100.0%) | 0 (0.0%) |
| Total (Category) | 221 (100.0%) | 0 (0.0%) |
| Total (Overall) | 1,001 (51.6%) | 937 (48.3%) |
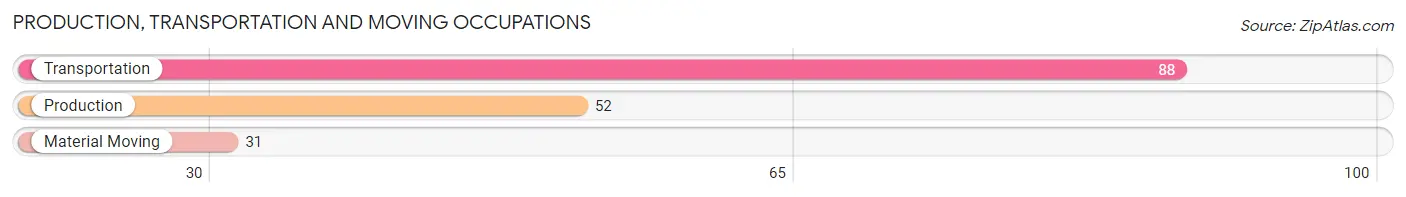
Production, Transportation and Moving Occupations
The most common Production, Transportation and Moving occupations in Waverly are Transportation (88 | 4.5%), Production (52 | 2.7%), and Material Moving (31 | 1.6%).
Production, Transportation and Moving Occupations by Sex
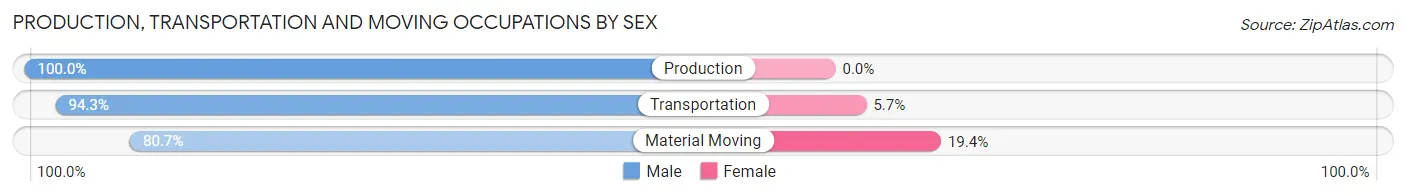
| Occupation | Male | Female |
| Production | 52 (100.0%) | 0 (0.0%) |
| Transportation | 83 (94.3%) | 5 (5.7%) |
| Material Moving | 25 (80.6%) | 6 (19.4%) |
| Total (Category) | 160 (93.6%) | 11 (6.4%) |
| Total (Overall) | 1,001 (51.6%) | 937 (48.3%) |
Employment Industries by Sex in Waverly
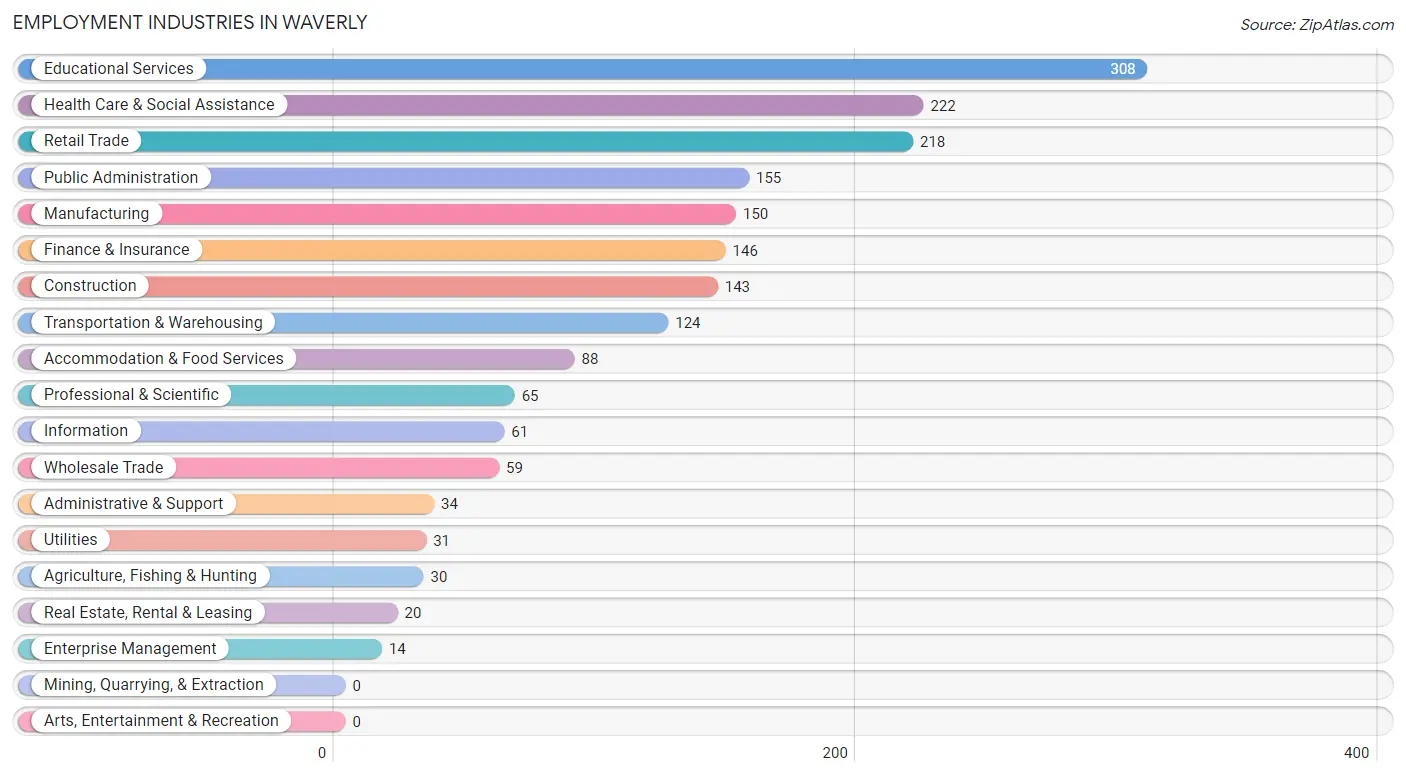
Employment Industries in Waverly
The major employment industries in Waverly include Educational Services (308 | 15.9%), Health Care & Social Assistance (222 | 11.5%), Retail Trade (218 | 11.3%), Public Administration (155 | 8.0%), and Manufacturing (150 | 7.7%).
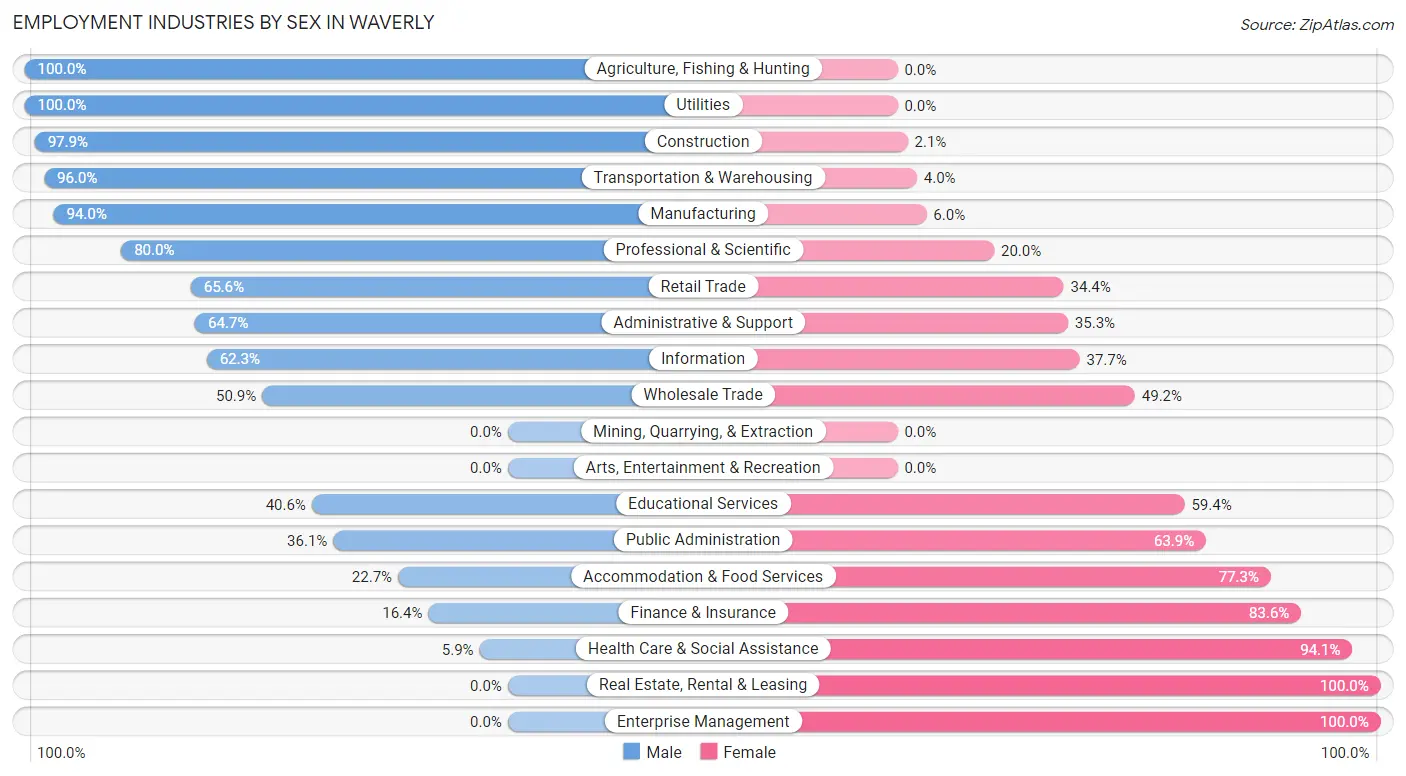
Employment Industries by Sex in Waverly
The Waverly industries that see more men than women are Agriculture, Fishing & Hunting (100.0%), Utilities (100.0%), and Construction (97.9%), whereas the industries that tend to have a higher number of women are Real Estate, Rental & Leasing (100.0%), Enterprise Management (100.0%), and Health Care & Social Assistance (94.1%).
| Industry | Male | Female |
| Agriculture, Fishing & Hunting | 30 (100.0%) | 0 (0.0%) |
| Mining, Quarrying, & Extraction | 0 (0.0%) | 0 (0.0%) |
| Construction | 140 (97.9%) | 3 (2.1%) |
| Manufacturing | 141 (94.0%) | 9 (6.0%) |
| Wholesale Trade | 30 (50.8%) | 29 (49.1%) |
| Retail Trade | 143 (65.6%) | 75 (34.4%) |
| Transportation & Warehousing | 119 (96.0%) | 5 (4.0%) |
| Utilities | 31 (100.0%) | 0 (0.0%) |
| Information | 38 (62.3%) | 23 (37.7%) |
| Finance & Insurance | 24 (16.4%) | 122 (83.6%) |
| Real Estate, Rental & Leasing | 0 (0.0%) | 20 (100.0%) |
| Professional & Scientific | 52 (80.0%) | 13 (20.0%) |
| Enterprise Management | 0 (0.0%) | 14 (100.0%) |
| Administrative & Support | 22 (64.7%) | 12 (35.3%) |
| Educational Services | 125 (40.6%) | 183 (59.4%) |
| Health Care & Social Assistance | 13 (5.9%) | 209 (94.1%) |
| Arts, Entertainment & Recreation | 0 (0.0%) | 0 (0.0%) |
| Accommodation & Food Services | 20 (22.7%) | 68 (77.3%) |
| Public Administration | 56 (36.1%) | 99 (63.9%) |
| Total | 1,001 (51.6%) | 937 (48.3%) |
Education in Waverly
School Enrollment in Waverly
The most common levels of schooling among the 1,403 students in Waverly are high school (341 | 24.3%), middle school (310 | 22.1%), and elementary school (290 | 20.7%).
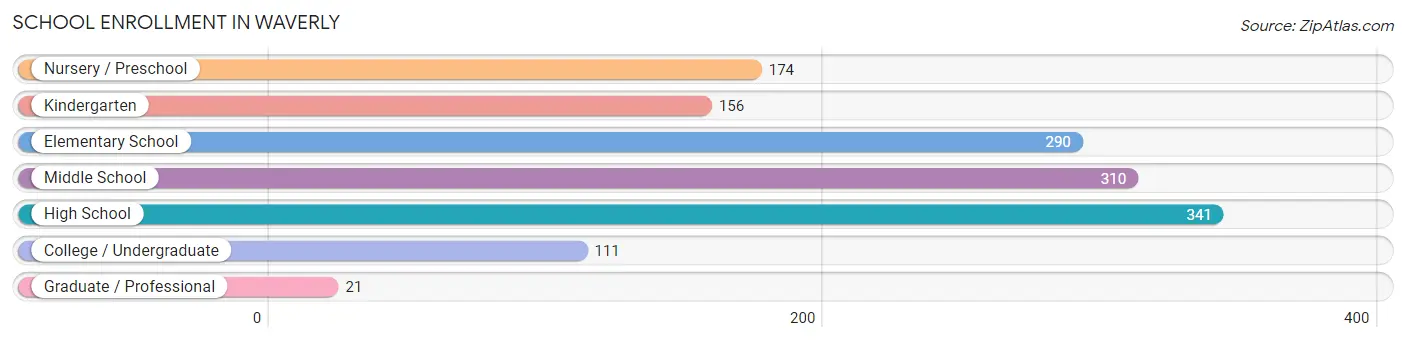
| School Level | # Students | % Students |
| Nursery / Preschool | 174 | 12.4% |
| Kindergarten | 156 | 11.1% |
| Elementary School | 290 | 20.7% |
| Middle School | 310 | 22.1% |
| High School | 341 | 24.3% |
| College / Undergraduate | 111 | 7.9% |
| Graduate / Professional | 21 | 1.5% |
| Total | 1,403 | 100.0% |
School Enrollment by Age by Funding Source in Waverly
Out of a total of 1,403 students who are enrolled in schools in Waverly, 236 (16.8%) attend a private institution, while the remaining 1,167 (83.2%) are enrolled in public schools. The age group of 3 to 4 year olds has the highest likelihood of being enrolled in private schools, with 29 (41.4% in the age bracket) enrolled. Conversely, the age group of 15 to 17 year olds has the lowest likelihood of being enrolled in a private school, with 217 (100.0% in the age bracket) attending a public institution.
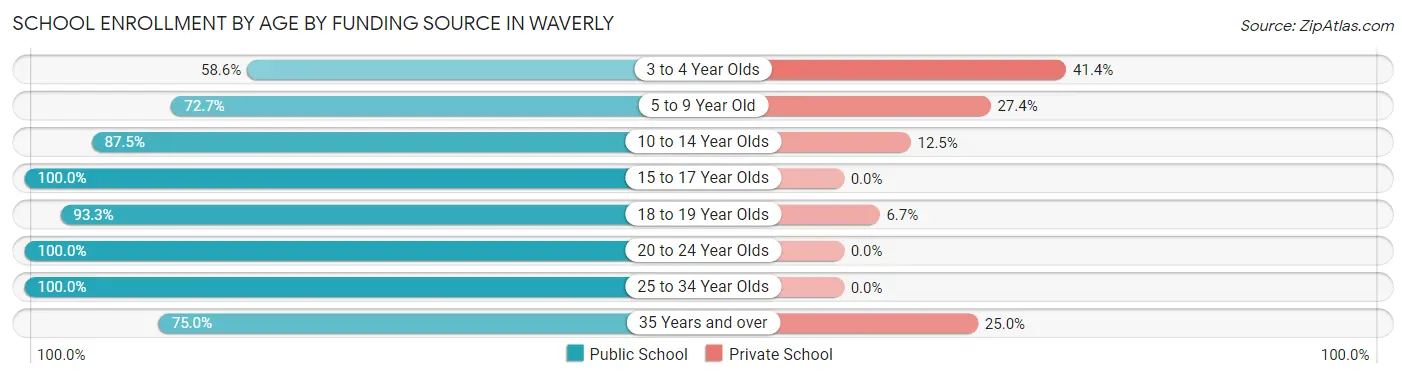
| Age Bracket | Public School | Private School |
| 3 to 4 Year Olds | 41 (58.6%) | 29 (41.4%) |
| 5 to 9 Year Old | 356 (72.7%) | 134 (27.4%) |
| 10 to 14 Year Olds | 379 (87.5%) | 54 (12.5%) |
| 15 to 17 Year Olds | 217 (100.0%) | 0 (0.0%) |
| 18 to 19 Year Olds | 84 (93.3%) | 6 (6.7%) |
| 20 to 24 Year Olds | 23 (100.0%) | 0 (0.0%) |
| 25 to 34 Year Olds | 28 (100.0%) | 0 (0.0%) |
| 35 Years and over | 39 (75.0%) | 13 (25.0%) |
| Total | 1,167 (83.2%) | 236 (16.8%) |
Educational Attainment by Field of Study in Waverly
Business (223 | 20.3%), education (177 | 16.2%), arts & humanities (147 | 13.4%), bio, nature & agricultural (129 | 11.8%), and science & technology (94 | 8.6%) are the most common fields of study among 1,096 individuals in Waverly who have obtained a bachelor's degree or higher.
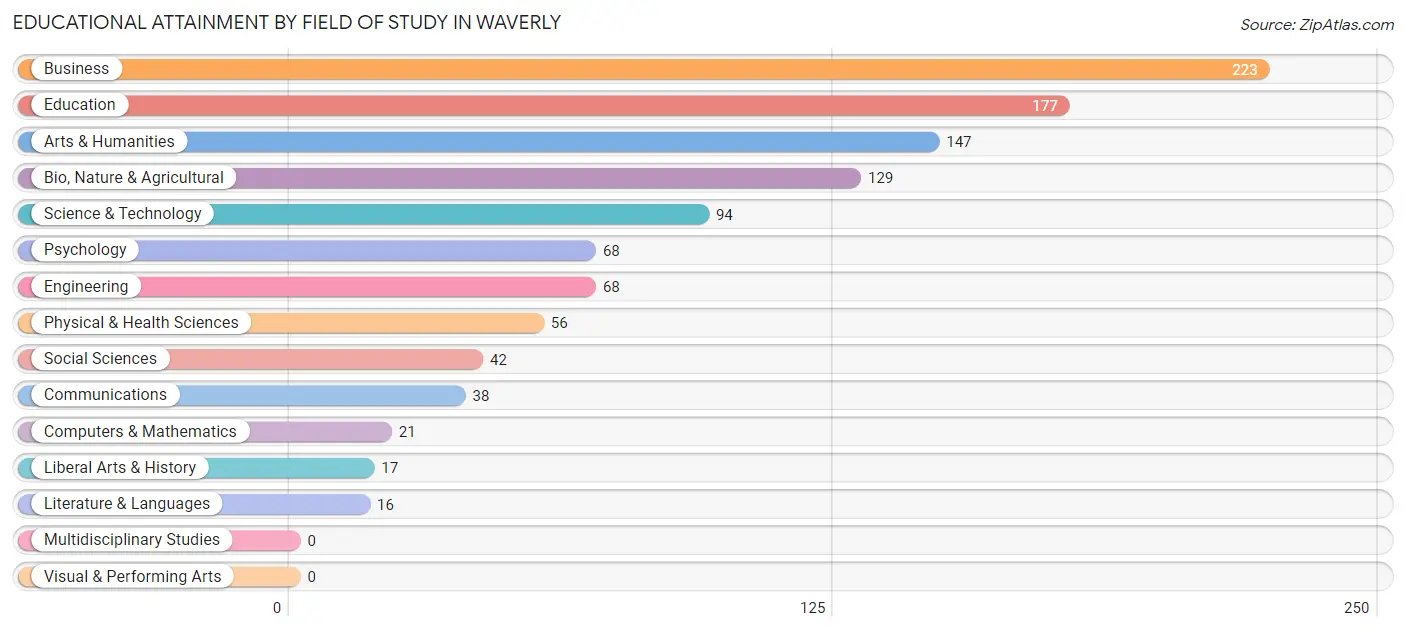
| Field of Study | # Graduates | % Graduates |
| Computers & Mathematics | 21 | 1.9% |
| Bio, Nature & Agricultural | 129 | 11.8% |
| Physical & Health Sciences | 56 | 5.1% |
| Psychology | 68 | 6.2% |
| Social Sciences | 42 | 3.8% |
| Engineering | 68 | 6.2% |
| Multidisciplinary Studies | 0 | 0.0% |
| Science & Technology | 94 | 8.6% |
| Business | 223 | 20.3% |
| Education | 177 | 16.2% |
| Literature & Languages | 16 | 1.5% |
| Liberal Arts & History | 17 | 1.5% |
| Visual & Performing Arts | 0 | 0.0% |
| Communications | 38 | 3.5% |
| Arts & Humanities | 147 | 13.4% |
| Total | 1,096 | 100.0% |
Transportation & Commute in Waverly
Vehicle Availability by Sex in Waverly
The most prevalent vehicle ownership categories in Waverly are males with 2 vehicles (450, accounting for 42.9%) and females with 2 vehicles (384, making up 48.2%).
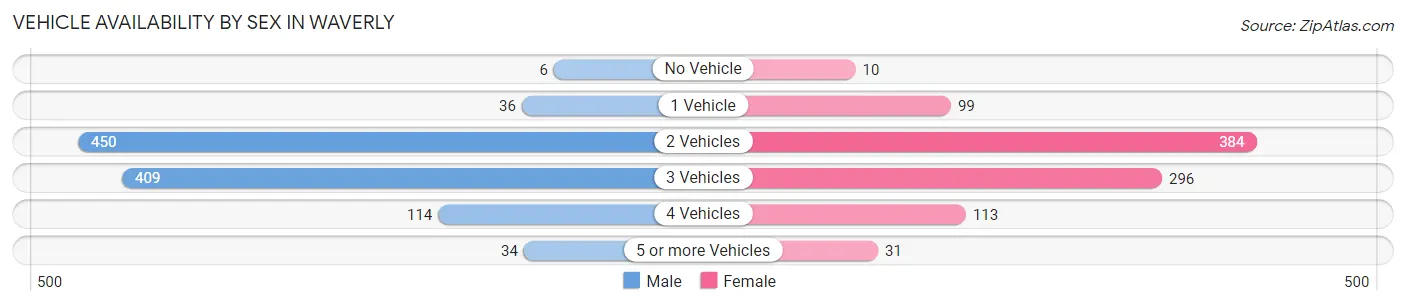
| Vehicles Available | Male | Female |
| No Vehicle | 6 (0.6%) | 10 (1.1%) |
| 1 Vehicle | 36 (3.4%) | 99 (10.6%) |
| 2 Vehicles | 450 (42.9%) | 384 (41.2%) |
| 3 Vehicles | 409 (39.0%) | 296 (31.7%) |
| 4 Vehicles | 114 (10.9%) | 113 (12.1%) |
| 5 or more Vehicles | 34 (3.2%) | 31 (3.3%) |
| Total | 1,049 (100.0%) | 933 (100.0%) |
Commute Time in Waverly
The most frequently occuring commute durations in Waverly are 20 to 24 minutes (646 commuters, 35.4%), 15 to 19 minutes (195 commuters, 10.7%), and 25 to 29 minutes (194 commuters, 10.6%).
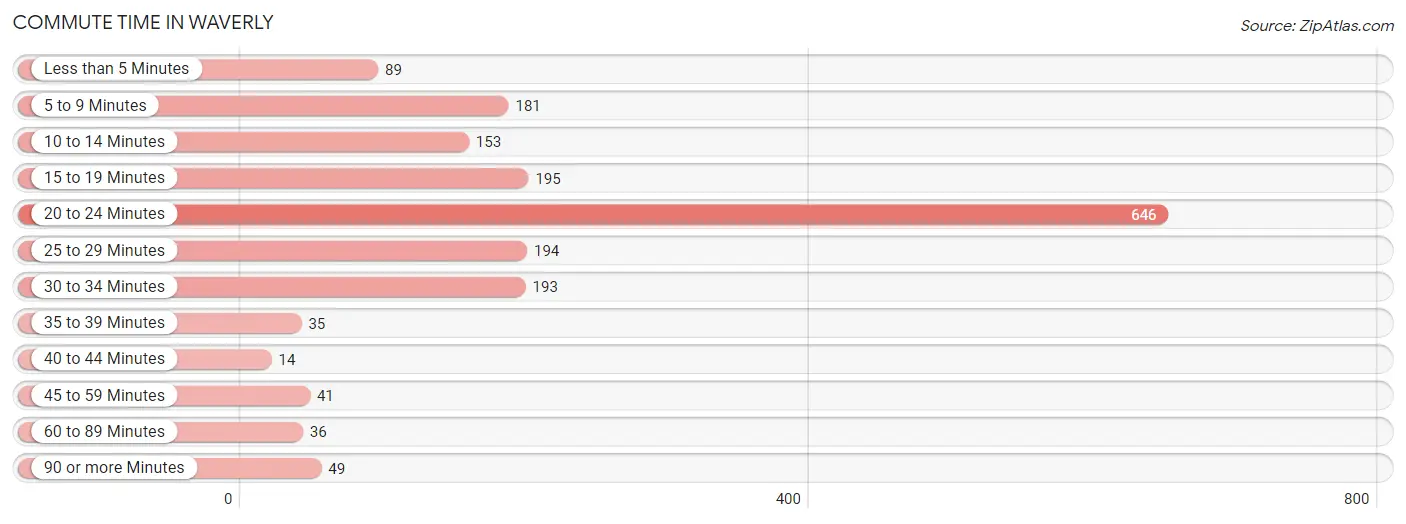
| Commute Time | # Commuters | % Commuters |
| Less than 5 Minutes | 89 | 4.9% |
| 5 to 9 Minutes | 181 | 9.9% |
| 10 to 14 Minutes | 153 | 8.4% |
| 15 to 19 Minutes | 195 | 10.7% |
| 20 to 24 Minutes | 646 | 35.4% |
| 25 to 29 Minutes | 194 | 10.6% |
| 30 to 34 Minutes | 193 | 10.6% |
| 35 to 39 Minutes | 35 | 1.9% |
| 40 to 44 Minutes | 14 | 0.8% |
| 45 to 59 Minutes | 41 | 2.2% |
| 60 to 89 Minutes | 36 | 2.0% |
| 90 or more Minutes | 49 | 2.7% |
Commute Time by Sex in Waverly
The most common commute times in Waverly are 20 to 24 minutes (411 commuters, 40.5%) for males and 20 to 24 minutes (235 commuters, 29.0%) for females.
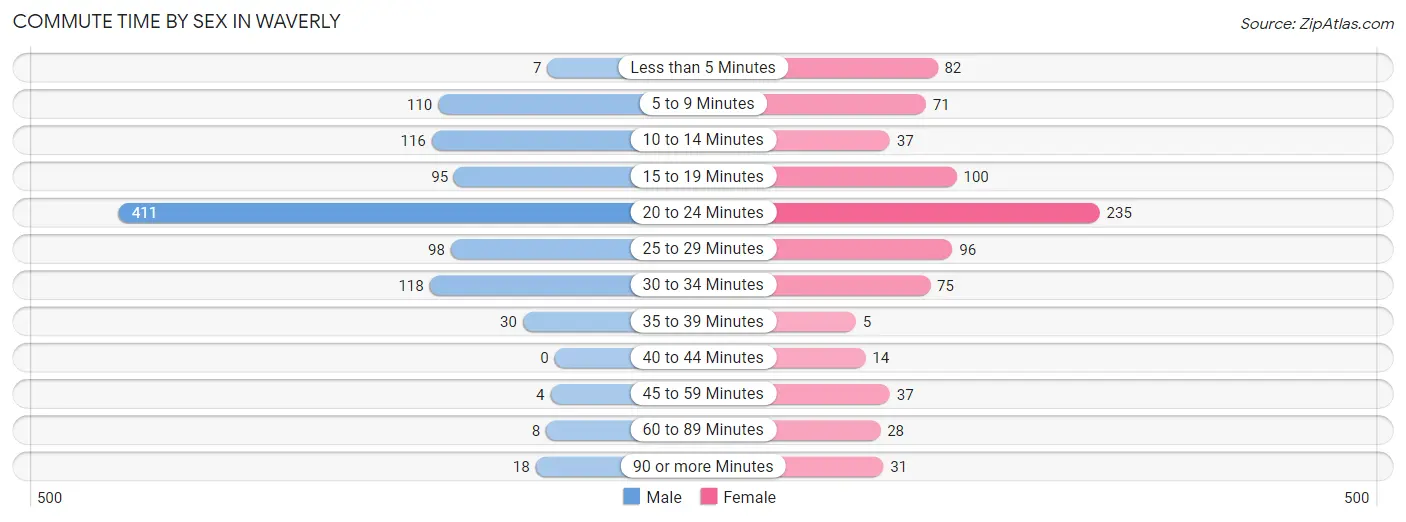
| Commute Time | Male | Female |
| Less than 5 Minutes | 7 (0.7%) | 82 (10.1%) |
| 5 to 9 Minutes | 110 (10.8%) | 71 (8.7%) |
| 10 to 14 Minutes | 116 (11.4%) | 37 (4.6%) |
| 15 to 19 Minutes | 95 (9.4%) | 100 (12.3%) |
| 20 to 24 Minutes | 411 (40.5%) | 235 (29.0%) |
| 25 to 29 Minutes | 98 (9.7%) | 96 (11.8%) |
| 30 to 34 Minutes | 118 (11.6%) | 75 (9.2%) |
| 35 to 39 Minutes | 30 (3.0%) | 5 (0.6%) |
| 40 to 44 Minutes | 0 (0.0%) | 14 (1.7%) |
| 45 to 59 Minutes | 4 (0.4%) | 37 (4.6%) |
| 60 to 89 Minutes | 8 (0.8%) | 28 (3.5%) |
| 90 or more Minutes | 18 (1.8%) | 31 (3.8%) |
Time of Departure to Work by Sex in Waverly
The most frequent times of departure to work in Waverly are 6:30 AM to 6:59 AM (225, 22.2%) for males and 7:00 AM to 7:29 AM (188, 23.2%) for females.
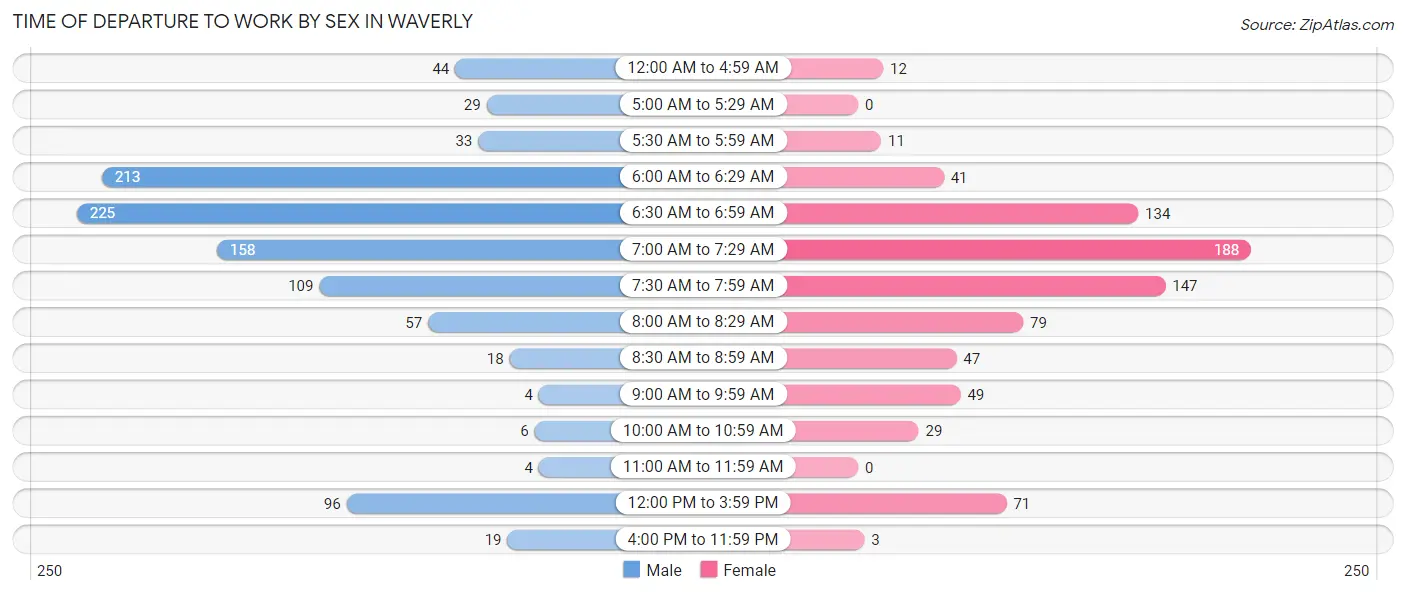
| Time of Departure | Male | Female |
| 12:00 AM to 4:59 AM | 44 (4.3%) | 12 (1.5%) |
| 5:00 AM to 5:29 AM | 29 (2.9%) | 0 (0.0%) |
| 5:30 AM to 5:59 AM | 33 (3.3%) | 11 (1.4%) |
| 6:00 AM to 6:29 AM | 213 (21.0%) | 41 (5.1%) |
| 6:30 AM to 6:59 AM | 225 (22.2%) | 134 (16.5%) |
| 7:00 AM to 7:29 AM | 158 (15.6%) | 188 (23.2%) |
| 7:30 AM to 7:59 AM | 109 (10.7%) | 147 (18.1%) |
| 8:00 AM to 8:29 AM | 57 (5.6%) | 79 (9.7%) |
| 8:30 AM to 8:59 AM | 18 (1.8%) | 47 (5.8%) |
| 9:00 AM to 9:59 AM | 4 (0.4%) | 49 (6.0%) |
| 10:00 AM to 10:59 AM | 6 (0.6%) | 29 (3.6%) |
| 11:00 AM to 11:59 AM | 4 (0.4%) | 0 (0.0%) |
| 12:00 PM to 3:59 PM | 96 (9.5%) | 71 (8.7%) |
| 4:00 PM to 11:59 PM | 19 (1.9%) | 3 (0.4%) |
| Total | 1,015 (100.0%) | 811 (100.0%) |
Housing Occupancy in Waverly
Occupancy by Ownership in Waverly
Of the total 1,471 dwellings in Waverly, owner-occupied units account for 1,211 (82.3%), while renter-occupied units make up 260 (17.7%).
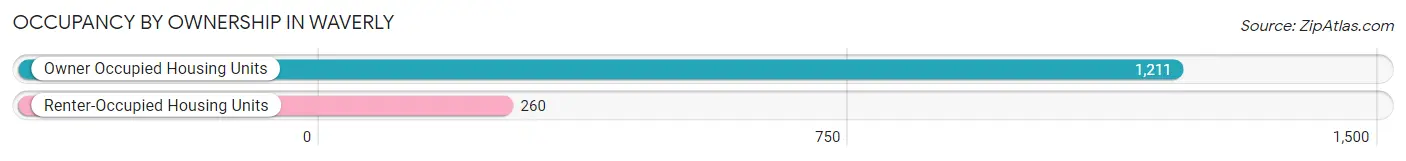
| Occupancy | # Housing Units | % Housing Units |
| Owner Occupied Housing Units | 1,211 | 82.3% |
| Renter-Occupied Housing Units | 260 | 17.7% |
| Total Occupied Housing Units | 1,471 | 100.0% |
Occupancy by Household Size in Waverly
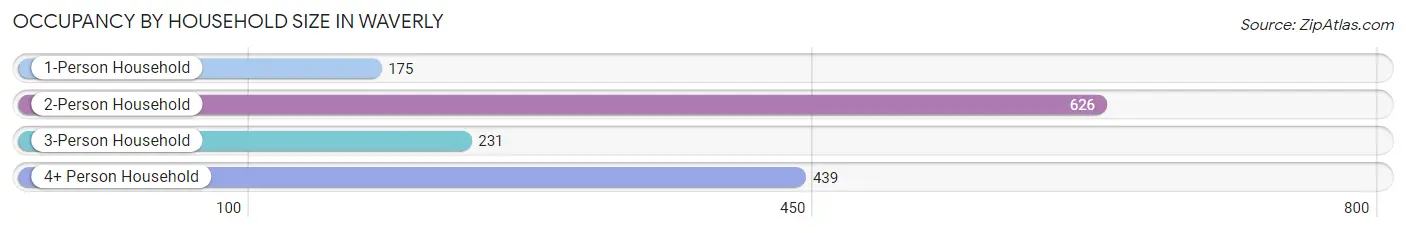
| Household Size | # Housing Units | % Housing Units |
| 1-Person Household | 175 | 11.9% |
| 2-Person Household | 626 | 42.6% |
| 3-Person Household | 231 | 15.7% |
| 4+ Person Household | 439 | 29.8% |
| Total Housing Units | 1,471 | 100.0% |
Occupancy by Ownership by Household Size in Waverly
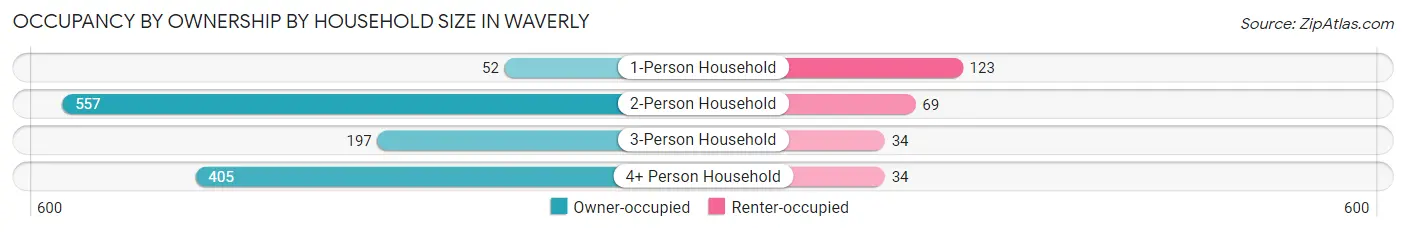
| Household Size | Owner-occupied | Renter-occupied |
| 1-Person Household | 52 (29.7%) | 123 (70.3%) |
| 2-Person Household | 557 (89.0%) | 69 (11.0%) |
| 3-Person Household | 197 (85.3%) | 34 (14.7%) |
| 4+ Person Household | 405 (92.3%) | 34 (7.7%) |
| Total Housing Units | 1,211 (82.3%) | 260 (17.7%) |
Occupancy by Educational Attainment in Waverly
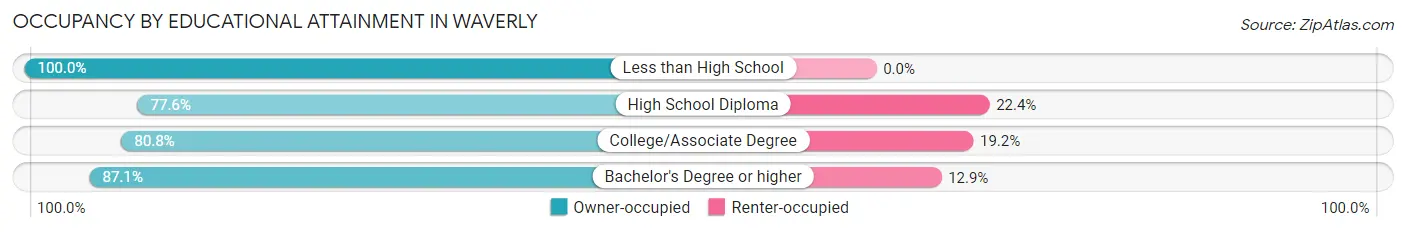
| Household Size | Owner-occupied | Renter-occupied |
| Less than High School | 5 (100.0%) | 0 (0.0%) |
| High School Diploma | 322 (77.6%) | 93 (22.4%) |
| College/Associate Degree | 404 (80.8%) | 96 (19.2%) |
| Bachelor's Degree or higher | 480 (87.1%) | 71 (12.9%) |
Occupancy by Age of Householder in Waverly
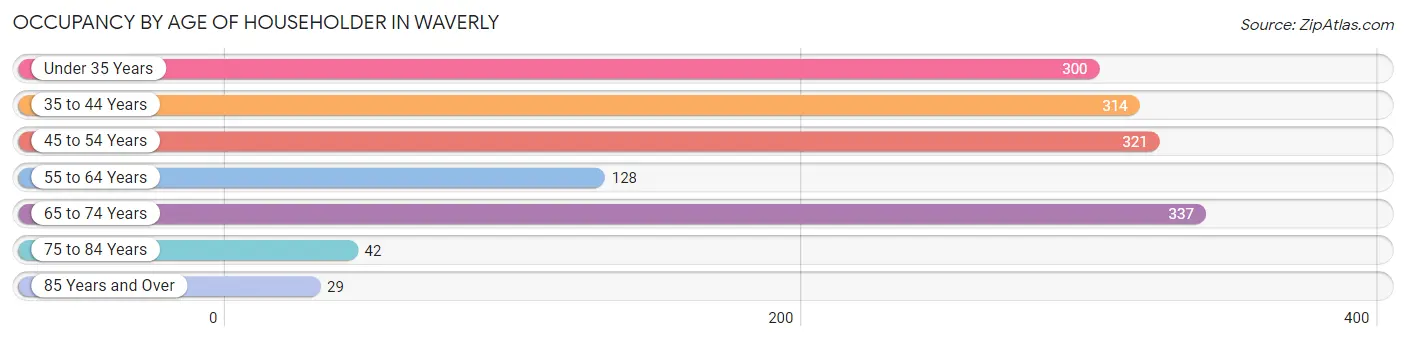
| Age Bracket | # Households | % Households |
| Under 35 Years | 300 | 20.4% |
| 35 to 44 Years | 314 | 21.3% |
| 45 to 54 Years | 321 | 21.8% |
| 55 to 64 Years | 128 | 8.7% |
| 65 to 74 Years | 337 | 22.9% |
| 75 to 84 Years | 42 | 2.9% |
| 85 Years and Over | 29 | 2.0% |
| Total | 1,471 | 100.0% |
Housing Finances in Waverly
Median Income by Occupancy in Waverly
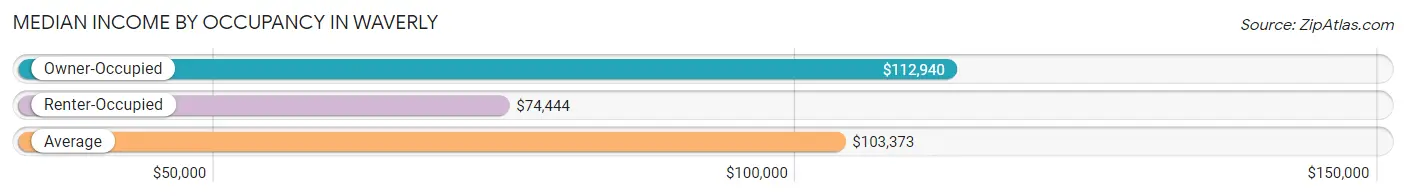
| Occupancy Type | # Households | Median Income |
| Owner-Occupied | 1,211 (82.3%) | $112,940 |
| Renter-Occupied | 260 (17.7%) | $74,444 |
| Average | 1,471 (100.0%) | $103,373 |
Occupancy by Householder Income Bracket in Waverly
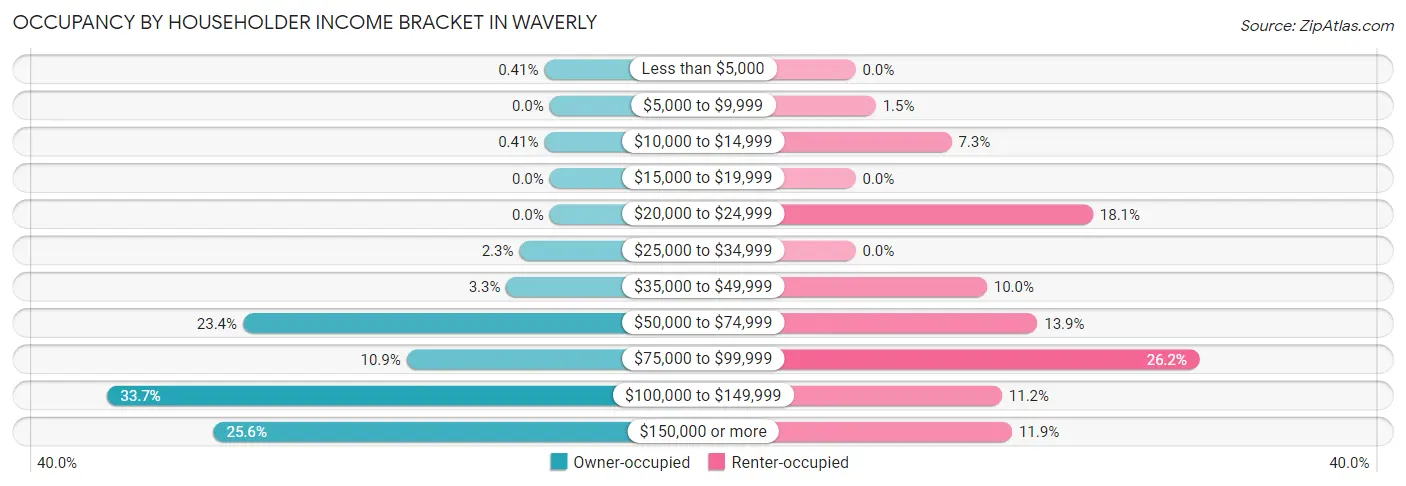
| Income Bracket | Owner-occupied | Renter-occupied |
| Less than $5,000 | 5 (0.4%) | 0 (0.0%) |
| $5,000 to $9,999 | 0 (0.0%) | 4 (1.5%) |
| $10,000 to $14,999 | 5 (0.4%) | 19 (7.3%) |
| $15,000 to $19,999 | 0 (0.0%) | 0 (0.0%) |
| $20,000 to $24,999 | 0 (0.0%) | 47 (18.1%) |
| $25,000 to $34,999 | 28 (2.3%) | 0 (0.0%) |
| $35,000 to $49,999 | 40 (3.3%) | 26 (10.0%) |
| $50,000 to $74,999 | 283 (23.4%) | 36 (13.9%) |
| $75,000 to $99,999 | 132 (10.9%) | 68 (26.2%) |
| $100,000 to $149,999 | 408 (33.7%) | 29 (11.2%) |
| $150,000 or more | 310 (25.6%) | 31 (11.9%) |
| Total | 1,211 (100.0%) | 260 (100.0%) |
Monthly Housing Cost Tiers in Waverly
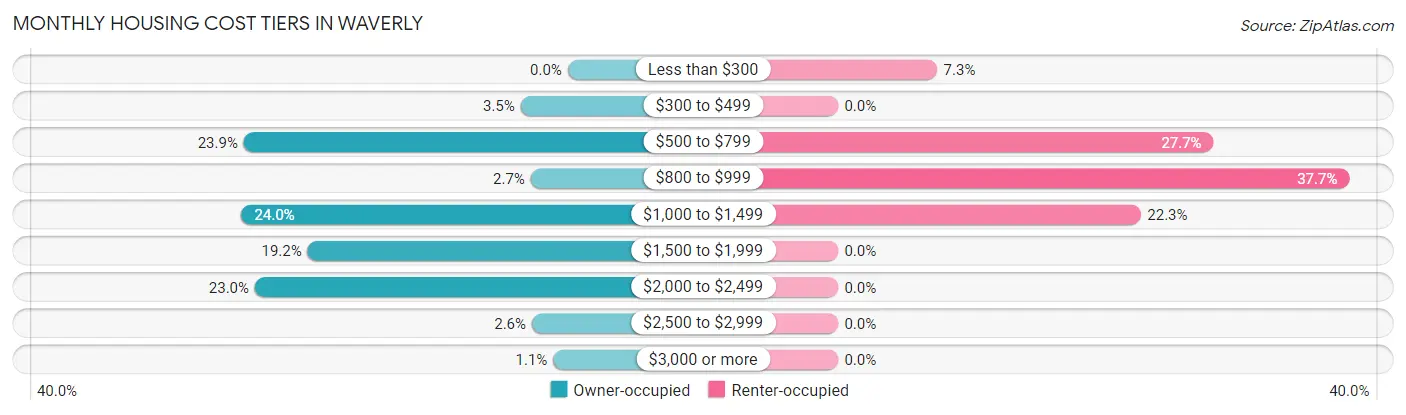
| Monthly Cost | Owner-occupied | Renter-occupied |
| Less than $300 | 0 (0.0%) | 19 (7.3%) |
| $300 to $499 | 42 (3.5%) | 0 (0.0%) |
| $500 to $799 | 289 (23.9%) | 72 (27.7%) |
| $800 to $999 | 33 (2.7%) | 98 (37.7%) |
| $1,000 to $1,499 | 291 (24.0%) | 58 (22.3%) |
| $1,500 to $1,999 | 232 (19.2%) | 0 (0.0%) |
| $2,000 to $2,499 | 279 (23.0%) | 0 (0.0%) |
| $2,500 to $2,999 | 32 (2.6%) | 0 (0.0%) |
| $3,000 or more | 13 (1.1%) | 0 (0.0%) |
| Total | 1,211 (100.0%) | 260 (100.0%) |
Physical Housing Characteristics in Waverly
Housing Structures in Waverly
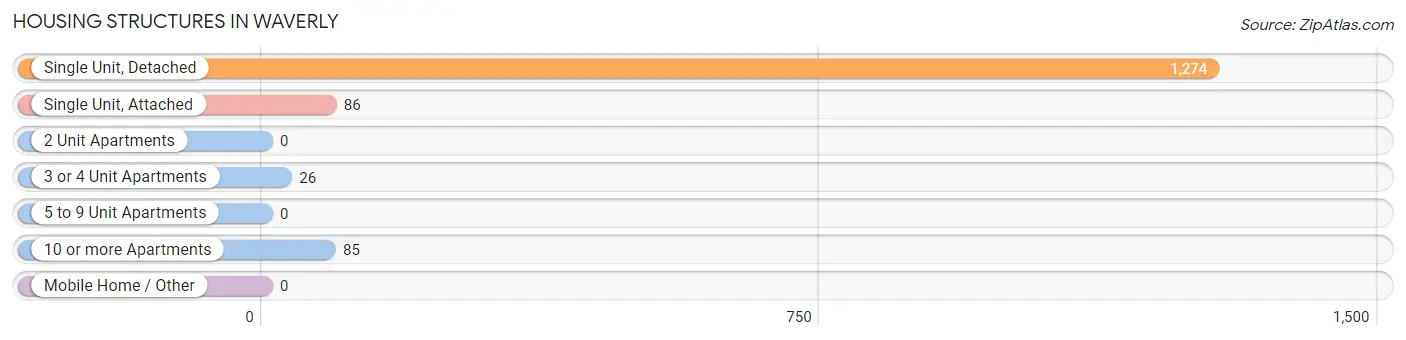
| Structure Type | # Housing Units | % Housing Units |
| Single Unit, Detached | 1,274 | 86.6% |
| Single Unit, Attached | 86 | 5.9% |
| 2 Unit Apartments | 0 | 0.0% |
| 3 or 4 Unit Apartments | 26 | 1.8% |
| 5 to 9 Unit Apartments | 0 | 0.0% |
| 10 or more Apartments | 85 | 5.8% |
| Mobile Home / Other | 0 | 0.0% |
| Total | 1,471 | 100.0% |
Housing Structures by Occupancy in Waverly
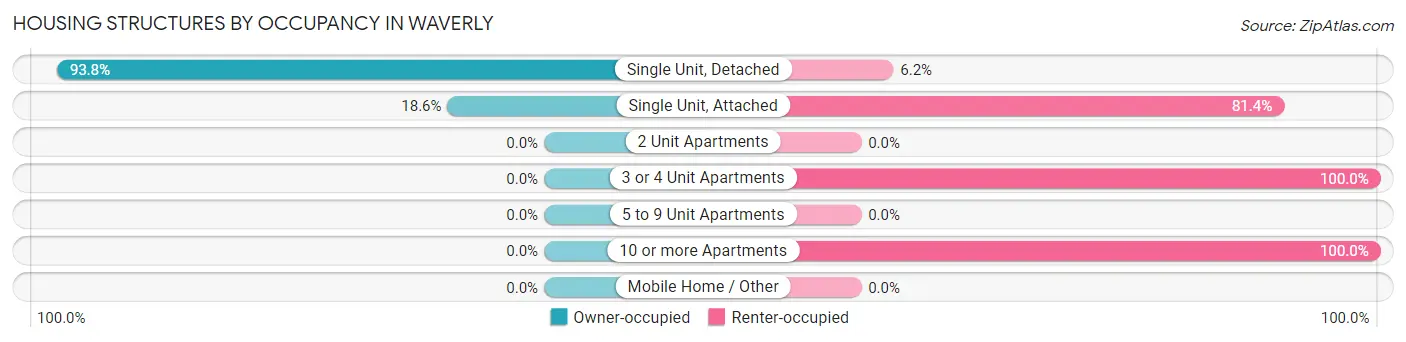
| Structure Type | Owner-occupied | Renter-occupied |
| Single Unit, Detached | 1,195 (93.8%) | 79 (6.2%) |
| Single Unit, Attached | 16 (18.6%) | 70 (81.4%) |
| 2 Unit Apartments | 0 (0.0%) | 0 (0.0%) |
| 3 or 4 Unit Apartments | 0 (0.0%) | 26 (100.0%) |
| 5 to 9 Unit Apartments | 0 (0.0%) | 0 (0.0%) |
| 10 or more Apartments | 0 (0.0%) | 85 (100.0%) |
| Mobile Home / Other | 0 (0.0%) | 0 (0.0%) |
| Total | 1,211 (82.3%) | 260 (17.7%) |
Housing Structures by Number of Rooms in Waverly
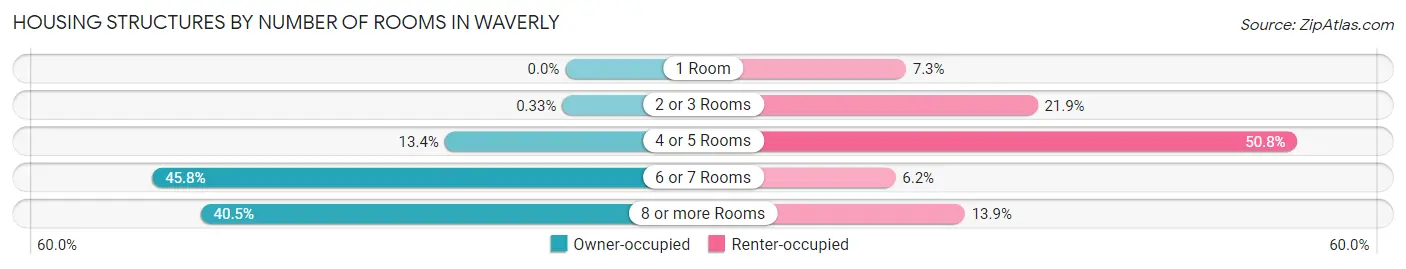
| Number of Rooms | Owner-occupied | Renter-occupied |
| 1 Room | 0 (0.0%) | 19 (7.3%) |
| 2 or 3 Rooms | 4 (0.3%) | 57 (21.9%) |
| 4 or 5 Rooms | 162 (13.4%) | 132 (50.8%) |
| 6 or 7 Rooms | 555 (45.8%) | 16 (6.1%) |
| 8 or more Rooms | 490 (40.5%) | 36 (13.9%) |
| Total | 1,211 (100.0%) | 260 (100.0%) |
Housing Structure by Heating Type in Waverly
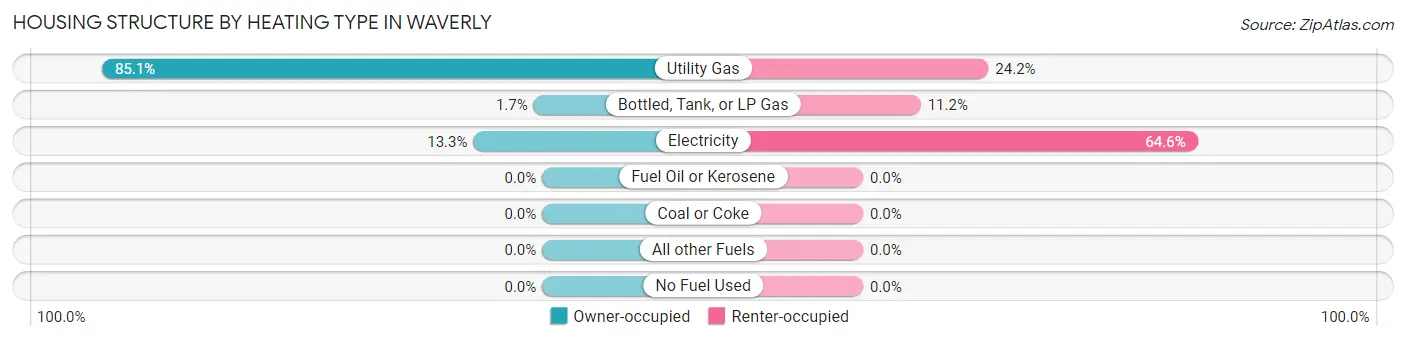
| Heating Type | Owner-occupied | Renter-occupied |
| Utility Gas | 1,030 (85.1%) | 63 (24.2%) |
| Bottled, Tank, or LP Gas | 20 (1.7%) | 29 (11.2%) |
| Electricity | 161 (13.3%) | 168 (64.6%) |
| Fuel Oil or Kerosene | 0 (0.0%) | 0 (0.0%) |
| Coal or Coke | 0 (0.0%) | 0 (0.0%) |
| All other Fuels | 0 (0.0%) | 0 (0.0%) |
| No Fuel Used | 0 (0.0%) | 0 (0.0%) |
| Total | 1,211 (100.0%) | 260 (100.0%) |
Household Vehicle Usage in Waverly
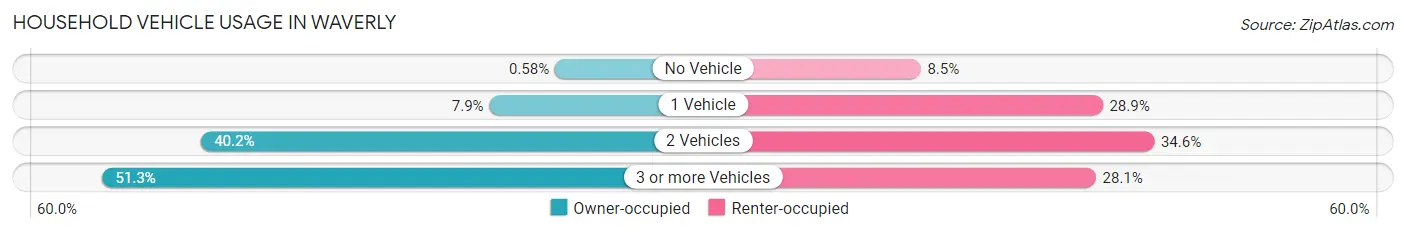
| Vehicles per Household | Owner-occupied | Renter-occupied |
| No Vehicle | 7 (0.6%) | 22 (8.5%) |
| 1 Vehicle | 96 (7.9%) | 75 (28.8%) |
| 2 Vehicles | 487 (40.2%) | 90 (34.6%) |
| 3 or more Vehicles | 621 (51.3%) | 73 (28.1%) |
| Total | 1,211 (100.0%) | 260 (100.0%) |
Real Estate & Mortgages in Waverly
Real Estate and Mortgage Overview in Waverly
| Characteristic | Without Mortgage | With Mortgage |
| Housing Units | 397 | 814 |
| Median Property Value | $232,400 | $258,400 |
| Median Household Income | $67,201 | $224 |
| Monthly Housing Costs | $577 | $13 |
| Real Estate Taxes | $3,560 | $20 |
Property Value by Mortgage Status in Waverly

| Property Value | Without Mortgage | With Mortgage |
| Less than $50,000 | 4 (1.0%) | 0 (0.0%) |
| $50,000 to $99,999 | 12 (3.0%) | 12 (1.5%) |
| $100,000 to $299,999 | 305 (76.8%) | 484 (59.5%) |
| $300,000 to $499,999 | 57 (14.4%) | 318 (39.1%) |
| $500,000 to $749,999 | 19 (4.8%) | 0 (0.0%) |
| $750,000 to $999,999 | 0 (0.0%) | 0 (0.0%) |
| $1,000,000 or more | 0 (0.0%) | 0 (0.0%) |
| Total | 397 (100.0%) | 814 (100.0%) |
Household Income by Mortgage Status in Waverly
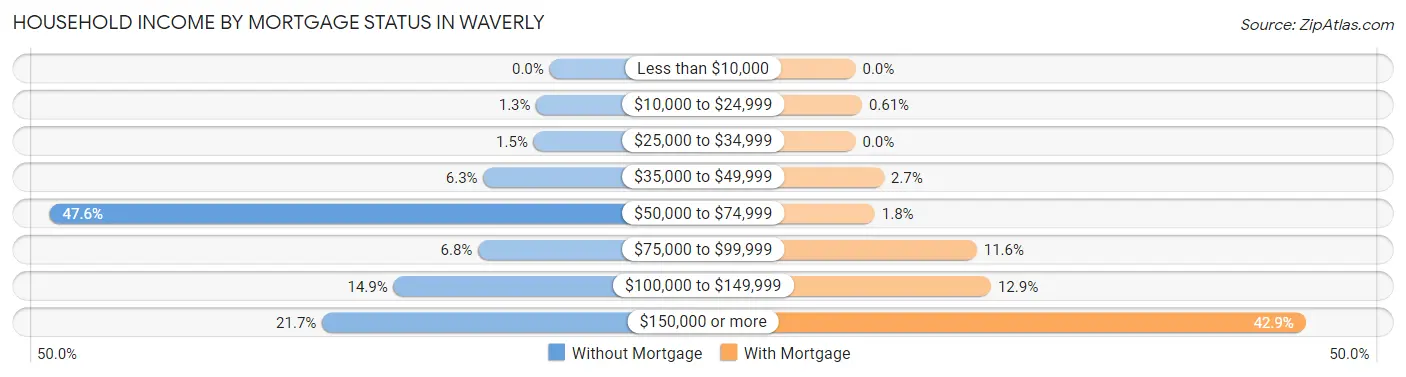
| Household Income | Without Mortgage | With Mortgage |
| Less than $10,000 | 0 (0.0%) | 0 (0.0%) |
| $10,000 to $24,999 | 5 (1.3%) | 5 (0.6%) |
| $25,000 to $34,999 | 6 (1.5%) | 0 (0.0%) |
| $35,000 to $49,999 | 25 (6.3%) | 22 (2.7%) |
| $50,000 to $74,999 | 189 (47.6%) | 15 (1.8%) |
| $75,000 to $99,999 | 27 (6.8%) | 94 (11.6%) |
| $100,000 to $149,999 | 59 (14.9%) | 105 (12.9%) |
| $150,000 or more | 86 (21.7%) | 349 (42.9%) |
| Total | 397 (100.0%) | 814 (100.0%) |
Property Value to Household Income Ratio in Waverly
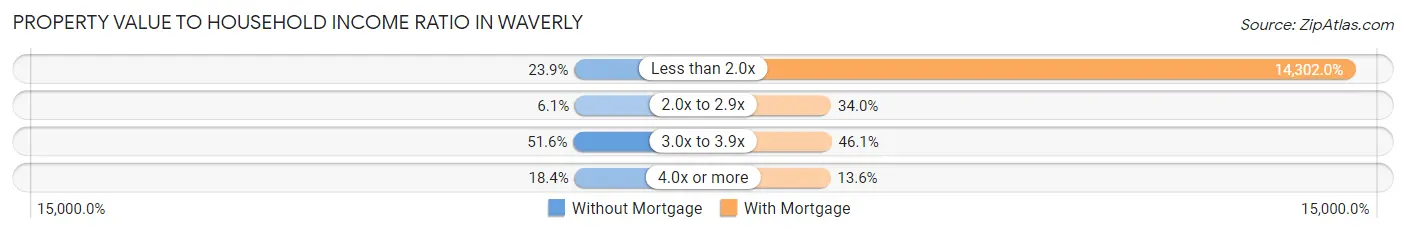
| Value-to-Income Ratio | Without Mortgage | With Mortgage |
| Less than 2.0x | 95 (23.9%) | 116,418 (14,302.0%) |
| 2.0x to 2.9x | 24 (6.0%) | 277 (34.0%) |
| 3.0x to 3.9x | 205 (51.6%) | 375 (46.1%) |
| 4.0x or more | 73 (18.4%) | 111 (13.6%) |
| Total | 397 (100.0%) | 814 (100.0%) |
Real Estate Taxes by Mortgage Status in Waverly
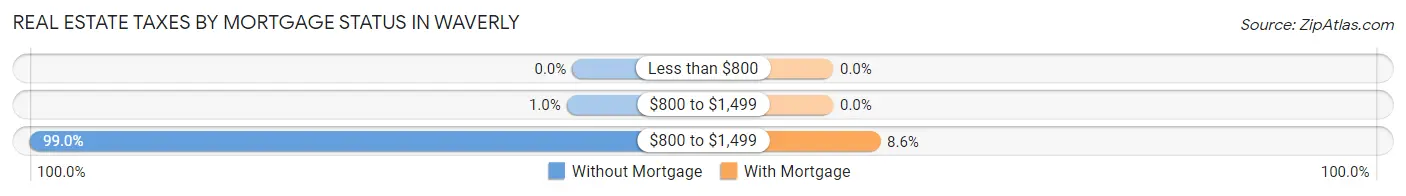
| Property Taxes | Without Mortgage | With Mortgage |
| Less than $800 | 0 (0.0%) | 0 (0.0%) |
| $800 to $1,499 | 4 (1.0%) | 0 (0.0%) |
| $800 to $1,499 | 393 (99.0%) | 70 (8.6%) |
| Total | 397 (100.0%) | 814 (100.0%) |
Health & Disability in Waverly
Health Insurance Coverage by Age in Waverly
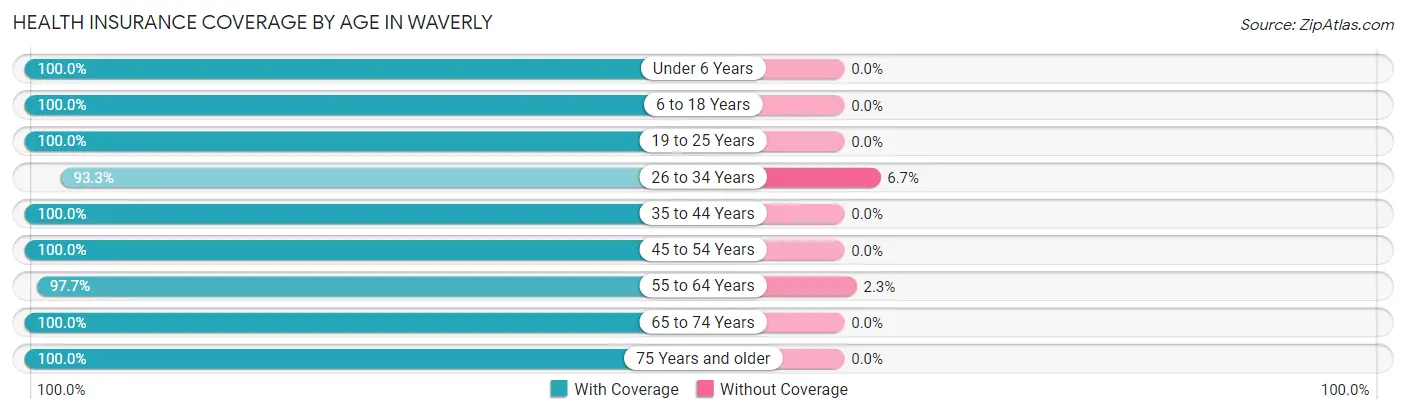
| Age Bracket | With Coverage | Without Coverage |
| Under 6 Years | 438 (100.0%) | 0 (0.0%) |
| 6 to 18 Years | 1,087 (100.0%) | 0 (0.0%) |
| 19 to 25 Years | 189 (100.0%) | 0 (0.0%) |
| 26 to 34 Years | 389 (93.3%) | 28 (6.7%) |
| 35 to 44 Years | 573 (100.0%) | 0 (0.0%) |
| 45 to 54 Years | 491 (100.0%) | 0 (0.0%) |
| 55 to 64 Years | 257 (97.7%) | 6 (2.3%) |
| 65 to 74 Years | 622 (100.0%) | 0 (0.0%) |
| 75 Years and older | 110 (100.0%) | 0 (0.0%) |
| Total | 4,156 (99.2%) | 34 (0.8%) |
Health Insurance Coverage by Citizenship Status in Waverly
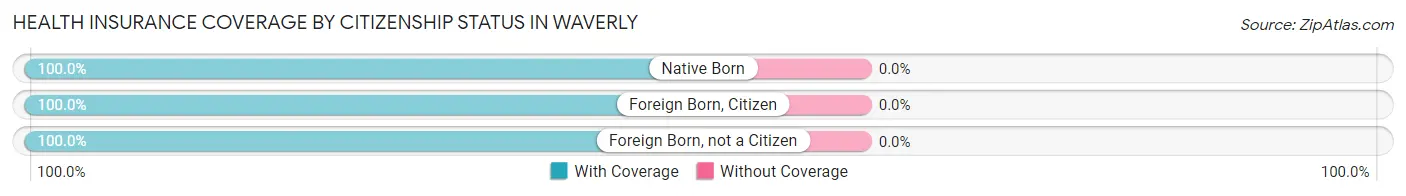
| Citizenship Status | With Coverage | Without Coverage |
| Native Born | 438 (100.0%) | 0 (0.0%) |
| Foreign Born, Citizen | 1,087 (100.0%) | 0 (0.0%) |
| Foreign Born, not a Citizen | 189 (100.0%) | 0 (0.0%) |
Health Insurance Coverage by Household Income in Waverly
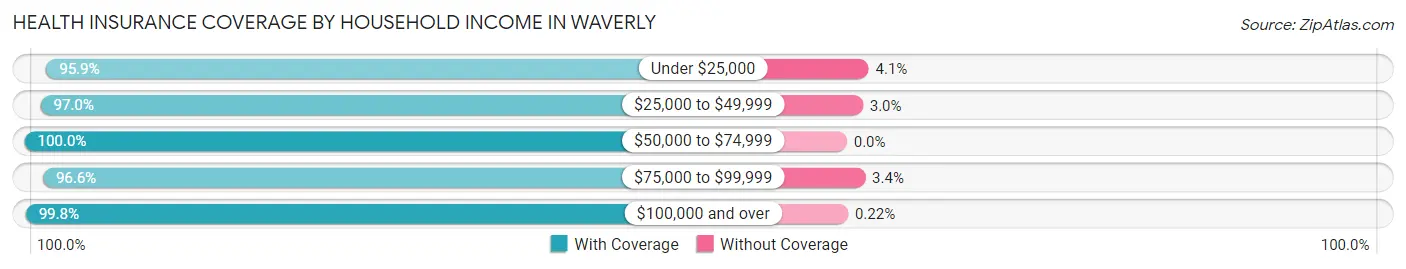
| Household Income | With Coverage | Without Coverage |
| Under $25,000 | 94 (95.9%) | 4 (4.1%) |
| $25,000 to $49,999 | 259 (97.0%) | 8 (3.0%) |
| $50,000 to $74,999 | 654 (100.0%) | 0 (0.0%) |
| $75,000 to $99,999 | 449 (96.6%) | 16 (3.4%) |
| $100,000 and over | 2,700 (99.8%) | 6 (0.2%) |
Public vs Private Health Insurance Coverage by Age in Waverly
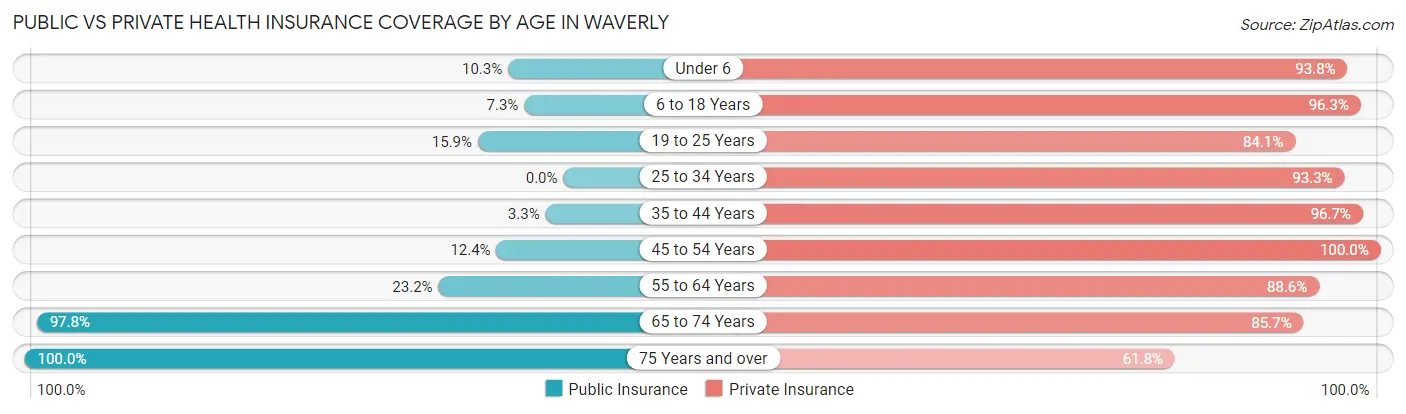
| Age Bracket | Public Insurance | Private Insurance |
| Under 6 | 45 (10.3%) | 411 (93.8%) |
| 6 to 18 Years | 79 (7.3%) | 1,047 (96.3%) |
| 19 to 25 Years | 30 (15.9%) | 159 (84.1%) |
| 25 to 34 Years | 0 (0.0%) | 389 (93.3%) |
| 35 to 44 Years | 19 (3.3%) | 554 (96.7%) |
| 45 to 54 Years | 61 (12.4%) | 491 (100.0%) |
| 55 to 64 Years | 61 (23.2%) | 233 (88.6%) |
| 65 to 74 Years | 608 (97.8%) | 533 (85.7%) |
| 75 Years and over | 110 (100.0%) | 68 (61.8%) |
| Total | 1,013 (24.2%) | 3,885 (92.7%) |
Disability Status by Sex by Age in Waverly
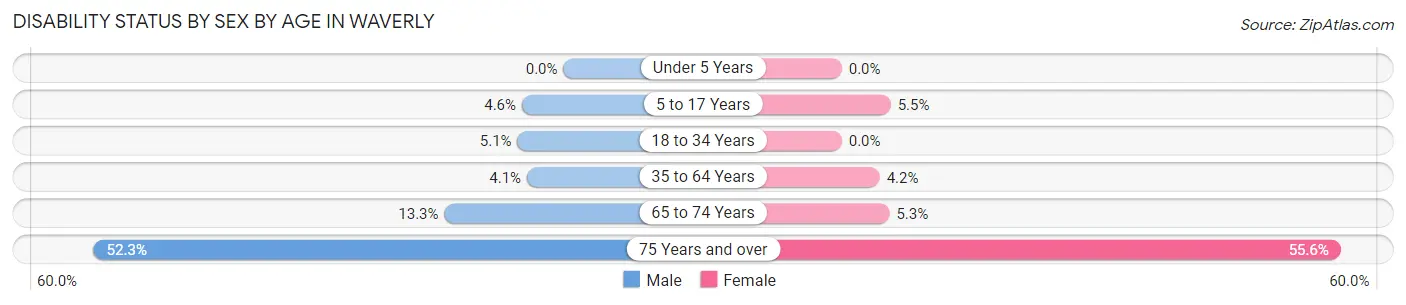
| Age Bracket | Male | Female |
| Under 5 Years | 0 (0.0%) | 0 (0.0%) |
| 5 to 17 Years | 24 (4.6%) | 34 (5.4%) |
| 18 to 34 Years | 16 (5.1%) | 0 (0.0%) |
| 35 to 64 Years | 26 (4.1%) | 29 (4.2%) |
| 65 to 74 Years | 40 (13.3%) | 17 (5.3%) |
| 75 Years and over | 34 (52.3%) | 25 (55.6%) |
Disability Class by Sex by Age in Waverly
Disability Class: Hearing Difficulty
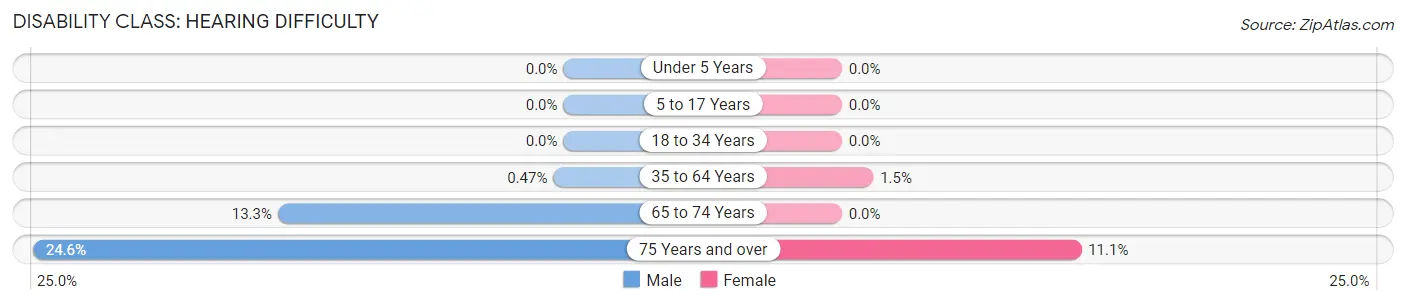
| Age Bracket | Male | Female |
| Under 5 Years | 0 (0.0%) | 0 (0.0%) |
| 5 to 17 Years | 0 (0.0%) | 0 (0.0%) |
| 18 to 34 Years | 0 (0.0%) | 0 (0.0%) |
| 35 to 64 Years | 3 (0.5%) | 10 (1.5%) |
| 65 to 74 Years | 40 (13.3%) | 0 (0.0%) |
| 75 Years and over | 16 (24.6%) | 5 (11.1%) |
Disability Class: Vision Difficulty
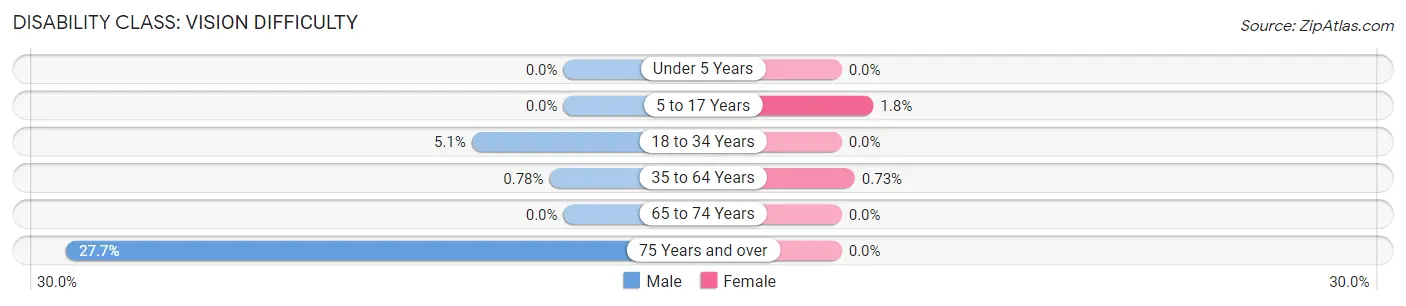
| Age Bracket | Male | Female |
| Under 5 Years | 0 (0.0%) | 0 (0.0%) |
| 5 to 17 Years | 0 (0.0%) | 11 (1.8%) |
| 18 to 34 Years | 16 (5.1%) | 0 (0.0%) |
| 35 to 64 Years | 5 (0.8%) | 5 (0.7%) |
| 65 to 74 Years | 0 (0.0%) | 0 (0.0%) |
| 75 Years and over | 18 (27.7%) | 0 (0.0%) |
Disability Class: Cognitive Difficulty
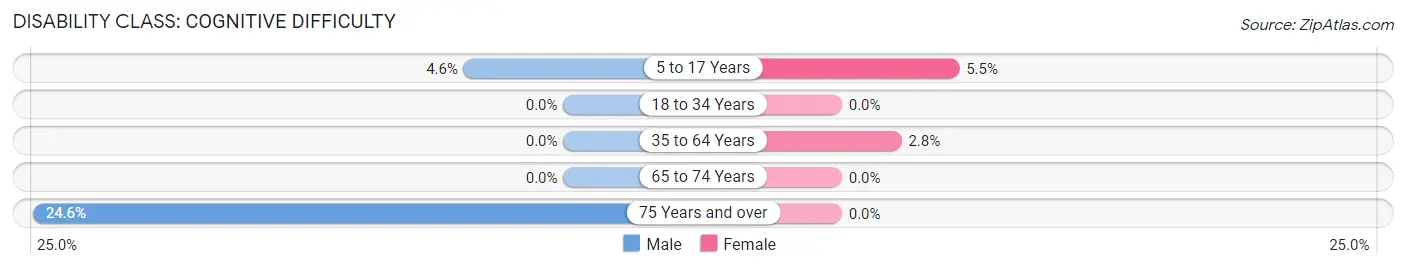
| Age Bracket | Male | Female |
| 5 to 17 Years | 24 (4.6%) | 34 (5.4%) |
| 18 to 34 Years | 0 (0.0%) | 0 (0.0%) |
| 35 to 64 Years | 0 (0.0%) | 19 (2.8%) |
| 65 to 74 Years | 0 (0.0%) | 0 (0.0%) |
| 75 Years and over | 16 (24.6%) | 0 (0.0%) |
Disability Class: Ambulatory Difficulty
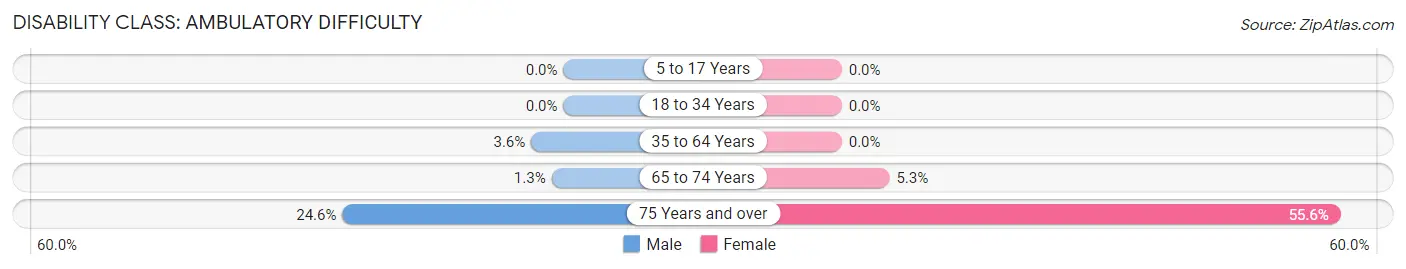
| Age Bracket | Male | Female |
| 5 to 17 Years | 0 (0.0%) | 0 (0.0%) |
| 18 to 34 Years | 0 (0.0%) | 0 (0.0%) |
| 35 to 64 Years | 23 (3.6%) | 0 (0.0%) |
| 65 to 74 Years | 4 (1.3%) | 17 (5.3%) |
| 75 Years and over | 16 (24.6%) | 25 (55.6%) |
Disability Class: Self-Care Difficulty
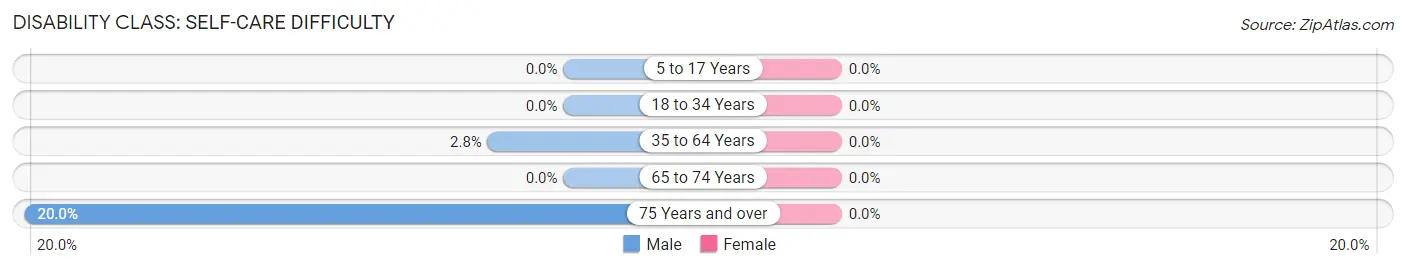
| Age Bracket | Male | Female |
| 5 to 17 Years | 0 (0.0%) | 0 (0.0%) |
| 18 to 34 Years | 0 (0.0%) | 0 (0.0%) |
| 35 to 64 Years | 18 (2.8%) | 0 (0.0%) |
| 65 to 74 Years | 0 (0.0%) | 0 (0.0%) |
| 75 Years and over | 13 (20.0%) | 0 (0.0%) |
Technology Access in Waverly
Computing Device Access in Waverly
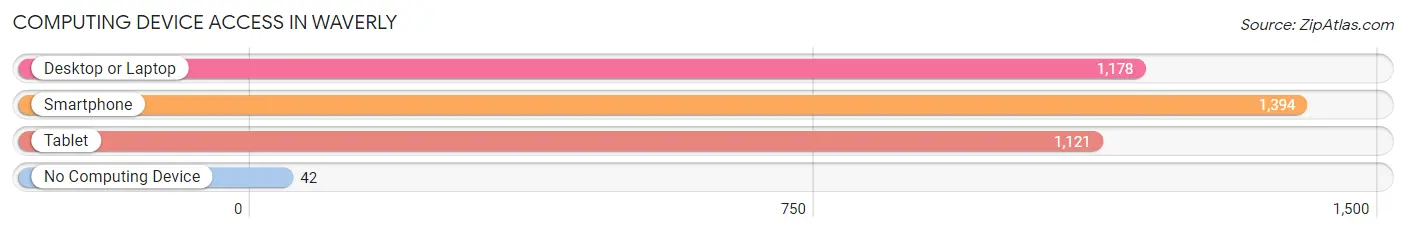
| Device Type | # Households | % Households |
| Desktop or Laptop | 1,178 | 80.1% |
| Smartphone | 1,394 | 94.8% |
| Tablet | 1,121 | 76.2% |
| No Computing Device | 42 | 2.9% |
| Total | 1,471 | 100.0% |
Internet Access in Waverly
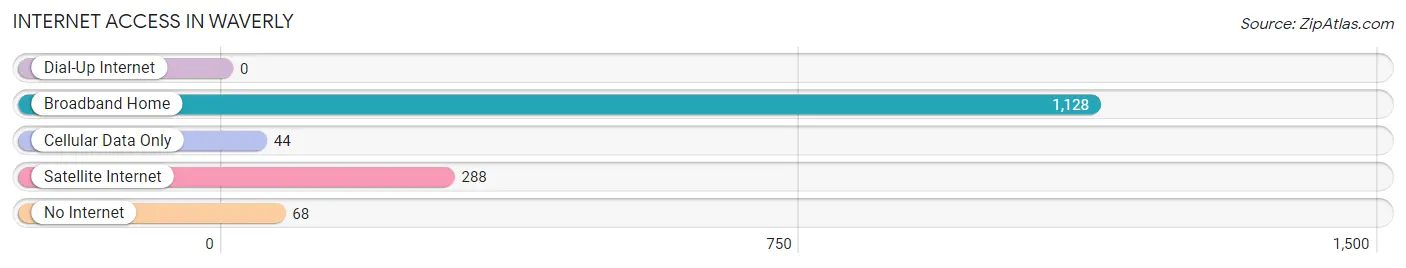
| Internet Type | # Households | % Households |
| Dial-Up Internet | 0 | 0.0% |
| Broadband Home | 1,128 | 76.7% |
| Cellular Data Only | 44 | 3.0% |
| Satellite Internet | 288 | 19.6% |
| No Internet | 68 | 4.6% |
| Total | 1,471 | 100.0% |
Waverly Summary
Waverly, Nebraska is a small city located in Lancaster County, Nebraska. It is situated on the banks of the Platte River, approximately 20 miles southwest of Lincoln. The city has a population of approximately 4,000 people and is part of the Lincoln Metropolitan Statistical Area.
History
Waverly was founded in 1871 by a group of settlers from Ohio. The city was named after Waverly, Ohio, the hometown of one of the settlers. The city was incorporated in 1873 and was the first city in Lancaster County to be incorporated.
The city was originally a farming community, but in the late 19th century, it became a popular stop for travelers on the Union Pacific Railroad. The railroad brought new businesses and industries to the city, and it quickly grew in size and population.
Geography
Waverly is located in southeastern Nebraska, approximately 20 miles southwest of Lincoln. The city is situated on the banks of the Platte River, and is surrounded by rolling hills and farmland. The city has a total area of 2.3 square miles, all of which is land.
The climate in Waverly is typical of the Great Plains, with hot summers and cold winters. The average temperature in the summer is around 80 degrees Fahrenheit, and the average temperature in the winter is around 20 degrees Fahrenheit.
Economy
The economy of Waverly is largely based on agriculture and manufacturing. The city is home to several large agricultural companies, including Cargill, ADM, and Tyson Foods. The city also has several manufacturing companies, including a plastics plant and a metal fabrication plant.
The city also has a thriving retail sector, with several large stores and restaurants located in the downtown area. The city also has a growing tourism industry, with several attractions located in the city, including the Waverly Historical Museum and the Waverly Golf Course.
Demographics
As of the 2010 census, the population of Waverly was 4,000. The racial makeup of the city was 95.3% White, 0.7% African American, 0.3% Native American, 0.7% Asian, 0.1% Pacific Islander, 1.2% from other races, and 1.9% from two or more races. Hispanic or Latino of any race were 3.2% of the population.
The median household income in Waverly was $50,000, and the median family income was $56,000. The per capita income in the city was $22,000. About 8.3% of families and 10.2% of the population were below the poverty line, including 14.3% of those under age 18 and 6.2% of those age 65 or over.
Waverly is a small city with a rich history and a diverse economy. The city is home to several large agricultural and manufacturing companies, as well as a thriving retail sector. The city also has a growing tourism industry, with several attractions located in the city. The population of Waverly is diverse, with a mix of races and ethnicities. The city has a median household income of $50,000 and a per capita income of $22,000.
Common Questions
What is Per Capita Income in Waverly?
Per Capita income in Waverly is $37,561.
What is the Median Family Income in Waverly?
Median Family Income in Waverly is $112,731.
What is the Median Household income in Waverly?
Median Household Income in Waverly is $103,373.
What is Income or Wage Gap in Waverly?
Income or Wage Gap in Waverly is 45.1%.
Women in Waverly earn 54.9 cents for every dollar earned by a man.
What is Inequality or Gini Index in Waverly?
Inequality or Gini Index in Waverly is 0.31.
What is the Total Population of Waverly?
Total Population of Waverly is 4,289.
What is the Total Male Population of Waverly?
Total Male Population of Waverly is 2,058.
What is the Total Female Population of Waverly?
Total Female Population of Waverly is 2,231.
What is the Ratio of Males per 100 Females in Waverly?
There are 92.25 Males per 100 Females in Waverly.
What is the Ratio of Females per 100 Males in Waverly?
There are 108.41 Females per 100 Males in Waverly.
What is the Median Population Age in Waverly?
Median Population Age in Waverly is 35.2 Years.
What is the Average Family Size in Waverly
Average Family Size in Waverly is 3.1 People.
What is the Average Household Size in Waverly
Average Household Size in Waverly is 2.9 People.
How Large is the Labor Force in Waverly?
There are 1,991 People in the Labor Forcein in Waverly.
What is the Percentage of People in the Labor Force in Waverly?
68.2% of People are in the Labor Force in Waverly.
What is the Unemployment Rate in Waverly?
Unemployment Rate in Waverly is 0.3%.