Waterloo, NE Map & Demographics
Waterloo Map
Waterloo Overview
$32,441
PER CAPITA INCOME
$71,964
AVG FAMILY INCOME
$65,000
AVG HOUSEHOLD INCOME
49.7%
WAGE / INCOME GAP [ % ]
50.3¢/ $1
WAGE / INCOME GAP [ $ ]
$12,926
FAMILY INCOME DEFICIT
0.38
INEQUALITY / GINI INDEX
931
TOTAL POPULATION
411
MALE POPULATION
520
FEMALE POPULATION
79.04
MALES / 100 FEMALES
126.52
FEMALES / 100 MALES
37.6
MEDIAN AGE
3.0
AVG FAMILY SIZE
2.5
AVG HOUSEHOLD SIZE
473
LABOR FORCE [ PEOPLE ]
64.4%
PERCENT IN LABOR FORCE
1.3%
UNEMPLOYMENT RATE
Waterloo Zip Codes
Waterloo Area Codes
Income in Waterloo
Income Overview in Waterloo
Per Capita Income in Waterloo is $32,441, while median incomes of families and households are $71,964 and $65,000 respectively.
| Characteristic | Number | Measure |
| Per Capita Income | 931 | $32,441 |
| Median Family Income | 261 | $71,964 |
| Mean Family Income | 261 | $84,297 |
| Median Household Income | 376 | $65,000 |
| Mean Household Income | 376 | $80,345 |
| Income Deficit | 261 | $12,926 |
| Wage / Income Gap (%) | 931 | 49.74% |
| Wage / Income Gap ($) | 931 | 50.26¢ per $1 |
| Gini / Inequality Index | 931 | 0.38 |
Earnings by Sex in Waterloo
Average Earnings in Waterloo are $42,857, $55,781 for men and $28,036 for women, a difference of 49.7%.
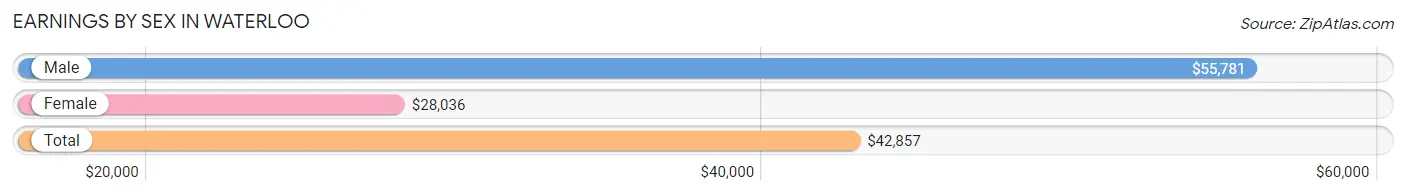
| Sex | Number | Average Earnings |
| Male | 272 (50.7%) | $55,781 |
| Female | 264 (49.2%) | $28,036 |
| Total | 536 (100.0%) | $42,857 |
Earnings by Sex by Income Bracket in Waterloo
The most common earnings brackets in Waterloo are $55,000 to $64,999 for men (78 | 28.7%) and $2,499 or less for women (61 | 23.1%).
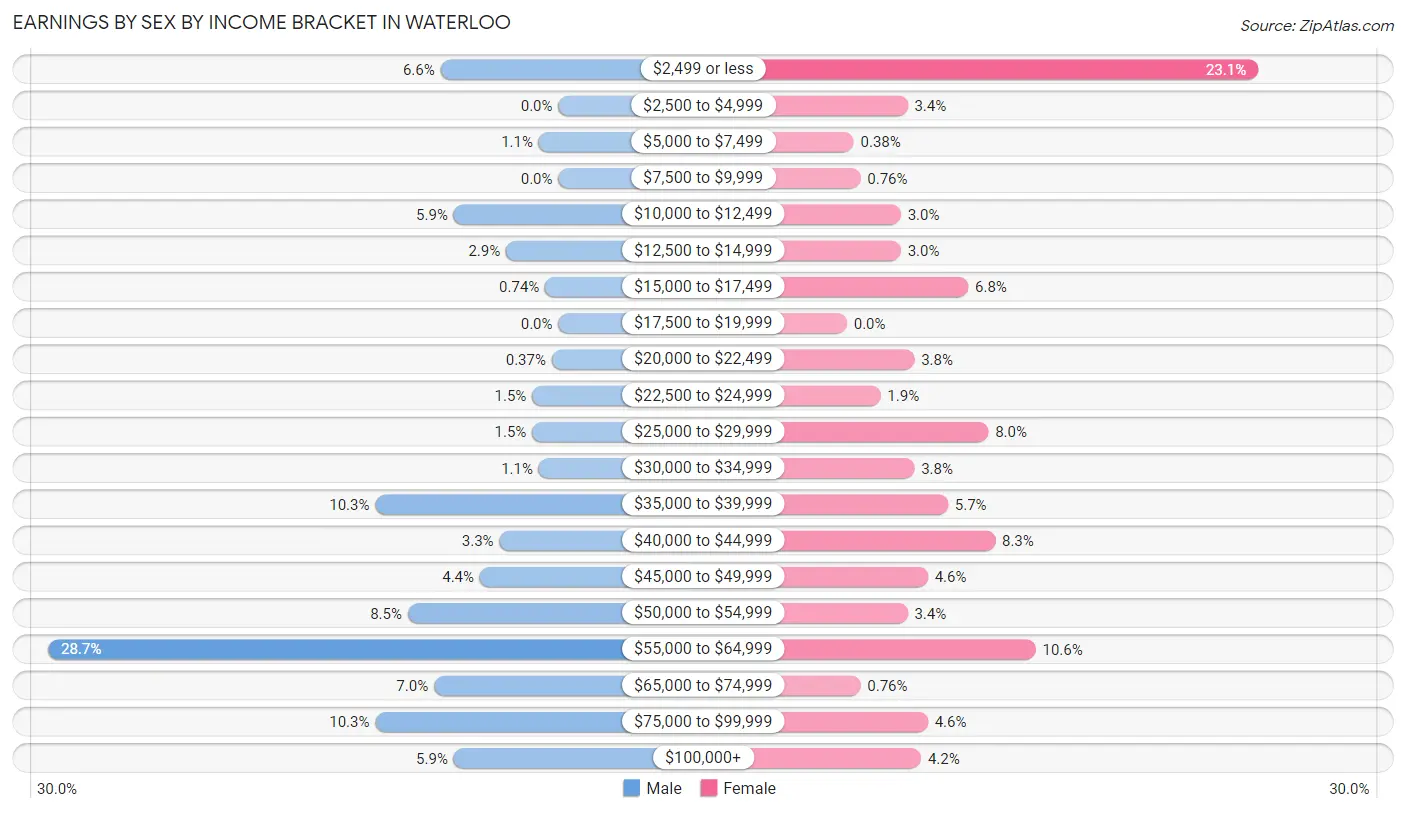
| Income | Male | Female |
| $2,499 or less | 18 (6.6%) | 61 (23.1%) |
| $2,500 to $4,999 | 0 (0.0%) | 9 (3.4%) |
| $5,000 to $7,499 | 3 (1.1%) | 1 (0.4%) |
| $7,500 to $9,999 | 0 (0.0%) | 2 (0.8%) |
| $10,000 to $12,499 | 16 (5.9%) | 8 (3.0%) |
| $12,500 to $14,999 | 8 (2.9%) | 8 (3.0%) |
| $15,000 to $17,499 | 2 (0.7%) | 18 (6.8%) |
| $17,500 to $19,999 | 0 (0.0%) | 0 (0.0%) |
| $20,000 to $22,499 | 1 (0.4%) | 10 (3.8%) |
| $22,500 to $24,999 | 4 (1.5%) | 5 (1.9%) |
| $25,000 to $29,999 | 4 (1.5%) | 21 (8.0%) |
| $30,000 to $34,999 | 3 (1.1%) | 10 (3.8%) |
| $35,000 to $39,999 | 28 (10.3%) | 15 (5.7%) |
| $40,000 to $44,999 | 9 (3.3%) | 22 (8.3%) |
| $45,000 to $49,999 | 12 (4.4%) | 12 (4.5%) |
| $50,000 to $54,999 | 23 (8.5%) | 9 (3.4%) |
| $55,000 to $64,999 | 78 (28.7%) | 28 (10.6%) |
| $65,000 to $74,999 | 19 (7.0%) | 2 (0.8%) |
| $75,000 to $99,999 | 28 (10.3%) | 12 (4.5%) |
| $100,000+ | 16 (5.9%) | 11 (4.2%) |
| Total | 272 (100.0%) | 264 (100.0%) |
Earnings by Sex by Educational Attainment in Waterloo
Average earnings in Waterloo are $59,167 for men and $30,833 for women, a difference of 47.9%. Men with an educational attainment of bachelor's degree enjoy the highest average annual earnings of $93,333, while those with college or associate's degree education earn the least with $55,781. Women with an educational attainment of bachelor's degree earn the most with the average annual earnings of $56,458, while those with college or associate's degree education have the smallest earnings of $36,429.
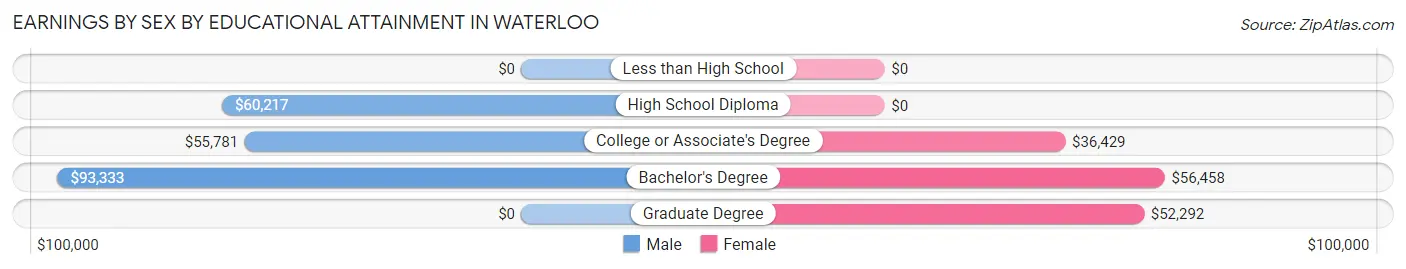
| Educational Attainment | Male Income | Female Income |
| Less than High School | - | - |
| High School Diploma | $60,217 | $0 |
| College or Associate's Degree | $55,781 | $36,429 |
| Bachelor's Degree | $93,333 | $56,458 |
| Graduate Degree | - | - |
| Total | $59,167 | $30,833 |
Family Income in Waterloo
Family Income Brackets in Waterloo
According to the Waterloo family income data, there are 93 families falling into the $50,000 to $74,999 income range, which is the most common income bracket and makes up 35.6% of all families. Conversely, the $10,000 to $14,999 income bracket is the least frequent group with only 4 families (1.5%) belonging to this category.
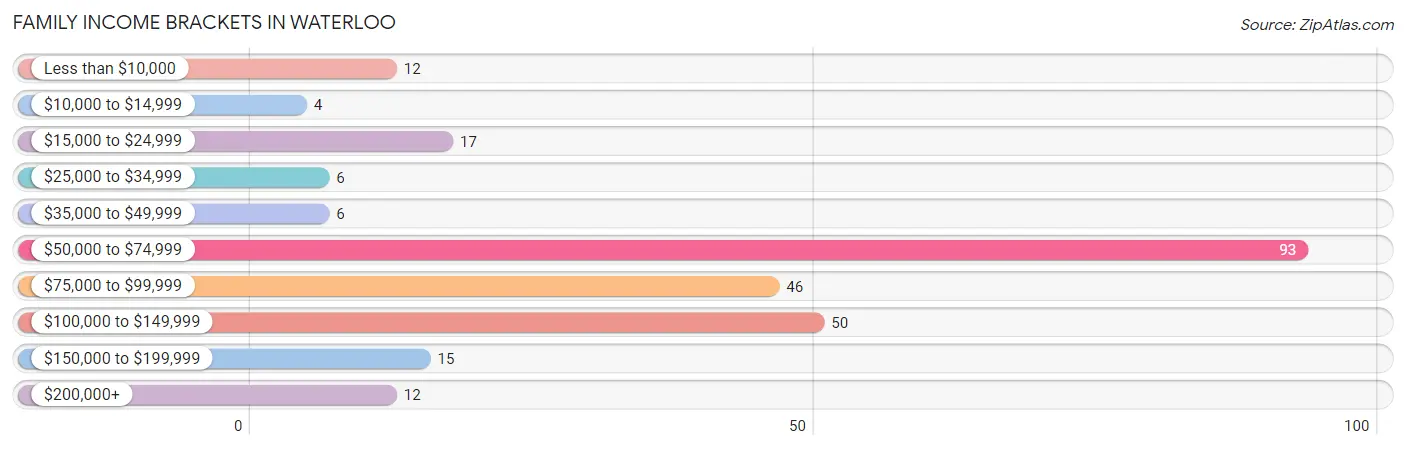
| Income Bracket | # Families | % Families |
| Less than $10,000 | 12 | 4.6% |
| $10,000 to $14,999 | 4 | 1.5% |
| $15,000 to $24,999 | 17 | 6.5% |
| $25,000 to $34,999 | 6 | 2.3% |
| $35,000 to $49,999 | 6 | 2.3% |
| $50,000 to $74,999 | 93 | 35.6% |
| $75,000 to $99,999 | 46 | 17.6% |
| $100,000 to $149,999 | 50 | 19.2% |
| $150,000 to $199,999 | 15 | 5.7% |
| $200,000+ | 12 | 4.6% |
Family Income by Famaliy Size in Waterloo
5-person families (13 | 5.0%) account for the highest median family income in Waterloo with $192,083 per family, while 3-person families (55 | 21.1%) have the highest median income of $38,698 per family member.
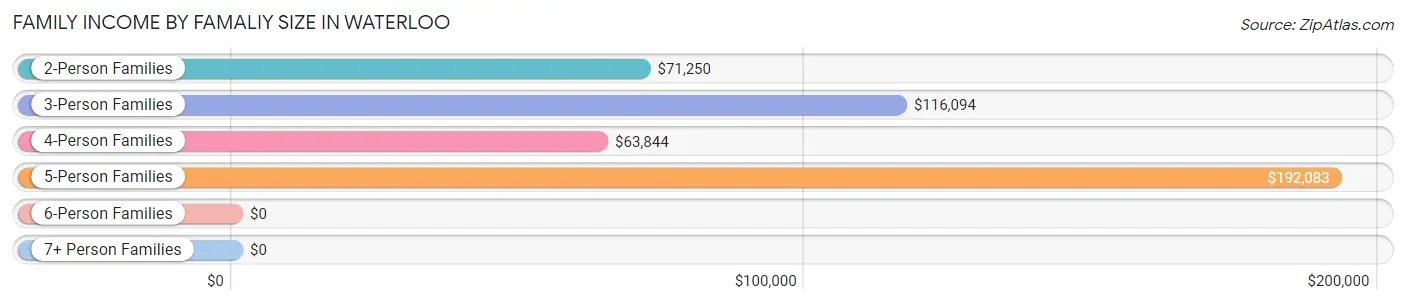
| Income Bracket | # Families | Median Income |
| 2-Person Families | 123 (47.1%) | $71,250 |
| 3-Person Families | 55 (21.1%) | $116,094 |
| 4-Person Families | 63 (24.1%) | $63,844 |
| 5-Person Families | 13 (5.0%) | $192,083 |
| 6-Person Families | 3 (1.1%) | $0 |
| 7+ Person Families | 4 (1.5%) | $0 |
| Total | 261 (100.0%) | $71,964 |
Family Income by Number of Earners in Waterloo
The median family income in Waterloo is $71,964, with families comprising 3+ earners (39) having the highest median family income of $126,458, while families with no earners (54) have the lowest median family income of $43,750, accounting for 14.9% and 20.7% of families, respectively.
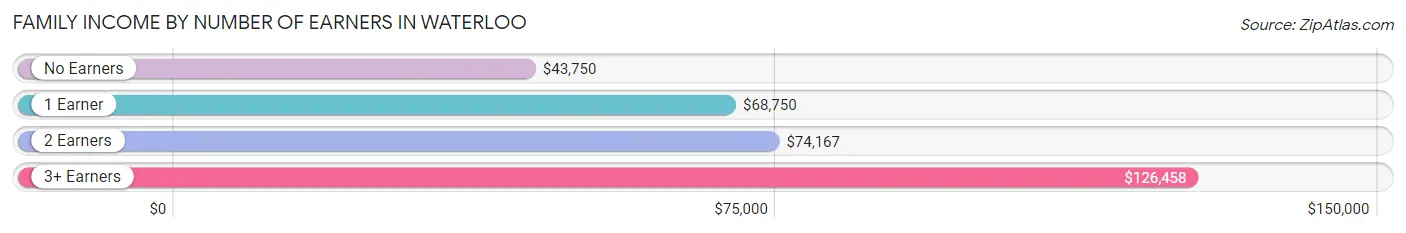
| Number of Earners | # Families | Median Income |
| No Earners | 54 (20.7%) | $43,750 |
| 1 Earner | 50 (19.2%) | $68,750 |
| 2 Earners | 118 (45.2%) | $74,167 |
| 3+ Earners | 39 (14.9%) | $126,458 |
| Total | 261 (100.0%) | $71,964 |
Household Income in Waterloo
Household Income Brackets in Waterloo
With 117 households falling in the category, the $50,000 to $74,999 income range is the most frequent in Waterloo, accounting for 31.1% of all households. In contrast, only 13 households (3.5%) fall into the $25,000 to $34,999 income bracket, making it the least populous group.
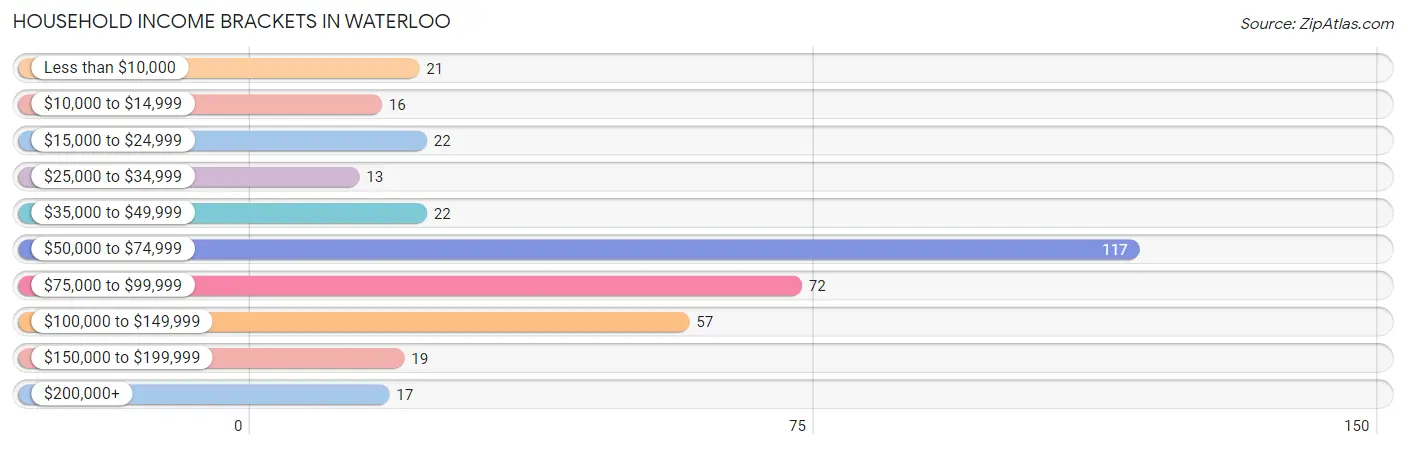
| Income Bracket | # Households | % Households |
| Less than $10,000 | 21 | 5.6% |
| $10,000 to $14,999 | 16 | 4.3% |
| $15,000 to $24,999 | 22 | 5.9% |
| $25,000 to $34,999 | 13 | 3.5% |
| $35,000 to $49,999 | 22 | 5.9% |
| $50,000 to $74,999 | 117 | 31.1% |
| $75,000 to $99,999 | 72 | 19.1% |
| $100,000 to $149,999 | 57 | 15.2% |
| $150,000 to $199,999 | 19 | 5.1% |
| $200,000+ | 17 | 4.5% |
Household Income by Householder Age in Waterloo
The median household income in Waterloo is $65,000, with the highest median household income of $94,167 found in the 45 to 64 years age bracket for the primary householder. A total of 152 households (40.4%) fall into this category. Meanwhile, the 15 to 24 years age bracket for the primary householder has the lowest median household income of $0, with 2 households (0.5%) in this group.
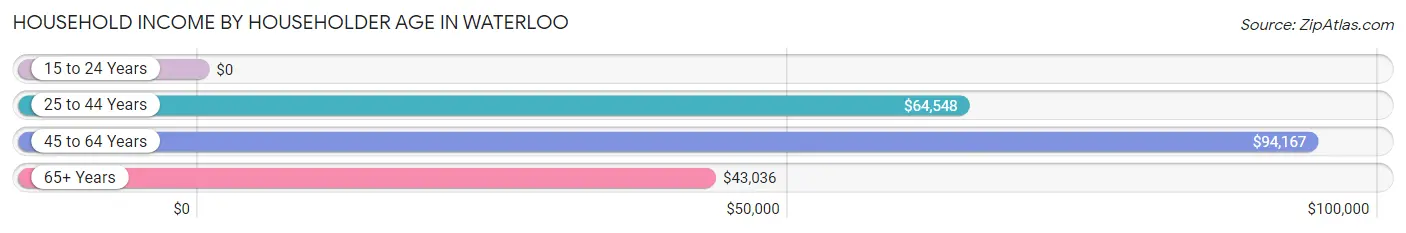
| Income Bracket | # Households | Median Income |
| 15 to 24 Years | 2 (0.5%) | $0 |
| 25 to 44 Years | 135 (35.9%) | $64,548 |
| 45 to 64 Years | 152 (40.4%) | $94,167 |
| 65+ Years | 87 (23.1%) | $43,036 |
| Total | 376 (100.0%) | $65,000 |
Poverty in Waterloo
Income Below Poverty by Sex and Age in Waterloo
With 9.0% poverty level for males and 8.8% for females among the residents of Waterloo, 15 year old males and 5 year old females are the most vulnerable to poverty, with 3 males (75.0%) and 2 females (100.0%) in their respective age groups living below the poverty level.
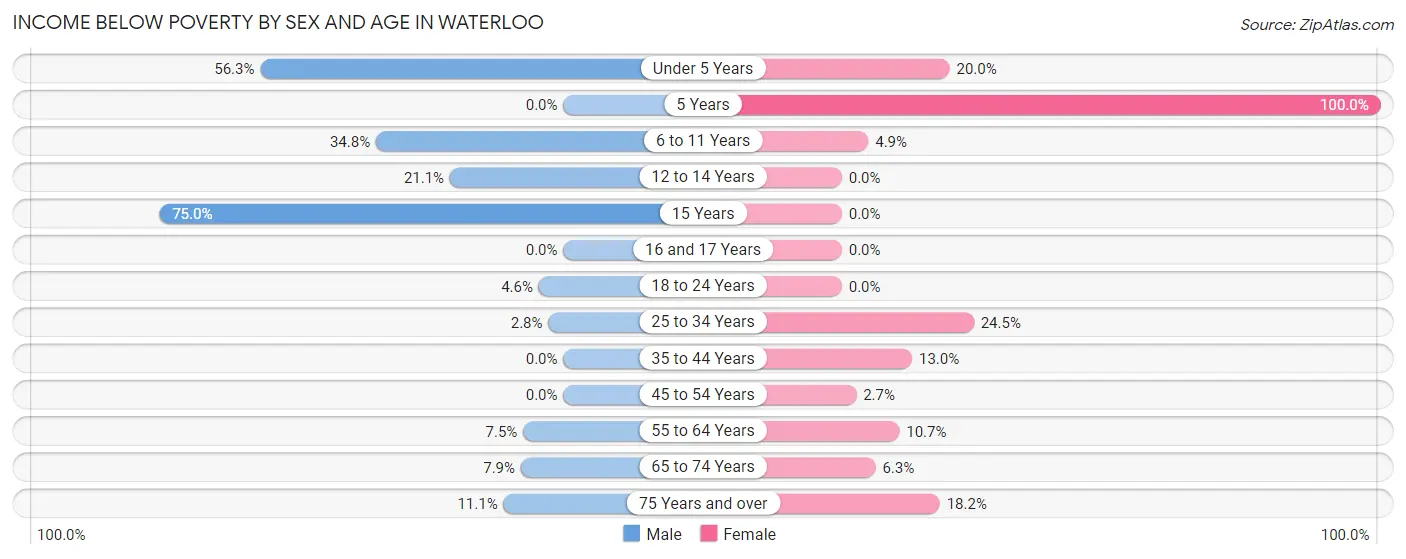
| Age Bracket | Male | Female |
| Under 5 Years | 9 (56.2%) | 2 (20.0%) |
| 5 Years | 0 (0.0%) | 2 (100.0%) |
| 6 to 11 Years | 8 (34.8%) | 3 (4.9%) |
| 12 to 14 Years | 4 (21.0%) | 0 (0.0%) |
| 15 Years | 3 (75.0%) | 0 (0.0%) |
| 16 and 17 Years | 0 (0.0%) | 0 (0.0%) |
| 18 to 24 Years | 1 (4.5%) | 0 (0.0%) |
| 25 to 34 Years | 2 (2.8%) | 12 (24.5%) |
| 35 to 44 Years | 0 (0.0%) | 9 (13.0%) |
| 45 to 54 Years | 0 (0.0%) | 2 (2.7%) |
| 55 to 64 Years | 5 (7.5%) | 8 (10.7%) |
| 65 to 74 Years | 3 (7.9%) | 4 (6.2%) |
| 75 Years and over | 2 (11.1%) | 4 (18.2%) |
| Total | 37 (9.0%) | 46 (8.8%) |
Income Above Poverty by Sex and Age in Waterloo
According to the poverty statistics in Waterloo, males aged 5 years and females aged 12 to 14 years are the age groups that are most secure financially, with 100.0% of males and 100.0% of females in these age groups living above the poverty line.
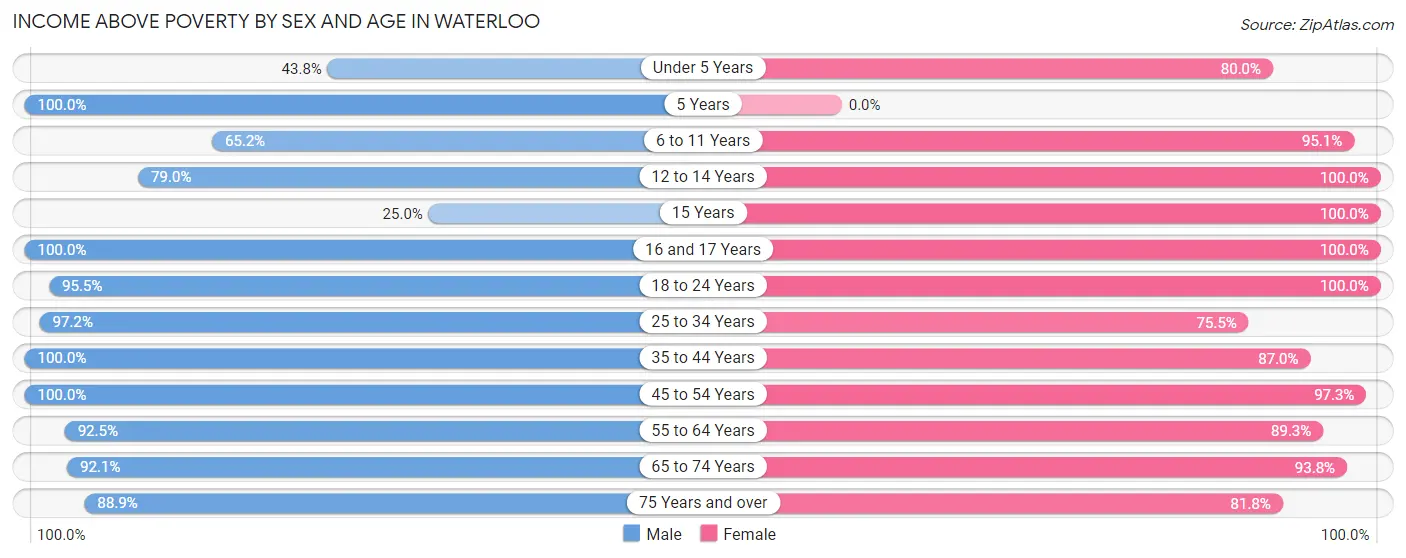
| Age Bracket | Male | Female |
| Under 5 Years | 7 (43.8%) | 8 (80.0%) |
| 5 Years | 2 (100.0%) | 0 (0.0%) |
| 6 to 11 Years | 15 (65.2%) | 58 (95.1%) |
| 12 to 14 Years | 15 (78.9%) | 17 (100.0%) |
| 15 Years | 1 (25.0%) | 42 (100.0%) |
| 16 and 17 Years | 9 (100.0%) | 9 (100.0%) |
| 18 to 24 Years | 21 (95.5%) | 25 (100.0%) |
| 25 to 34 Years | 70 (97.2%) | 37 (75.5%) |
| 35 to 44 Years | 66 (100.0%) | 60 (87.0%) |
| 45 to 54 Years | 55 (100.0%) | 73 (97.3%) |
| 55 to 64 Years | 62 (92.5%) | 67 (89.3%) |
| 65 to 74 Years | 35 (92.1%) | 60 (93.8%) |
| 75 Years and over | 16 (88.9%) | 18 (81.8%) |
| Total | 374 (91.0%) | 474 (91.1%) |
Income Below Poverty Among Married-Couple Families in Waterloo
The poverty statistics for married-couple families in Waterloo show that 3.2% or 7 of the total 219 families live below the poverty line. Families with no children have the highest poverty rate of 4.0%, comprising of 5 families. On the other hand, families with 3 or 4 children have the lowest poverty rate of 0.0%, which includes 0 families.
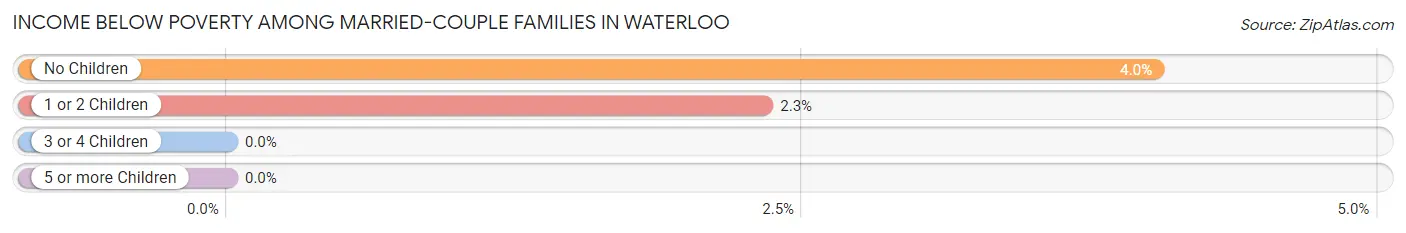
| Children | Above Poverty | Below Poverty |
| No Children | 119 (96.0%) | 5 (4.0%) |
| 1 or 2 Children | 84 (97.7%) | 2 (2.3%) |
| 3 or 4 Children | 7 (100.0%) | 0 (0.0%) |
| 5 or more Children | 2 (100.0%) | 0 (0.0%) |
| Total | 212 (96.8%) | 7 (3.2%) |
Income Below Poverty Among Single-Parent Households in Waterloo
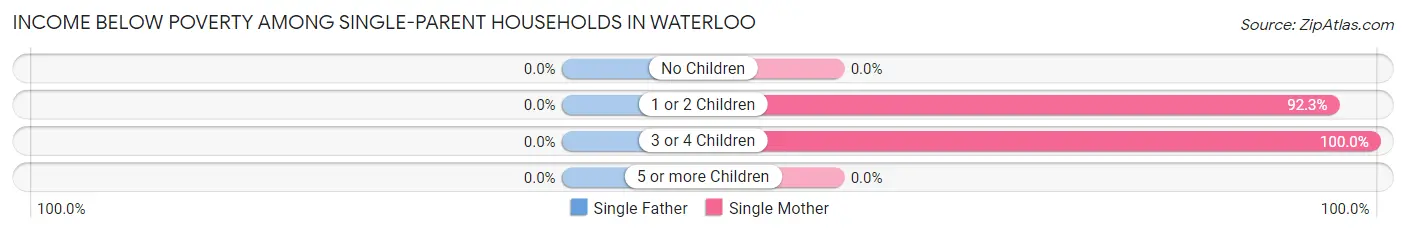
| Children | Single Father | Single Mother |
| No Children | 0 (0.0%) | 0 (0.0%) |
| 1 or 2 Children | 0 (0.0%) | 12 (92.3%) |
| 3 or 4 Children | 0 (0.0%) | 4 (100.0%) |
| 5 or more Children | 0 (0.0%) | 0 (0.0%) |
| Total | 0 (0.0%) | 16 (40.0%) |
Income Below Poverty Among Married-Couple vs Single-Parent Households in Waterloo
The poverty data for Waterloo shows that 7 of the married-couple family households (3.2%) and 16 of the single-parent households (38.1%) are living below the poverty level. Within the married-couple family households, those with no children have the highest poverty rate, with 5 households (4.0%) falling below the poverty line. Among the single-parent households, those with 1 or 2 children have the highest poverty rate, with 12 household (92.3%) living below poverty.
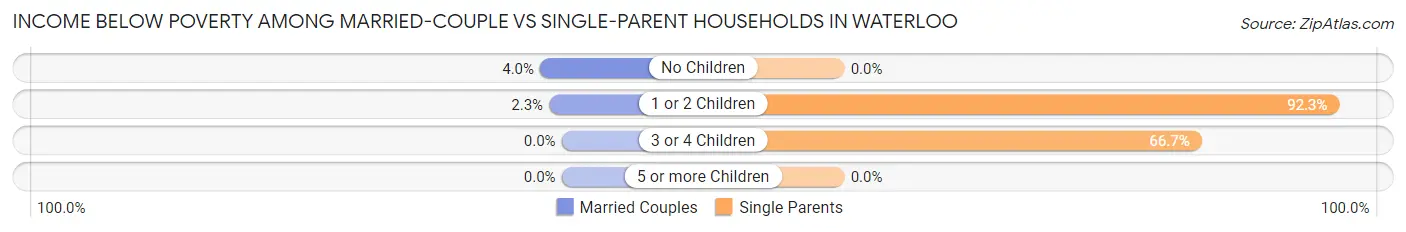
| Children | Married-Couple Families | Single-Parent Households |
| No Children | 5 (4.0%) | 0 (0.0%) |
| 1 or 2 Children | 2 (2.3%) | 12 (92.3%) |
| 3 or 4 Children | 0 (0.0%) | 4 (66.7%) |
| 5 or more Children | 0 (0.0%) | 0 (0.0%) |
| Total | 7 (3.2%) | 16 (38.1%) |
Race in Waterloo
The most populous races in Waterloo are White / Caucasian (899 | 96.6%), Two or more Races (30 | 3.2%), and Hispanic or Latino (27 | 2.9%).
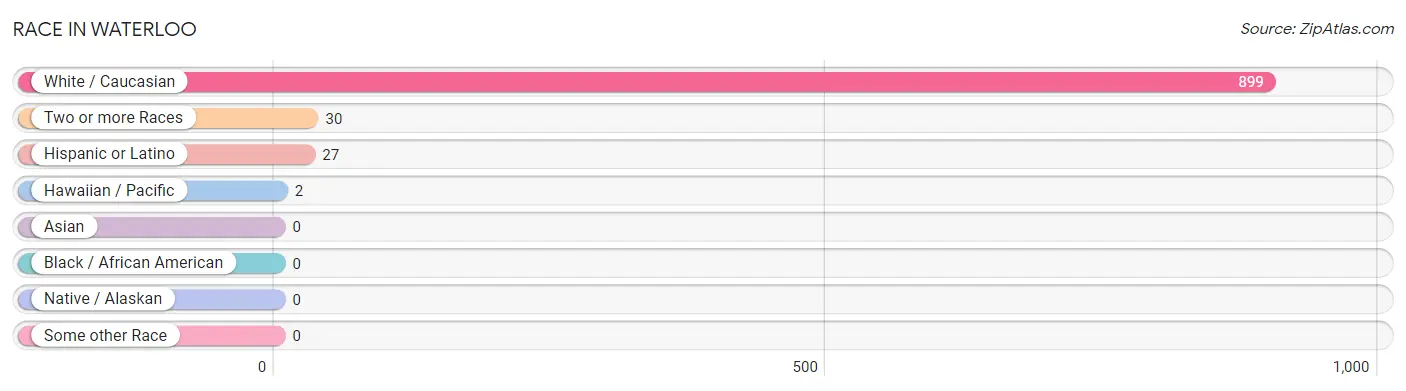
| Race | # Population | % Population |
| Asian | 0 | 0.0% |
| Black / African American | 0 | 0.0% |
| Hawaiian / Pacific | 2 | 0.2% |
| Hispanic or Latino | 27 | 2.9% |
| Native / Alaskan | 0 | 0.0% |
| White / Caucasian | 899 | 96.6% |
| Two or more Races | 30 | 3.2% |
| Some other Race | 0 | 0.0% |
| Total | 931 | 100.0% |
Ancestry in Waterloo
The most populous ancestries reported in Waterloo are German (389 | 41.8%), Irish (186 | 20.0%), English (160 | 17.2%), Czech (66 | 7.1%), and British (49 | 5.3%), together accounting for 91.3% of all Waterloo residents.
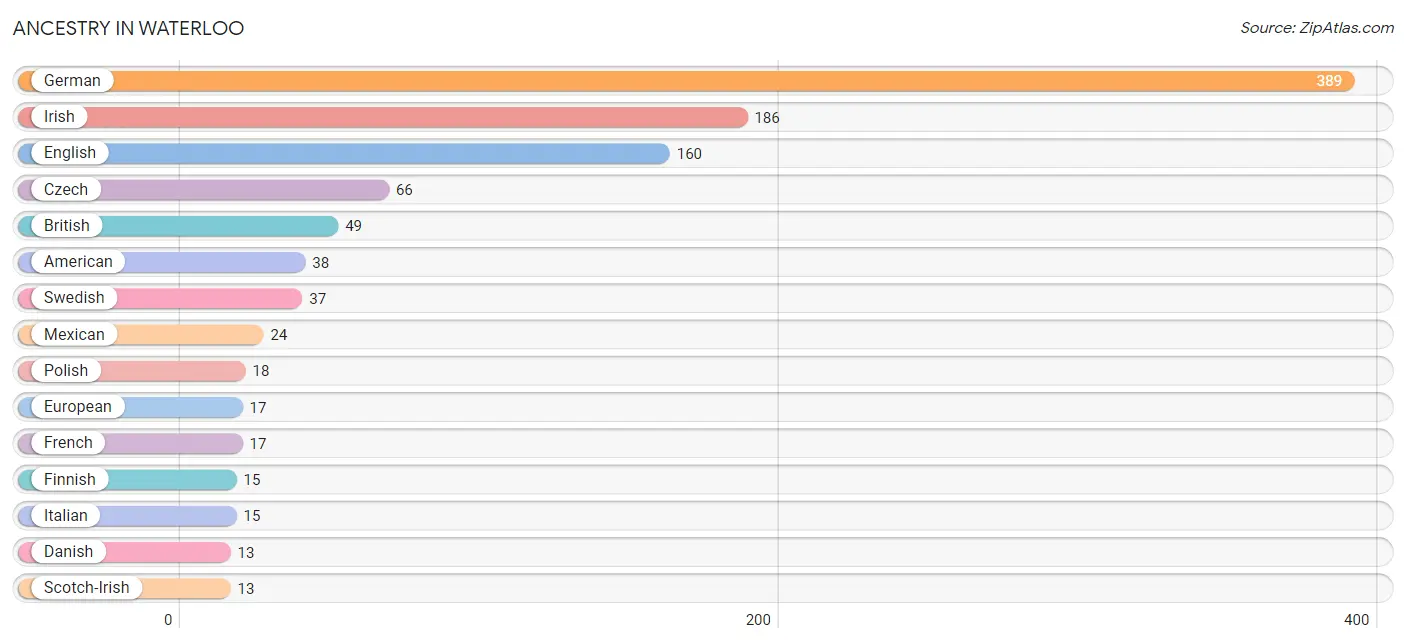
| Ancestry | # Population | % Population |
| American | 38 | 4.1% |
| Brazilian | 7 | 0.7% |
| British | 49 | 5.3% |
| Central American | 3 | 0.3% |
| Cherokee | 4 | 0.4% |
| Czech | 66 | 7.1% |
| Czechoslovakian | 2 | 0.2% |
| Danish | 13 | 1.4% |
| Eastern European | 2 | 0.2% |
| English | 160 | 17.2% |
| European | 17 | 1.8% |
| Finnish | 15 | 1.6% |
| French | 17 | 1.8% |
| German | 389 | 41.8% |
| Guatemalan | 3 | 0.3% |
| Irish | 186 | 20.0% |
| Italian | 15 | 1.6% |
| Latvian | 3 | 0.3% |
| Mexican | 24 | 2.6% |
| Northern European | 2 | 0.2% |
| Norwegian | 7 | 0.7% |
| Polish | 18 | 1.9% |
| Portuguese | 9 | 1.0% |
| Romanian | 6 | 0.6% |
| Scotch-Irish | 13 | 1.4% |
| Scottish | 10 | 1.1% |
| Swedish | 37 | 4.0% |
| Welsh | 4 | 0.4% | View All 28 Rows |
Immigrants in Waterloo
The most numerous immigrant groups reported in Waterloo came from Latin America (14 | 1.5%), South America (9 | 1.0%), Brazil (7 | 0.7%), Central America (5 | 0.5%), and Europe (3 | 0.3%), together accounting for 4.1% of all Waterloo residents.
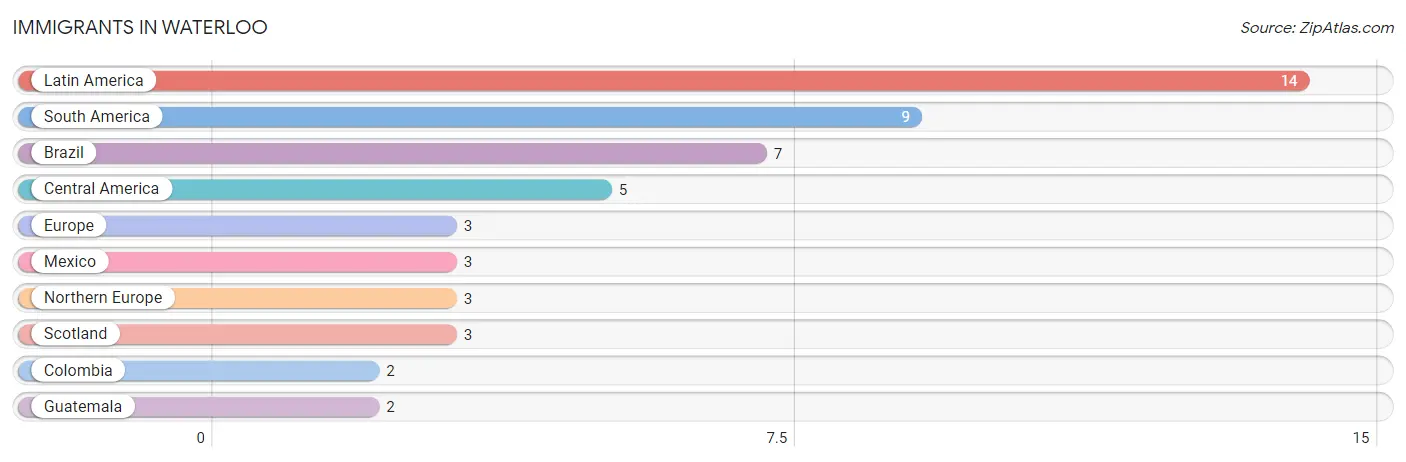
| Immigration Origin | # Population | % Population |
| Brazil | 7 | 0.7% |
| Central America | 5 | 0.5% |
| Colombia | 2 | 0.2% |
| Europe | 3 | 0.3% |
| Guatemala | 2 | 0.2% |
| Latin America | 14 | 1.5% |
| Mexico | 3 | 0.3% |
| Northern Europe | 3 | 0.3% |
| Scotland | 3 | 0.3% |
| South America | 9 | 1.0% | View All 10 Rows |
Sex and Age in Waterloo
Sex and Age in Waterloo
The most populous age groups in Waterloo are 60 to 64 Years (56 | 13.6%) for men and 35 to 39 Years (60 | 11.5%) for women.
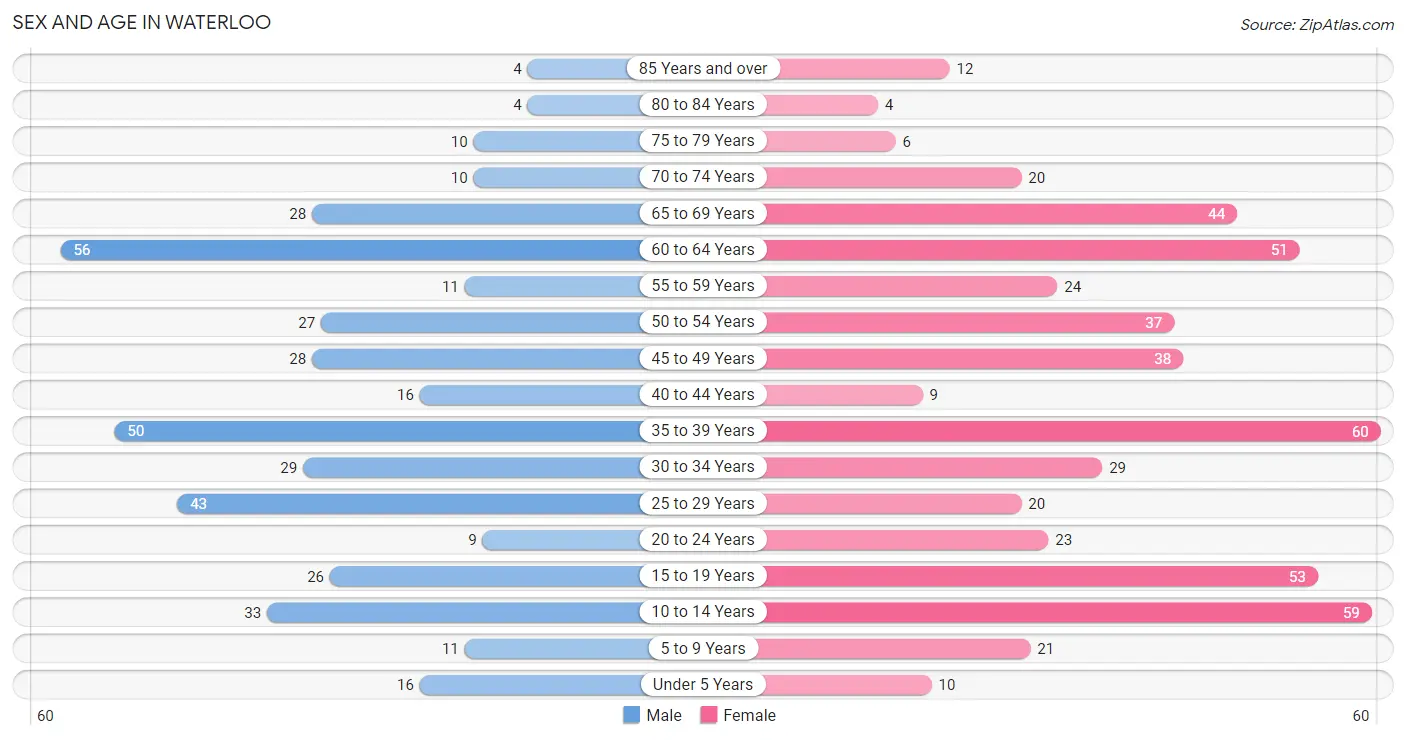
| Age Bracket | Male | Female |
| Under 5 Years | 16 (3.9%) | 10 (1.9%) |
| 5 to 9 Years | 11 (2.7%) | 21 (4.0%) |
| 10 to 14 Years | 33 (8.0%) | 59 (11.4%) |
| 15 to 19 Years | 26 (6.3%) | 53 (10.2%) |
| 20 to 24 Years | 9 (2.2%) | 23 (4.4%) |
| 25 to 29 Years | 43 (10.5%) | 20 (3.8%) |
| 30 to 34 Years | 29 (7.1%) | 29 (5.6%) |
| 35 to 39 Years | 50 (12.2%) | 60 (11.5%) |
| 40 to 44 Years | 16 (3.9%) | 9 (1.7%) |
| 45 to 49 Years | 28 (6.8%) | 38 (7.3%) |
| 50 to 54 Years | 27 (6.6%) | 37 (7.1%) |
| 55 to 59 Years | 11 (2.7%) | 24 (4.6%) |
| 60 to 64 Years | 56 (13.6%) | 51 (9.8%) |
| 65 to 69 Years | 28 (6.8%) | 44 (8.5%) |
| 70 to 74 Years | 10 (2.4%) | 20 (3.8%) |
| 75 to 79 Years | 10 (2.4%) | 6 (1.1%) |
| 80 to 84 Years | 4 (1.0%) | 4 (0.8%) |
| 85 Years and over | 4 (1.0%) | 12 (2.3%) |
| Total | 411 (100.0%) | 520 (100.0%) |
Families and Households in Waterloo
Median Family Size in Waterloo
The median family size in Waterloo is 3.01 persons per family, with married-couple families (219 | 83.9%) accounting for the largest median family size of 3.13 persons per family. On the other hand, single female/mother families (40 | 15.3%) represent the smallest median family size with 2.35 persons per family.
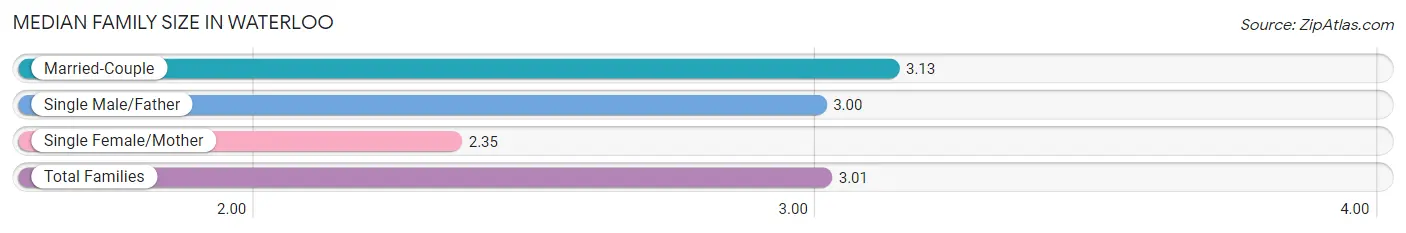
| Family Type | # Families | Family Size |
| Married-Couple | 219 (83.9%) | 3.13 |
| Single Male/Father | 2 (0.8%) | 3.00 |
| Single Female/Mother | 40 (15.3%) | 2.35 |
| Total Families | 261 (100.0%) | 3.01 |
Median Household Size in Waterloo
The median household size in Waterloo is 2.48 persons per household, with single male/father households (2 | 0.5%) accounting for the largest median household size of 4.5 persons per household. non-family households (115 | 30.6%) represent the smallest median household size with 1.22 persons per household.
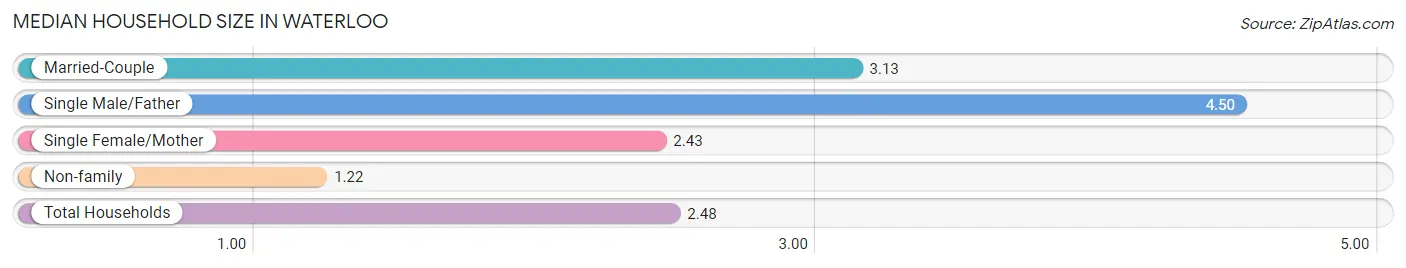
| Household Type | # Households | Household Size |
| Married-Couple | 219 (58.2%) | 3.13 |
| Single Male/Father | 2 (0.5%) | 4.50 |
| Single Female/Mother | 40 (10.6%) | 2.43 |
| Non-family | 115 (30.6%) | 1.22 |
| Total Households | 376 (100.0%) | 2.48 |
Household Size by Marriage Status in Waterloo
Out of a total of 376 households in Waterloo, 261 (69.4%) are family households, while 115 (30.6%) are nonfamily households. The most numerous type of family households are 2-person households, comprising 121, and the most common type of nonfamily households are 1-person households, comprising 93.
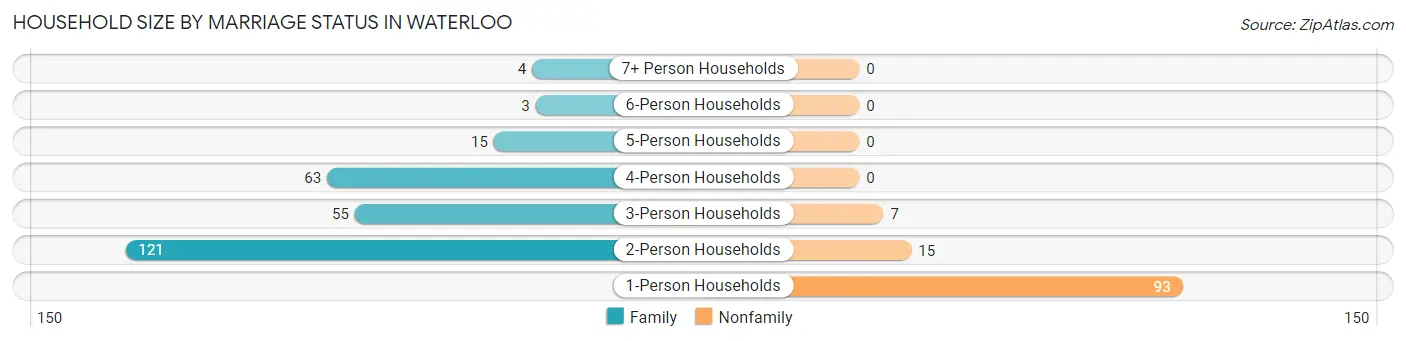
| Household Size | Family Households | Nonfamily Households |
| 1-Person Households | - | 93 (24.7%) |
| 2-Person Households | 121 (32.2%) | 15 (4.0%) |
| 3-Person Households | 55 (14.6%) | 7 (1.9%) |
| 4-Person Households | 63 (16.8%) | 0 (0.0%) |
| 5-Person Households | 15 (4.0%) | 0 (0.0%) |
| 6-Person Households | 3 (0.8%) | 0 (0.0%) |
| 7+ Person Households | 4 (1.1%) | 0 (0.0%) |
| Total | 261 (69.4%) | 115 (30.6%) |
Female Fertility in Waterloo
Fertility by Age in Waterloo
Average fertility rate in Waterloo is 25.0 births per 1,000 women. Women in the age bracket of 20 to 34 years have the highest fertility rate with 56.0 births per 1,000 women. Women in the age bracket of 20 to 34 years acount for 66.7% of all women with births.
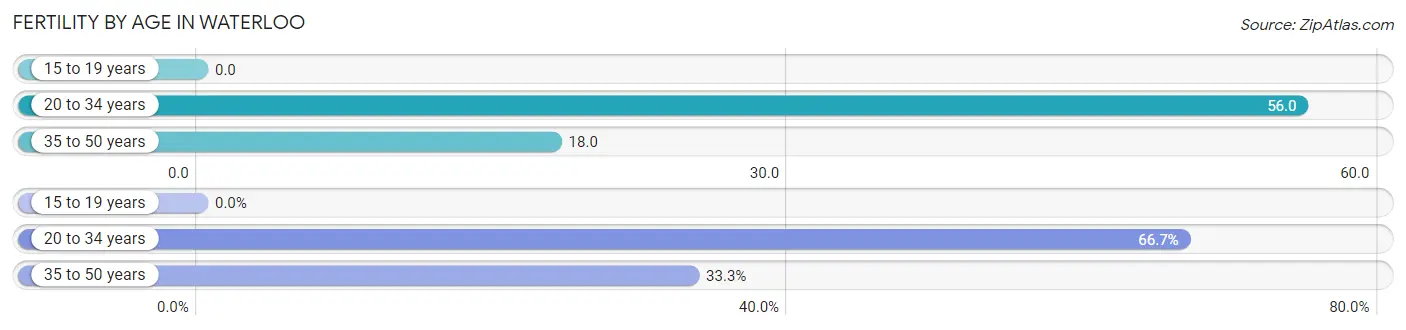
| Age Bracket | Women with Births | Births / 1,000 Women |
| 15 to 19 years | 0 (0.0%) | 0.0 |
| 20 to 34 years | 4 (66.7%) | 56.0 |
| 35 to 50 years | 2 (33.3%) | 18.0 |
| Total | 6 (100.0%) | 25.0 |
Fertility by Age by Marriage Status in Waterloo
66.7% of women with births (6) in Waterloo are married. The highest percentage of unmarried women with births falls into 20 to 34 years age bracket with 50.0% of them unmarried at the time of birth, while the lowest percentage of unmarried women with births belong to 35 to 50 years age bracket with 0.0% of them unmarried.
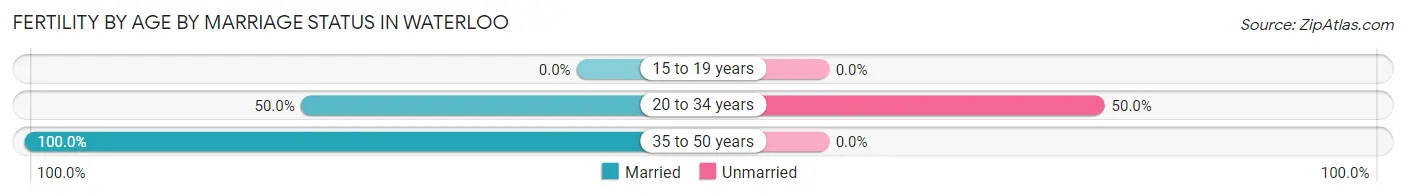
| Age Bracket | Married | Unmarried |
| 15 to 19 years | 0 (0.0%) | 0 (0.0%) |
| 20 to 34 years | 2 (50.0%) | 2 (50.0%) |
| 35 to 50 years | 2 (100.0%) | 0 (0.0%) |
| Total | 4 (66.7%) | 2 (33.3%) |
Fertility by Education in Waterloo
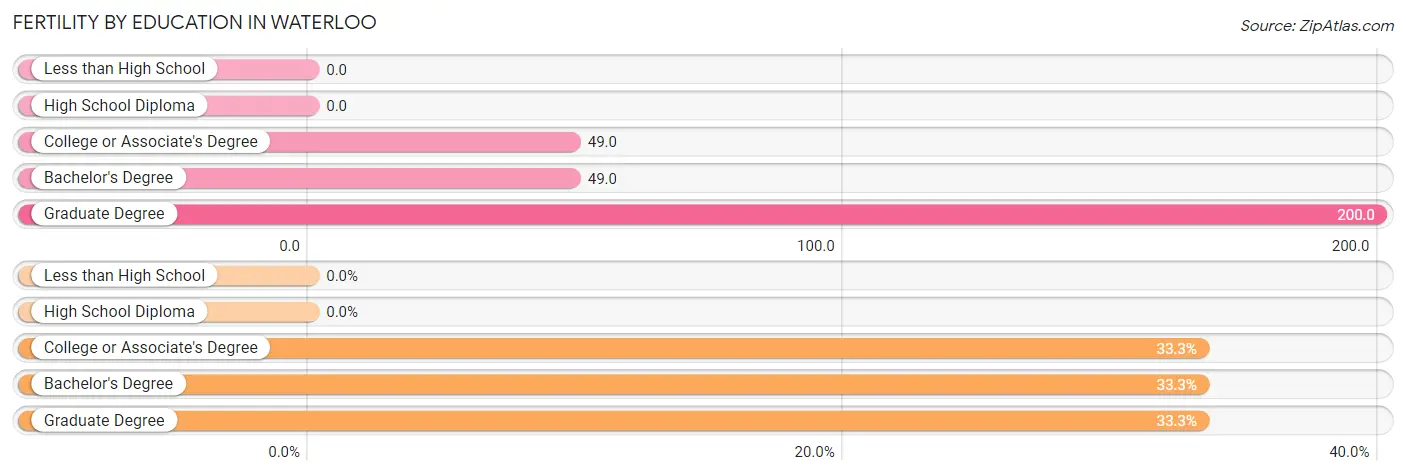
| Educational Attainment | Women with Births | Births / 1,000 Women |
| Less than High School | 0 (0.0%) | 0.0 |
| High School Diploma | 0 (0.0%) | 0.0 |
| College or Associate's Degree | 2 (33.3%) | 49.0 |
| Bachelor's Degree | 2 (33.3%) | 49.0 |
| Graduate Degree | 2 (33.3%) | 200.0 |
| Total | 6 (100.0%) | 25.0 |
Fertility by Education by Marriage Status in Waterloo
33.3% of women with births in Waterloo are unmarried. Women with the educational attainment of bachelor's degree are most likely to be married with 100.0% of them married at childbirth, while women with the educational attainment of college or associate's degree are least likely to be married with 100.0% of them unmarried at childbirth.
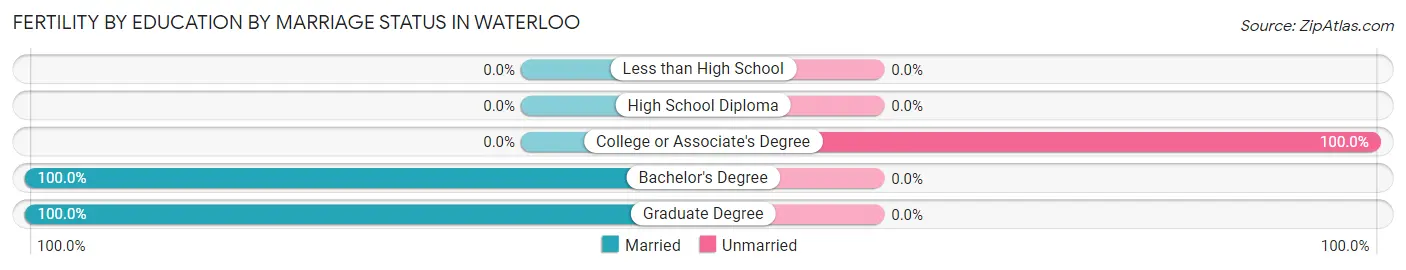
| Educational Attainment | Married | Unmarried |
| Less than High School | 0 (0.0%) | 0 (0.0%) |
| High School Diploma | 0 (0.0%) | 0 (0.0%) |
| College or Associate's Degree | 0 (0.0%) | 2 (100.0%) |
| Bachelor's Degree | 2 (100.0%) | 0 (0.0%) |
| Graduate Degree | 2 (100.0%) | 0 (0.0%) |
| Total | 4 (66.7%) | 2 (33.3%) |
Employment Characteristics in Waterloo
Employment by Class of Employer in Waterloo
Among the 461 employed individuals in Waterloo, private company employees (290 | 62.9%), not-for-profit organizations (74 | 16.1%), and local government employees (35 | 7.6%) make up the most common classes of employment.
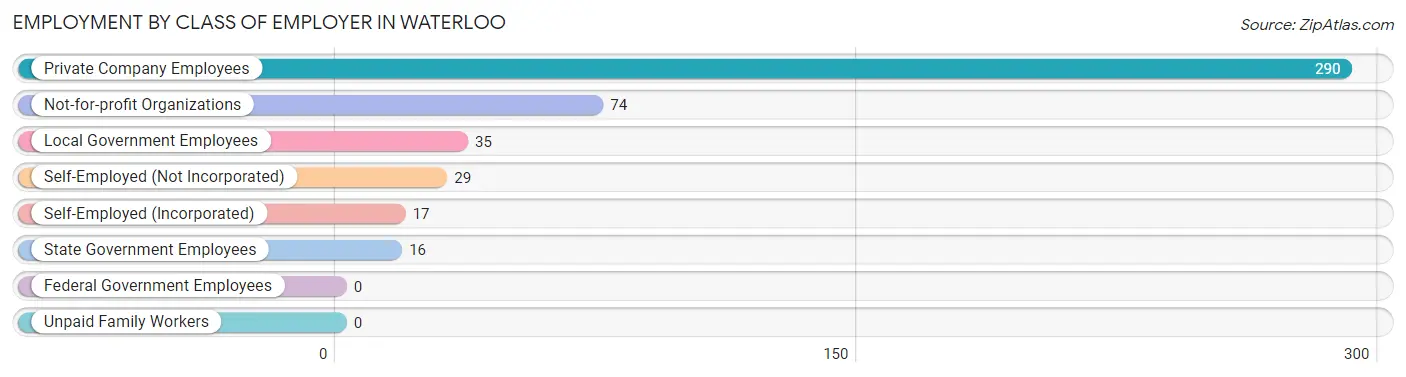
| Employer Class | # Employees | % Employees |
| Private Company Employees | 290 | 62.9% |
| Self-Employed (Incorporated) | 17 | 3.7% |
| Self-Employed (Not Incorporated) | 29 | 6.3% |
| Not-for-profit Organizations | 74 | 16.1% |
| Local Government Employees | 35 | 7.6% |
| State Government Employees | 16 | 3.5% |
| Federal Government Employees | 0 | 0.0% |
| Unpaid Family Workers | 0 | 0.0% |
| Total | 461 | 100.0% |
Employment Status by Age in Waterloo
According to the labor force statistics for Waterloo, out of the total population over 16 years of age (735), 64.4% or 473 individuals are in the labor force, with 1.3% or 6 of them unemployed. The age group with the highest labor force participation rate is 25 to 29 years, with 96.8% or 61 individuals in the labor force. Within the labor force, the 35 to 44 years age range has the highest percentage of unemployed individuals, with 5.6% or 5 of them being unemployed.
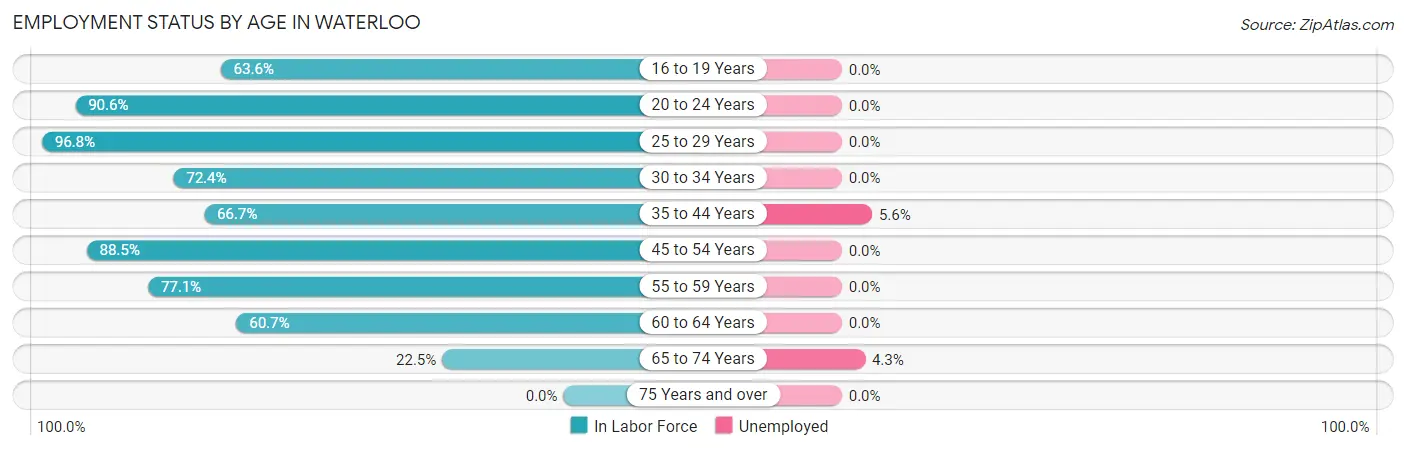
| Age Bracket | In Labor Force | Unemployed |
| 16 to 19 Years | 21 (63.6%) | 0 (0.0%) |
| 20 to 24 Years | 29 (90.6%) | 0 (0.0%) |
| 25 to 29 Years | 61 (96.8%) | 0 (0.0%) |
| 30 to 34 Years | 42 (72.4%) | 0 (0.0%) |
| 35 to 44 Years | 90 (66.7%) | 5 (5.6%) |
| 45 to 54 Years | 115 (88.5%) | 0 (0.0%) |
| 55 to 59 Years | 27 (77.1%) | 0 (0.0%) |
| 60 to 64 Years | 65 (60.7%) | 0 (0.0%) |
| 65 to 74 Years | 23 (22.5%) | 1 (4.3%) |
| 75 Years and over | 0 (0.0%) | 0 (0.0%) |
| Total | 473 (64.4%) | 6 (1.3%) |
Employment Status by Educational Attainment in Waterloo
According to labor force statistics for Waterloo, 75.8% of individuals (400) out of the total population between 25 and 64 years of age (528) are in the labor force, with 1.3% or 5 of them being unemployed. The group with the highest labor force participation rate are those with the educational attainment of less than high school, with 100.0% or 12 individuals in the labor force. Within the labor force, individuals with bachelor's degree or higher education have the highest percentage of unemployment, with 2.6% or 2 of them being unemployed.
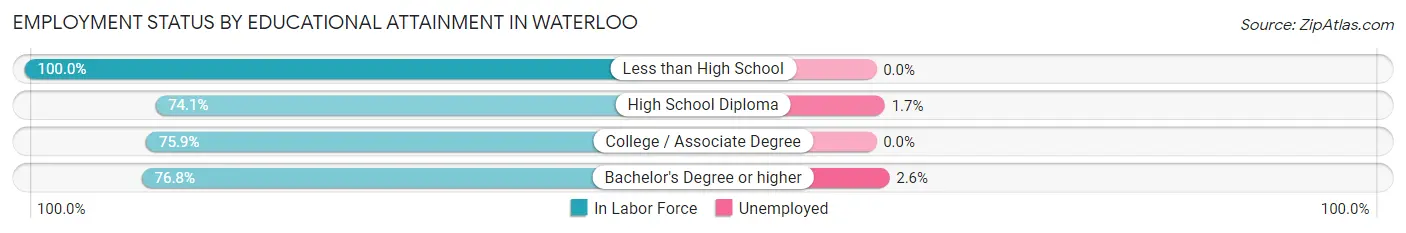
| Educational Attainment | In Labor Force | Unemployed |
| Less than High School | 12 (100.0%) | 0 (0.0%) |
| High School Diploma | 180 (74.1%) | 4 (1.7%) |
| College / Associate Degree | 132 (75.9%) | 0 (0.0%) |
| Bachelor's Degree or higher | 76 (76.8%) | 3 (2.6%) |
| Total | 400 (75.8%) | 7 (1.3%) |
Employment Occupations by Sex in Waterloo
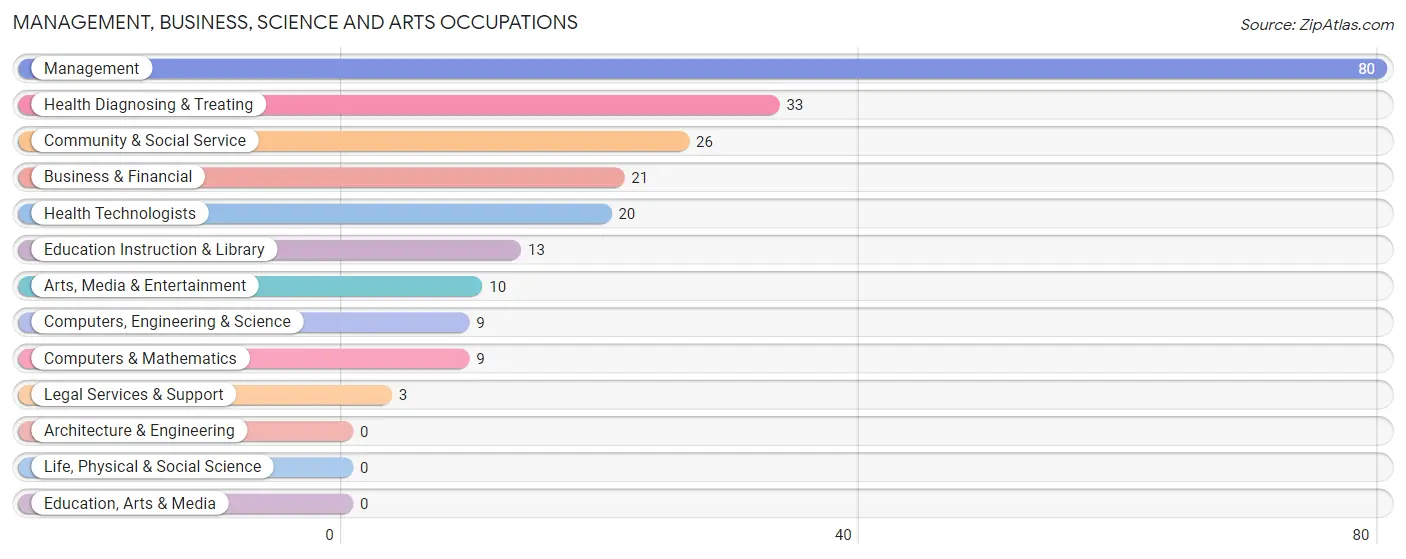
Management, Business, Science and Arts Occupations
The most common Management, Business, Science and Arts occupations in Waterloo are Management (80 | 17.1%), Health Diagnosing & Treating (33 | 7.1%), Community & Social Service (26 | 5.6%), Business & Financial (21 | 4.5%), and Health Technologists (20 | 4.3%).
Management, Business, Science and Arts Occupations by Sex
Within the Management, Business, Science and Arts occupations in Waterloo, the most male-oriented occupations are Management (86.3%), Computers, Engineering & Science (77.8%), and Computers & Mathematics (77.8%), while the most female-oriented occupations are Community & Social Service (100.0%), Legal Services & Support (100.0%), and Education Instruction & Library (100.0%).
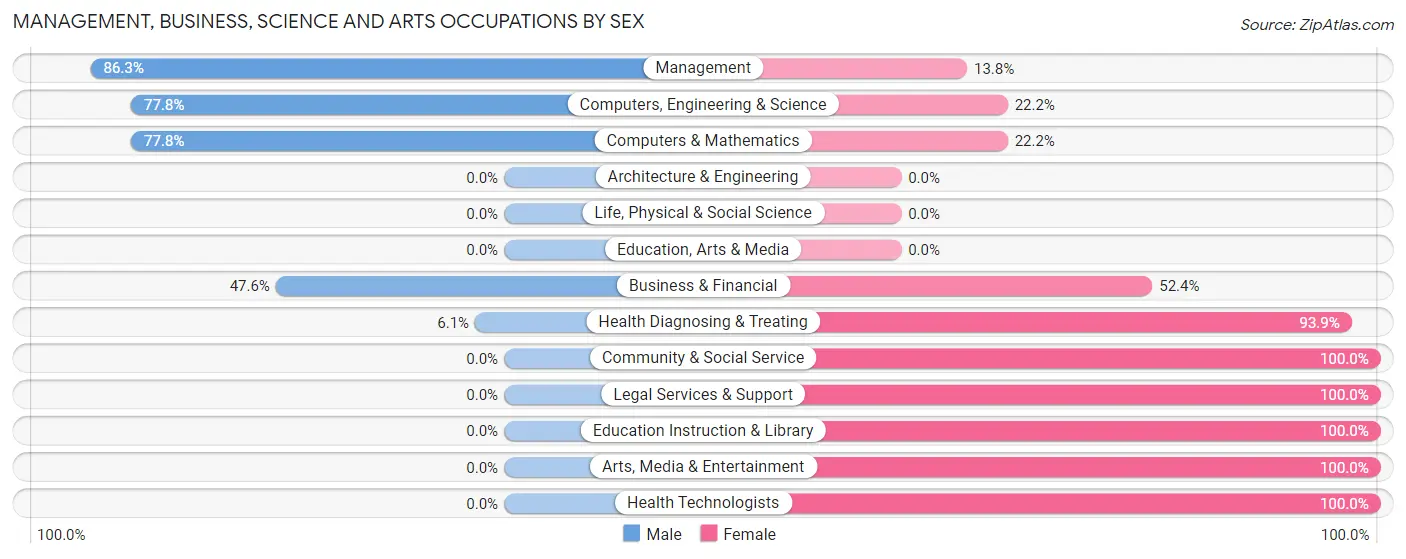
| Occupation | Male | Female |
| Management | 69 (86.3%) | 11 (13.8%) |
| Business & Financial | 10 (47.6%) | 11 (52.4%) |
| Computers, Engineering & Science | 7 (77.8%) | 2 (22.2%) |
| Computers & Mathematics | 7 (77.8%) | 2 (22.2%) |
| Architecture & Engineering | 0 (0.0%) | 0 (0.0%) |
| Life, Physical & Social Science | 0 (0.0%) | 0 (0.0%) |
| Community & Social Service | 0 (0.0%) | 26 (100.0%) |
| Education, Arts & Media | 0 (0.0%) | 0 (0.0%) |
| Legal Services & Support | 0 (0.0%) | 3 (100.0%) |
| Education Instruction & Library | 0 (0.0%) | 13 (100.0%) |
| Arts, Media & Entertainment | 0 (0.0%) | 10 (100.0%) |
| Health Diagnosing & Treating | 2 (6.1%) | 31 (93.9%) |
| Health Technologists | 0 (0.0%) | 20 (100.0%) |
| Total (Category) | 88 (52.1%) | 81 (47.9%) |
| Total (Overall) | 259 (55.5%) | 208 (44.5%) |
Services Occupations
The most common Services occupations in Waterloo are Food Preparation & Serving (37 | 7.9%), Cleaning & Maintenance (25 | 5.3%), Healthcare Support (14 | 3.0%), Personal Care & Service (14 | 3.0%), and Security & Protection (2 | 0.4%).
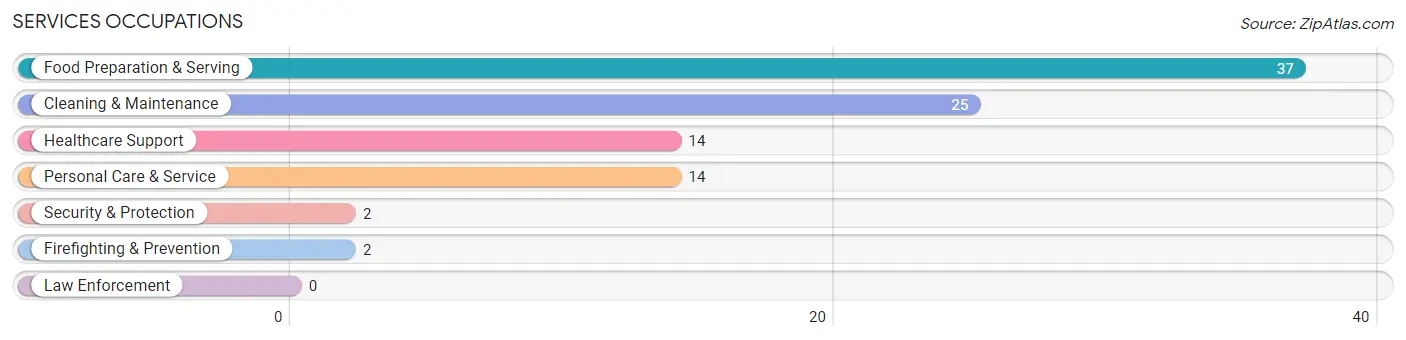
Services Occupations by Sex
Within the Services occupations in Waterloo, the most male-oriented occupations are Security & Protection (100.0%), Firefighting & Prevention (100.0%), and Food Preparation & Serving (56.8%), while the most female-oriented occupations are Healthcare Support (100.0%), Personal Care & Service (100.0%), and Cleaning & Maintenance (64.0%).
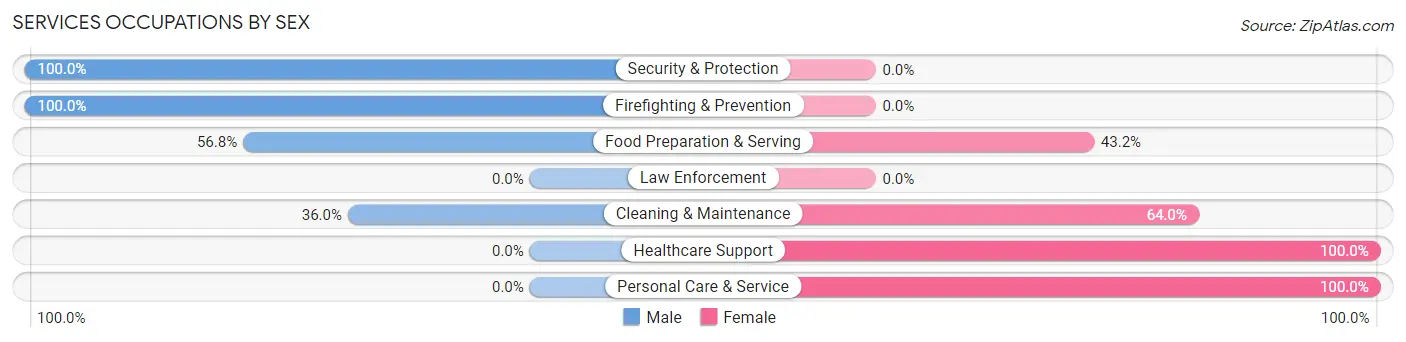
| Occupation | Male | Female |
| Healthcare Support | 0 (0.0%) | 14 (100.0%) |
| Security & Protection | 2 (100.0%) | 0 (0.0%) |
| Firefighting & Prevention | 2 (100.0%) | 0 (0.0%) |
| Law Enforcement | 0 (0.0%) | 0 (0.0%) |
| Food Preparation & Serving | 21 (56.8%) | 16 (43.2%) |
| Cleaning & Maintenance | 9 (36.0%) | 16 (64.0%) |
| Personal Care & Service | 0 (0.0%) | 14 (100.0%) |
| Total (Category) | 32 (34.8%) | 60 (65.2%) |
| Total (Overall) | 259 (55.5%) | 208 (44.5%) |
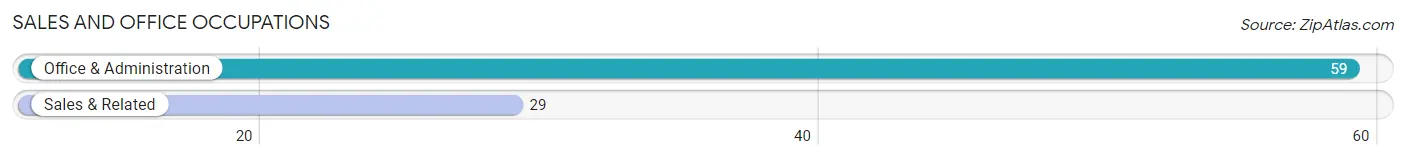
Sales and Office Occupations
The most common Sales and Office occupations in Waterloo are Office & Administration (59 | 12.6%), and Sales & Related (29 | 6.2%).
Sales and Office Occupations by Sex
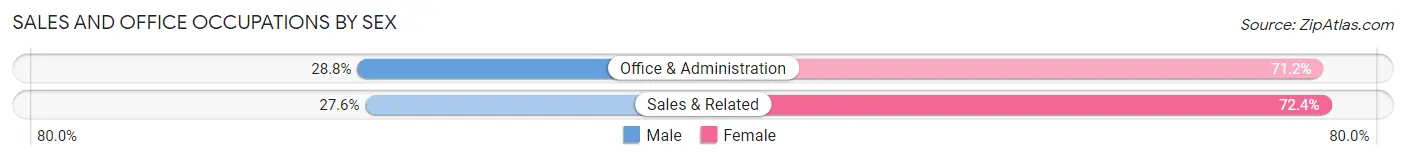
| Occupation | Male | Female |
| Sales & Related | 8 (27.6%) | 21 (72.4%) |
| Office & Administration | 17 (28.8%) | 42 (71.2%) |
| Total (Category) | 25 (28.4%) | 63 (71.6%) |
| Total (Overall) | 259 (55.5%) | 208 (44.5%) |
Natural Resources, Construction and Maintenance Occupations
The most common Natural Resources, Construction and Maintenance occupations in Waterloo are Construction & Extraction (52 | 11.1%), Installation, Maintenance & Repair (40 | 8.6%), and Farming, Fishing & Forestry (3 | 0.6%).
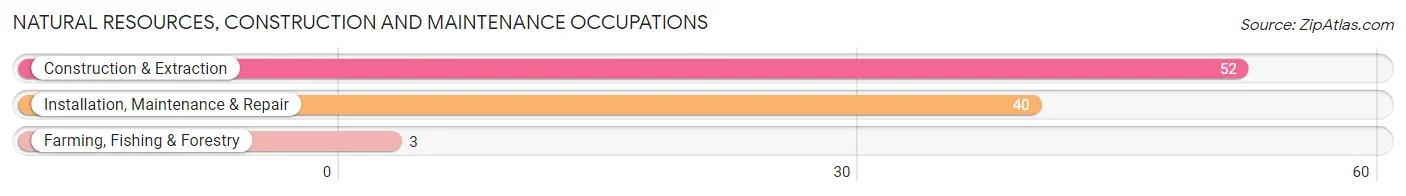
Natural Resources, Construction and Maintenance Occupations by Sex
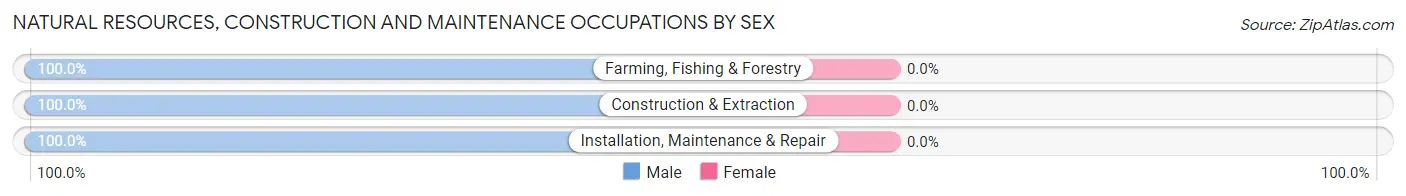
| Occupation | Male | Female |
| Farming, Fishing & Forestry | 3 (100.0%) | 0 (0.0%) |
| Construction & Extraction | 52 (100.0%) | 0 (0.0%) |
| Installation, Maintenance & Repair | 40 (100.0%) | 0 (0.0%) |
| Total (Category) | 95 (100.0%) | 0 (0.0%) |
| Total (Overall) | 259 (55.5%) | 208 (44.5%) |
Production, Transportation and Moving Occupations
The most common Production, Transportation and Moving occupations in Waterloo are Transportation (10 | 2.1%), Production (9 | 1.9%), and Material Moving (4 | 0.9%).
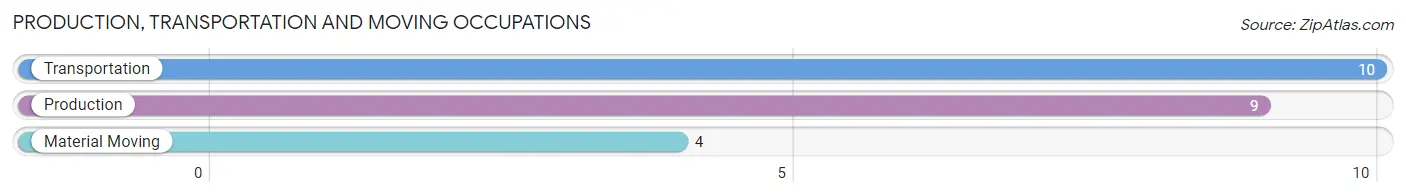
Production, Transportation and Moving Occupations by Sex
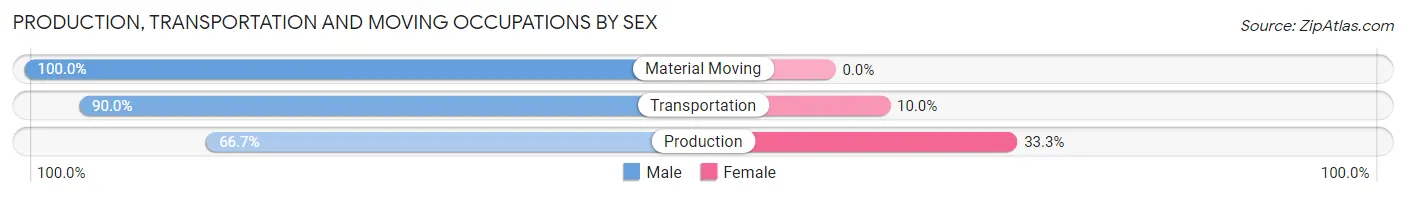
| Occupation | Male | Female |
| Production | 6 (66.7%) | 3 (33.3%) |
| Transportation | 9 (90.0%) | 1 (10.0%) |
| Material Moving | 4 (100.0%) | 0 (0.0%) |
| Total (Category) | 19 (82.6%) | 4 (17.4%) |
| Total (Overall) | 259 (55.5%) | 208 (44.5%) |
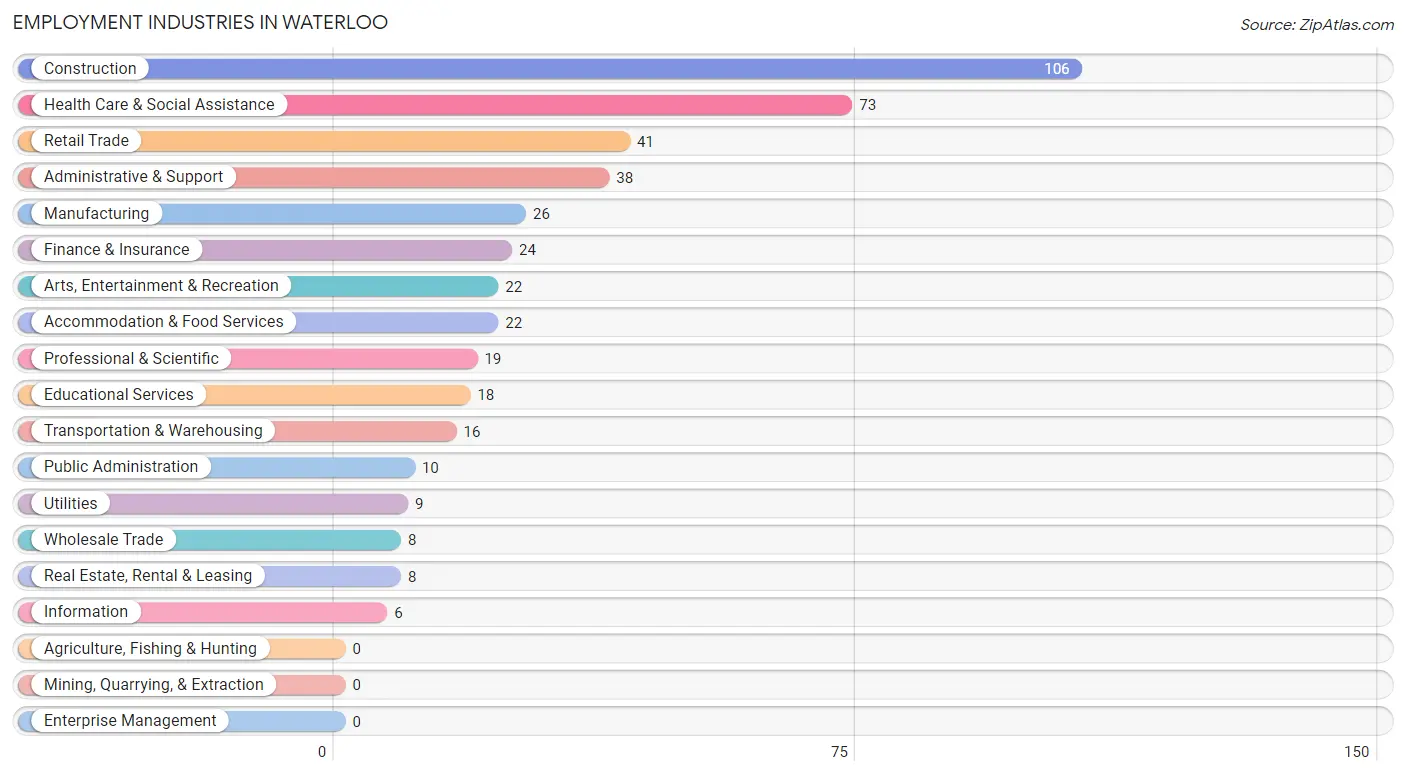
Employment Industries by Sex in Waterloo
Employment Industries in Waterloo
The major employment industries in Waterloo include Construction (106 | 22.7%), Health Care & Social Assistance (73 | 15.6%), Retail Trade (41 | 8.8%), Administrative & Support (38 | 8.1%), and Manufacturing (26 | 5.6%).
Employment Industries by Sex in Waterloo
The Waterloo industries that see more men than women are Wholesale Trade (100.0%), Utilities (100.0%), and Construction (96.2%), whereas the industries that tend to have a higher number of women are Information (100.0%), Educational Services (94.4%), and Public Administration (90.0%).
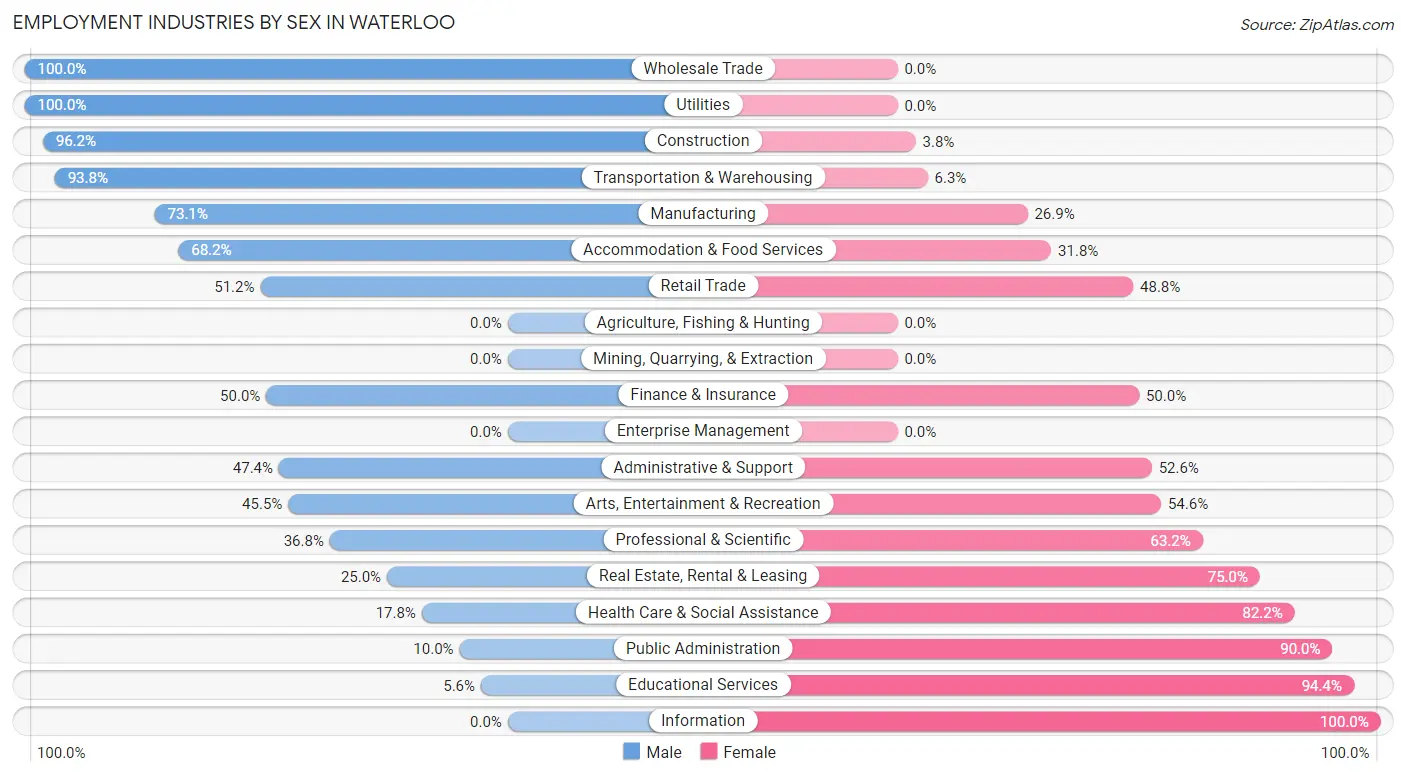
| Industry | Male | Female |
| Agriculture, Fishing & Hunting | 0 (0.0%) | 0 (0.0%) |
| Mining, Quarrying, & Extraction | 0 (0.0%) | 0 (0.0%) |
| Construction | 102 (96.2%) | 4 (3.8%) |
| Manufacturing | 19 (73.1%) | 7 (26.9%) |
| Wholesale Trade | 8 (100.0%) | 0 (0.0%) |
| Retail Trade | 21 (51.2%) | 20 (48.8%) |
| Transportation & Warehousing | 15 (93.8%) | 1 (6.2%) |
| Utilities | 9 (100.0%) | 0 (0.0%) |
| Information | 0 (0.0%) | 6 (100.0%) |
| Finance & Insurance | 12 (50.0%) | 12 (50.0%) |
| Real Estate, Rental & Leasing | 2 (25.0%) | 6 (75.0%) |
| Professional & Scientific | 7 (36.8%) | 12 (63.2%) |
| Enterprise Management | 0 (0.0%) | 0 (0.0%) |
| Administrative & Support | 18 (47.4%) | 20 (52.6%) |
| Educational Services | 1 (5.6%) | 17 (94.4%) |
| Health Care & Social Assistance | 13 (17.8%) | 60 (82.2%) |
| Arts, Entertainment & Recreation | 10 (45.5%) | 12 (54.5%) |
| Accommodation & Food Services | 15 (68.2%) | 7 (31.8%) |
| Public Administration | 1 (10.0%) | 9 (90.0%) |
| Total | 259 (55.5%) | 208 (44.5%) |
Education in Waterloo
School Enrollment in Waterloo
The most common levels of schooling among the 211 students in Waterloo are high school (77 | 36.5%), middle school (72 | 34.1%), and elementary school (30 | 14.2%).
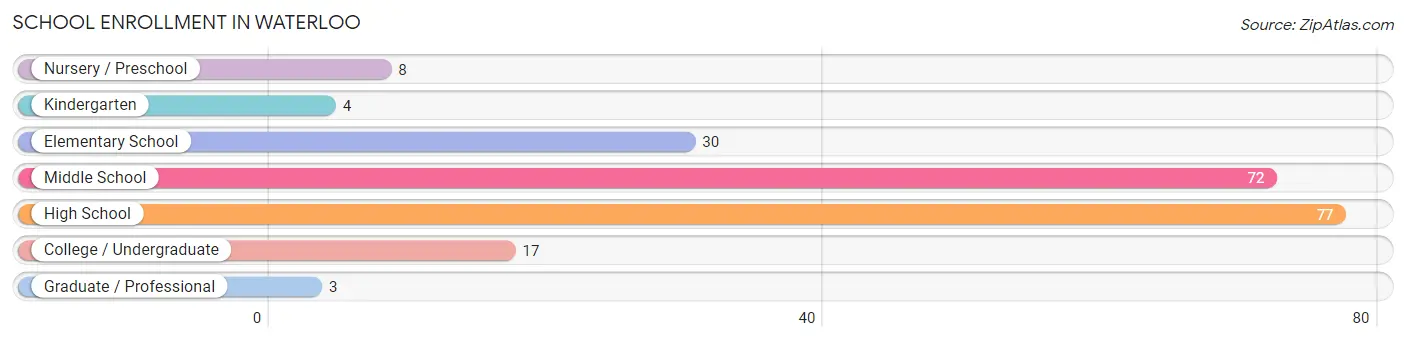
| School Level | # Students | % Students |
| Nursery / Preschool | 8 | 3.8% |
| Kindergarten | 4 | 1.9% |
| Elementary School | 30 | 14.2% |
| Middle School | 72 | 34.1% |
| High School | 77 | 36.5% |
| College / Undergraduate | 17 | 8.1% |
| Graduate / Professional | 3 | 1.4% |
| Total | 211 | 100.0% |
School Enrollment by Age by Funding Source in Waterloo
Out of a total of 211 students who are enrolled in schools in Waterloo, 98 (46.4%) attend a private institution, while the remaining 113 (53.6%) are enrolled in public schools. The age group of 15 to 17 year olds has the highest likelihood of being enrolled in private schools, with 42 (65.6% in the age bracket) enrolled. Conversely, the age group of 35 years and over has the lowest likelihood of being enrolled in a private school, with 4 (100.0% in the age bracket) attending a public institution.
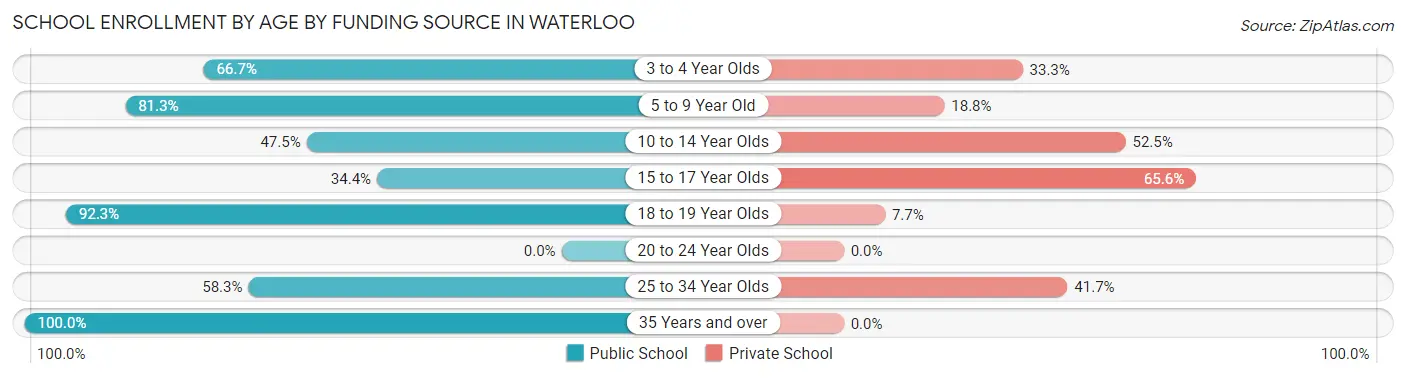
| Age Bracket | Public School | Private School |
| 3 to 4 Year Olds | 4 (66.7%) | 2 (33.3%) |
| 5 to 9 Year Old | 26 (81.2%) | 6 (18.8%) |
| 10 to 14 Year Olds | 38 (47.5%) | 42 (52.5%) |
| 15 to 17 Year Olds | 22 (34.4%) | 42 (65.6%) |
| 18 to 19 Year Olds | 12 (92.3%) | 1 (7.7%) |
| 20 to 24 Year Olds | 0 (0.0%) | 0 (0.0%) |
| 25 to 34 Year Olds | 7 (58.3%) | 5 (41.7%) |
| 35 Years and over | 4 (100.0%) | 0 (0.0%) |
| Total | 113 (53.6%) | 98 (46.4%) |
Educational Attainment by Field of Study in Waterloo
Business (36 | 26.7%), education (19 | 14.1%), science & technology (18 | 13.3%), arts & humanities (14 | 10.4%), and psychology (13 | 9.6%) are the most common fields of study among 135 individuals in Waterloo who have obtained a bachelor's degree or higher.
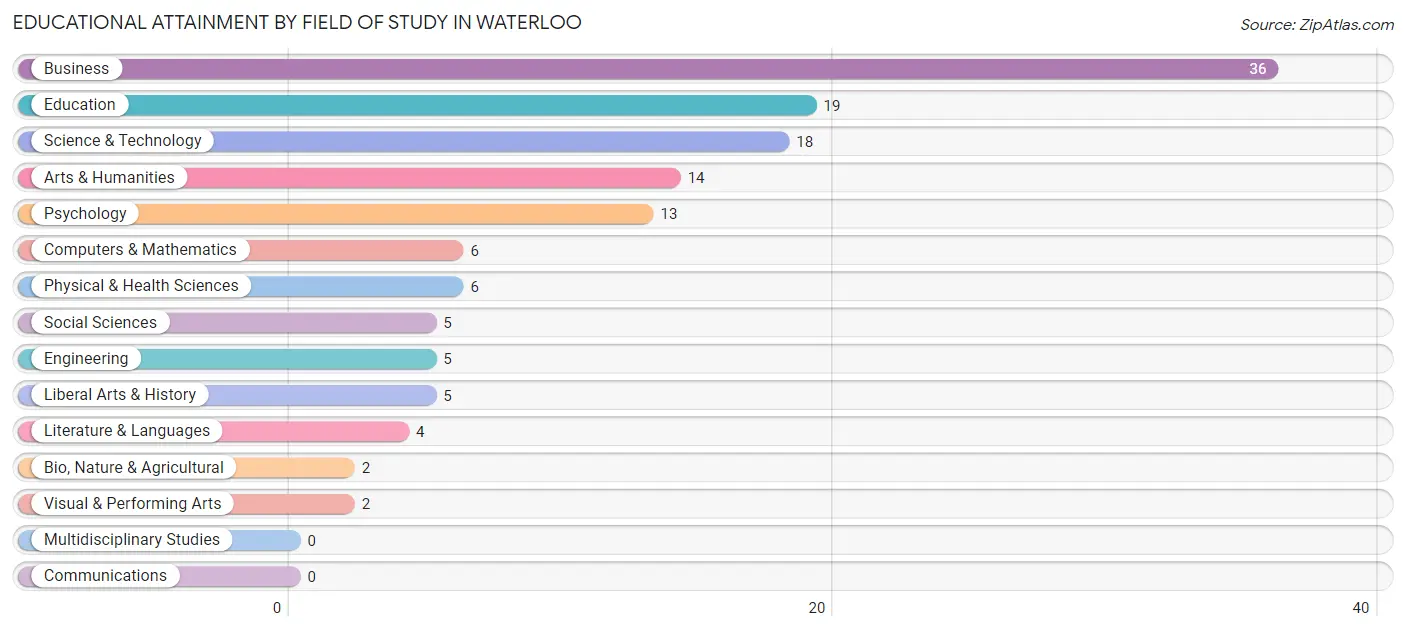
| Field of Study | # Graduates | % Graduates |
| Computers & Mathematics | 6 | 4.4% |
| Bio, Nature & Agricultural | 2 | 1.5% |
| Physical & Health Sciences | 6 | 4.4% |
| Psychology | 13 | 9.6% |
| Social Sciences | 5 | 3.7% |
| Engineering | 5 | 3.7% |
| Multidisciplinary Studies | 0 | 0.0% |
| Science & Technology | 18 | 13.3% |
| Business | 36 | 26.7% |
| Education | 19 | 14.1% |
| Literature & Languages | 4 | 3.0% |
| Liberal Arts & History | 5 | 3.7% |
| Visual & Performing Arts | 2 | 1.5% |
| Communications | 0 | 0.0% |
| Arts & Humanities | 14 | 10.4% |
| Total | 135 | 100.0% |
Transportation & Commute in Waterloo
Vehicle Availability by Sex in Waterloo
The most prevalent vehicle ownership categories in Waterloo are males with 2 vehicles (114, accounting for 44.5%) and females with 2 vehicles (76, making up 55.6%).
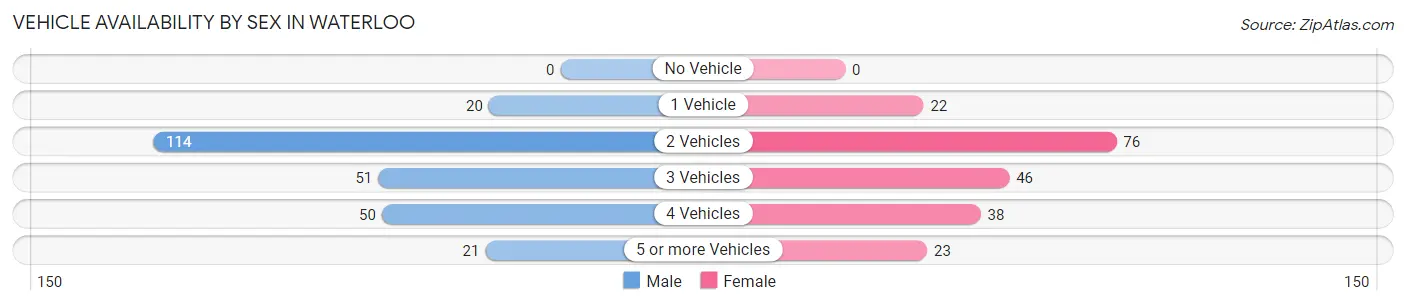
| Vehicles Available | Male | Female |
| No Vehicle | 0 (0.0%) | 0 (0.0%) |
| 1 Vehicle | 20 (7.8%) | 22 (10.7%) |
| 2 Vehicles | 114 (44.5%) | 76 (37.1%) |
| 3 Vehicles | 51 (19.9%) | 46 (22.4%) |
| 4 Vehicles | 50 (19.5%) | 38 (18.5%) |
| 5 or more Vehicles | 21 (8.2%) | 23 (11.2%) |
| Total | 256 (100.0%) | 205 (100.0%) |
Commute Time in Waterloo
The most frequently occuring commute durations in Waterloo are 30 to 34 minutes (79 commuters, 18.2%), 20 to 24 minutes (59 commuters, 13.6%), and 25 to 29 minutes (59 commuters, 13.6%).
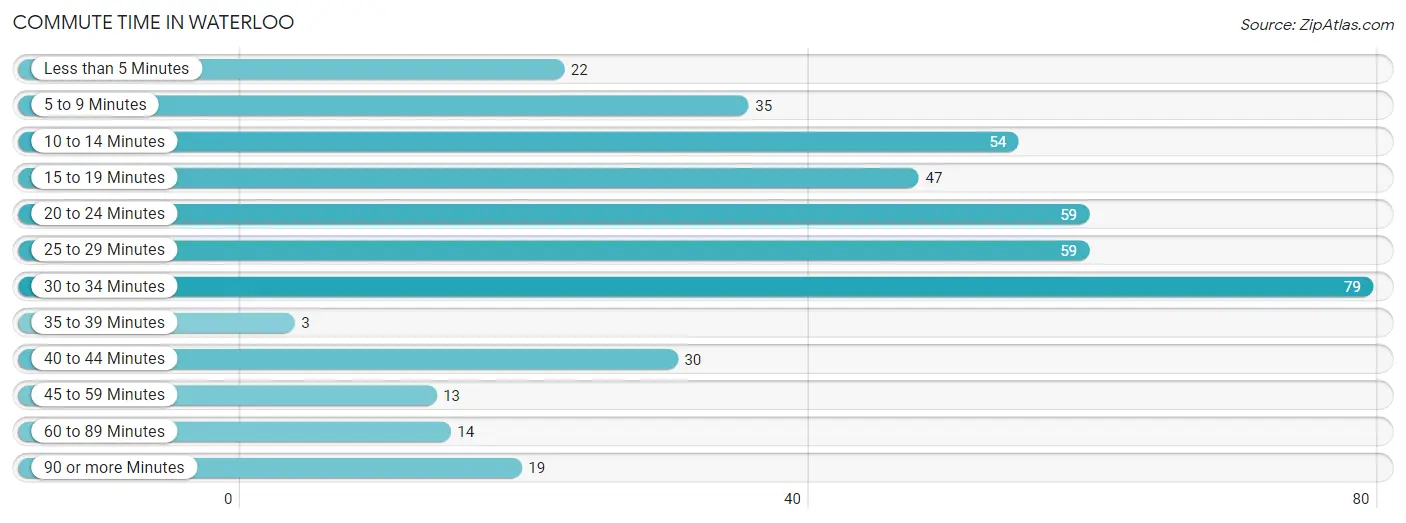
| Commute Time | # Commuters | % Commuters |
| Less than 5 Minutes | 22 | 5.1% |
| 5 to 9 Minutes | 35 | 8.1% |
| 10 to 14 Minutes | 54 | 12.4% |
| 15 to 19 Minutes | 47 | 10.8% |
| 20 to 24 Minutes | 59 | 13.6% |
| 25 to 29 Minutes | 59 | 13.6% |
| 30 to 34 Minutes | 79 | 18.2% |
| 35 to 39 Minutes | 3 | 0.7% |
| 40 to 44 Minutes | 30 | 6.9% |
| 45 to 59 Minutes | 13 | 3.0% |
| 60 to 89 Minutes | 14 | 3.2% |
| 90 or more Minutes | 19 | 4.4% |
Commute Time by Sex in Waterloo
The most common commute times in Waterloo are 30 to 34 minutes (73 commuters, 30.7%) for males and 10 to 14 minutes (40 commuters, 20.4%) for females.
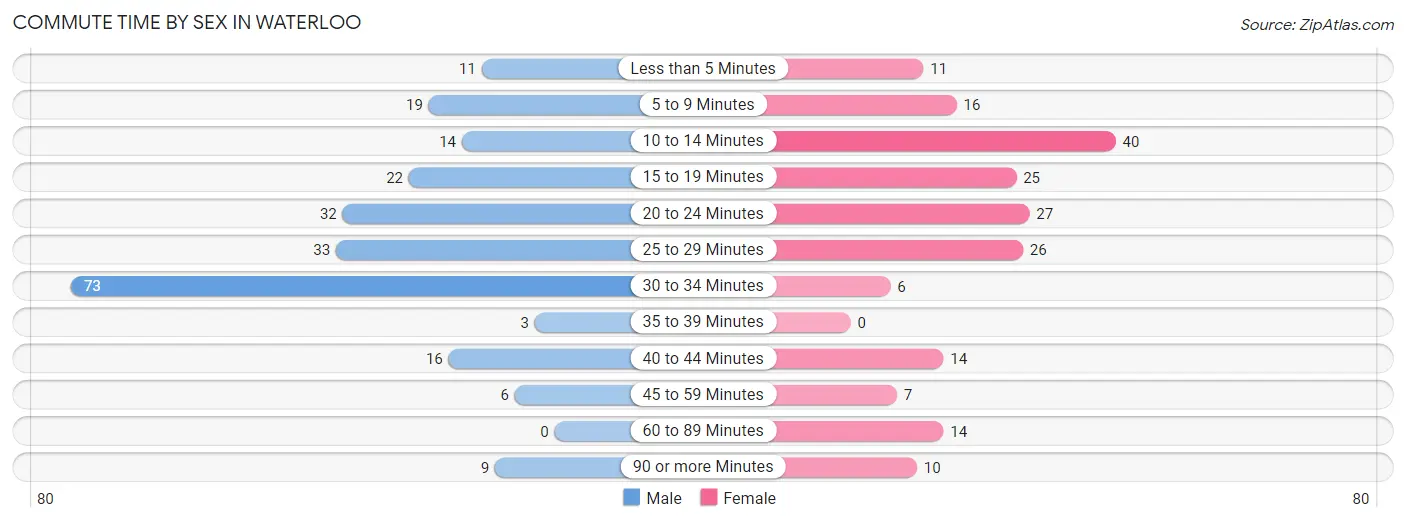
| Commute Time | Male | Female |
| Less than 5 Minutes | 11 (4.6%) | 11 (5.6%) |
| 5 to 9 Minutes | 19 (8.0%) | 16 (8.2%) |
| 10 to 14 Minutes | 14 (5.9%) | 40 (20.4%) |
| 15 to 19 Minutes | 22 (9.2%) | 25 (12.8%) |
| 20 to 24 Minutes | 32 (13.5%) | 27 (13.8%) |
| 25 to 29 Minutes | 33 (13.9%) | 26 (13.3%) |
| 30 to 34 Minutes | 73 (30.7%) | 6 (3.1%) |
| 35 to 39 Minutes | 3 (1.3%) | 0 (0.0%) |
| 40 to 44 Minutes | 16 (6.7%) | 14 (7.1%) |
| 45 to 59 Minutes | 6 (2.5%) | 7 (3.6%) |
| 60 to 89 Minutes | 0 (0.0%) | 14 (7.1%) |
| 90 or more Minutes | 9 (3.8%) | 10 (5.1%) |
Time of Departure to Work by Sex in Waterloo
The most frequent times of departure to work in Waterloo are 6:30 AM to 6:59 AM (62, 26.1%) for males and 7:30 AM to 7:59 AM (35, 17.9%) for females.
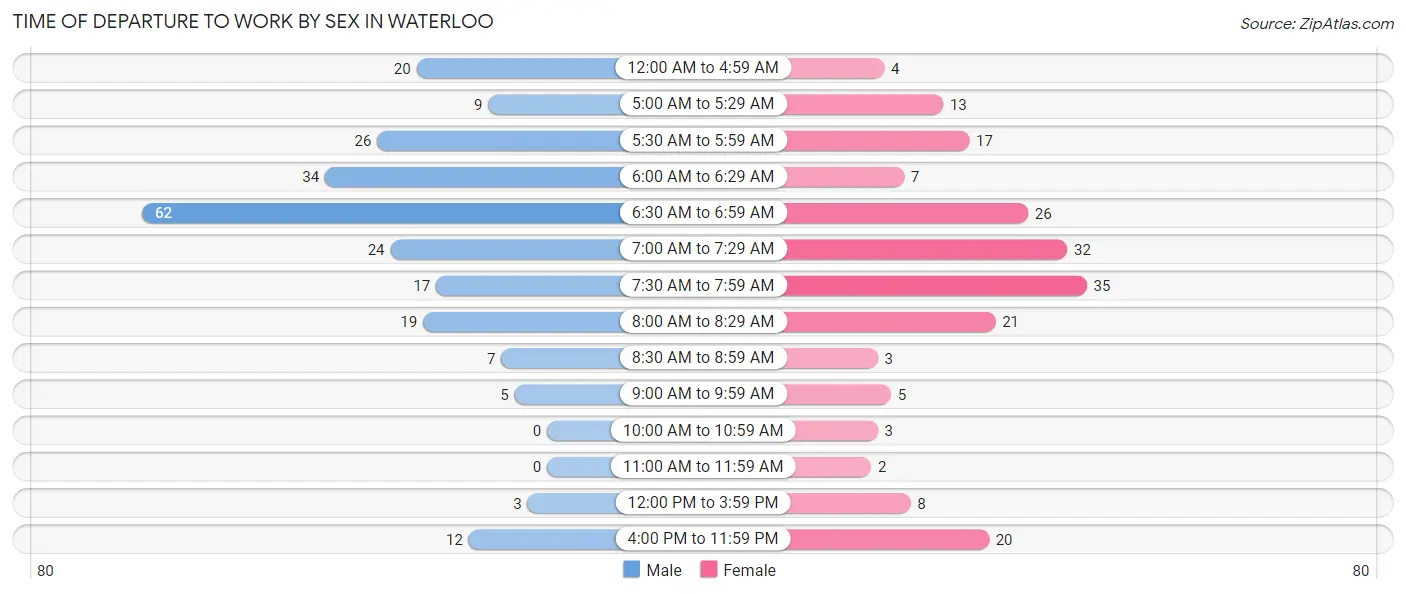
| Time of Departure | Male | Female |
| 12:00 AM to 4:59 AM | 20 (8.4%) | 4 (2.0%) |
| 5:00 AM to 5:29 AM | 9 (3.8%) | 13 (6.6%) |
| 5:30 AM to 5:59 AM | 26 (10.9%) | 17 (8.7%) |
| 6:00 AM to 6:29 AM | 34 (14.3%) | 7 (3.6%) |
| 6:30 AM to 6:59 AM | 62 (26.1%) | 26 (13.3%) |
| 7:00 AM to 7:29 AM | 24 (10.1%) | 32 (16.3%) |
| 7:30 AM to 7:59 AM | 17 (7.1%) | 35 (17.9%) |
| 8:00 AM to 8:29 AM | 19 (8.0%) | 21 (10.7%) |
| 8:30 AM to 8:59 AM | 7 (2.9%) | 3 (1.5%) |
| 9:00 AM to 9:59 AM | 5 (2.1%) | 5 (2.5%) |
| 10:00 AM to 10:59 AM | 0 (0.0%) | 3 (1.5%) |
| 11:00 AM to 11:59 AM | 0 (0.0%) | 2 (1.0%) |
| 12:00 PM to 3:59 PM | 3 (1.3%) | 8 (4.1%) |
| 4:00 PM to 11:59 PM | 12 (5.0%) | 20 (10.2%) |
| Total | 238 (100.0%) | 196 (100.0%) |
Housing Occupancy in Waterloo
Occupancy by Ownership in Waterloo
Of the total 376 dwellings in Waterloo, owner-occupied units account for 288 (76.6%), while renter-occupied units make up 88 (23.4%).
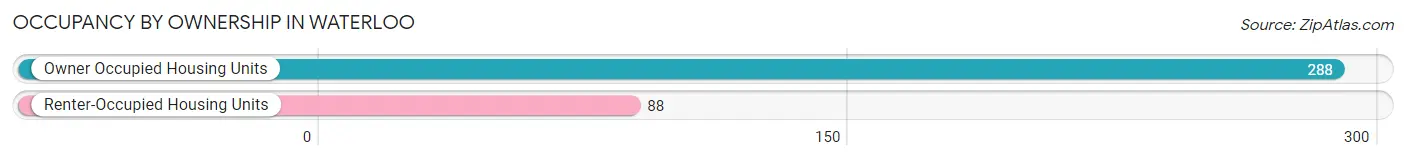
| Occupancy | # Housing Units | % Housing Units |
| Owner Occupied Housing Units | 288 | 76.6% |
| Renter-Occupied Housing Units | 88 | 23.4% |
| Total Occupied Housing Units | 376 | 100.0% |
Occupancy by Household Size in Waterloo
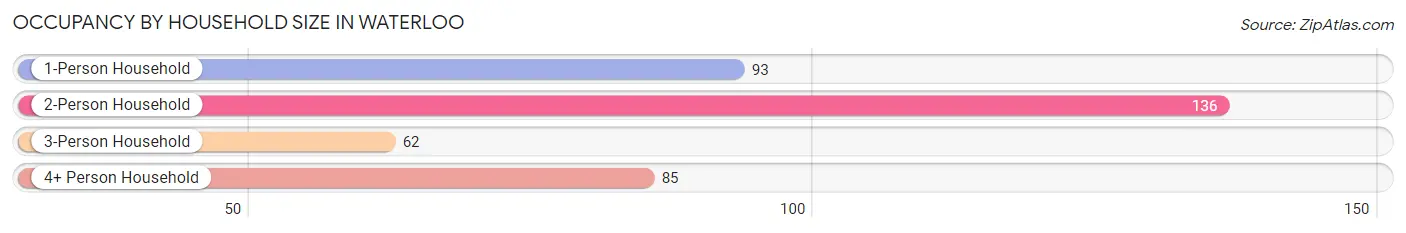
| Household Size | # Housing Units | % Housing Units |
| 1-Person Household | 93 | 24.7% |
| 2-Person Household | 136 | 36.2% |
| 3-Person Household | 62 | 16.5% |
| 4+ Person Household | 85 | 22.6% |
| Total Housing Units | 376 | 100.0% |
Occupancy by Ownership by Household Size in Waterloo
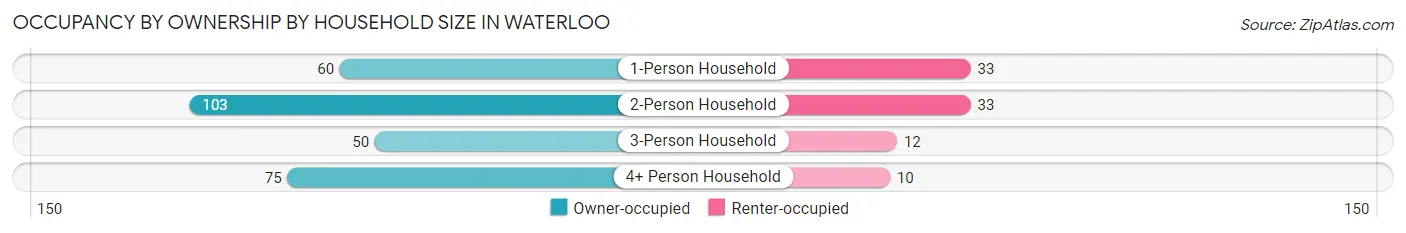
| Household Size | Owner-occupied | Renter-occupied |
| 1-Person Household | 60 (64.5%) | 33 (35.5%) |
| 2-Person Household | 103 (75.7%) | 33 (24.3%) |
| 3-Person Household | 50 (80.6%) | 12 (19.4%) |
| 4+ Person Household | 75 (88.2%) | 10 (11.8%) |
| Total Housing Units | 288 (76.6%) | 88 (23.4%) |
Occupancy by Educational Attainment in Waterloo
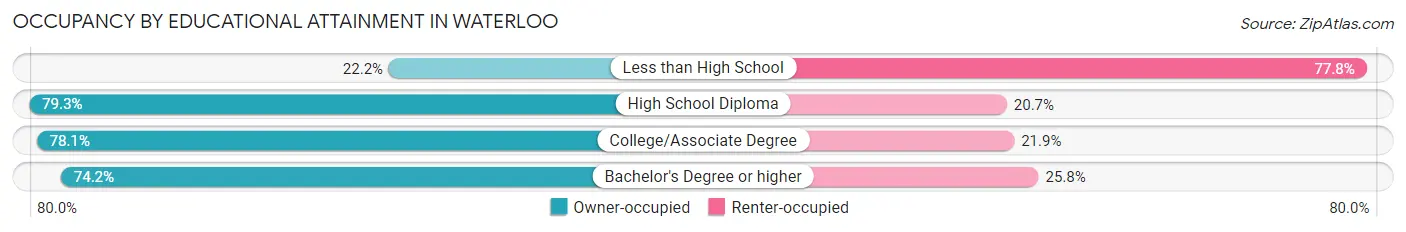
| Household Size | Owner-occupied | Renter-occupied |
| Less than High School | 2 (22.2%) | 7 (77.8%) |
| High School Diploma | 130 (79.3%) | 34 (20.7%) |
| College/Associate Degree | 107 (78.1%) | 30 (21.9%) |
| Bachelor's Degree or higher | 49 (74.2%) | 17 (25.8%) |
Occupancy by Age of Householder in Waterloo
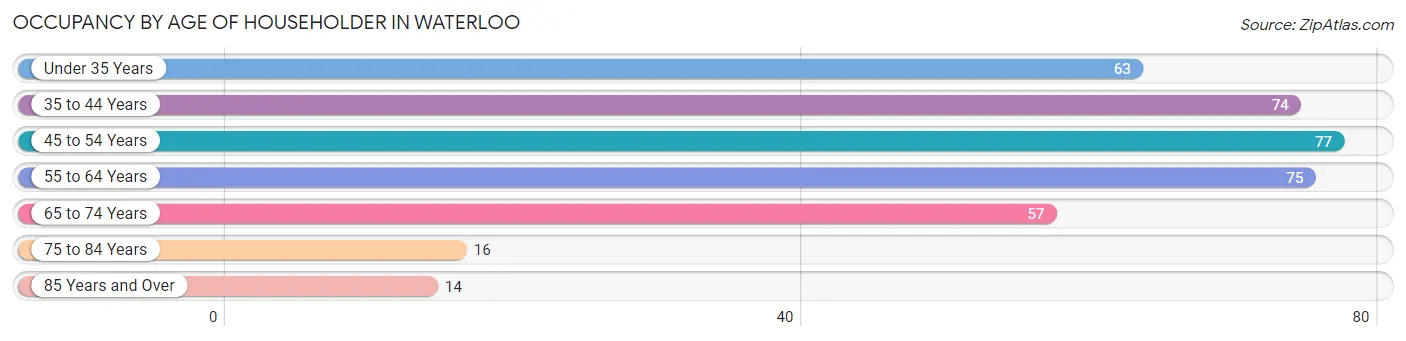
| Age Bracket | # Households | % Households |
| Under 35 Years | 63 | 16.8% |
| 35 to 44 Years | 74 | 19.7% |
| 45 to 54 Years | 77 | 20.5% |
| 55 to 64 Years | 75 | 20.0% |
| 65 to 74 Years | 57 | 15.2% |
| 75 to 84 Years | 16 | 4.3% |
| 85 Years and Over | 14 | 3.7% |
| Total | 376 | 100.0% |
Housing Finances in Waterloo
Median Income by Occupancy in Waterloo
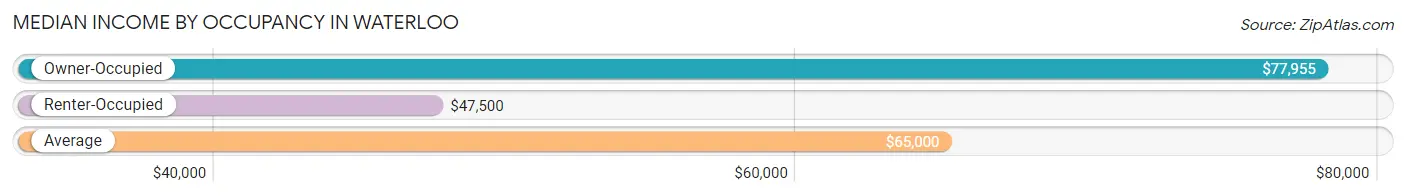
| Occupancy Type | # Households | Median Income |
| Owner-Occupied | 288 (76.6%) | $77,955 |
| Renter-Occupied | 88 (23.4%) | $47,500 |
| Average | 376 (100.0%) | $65,000 |
Occupancy by Householder Income Bracket in Waterloo
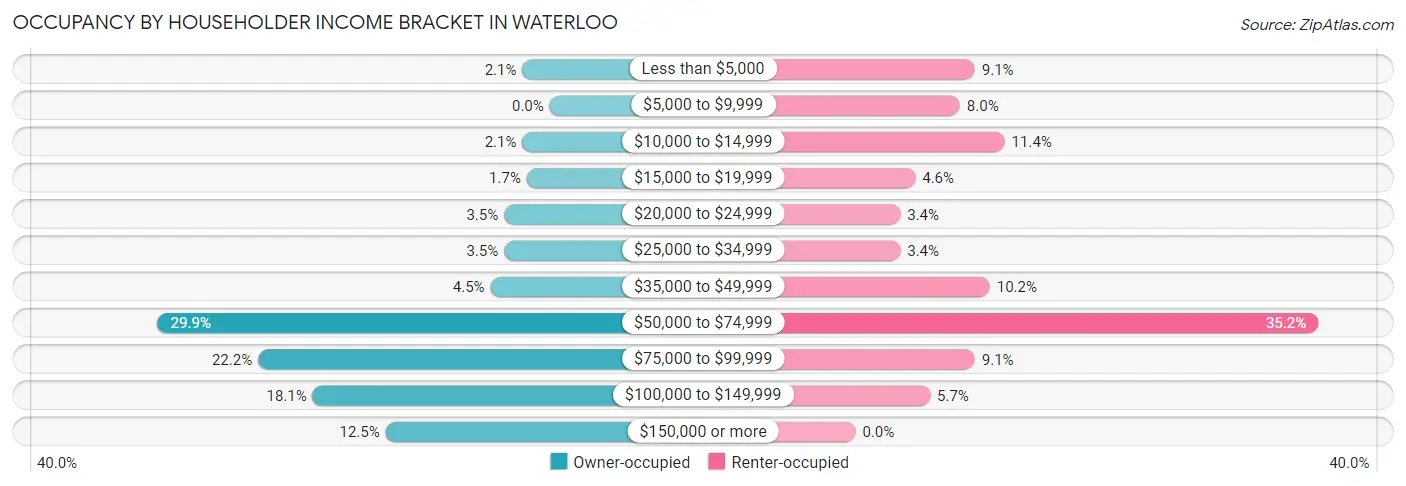
| Income Bracket | Owner-occupied | Renter-occupied |
| Less than $5,000 | 6 (2.1%) | 8 (9.1%) |
| $5,000 to $9,999 | 0 (0.0%) | 7 (8.0%) |
| $10,000 to $14,999 | 6 (2.1%) | 10 (11.4%) |
| $15,000 to $19,999 | 5 (1.7%) | 4 (4.5%) |
| $20,000 to $24,999 | 10 (3.5%) | 3 (3.4%) |
| $25,000 to $34,999 | 10 (3.5%) | 3 (3.4%) |
| $35,000 to $49,999 | 13 (4.5%) | 9 (10.2%) |
| $50,000 to $74,999 | 86 (29.9%) | 31 (35.2%) |
| $75,000 to $99,999 | 64 (22.2%) | 8 (9.1%) |
| $100,000 to $149,999 | 52 (18.1%) | 5 (5.7%) |
| $150,000 or more | 36 (12.5%) | 0 (0.0%) |
| Total | 288 (100.0%) | 88 (100.0%) |
Monthly Housing Cost Tiers in Waterloo
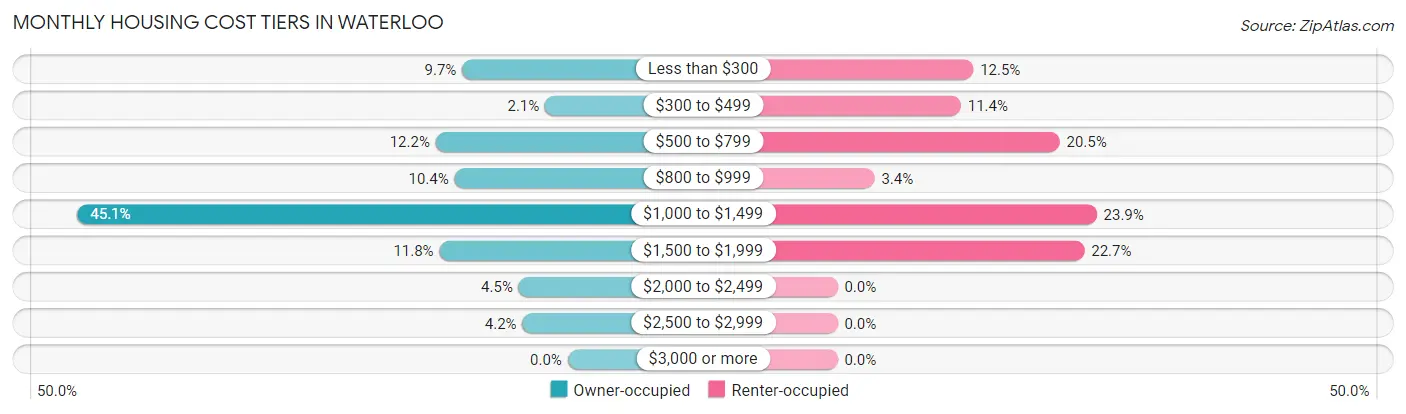
| Monthly Cost | Owner-occupied | Renter-occupied |
| Less than $300 | 28 (9.7%) | 11 (12.5%) |
| $300 to $499 | 6 (2.1%) | 10 (11.4%) |
| $500 to $799 | 35 (12.1%) | 18 (20.4%) |
| $800 to $999 | 30 (10.4%) | 3 (3.4%) |
| $1,000 to $1,499 | 130 (45.1%) | 21 (23.9%) |
| $1,500 to $1,999 | 34 (11.8%) | 20 (22.7%) |
| $2,000 to $2,499 | 13 (4.5%) | 0 (0.0%) |
| $2,500 to $2,999 | 12 (4.2%) | 0 (0.0%) |
| $3,000 or more | 0 (0.0%) | 0 (0.0%) |
| Total | 288 (100.0%) | 88 (100.0%) |
Physical Housing Characteristics in Waterloo
Housing Structures in Waterloo
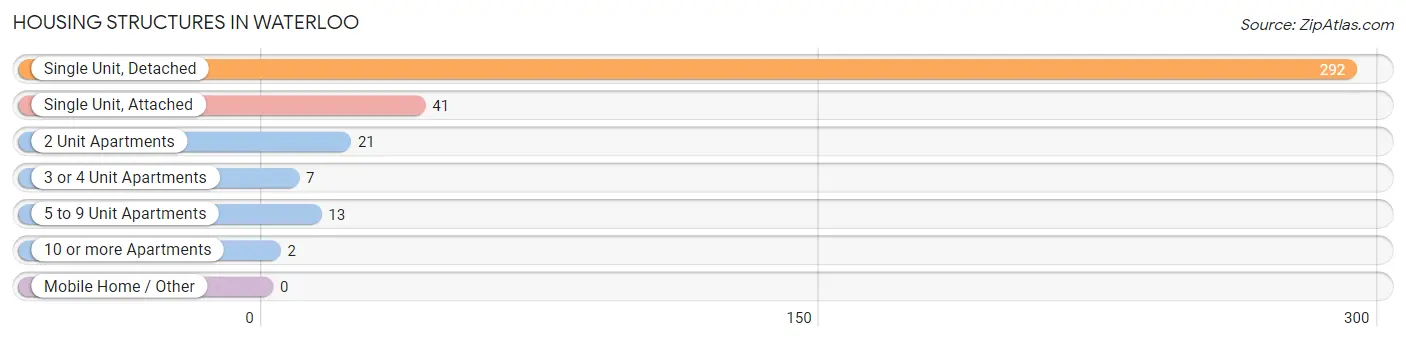
| Structure Type | # Housing Units | % Housing Units |
| Single Unit, Detached | 292 | 77.7% |
| Single Unit, Attached | 41 | 10.9% |
| 2 Unit Apartments | 21 | 5.6% |
| 3 or 4 Unit Apartments | 7 | 1.9% |
| 5 to 9 Unit Apartments | 13 | 3.5% |
| 10 or more Apartments | 2 | 0.5% |
| Mobile Home / Other | 0 | 0.0% |
| Total | 376 | 100.0% |
Housing Structures by Occupancy in Waterloo
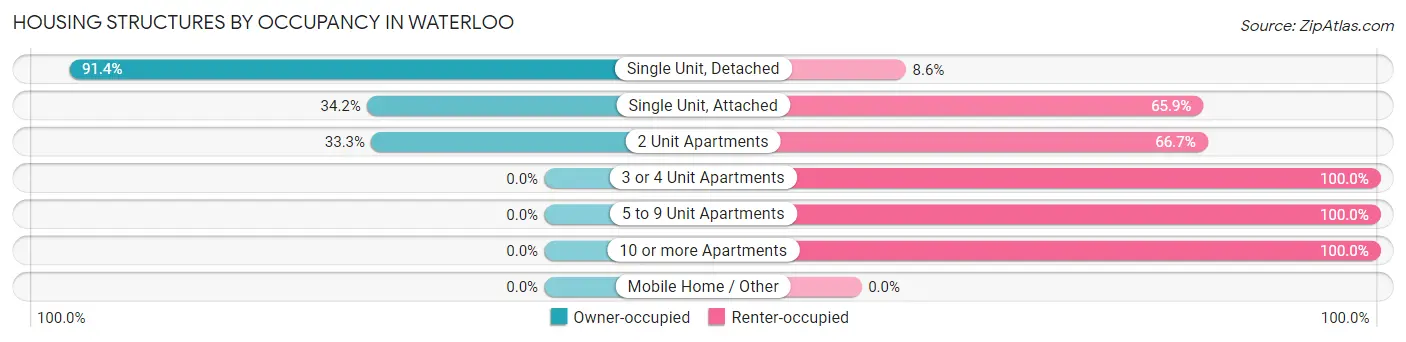
| Structure Type | Owner-occupied | Renter-occupied |
| Single Unit, Detached | 267 (91.4%) | 25 (8.6%) |
| Single Unit, Attached | 14 (34.2%) | 27 (65.8%) |
| 2 Unit Apartments | 7 (33.3%) | 14 (66.7%) |
| 3 or 4 Unit Apartments | 0 (0.0%) | 7 (100.0%) |
| 5 to 9 Unit Apartments | 0 (0.0%) | 13 (100.0%) |
| 10 or more Apartments | 0 (0.0%) | 2 (100.0%) |
| Mobile Home / Other | 0 (0.0%) | 0 (0.0%) |
| Total | 288 (76.6%) | 88 (23.4%) |
Housing Structures by Number of Rooms in Waterloo
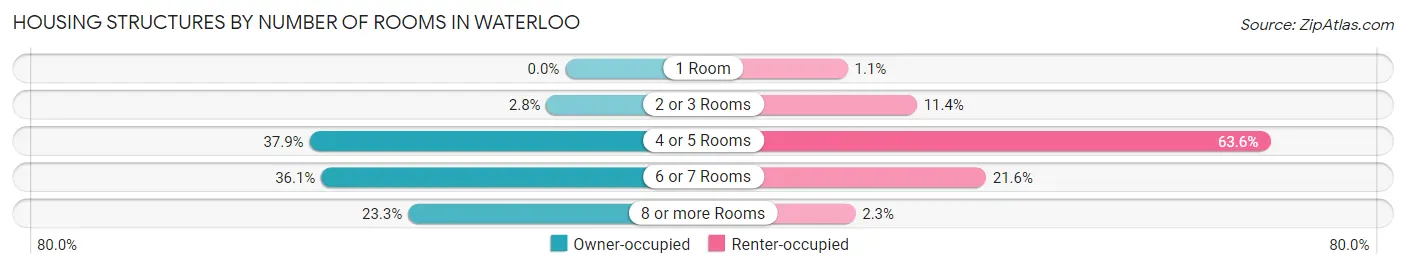
| Number of Rooms | Owner-occupied | Renter-occupied |
| 1 Room | 0 (0.0%) | 1 (1.1%) |
| 2 or 3 Rooms | 8 (2.8%) | 10 (11.4%) |
| 4 or 5 Rooms | 109 (37.9%) | 56 (63.6%) |
| 6 or 7 Rooms | 104 (36.1%) | 19 (21.6%) |
| 8 or more Rooms | 67 (23.3%) | 2 (2.3%) |
| Total | 288 (100.0%) | 88 (100.0%) |
Housing Structure by Heating Type in Waterloo
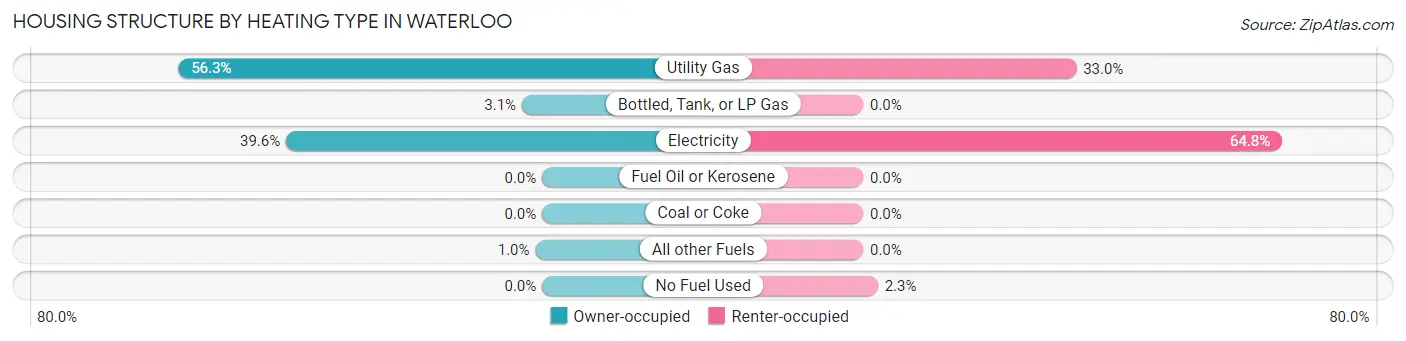
| Heating Type | Owner-occupied | Renter-occupied |
| Utility Gas | 162 (56.2%) | 29 (33.0%) |
| Bottled, Tank, or LP Gas | 9 (3.1%) | 0 (0.0%) |
| Electricity | 114 (39.6%) | 57 (64.8%) |
| Fuel Oil or Kerosene | 0 (0.0%) | 0 (0.0%) |
| Coal or Coke | 0 (0.0%) | 0 (0.0%) |
| All other Fuels | 3 (1.0%) | 0 (0.0%) |
| No Fuel Used | 0 (0.0%) | 2 (2.3%) |
| Total | 288 (100.0%) | 88 (100.0%) |
Household Vehicle Usage in Waterloo
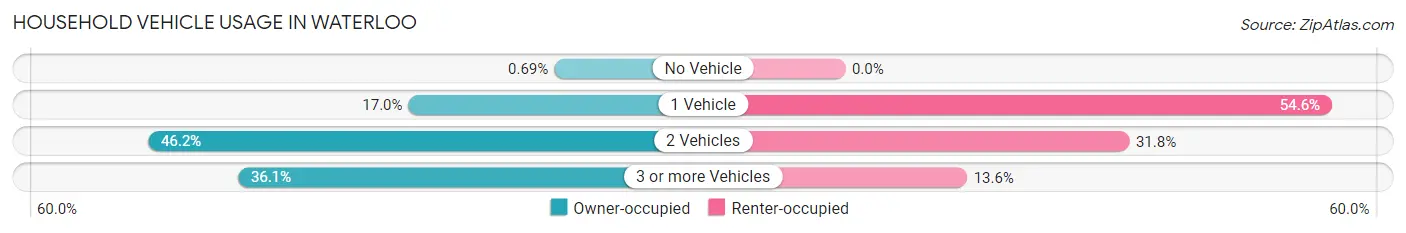
| Vehicles per Household | Owner-occupied | Renter-occupied |
| No Vehicle | 2 (0.7%) | 0 (0.0%) |
| 1 Vehicle | 49 (17.0%) | 48 (54.5%) |
| 2 Vehicles | 133 (46.2%) | 28 (31.8%) |
| 3 or more Vehicles | 104 (36.1%) | 12 (13.6%) |
| Total | 288 (100.0%) | 88 (100.0%) |
Real Estate & Mortgages in Waterloo
Real Estate and Mortgage Overview in Waterloo
| Characteristic | Without Mortgage | With Mortgage |
| Housing Units | 73 | 215 |
| Median Property Value | $159,200 | $218,000 |
| Median Household Income | $51,625 | $33 |
| Monthly Housing Costs | $555 | $0 |
| Real Estate Taxes | $2,525 | $8 |
Property Value by Mortgage Status in Waterloo
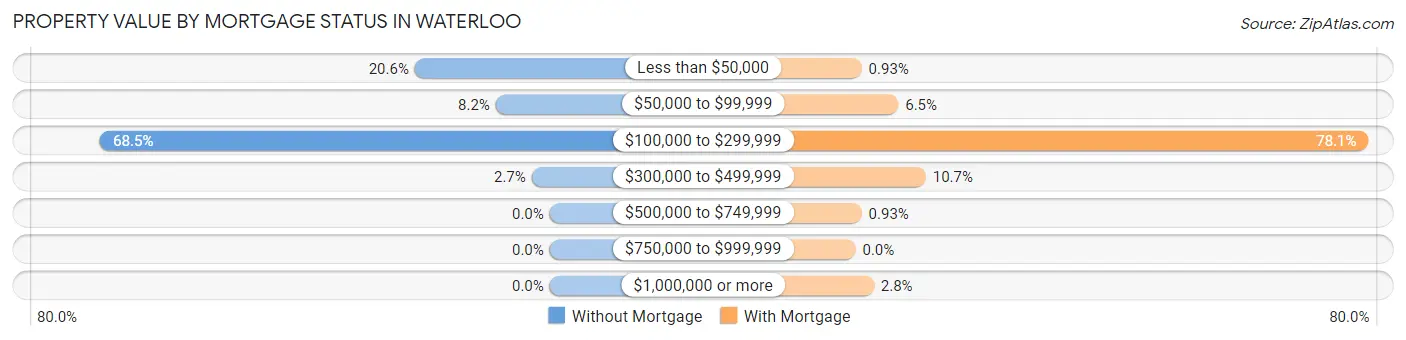
| Property Value | Without Mortgage | With Mortgage |
| Less than $50,000 | 15 (20.5%) | 2 (0.9%) |
| $50,000 to $99,999 | 6 (8.2%) | 14 (6.5%) |
| $100,000 to $299,999 | 50 (68.5%) | 168 (78.1%) |
| $300,000 to $499,999 | 2 (2.7%) | 23 (10.7%) |
| $500,000 to $749,999 | 0 (0.0%) | 2 (0.9%) |
| $750,000 to $999,999 | 0 (0.0%) | 0 (0.0%) |
| $1,000,000 or more | 0 (0.0%) | 6 (2.8%) |
| Total | 73 (100.0%) | 215 (100.0%) |
Household Income by Mortgage Status in Waterloo
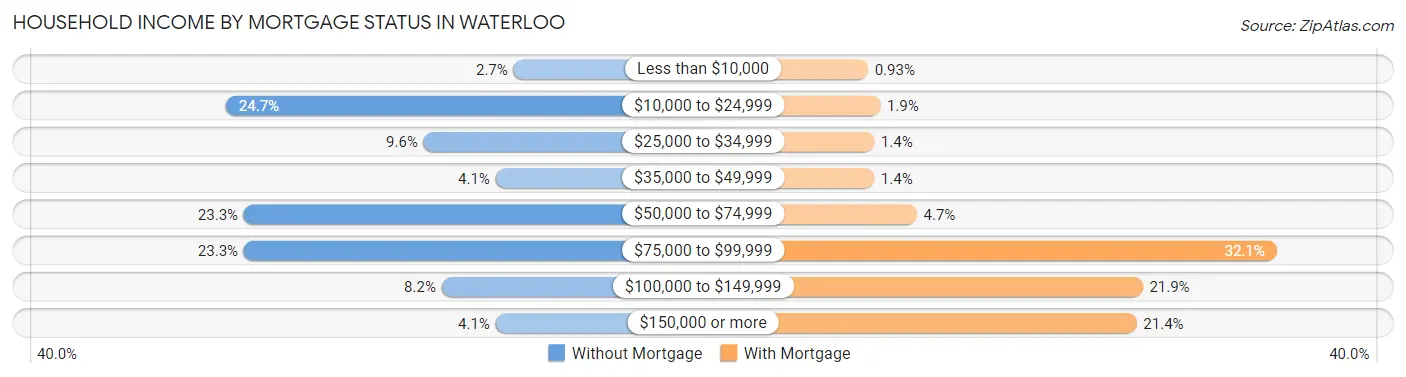
| Household Income | Without Mortgage | With Mortgage |
| Less than $10,000 | 2 (2.7%) | 2 (0.9%) |
| $10,000 to $24,999 | 18 (24.7%) | 4 (1.9%) |
| $25,000 to $34,999 | 7 (9.6%) | 3 (1.4%) |
| $35,000 to $49,999 | 3 (4.1%) | 3 (1.4%) |
| $50,000 to $74,999 | 17 (23.3%) | 10 (4.6%) |
| $75,000 to $99,999 | 17 (23.3%) | 69 (32.1%) |
| $100,000 to $149,999 | 6 (8.2%) | 47 (21.9%) |
| $150,000 or more | 3 (4.1%) | 46 (21.4%) |
| Total | 73 (100.0%) | 215 (100.0%) |
Property Value to Household Income Ratio in Waterloo
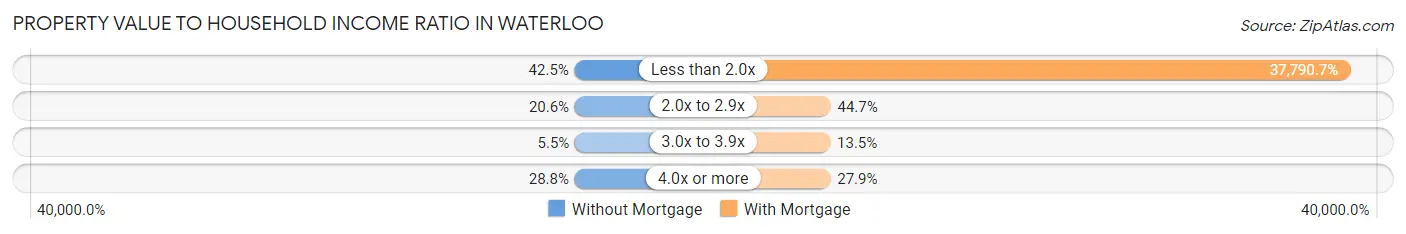
| Value-to-Income Ratio | Without Mortgage | With Mortgage |
| Less than 2.0x | 31 (42.5%) | 81,250 (37,790.7%) |
| 2.0x to 2.9x | 15 (20.5%) | 96 (44.7%) |
| 3.0x to 3.9x | 4 (5.5%) | 29 (13.5%) |
| 4.0x or more | 21 (28.8%) | 60 (27.9%) |
| Total | 73 (100.0%) | 215 (100.0%) |
Real Estate Taxes by Mortgage Status in Waterloo
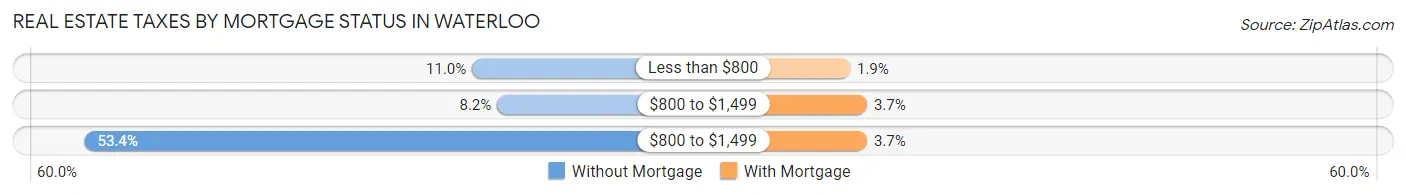
| Property Taxes | Without Mortgage | With Mortgage |
| Less than $800 | 8 (11.0%) | 4 (1.9%) |
| $800 to $1,499 | 6 (8.2%) | 8 (3.7%) |
| $800 to $1,499 | 39 (53.4%) | 8 (3.7%) |
| Total | 73 (100.0%) | 215 (100.0%) |
Health & Disability in Waterloo
Health Insurance Coverage by Age in Waterloo
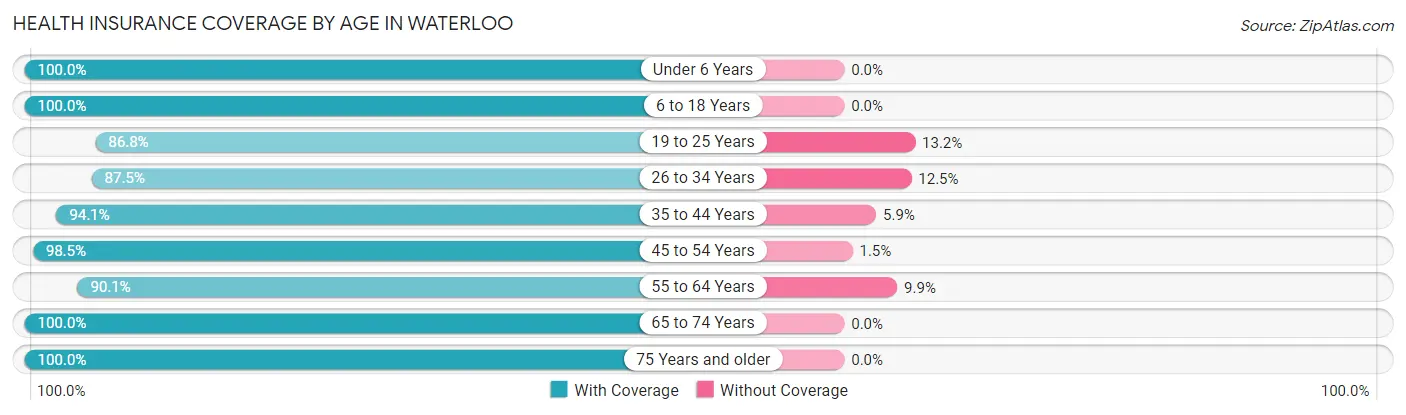
| Age Bracket | With Coverage | Without Coverage |
| Under 6 Years | 30 (100.0%) | 0 (0.0%) |
| 6 to 18 Years | 195 (100.0%) | 0 (0.0%) |
| 19 to 25 Years | 46 (86.8%) | 7 (13.2%) |
| 26 to 34 Years | 91 (87.5%) | 13 (12.5%) |
| 35 to 44 Years | 127 (94.1%) | 8 (5.9%) |
| 45 to 54 Years | 128 (98.5%) | 2 (1.5%) |
| 55 to 64 Years | 128 (90.1%) | 14 (9.9%) |
| 65 to 74 Years | 102 (100.0%) | 0 (0.0%) |
| 75 Years and older | 40 (100.0%) | 0 (0.0%) |
| Total | 887 (95.3%) | 44 (4.7%) |
Health Insurance Coverage by Citizenship Status in Waterloo
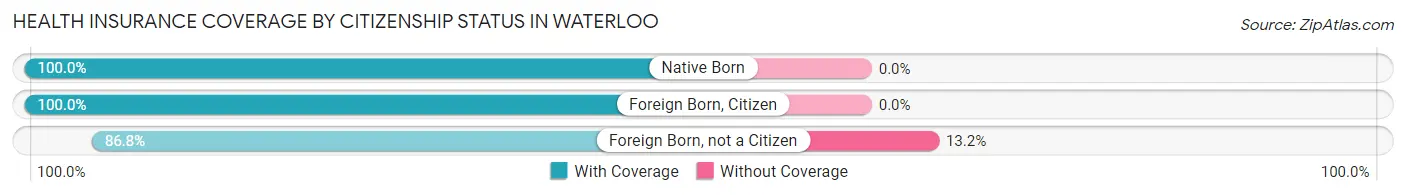
| Citizenship Status | With Coverage | Without Coverage |
| Native Born | 30 (100.0%) | 0 (0.0%) |
| Foreign Born, Citizen | 195 (100.0%) | 0 (0.0%) |
| Foreign Born, not a Citizen | 46 (86.8%) | 7 (13.2%) |
Health Insurance Coverage by Household Income in Waterloo
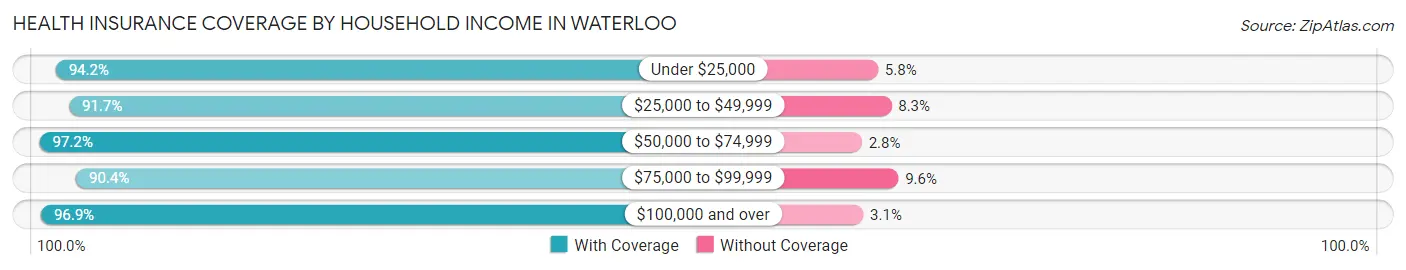
| Household Income | With Coverage | Without Coverage |
| Under $25,000 | 97 (94.2%) | 6 (5.8%) |
| $25,000 to $49,999 | 44 (91.7%) | 4 (8.3%) |
| $50,000 to $74,999 | 312 (97.2%) | 9 (2.8%) |
| $75,000 to $99,999 | 150 (90.4%) | 16 (9.6%) |
| $100,000 and over | 284 (96.9%) | 9 (3.1%) |
Public vs Private Health Insurance Coverage by Age in Waterloo
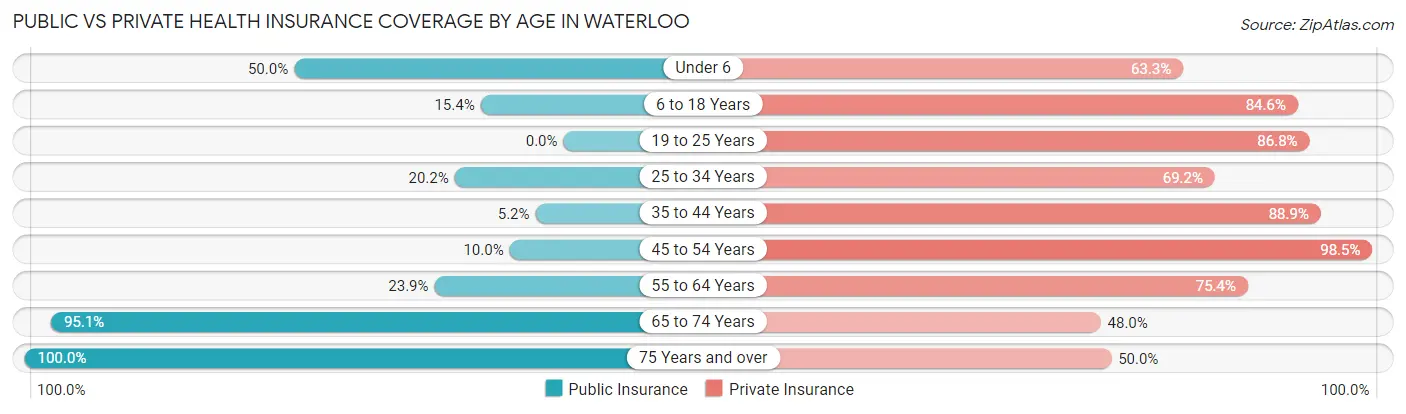
| Age Bracket | Public Insurance | Private Insurance |
| Under 6 | 15 (50.0%) | 19 (63.3%) |
| 6 to 18 Years | 30 (15.4%) | 165 (84.6%) |
| 19 to 25 Years | 0 (0.0%) | 46 (86.8%) |
| 25 to 34 Years | 21 (20.2%) | 72 (69.2%) |
| 35 to 44 Years | 7 (5.2%) | 120 (88.9%) |
| 45 to 54 Years | 13 (10.0%) | 128 (98.5%) |
| 55 to 64 Years | 34 (23.9%) | 107 (75.3%) |
| 65 to 74 Years | 97 (95.1%) | 49 (48.0%) |
| 75 Years and over | 40 (100.0%) | 20 (50.0%) |
| Total | 257 (27.6%) | 726 (78.0%) |
Disability Status by Sex by Age in Waterloo
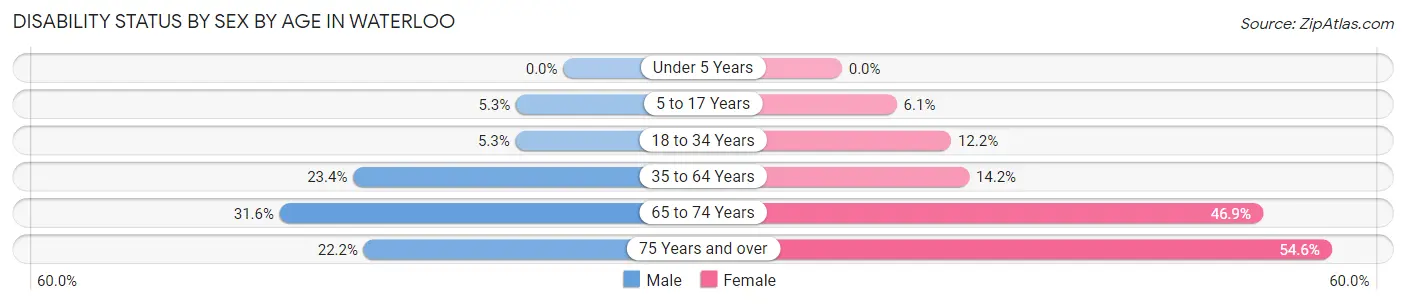
| Age Bracket | Male | Female |
| Under 5 Years | 0 (0.0%) | 0 (0.0%) |
| 5 to 17 Years | 3 (5.3%) | 8 (6.1%) |
| 18 to 34 Years | 5 (5.3%) | 9 (12.2%) |
| 35 to 64 Years | 44 (23.4%) | 31 (14.2%) |
| 65 to 74 Years | 12 (31.6%) | 30 (46.9%) |
| 75 Years and over | 4 (22.2%) | 12 (54.5%) |
Disability Class by Sex by Age in Waterloo
Disability Class: Hearing Difficulty
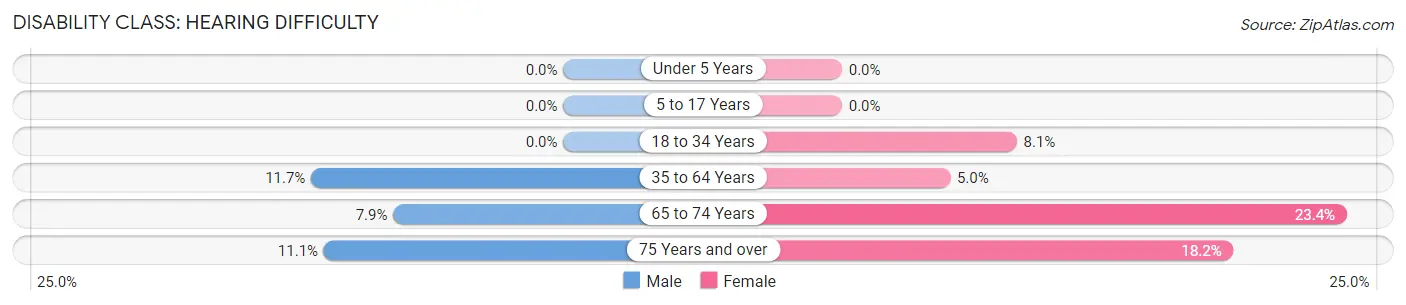
| Age Bracket | Male | Female |
| Under 5 Years | 0 (0.0%) | 0 (0.0%) |
| 5 to 17 Years | 0 (0.0%) | 0 (0.0%) |
| 18 to 34 Years | 0 (0.0%) | 6 (8.1%) |
| 35 to 64 Years | 22 (11.7%) | 11 (5.0%) |
| 65 to 74 Years | 3 (7.9%) | 15 (23.4%) |
| 75 Years and over | 2 (11.1%) | 4 (18.2%) |
Disability Class: Vision Difficulty
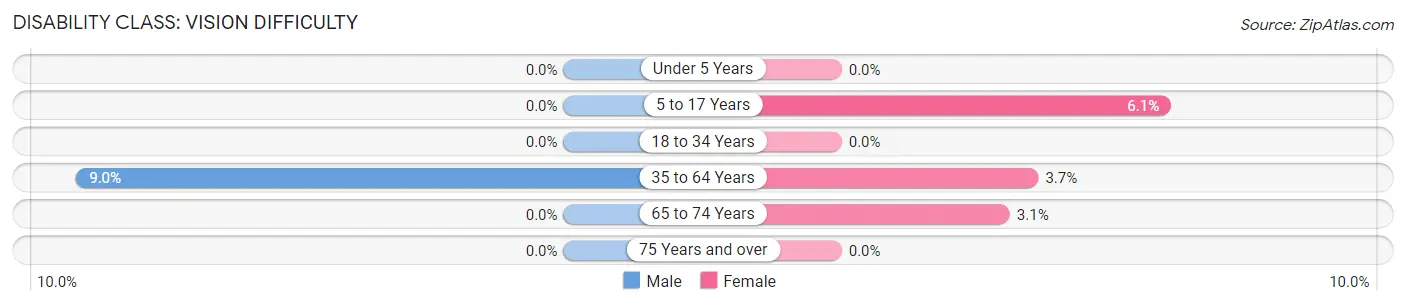
| Age Bracket | Male | Female |
| Under 5 Years | 0 (0.0%) | 0 (0.0%) |
| 5 to 17 Years | 0 (0.0%) | 8 (6.1%) |
| 18 to 34 Years | 0 (0.0%) | 0 (0.0%) |
| 35 to 64 Years | 17 (9.0%) | 8 (3.6%) |
| 65 to 74 Years | 0 (0.0%) | 2 (3.1%) |
| 75 Years and over | 0 (0.0%) | 0 (0.0%) |
Disability Class: Cognitive Difficulty
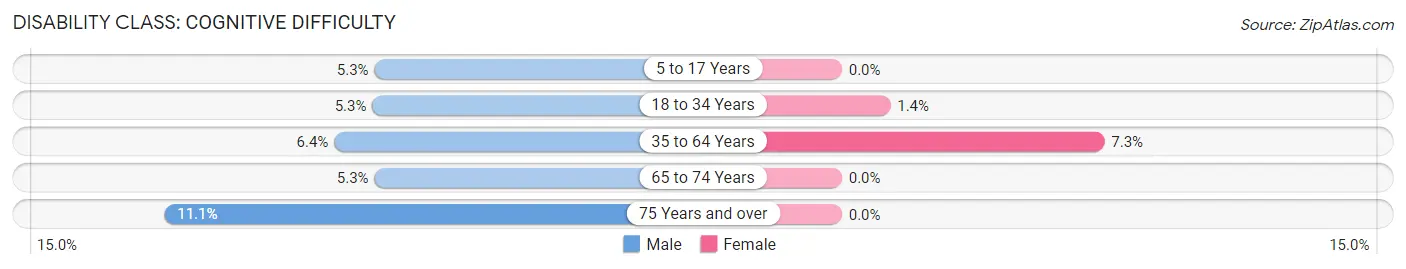
| Age Bracket | Male | Female |
| 5 to 17 Years | 3 (5.3%) | 0 (0.0%) |
| 18 to 34 Years | 5 (5.3%) | 1 (1.3%) |
| 35 to 64 Years | 12 (6.4%) | 16 (7.3%) |
| 65 to 74 Years | 2 (5.3%) | 0 (0.0%) |
| 75 Years and over | 2 (11.1%) | 0 (0.0%) |
Disability Class: Ambulatory Difficulty
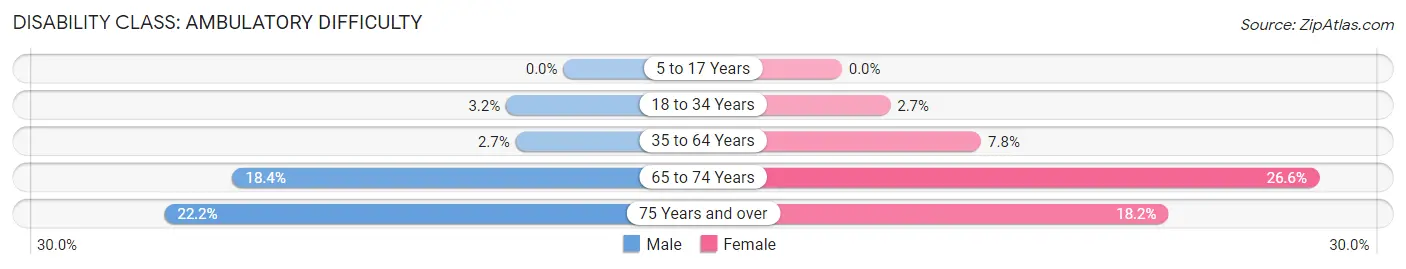
| Age Bracket | Male | Female |
| 5 to 17 Years | 0 (0.0%) | 0 (0.0%) |
| 18 to 34 Years | 3 (3.2%) | 2 (2.7%) |
| 35 to 64 Years | 5 (2.7%) | 17 (7.8%) |
| 65 to 74 Years | 7 (18.4%) | 17 (26.6%) |
| 75 Years and over | 4 (22.2%) | 4 (18.2%) |
Disability Class: Self-Care Difficulty
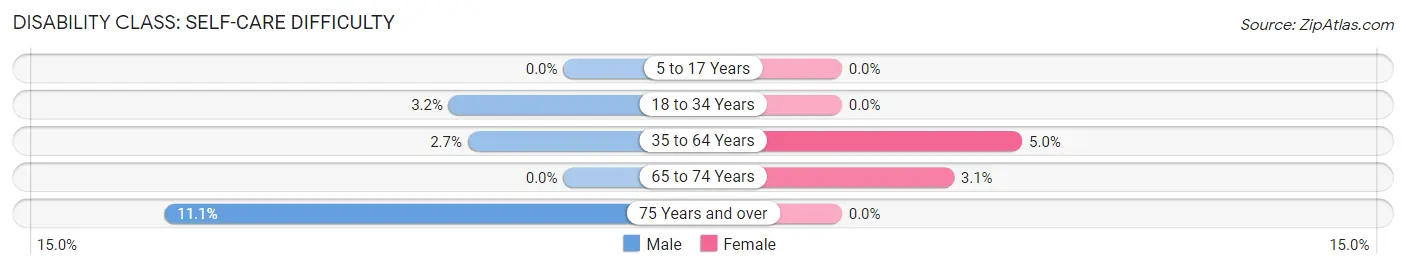
| Age Bracket | Male | Female |
| 5 to 17 Years | 0 (0.0%) | 0 (0.0%) |
| 18 to 34 Years | 3 (3.2%) | 0 (0.0%) |
| 35 to 64 Years | 5 (2.7%) | 11 (5.0%) |
| 65 to 74 Years | 0 (0.0%) | 2 (3.1%) |
| 75 Years and over | 2 (11.1%) | 0 (0.0%) |
Technology Access in Waterloo
Computing Device Access in Waterloo
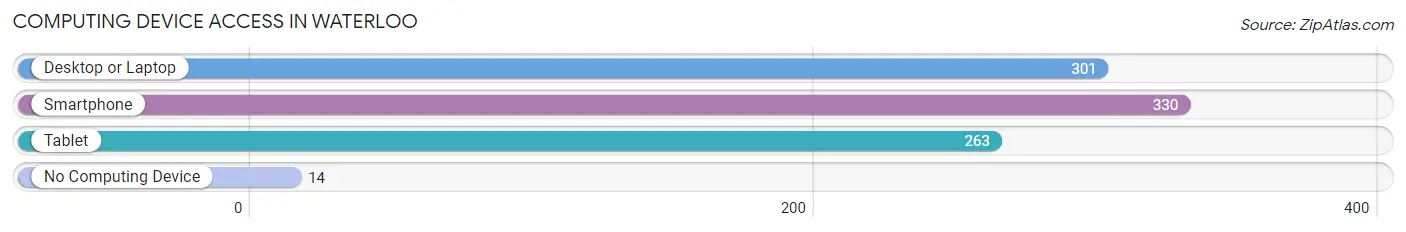
| Device Type | # Households | % Households |
| Desktop or Laptop | 301 | 80.0% |
| Smartphone | 330 | 87.8% |
| Tablet | 263 | 70.0% |
| No Computing Device | 14 | 3.7% |
| Total | 376 | 100.0% |
Internet Access in Waterloo
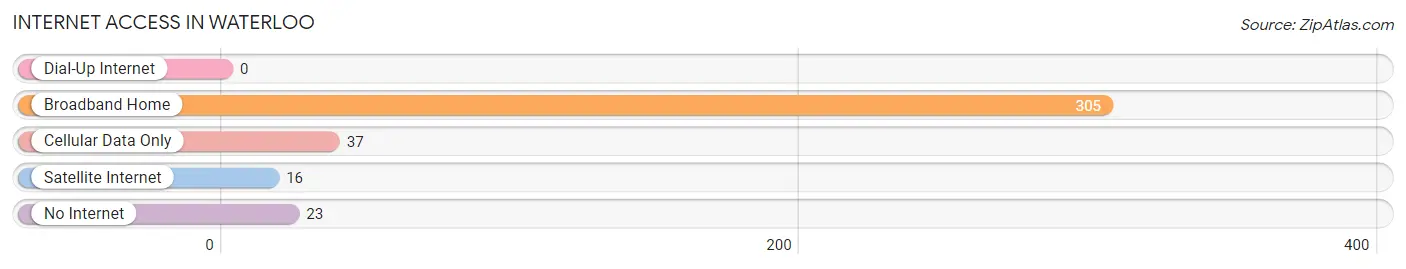
| Internet Type | # Households | % Households |
| Dial-Up Internet | 0 | 0.0% |
| Broadband Home | 305 | 81.1% |
| Cellular Data Only | 37 | 9.8% |
| Satellite Internet | 16 | 4.3% |
| No Internet | 23 | 6.1% |
| Total | 376 | 100.0% |
Waterloo Summary
Waterloo is a small city located in the state of Nebraska, in the United States of America. It is located in the eastern part of the state, in the county of Douglas. The city has a population of approximately 4,000 people, and is part of the Omaha-Council Bluffs metropolitan area.
History
Waterloo was founded in 1854 by a group of settlers from the nearby town of Omaha. The settlers were looking for a place to settle and start a new life, and they chose the area around Waterloo because of its fertile soil and abundant water supply. The town was named after the Battle of Waterloo, which had taken place in 1815.
The town grew quickly, and by the late 1800s, it had become a thriving agricultural center. The town was also home to a number of businesses, including a flour mill, a sawmill, and a brickyard.
In the early 1900s, the town began to experience a decline in population, as many of the residents moved away to larger cities. However, the town was able to remain a viable community, thanks to its strong agricultural base.
Geography
Waterloo is located in the eastern part of Nebraska, in the county of Douglas. The city is situated on the banks of the Missouri River, and is surrounded by rolling hills and farmland. The city is located approximately 25 miles north of Omaha, and is part of the Omaha-Council Bluffs metropolitan area.
The climate in Waterloo is generally mild, with hot summers and cold winters. The average temperature in the summer is around 80 degrees Fahrenheit, while the average temperature in the winter is around 20 degrees Fahrenheit.
Economy
The economy of Waterloo is largely based on agriculture. The city is home to a number of farms, which produce a variety of crops, including corn, soybeans, and wheat. The city is also home to a number of businesses, including a flour mill, a sawmill, and a brickyard.
In addition to agriculture, the city is also home to a number of manufacturing companies, which produce a variety of products, including furniture, clothing, and electronics. The city is also home to a number of retail stores, which sell a variety of goods, including clothing, food, and home goods.
Demographics
As of the 2010 census, the population of Waterloo was 4,000 people. The racial makeup of the city was 94.3% White, 0.7% African American, 0.3% Native American, 0.2% Asian, 0.1% Pacific Islander, and 4.4% from other races. The median household income in the city was $41,250, and the median family income was $50,000.
The city is home to a number of churches, including the First United Methodist Church, the First Presbyterian Church, and the Waterloo Baptist Church. The city is also home to a number of schools, including the Waterloo Public Schools, the Waterloo Catholic Schools, and the Waterloo Lutheran Schools.
Conclusion
Waterloo is a small city located in the state of Nebraska, in the United States of America. It is located in the eastern part of the state, in the county of Douglas. The city has a population of approximately 4,000 people, and is part of the Omaha-Council Bluffs metropolitan area. The economy of Waterloo is largely based on agriculture, and the city is home to a number of businesses, including a flour mill, a sawmill, and a brickyard. The racial makeup of the city is 94.3% White, 0.7% African American, 0.3% Native American, 0.2% Asian, 0.1% Pacific Islander, and 4.4% from other races. The median household income in the city was $41,250, and the median family income was $50,000.
Common Questions
What is Per Capita Income in Waterloo?
Per Capita income in Waterloo is $32,441.
What is the Median Family Income in Waterloo?
Median Family Income in Waterloo is $71,964.
What is the Median Household income in Waterloo?
Median Household Income in Waterloo is $65,000.
What is Income or Wage Gap in Waterloo?
Income or Wage Gap in Waterloo is 49.7%.
Women in Waterloo earn 50.3 cents for every dollar earned by a man.
What is Family Income Deficit in Waterloo?
Family Income Deficit in Waterloo is $12,926.
Families that are below poverty line in Waterloo earn $12,926 less on average than the poverty threshold level.
What is Inequality or Gini Index in Waterloo?
Inequality or Gini Index in Waterloo is 0.38.
What is the Total Population of Waterloo?
Total Population of Waterloo is 931.
What is the Total Male Population of Waterloo?
Total Male Population of Waterloo is 411.
What is the Total Female Population of Waterloo?
Total Female Population of Waterloo is 520.
What is the Ratio of Males per 100 Females in Waterloo?
There are 79.04 Males per 100 Females in Waterloo.
What is the Ratio of Females per 100 Males in Waterloo?
There are 126.52 Females per 100 Males in Waterloo.
What is the Median Population Age in Waterloo?
Median Population Age in Waterloo is 37.6 Years.
What is the Average Family Size in Waterloo
Average Family Size in Waterloo is 3.0 People.
What is the Average Household Size in Waterloo
Average Household Size in Waterloo is 2.5 People.
How Large is the Labor Force in Waterloo?
There are 473 People in the Labor Forcein in Waterloo.
What is the Percentage of People in the Labor Force in Waterloo?
64.4% of People are in the Labor Force in Waterloo.
What is the Unemployment Rate in Waterloo?
Unemployment Rate in Waterloo is 1.3%.