Valley, NE Map & Demographics
Valley Map
Valley Overview
$52,590
PER CAPITA INCOME
$124,583
AVG FAMILY INCOME
$80,319
AVG HOUSEHOLD INCOME
19.2%
WAGE / INCOME GAP [ % ]
80.8¢/ $1
WAGE / INCOME GAP [ $ ]
0.49
INEQUALITY / GINI INDEX
3,032
TOTAL POPULATION
1,527
MALE POPULATION
1,505
FEMALE POPULATION
101.46
MALES / 100 FEMALES
98.56
FEMALES / 100 MALES
48.5
MEDIAN AGE
2.9
AVG FAMILY SIZE
2.2
AVG HOUSEHOLD SIZE
1,576
LABOR FORCE [ PEOPLE ]
65.5%
PERCENT IN LABOR FORCE
2.9%
UNEMPLOYMENT RATE
Valley Zip Codes
Valley Area Codes
Income in Valley
Income Overview in Valley
Per Capita Income in Valley is $52,590, while median incomes of families and households are $124,583 and $80,319 respectively.
| Characteristic | Number | Measure |
| Per Capita Income | 3,032 | $52,590 |
| Median Family Income | 843 | $124,583 |
| Mean Family Income | 843 | $155,995 |
| Median Household Income | 1,342 | $80,319 |
| Mean Household Income | 1,342 | $117,580 |
| Income Deficit | 843 | $0 |
| Wage / Income Gap (%) | 3,032 | 19.19% |
| Wage / Income Gap ($) | 3,032 | 80.81¢ per $1 |
| Gini / Inequality Index | 3,032 | 0.49 |
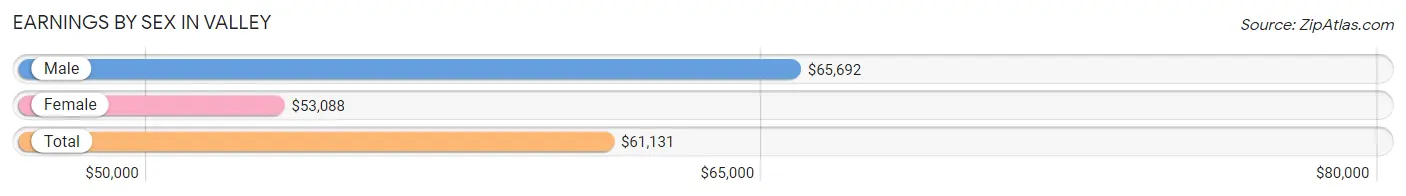
Earnings by Sex in Valley
Average Earnings in Valley are $61,131, $65,692 for men and $53,088 for women, a difference of 19.2%.
| Sex | Number | Average Earnings |
| Male | 911 (55.4%) | $65,692 |
| Female | 732 (44.6%) | $53,088 |
| Total | 1,643 (100.0%) | $61,131 |
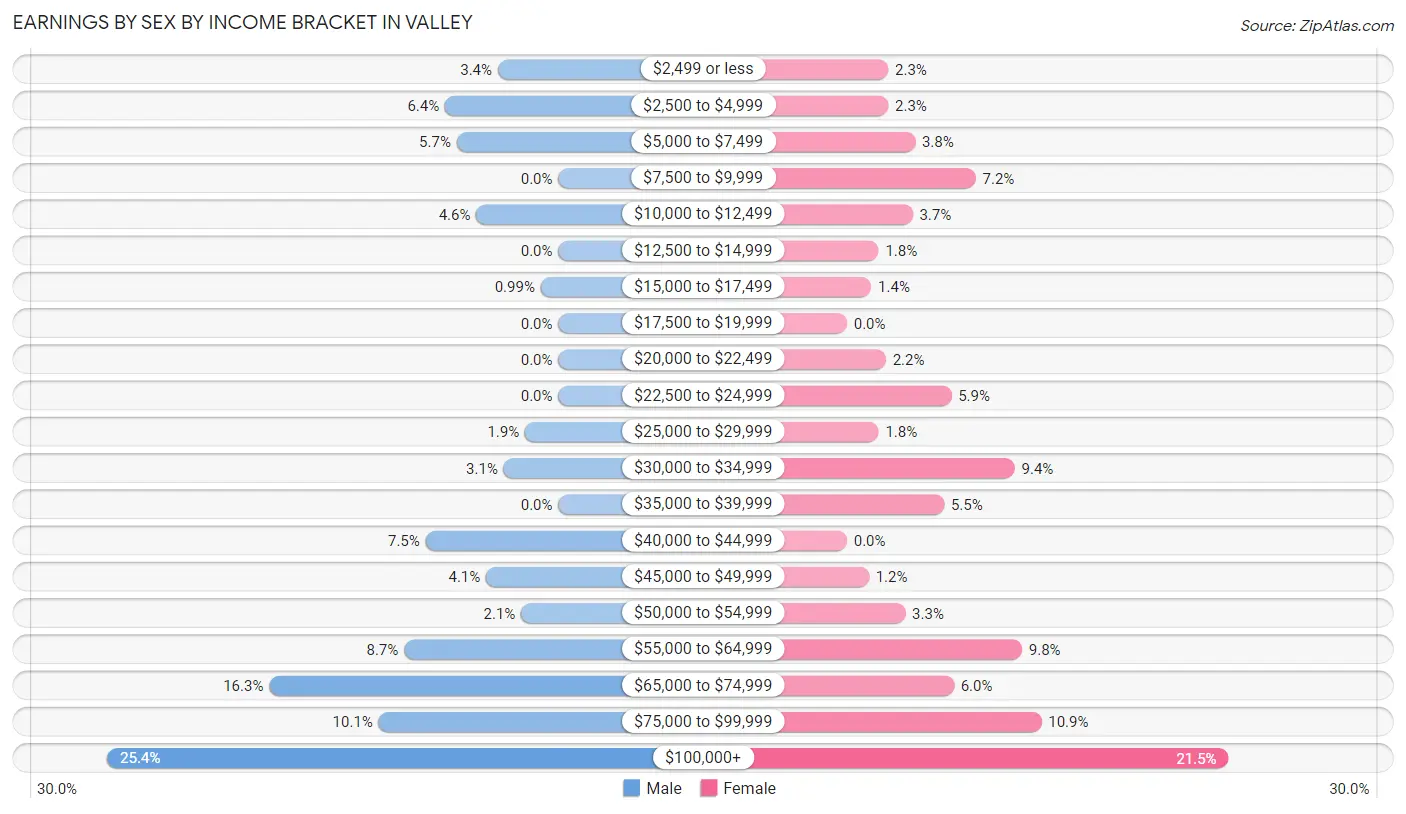
Earnings by Sex by Income Bracket in Valley
The most common earnings brackets in Valley are $100,000+ for men (231 | 25.4%) and $100,000+ for women (157 | 21.4%).
| Income | Male | Female |
| $2,499 or less | 31 (3.4%) | 17 (2.3%) |
| $2,500 to $4,999 | 58 (6.4%) | 17 (2.3%) |
| $5,000 to $7,499 | 52 (5.7%) | 28 (3.8%) |
| $7,500 to $9,999 | 0 (0.0%) | 53 (7.2%) |
| $10,000 to $12,499 | 42 (4.6%) | 27 (3.7%) |
| $12,500 to $14,999 | 0 (0.0%) | 13 (1.8%) |
| $15,000 to $17,499 | 9 (1.0%) | 10 (1.4%) |
| $17,500 to $19,999 | 0 (0.0%) | 0 (0.0%) |
| $20,000 to $22,499 | 0 (0.0%) | 16 (2.2%) |
| $22,500 to $24,999 | 0 (0.0%) | 43 (5.9%) |
| $25,000 to $29,999 | 17 (1.9%) | 13 (1.8%) |
| $30,000 to $34,999 | 28 (3.1%) | 69 (9.4%) |
| $35,000 to $39,999 | 0 (0.0%) | 40 (5.5%) |
| $40,000 to $44,999 | 68 (7.5%) | 0 (0.0%) |
| $45,000 to $49,999 | 37 (4.1%) | 9 (1.2%) |
| $50,000 to $54,999 | 19 (2.1%) | 24 (3.3%) |
| $55,000 to $64,999 | 79 (8.7%) | 72 (9.8%) |
| $65,000 to $74,999 | 148 (16.3%) | 44 (6.0%) |
| $75,000 to $99,999 | 92 (10.1%) | 80 (10.9%) |
| $100,000+ | 231 (25.4%) | 157 (21.4%) |
| Total | 911 (100.0%) | 732 (100.0%) |
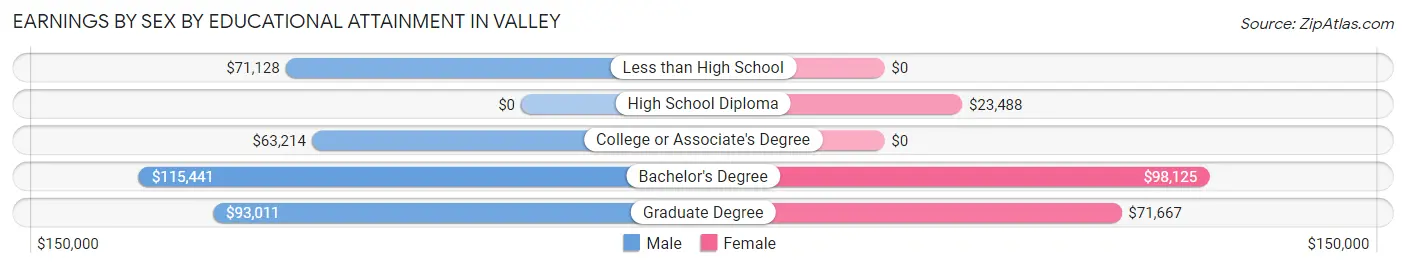
Earnings by Sex by Educational Attainment in Valley
Average earnings in Valley are $68,229 for men and $55,500 for women, a difference of 18.7%. Men with an educational attainment of bachelor's degree enjoy the highest average annual earnings of $115,441, while those with college or associate's degree education earn the least with $63,214. Women with an educational attainment of bachelor's degree earn the most with the average annual earnings of $98,125, while those with high school diploma education have the smallest earnings of $23,488.
| Educational Attainment | Male Income | Female Income |
| Less than High School | $71,128 | $0 |
| High School Diploma | - | - |
| College or Associate's Degree | $63,214 | $0 |
| Bachelor's Degree | $115,441 | $98,125 |
| Graduate Degree | $93,011 | $71,667 |
| Total | $68,229 | $55,500 |
Family Income in Valley
Family Income Brackets in Valley
According to the Valley family income data, there are 218 families falling into the $200,000+ income range, which is the most common income bracket and makes up 25.9% of all families.
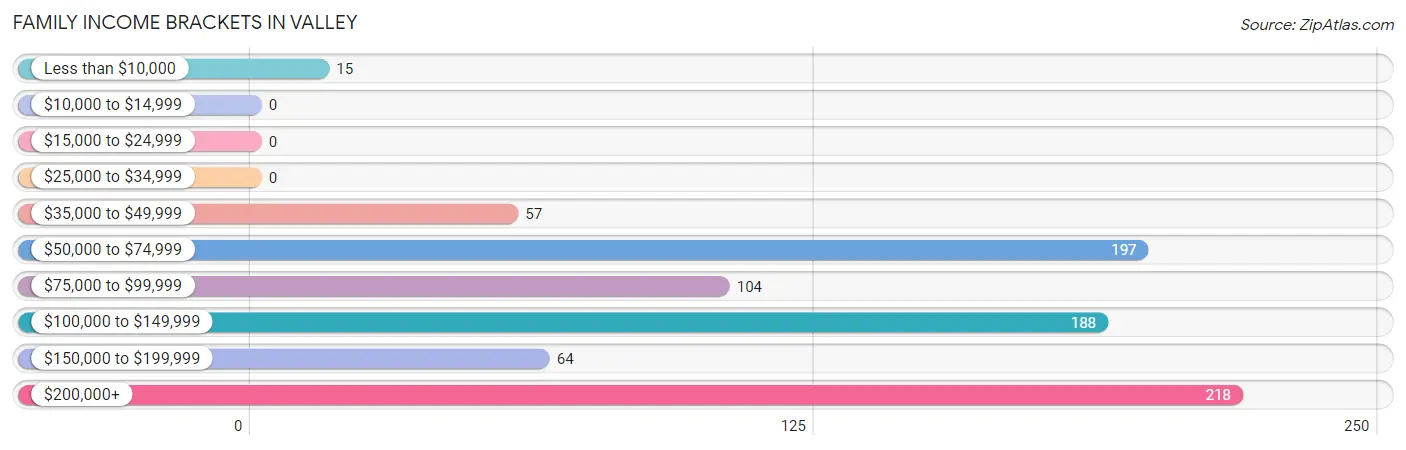
| Income Bracket | # Families | % Families |
| Less than $10,000 | 15 | 1.8% |
| $10,000 to $14,999 | 0 | 0.0% |
| $15,000 to $24,999 | 0 | 0.0% |
| $25,000 to $34,999 | 0 | 0.0% |
| $35,000 to $49,999 | 57 | 6.8% |
| $50,000 to $74,999 | 197 | 23.4% |
| $75,000 to $99,999 | 104 | 12.3% |
| $100,000 to $149,999 | 188 | 22.3% |
| $150,000 to $199,999 | 64 | 7.6% |
| $200,000+ | 218 | 25.9% |
Family Income by Famaliy Size in Valley
5-person families (38 | 4.5%) account for the highest median family income in Valley with $250,001 per family, while 5-person families (38 | 4.5%) have the highest median income of $50,000 per family member.
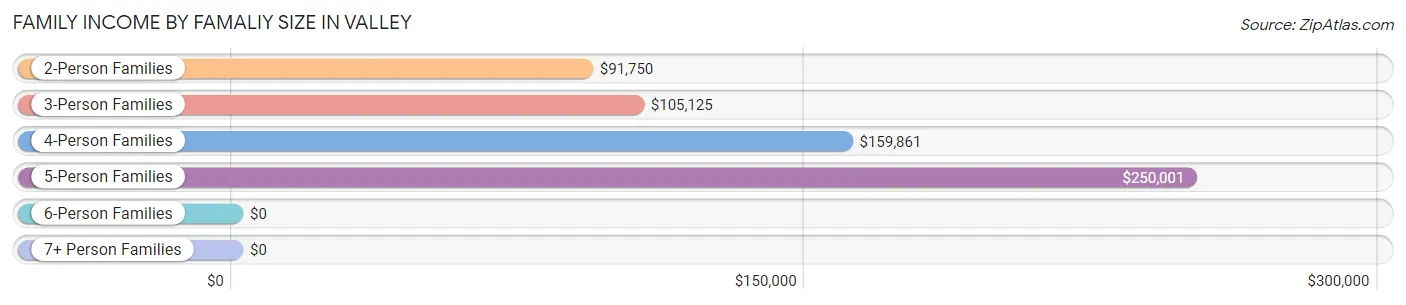
| Income Bracket | # Families | Median Income |
| 2-Person Families | 391 (46.4%) | $91,750 |
| 3-Person Families | 259 (30.7%) | $105,125 |
| 4-Person Families | 155 (18.4%) | $159,861 |
| 5-Person Families | 38 (4.5%) | $250,001 |
| 6-Person Families | 0 (0.0%) | $0 |
| 7+ Person Families | 0 (0.0%) | $0 |
| Total | 843 (100.0%) | $124,583 |
Family Income by Number of Earners in Valley
The median family income in Valley is $124,583, with families comprising 2 earners (410) having the highest median family income of $158,333, while families with 1 earner (261) have the lowest median family income of $72,125, accounting for 48.6% and 31.0% of families, respectively.
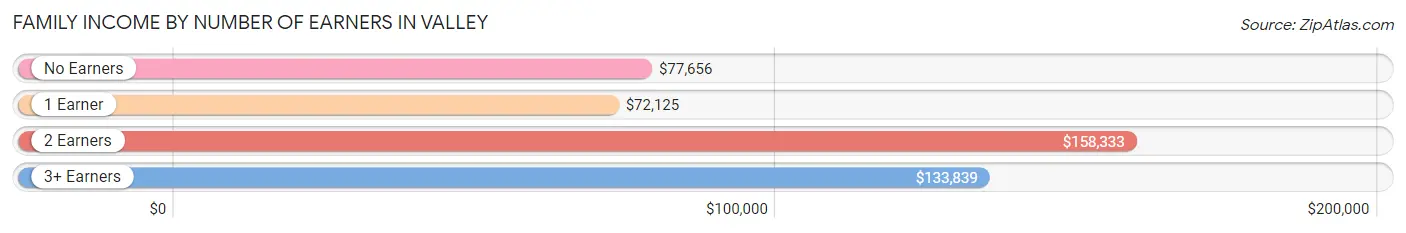
| Number of Earners | # Families | Median Income |
| No Earners | 77 (9.1%) | $77,656 |
| 1 Earner | 261 (31.0%) | $72,125 |
| 2 Earners | 410 (48.6%) | $158,333 |
| 3+ Earners | 95 (11.3%) | $133,839 |
| Total | 843 (100.0%) | $124,583 |
Household Income in Valley
Household Income Brackets in Valley
With 250 households falling in the category, the $50,000 to $74,999 income range is the most frequent in Valley, accounting for 18.6% of all households. In contrast, only 50 households (3.7%) fall into the less than $10,000 income bracket, making it the least populous group.
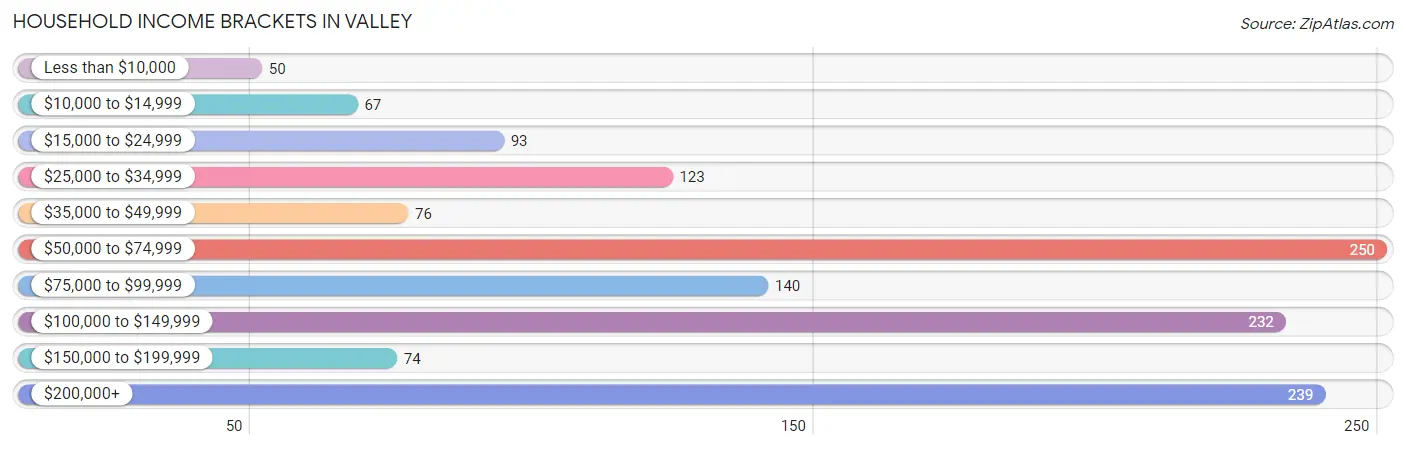
| Income Bracket | # Households | % Households |
| Less than $10,000 | 50 | 3.7% |
| $10,000 to $14,999 | 67 | 5.0% |
| $15,000 to $24,999 | 93 | 6.9% |
| $25,000 to $34,999 | 123 | 9.2% |
| $35,000 to $49,999 | 76 | 5.7% |
| $50,000 to $74,999 | 250 | 18.6% |
| $75,000 to $99,999 | 140 | 10.4% |
| $100,000 to $149,999 | 232 | 17.3% |
| $150,000 to $199,999 | 74 | 5.5% |
| $200,000+ | 239 | 17.8% |
Household Income by Householder Age in Valley
The median household income in Valley is $80,319, with the highest median household income of $116,806 found in the 25 to 44 years age bracket for the primary householder. A total of 351 households (26.2%) fall into this category. Meanwhile, the 65+ years age bracket for the primary householder has the lowest median household income of $53,382, with 338 households (25.2%) in this group.
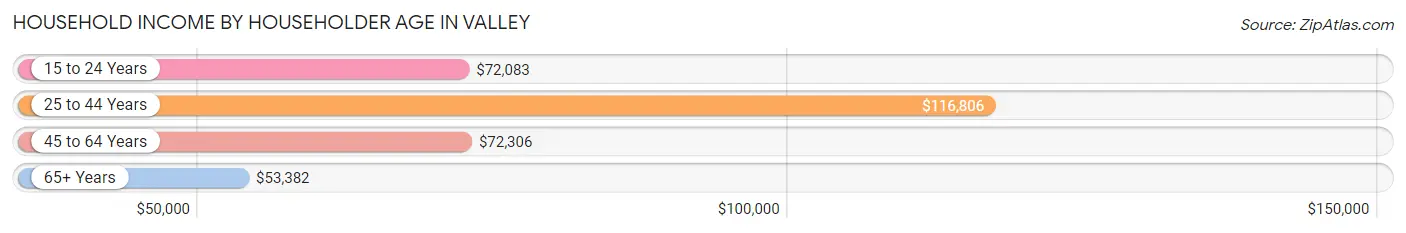
| Income Bracket | # Households | Median Income |
| 15 to 24 Years | 42 (3.1%) | $72,083 |
| 25 to 44 Years | 351 (26.2%) | $116,806 |
| 45 to 64 Years | 611 (45.5%) | $72,306 |
| 65+ Years | 338 (25.2%) | $53,382 |
| Total | 1,342 (100.0%) | $80,319 |
Poverty in Valley
Income Below Poverty by Sex and Age in Valley
With 4.4% poverty level for males and 5.5% for females among the residents of Valley, 55 to 64 year old males and 55 to 64 year old females are the most vulnerable to poverty, with 39 males (14.0%) and 41 females (12.8%) in their respective age groups living below the poverty level.
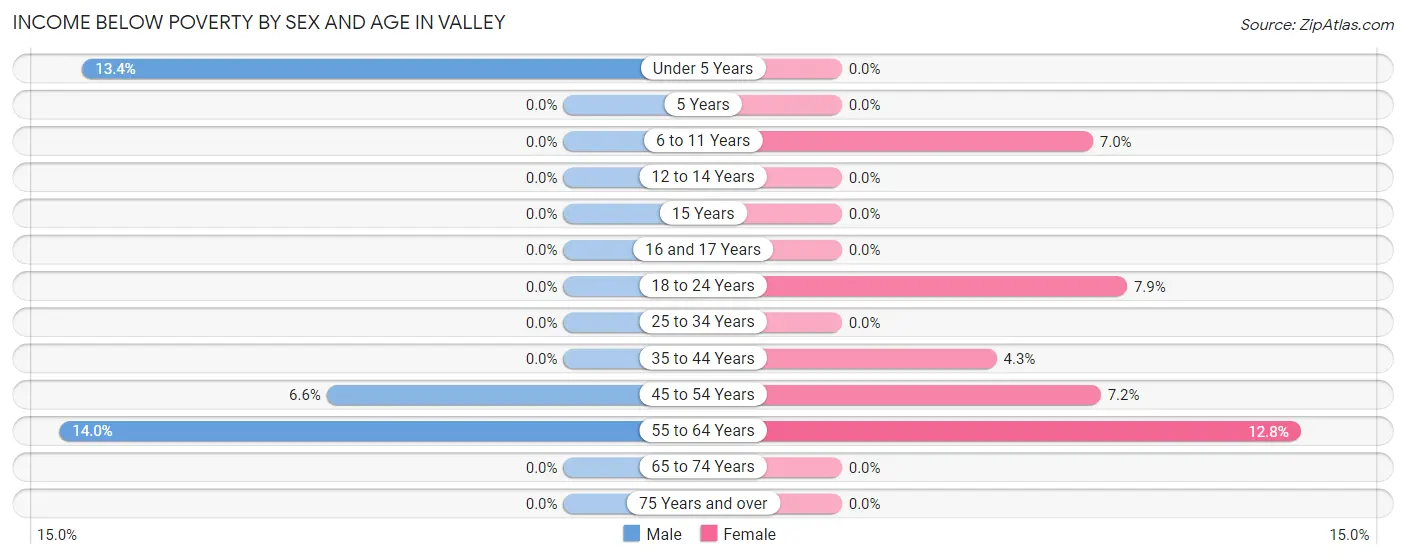
| Age Bracket | Male | Female |
| Under 5 Years | 17 (13.4%) | 0 (0.0%) |
| 5 Years | 0 (0.0%) | 0 (0.0%) |
| 6 to 11 Years | 0 (0.0%) | 10 (7.0%) |
| 12 to 14 Years | 0 (0.0%) | 0 (0.0%) |
| 15 Years | 0 (0.0%) | 0 (0.0%) |
| 16 and 17 Years | 0 (0.0%) | 0 (0.0%) |
| 18 to 24 Years | 0 (0.0%) | 5 (7.9%) |
| 25 to 34 Years | 0 (0.0%) | 0 (0.0%) |
| 35 to 44 Years | 0 (0.0%) | 10 (4.3%) |
| 45 to 54 Years | 11 (6.6%) | 15 (7.2%) |
| 55 to 64 Years | 39 (14.0%) | 41 (12.8%) |
| 65 to 74 Years | 0 (0.0%) | 0 (0.0%) |
| 75 Years and over | 0 (0.0%) | 0 (0.0%) |
| Total | 67 (4.4%) | 81 (5.5%) |
Income Above Poverty by Sex and Age in Valley
According to the poverty statistics in Valley, males aged 5 years and females aged under 5 years are the age groups that are most secure financially, with 100.0% of males and 100.0% of females in these age groups living above the poverty line.
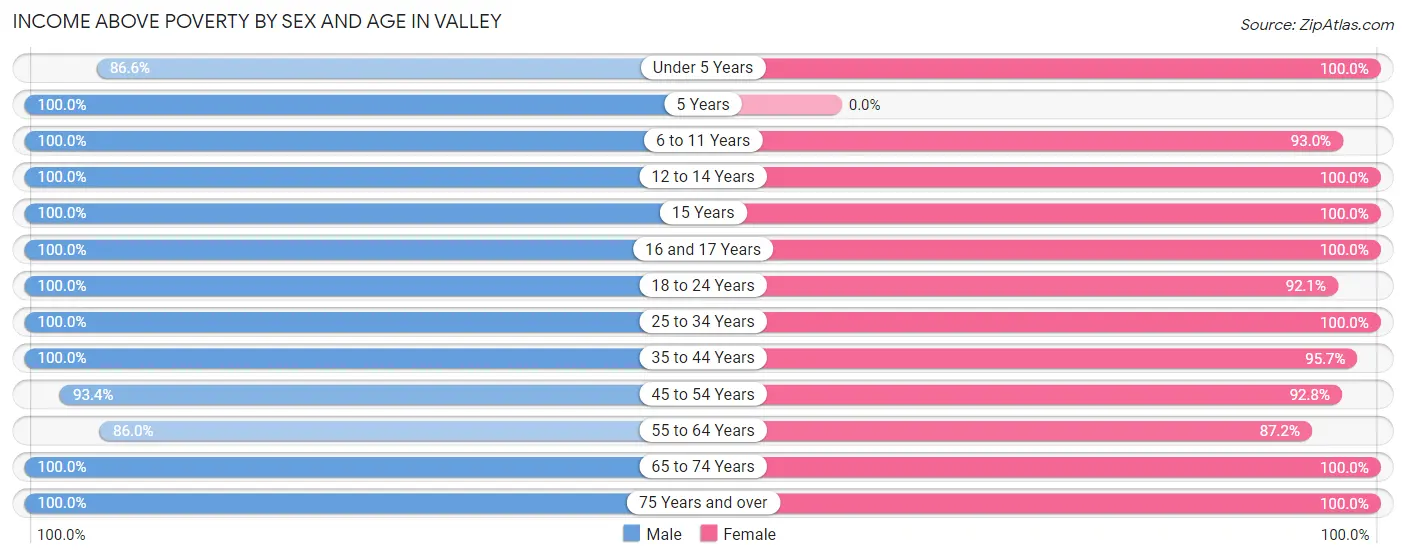
| Age Bracket | Male | Female |
| Under 5 Years | 110 (86.6%) | 78 (100.0%) |
| 5 Years | 27 (100.0%) | 0 (0.0%) |
| 6 to 11 Years | 96 (100.0%) | 133 (93.0%) |
| 12 to 14 Years | 109 (100.0%) | 27 (100.0%) |
| 15 Years | 15 (100.0%) | 4 (100.0%) |
| 16 and 17 Years | 9 (100.0%) | 8 (100.0%) |
| 18 to 24 Years | 104 (100.0%) | 58 (92.1%) |
| 25 to 34 Years | 172 (100.0%) | 114 (100.0%) |
| 35 to 44 Years | 141 (100.0%) | 222 (95.7%) |
| 45 to 54 Years | 156 (93.4%) | 193 (92.8%) |
| 55 to 64 Years | 239 (86.0%) | 280 (87.2%) |
| 65 to 74 Years | 203 (100.0%) | 197 (100.0%) |
| 75 Years and over | 73 (100.0%) | 66 (100.0%) |
| Total | 1,454 (95.6%) | 1,380 (94.5%) |
Income Below Poverty Among Married-Couple Families in Valley
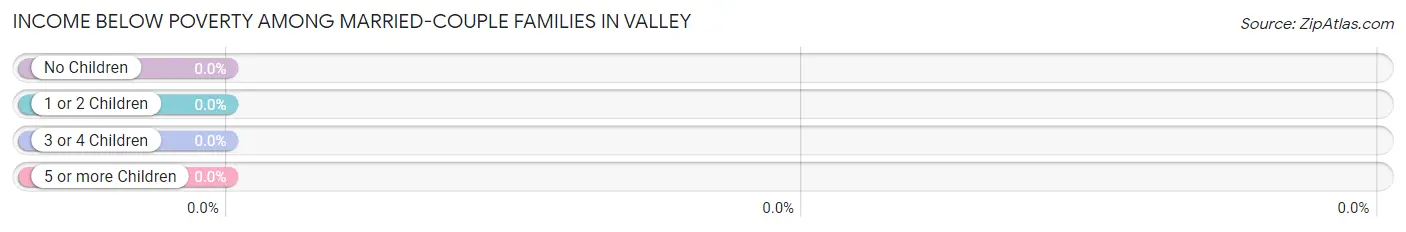
| Children | Above Poverty | Below Poverty |
| No Children | 458 (100.0%) | 0 (0.0%) |
| 1 or 2 Children | 220 (100.0%) | 0 (0.0%) |
| 3 or 4 Children | 24 (100.0%) | 0 (0.0%) |
| 5 or more Children | 0 (0.0%) | 0 (0.0%) |
| Total | 702 (100.0%) | 0 (0.0%) |
Income Below Poverty Among Single-Parent Households in Valley
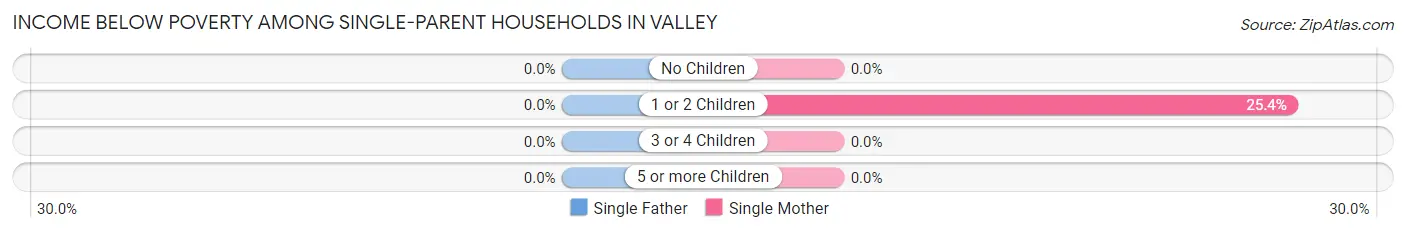
| Children | Single Father | Single Mother |
| No Children | 0 (0.0%) | 0 (0.0%) |
| 1 or 2 Children | 0 (0.0%) | 15 (25.4%) |
| 3 or 4 Children | 0 (0.0%) | 0 (0.0%) |
| 5 or more Children | 0 (0.0%) | 0 (0.0%) |
| Total | 0 (0.0%) | 15 (14.3%) |
Income Below Poverty Among Married-Couple vs Single-Parent Households in Valley

| Children | Married-Couple Families | Single-Parent Households |
| No Children | 0 (0.0%) | 0 (0.0%) |
| 1 or 2 Children | 0 (0.0%) | 15 (22.7%) |
| 3 or 4 Children | 0 (0.0%) | 0 (0.0%) |
| 5 or more Children | 0 (0.0%) | 0 (0.0%) |
| Total | 0 (0.0%) | 15 (10.6%) |
Race in Valley
The most populous races in Valley are White / Caucasian (2,939 | 96.9%), Hispanic or Latino (72 | 2.4%), and Two or more Races (47 | 1.5%).
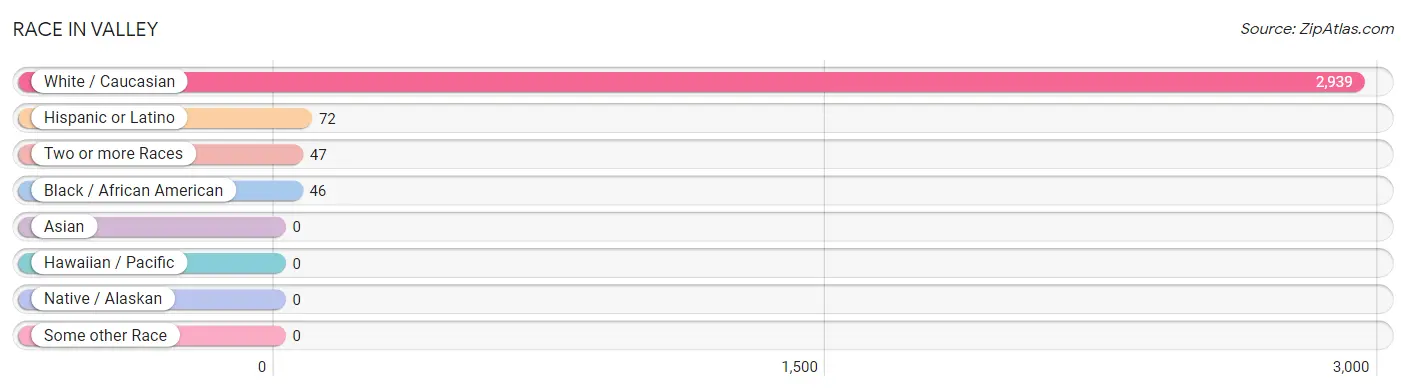
| Race | # Population | % Population |
| Asian | 0 | 0.0% |
| Black / African American | 46 | 1.5% |
| Hawaiian / Pacific | 0 | 0.0% |
| Hispanic or Latino | 72 | 2.4% |
| Native / Alaskan | 0 | 0.0% |
| White / Caucasian | 2,939 | 96.9% |
| Two or more Races | 47 | 1.5% |
| Some other Race | 0 | 0.0% |
| Total | 3,032 | 100.0% |
Ancestry in Valley
The most populous ancestries reported in Valley are German (1,263 | 41.7%), Irish (668 | 22.0%), Polish (226 | 7.4%), English (220 | 7.3%), and Swedish (188 | 6.2%), together accounting for 84.6% of all Valley residents.
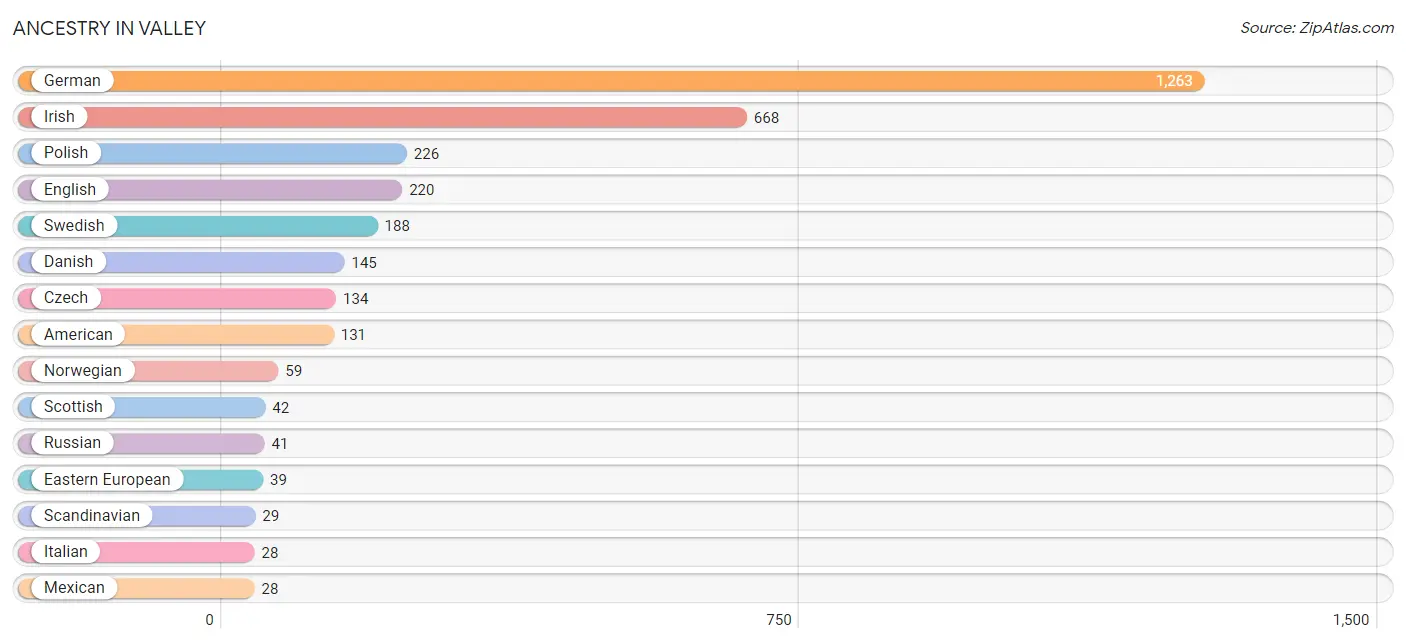
| Ancestry | # Population | % Population |
| African | 15 | 0.5% |
| American | 131 | 4.3% |
| Austrian | 18 | 0.6% |
| Central American | 10 | 0.3% |
| Croatian | 20 | 0.7% |
| Cuban | 11 | 0.4% |
| Czech | 134 | 4.4% |
| Danish | 145 | 4.8% |
| Dutch | 12 | 0.4% |
| Eastern European | 39 | 1.3% |
| English | 220 | 7.3% |
| French | 19 | 0.6% |
| French Canadian | 17 | 0.6% |
| German | 1,263 | 41.7% |
| Irish | 668 | 22.0% |
| Italian | 28 | 0.9% |
| Korean | 25 | 0.8% |
| Lithuanian | 10 | 0.3% |
| Mexican | 28 | 0.9% |
| Norwegian | 59 | 1.9% |
| Polish | 226 | 7.4% |
| Puerto Rican | 23 | 0.8% |
| Russian | 41 | 1.3% |
| Salvadoran | 10 | 0.3% |
| Scandinavian | 29 | 1.0% |
| Scotch-Irish | 21 | 0.7% |
| Scottish | 42 | 1.4% |
| Slovak | 16 | 0.5% |
| Subsaharan African | 15 | 0.5% |
| Swedish | 188 | 6.2% |
| Welsh | 28 | 0.9% | View All 31 Rows |
Immigrants in Valley
The most numerous immigrant groups reported in Valley came from Africa (15 | 0.5%), Nigeria (15 | 0.5%), Western Africa (15 | 0.5%), Caribbean (11 | 0.4%), and Cuba (11 | 0.4%), together accounting for 2.2% of all Valley residents.
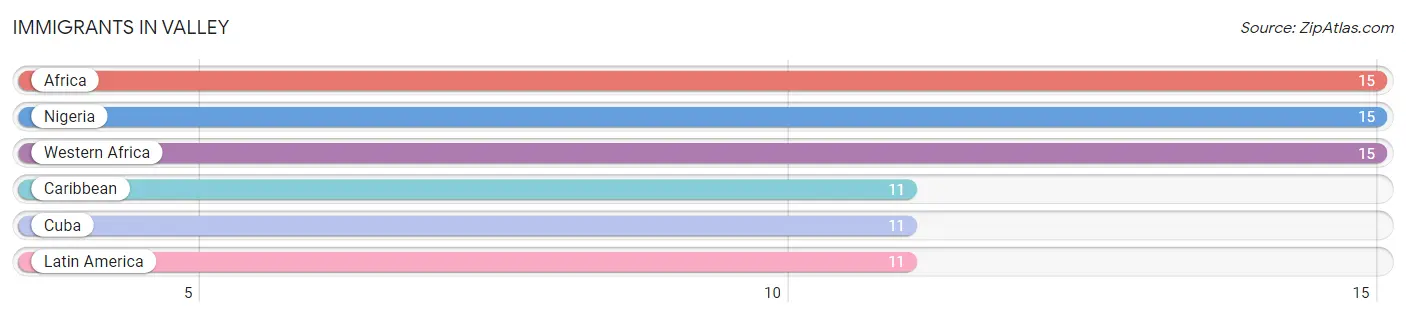
| Immigration Origin | # Population | % Population |
| Africa | 15 | 0.5% |
| Caribbean | 11 | 0.4% |
| Cuba | 11 | 0.4% |
| Latin America | 11 | 0.4% |
| Nigeria | 15 | 0.5% |
| Western Africa | 15 | 0.5% | View All 6 Rows |
Sex and Age in Valley
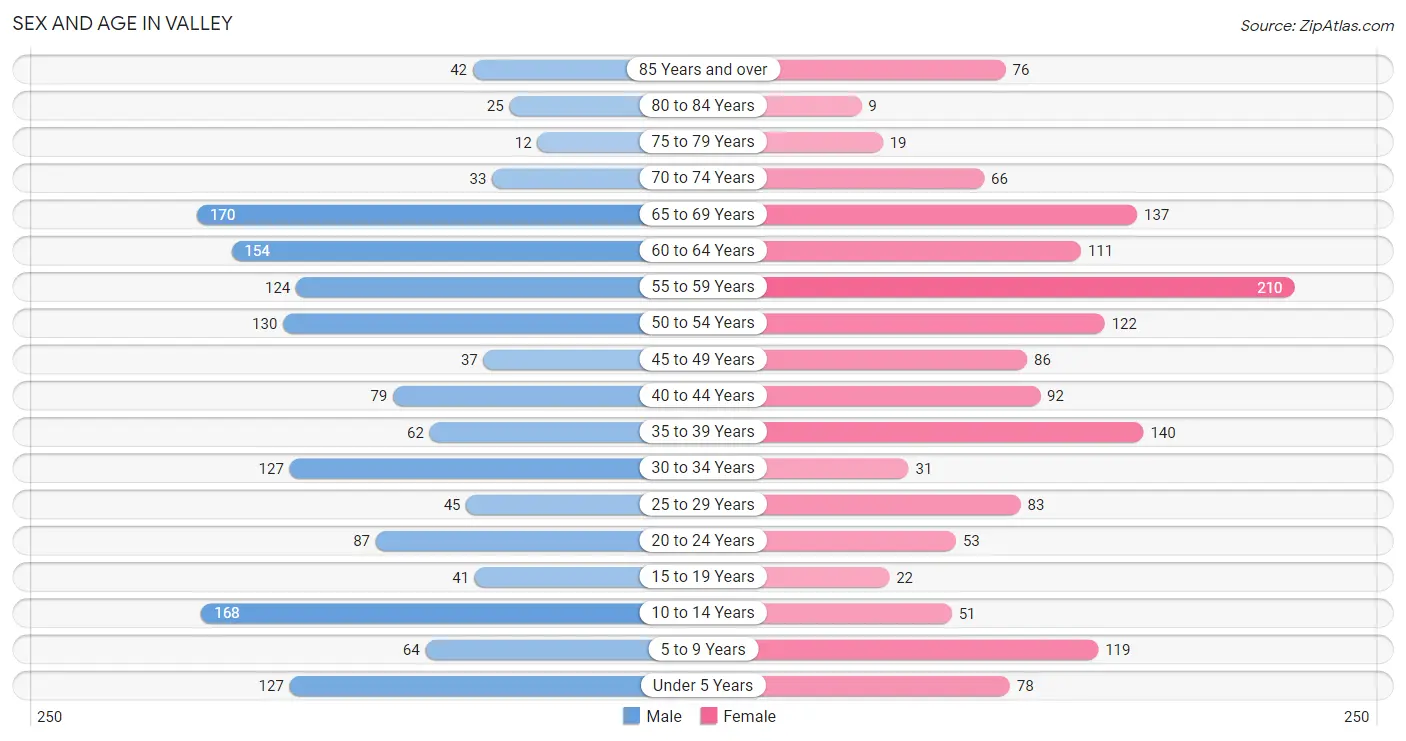
Sex and Age in Valley
The most populous age groups in Valley are 65 to 69 Years (170 | 11.1%) for men and 55 to 59 Years (210 | 14.0%) for women.
| Age Bracket | Male | Female |
| Under 5 Years | 127 (8.3%) | 78 (5.2%) |
| 5 to 9 Years | 64 (4.2%) | 119 (7.9%) |
| 10 to 14 Years | 168 (11.0%) | 51 (3.4%) |
| 15 to 19 Years | 41 (2.7%) | 22 (1.5%) |
| 20 to 24 Years | 87 (5.7%) | 53 (3.5%) |
| 25 to 29 Years | 45 (2.9%) | 83 (5.5%) |
| 30 to 34 Years | 127 (8.3%) | 31 (2.1%) |
| 35 to 39 Years | 62 (4.1%) | 140 (9.3%) |
| 40 to 44 Years | 79 (5.2%) | 92 (6.1%) |
| 45 to 49 Years | 37 (2.4%) | 86 (5.7%) |
| 50 to 54 Years | 130 (8.5%) | 122 (8.1%) |
| 55 to 59 Years | 124 (8.1%) | 210 (14.0%) |
| 60 to 64 Years | 154 (10.1%) | 111 (7.4%) |
| 65 to 69 Years | 170 (11.1%) | 137 (9.1%) |
| 70 to 74 Years | 33 (2.2%) | 66 (4.4%) |
| 75 to 79 Years | 12 (0.8%) | 19 (1.3%) |
| 80 to 84 Years | 25 (1.6%) | 9 (0.6%) |
| 85 Years and over | 42 (2.8%) | 76 (5.1%) |
| Total | 1,527 (100.0%) | 1,505 (100.0%) |
Families and Households in Valley
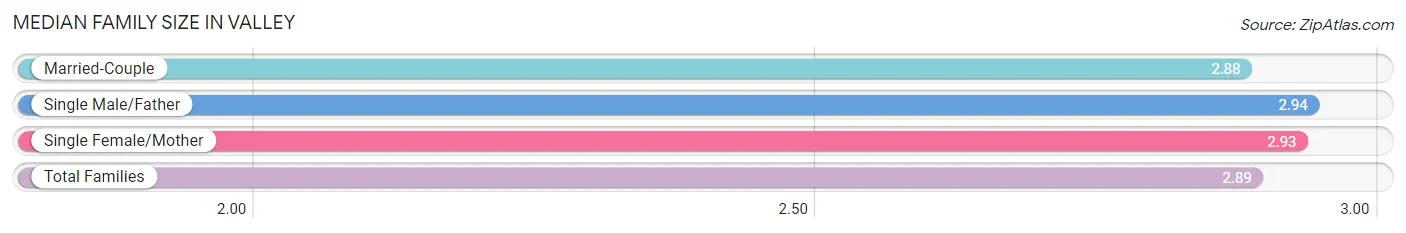
Median Family Size in Valley
The median family size in Valley is 2.89 persons per family, with single male/father families (36 | 4.3%) accounting for the largest median family size of 2.94 persons per family. On the other hand, married-couple families (702 | 83.3%) represent the smallest median family size with 2.88 persons per family.
| Family Type | # Families | Family Size |
| Married-Couple | 702 (83.3%) | 2.88 |
| Single Male/Father | 36 (4.3%) | 2.94 |
| Single Female/Mother | 105 (12.5%) | 2.93 |
| Total Families | 843 (100.0%) | 2.89 |
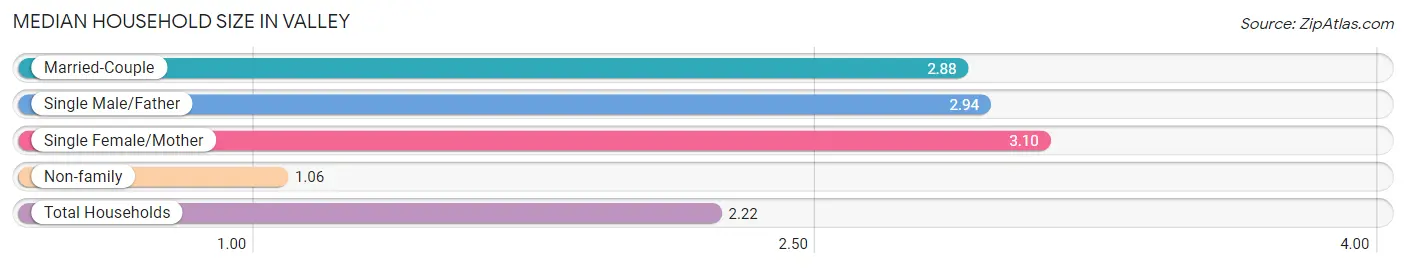
Median Household Size in Valley
The median household size in Valley is 2.22 persons per household, with single female/mother households (105 | 7.8%) accounting for the largest median household size of 3.1 persons per household. non-family households (499 | 37.2%) represent the smallest median household size with 1.06 persons per household.
| Household Type | # Households | Household Size |
| Married-Couple | 702 (52.3%) | 2.88 |
| Single Male/Father | 36 (2.7%) | 2.94 |
| Single Female/Mother | 105 (7.8%) | 3.10 |
| Non-family | 499 (37.2%) | 1.06 |
| Total Households | 1,342 (100.0%) | 2.22 |
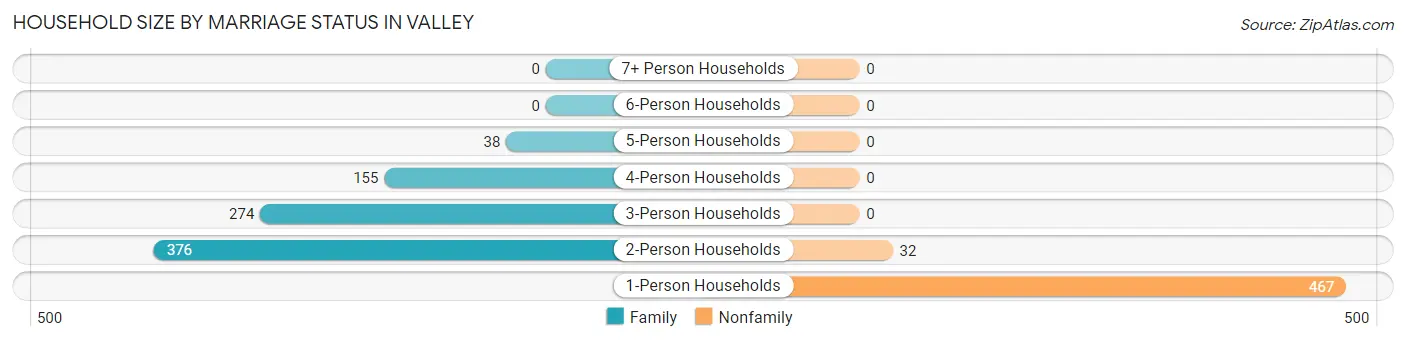
Household Size by Marriage Status in Valley
Out of a total of 1,342 households in Valley, 843 (62.8%) are family households, while 499 (37.2%) are nonfamily households. The most numerous type of family households are 2-person households, comprising 376, and the most common type of nonfamily households are 1-person households, comprising 467.
| Household Size | Family Households | Nonfamily Households |
| 1-Person Households | - | 467 (34.8%) |
| 2-Person Households | 376 (28.0%) | 32 (2.4%) |
| 3-Person Households | 274 (20.4%) | 0 (0.0%) |
| 4-Person Households | 155 (11.6%) | 0 (0.0%) |
| 5-Person Households | 38 (2.8%) | 0 (0.0%) |
| 6-Person Households | 0 (0.0%) | 0 (0.0%) |
| 7+ Person Households | 0 (0.0%) | 0 (0.0%) |
| Total | 843 (62.8%) | 499 (37.2%) |
Female Fertility in Valley
Fertility by Age in Valley
Average fertility rate in Valley is 49.0 births per 1,000 women. Women in the age bracket of 20 to 34 years have the highest fertility rate with 96.0 births per 1,000 women. Women in the age bracket of 20 to 34 years acount for 61.5% of all women with births.
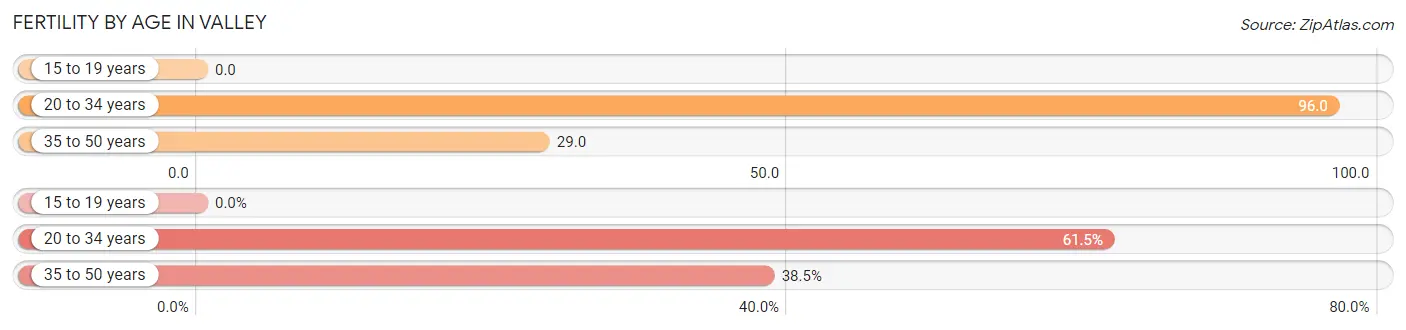
| Age Bracket | Women with Births | Births / 1,000 Women |
| 15 to 19 years | 0 (0.0%) | 0.0 |
| 20 to 34 years | 16 (61.5%) | 96.0 |
| 35 to 50 years | 10 (38.5%) | 29.0 |
| Total | 26 (100.0%) | 49.0 |
Fertility by Age by Marriage Status in Valley
61.5% of women with births (26) in Valley are married. The highest percentage of unmarried women with births falls into 20 to 34 years age bracket with 62.5% of them unmarried at the time of birth, while the lowest percentage of unmarried women with births belong to 35 to 50 years age bracket with 0.0% of them unmarried.
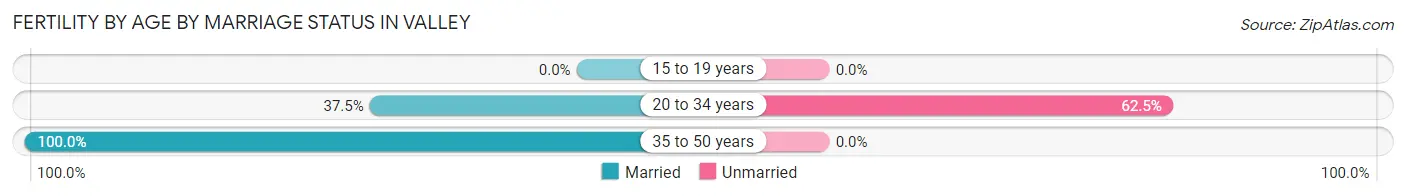
| Age Bracket | Married | Unmarried |
| 15 to 19 years | 0 (0.0%) | 0 (0.0%) |
| 20 to 34 years | 6 (37.5%) | 10 (62.5%) |
| 35 to 50 years | 10 (100.0%) | 0 (0.0%) |
| Total | 16 (61.5%) | 10 (38.5%) |
Fertility by Education in Valley
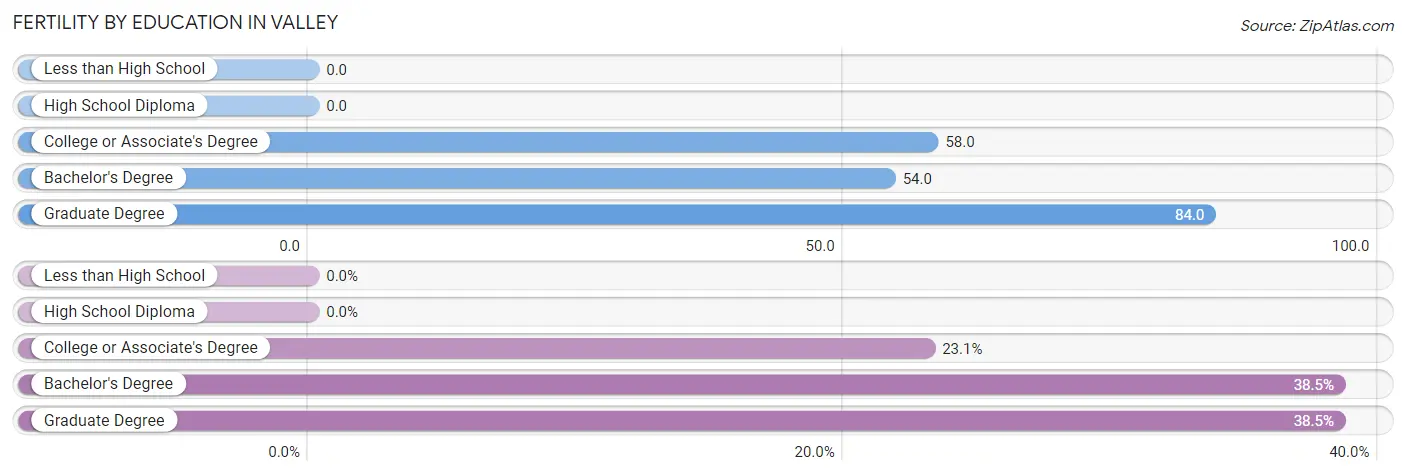
| Educational Attainment | Women with Births | Births / 1,000 Women |
| Less than High School | 0 (0.0%) | 0.0 |
| High School Diploma | 0 (0.0%) | 0.0 |
| College or Associate's Degree | 6 (23.1%) | 58.0 |
| Bachelor's Degree | 10 (38.5%) | 54.0 |
| Graduate Degree | 10 (38.5%) | 84.0 |
| Total | 26 (100.0%) | 49.0 |
Fertility by Education by Marriage Status in Valley
38.5% of women with births in Valley are unmarried. Women with the educational attainment of college or associate's degree are most likely to be married with 100.0% of them married at childbirth, while women with the educational attainment of bachelor's degree are least likely to be married with 100.0% of them unmarried at childbirth.
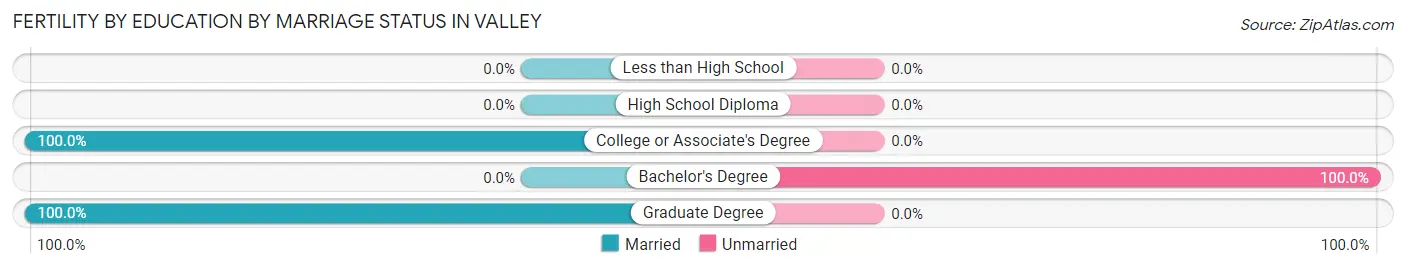
| Educational Attainment | Married | Unmarried |
| Less than High School | 0 (0.0%) | 0 (0.0%) |
| High School Diploma | 0 (0.0%) | 0 (0.0%) |
| College or Associate's Degree | 6 (100.0%) | 0 (0.0%) |
| Bachelor's Degree | 0 (0.0%) | 10 (100.0%) |
| Graduate Degree | 10 (100.0%) | 0 (0.0%) |
| Total | 16 (61.5%) | 10 (38.5%) |
Employment Characteristics in Valley
Employment by Class of Employer in Valley
Among the 1,491 employed individuals in Valley, private company employees (944 | 63.3%), not-for-profit organizations (192 | 12.9%), and self-employed (not incorporated) (129 | 8.6%) make up the most common classes of employment.
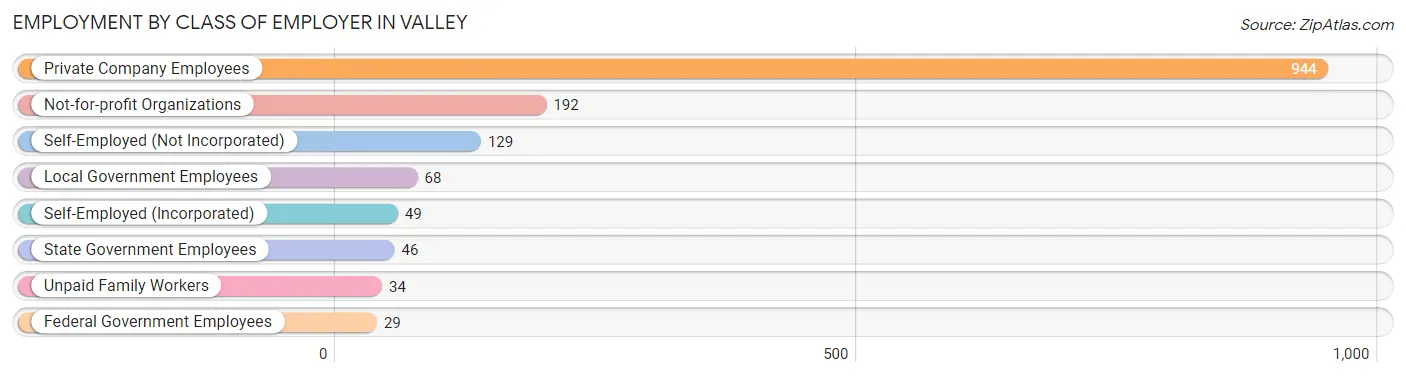
| Employer Class | # Employees | % Employees |
| Private Company Employees | 944 | 63.3% |
| Self-Employed (Incorporated) | 49 | 3.3% |
| Self-Employed (Not Incorporated) | 129 | 8.6% |
| Not-for-profit Organizations | 192 | 12.9% |
| Local Government Employees | 68 | 4.6% |
| State Government Employees | 46 | 3.1% |
| Federal Government Employees | 29 | 1.9% |
| Unpaid Family Workers | 34 | 2.3% |
| Total | 1,491 | 100.0% |
Employment Status by Age in Valley
According to the labor force statistics for Valley, out of the total population over 16 years of age (2,406), 65.5% or 1,576 individuals are in the labor force, with 2.9% or 46 of them unemployed. The age group with the highest labor force participation rate is 20 to 24 years, with 96.4% or 135 individuals in the labor force. Within the labor force, the 45 to 54 years age range has the highest percentage of unemployed individuals, with 10.0% or 36 of them being unemployed.
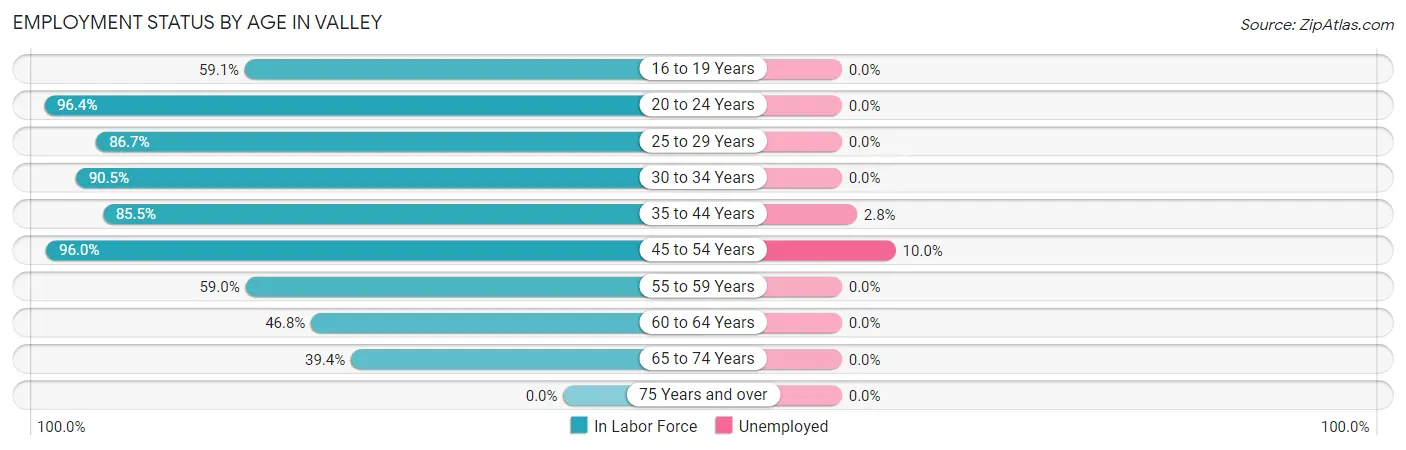
| Age Bracket | In Labor Force | Unemployed |
| 16 to 19 Years | 26 (59.1%) | 0 (0.0%) |
| 20 to 24 Years | 135 (96.4%) | 0 (0.0%) |
| 25 to 29 Years | 111 (86.7%) | 0 (0.0%) |
| 30 to 34 Years | 143 (90.5%) | 0 (0.0%) |
| 35 to 44 Years | 319 (85.5%) | 9 (2.8%) |
| 45 to 54 Years | 360 (96.0%) | 36 (10.0%) |
| 55 to 59 Years | 197 (59.0%) | 0 (0.0%) |
| 60 to 64 Years | 124 (46.8%) | 0 (0.0%) |
| 65 to 74 Years | 160 (39.4%) | 0 (0.0%) |
| 75 Years and over | 0 (0.0%) | 0 (0.0%) |
| Total | 1,576 (65.5%) | 46 (2.9%) |
Employment Status by Educational Attainment in Valley
According to labor force statistics for Valley, 76.8% of individuals (1,254) out of the total population between 25 and 64 years of age (1,633) are in the labor force, with 3.6% or 45 of them being unemployed. The group with the highest labor force participation rate are those with the educational attainment of bachelor's degree or higher, with 87.5% or 671 individuals in the labor force. Within the labor force, individuals with college / associate degree education have the highest percentage of unemployment, with 6.5% or 19 of them being unemployed.
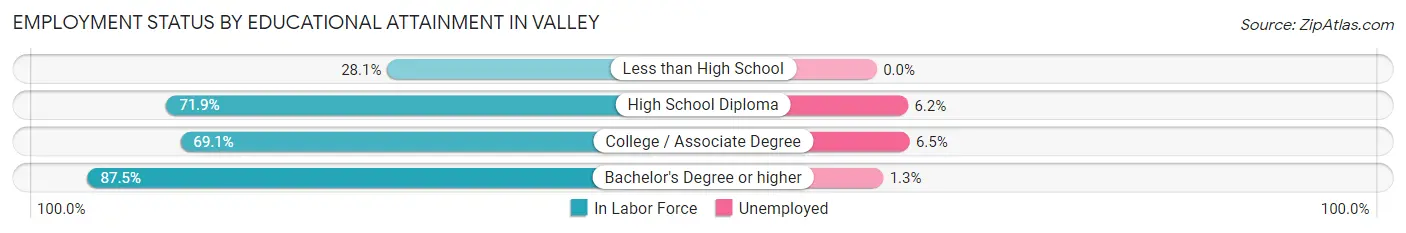
| Educational Attainment | In Labor Force | Unemployed |
| Less than High School | 18 (28.1%) | 0 (0.0%) |
| High School Diploma | 274 (71.9%) | 24 (6.2%) |
| College / Associate Degree | 291 (69.1%) | 27 (6.5%) |
| Bachelor's Degree or higher | 671 (87.5%) | 10 (1.3%) |
| Total | 1,254 (76.8%) | 59 (3.6%) |
Employment Occupations by Sex in Valley
Management, Business, Science and Arts Occupations
The most common Management, Business, Science and Arts occupations in Valley are Management (266 | 17.4%), Community & Social Service (176 | 11.5%), Computers, Engineering & Science (140 | 9.1%), Health Diagnosing & Treating (126 | 8.2%), and Health Technologists (119 | 7.8%).
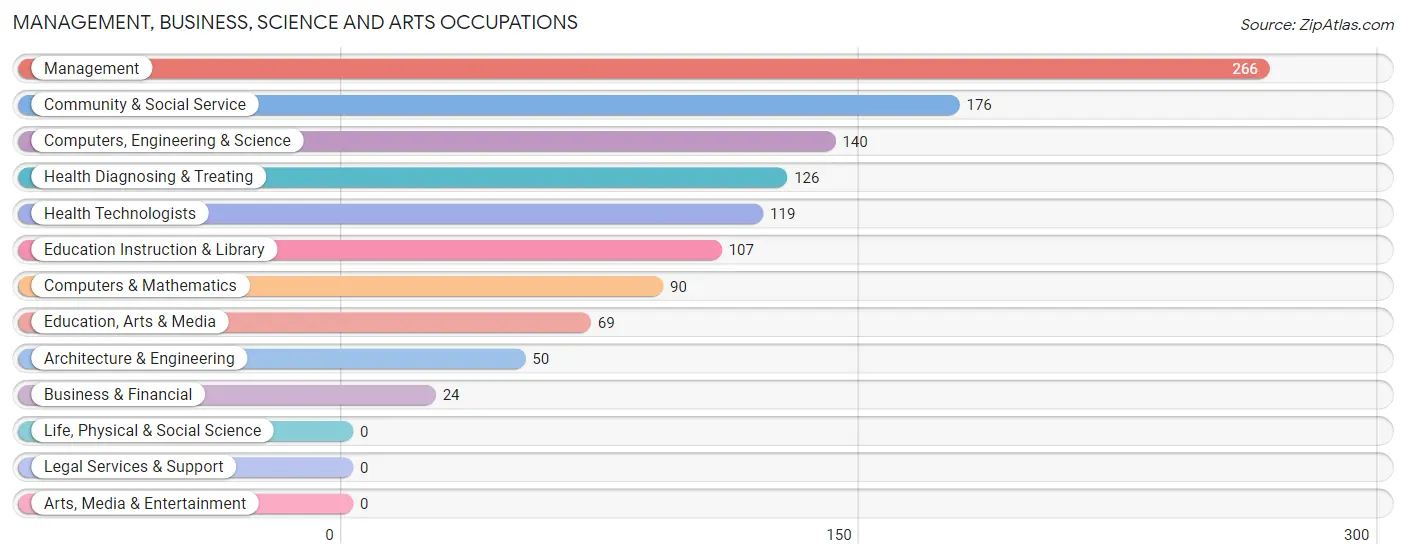
Management, Business, Science and Arts Occupations by Sex
Within the Management, Business, Science and Arts occupations in Valley, the most male-oriented occupations are Architecture & Engineering (100.0%), Computers, Engineering & Science (77.9%), and Computers & Mathematics (65.6%), while the most female-oriented occupations are Health Technologists (79.0%), Education Instruction & Library (75.7%), and Health Diagnosing & Treating (74.6%).
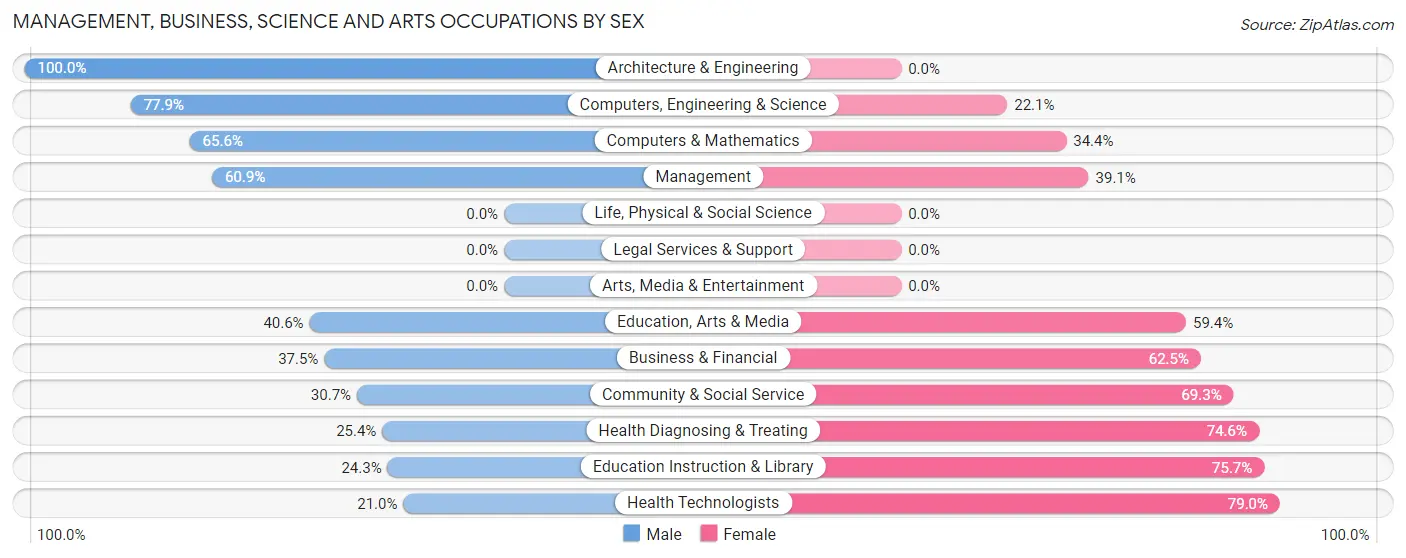
| Occupation | Male | Female |
| Management | 162 (60.9%) | 104 (39.1%) |
| Business & Financial | 9 (37.5%) | 15 (62.5%) |
| Computers, Engineering & Science | 109 (77.9%) | 31 (22.1%) |
| Computers & Mathematics | 59 (65.6%) | 31 (34.4%) |
| Architecture & Engineering | 50 (100.0%) | 0 (0.0%) |
| Life, Physical & Social Science | 0 (0.0%) | 0 (0.0%) |
| Community & Social Service | 54 (30.7%) | 122 (69.3%) |
| Education, Arts & Media | 28 (40.6%) | 41 (59.4%) |
| Legal Services & Support | 0 (0.0%) | 0 (0.0%) |
| Education Instruction & Library | 26 (24.3%) | 81 (75.7%) |
| Arts, Media & Entertainment | 0 (0.0%) | 0 (0.0%) |
| Health Diagnosing & Treating | 32 (25.4%) | 94 (74.6%) |
| Health Technologists | 25 (21.0%) | 94 (79.0%) |
| Total (Category) | 366 (50.0%) | 366 (50.0%) |
| Total (Overall) | 841 (55.0%) | 689 (45.0%) |
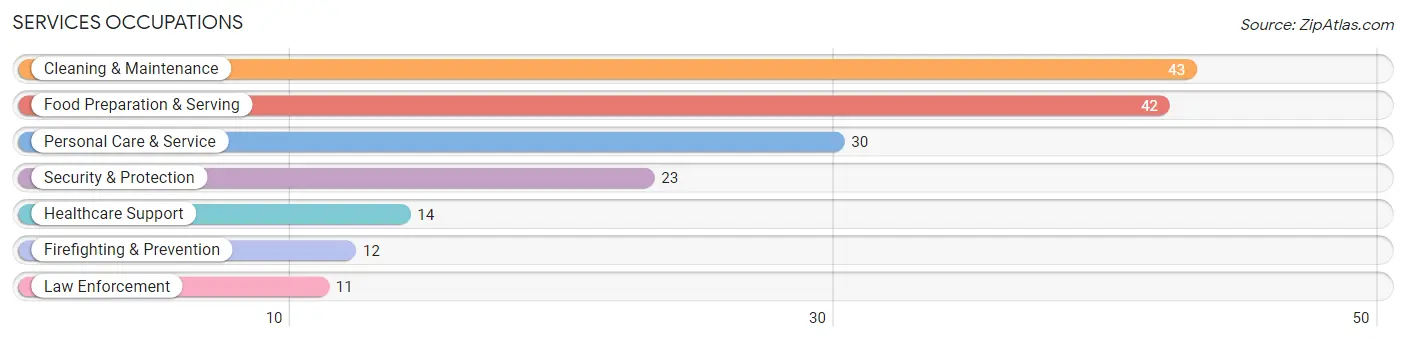
Services Occupations
The most common Services occupations in Valley are Cleaning & Maintenance (43 | 2.8%), Food Preparation & Serving (42 | 2.8%), Personal Care & Service (30 | 2.0%), Security & Protection (23 | 1.5%), and Healthcare Support (14 | 0.9%).
Services Occupations by Sex
Within the Services occupations in Valley, the most male-oriented occupations are Security & Protection (100.0%), Firefighting & Prevention (100.0%), and Law Enforcement (100.0%), while the most female-oriented occupations are Healthcare Support (100.0%), Cleaning & Maintenance (100.0%), and Personal Care & Service (43.3%).
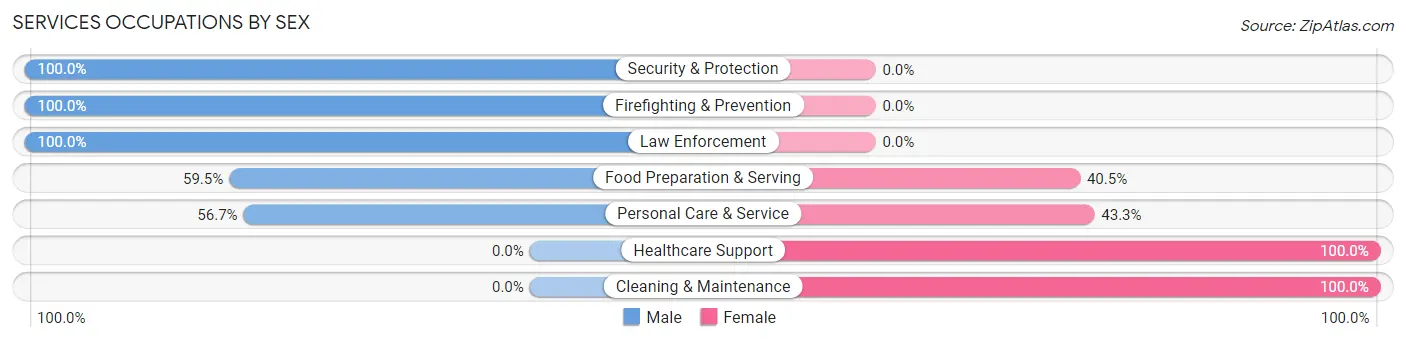
| Occupation | Male | Female |
| Healthcare Support | 0 (0.0%) | 14 (100.0%) |
| Security & Protection | 23 (100.0%) | 0 (0.0%) |
| Firefighting & Prevention | 12 (100.0%) | 0 (0.0%) |
| Law Enforcement | 11 (100.0%) | 0 (0.0%) |
| Food Preparation & Serving | 25 (59.5%) | 17 (40.5%) |
| Cleaning & Maintenance | 0 (0.0%) | 43 (100.0%) |
| Personal Care & Service | 17 (56.7%) | 13 (43.3%) |
| Total (Category) | 65 (42.8%) | 87 (57.2%) |
| Total (Overall) | 841 (55.0%) | 689 (45.0%) |
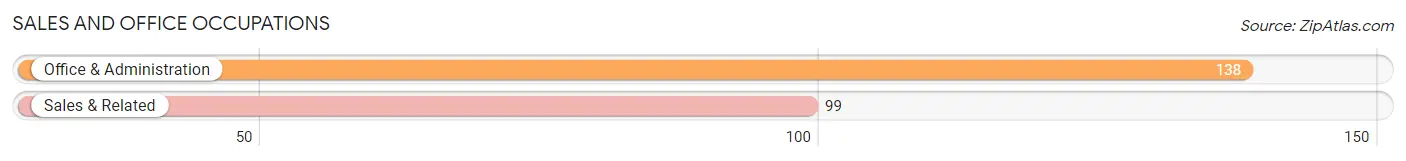
Sales and Office Occupations
The most common Sales and Office occupations in Valley are Office & Administration (138 | 9.0%), and Sales & Related (99 | 6.5%).
Sales and Office Occupations by Sex
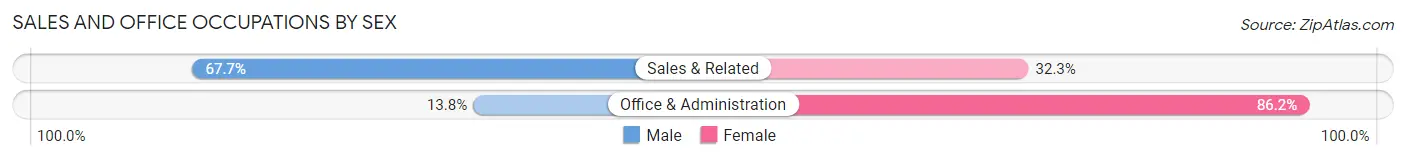
| Occupation | Male | Female |
| Sales & Related | 67 (67.7%) | 32 (32.3%) |
| Office & Administration | 19 (13.8%) | 119 (86.2%) |
| Total (Category) | 86 (36.3%) | 151 (63.7%) |
| Total (Overall) | 841 (55.0%) | 689 (45.0%) |
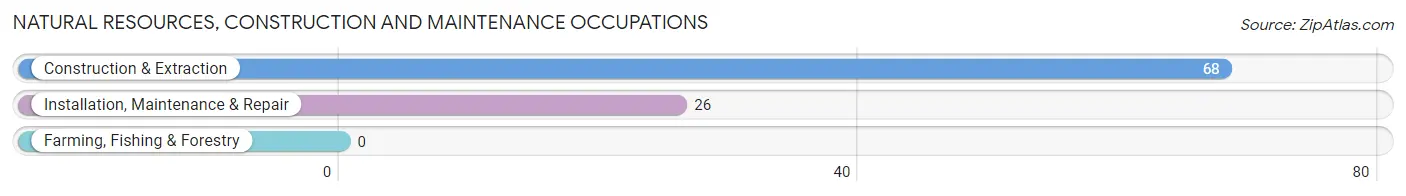
Natural Resources, Construction and Maintenance Occupations
The most common Natural Resources, Construction and Maintenance occupations in Valley are Construction & Extraction (68 | 4.4%), and Installation, Maintenance & Repair (26 | 1.7%).
Natural Resources, Construction and Maintenance Occupations by Sex
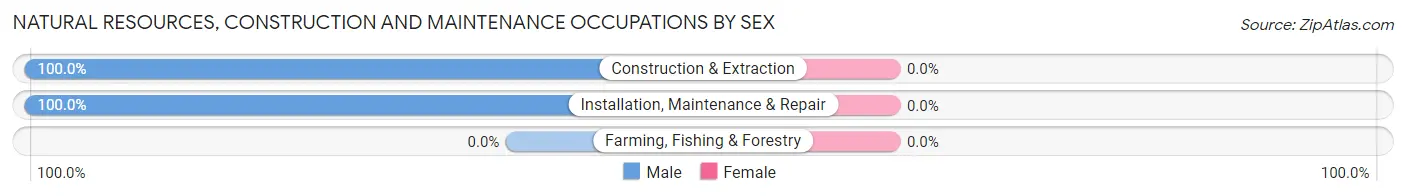
| Occupation | Male | Female |
| Farming, Fishing & Forestry | 0 (0.0%) | 0 (0.0%) |
| Construction & Extraction | 68 (100.0%) | 0 (0.0%) |
| Installation, Maintenance & Repair | 26 (100.0%) | 0 (0.0%) |
| Total (Category) | 94 (100.0%) | 0 (0.0%) |
| Total (Overall) | 841 (55.0%) | 689 (45.0%) |
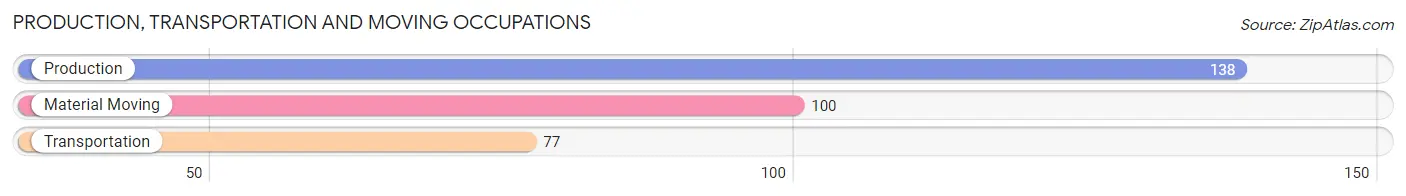
Production, Transportation and Moving Occupations
The most common Production, Transportation and Moving occupations in Valley are Production (138 | 9.0%), Material Moving (100 | 6.5%), and Transportation (77 | 5.0%).
Production, Transportation and Moving Occupations by Sex
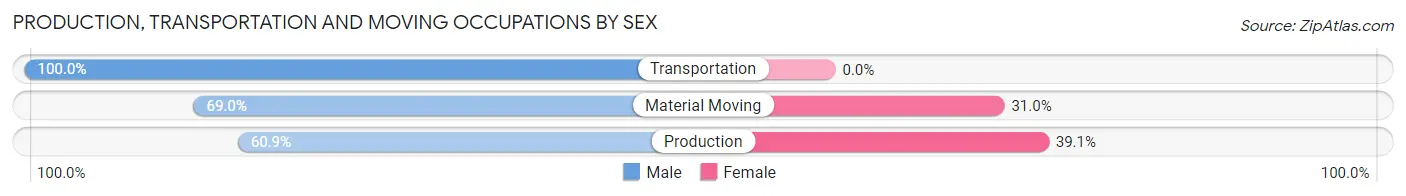
| Occupation | Male | Female |
| Production | 84 (60.9%) | 54 (39.1%) |
| Transportation | 77 (100.0%) | 0 (0.0%) |
| Material Moving | 69 (69.0%) | 31 (31.0%) |
| Total (Category) | 230 (73.0%) | 85 (27.0%) |
| Total (Overall) | 841 (55.0%) | 689 (45.0%) |
Employment Industries by Sex in Valley
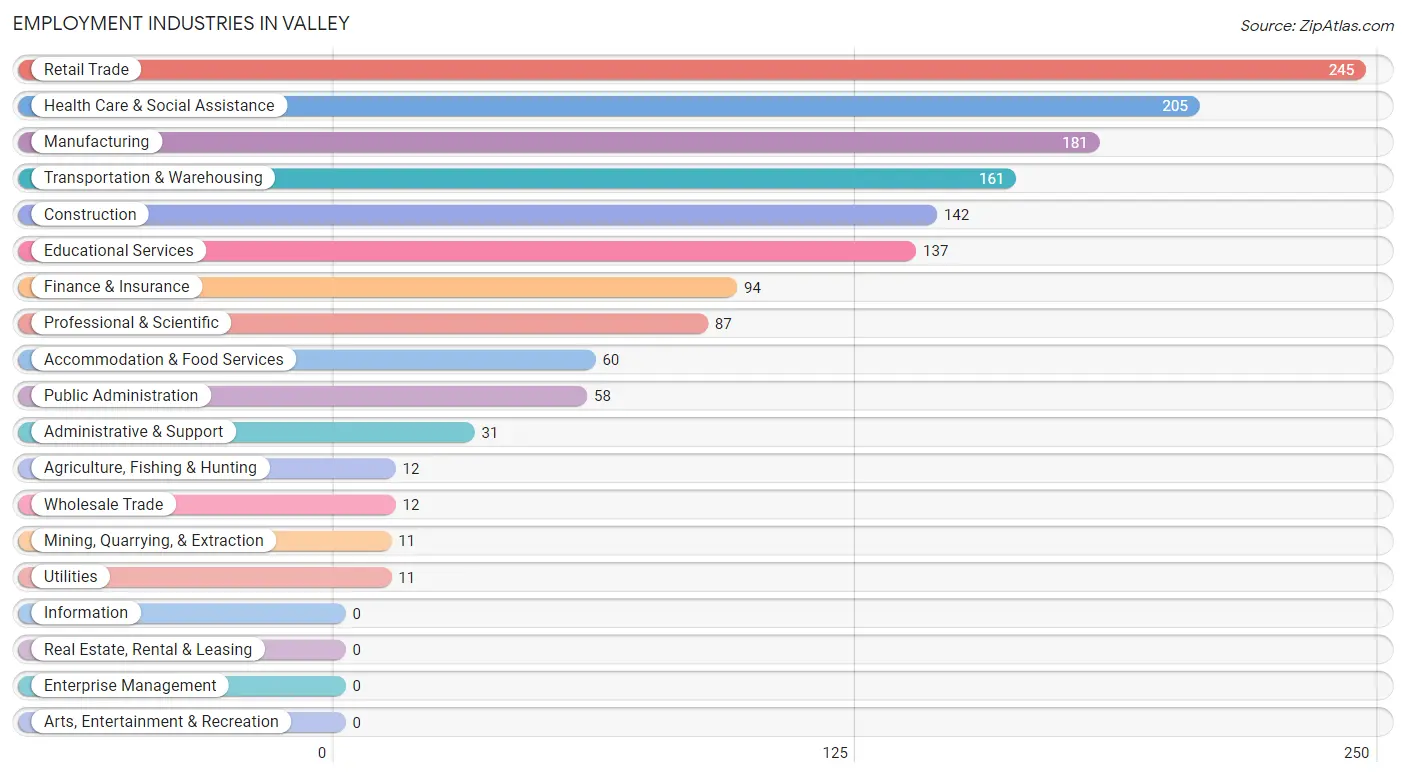
Employment Industries in Valley
The major employment industries in Valley include Retail Trade (245 | 16.0%), Health Care & Social Assistance (205 | 13.4%), Manufacturing (181 | 11.8%), Transportation & Warehousing (161 | 10.5%), and Construction (142 | 9.3%).
Employment Industries by Sex in Valley
The Valley industries that see more men than women are Agriculture, Fishing & Hunting (100.0%), Mining, Quarrying, & Extraction (100.0%), and Utilities (100.0%), whereas the industries that tend to have a higher number of women are Wholesale Trade (100.0%), Health Care & Social Assistance (95.1%), and Educational Services (75.2%).
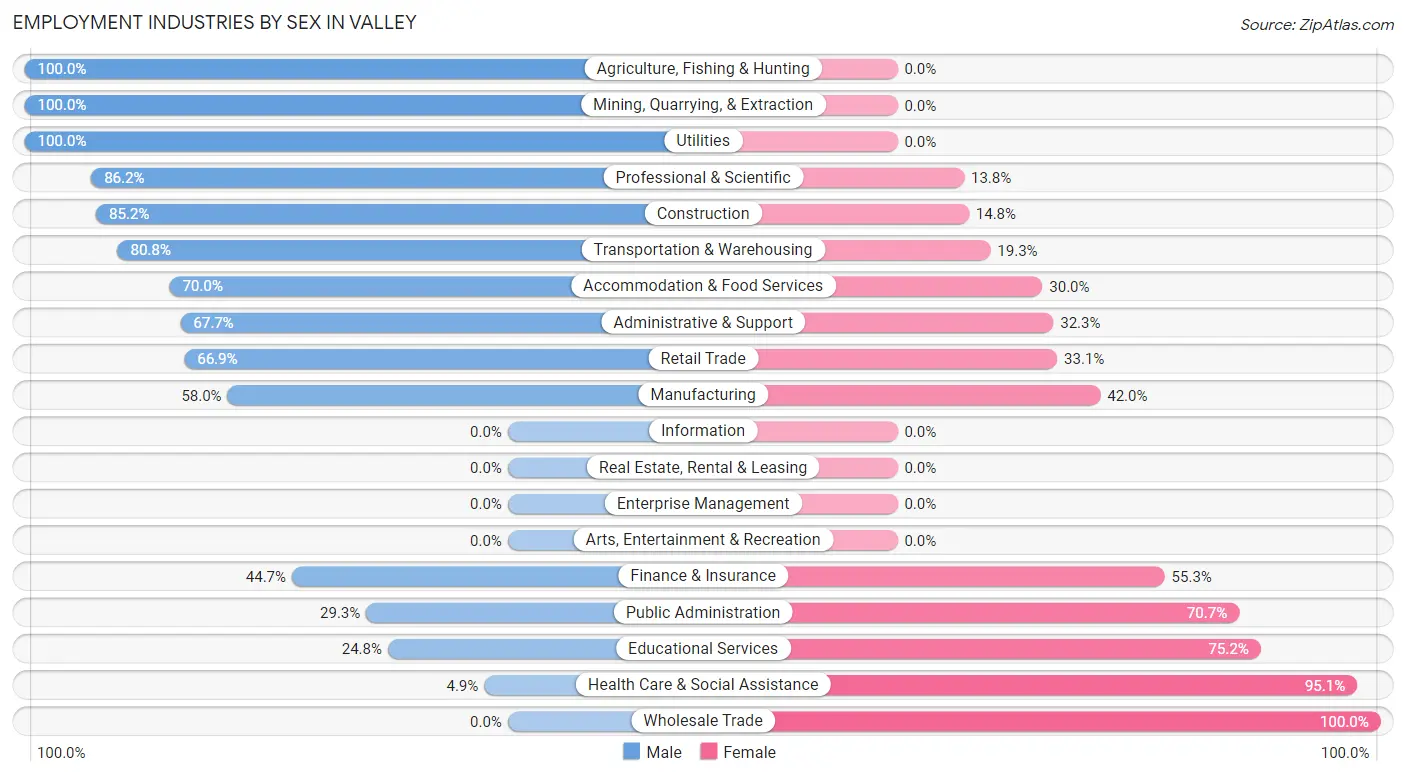
| Industry | Male | Female |
| Agriculture, Fishing & Hunting | 12 (100.0%) | 0 (0.0%) |
| Mining, Quarrying, & Extraction | 11 (100.0%) | 0 (0.0%) |
| Construction | 121 (85.2%) | 21 (14.8%) |
| Manufacturing | 105 (58.0%) | 76 (42.0%) |
| Wholesale Trade | 0 (0.0%) | 12 (100.0%) |
| Retail Trade | 164 (66.9%) | 81 (33.1%) |
| Transportation & Warehousing | 130 (80.7%) | 31 (19.3%) |
| Utilities | 11 (100.0%) | 0 (0.0%) |
| Information | 0 (0.0%) | 0 (0.0%) |
| Finance & Insurance | 42 (44.7%) | 52 (55.3%) |
| Real Estate, Rental & Leasing | 0 (0.0%) | 0 (0.0%) |
| Professional & Scientific | 75 (86.2%) | 12 (13.8%) |
| Enterprise Management | 0 (0.0%) | 0 (0.0%) |
| Administrative & Support | 21 (67.7%) | 10 (32.3%) |
| Educational Services | 34 (24.8%) | 103 (75.2%) |
| Health Care & Social Assistance | 10 (4.9%) | 195 (95.1%) |
| Arts, Entertainment & Recreation | 0 (0.0%) | 0 (0.0%) |
| Accommodation & Food Services | 42 (70.0%) | 18 (30.0%) |
| Public Administration | 17 (29.3%) | 41 (70.7%) |
| Total | 841 (55.0%) | 689 (45.0%) |
Education in Valley
School Enrollment in Valley
The most common levels of schooling among the 666 students in Valley are middle school (198 | 29.7%), elementary school (157 | 23.6%), and college / undergraduate (129 | 19.4%).
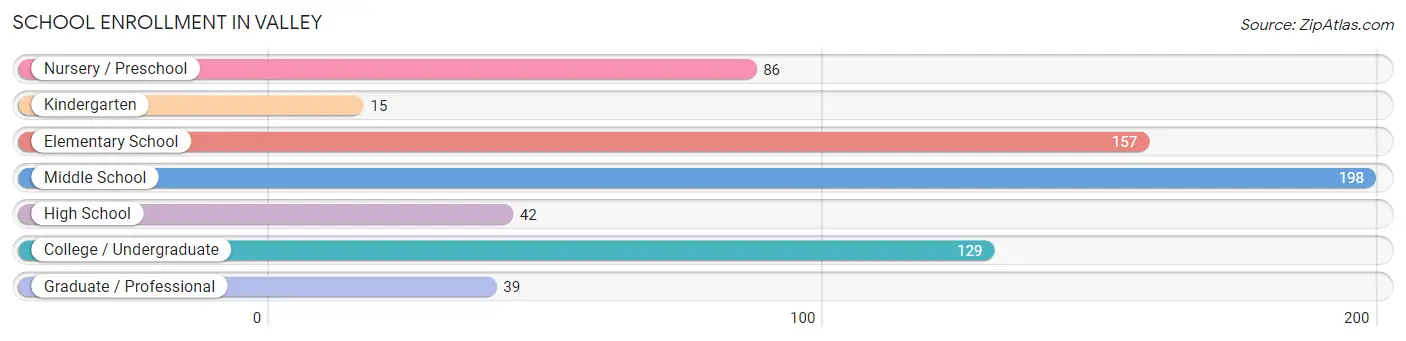
| School Level | # Students | % Students |
| Nursery / Preschool | 86 | 12.9% |
| Kindergarten | 15 | 2.2% |
| Elementary School | 157 | 23.6% |
| Middle School | 198 | 29.7% |
| High School | 42 | 6.3% |
| College / Undergraduate | 129 | 19.4% |
| Graduate / Professional | 39 | 5.9% |
| Total | 666 | 100.0% |
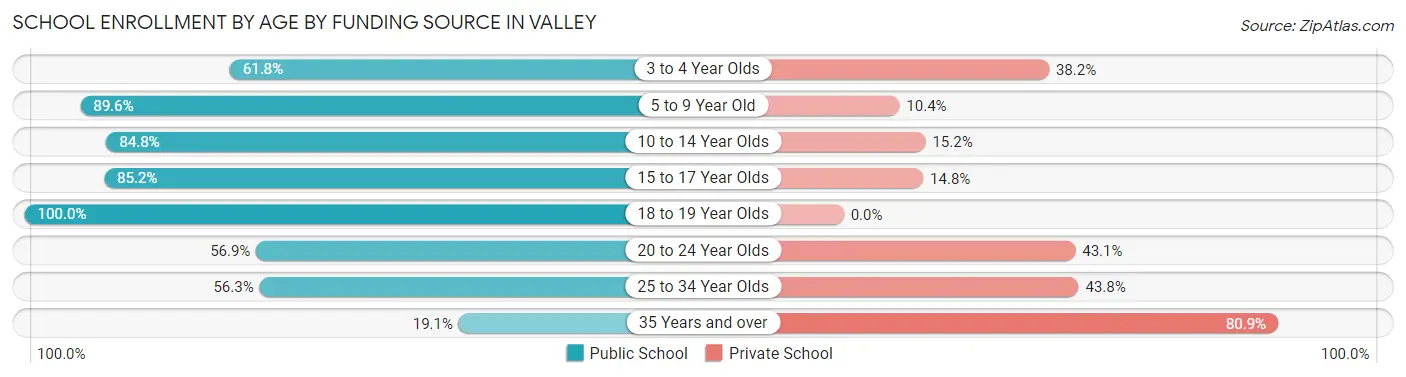
School Enrollment by Age by Funding Source in Valley
Out of a total of 666 students who are enrolled in schools in Valley, 172 (25.8%) attend a private institution, while the remaining 494 (74.2%) are enrolled in public schools. The age group of 35 years and over has the highest likelihood of being enrolled in private schools, with 55 (80.9% in the age bracket) enrolled. Conversely, the age group of 18 to 19 year olds has the lowest likelihood of being enrolled in a private school, with 27 (100.0% in the age bracket) attending a public institution.
| Age Bracket | Public School | Private School |
| 3 to 4 Year Olds | 42 (61.8%) | 26 (38.2%) |
| 5 to 9 Year Old | 164 (89.6%) | 19 (10.4%) |
| 10 to 14 Year Olds | 178 (84.8%) | 32 (15.2%) |
| 15 to 17 Year Olds | 23 (85.2%) | 4 (14.8%) |
| 18 to 19 Year Olds | 27 (100.0%) | 0 (0.0%) |
| 20 to 24 Year Olds | 29 (56.9%) | 22 (43.1%) |
| 25 to 34 Year Olds | 18 (56.2%) | 14 (43.8%) |
| 35 Years and over | 13 (19.1%) | 55 (80.9%) |
| Total | 494 (74.2%) | 172 (25.8%) |
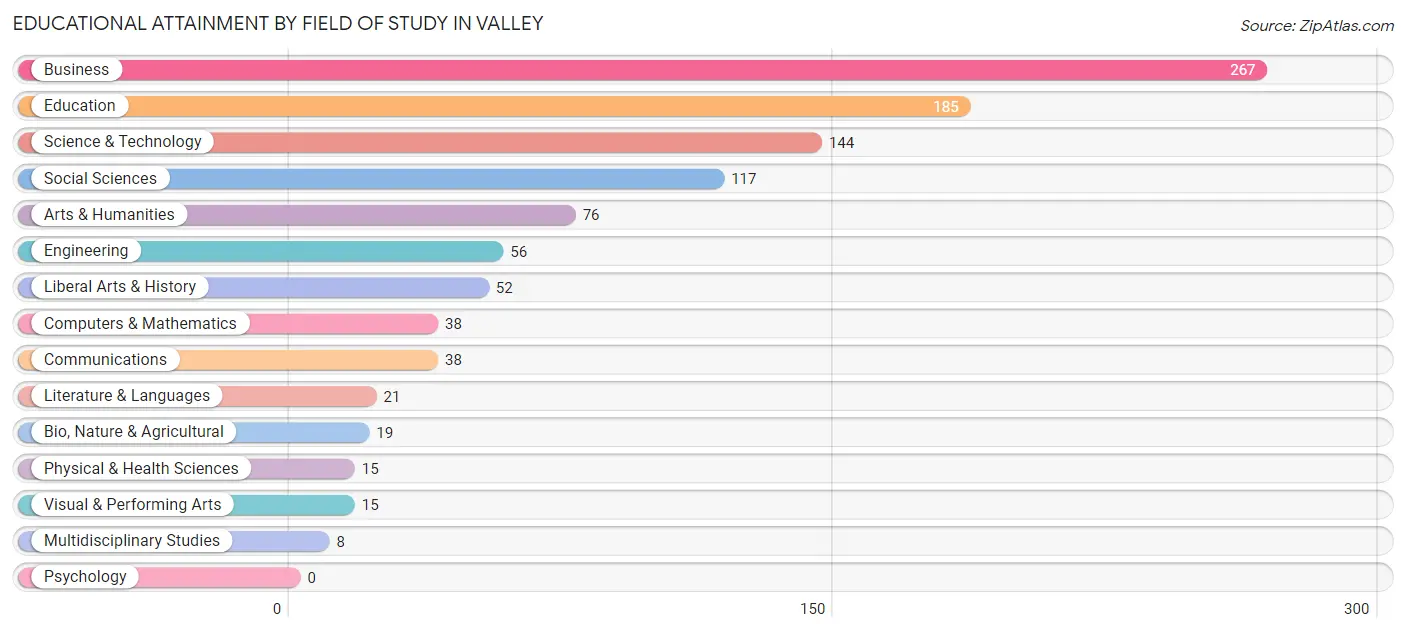
Educational Attainment by Field of Study in Valley
Business (267 | 25.4%), education (185 | 17.6%), science & technology (144 | 13.7%), social sciences (117 | 11.1%), and arts & humanities (76 | 7.2%) are the most common fields of study among 1,051 individuals in Valley who have obtained a bachelor's degree or higher.
| Field of Study | # Graduates | % Graduates |
| Computers & Mathematics | 38 | 3.6% |
| Bio, Nature & Agricultural | 19 | 1.8% |
| Physical & Health Sciences | 15 | 1.4% |
| Psychology | 0 | 0.0% |
| Social Sciences | 117 | 11.1% |
| Engineering | 56 | 5.3% |
| Multidisciplinary Studies | 8 | 0.8% |
| Science & Technology | 144 | 13.7% |
| Business | 267 | 25.4% |
| Education | 185 | 17.6% |
| Literature & Languages | 21 | 2.0% |
| Liberal Arts & History | 52 | 5.0% |
| Visual & Performing Arts | 15 | 1.4% |
| Communications | 38 | 3.6% |
| Arts & Humanities | 76 | 7.2% |
| Total | 1,051 | 100.0% |
Transportation & Commute in Valley
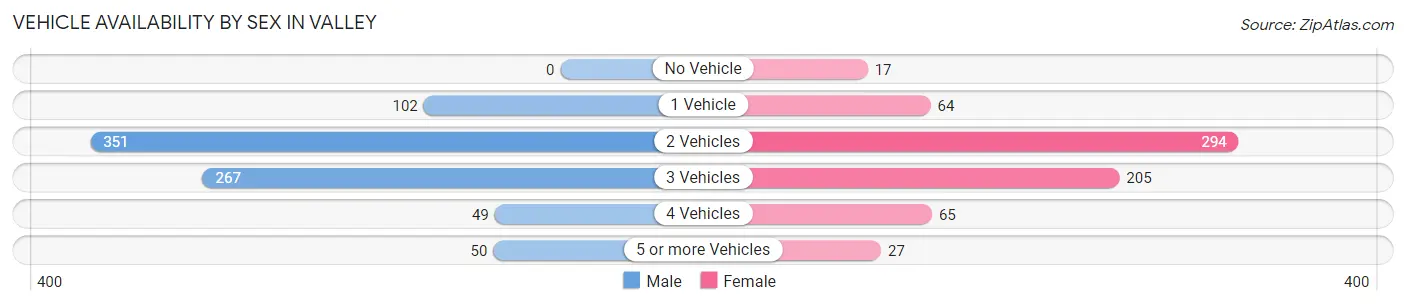
Vehicle Availability by Sex in Valley
The most prevalent vehicle ownership categories in Valley are males with 2 vehicles (351, accounting for 42.9%) and females with 2 vehicles (294, making up 52.2%).
| Vehicles Available | Male | Female |
| No Vehicle | 0 (0.0%) | 17 (2.5%) |
| 1 Vehicle | 102 (12.4%) | 64 (9.5%) |
| 2 Vehicles | 351 (42.9%) | 294 (43.8%) |
| 3 Vehicles | 267 (32.6%) | 205 (30.5%) |
| 4 Vehicles | 49 (6.0%) | 65 (9.7%) |
| 5 or more Vehicles | 50 (6.1%) | 27 (4.0%) |
| Total | 819 (100.0%) | 672 (100.0%) |
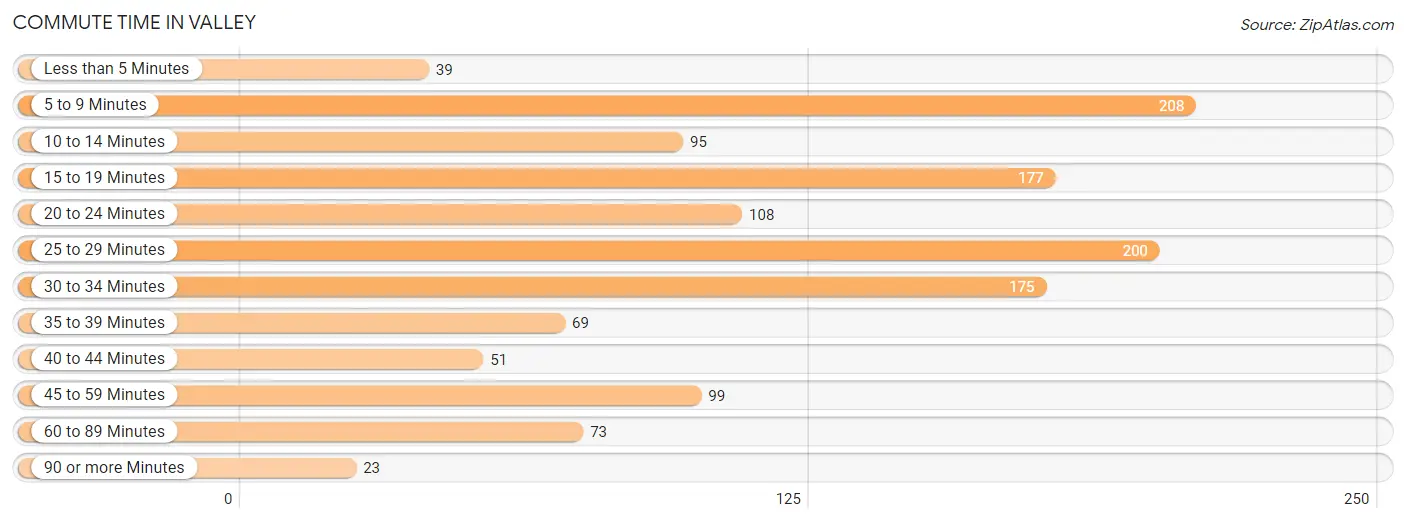
Commute Time in Valley
The most frequently occuring commute durations in Valley are 5 to 9 minutes (208 commuters, 15.8%), 25 to 29 minutes (200 commuters, 15.2%), and 15 to 19 minutes (177 commuters, 13.4%).
| Commute Time | # Commuters | % Commuters |
| Less than 5 Minutes | 39 | 3.0% |
| 5 to 9 Minutes | 208 | 15.8% |
| 10 to 14 Minutes | 95 | 7.2% |
| 15 to 19 Minutes | 177 | 13.4% |
| 20 to 24 Minutes | 108 | 8.2% |
| 25 to 29 Minutes | 200 | 15.2% |
| 30 to 34 Minutes | 175 | 13.3% |
| 35 to 39 Minutes | 69 | 5.2% |
| 40 to 44 Minutes | 51 | 3.9% |
| 45 to 59 Minutes | 99 | 7.5% |
| 60 to 89 Minutes | 73 | 5.5% |
| 90 or more Minutes | 23 | 1.8% |
Commute Time by Sex in Valley
The most common commute times in Valley are 15 to 19 minutes (134 commuters, 18.2%) for males and 45 to 59 minutes (88 commuters, 15.2%) for females.
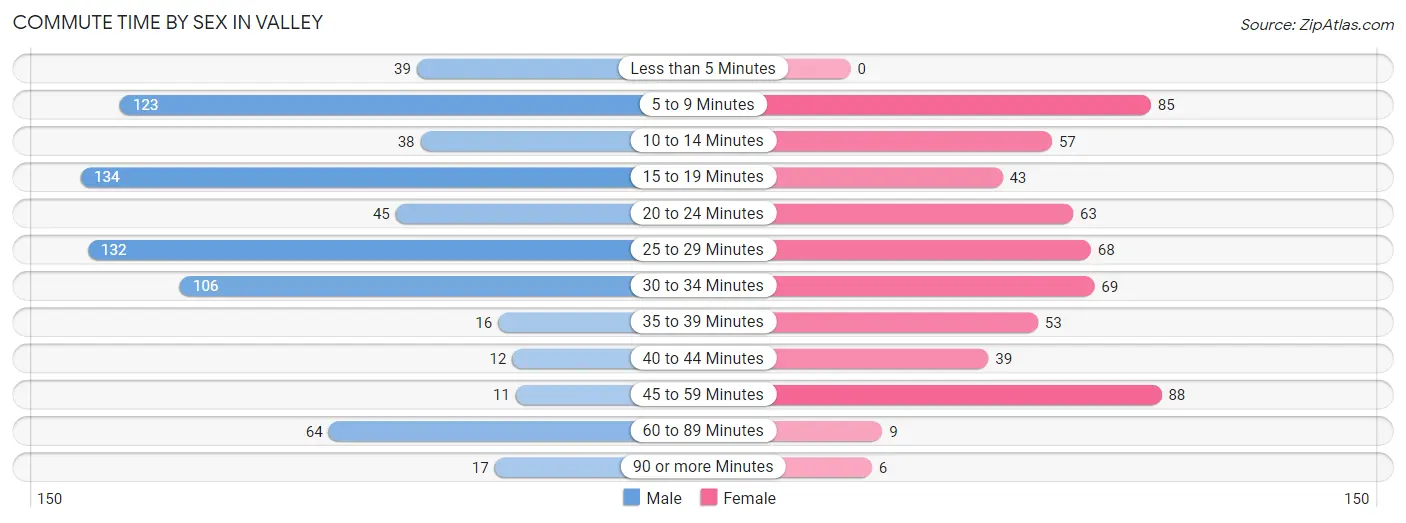
| Commute Time | Male | Female |
| Less than 5 Minutes | 39 (5.3%) | 0 (0.0%) |
| 5 to 9 Minutes | 123 (16.7%) | 85 (14.7%) |
| 10 to 14 Minutes | 38 (5.2%) | 57 (9.8%) |
| 15 to 19 Minutes | 134 (18.2%) | 43 (7.4%) |
| 20 to 24 Minutes | 45 (6.1%) | 63 (10.9%) |
| 25 to 29 Minutes | 132 (17.9%) | 68 (11.7%) |
| 30 to 34 Minutes | 106 (14.4%) | 69 (11.9%) |
| 35 to 39 Minutes | 16 (2.2%) | 53 (9.1%) |
| 40 to 44 Minutes | 12 (1.6%) | 39 (6.7%) |
| 45 to 59 Minutes | 11 (1.5%) | 88 (15.2%) |
| 60 to 89 Minutes | 64 (8.7%) | 9 (1.5%) |
| 90 or more Minutes | 17 (2.3%) | 6 (1.0%) |
Time of Departure to Work by Sex in Valley
The most frequent times of departure to work in Valley are 6:30 AM to 6:59 AM (213, 28.9%) for males and 7:00 AM to 7:29 AM (151, 26.0%) for females.
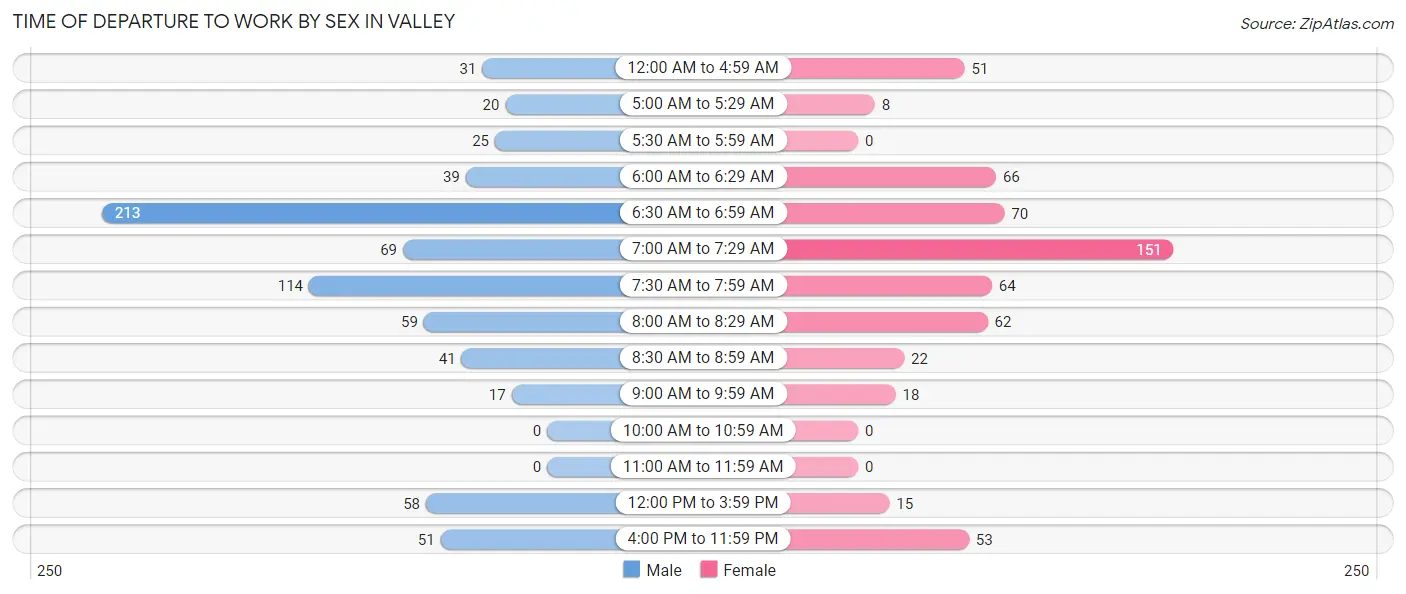
| Time of Departure | Male | Female |
| 12:00 AM to 4:59 AM | 31 (4.2%) | 51 (8.8%) |
| 5:00 AM to 5:29 AM | 20 (2.7%) | 8 (1.4%) |
| 5:30 AM to 5:59 AM | 25 (3.4%) | 0 (0.0%) |
| 6:00 AM to 6:29 AM | 39 (5.3%) | 66 (11.4%) |
| 6:30 AM to 6:59 AM | 213 (28.9%) | 70 (12.1%) |
| 7:00 AM to 7:29 AM | 69 (9.4%) | 151 (26.0%) |
| 7:30 AM to 7:59 AM | 114 (15.5%) | 64 (11.0%) |
| 8:00 AM to 8:29 AM | 59 (8.0%) | 62 (10.7%) |
| 8:30 AM to 8:59 AM | 41 (5.6%) | 22 (3.8%) |
| 9:00 AM to 9:59 AM | 17 (2.3%) | 18 (3.1%) |
| 10:00 AM to 10:59 AM | 0 (0.0%) | 0 (0.0%) |
| 11:00 AM to 11:59 AM | 0 (0.0%) | 0 (0.0%) |
| 12:00 PM to 3:59 PM | 58 (7.9%) | 15 (2.6%) |
| 4:00 PM to 11:59 PM | 51 (6.9%) | 53 (9.1%) |
| Total | 737 (100.0%) | 580 (100.0%) |
Housing Occupancy in Valley
Occupancy by Ownership in Valley
Of the total 1,342 dwellings in Valley, owner-occupied units account for 1,029 (76.7%), while renter-occupied units make up 313 (23.3%).
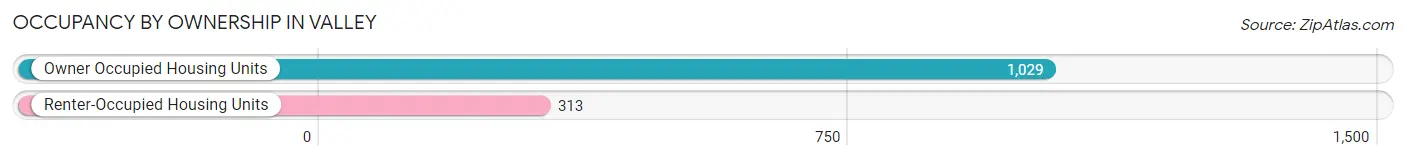
| Occupancy | # Housing Units | % Housing Units |
| Owner Occupied Housing Units | 1,029 | 76.7% |
| Renter-Occupied Housing Units | 313 | 23.3% |
| Total Occupied Housing Units | 1,342 | 100.0% |
Occupancy by Household Size in Valley
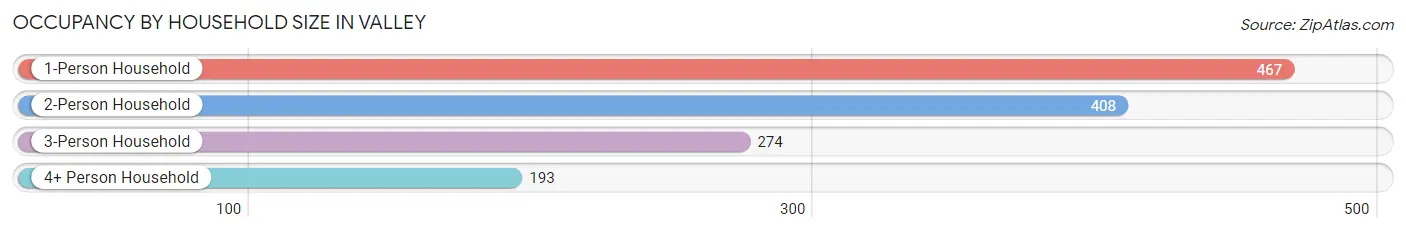
| Household Size | # Housing Units | % Housing Units |
| 1-Person Household | 467 | 34.8% |
| 2-Person Household | 408 | 30.4% |
| 3-Person Household | 274 | 20.4% |
| 4+ Person Household | 193 | 14.4% |
| Total Housing Units | 1,342 | 100.0% |
Occupancy by Ownership by Household Size in Valley
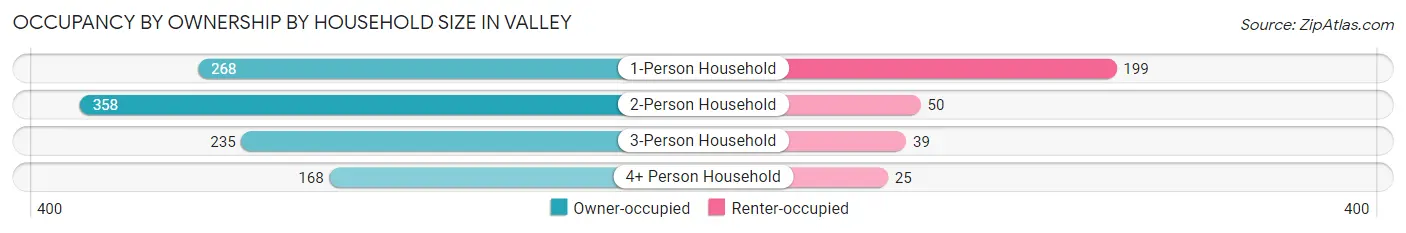
| Household Size | Owner-occupied | Renter-occupied |
| 1-Person Household | 268 (57.4%) | 199 (42.6%) |
| 2-Person Household | 358 (87.7%) | 50 (12.2%) |
| 3-Person Household | 235 (85.8%) | 39 (14.2%) |
| 4+ Person Household | 168 (87.1%) | 25 (13.0%) |
| Total Housing Units | 1,029 (76.7%) | 313 (23.3%) |
Occupancy by Educational Attainment in Valley
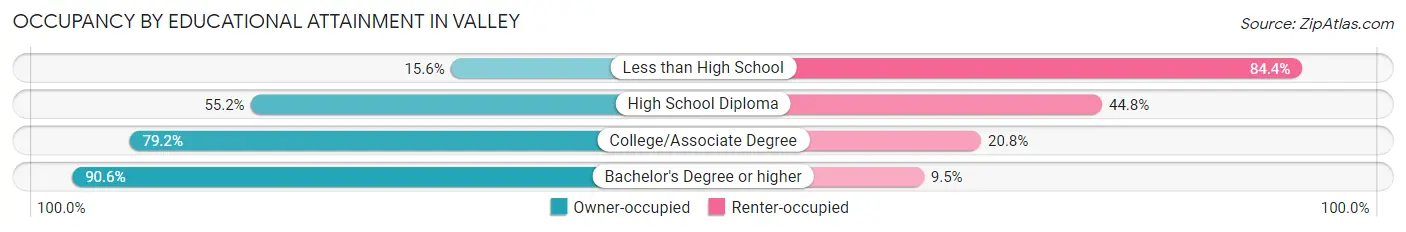
| Household Size | Owner-occupied | Renter-occupied |
| Less than High School | 7 (15.6%) | 38 (84.4%) |
| High School Diploma | 164 (55.2%) | 133 (44.8%) |
| College/Associate Degree | 331 (79.2%) | 87 (20.8%) |
| Bachelor's Degree or higher | 527 (90.5%) | 55 (9.5%) |
Occupancy by Age of Householder in Valley
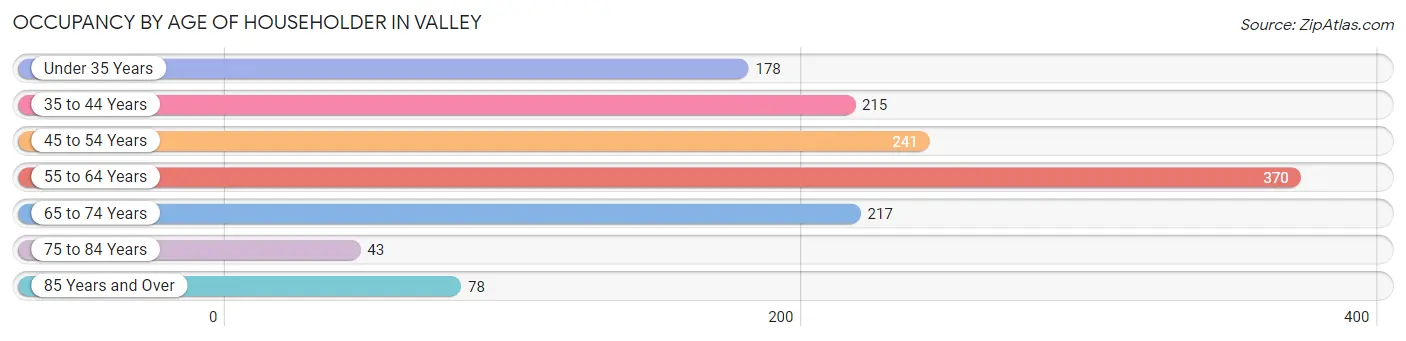
| Age Bracket | # Households | % Households |
| Under 35 Years | 178 | 13.3% |
| 35 to 44 Years | 215 | 16.0% |
| 45 to 54 Years | 241 | 18.0% |
| 55 to 64 Years | 370 | 27.6% |
| 65 to 74 Years | 217 | 16.2% |
| 75 to 84 Years | 43 | 3.2% |
| 85 Years and Over | 78 | 5.8% |
| Total | 1,342 | 100.0% |
Housing Finances in Valley
Median Income by Occupancy in Valley
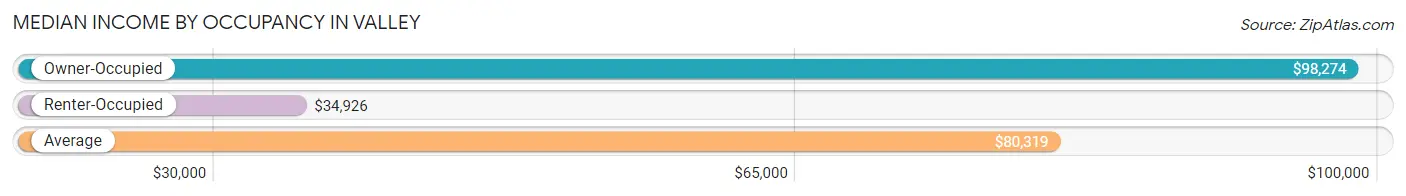
| Occupancy Type | # Households | Median Income |
| Owner-Occupied | 1,029 (76.7%) | $98,274 |
| Renter-Occupied | 313 (23.3%) | $34,926 |
| Average | 1,342 (100.0%) | $80,319 |
Occupancy by Householder Income Bracket in Valley
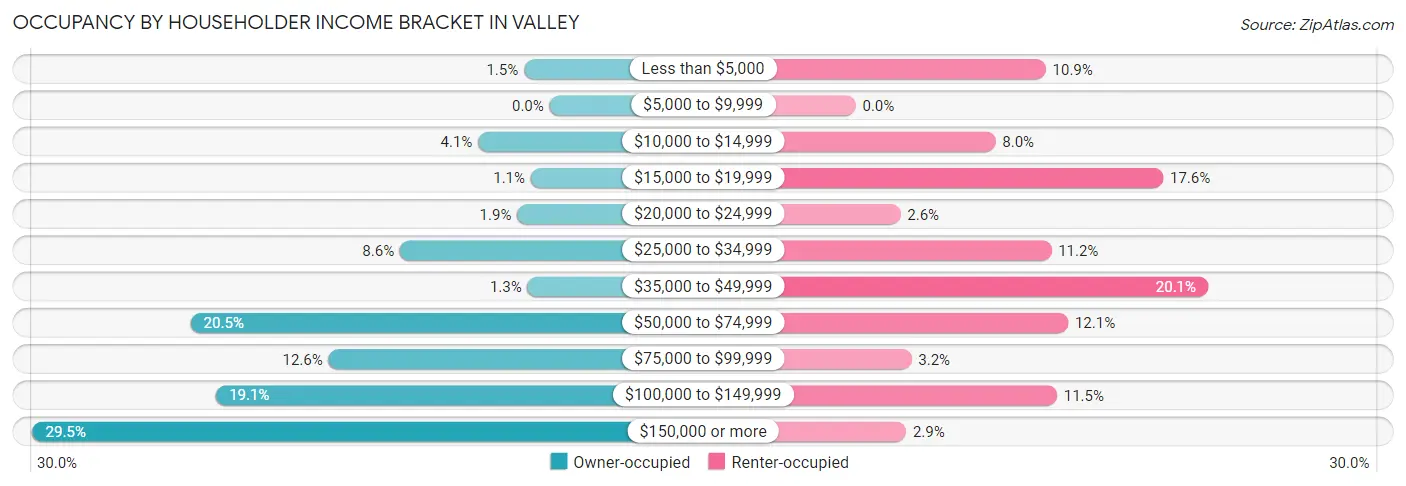
| Income Bracket | Owner-occupied | Renter-occupied |
| Less than $5,000 | 15 (1.5%) | 34 (10.9%) |
| $5,000 to $9,999 | 0 (0.0%) | 0 (0.0%) |
| $10,000 to $14,999 | 42 (4.1%) | 25 (8.0%) |
| $15,000 to $19,999 | 11 (1.1%) | 55 (17.6%) |
| $20,000 to $24,999 | 19 (1.8%) | 8 (2.6%) |
| $25,000 to $34,999 | 88 (8.6%) | 35 (11.2%) |
| $35,000 to $49,999 | 13 (1.3%) | 63 (20.1%) |
| $50,000 to $74,999 | 211 (20.5%) | 38 (12.1%) |
| $75,000 to $99,999 | 130 (12.6%) | 10 (3.2%) |
| $100,000 to $149,999 | 196 (19.1%) | 36 (11.5%) |
| $150,000 or more | 304 (29.5%) | 9 (2.9%) |
| Total | 1,029 (100.0%) | 313 (100.0%) |
Monthly Housing Cost Tiers in Valley
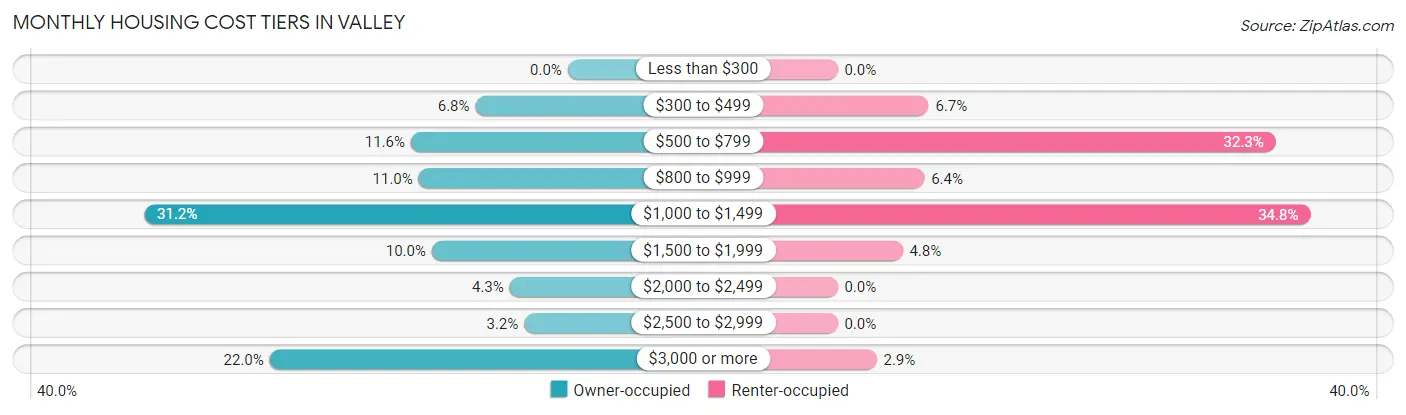
| Monthly Cost | Owner-occupied | Renter-occupied |
| Less than $300 | 0 (0.0%) | 0 (0.0%) |
| $300 to $499 | 70 (6.8%) | 21 (6.7%) |
| $500 to $799 | 119 (11.6%) | 101 (32.3%) |
| $800 to $999 | 113 (11.0%) | 20 (6.4%) |
| $1,000 to $1,499 | 321 (31.2%) | 109 (34.8%) |
| $1,500 to $1,999 | 103 (10.0%) | 15 (4.8%) |
| $2,000 to $2,499 | 44 (4.3%) | 0 (0.0%) |
| $2,500 to $2,999 | 33 (3.2%) | 0 (0.0%) |
| $3,000 or more | 226 (22.0%) | 9 (2.9%) |
| Total | 1,029 (100.0%) | 313 (100.0%) |
Physical Housing Characteristics in Valley
Housing Structures in Valley
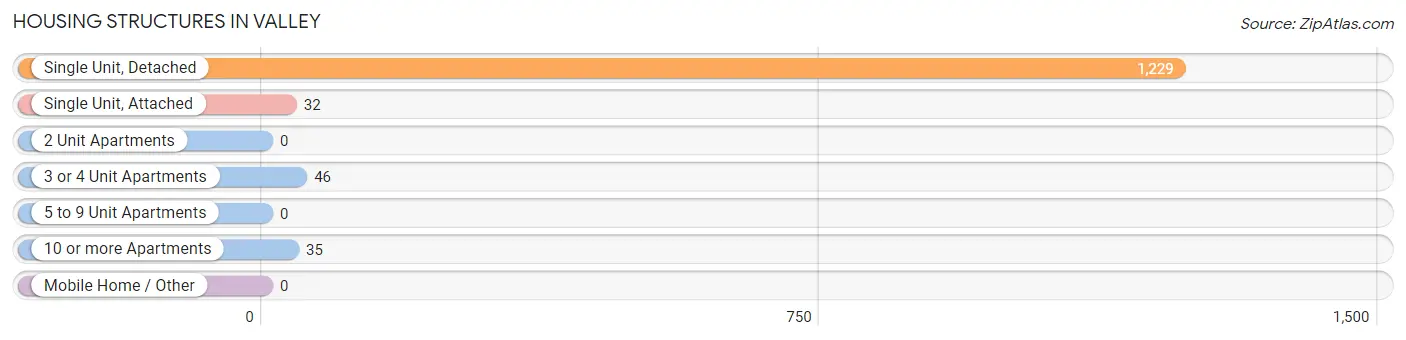
| Structure Type | # Housing Units | % Housing Units |
| Single Unit, Detached | 1,229 | 91.6% |
| Single Unit, Attached | 32 | 2.4% |
| 2 Unit Apartments | 0 | 0.0% |
| 3 or 4 Unit Apartments | 46 | 3.4% |
| 5 to 9 Unit Apartments | 0 | 0.0% |
| 10 or more Apartments | 35 | 2.6% |
| Mobile Home / Other | 0 | 0.0% |
| Total | 1,342 | 100.0% |
Housing Structures by Occupancy in Valley
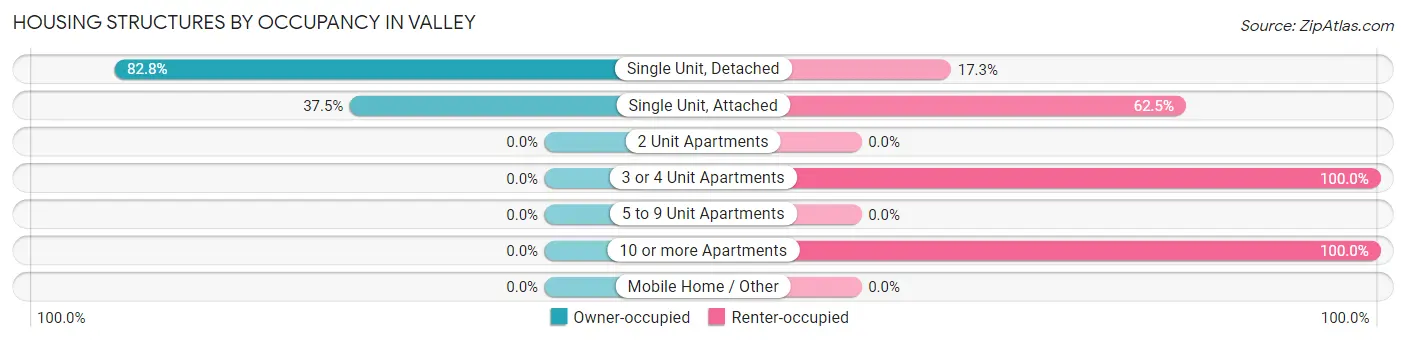
| Structure Type | Owner-occupied | Renter-occupied |
| Single Unit, Detached | 1,017 (82.8%) | 212 (17.2%) |
| Single Unit, Attached | 12 (37.5%) | 20 (62.5%) |
| 2 Unit Apartments | 0 (0.0%) | 0 (0.0%) |
| 3 or 4 Unit Apartments | 0 (0.0%) | 46 (100.0%) |
| 5 to 9 Unit Apartments | 0 (0.0%) | 0 (0.0%) |
| 10 or more Apartments | 0 (0.0%) | 35 (100.0%) |
| Mobile Home / Other | 0 (0.0%) | 0 (0.0%) |
| Total | 1,029 (76.7%) | 313 (23.3%) |
Housing Structures by Number of Rooms in Valley
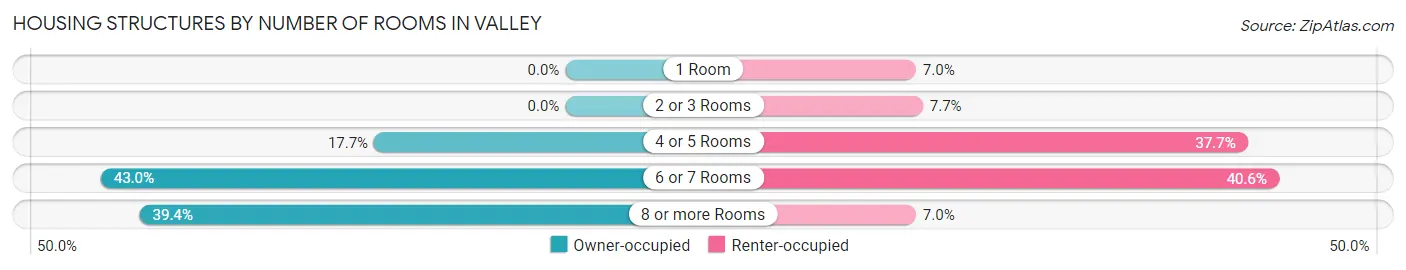
| Number of Rooms | Owner-occupied | Renter-occupied |
| 1 Room | 0 (0.0%) | 22 (7.0%) |
| 2 or 3 Rooms | 0 (0.0%) | 24 (7.7%) |
| 4 or 5 Rooms | 182 (17.7%) | 118 (37.7%) |
| 6 or 7 Rooms | 442 (42.9%) | 127 (40.6%) |
| 8 or more Rooms | 405 (39.4%) | 22 (7.0%) |
| Total | 1,029 (100.0%) | 313 (100.0%) |
Housing Structure by Heating Type in Valley
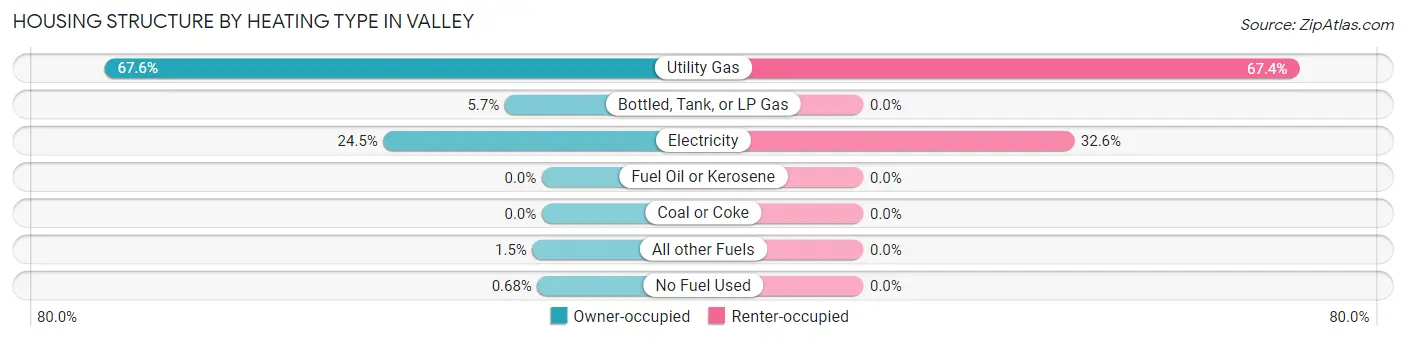
| Heating Type | Owner-occupied | Renter-occupied |
| Utility Gas | 696 (67.6%) | 211 (67.4%) |
| Bottled, Tank, or LP Gas | 59 (5.7%) | 0 (0.0%) |
| Electricity | 252 (24.5%) | 102 (32.6%) |
| Fuel Oil or Kerosene | 0 (0.0%) | 0 (0.0%) |
| Coal or Coke | 0 (0.0%) | 0 (0.0%) |
| All other Fuels | 15 (1.5%) | 0 (0.0%) |
| No Fuel Used | 7 (0.7%) | 0 (0.0%) |
| Total | 1,029 (100.0%) | 313 (100.0%) |
Household Vehicle Usage in Valley
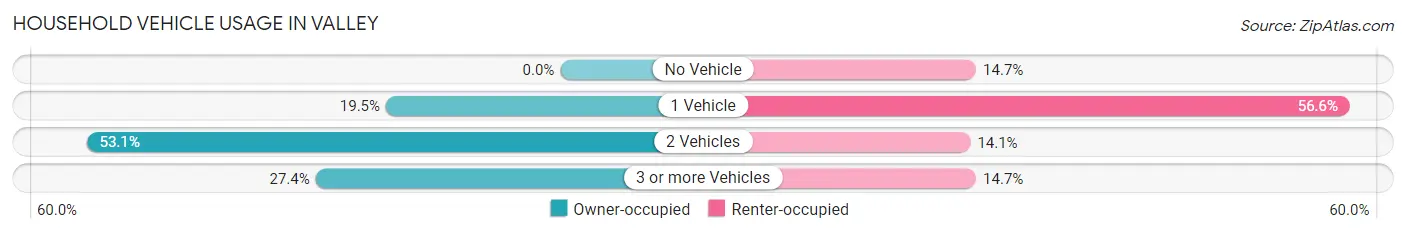
| Vehicles per Household | Owner-occupied | Renter-occupied |
| No Vehicle | 0 (0.0%) | 46 (14.7%) |
| 1 Vehicle | 201 (19.5%) | 177 (56.6%) |
| 2 Vehicles | 546 (53.1%) | 44 (14.1%) |
| 3 or more Vehicles | 282 (27.4%) | 46 (14.7%) |
| Total | 1,029 (100.0%) | 313 (100.0%) |
Real Estate & Mortgages in Valley
Real Estate and Mortgage Overview in Valley
| Characteristic | Without Mortgage | With Mortgage |
| Housing Units | 514 | 515 |
| Median Property Value | $427,300 | $389,100 |
| Median Household Income | $82,262 | $166 |
| Monthly Housing Costs | $958 | $205 |
| Real Estate Taxes | $6,402 | $10 |
Property Value by Mortgage Status in Valley
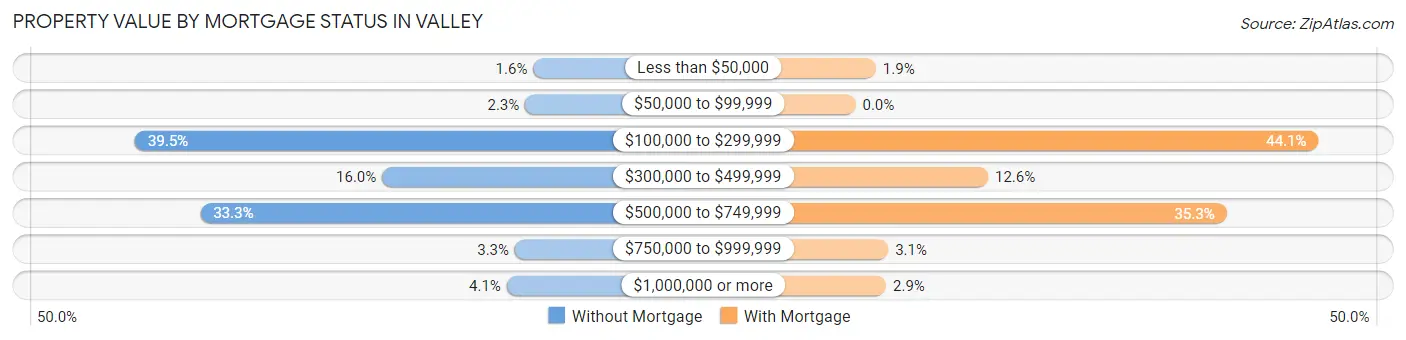
| Property Value | Without Mortgage | With Mortgage |
| Less than $50,000 | 8 (1.6%) | 10 (1.9%) |
| $50,000 to $99,999 | 12 (2.3%) | 0 (0.0%) |
| $100,000 to $299,999 | 203 (39.5%) | 227 (44.1%) |
| $300,000 to $499,999 | 82 (16.0%) | 65 (12.6%) |
| $500,000 to $749,999 | 171 (33.3%) | 182 (35.3%) |
| $750,000 to $999,999 | 17 (3.3%) | 16 (3.1%) |
| $1,000,000 or more | 21 (4.1%) | 15 (2.9%) |
| Total | 514 (100.0%) | 515 (100.0%) |
Household Income by Mortgage Status in Valley
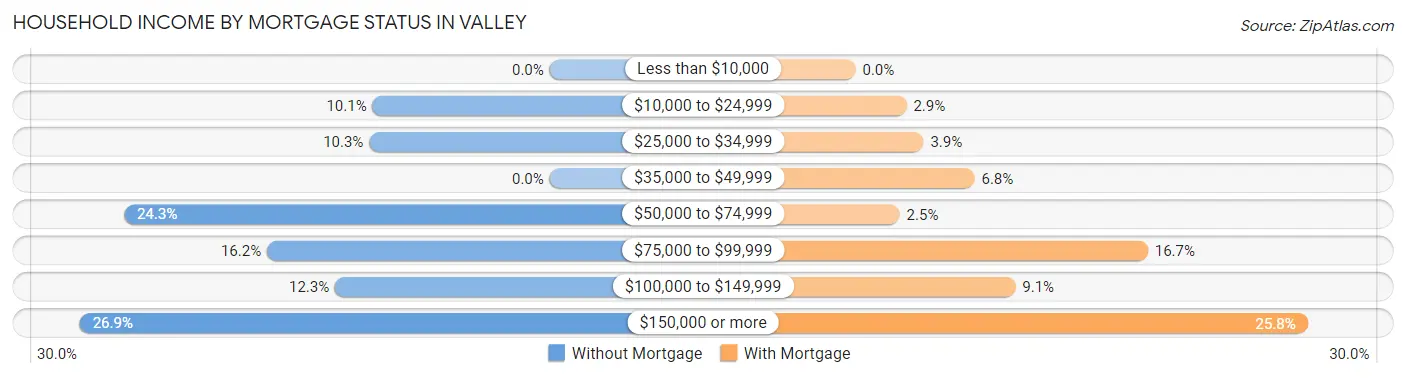
| Household Income | Without Mortgage | With Mortgage |
| Less than $10,000 | 0 (0.0%) | 0 (0.0%) |
| $10,000 to $24,999 | 52 (10.1%) | 15 (2.9%) |
| $25,000 to $34,999 | 53 (10.3%) | 20 (3.9%) |
| $35,000 to $49,999 | 0 (0.0%) | 35 (6.8%) |
| $50,000 to $74,999 | 125 (24.3%) | 13 (2.5%) |
| $75,000 to $99,999 | 83 (16.2%) | 86 (16.7%) |
| $100,000 to $149,999 | 63 (12.3%) | 47 (9.1%) |
| $150,000 or more | 138 (26.9%) | 133 (25.8%) |
| Total | 514 (100.0%) | 515 (100.0%) |
Property Value to Household Income Ratio in Valley
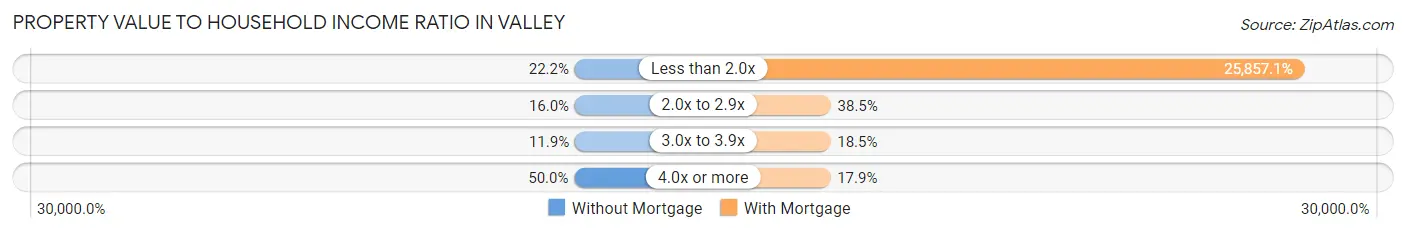
| Value-to-Income Ratio | Without Mortgage | With Mortgage |
| Less than 2.0x | 114 (22.2%) | 133,164 (25,857.1%) |
| 2.0x to 2.9x | 82 (16.0%) | 198 (38.5%) |
| 3.0x to 3.9x | 61 (11.9%) | 95 (18.4%) |
| 4.0x or more | 257 (50.0%) | 92 (17.9%) |
| Total | 514 (100.0%) | 515 (100.0%) |
Real Estate Taxes by Mortgage Status in Valley
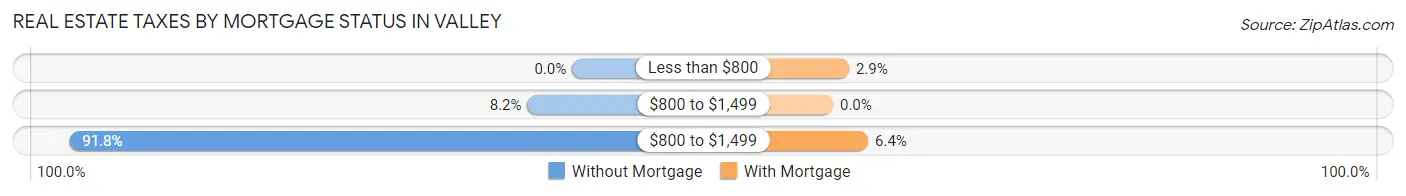
| Property Taxes | Without Mortgage | With Mortgage |
| Less than $800 | 0 (0.0%) | 15 (2.9%) |
| $800 to $1,499 | 42 (8.2%) | 0 (0.0%) |
| $800 to $1,499 | 472 (91.8%) | 33 (6.4%) |
| Total | 514 (100.0%) | 515 (100.0%) |
Health & Disability in Valley
Health Insurance Coverage by Age in Valley
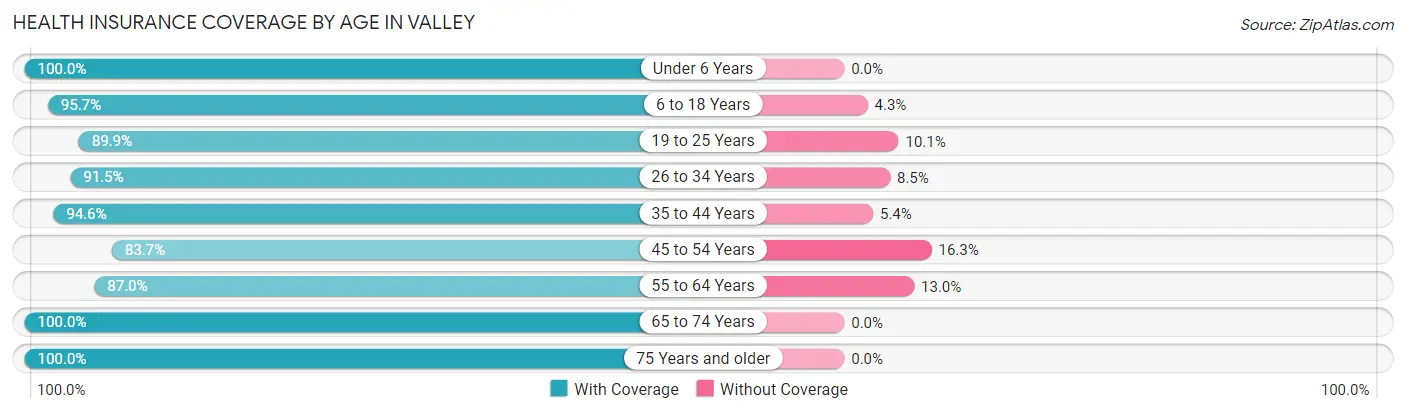
| Age Bracket | With Coverage | Without Coverage |
| Under 6 Years | 232 (100.0%) | 0 (0.0%) |
| 6 to 18 Years | 419 (95.7%) | 19 (4.3%) |
| 19 to 25 Years | 151 (89.9%) | 17 (10.1%) |
| 26 to 34 Years | 236 (91.5%) | 22 (8.5%) |
| 35 to 44 Years | 353 (94.6%) | 20 (5.4%) |
| 45 to 54 Years | 314 (83.7%) | 61 (16.3%) |
| 55 to 64 Years | 521 (87.0%) | 78 (13.0%) |
| 65 to 74 Years | 400 (100.0%) | 0 (0.0%) |
| 75 Years and older | 139 (100.0%) | 0 (0.0%) |
| Total | 2,765 (92.7%) | 217 (7.3%) |
Health Insurance Coverage by Citizenship Status in Valley
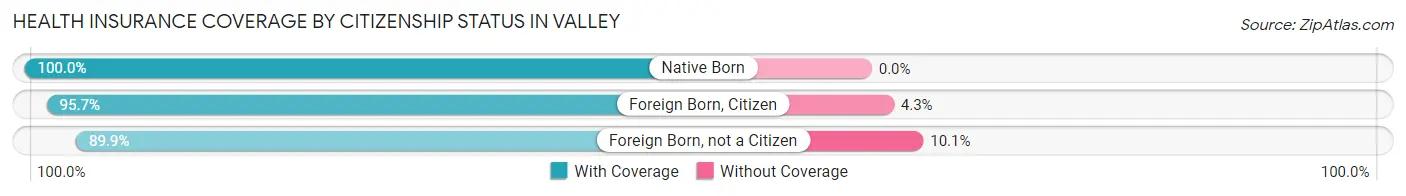
| Citizenship Status | With Coverage | Without Coverage |
| Native Born | 232 (100.0%) | 0 (0.0%) |
| Foreign Born, Citizen | 419 (95.7%) | 19 (4.3%) |
| Foreign Born, not a Citizen | 151 (89.9%) | 17 (10.1%) |
Health Insurance Coverage by Household Income in Valley
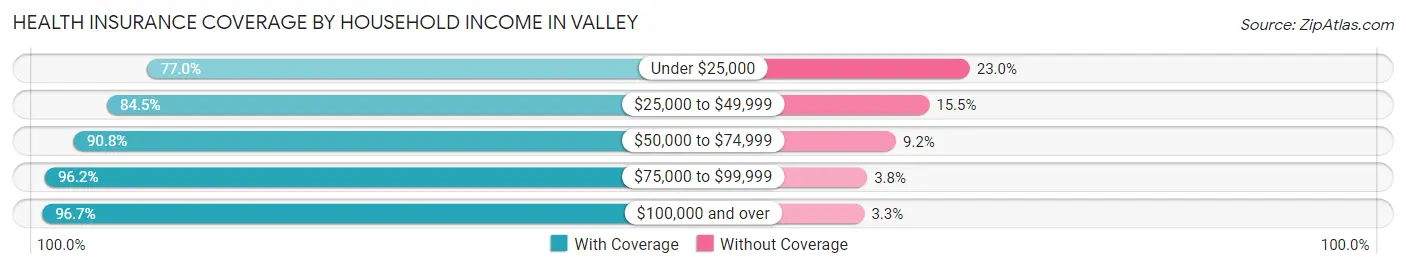
| Household Income | With Coverage | Without Coverage |
| Under $25,000 | 177 (77.0%) | 53 (23.0%) |
| $25,000 to $49,999 | 268 (84.5%) | 49 (15.5%) |
| $50,000 to $74,999 | 501 (90.8%) | 51 (9.2%) |
| $75,000 to $99,999 | 301 (96.2%) | 12 (3.8%) |
| $100,000 and over | 1,518 (96.7%) | 52 (3.3%) |
Public vs Private Health Insurance Coverage by Age in Valley
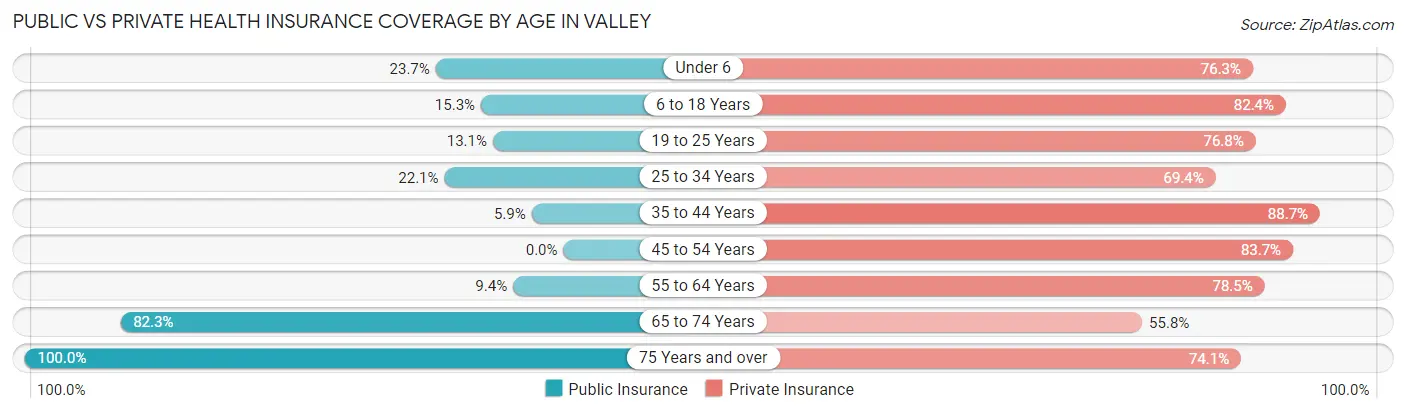
| Age Bracket | Public Insurance | Private Insurance |
| Under 6 | 55 (23.7%) | 177 (76.3%) |
| 6 to 18 Years | 67 (15.3%) | 361 (82.4%) |
| 19 to 25 Years | 22 (13.1%) | 129 (76.8%) |
| 25 to 34 Years | 57 (22.1%) | 179 (69.4%) |
| 35 to 44 Years | 22 (5.9%) | 331 (88.7%) |
| 45 to 54 Years | 0 (0.0%) | 314 (83.7%) |
| 55 to 64 Years | 56 (9.3%) | 470 (78.5%) |
| 65 to 74 Years | 329 (82.3%) | 223 (55.7%) |
| 75 Years and over | 139 (100.0%) | 103 (74.1%) |
| Total | 747 (25.1%) | 2,287 (76.7%) |
Disability Status by Sex by Age in Valley
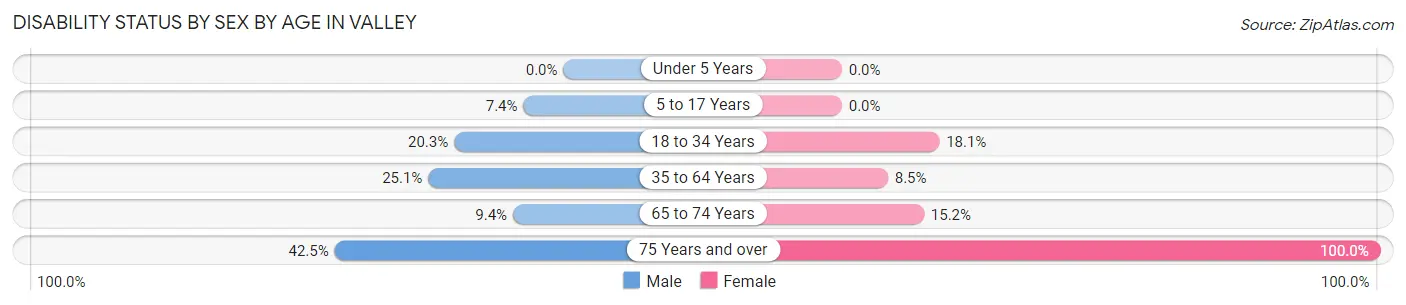
| Age Bracket | Male | Female |
| Under 5 Years | 0 (0.0%) | 0 (0.0%) |
| 5 to 17 Years | 19 (7.4%) | 0 (0.0%) |
| 18 to 34 Years | 56 (20.3%) | 32 (18.1%) |
| 35 to 64 Years | 147 (25.1%) | 65 (8.5%) |
| 65 to 74 Years | 19 (9.4%) | 30 (15.2%) |
| 75 Years and over | 31 (42.5%) | 66 (100.0%) |
Disability Class by Sex by Age in Valley
Disability Class: Hearing Difficulty
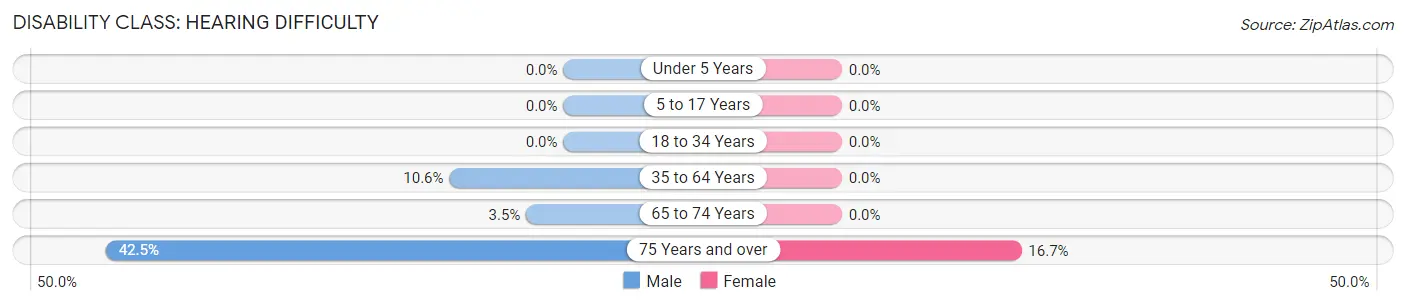
| Age Bracket | Male | Female |
| Under 5 Years | 0 (0.0%) | 0 (0.0%) |
| 5 to 17 Years | 0 (0.0%) | 0 (0.0%) |
| 18 to 34 Years | 0 (0.0%) | 0 (0.0%) |
| 35 to 64 Years | 62 (10.6%) | 0 (0.0%) |
| 65 to 74 Years | 7 (3.5%) | 0 (0.0%) |
| 75 Years and over | 31 (42.5%) | 11 (16.7%) |
Disability Class: Vision Difficulty
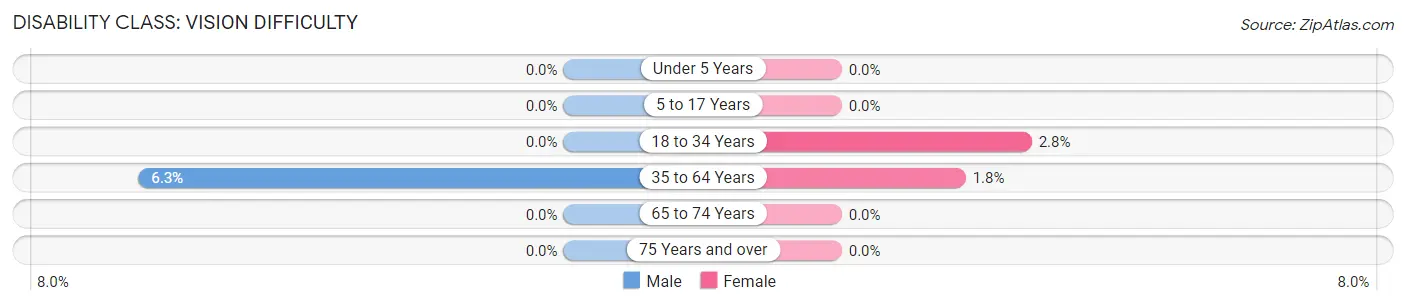
| Age Bracket | Male | Female |
| Under 5 Years | 0 (0.0%) | 0 (0.0%) |
| 5 to 17 Years | 0 (0.0%) | 0 (0.0%) |
| 18 to 34 Years | 0 (0.0%) | 5 (2.8%) |
| 35 to 64 Years | 37 (6.3%) | 14 (1.8%) |
| 65 to 74 Years | 0 (0.0%) | 0 (0.0%) |
| 75 Years and over | 0 (0.0%) | 0 (0.0%) |
Disability Class: Cognitive Difficulty
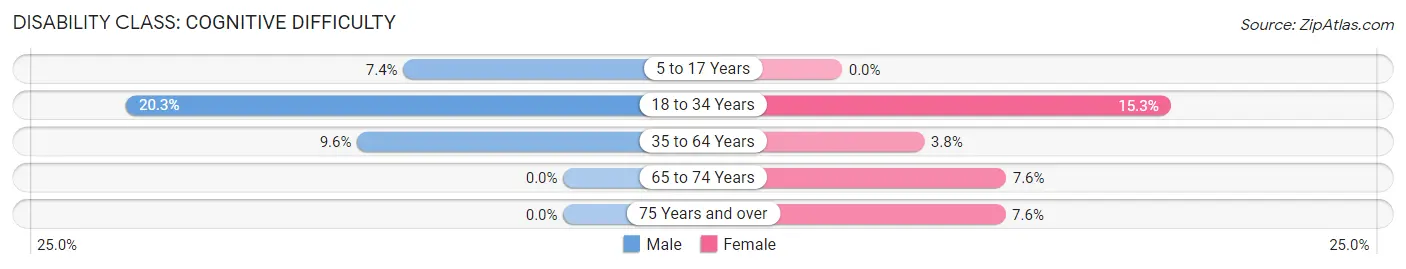
| Age Bracket | Male | Female |
| 5 to 17 Years | 19 (7.4%) | 0 (0.0%) |
| 18 to 34 Years | 56 (20.3%) | 27 (15.2%) |
| 35 to 64 Years | 56 (9.6%) | 29 (3.8%) |
| 65 to 74 Years | 0 (0.0%) | 15 (7.6%) |
| 75 Years and over | 0 (0.0%) | 5 (7.6%) |
Disability Class: Ambulatory Difficulty
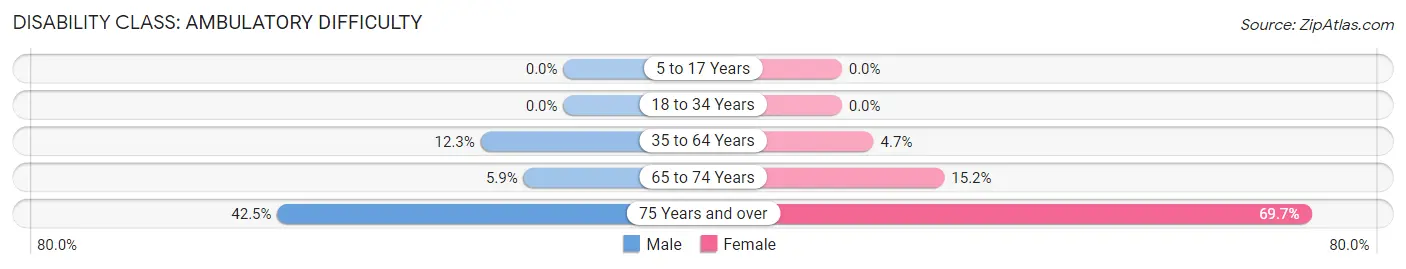
| Age Bracket | Male | Female |
| 5 to 17 Years | 0 (0.0%) | 0 (0.0%) |
| 18 to 34 Years | 0 (0.0%) | 0 (0.0%) |
| 35 to 64 Years | 72 (12.3%) | 36 (4.7%) |
| 65 to 74 Years | 12 (5.9%) | 30 (15.2%) |
| 75 Years and over | 31 (42.5%) | 46 (69.7%) |
Disability Class: Self-Care Difficulty
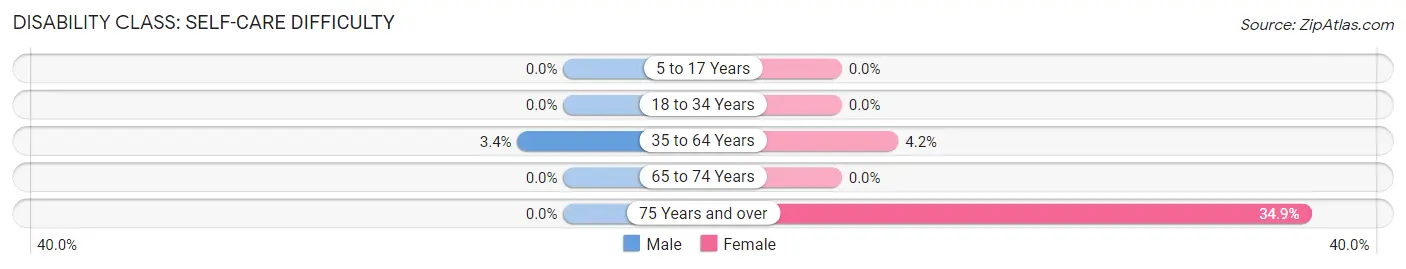
| Age Bracket | Male | Female |
| 5 to 17 Years | 0 (0.0%) | 0 (0.0%) |
| 18 to 34 Years | 0 (0.0%) | 0 (0.0%) |
| 35 to 64 Years | 20 (3.4%) | 32 (4.2%) |
| 65 to 74 Years | 0 (0.0%) | 0 (0.0%) |
| 75 Years and over | 0 (0.0%) | 23 (34.8%) |
Technology Access in Valley
Computing Device Access in Valley
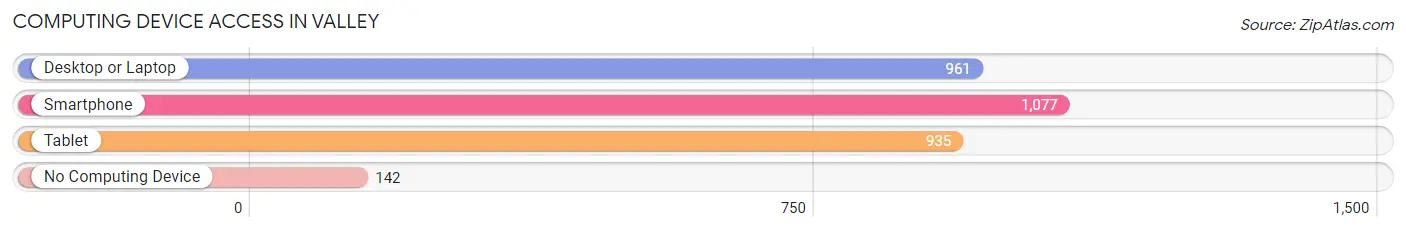
| Device Type | # Households | % Households |
| Desktop or Laptop | 961 | 71.6% |
| Smartphone | 1,077 | 80.2% |
| Tablet | 935 | 69.7% |
| No Computing Device | 142 | 10.6% |
| Total | 1,342 | 100.0% |
Internet Access in Valley
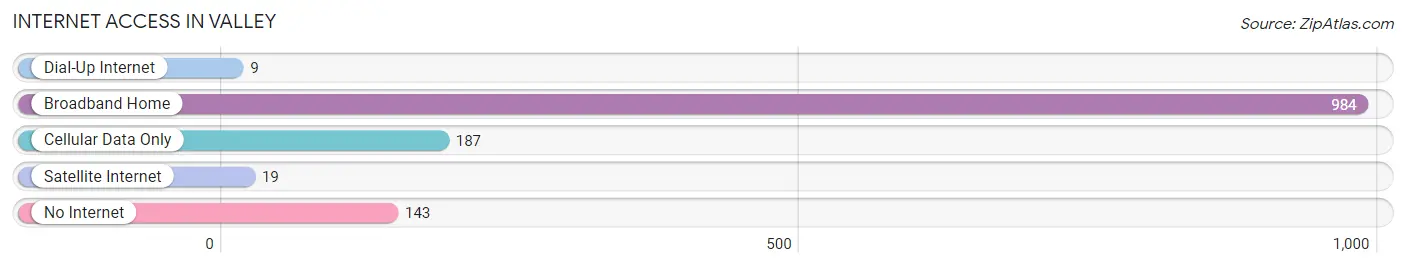
| Internet Type | # Households | % Households |
| Dial-Up Internet | 9 | 0.7% |
| Broadband Home | 984 | 73.3% |
| Cellular Data Only | 187 | 13.9% |
| Satellite Internet | 19 | 1.4% |
| No Internet | 143 | 10.7% |
| Total | 1,342 | 100.0% |
Valley Summary
Valley, Nebraska is a small town located in the northeastern corner of the state, near the border of South Dakota. It is part of the Sioux City, Iowa metropolitan area and is home to a population of just over 1,000 people. The town was founded in 1873 and has a rich history of farming and ranching.
Geography
Valley is located in the northeastern corner of Nebraska, near the border of South Dakota. It is situated in the Missouri River Valley, which is part of the Great Plains region. The town is located on the banks of the Missouri River, which provides a natural border between Nebraska and South Dakota. The town is surrounded by rolling hills and grasslands, and is home to a variety of wildlife, including deer, antelope, and wild turkeys.
The climate in Valley is typical of the Great Plains region, with hot summers and cold winters. The average temperature in the summer is around 80 degrees Fahrenheit, while the average temperature in the winter is around 20 degrees Fahrenheit. The town receives an average of 20 inches of precipitation per year, with most of it falling in the spring and summer months.
Economy
Valley’s economy is largely based on agriculture and ranching. The town is home to several large farms and ranches, which produce a variety of crops, including corn, soybeans, and wheat. The town also has a small manufacturing sector, which produces a variety of products, including furniture, clothing, and electronics.
The town is also home to several small businesses, including restaurants, retail stores, and service providers. The town is also home to a small airport, which provides air service to the surrounding area.
Demographics
As of the 2010 census, Valley had a population of 1,072 people. The population is predominantly white, with a small percentage of African Americans, Hispanics, and Native Americans. The median household income in Valley is $45,000, and the median home value is $125,000.
Valley is a small town with a rich history and a strong sense of community. The town is home to a variety of businesses and services, and is a great place to live and work. The town is also home to a variety of recreational activities, including fishing, hunting, and camping. Valley is a great place to call home, and is a great place to visit.
Common Questions
What is Per Capita Income in Valley?
Per Capita income in Valley is $52,590.
What is the Median Family Income in Valley?
Median Family Income in Valley is $124,583.
What is the Median Household income in Valley?
Median Household Income in Valley is $80,319.
What is Income or Wage Gap in Valley?
Income or Wage Gap in Valley is 19.2%.
Women in Valley earn 80.8 cents for every dollar earned by a man.
What is Inequality or Gini Index in Valley?
Inequality or Gini Index in Valley is 0.49.
What is the Total Population of Valley?
Total Population of Valley is 3,032.
What is the Total Male Population of Valley?
Total Male Population of Valley is 1,527.
What is the Total Female Population of Valley?
Total Female Population of Valley is 1,505.
What is the Ratio of Males per 100 Females in Valley?
There are 101.46 Males per 100 Females in Valley.
What is the Ratio of Females per 100 Males in Valley?
There are 98.56 Females per 100 Males in Valley.
What is the Median Population Age in Valley?
Median Population Age in Valley is 48.5 Years.
What is the Average Family Size in Valley
Average Family Size in Valley is 2.9 People.
What is the Average Household Size in Valley
Average Household Size in Valley is 2.2 People.
How Large is the Labor Force in Valley?
There are 1,576 People in the Labor Forcein in Valley.
What is the Percentage of People in the Labor Force in Valley?
65.5% of People are in the Labor Force in Valley.
What is the Unemployment Rate in Valley?
Unemployment Rate in Valley is 2.9%.