Silver Creek, NE Map & Demographics
Silver Creek Map
Silver Creek Overview
$33,721
PER CAPITA INCOME
$65,625
AVG FAMILY INCOME
$47,750
AVG HOUSEHOLD INCOME
28.6%
WAGE / INCOME GAP [ % ]
71.4¢/ $1
WAGE / INCOME GAP [ $ ]
0.36
INEQUALITY / GINI INDEX
384
TOTAL POPULATION
221
MALE POPULATION
163
FEMALE POPULATION
135.58
MALES / 100 FEMALES
73.76
FEMALES / 100 MALES
51.0
MEDIAN AGE
2.4
AVG FAMILY SIZE
1.9
AVG HOUSEHOLD SIZE
241
LABOR FORCE [ PEOPLE ]
69.9%
PERCENT IN LABOR FORCE
Silver Creek Zip Codes
Silver Creek Area Codes
Income in Silver Creek
Income Overview in Silver Creek
Per Capita Income in Silver Creek is $33,721, while median incomes of families and households are $65,625 and $47,750 respectively.
| Characteristic | Number | Measure |
| Per Capita Income | 384 | $33,721 |
| Median Family Income | 93 | $65,625 |
| Mean Family Income | 93 | $75,360 |
| Median Household Income | 205 | $47,750 |
| Mean Household Income | 205 | $61,867 |
| Income Deficit | 93 | $0 |
| Wage / Income Gap (%) | 384 | 28.60% |
| Wage / Income Gap ($) | 384 | 71.40¢ per $1 |
| Gini / Inequality Index | 384 | 0.36 |
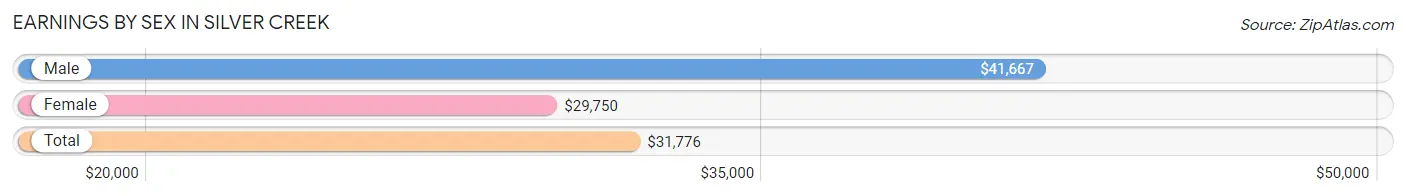
Earnings by Sex in Silver Creek
Average Earnings in Silver Creek are $31,776, $41,667 for men and $29,750 for women, a difference of 28.6%.
| Sex | Number | Average Earnings |
| Male | 164 (64.3%) | $41,667 |
| Female | 91 (35.7%) | $29,750 |
| Total | 255 (100.0%) | $31,776 |
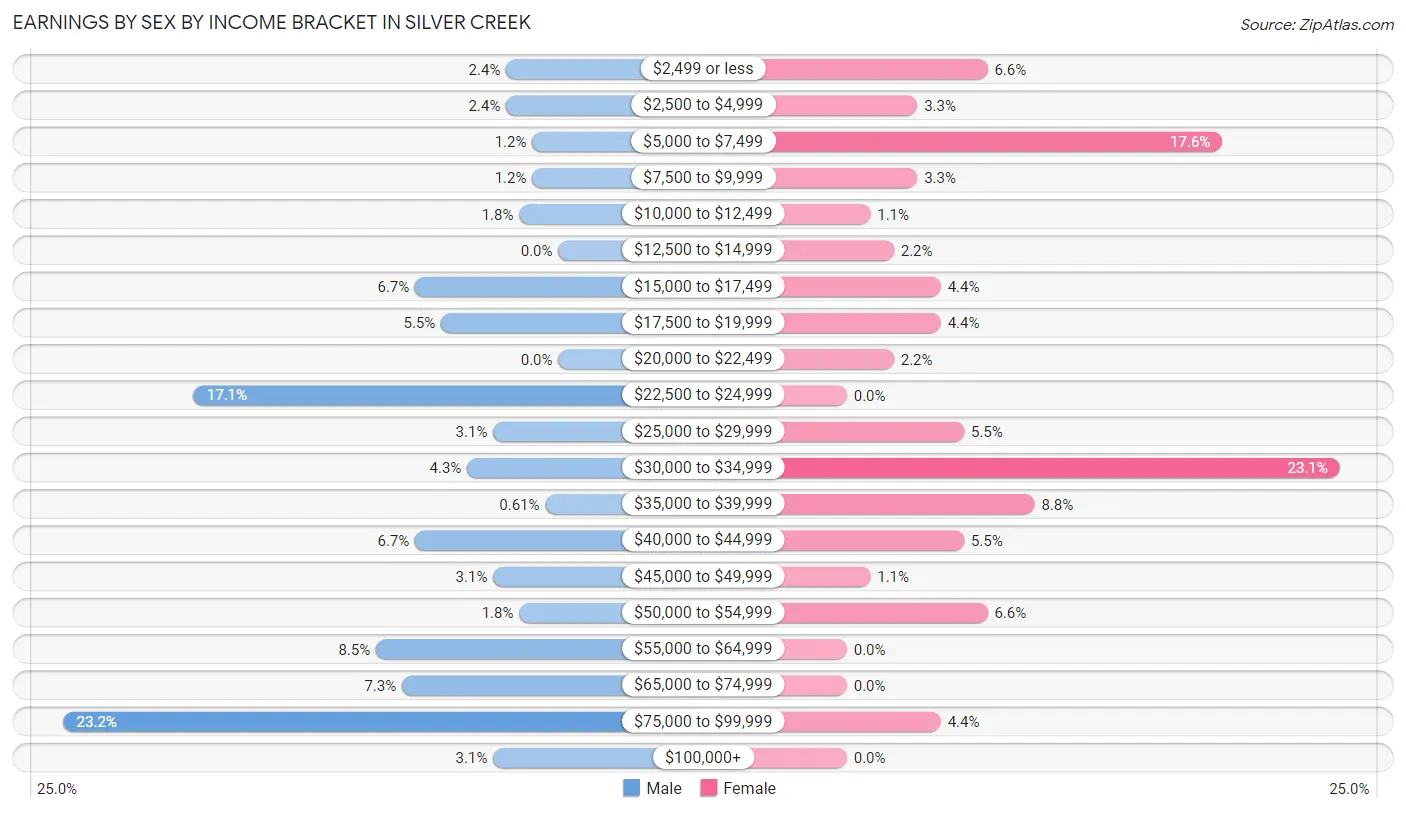
Earnings by Sex by Income Bracket in Silver Creek
The most common earnings brackets in Silver Creek are $75,000 to $99,999 for men (38 | 23.2%) and $30,000 to $34,999 for women (21 | 23.1%).
| Income | Male | Female |
| $2,499 or less | 4 (2.4%) | 6 (6.6%) |
| $2,500 to $4,999 | 4 (2.4%) | 3 (3.3%) |
| $5,000 to $7,499 | 2 (1.2%) | 16 (17.6%) |
| $7,500 to $9,999 | 2 (1.2%) | 3 (3.3%) |
| $10,000 to $12,499 | 3 (1.8%) | 1 (1.1%) |
| $12,500 to $14,999 | 0 (0.0%) | 2 (2.2%) |
| $15,000 to $17,499 | 11 (6.7%) | 4 (4.4%) |
| $17,500 to $19,999 | 9 (5.5%) | 4 (4.4%) |
| $20,000 to $22,499 | 0 (0.0%) | 2 (2.2%) |
| $22,500 to $24,999 | 28 (17.1%) | 0 (0.0%) |
| $25,000 to $29,999 | 5 (3.0%) | 5 (5.5%) |
| $30,000 to $34,999 | 7 (4.3%) | 21 (23.1%) |
| $35,000 to $39,999 | 1 (0.6%) | 8 (8.8%) |
| $40,000 to $44,999 | 11 (6.7%) | 5 (5.5%) |
| $45,000 to $49,999 | 5 (3.0%) | 1 (1.1%) |
| $50,000 to $54,999 | 3 (1.8%) | 6 (6.6%) |
| $55,000 to $64,999 | 14 (8.5%) | 0 (0.0%) |
| $65,000 to $74,999 | 12 (7.3%) | 0 (0.0%) |
| $75,000 to $99,999 | 38 (23.2%) | 4 (4.4%) |
| $100,000+ | 5 (3.0%) | 0 (0.0%) |
| Total | 164 (100.0%) | 91 (100.0%) |
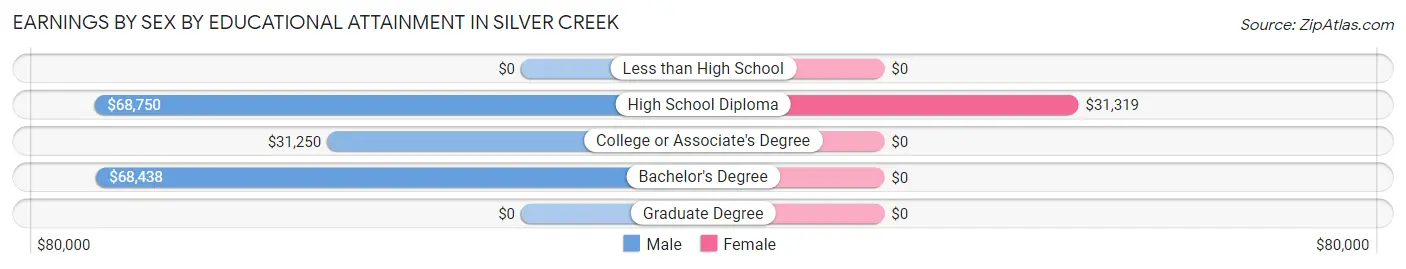
Earnings by Sex by Educational Attainment in Silver Creek
Average earnings in Silver Creek are $41,944 for men and $30,417 for women, a difference of 27.5%. Men with an educational attainment of high school diploma enjoy the highest average annual earnings of $68,750, while those with college or associate's degree education earn the least with $31,250. Women with an educational attainment of high school diploma earn the most with the average annual earnings of $31,319, while those with high school diploma education have the smallest earnings of $31,319.
| Educational Attainment | Male Income | Female Income |
| Less than High School | - | - |
| High School Diploma | $68,750 | $31,319 |
| College or Associate's Degree | $31,250 | $0 |
| Bachelor's Degree | $68,438 | $0 |
| Graduate Degree | - | - |
| Total | $41,944 | $30,417 |
Family Income in Silver Creek
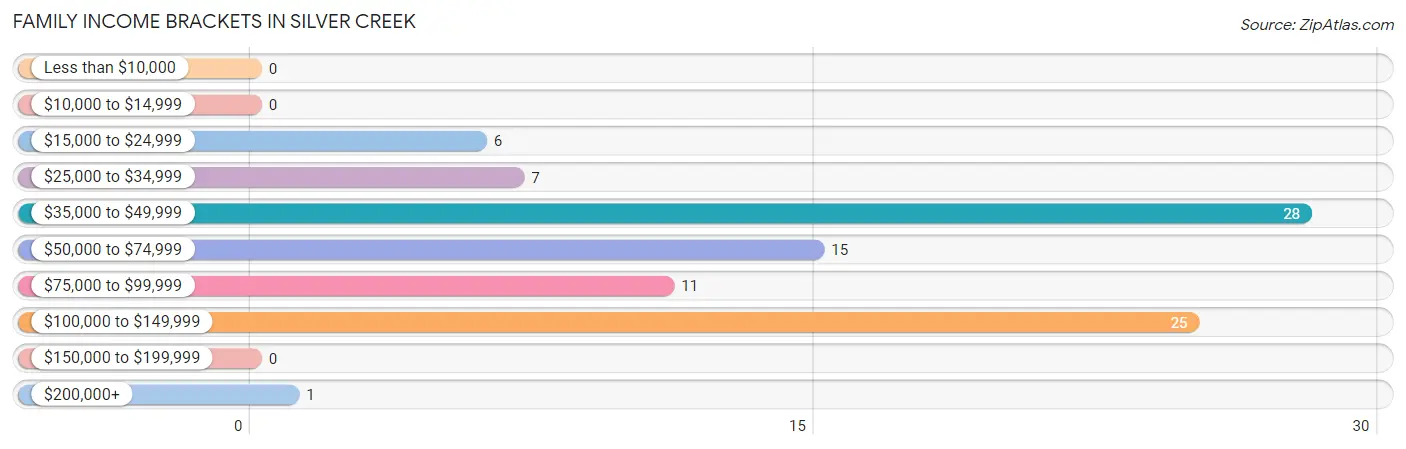
Family Income Brackets in Silver Creek
According to the Silver Creek family income data, there are 28 families falling into the $35,000 to $49,999 income range, which is the most common income bracket and makes up 30.1% of all families.
| Income Bracket | # Families | % Families |
| Less than $10,000 | 0 | 0.0% |
| $10,000 to $14,999 | 0 | 0.0% |
| $15,000 to $24,999 | 6 | 6.5% |
| $25,000 to $34,999 | 7 | 7.5% |
| $35,000 to $49,999 | 28 | 30.1% |
| $50,000 to $74,999 | 15 | 16.1% |
| $75,000 to $99,999 | 11 | 11.8% |
| $100,000 to $149,999 | 25 | 26.9% |
| $150,000 to $199,999 | 0 | 0.0% |
| $200,000+ | 1 | 1.1% |
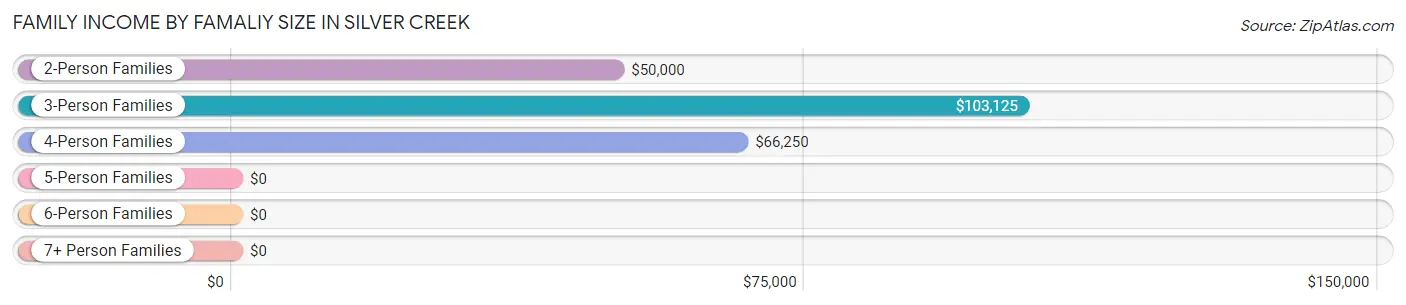
Family Income by Famaliy Size in Silver Creek
3-person families (7 | 7.5%) account for the highest median family income in Silver Creek with $103,125 per family, while 3-person families (7 | 7.5%) have the highest median income of $34,375 per family member.
| Income Bracket | # Families | Median Income |
| 2-Person Families | 76 (81.7%) | $50,000 |
| 3-Person Families | 7 (7.5%) | $103,125 |
| 4-Person Families | 8 (8.6%) | $66,250 |
| 5-Person Families | 2 (2.1%) | $0 |
| 6-Person Families | 0 (0.0%) | $0 |
| 7+ Person Families | 0 (0.0%) | $0 |
| Total | 93 (100.0%) | $65,625 |
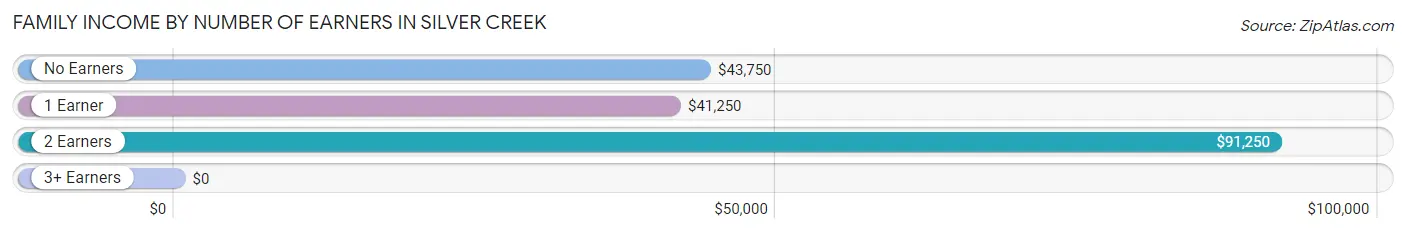
Family Income by Number of Earners in Silver Creek
| Number of Earners | # Families | Median Income |
| No Earners | 5 (5.4%) | $43,750 |
| 1 Earner | 26 (28.0%) | $41,250 |
| 2 Earners | 60 (64.5%) | $91,250 |
| 3+ Earners | 2 (2.1%) | $0 |
| Total | 93 (100.0%) | $65,625 |
Household Income in Silver Creek
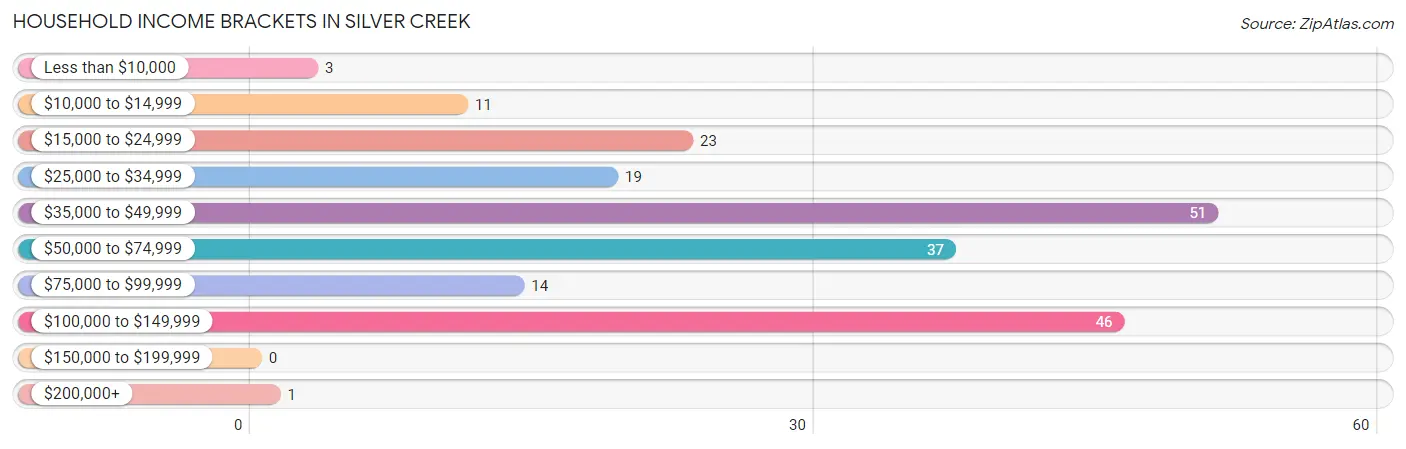
Household Income Brackets in Silver Creek
With 51 households falling in the category, the $35,000 to $49,999 income range is the most frequent in Silver Creek, accounting for 24.9% of all households.
| Income Bracket | # Households | % Households |
| Less than $10,000 | 3 | 1.5% |
| $10,000 to $14,999 | 11 | 5.4% |
| $15,000 to $24,999 | 23 | 11.2% |
| $25,000 to $34,999 | 19 | 9.3% |
| $35,000 to $49,999 | 51 | 24.9% |
| $50,000 to $74,999 | 37 | 18.0% |
| $75,000 to $99,999 | 14 | 6.8% |
| $100,000 to $149,999 | 46 | 22.4% |
| $150,000 to $199,999 | 0 | 0.0% |
| $200,000+ | 1 | 0.5% |
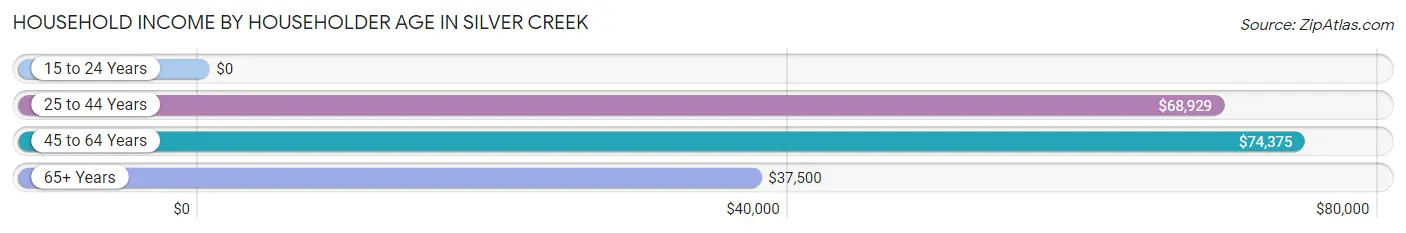
Household Income by Householder Age in Silver Creek
The median household income in Silver Creek is $47,750, with the highest median household income of $74,375 found in the 45 to 64 years age bracket for the primary householder. A total of 67 households (32.7%) fall into this category. Meanwhile, the 15 to 24 years age bracket for the primary householder has the lowest median household income of $0, with 2 households (1.0%) in this group.
| Income Bracket | # Households | Median Income |
| 15 to 24 Years | 2 (1.0%) | $0 |
| 25 to 44 Years | 66 (32.2%) | $68,929 |
| 45 to 64 Years | 67 (32.7%) | $74,375 |
| 65+ Years | 70 (34.2%) | $37,500 |
| Total | 205 (100.0%) | $47,750 |
Poverty in Silver Creek
Income Below Poverty by Sex and Age in Silver Creek
With 8.1% poverty level for males and 10.4% for females among the residents of Silver Creek, under 5 year old males and under 5 year old females are the most vulnerable to poverty, with 3 males (37.5%) and 4 females (66.7%) in their respective age groups living below the poverty level.
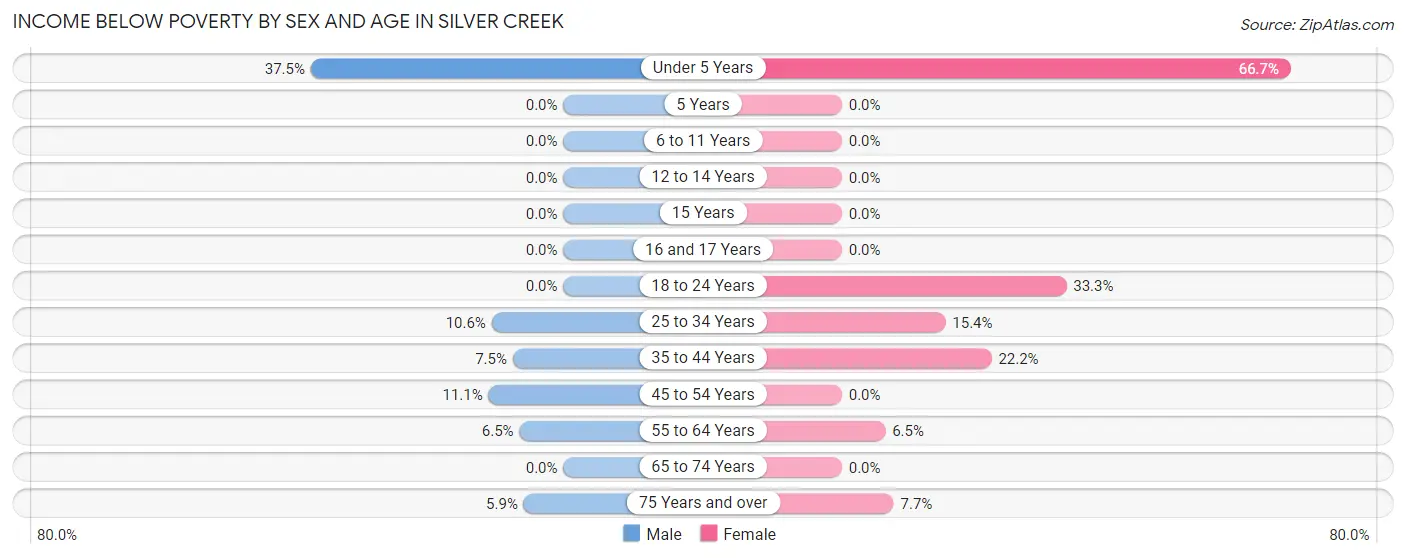
| Age Bracket | Male | Female |
| Under 5 Years | 3 (37.5%) | 4 (66.7%) |
| 5 Years | 0 (0.0%) | 0 (0.0%) |
| 6 to 11 Years | 0 (0.0%) | 0 (0.0%) |
| 12 to 14 Years | 0 (0.0%) | 0 (0.0%) |
| 15 Years | 0 (0.0%) | 0 (0.0%) |
| 16 and 17 Years | 0 (0.0%) | 0 (0.0%) |
| 18 to 24 Years | 0 (0.0%) | 2 (33.3%) |
| 25 to 34 Years | 5 (10.6%) | 2 (15.4%) |
| 35 to 44 Years | 3 (7.5%) | 4 (22.2%) |
| 45 to 54 Years | 3 (11.1%) | 0 (0.0%) |
| 55 to 64 Years | 3 (6.5%) | 2 (6.5%) |
| 65 to 74 Years | 0 (0.0%) | 0 (0.0%) |
| 75 Years and over | 1 (5.9%) | 3 (7.7%) |
| Total | 18 (8.1%) | 17 (10.4%) |
Income Above Poverty by Sex and Age in Silver Creek
According to the poverty statistics in Silver Creek, males aged 5 years and females aged 5 years are the age groups that are most secure financially, with 100.0% of males and 100.0% of females in these age groups living above the poverty line.
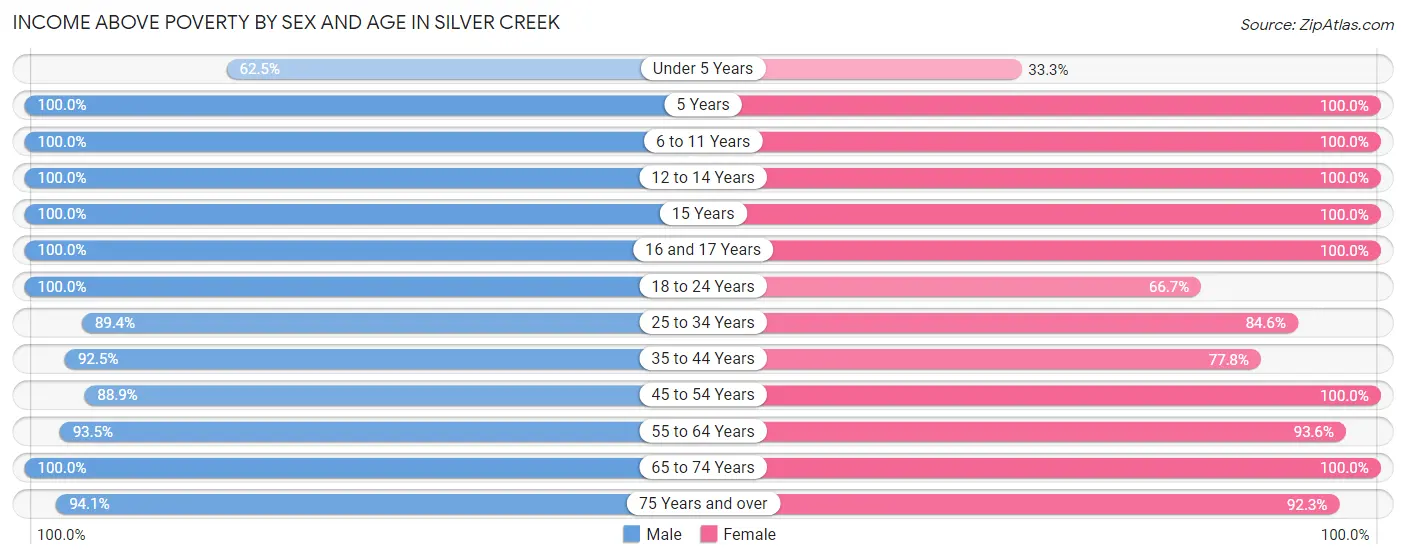
| Age Bracket | Male | Female |
| Under 5 Years | 5 (62.5%) | 2 (33.3%) |
| 5 Years | 2 (100.0%) | 1 (100.0%) |
| 6 to 11 Years | 3 (100.0%) | 3 (100.0%) |
| 12 to 14 Years | 6 (100.0%) | 4 (100.0%) |
| 15 Years | 3 (100.0%) | 3 (100.0%) |
| 16 and 17 Years | 1 (100.0%) | 2 (100.0%) |
| 18 to 24 Years | 5 (100.0%) | 4 (66.7%) |
| 25 to 34 Years | 42 (89.4%) | 11 (84.6%) |
| 35 to 44 Years | 37 (92.5%) | 14 (77.8%) |
| 45 to 54 Years | 24 (88.9%) | 14 (100.0%) |
| 55 to 64 Years | 43 (93.5%) | 29 (93.5%) |
| 65 to 74 Years | 16 (100.0%) | 23 (100.0%) |
| 75 Years and over | 16 (94.1%) | 36 (92.3%) |
| Total | 203 (91.9%) | 146 (89.6%) |
Income Below Poverty Among Married-Couple Families in Silver Creek
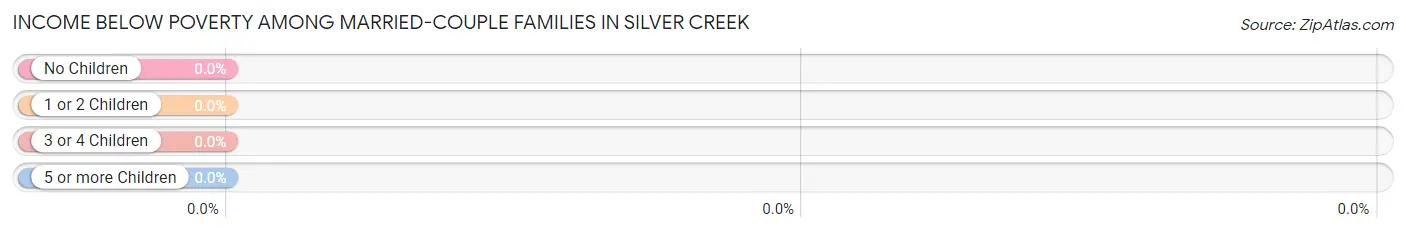
| Children | Above Poverty | Below Poverty |
| No Children | 64 (100.0%) | 0 (0.0%) |
| 1 or 2 Children | 13 (100.0%) | 0 (0.0%) |
| 3 or 4 Children | 0 (0.0%) | 0 (0.0%) |
| 5 or more Children | 0 (0.0%) | 0 (0.0%) |
| Total | 77 (100.0%) | 0 (0.0%) |
Income Below Poverty Among Single-Parent Households in Silver Creek
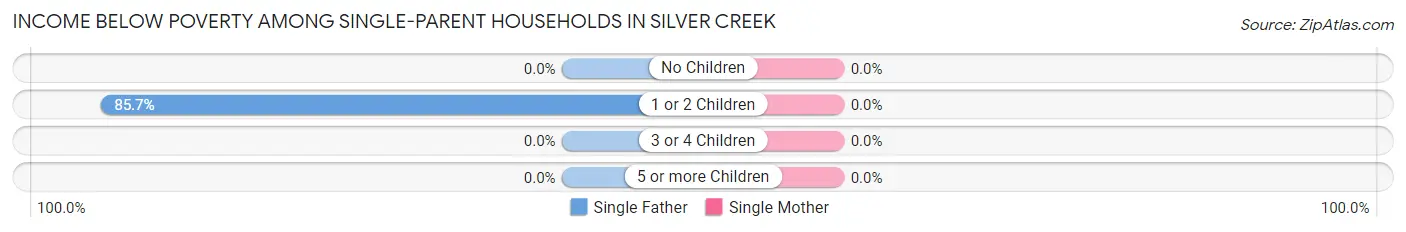
| Children | Single Father | Single Mother |
| No Children | 0 (0.0%) | 0 (0.0%) |
| 1 or 2 Children | 6 (85.7%) | 0 (0.0%) |
| 3 or 4 Children | 0 (0.0%) | 0 (0.0%) |
| 5 or more Children | 0 (0.0%) | 0 (0.0%) |
| Total | 6 (46.2%) | 0 (0.0%) |
Income Below Poverty Among Married-Couple vs Single-Parent Households in Silver Creek
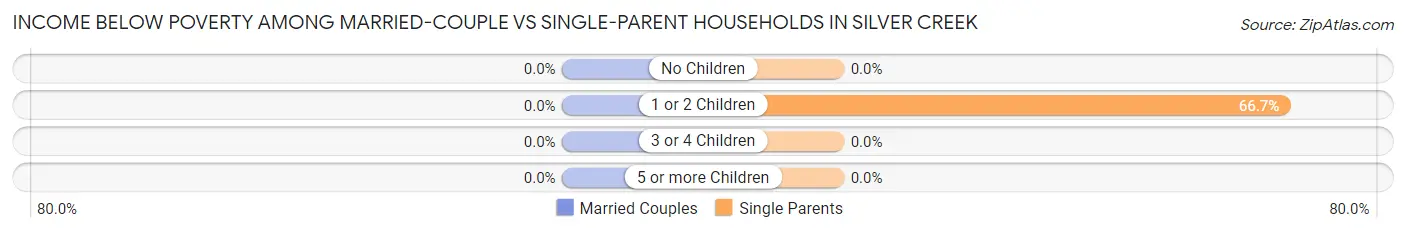
| Children | Married-Couple Families | Single-Parent Households |
| No Children | 0 (0.0%) | 0 (0.0%) |
| 1 or 2 Children | 0 (0.0%) | 6 (66.7%) |
| 3 or 4 Children | 0 (0.0%) | 0 (0.0%) |
| 5 or more Children | 0 (0.0%) | 0 (0.0%) |
| Total | 0 (0.0%) | 6 (37.5%) |
Race in Silver Creek
The most populous races in Silver Creek are White / Caucasian (379 | 98.7%), Two or more Races (5 | 1.3%), and Hispanic or Latino (4 | 1.0%).
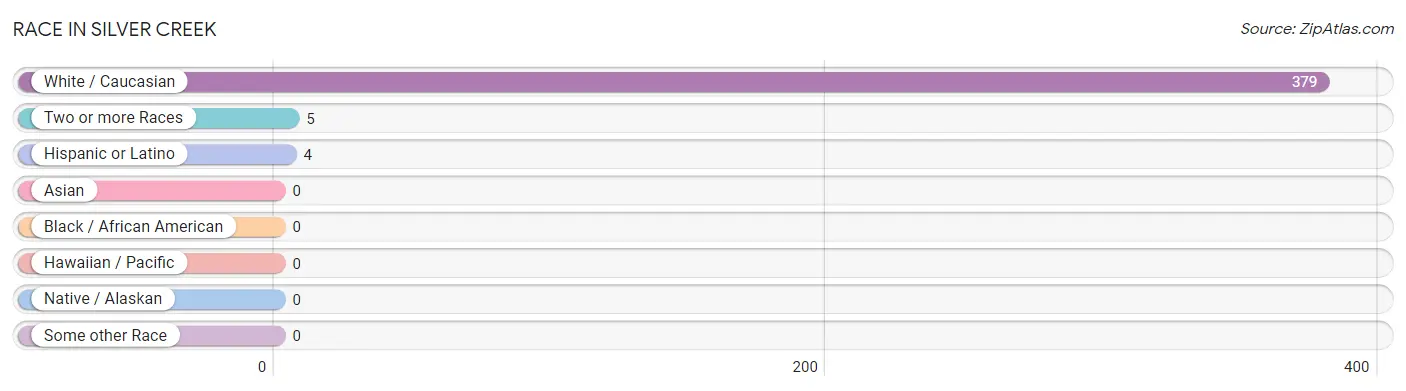
| Race | # Population | % Population |
| Asian | 0 | 0.0% |
| Black / African American | 0 | 0.0% |
| Hawaiian / Pacific | 0 | 0.0% |
| Hispanic or Latino | 4 | 1.0% |
| Native / Alaskan | 0 | 0.0% |
| White / Caucasian | 379 | 98.7% |
| Two or more Races | 5 | 1.3% |
| Some other Race | 0 | 0.0% |
| Total | 384 | 100.0% |
Ancestry in Silver Creek
The most populous ancestries reported in Silver Creek are German (186 | 48.4%), Polish (89 | 23.2%), Irish (47 | 12.2%), English (25 | 6.5%), and Swiss (17 | 4.4%), together accounting for 94.8% of all Silver Creek residents.
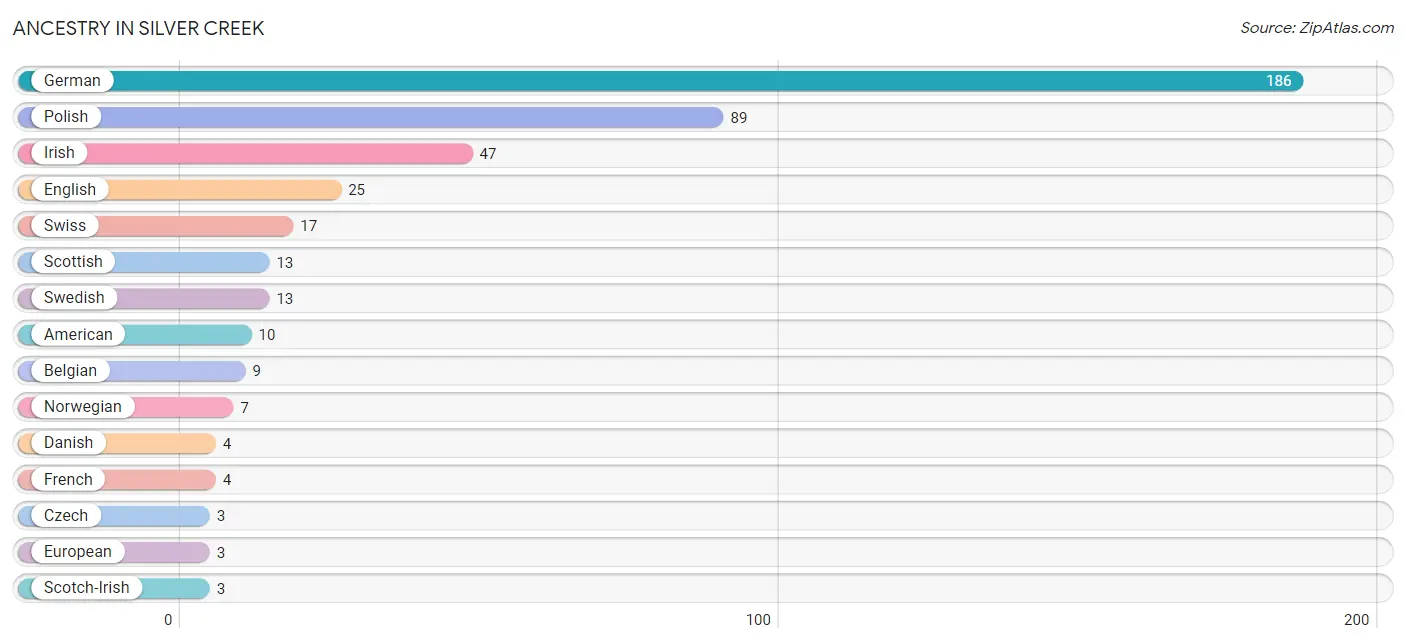
| Ancestry | # Population | % Population |
| American | 10 | 2.6% |
| Belgian | 9 | 2.3% |
| Cuban | 2 | 0.5% |
| Czech | 3 | 0.8% |
| Czechoslovakian | 2 | 0.5% |
| Danish | 4 | 1.0% |
| Dutch | 1 | 0.3% |
| English | 25 | 6.5% |
| European | 3 | 0.8% |
| French | 4 | 1.0% |
| French Canadian | 2 | 0.5% |
| German | 186 | 48.4% |
| Irish | 47 | 12.2% |
| Mexican | 2 | 0.5% |
| Norwegian | 7 | 1.8% |
| Pennsylvania German | 2 | 0.5% |
| Polish | 89 | 23.2% |
| Russian | 1 | 0.3% |
| Scotch-Irish | 3 | 0.8% |
| Scottish | 13 | 3.4% |
| Swedish | 13 | 3.4% |
| Swiss | 17 | 4.4% | View All 22 Rows |
Immigrants in Silver Creek
The most numerous immigrant groups reported in Silver Creek came from Latin America (4 | 1.0%), Caribbean (2 | 0.5%), Central America (2 | 0.5%), Cuba (2 | 0.5%), and Mexico (2 | 0.5%), together accounting for 3.1% of all Silver Creek residents.
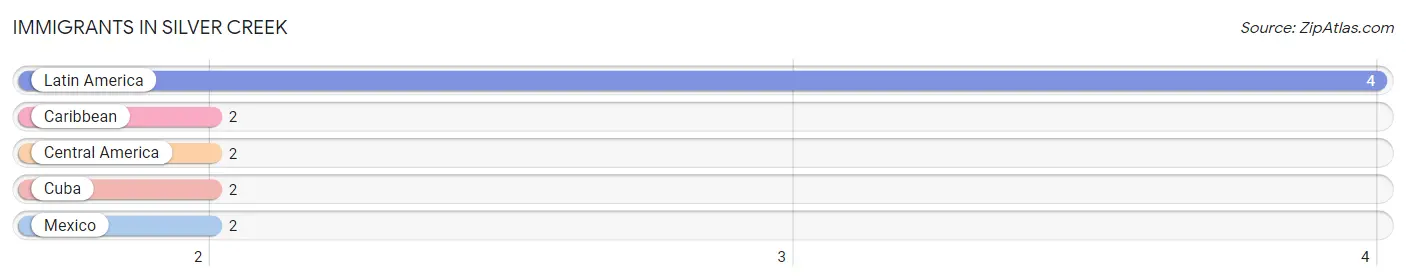
| Immigration Origin | # Population | % Population |
| Caribbean | 2 | 0.5% |
| Central America | 2 | 0.5% |
| Cuba | 2 | 0.5% |
| Latin America | 4 | 1.0% |
| Mexico | 2 | 0.5% | View All 5 Rows |
Sex and Age in Silver Creek
Sex and Age in Silver Creek
The most populous age groups in Silver Creek are 55 to 59 Years (36 | 16.3%) for men and 55 to 59 Years (28 | 17.2%) for women.
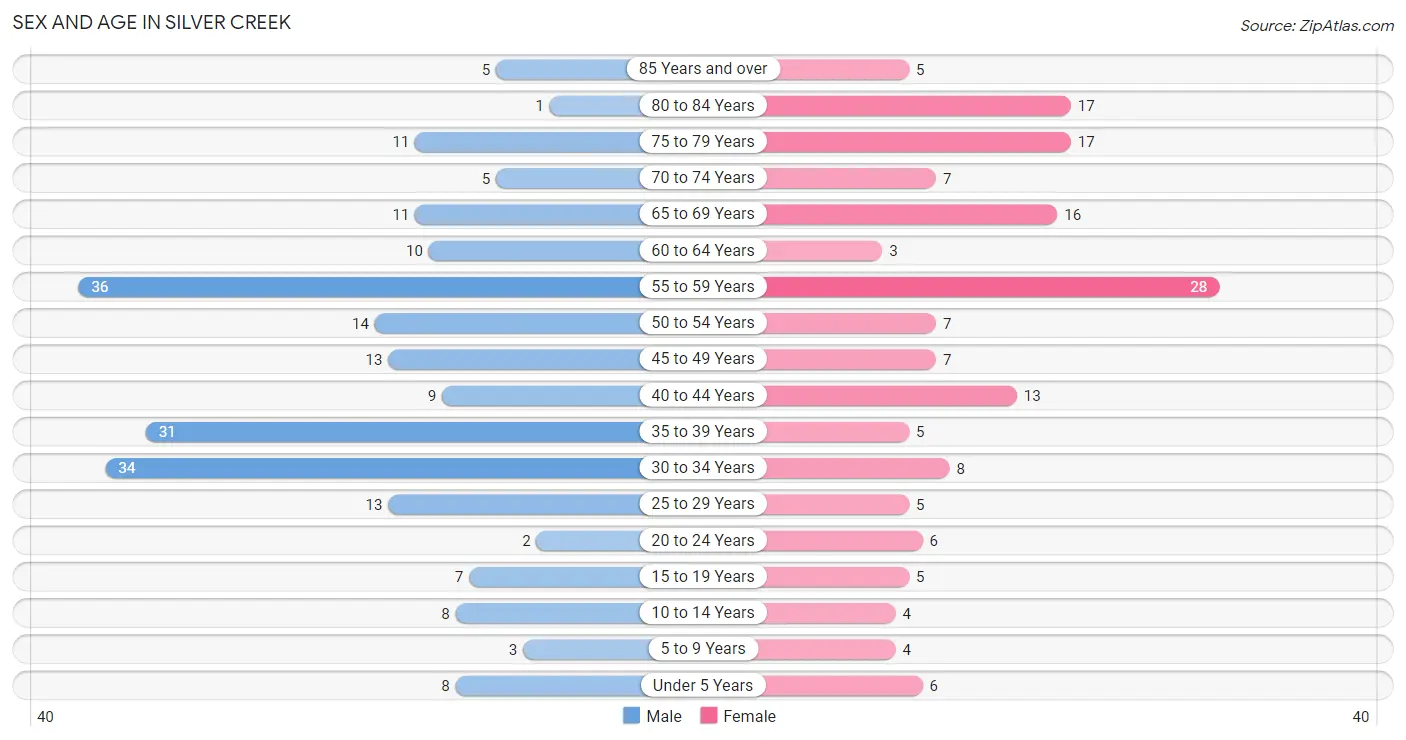
| Age Bracket | Male | Female |
| Under 5 Years | 8 (3.6%) | 6 (3.7%) |
| 5 to 9 Years | 3 (1.4%) | 4 (2.5%) |
| 10 to 14 Years | 8 (3.6%) | 4 (2.5%) |
| 15 to 19 Years | 7 (3.2%) | 5 (3.1%) |
| 20 to 24 Years | 2 (0.9%) | 6 (3.7%) |
| 25 to 29 Years | 13 (5.9%) | 5 (3.1%) |
| 30 to 34 Years | 34 (15.4%) | 8 (4.9%) |
| 35 to 39 Years | 31 (14.0%) | 5 (3.1%) |
| 40 to 44 Years | 9 (4.1%) | 13 (8.0%) |
| 45 to 49 Years | 13 (5.9%) | 7 (4.3%) |
| 50 to 54 Years | 14 (6.3%) | 7 (4.3%) |
| 55 to 59 Years | 36 (16.3%) | 28 (17.2%) |
| 60 to 64 Years | 10 (4.5%) | 3 (1.8%) |
| 65 to 69 Years | 11 (5.0%) | 16 (9.8%) |
| 70 to 74 Years | 5 (2.3%) | 7 (4.3%) |
| 75 to 79 Years | 11 (5.0%) | 17 (10.4%) |
| 80 to 84 Years | 1 (0.4%) | 17 (10.4%) |
| 85 Years and over | 5 (2.3%) | 5 (3.1%) |
| Total | 221 (100.0%) | 163 (100.0%) |
Families and Households in Silver Creek
Median Family Size in Silver Creek
The median family size in Silver Creek is 2.37 persons per family, with single female/mother families (3 | 3.2%) accounting for the largest median family size of 3 persons per family. On the other hand, married-couple families (77 | 82.8%) represent the smallest median family size with 2.27 persons per family.
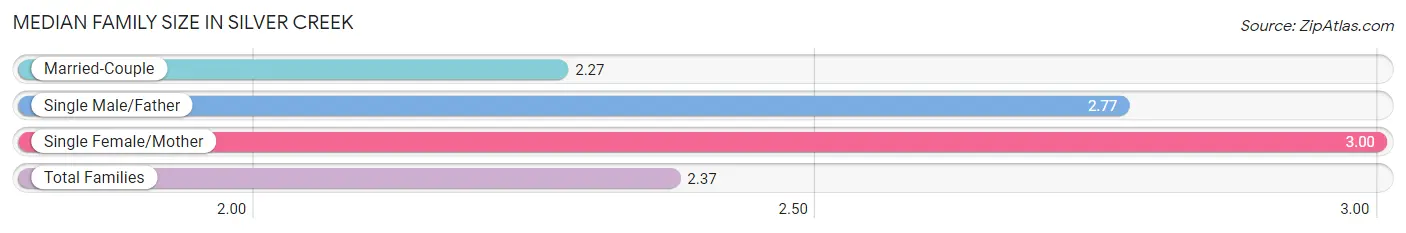
| Family Type | # Families | Family Size |
| Married-Couple | 77 (82.8%) | 2.27 |
| Single Male/Father | 13 (14.0%) | 2.77 |
| Single Female/Mother | 3 (3.2%) | 3.00 |
| Total Families | 93 (100.0%) | 2.37 |
Median Household Size in Silver Creek
The median household size in Silver Creek is 1.87 persons per household, with single male/father households (13 | 6.3%) accounting for the largest median household size of 4.23 persons per household. non-family households (112 | 54.6%) represent the smallest median household size with 1.29 persons per household.
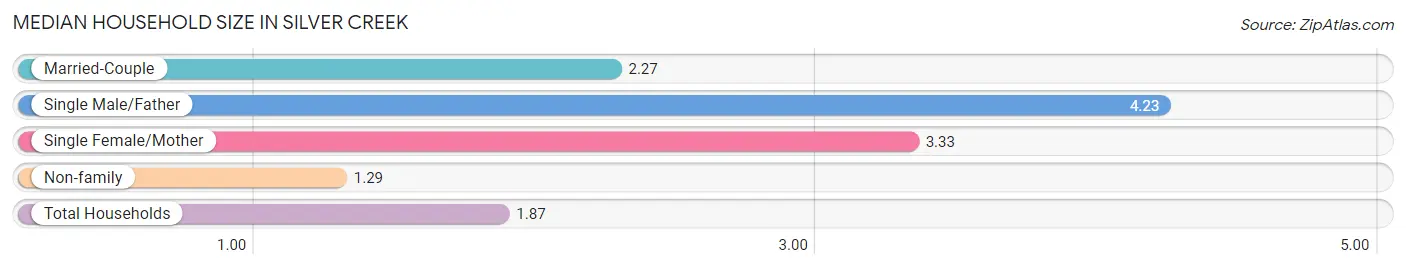
| Household Type | # Households | Household Size |
| Married-Couple | 77 (37.6%) | 2.27 |
| Single Male/Father | 13 (6.3%) | 4.23 |
| Single Female/Mother | 3 (1.5%) | 3.33 |
| Non-family | 112 (54.6%) | 1.29 |
| Total Households | 205 (100.0%) | 1.87 |
Household Size by Marriage Status in Silver Creek
Out of a total of 205 households in Silver Creek, 93 (45.4%) are family households, while 112 (54.6%) are nonfamily households. The most numerous type of family households are 2-person households, comprising 68, and the most common type of nonfamily households are 1-person households, comprising 89.
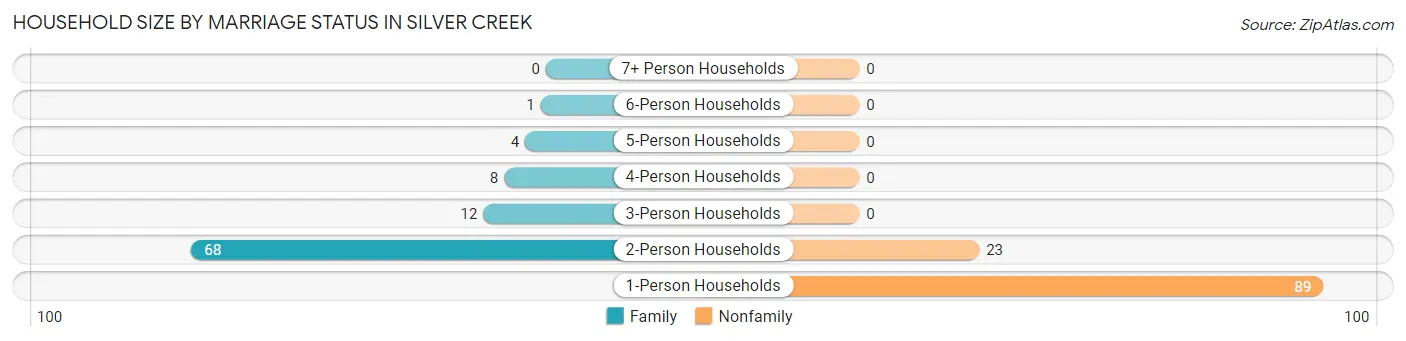
| Household Size | Family Households | Nonfamily Households |
| 1-Person Households | - | 89 (43.4%) |
| 2-Person Households | 68 (33.2%) | 23 (11.2%) |
| 3-Person Households | 12 (5.9%) | 0 (0.0%) |
| 4-Person Households | 8 (3.9%) | 0 (0.0%) |
| 5-Person Households | 4 (1.9%) | 0 (0.0%) |
| 6-Person Households | 1 (0.5%) | 0 (0.0%) |
| 7+ Person Households | 0 (0.0%) | 0 (0.0%) |
| Total | 93 (45.4%) | 112 (54.6%) |
Female Fertility in Silver Creek
Fertility by Age in Silver Creek
Average fertility rate in Silver Creek is 82.0 births per 1,000 women. Women in the age bracket of 20 to 34 years have the highest fertility rate with 211.0 births per 1,000 women. Women in the age bracket of 20 to 34 years acount for 100.0% of all women with births.
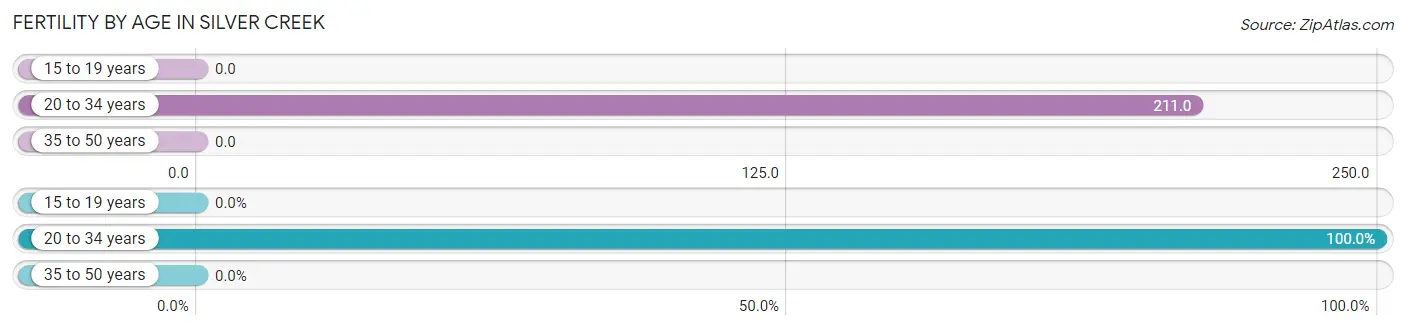
| Age Bracket | Women with Births | Births / 1,000 Women |
| 15 to 19 years | 0 (0.0%) | 0.0 |
| 20 to 34 years | 4 (100.0%) | 211.0 |
| 35 to 50 years | 0 (0.0%) | 0.0 |
| Total | 4 (100.0%) | 82.0 |
Fertility by Age by Marriage Status in Silver Creek
50.0% of women with births (4) in Silver Creek are married. The highest percentage of unmarried women with births falls into 20 to 34 years age bracket with 50.0% of them unmarried at the time of birth, while the lowest percentage of unmarried women with births belong to 20 to 34 years age bracket with 50.0% of them unmarried.
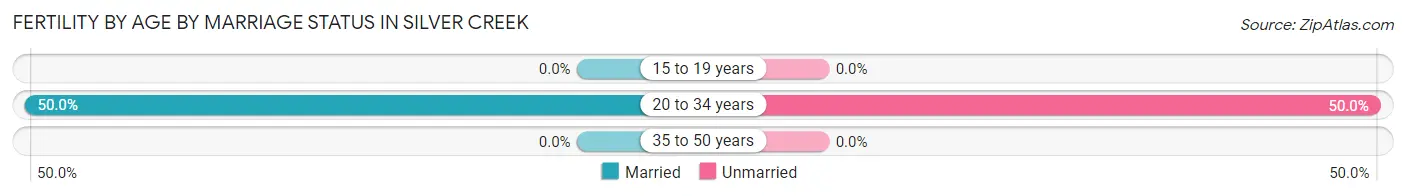
| Age Bracket | Married | Unmarried |
| 15 to 19 years | 0 (0.0%) | 0 (0.0%) |
| 20 to 34 years | 2 (50.0%) | 2 (50.0%) |
| 35 to 50 years | 0 (0.0%) | 0 (0.0%) |
| Total | 2 (50.0%) | 2 (50.0%) |
Fertility by Education in Silver Creek
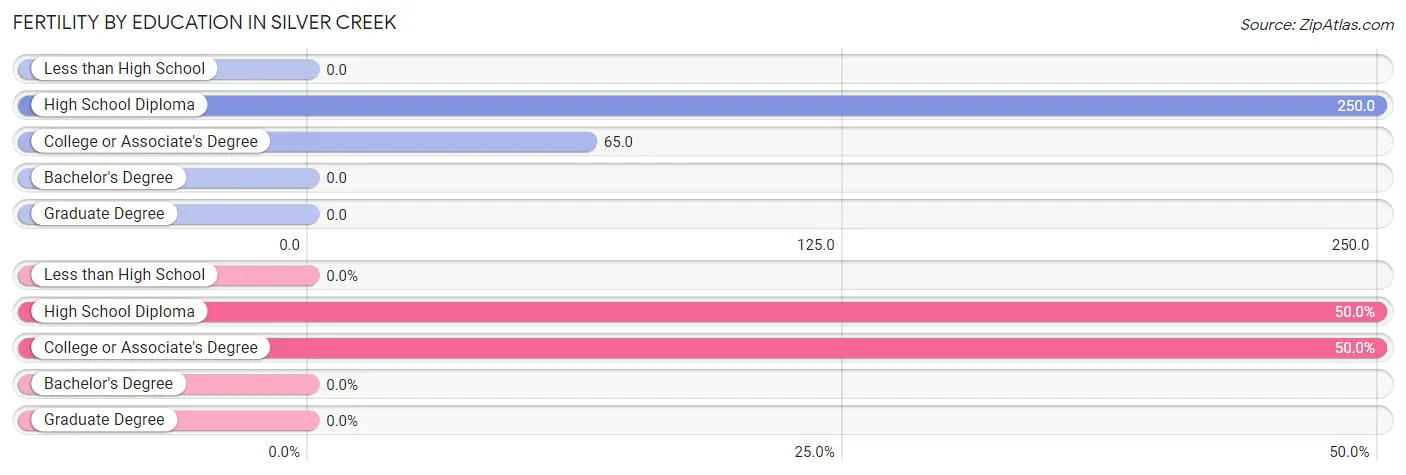
| Educational Attainment | Women with Births | Births / 1,000 Women |
| Less than High School | 0 (0.0%) | 0.0 |
| High School Diploma | 2 (50.0%) | 250.0 |
| College or Associate's Degree | 2 (50.0%) | 65.0 |
| Bachelor's Degree | 0 (0.0%) | 0.0 |
| Graduate Degree | 0 (0.0%) | 0.0 |
| Total | 4 (100.0%) | 82.0 |
Fertility by Education by Marriage Status in Silver Creek
50.0% of women with births in Silver Creek are unmarried. Women with the educational attainment of high school diploma are most likely to be married with 100.0% of them married at childbirth, while women with the educational attainment of college or associate's degree are least likely to be married with 100.0% of them unmarried at childbirth.
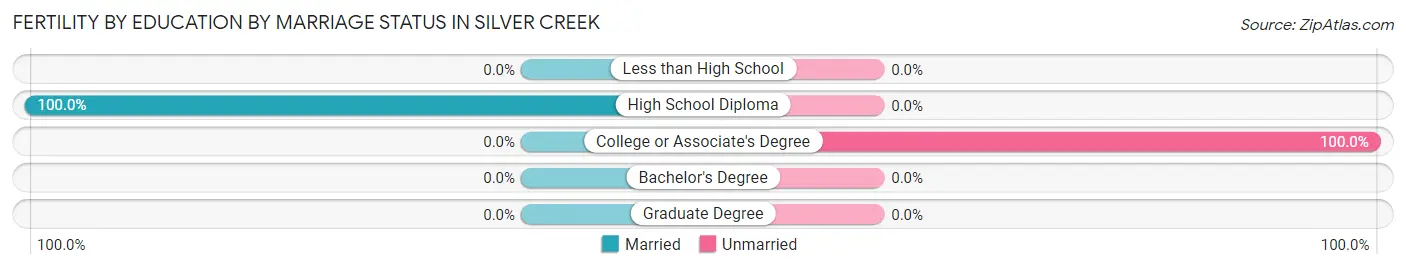
| Educational Attainment | Married | Unmarried |
| Less than High School | 0 (0.0%) | 0 (0.0%) |
| High School Diploma | 2 (100.0%) | 0 (0.0%) |
| College or Associate's Degree | 0 (0.0%) | 2 (100.0%) |
| Bachelor's Degree | 0 (0.0%) | 0 (0.0%) |
| Graduate Degree | 0 (0.0%) | 0 (0.0%) |
| Total | 2 (50.0%) | 2 (50.0%) |
Employment Characteristics in Silver Creek
Employment by Class of Employer in Silver Creek
Among the 240 employed individuals in Silver Creek, private company employees (126 | 52.5%), self-employed (not incorporated) (48 | 20.0%), and local government employees (45 | 18.8%) make up the most common classes of employment.
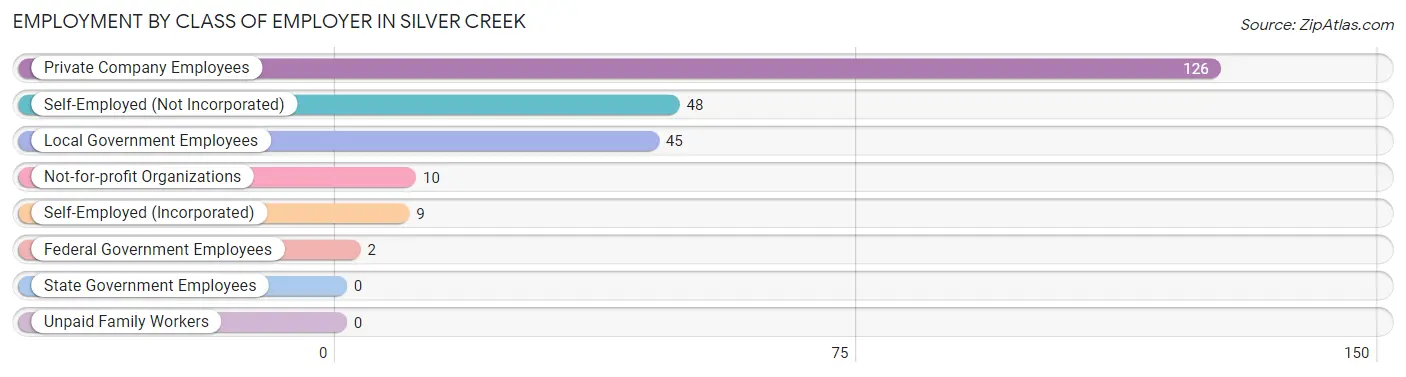
| Employer Class | # Employees | % Employees |
| Private Company Employees | 126 | 52.5% |
| Self-Employed (Incorporated) | 9 | 3.7% |
| Self-Employed (Not Incorporated) | 48 | 20.0% |
| Not-for-profit Organizations | 10 | 4.2% |
| Local Government Employees | 45 | 18.8% |
| State Government Employees | 0 | 0.0% |
| Federal Government Employees | 2 | 0.8% |
| Unpaid Family Workers | 0 | 0.0% |
| Total | 240 | 100.0% |
Employment Status by Age in Silver Creek
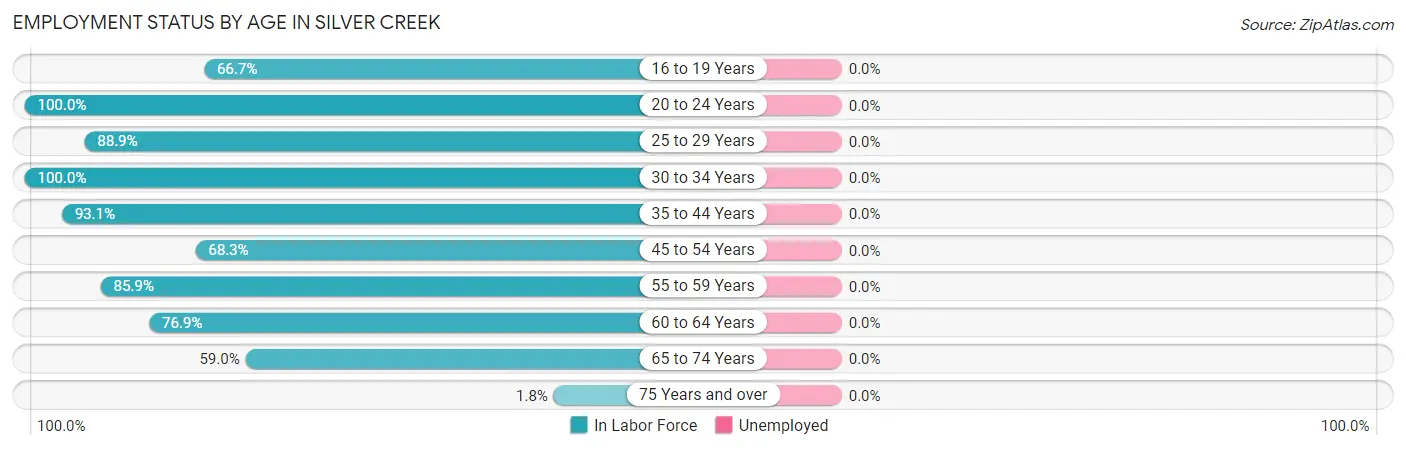
| Age Bracket | In Labor Force | Unemployed |
| 16 to 19 Years | 4 (66.7%) | 0 (0.0%) |
| 20 to 24 Years | 8 (100.0%) | 0 (0.0%) |
| 25 to 29 Years | 16 (88.9%) | 0 (0.0%) |
| 30 to 34 Years | 42 (100.0%) | 0 (0.0%) |
| 35 to 44 Years | 54 (93.1%) | 0 (0.0%) |
| 45 to 54 Years | 28 (68.3%) | 0 (0.0%) |
| 55 to 59 Years | 55 (85.9%) | 0 (0.0%) |
| 60 to 64 Years | 10 (76.9%) | 0 (0.0%) |
| 65 to 74 Years | 23 (59.0%) | 0 (0.0%) |
| 75 Years and over | 1 (1.8%) | 0 (0.0%) |
| Total | 241 (69.9%) | 0 (0.0%) |
Employment Status by Educational Attainment in Silver Creek
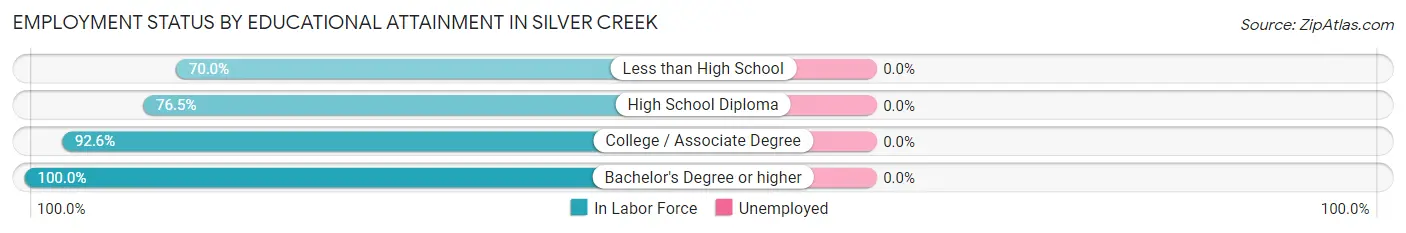
| Educational Attainment | In Labor Force | Unemployed |
| Less than High School | 7 (70.0%) | 0 (0.0%) |
| High School Diploma | 62 (76.5%) | 0 (0.0%) |
| College / Associate Degree | 112 (92.6%) | 0 (0.0%) |
| Bachelor's Degree or higher | 24 (100.0%) | 0 (0.0%) |
| Total | 205 (86.9%) | 0 (0.0%) |
Employment Occupations by Sex in Silver Creek
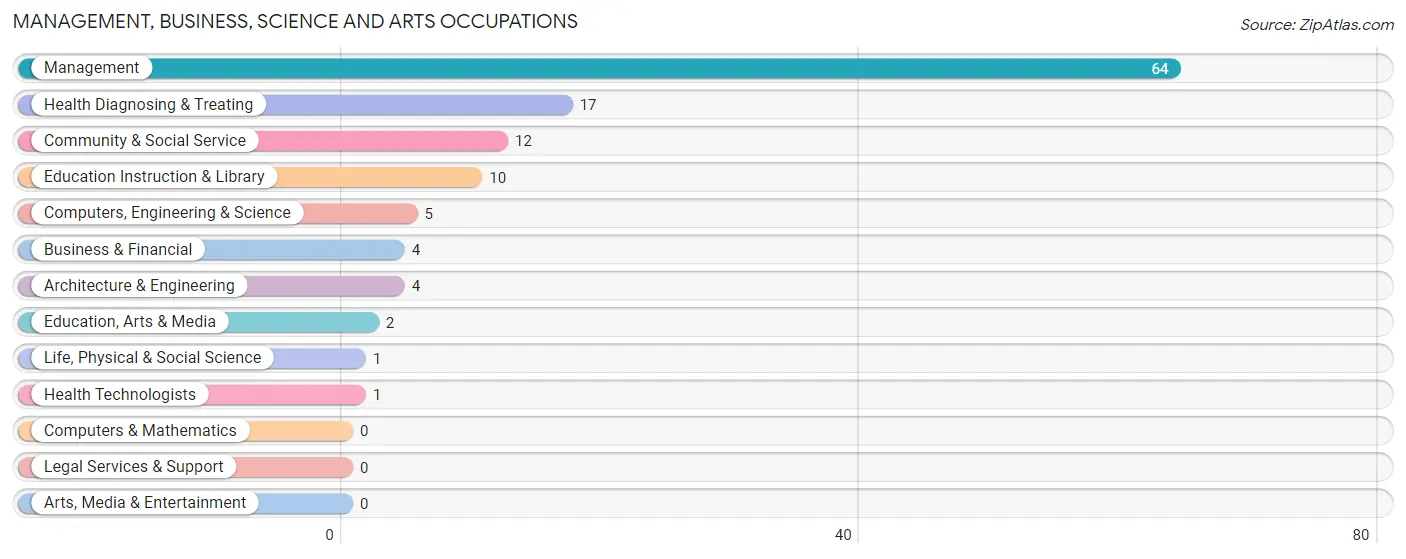
Management, Business, Science and Arts Occupations
The most common Management, Business, Science and Arts occupations in Silver Creek are Management (64 | 26.6%), Health Diagnosing & Treating (17 | 7.0%), Community & Social Service (12 | 5.0%), Education Instruction & Library (10 | 4.2%), and Computers, Engineering & Science (5 | 2.1%).
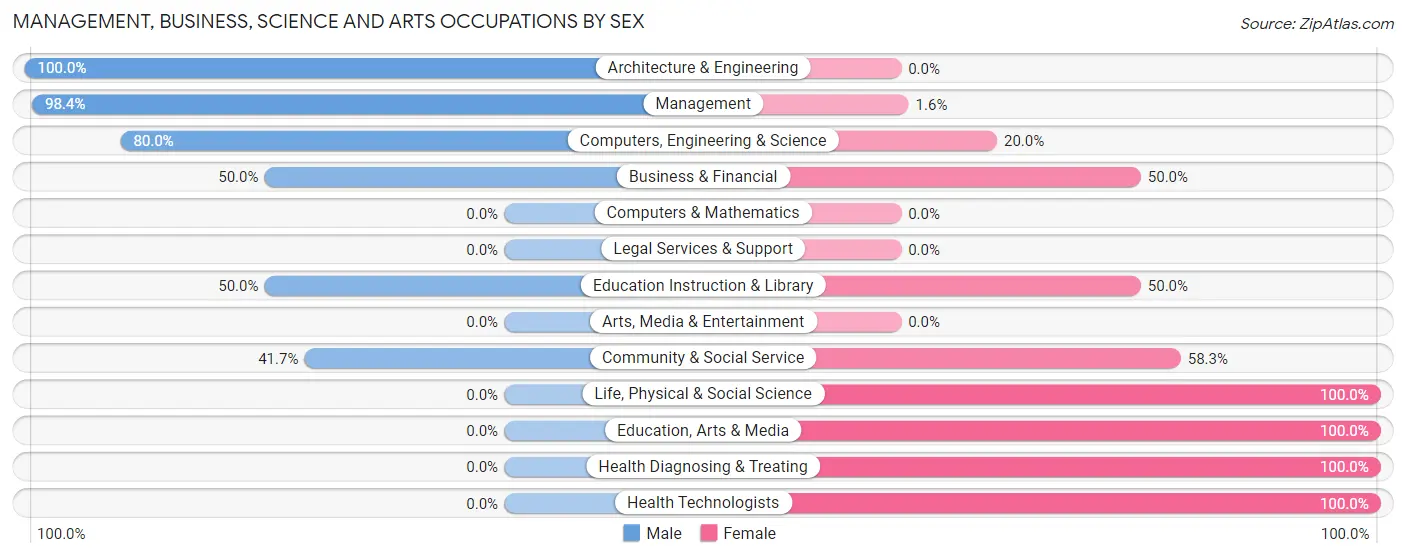
Management, Business, Science and Arts Occupations by Sex
Within the Management, Business, Science and Arts occupations in Silver Creek, the most male-oriented occupations are Architecture & Engineering (100.0%), Management (98.4%), and Computers, Engineering & Science (80.0%), while the most female-oriented occupations are Life, Physical & Social Science (100.0%), Education, Arts & Media (100.0%), and Health Diagnosing & Treating (100.0%).
| Occupation | Male | Female |
| Management | 63 (98.4%) | 1 (1.6%) |
| Business & Financial | 2 (50.0%) | 2 (50.0%) |
| Computers, Engineering & Science | 4 (80.0%) | 1 (20.0%) |
| Computers & Mathematics | 0 (0.0%) | 0 (0.0%) |
| Architecture & Engineering | 4 (100.0%) | 0 (0.0%) |
| Life, Physical & Social Science | 0 (0.0%) | 1 (100.0%) |
| Community & Social Service | 5 (41.7%) | 7 (58.3%) |
| Education, Arts & Media | 0 (0.0%) | 2 (100.0%) |
| Legal Services & Support | 0 (0.0%) | 0 (0.0%) |
| Education Instruction & Library | 5 (50.0%) | 5 (50.0%) |
| Arts, Media & Entertainment | 0 (0.0%) | 0 (0.0%) |
| Health Diagnosing & Treating | 0 (0.0%) | 17 (100.0%) |
| Health Technologists | 0 (0.0%) | 1 (100.0%) |
| Total (Category) | 74 (72.6%) | 28 (27.5%) |
| Total (Overall) | 150 (62.2%) | 91 (37.8%) |
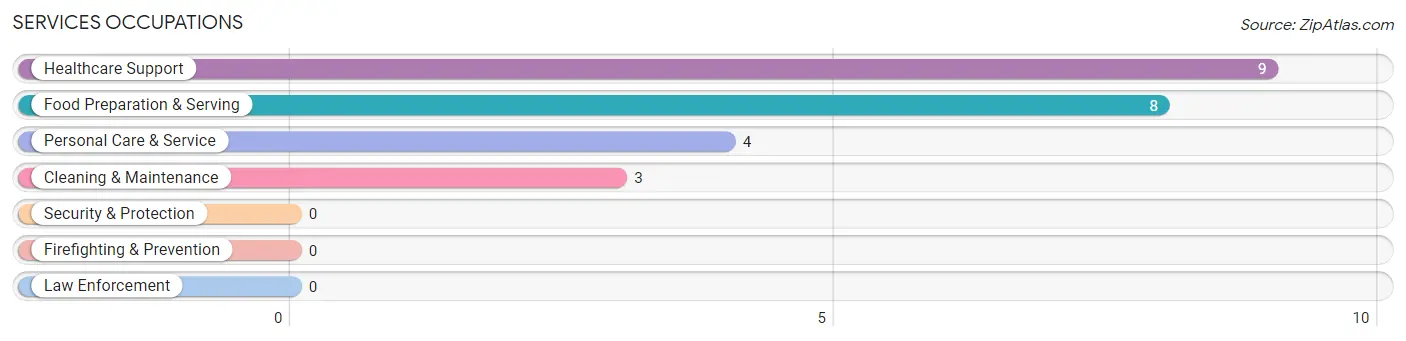
Services Occupations
The most common Services occupations in Silver Creek are Healthcare Support (9 | 3.7%), Food Preparation & Serving (8 | 3.3%), Personal Care & Service (4 | 1.7%), and Cleaning & Maintenance (3 | 1.2%).
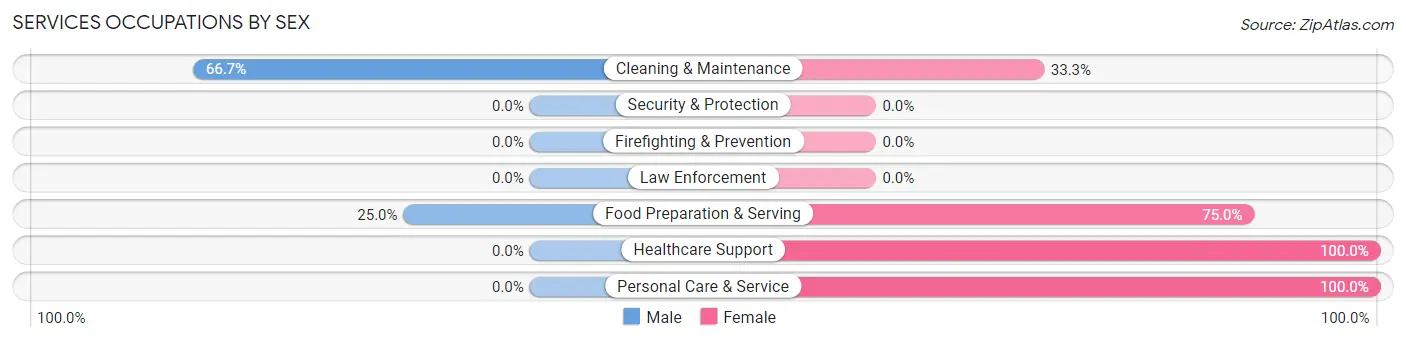
Services Occupations by Sex
Within the Services occupations in Silver Creek, the most male-oriented occupations are Cleaning & Maintenance (66.7%), and Food Preparation & Serving (25.0%), while the most female-oriented occupations are Healthcare Support (100.0%), Personal Care & Service (100.0%), and Food Preparation & Serving (75.0%).
| Occupation | Male | Female |
| Healthcare Support | 0 (0.0%) | 9 (100.0%) |
| Security & Protection | 0 (0.0%) | 0 (0.0%) |
| Firefighting & Prevention | 0 (0.0%) | 0 (0.0%) |
| Law Enforcement | 0 (0.0%) | 0 (0.0%) |
| Food Preparation & Serving | 2 (25.0%) | 6 (75.0%) |
| Cleaning & Maintenance | 2 (66.7%) | 1 (33.3%) |
| Personal Care & Service | 0 (0.0%) | 4 (100.0%) |
| Total (Category) | 4 (16.7%) | 20 (83.3%) |
| Total (Overall) | 150 (62.2%) | 91 (37.8%) |
Sales and Office Occupations
The most common Sales and Office occupations in Silver Creek are Office & Administration (28 | 11.6%), and Sales & Related (16 | 6.6%).
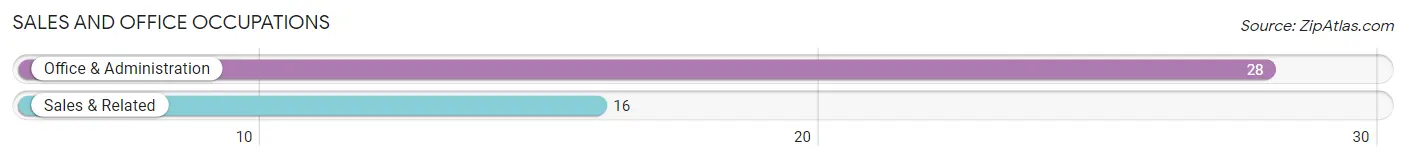
Sales and Office Occupations by Sex
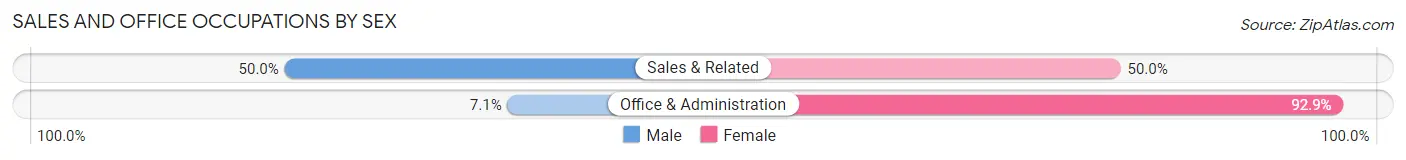
| Occupation | Male | Female |
| Sales & Related | 8 (50.0%) | 8 (50.0%) |
| Office & Administration | 2 (7.1%) | 26 (92.9%) |
| Total (Category) | 10 (22.7%) | 34 (77.3%) |
| Total (Overall) | 150 (62.2%) | 91 (37.8%) |
Natural Resources, Construction and Maintenance Occupations
The most common Natural Resources, Construction and Maintenance occupations in Silver Creek are Installation, Maintenance & Repair (19 | 7.9%), Farming, Fishing & Forestry (13 | 5.4%), and Construction & Extraction (9 | 3.7%).
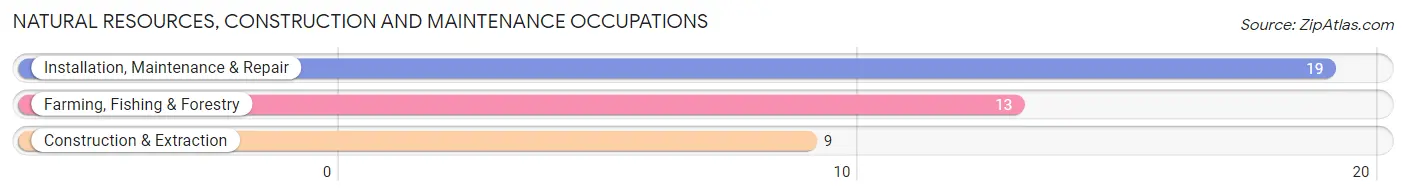
Natural Resources, Construction and Maintenance Occupations by Sex
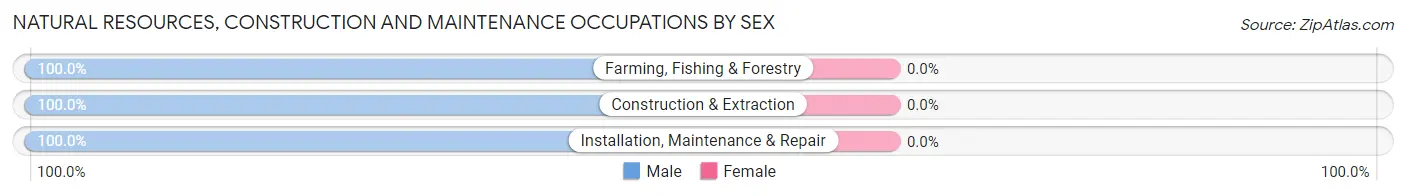
| Occupation | Male | Female |
| Farming, Fishing & Forestry | 13 (100.0%) | 0 (0.0%) |
| Construction & Extraction | 9 (100.0%) | 0 (0.0%) |
| Installation, Maintenance & Repair | 19 (100.0%) | 0 (0.0%) |
| Total (Category) | 41 (100.0%) | 0 (0.0%) |
| Total (Overall) | 150 (62.2%) | 91 (37.8%) |
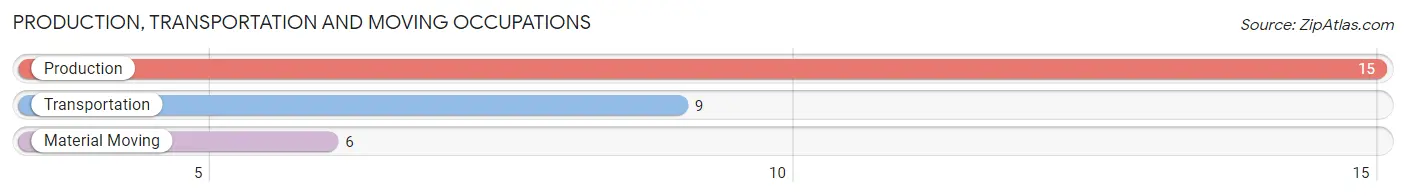
Production, Transportation and Moving Occupations
The most common Production, Transportation and Moving occupations in Silver Creek are Production (15 | 6.2%), Transportation (9 | 3.7%), and Material Moving (6 | 2.5%).
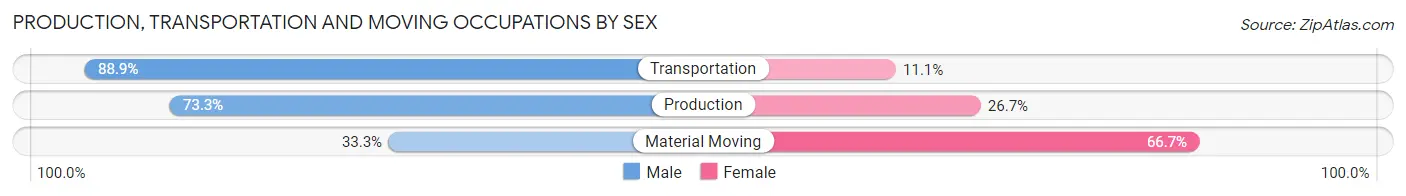
Production, Transportation and Moving Occupations by Sex
| Occupation | Male | Female |
| Production | 11 (73.3%) | 4 (26.7%) |
| Transportation | 8 (88.9%) | 1 (11.1%) |
| Material Moving | 2 (33.3%) | 4 (66.7%) |
| Total (Category) | 21 (70.0%) | 9 (30.0%) |
| Total (Overall) | 150 (62.2%) | 91 (37.8%) |
Employment Industries by Sex in Silver Creek
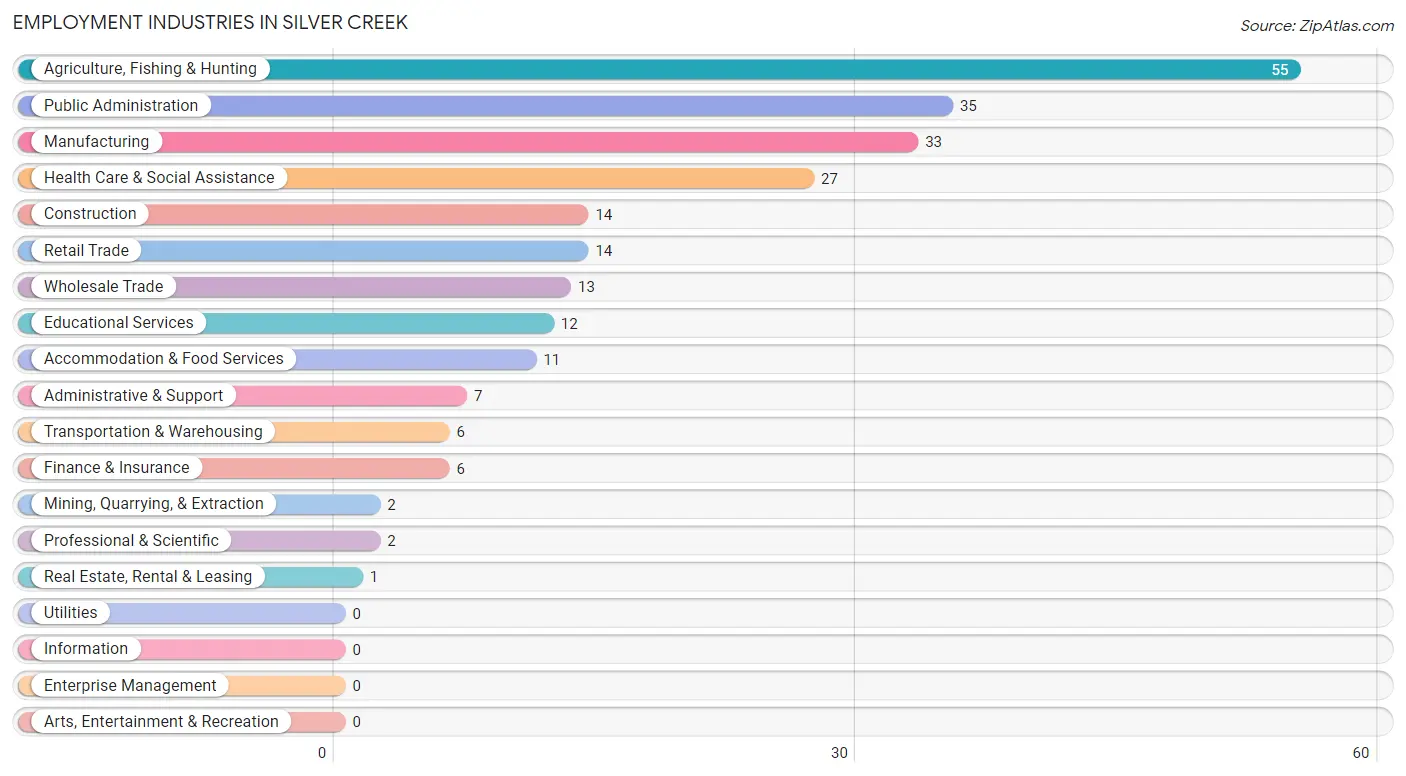
Employment Industries in Silver Creek
The major employment industries in Silver Creek include Agriculture, Fishing & Hunting (55 | 22.8%), Public Administration (35 | 14.5%), Manufacturing (33 | 13.7%), Health Care & Social Assistance (27 | 11.2%), and Construction (14 | 5.8%).
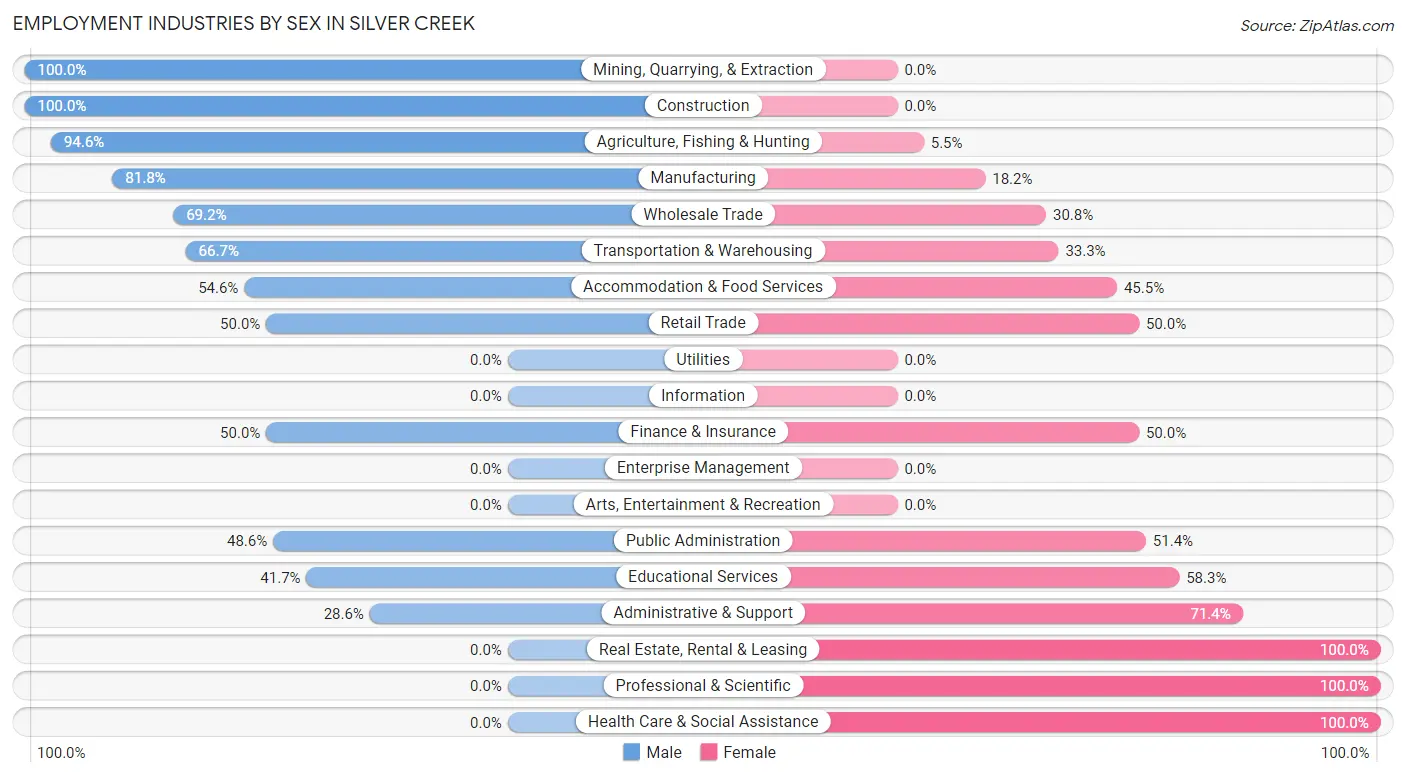
Employment Industries by Sex in Silver Creek
The Silver Creek industries that see more men than women are Mining, Quarrying, & Extraction (100.0%), Construction (100.0%), and Agriculture, Fishing & Hunting (94.6%), whereas the industries that tend to have a higher number of women are Real Estate, Rental & Leasing (100.0%), Professional & Scientific (100.0%), and Health Care & Social Assistance (100.0%).
| Industry | Male | Female |
| Agriculture, Fishing & Hunting | 52 (94.6%) | 3 (5.4%) |
| Mining, Quarrying, & Extraction | 2 (100.0%) | 0 (0.0%) |
| Construction | 14 (100.0%) | 0 (0.0%) |
| Manufacturing | 27 (81.8%) | 6 (18.2%) |
| Wholesale Trade | 9 (69.2%) | 4 (30.8%) |
| Retail Trade | 7 (50.0%) | 7 (50.0%) |
| Transportation & Warehousing | 4 (66.7%) | 2 (33.3%) |
| Utilities | 0 (0.0%) | 0 (0.0%) |
| Information | 0 (0.0%) | 0 (0.0%) |
| Finance & Insurance | 3 (50.0%) | 3 (50.0%) |
| Real Estate, Rental & Leasing | 0 (0.0%) | 1 (100.0%) |
| Professional & Scientific | 0 (0.0%) | 2 (100.0%) |
| Enterprise Management | 0 (0.0%) | 0 (0.0%) |
| Administrative & Support | 2 (28.6%) | 5 (71.4%) |
| Educational Services | 5 (41.7%) | 7 (58.3%) |
| Health Care & Social Assistance | 0 (0.0%) | 27 (100.0%) |
| Arts, Entertainment & Recreation | 0 (0.0%) | 0 (0.0%) |
| Accommodation & Food Services | 6 (54.5%) | 5 (45.5%) |
| Public Administration | 17 (48.6%) | 18 (51.4%) |
| Total | 150 (62.2%) | 91 (37.8%) |
Education in Silver Creek
School Enrollment in Silver Creek
The most common levels of schooling among the 39 students in Silver Creek are high school (15 | 38.5%), middle school (9 | 23.1%), and college / undergraduate (7 | 17.9%).
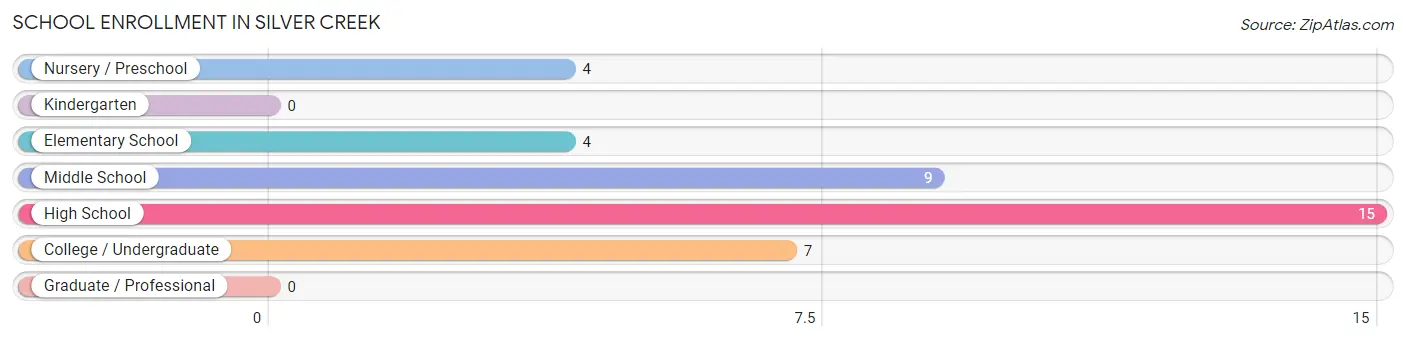
| School Level | # Students | % Students |
| Nursery / Preschool | 4 | 10.3% |
| Kindergarten | 0 | 0.0% |
| Elementary School | 4 | 10.3% |
| Middle School | 9 | 23.1% |
| High School | 15 | 38.5% |
| College / Undergraduate | 7 | 17.9% |
| Graduate / Professional | 0 | 0.0% |
| Total | 39 | 100.0% |
School Enrollment by Age by Funding Source in Silver Creek
Out of a total of 39 students who are enrolled in schools in Silver Creek, 4 (10.3%) attend a private institution, while the remaining 35 (89.7%) are enrolled in public schools. The age group of 20 to 24 year olds has the highest likelihood of being enrolled in private schools, with 2 (100.0% in the age bracket) enrolled. Conversely, the age group of 3 to 4 year olds has the lowest likelihood of being enrolled in a private school, with 3 (100.0% in the age bracket) attending a public institution.
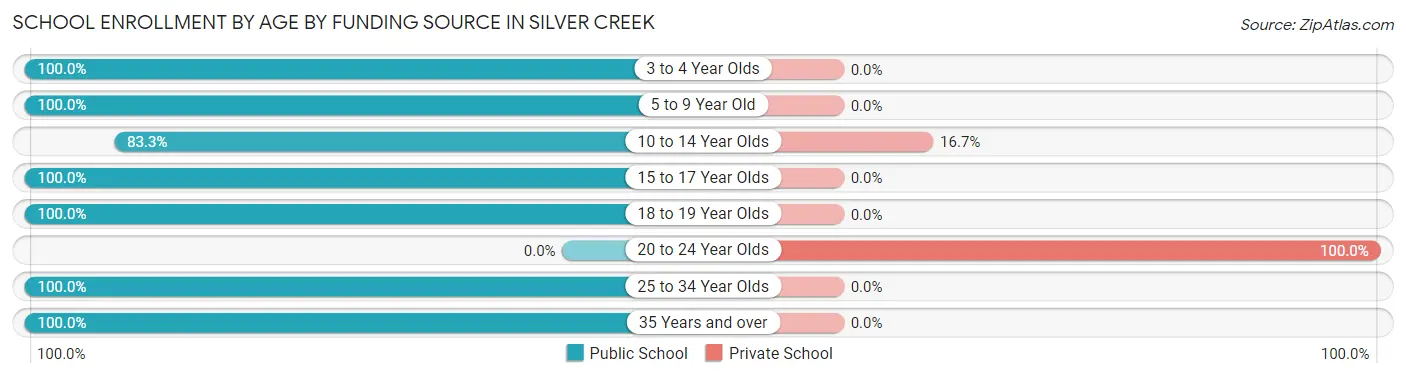
| Age Bracket | Public School | Private School |
| 3 to 4 Year Olds | 3 (100.0%) | 0 (0.0%) |
| 5 to 9 Year Old | 5 (100.0%) | 0 (0.0%) |
| 10 to 14 Year Olds | 10 (83.3%) | 2 (16.7%) |
| 15 to 17 Year Olds | 9 (100.0%) | 0 (0.0%) |
| 18 to 19 Year Olds | 3 (100.0%) | 0 (0.0%) |
| 20 to 24 Year Olds | 0 (0.0%) | 2 (100.0%) |
| 25 to 34 Year Olds | 2 (100.0%) | 0 (0.0%) |
| 35 Years and over | 3 (100.0%) | 0 (0.0%) |
| Total | 35 (89.7%) | 4 (10.3%) |
Educational Attainment by Field of Study in Silver Creek
Business (9 | 34.6%), science & technology (7 | 26.9%), education (6 | 23.1%), computers & mathematics (2 | 7.7%), and literature & languages (1 | 3.8%) are the most common fields of study among 26 individuals in Silver Creek who have obtained a bachelor's degree or higher.
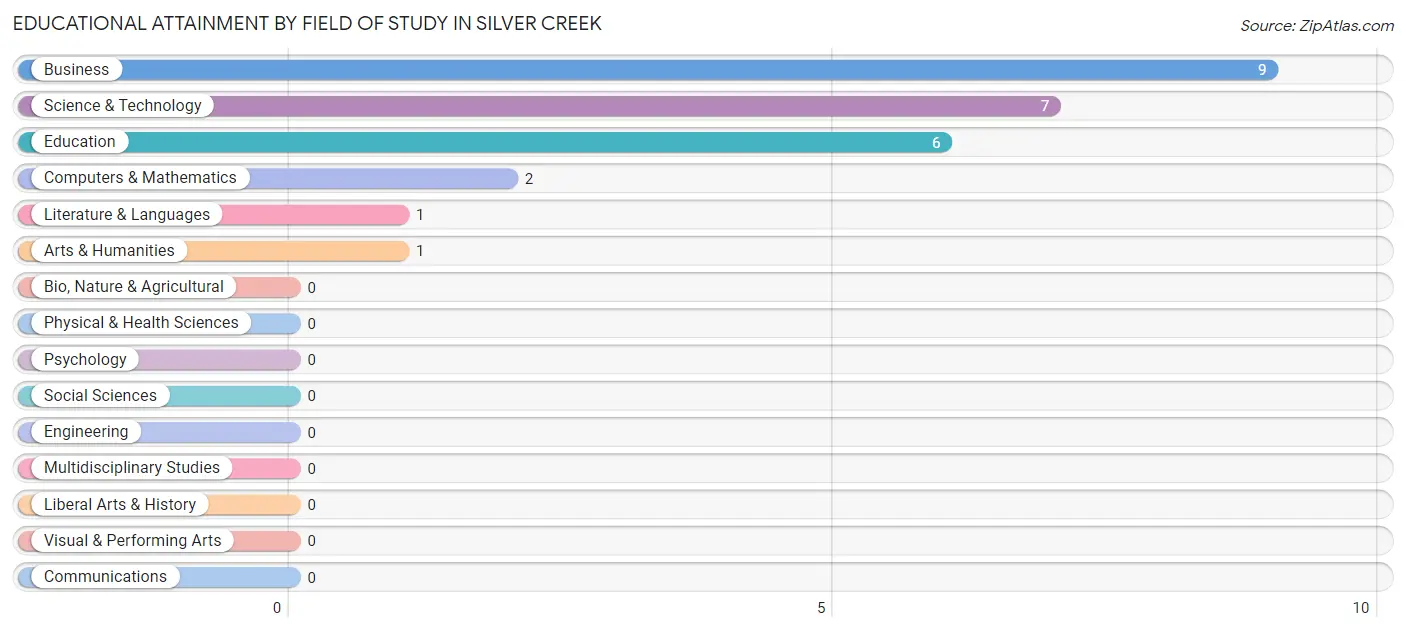
| Field of Study | # Graduates | % Graduates |
| Computers & Mathematics | 2 | 7.7% |
| Bio, Nature & Agricultural | 0 | 0.0% |
| Physical & Health Sciences | 0 | 0.0% |
| Psychology | 0 | 0.0% |
| Social Sciences | 0 | 0.0% |
| Engineering | 0 | 0.0% |
| Multidisciplinary Studies | 0 | 0.0% |
| Science & Technology | 7 | 26.9% |
| Business | 9 | 34.6% |
| Education | 6 | 23.1% |
| Literature & Languages | 1 | 3.8% |
| Liberal Arts & History | 0 | 0.0% |
| Visual & Performing Arts | 0 | 0.0% |
| Communications | 0 | 0.0% |
| Arts & Humanities | 1 | 3.8% |
| Total | 26 | 100.0% |
Transportation & Commute in Silver Creek
Vehicle Availability by Sex in Silver Creek
The most prevalent vehicle ownership categories in Silver Creek are males with 2 vehicles (51, accounting for 34.2%) and females with 2 vehicles (38, making up 56.0%).
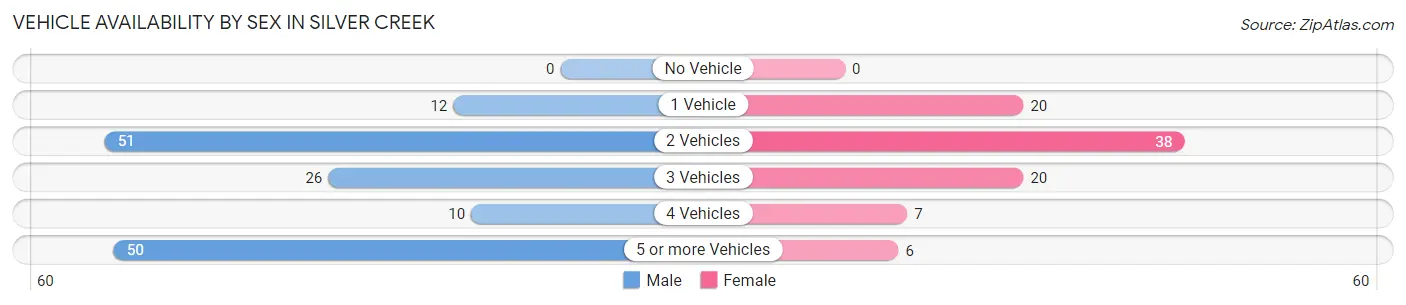
| Vehicles Available | Male | Female |
| No Vehicle | 0 (0.0%) | 0 (0.0%) |
| 1 Vehicle | 12 (8.1%) | 20 (22.0%) |
| 2 Vehicles | 51 (34.2%) | 38 (41.8%) |
| 3 Vehicles | 26 (17.4%) | 20 (22.0%) |
| 4 Vehicles | 10 (6.7%) | 7 (7.7%) |
| 5 or more Vehicles | 50 (33.6%) | 6 (6.6%) |
| Total | 149 (100.0%) | 91 (100.0%) |
Commute Time in Silver Creek
The most frequently occuring commute durations in Silver Creek are 10 to 14 minutes (43 commuters, 18.4%), 30 to 34 minutes (43 commuters, 18.4%), and less than 5 minutes (34 commuters, 14.5%).
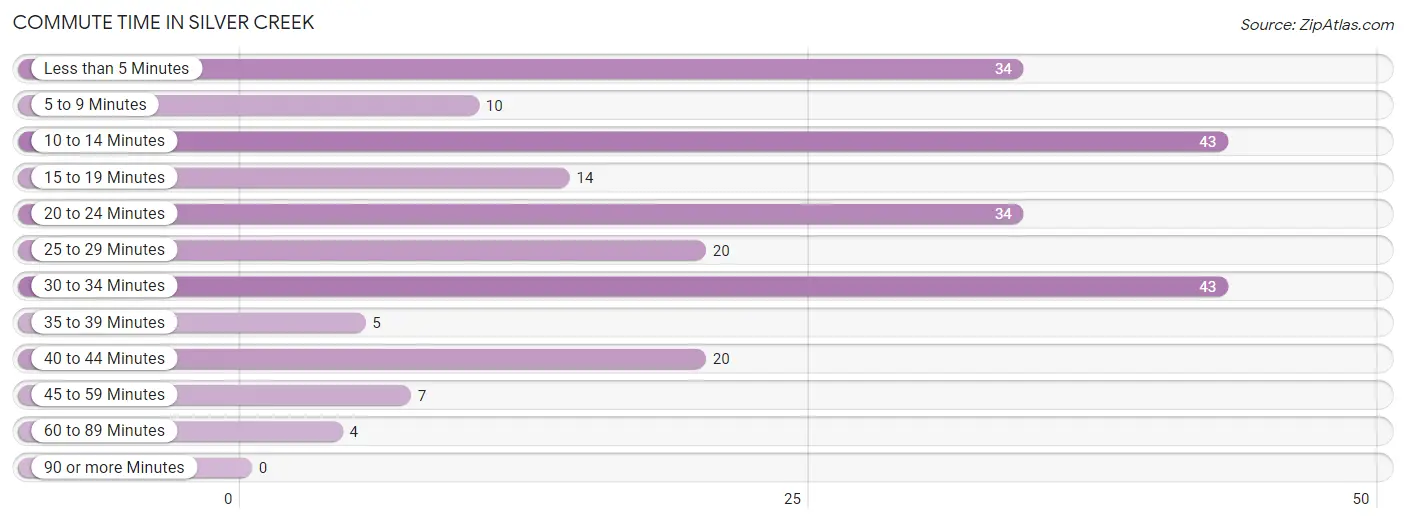
| Commute Time | # Commuters | % Commuters |
| Less than 5 Minutes | 34 | 14.5% |
| 5 to 9 Minutes | 10 | 4.3% |
| 10 to 14 Minutes | 43 | 18.4% |
| 15 to 19 Minutes | 14 | 6.0% |
| 20 to 24 Minutes | 34 | 14.5% |
| 25 to 29 Minutes | 20 | 8.6% |
| 30 to 34 Minutes | 43 | 18.4% |
| 35 to 39 Minutes | 5 | 2.1% |
| 40 to 44 Minutes | 20 | 8.6% |
| 45 to 59 Minutes | 7 | 3.0% |
| 60 to 89 Minutes | 4 | 1.7% |
| 90 or more Minutes | 0 | 0.0% |
Commute Time by Sex in Silver Creek
The most common commute times in Silver Creek are 10 to 14 minutes (37 commuters, 25.0%) for males and 20 to 24 minutes (29 commuters, 33.7%) for females.
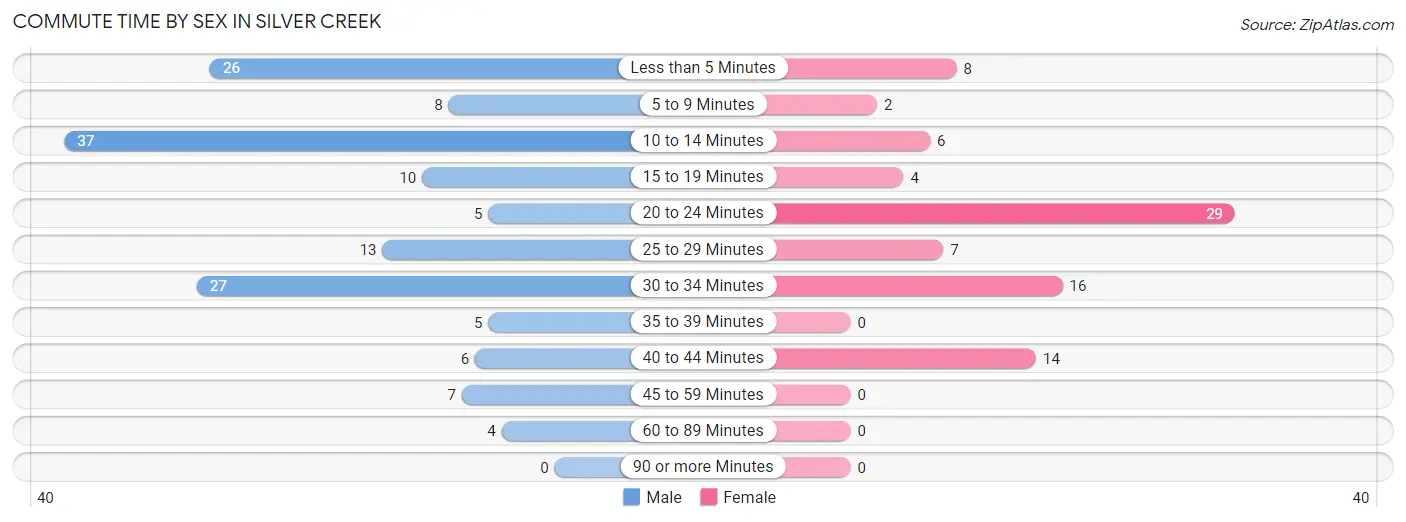
| Commute Time | Male | Female |
| Less than 5 Minutes | 26 (17.6%) | 8 (9.3%) |
| 5 to 9 Minutes | 8 (5.4%) | 2 (2.3%) |
| 10 to 14 Minutes | 37 (25.0%) | 6 (7.0%) |
| 15 to 19 Minutes | 10 (6.8%) | 4 (4.6%) |
| 20 to 24 Minutes | 5 (3.4%) | 29 (33.7%) |
| 25 to 29 Minutes | 13 (8.8%) | 7 (8.1%) |
| 30 to 34 Minutes | 27 (18.2%) | 16 (18.6%) |
| 35 to 39 Minutes | 5 (3.4%) | 0 (0.0%) |
| 40 to 44 Minutes | 6 (4.1%) | 14 (16.3%) |
| 45 to 59 Minutes | 7 (4.7%) | 0 (0.0%) |
| 60 to 89 Minutes | 4 (2.7%) | 0 (0.0%) |
| 90 or more Minutes | 0 (0.0%) | 0 (0.0%) |
Time of Departure to Work by Sex in Silver Creek
The most frequent times of departure to work in Silver Creek are 7:30 AM to 7:59 AM (31, 20.9%) for males and 7:00 AM to 7:29 AM (24, 27.9%) for females.
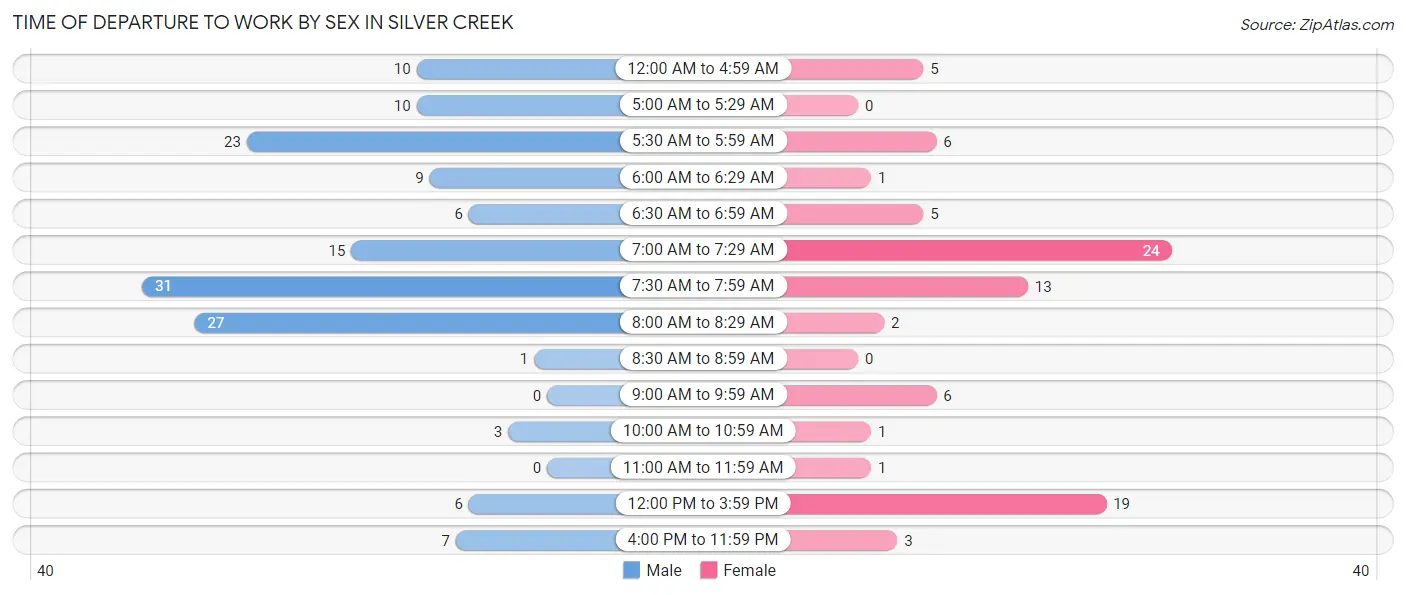
| Time of Departure | Male | Female |
| 12:00 AM to 4:59 AM | 10 (6.8%) | 5 (5.8%) |
| 5:00 AM to 5:29 AM | 10 (6.8%) | 0 (0.0%) |
| 5:30 AM to 5:59 AM | 23 (15.5%) | 6 (7.0%) |
| 6:00 AM to 6:29 AM | 9 (6.1%) | 1 (1.2%) |
| 6:30 AM to 6:59 AM | 6 (4.1%) | 5 (5.8%) |
| 7:00 AM to 7:29 AM | 15 (10.1%) | 24 (27.9%) |
| 7:30 AM to 7:59 AM | 31 (20.9%) | 13 (15.1%) |
| 8:00 AM to 8:29 AM | 27 (18.2%) | 2 (2.3%) |
| 8:30 AM to 8:59 AM | 1 (0.7%) | 0 (0.0%) |
| 9:00 AM to 9:59 AM | 0 (0.0%) | 6 (7.0%) |
| 10:00 AM to 10:59 AM | 3 (2.0%) | 1 (1.2%) |
| 11:00 AM to 11:59 AM | 0 (0.0%) | 1 (1.2%) |
| 12:00 PM to 3:59 PM | 6 (4.1%) | 19 (22.1%) |
| 4:00 PM to 11:59 PM | 7 (4.7%) | 3 (3.5%) |
| Total | 148 (100.0%) | 86 (100.0%) |
Housing Occupancy in Silver Creek
Occupancy by Ownership in Silver Creek
Of the total 205 dwellings in Silver Creek, owner-occupied units account for 160 (78.0%), while renter-occupied units make up 45 (22.0%).
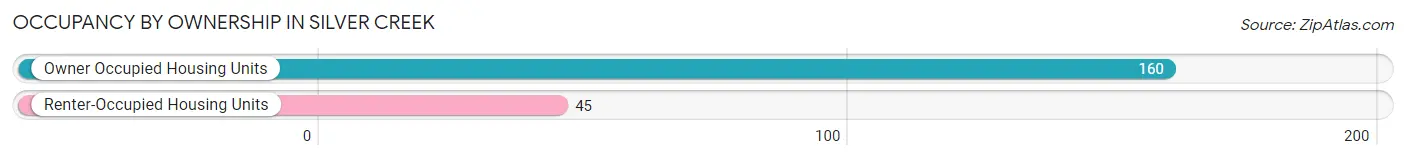
| Occupancy | # Housing Units | % Housing Units |
| Owner Occupied Housing Units | 160 | 78.0% |
| Renter-Occupied Housing Units | 45 | 22.0% |
| Total Occupied Housing Units | 205 | 100.0% |
Occupancy by Household Size in Silver Creek
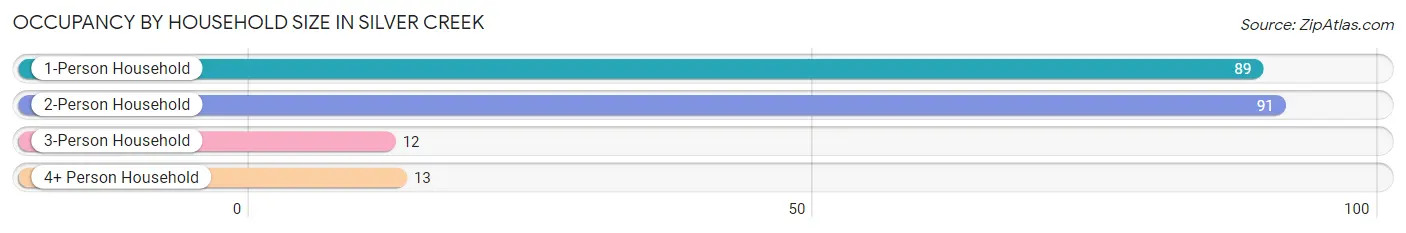
| Household Size | # Housing Units | % Housing Units |
| 1-Person Household | 89 | 43.4% |
| 2-Person Household | 91 | 44.4% |
| 3-Person Household | 12 | 5.9% |
| 4+ Person Household | 13 | 6.3% |
| Total Housing Units | 205 | 100.0% |
Occupancy by Ownership by Household Size in Silver Creek
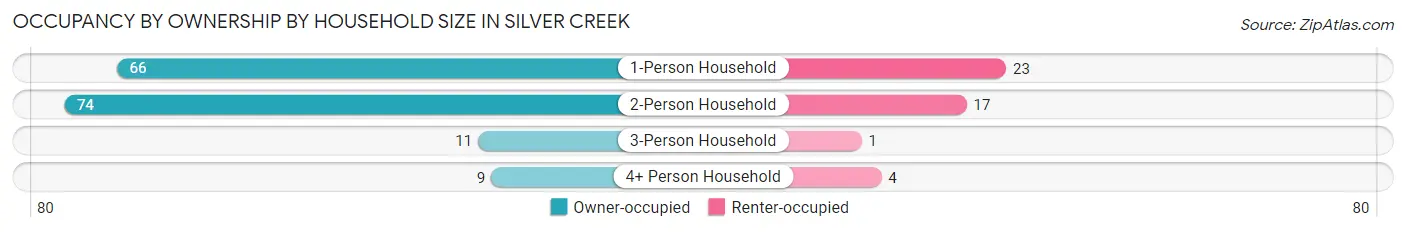
| Household Size | Owner-occupied | Renter-occupied |
| 1-Person Household | 66 (74.2%) | 23 (25.8%) |
| 2-Person Household | 74 (81.3%) | 17 (18.7%) |
| 3-Person Household | 11 (91.7%) | 1 (8.3%) |
| 4+ Person Household | 9 (69.2%) | 4 (30.8%) |
| Total Housing Units | 160 (78.0%) | 45 (22.0%) |
Occupancy by Educational Attainment in Silver Creek
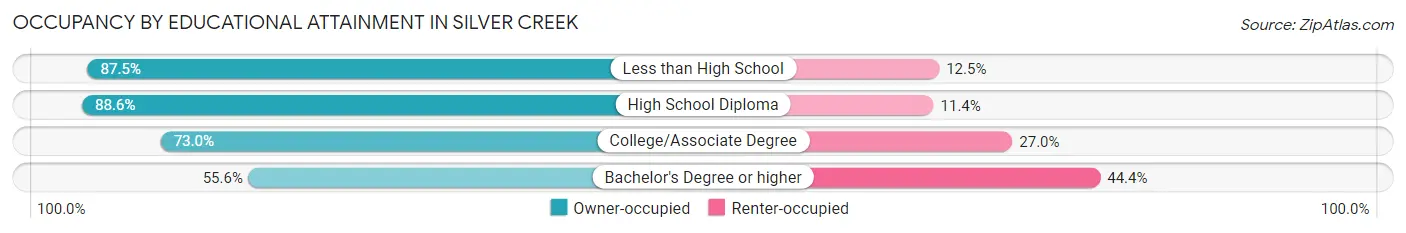
| Household Size | Owner-occupied | Renter-occupied |
| Less than High School | 7 (87.5%) | 1 (12.5%) |
| High School Diploma | 70 (88.6%) | 9 (11.4%) |
| College/Associate Degree | 73 (73.0%) | 27 (27.0%) |
| Bachelor's Degree or higher | 10 (55.6%) | 8 (44.4%) |
Occupancy by Age of Householder in Silver Creek
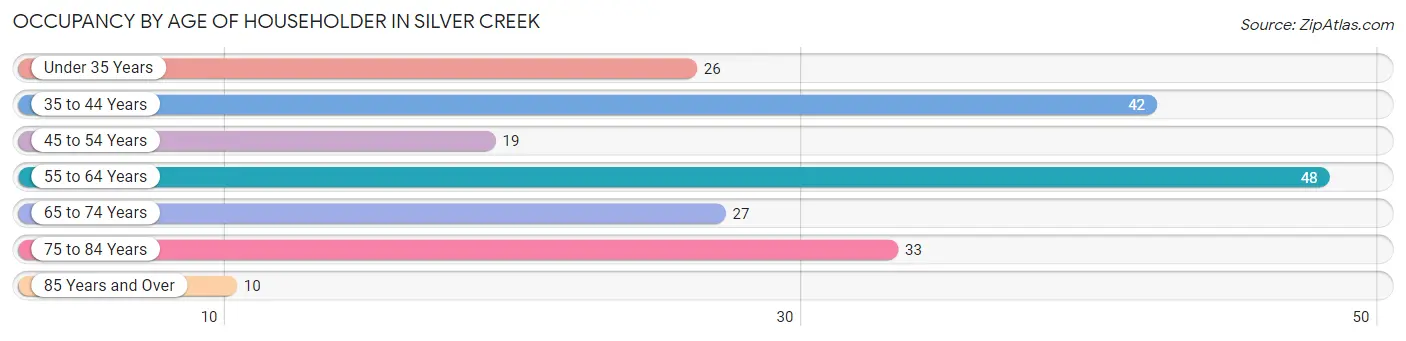
| Age Bracket | # Households | % Households |
| Under 35 Years | 26 | 12.7% |
| 35 to 44 Years | 42 | 20.5% |
| 45 to 54 Years | 19 | 9.3% |
| 55 to 64 Years | 48 | 23.4% |
| 65 to 74 Years | 27 | 13.2% |
| 75 to 84 Years | 33 | 16.1% |
| 85 Years and Over | 10 | 4.9% |
| Total | 205 | 100.0% |
Housing Finances in Silver Creek
Median Income by Occupancy in Silver Creek
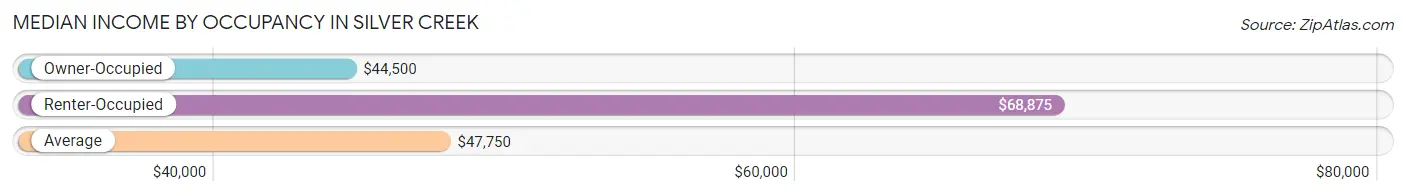
| Occupancy Type | # Households | Median Income |
| Owner-Occupied | 160 (78.0%) | $44,500 |
| Renter-Occupied | 45 (22.0%) | $68,875 |
| Average | 205 (100.0%) | $47,750 |
Occupancy by Householder Income Bracket in Silver Creek
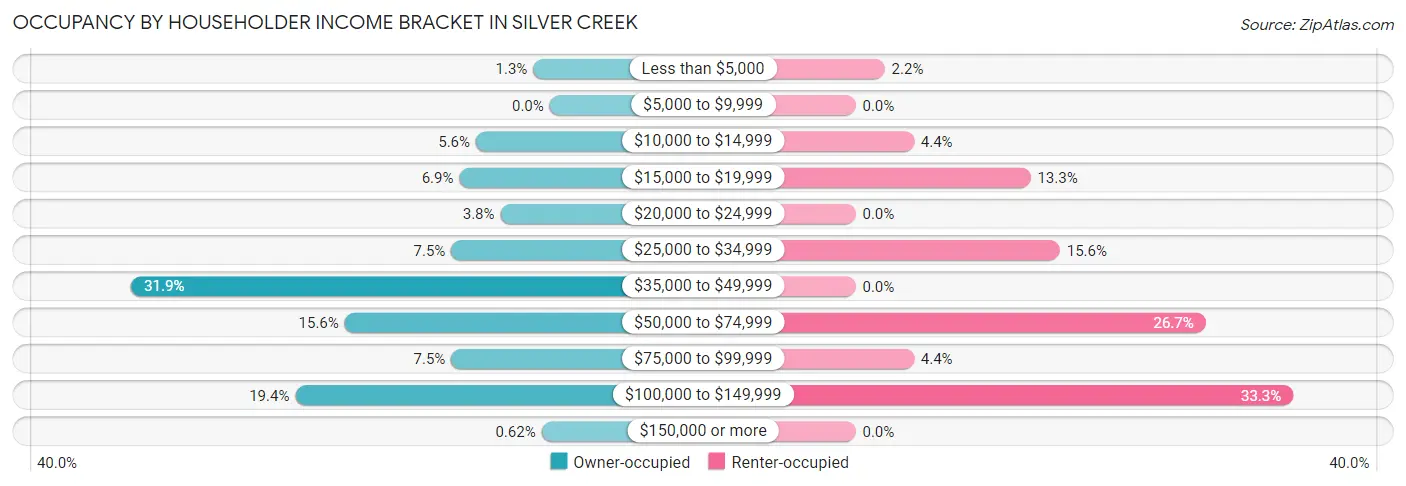
| Income Bracket | Owner-occupied | Renter-occupied |
| Less than $5,000 | 2 (1.3%) | 1 (2.2%) |
| $5,000 to $9,999 | 0 (0.0%) | 0 (0.0%) |
| $10,000 to $14,999 | 9 (5.6%) | 2 (4.4%) |
| $15,000 to $19,999 | 11 (6.9%) | 6 (13.3%) |
| $20,000 to $24,999 | 6 (3.7%) | 0 (0.0%) |
| $25,000 to $34,999 | 12 (7.5%) | 7 (15.6%) |
| $35,000 to $49,999 | 51 (31.9%) | 0 (0.0%) |
| $50,000 to $74,999 | 25 (15.6%) | 12 (26.7%) |
| $75,000 to $99,999 | 12 (7.5%) | 2 (4.4%) |
| $100,000 to $149,999 | 31 (19.4%) | 15 (33.3%) |
| $150,000 or more | 1 (0.6%) | 0 (0.0%) |
| Total | 160 (100.0%) | 45 (100.0%) |
Monthly Housing Cost Tiers in Silver Creek
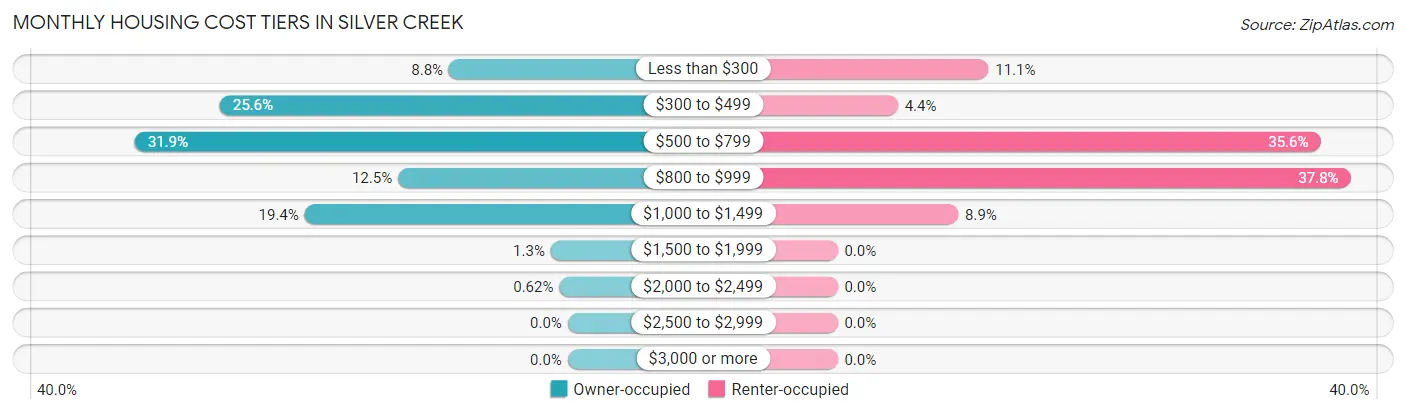
| Monthly Cost | Owner-occupied | Renter-occupied |
| Less than $300 | 14 (8.7%) | 5 (11.1%) |
| $300 to $499 | 41 (25.6%) | 2 (4.4%) |
| $500 to $799 | 51 (31.9%) | 16 (35.6%) |
| $800 to $999 | 20 (12.5%) | 17 (37.8%) |
| $1,000 to $1,499 | 31 (19.4%) | 4 (8.9%) |
| $1,500 to $1,999 | 2 (1.3%) | 0 (0.0%) |
| $2,000 to $2,499 | 1 (0.6%) | 0 (0.0%) |
| $2,500 to $2,999 | 0 (0.0%) | 0 (0.0%) |
| $3,000 or more | 0 (0.0%) | 0 (0.0%) |
| Total | 160 (100.0%) | 45 (100.0%) |
Physical Housing Characteristics in Silver Creek
Housing Structures in Silver Creek
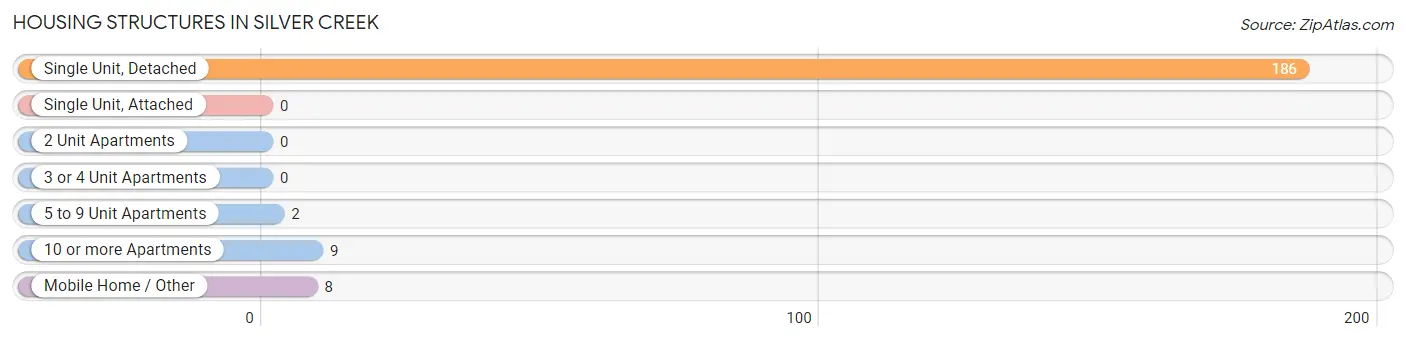
| Structure Type | # Housing Units | % Housing Units |
| Single Unit, Detached | 186 | 90.7% |
| Single Unit, Attached | 0 | 0.0% |
| 2 Unit Apartments | 0 | 0.0% |
| 3 or 4 Unit Apartments | 0 | 0.0% |
| 5 to 9 Unit Apartments | 2 | 1.0% |
| 10 or more Apartments | 9 | 4.4% |
| Mobile Home / Other | 8 | 3.9% |
| Total | 205 | 100.0% |
Housing Structures by Occupancy in Silver Creek
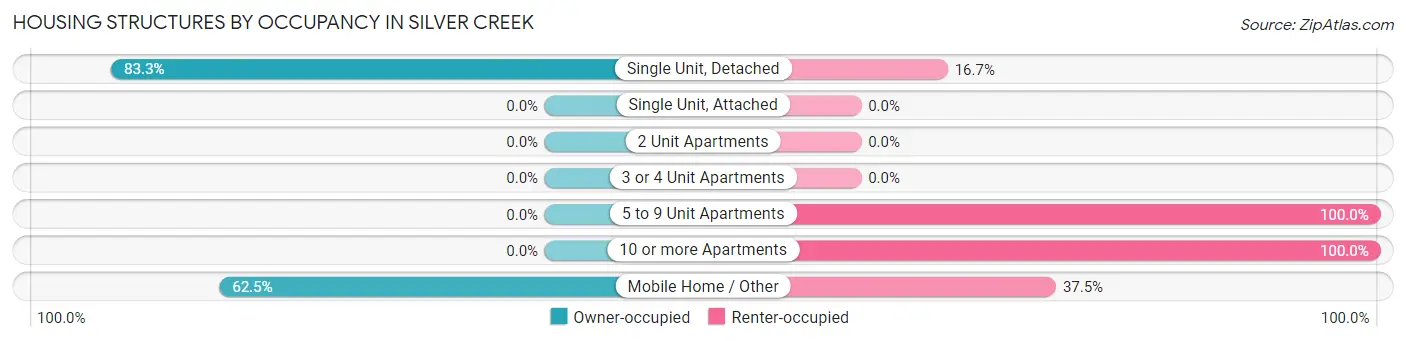
| Structure Type | Owner-occupied | Renter-occupied |
| Single Unit, Detached | 155 (83.3%) | 31 (16.7%) |
| Single Unit, Attached | 0 (0.0%) | 0 (0.0%) |
| 2 Unit Apartments | 0 (0.0%) | 0 (0.0%) |
| 3 or 4 Unit Apartments | 0 (0.0%) | 0 (0.0%) |
| 5 to 9 Unit Apartments | 0 (0.0%) | 2 (100.0%) |
| 10 or more Apartments | 0 (0.0%) | 9 (100.0%) |
| Mobile Home / Other | 5 (62.5%) | 3 (37.5%) |
| Total | 160 (78.0%) | 45 (22.0%) |
Housing Structures by Number of Rooms in Silver Creek
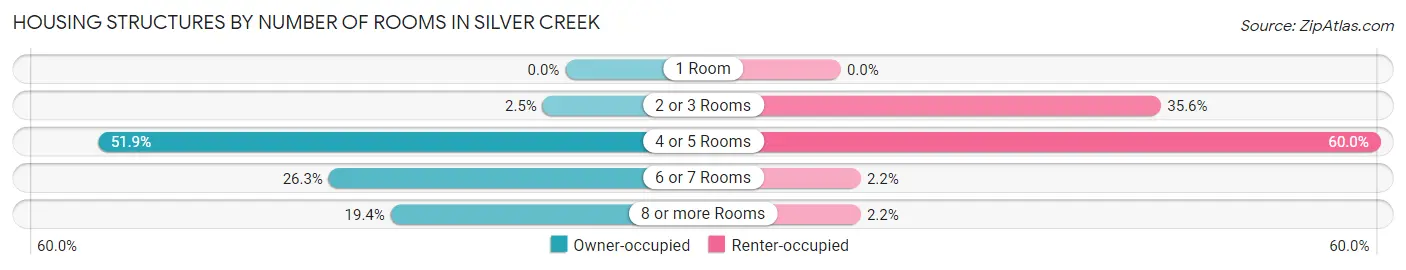
| Number of Rooms | Owner-occupied | Renter-occupied |
| 1 Room | 0 (0.0%) | 0 (0.0%) |
| 2 or 3 Rooms | 4 (2.5%) | 16 (35.6%) |
| 4 or 5 Rooms | 83 (51.9%) | 27 (60.0%) |
| 6 or 7 Rooms | 42 (26.3%) | 1 (2.2%) |
| 8 or more Rooms | 31 (19.4%) | 1 (2.2%) |
| Total | 160 (100.0%) | 45 (100.0%) |
Housing Structure by Heating Type in Silver Creek
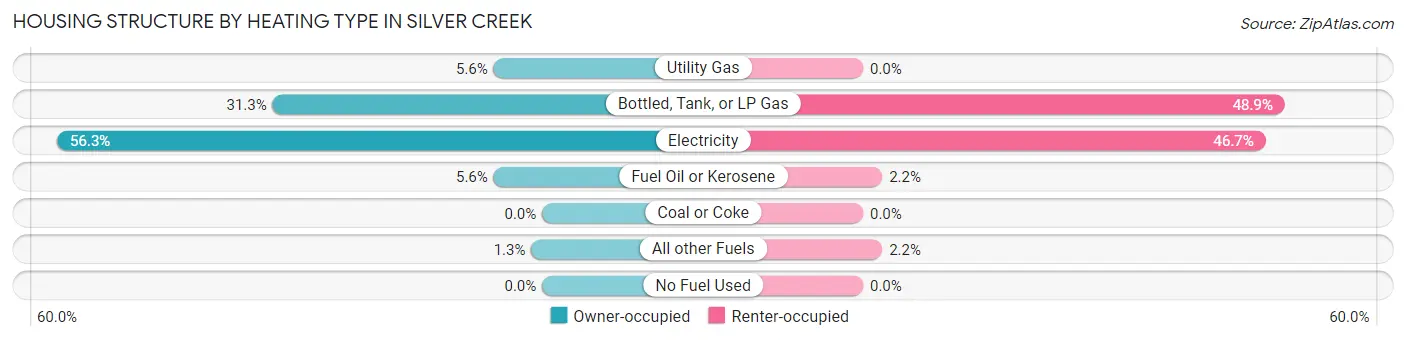
| Heating Type | Owner-occupied | Renter-occupied |
| Utility Gas | 9 (5.6%) | 0 (0.0%) |
| Bottled, Tank, or LP Gas | 50 (31.2%) | 22 (48.9%) |
| Electricity | 90 (56.2%) | 21 (46.7%) |
| Fuel Oil or Kerosene | 9 (5.6%) | 1 (2.2%) |
| Coal or Coke | 0 (0.0%) | 0 (0.0%) |
| All other Fuels | 2 (1.3%) | 1 (2.2%) |
| No Fuel Used | 0 (0.0%) | 0 (0.0%) |
| Total | 160 (100.0%) | 45 (100.0%) |
Household Vehicle Usage in Silver Creek
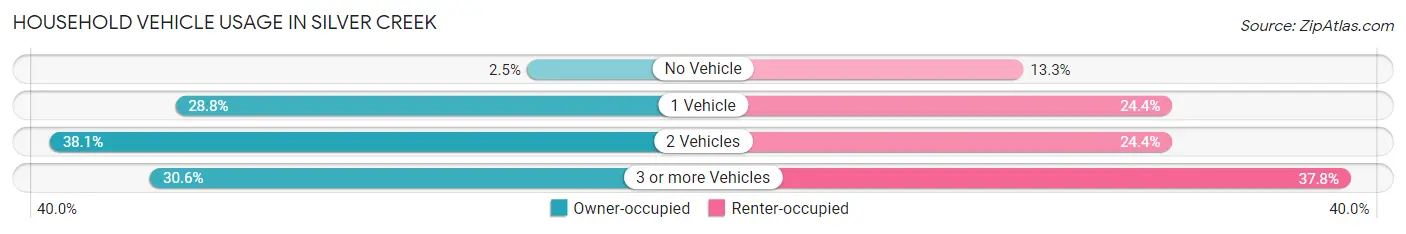
| Vehicles per Household | Owner-occupied | Renter-occupied |
| No Vehicle | 4 (2.5%) | 6 (13.3%) |
| 1 Vehicle | 46 (28.7%) | 11 (24.4%) |
| 2 Vehicles | 61 (38.1%) | 11 (24.4%) |
| 3 or more Vehicles | 49 (30.6%) | 17 (37.8%) |
| Total | 160 (100.0%) | 45 (100.0%) |
Real Estate & Mortgages in Silver Creek
Real Estate and Mortgage Overview in Silver Creek
| Characteristic | Without Mortgage | With Mortgage |
| Housing Units | 80 | 80 |
| Median Property Value | $68,900 | $91,800 |
| Median Household Income | $40,833 | $1 |
| Monthly Housing Costs | $412 | $0 |
| Real Estate Taxes | $1,042 | $0 |
Property Value by Mortgage Status in Silver Creek
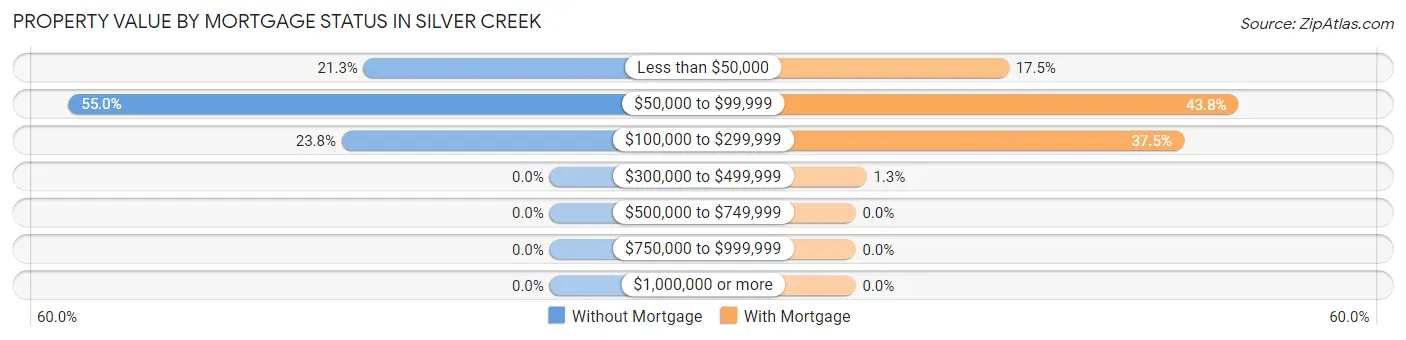
| Property Value | Without Mortgage | With Mortgage |
| Less than $50,000 | 17 (21.2%) | 14 (17.5%) |
| $50,000 to $99,999 | 44 (55.0%) | 35 (43.8%) |
| $100,000 to $299,999 | 19 (23.7%) | 30 (37.5%) |
| $300,000 to $499,999 | 0 (0.0%) | 1 (1.3%) |
| $500,000 to $749,999 | 0 (0.0%) | 0 (0.0%) |
| $750,000 to $999,999 | 0 (0.0%) | 0 (0.0%) |
| $1,000,000 or more | 0 (0.0%) | 0 (0.0%) |
| Total | 80 (100.0%) | 80 (100.0%) |
Household Income by Mortgage Status in Silver Creek
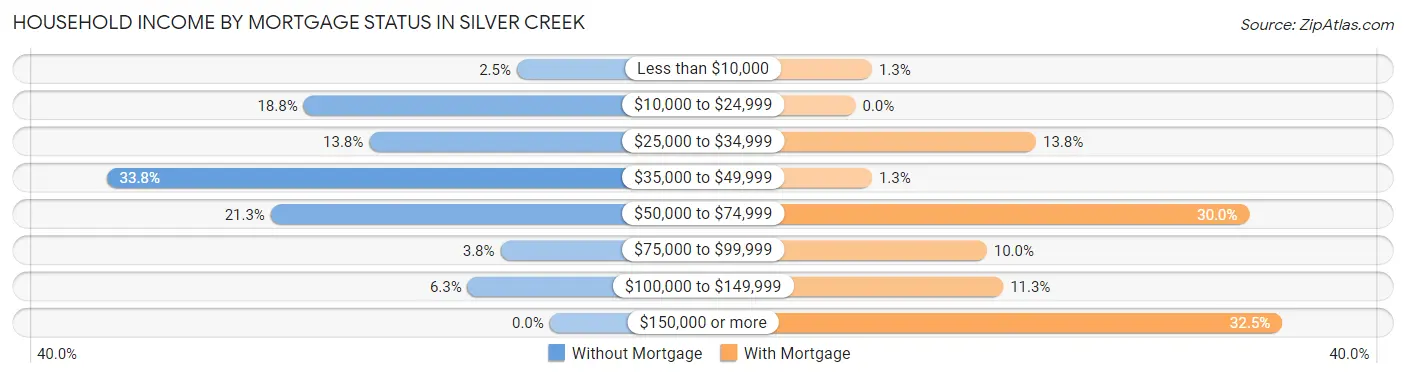
| Household Income | Without Mortgage | With Mortgage |
| Less than $10,000 | 2 (2.5%) | 1 (1.3%) |
| $10,000 to $24,999 | 15 (18.8%) | 0 (0.0%) |
| $25,000 to $34,999 | 11 (13.8%) | 11 (13.8%) |
| $35,000 to $49,999 | 27 (33.8%) | 1 (1.3%) |
| $50,000 to $74,999 | 17 (21.2%) | 24 (30.0%) |
| $75,000 to $99,999 | 3 (3.7%) | 8 (10.0%) |
| $100,000 to $149,999 | 5 (6.2%) | 9 (11.3%) |
| $150,000 or more | 0 (0.0%) | 26 (32.5%) |
| Total | 80 (100.0%) | 80 (100.0%) |
Property Value to Household Income Ratio in Silver Creek
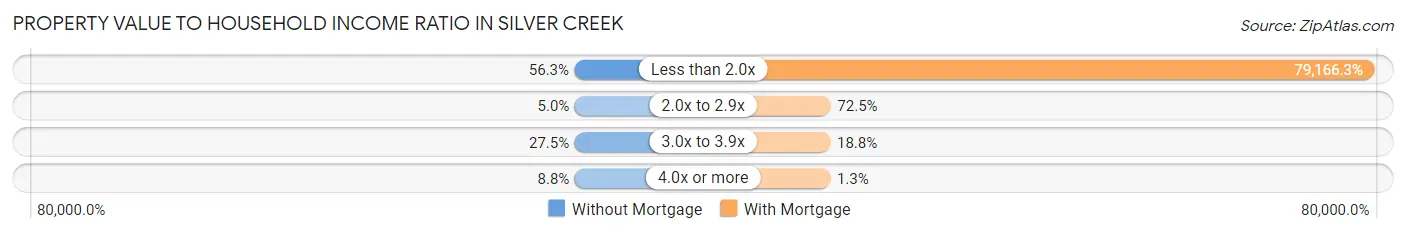
| Value-to-Income Ratio | Without Mortgage | With Mortgage |
| Less than 2.0x | 45 (56.2%) | 63,333 (79,166.3%) |
| 2.0x to 2.9x | 4 (5.0%) | 58 (72.5%) |
| 3.0x to 3.9x | 22 (27.5%) | 15 (18.8%) |
| 4.0x or more | 7 (8.7%) | 1 (1.3%) |
| Total | 80 (100.0%) | 80 (100.0%) |
Real Estate Taxes by Mortgage Status in Silver Creek
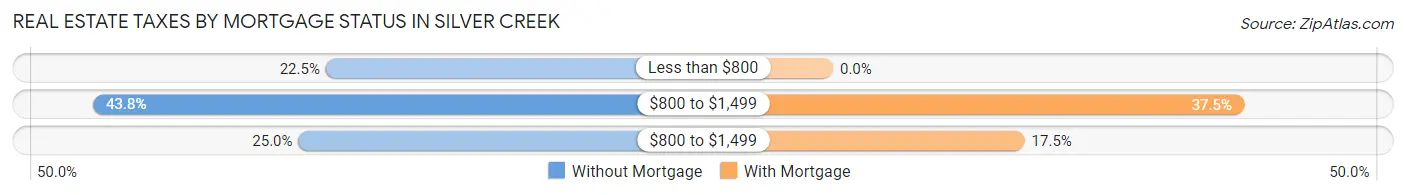
| Property Taxes | Without Mortgage | With Mortgage |
| Less than $800 | 18 (22.5%) | 0 (0.0%) |
| $800 to $1,499 | 35 (43.8%) | 30 (37.5%) |
| $800 to $1,499 | 20 (25.0%) | 14 (17.5%) |
| Total | 80 (100.0%) | 80 (100.0%) |
Health & Disability in Silver Creek
Health Insurance Coverage by Age in Silver Creek
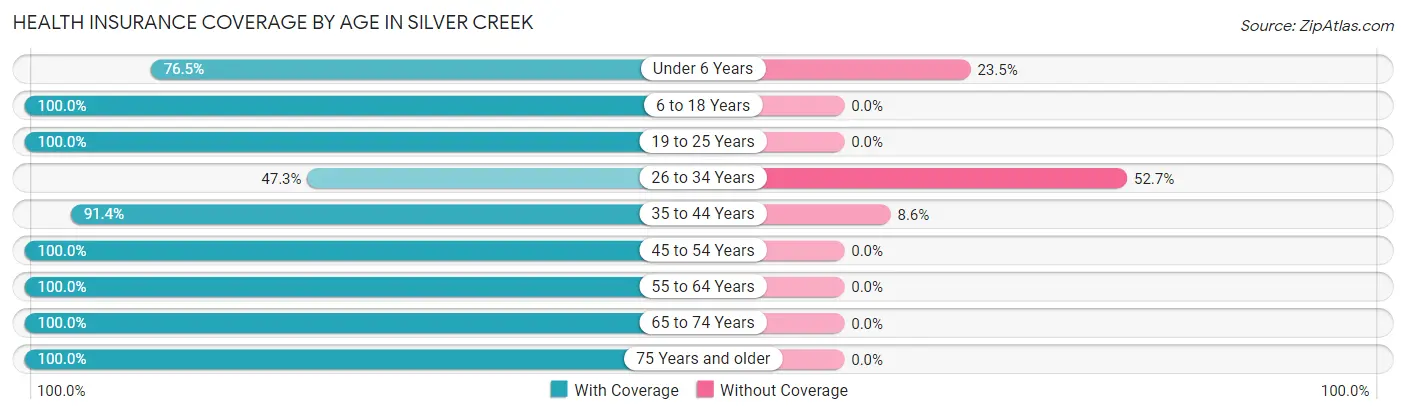
| Age Bracket | With Coverage | Without Coverage |
| Under 6 Years | 13 (76.5%) | 4 (23.5%) |
| 6 to 18 Years | 28 (100.0%) | 0 (0.0%) |
| 19 to 25 Years | 13 (100.0%) | 0 (0.0%) |
| 26 to 34 Years | 26 (47.3%) | 29 (52.7%) |
| 35 to 44 Years | 53 (91.4%) | 5 (8.6%) |
| 45 to 54 Years | 41 (100.0%) | 0 (0.0%) |
| 55 to 64 Years | 77 (100.0%) | 0 (0.0%) |
| 65 to 74 Years | 39 (100.0%) | 0 (0.0%) |
| 75 Years and older | 56 (100.0%) | 0 (0.0%) |
| Total | 346 (90.1%) | 38 (9.9%) |
Health Insurance Coverage by Citizenship Status in Silver Creek
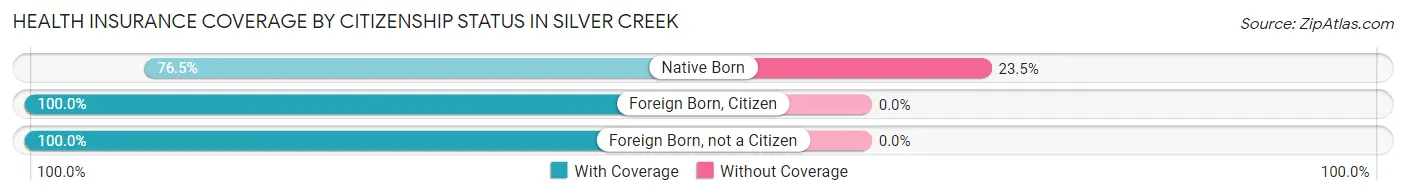
| Citizenship Status | With Coverage | Without Coverage |
| Native Born | 13 (76.5%) | 4 (23.5%) |
| Foreign Born, Citizen | 28 (100.0%) | 0 (0.0%) |
| Foreign Born, not a Citizen | 13 (100.0%) | 0 (0.0%) |
Health Insurance Coverage by Household Income in Silver Creek
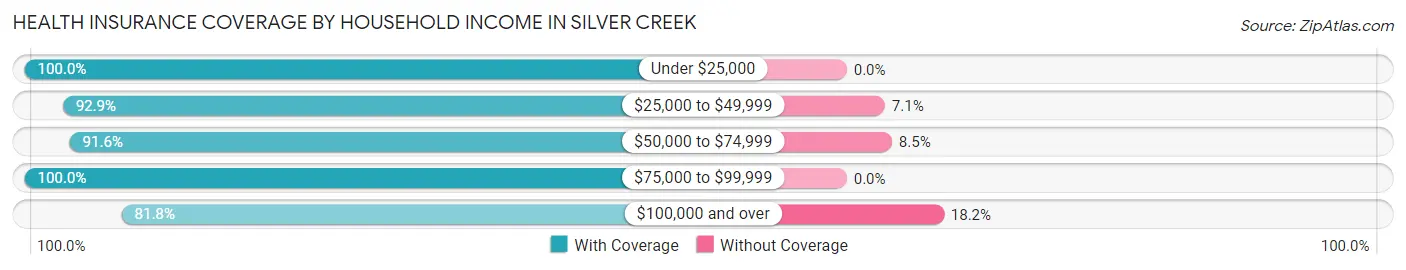
| Household Income | With Coverage | Without Coverage |
| Under $25,000 | 37 (100.0%) | 0 (0.0%) |
| $25,000 to $49,999 | 104 (92.9%) | 8 (7.1%) |
| $50,000 to $74,999 | 65 (91.5%) | 6 (8.5%) |
| $75,000 to $99,999 | 32 (100.0%) | 0 (0.0%) |
| $100,000 and over | 108 (81.8%) | 24 (18.2%) |
Public vs Private Health Insurance Coverage by Age in Silver Creek
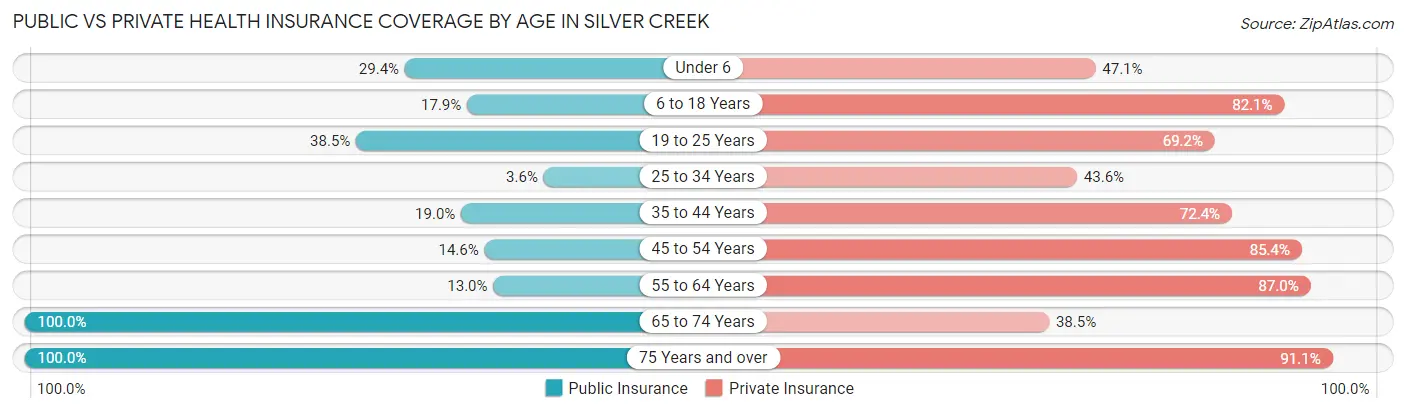
| Age Bracket | Public Insurance | Private Insurance |
| Under 6 | 5 (29.4%) | 8 (47.1%) |
| 6 to 18 Years | 5 (17.9%) | 23 (82.1%) |
| 19 to 25 Years | 5 (38.5%) | 9 (69.2%) |
| 25 to 34 Years | 2 (3.6%) | 24 (43.6%) |
| 35 to 44 Years | 11 (19.0%) | 42 (72.4%) |
| 45 to 54 Years | 6 (14.6%) | 35 (85.4%) |
| 55 to 64 Years | 10 (13.0%) | 67 (87.0%) |
| 65 to 74 Years | 39 (100.0%) | 15 (38.5%) |
| 75 Years and over | 56 (100.0%) | 51 (91.1%) |
| Total | 139 (36.2%) | 274 (71.4%) |
Disability Status by Sex by Age in Silver Creek
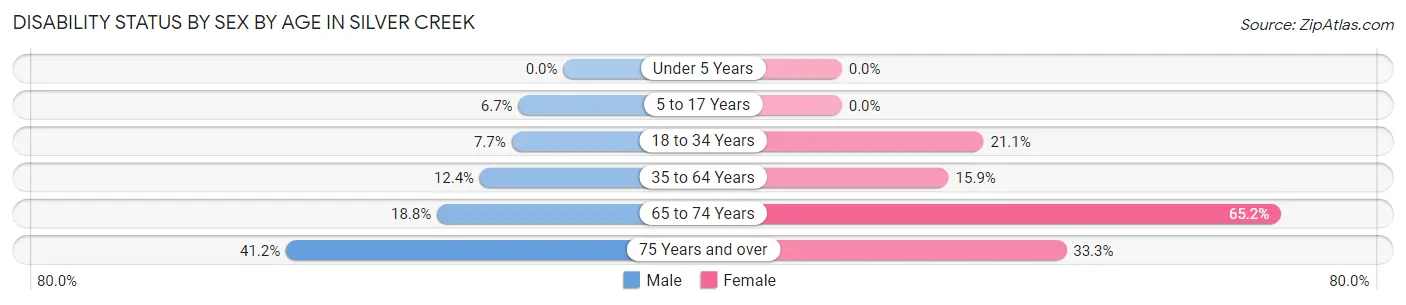
| Age Bracket | Male | Female |
| Under 5 Years | 0 (0.0%) | 0 (0.0%) |
| 5 to 17 Years | 1 (6.7%) | 0 (0.0%) |
| 18 to 34 Years | 4 (7.7%) | 4 (21.0%) |
| 35 to 64 Years | 14 (12.4%) | 10 (15.9%) |
| 65 to 74 Years | 3 (18.8%) | 15 (65.2%) |
| 75 Years and over | 7 (41.2%) | 13 (33.3%) |
Disability Class by Sex by Age in Silver Creek
Disability Class: Hearing Difficulty
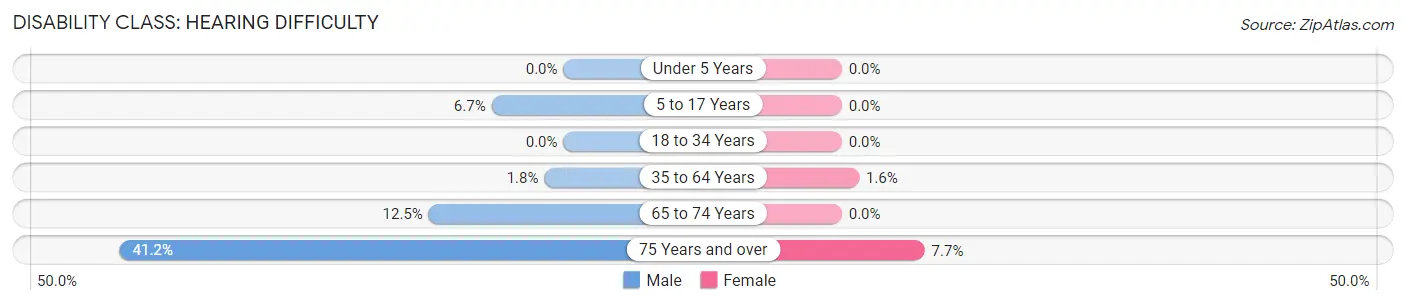
| Age Bracket | Male | Female |
| Under 5 Years | 0 (0.0%) | 0 (0.0%) |
| 5 to 17 Years | 1 (6.7%) | 0 (0.0%) |
| 18 to 34 Years | 0 (0.0%) | 0 (0.0%) |
| 35 to 64 Years | 2 (1.8%) | 1 (1.6%) |
| 65 to 74 Years | 2 (12.5%) | 0 (0.0%) |
| 75 Years and over | 7 (41.2%) | 3 (7.7%) |
Disability Class: Vision Difficulty
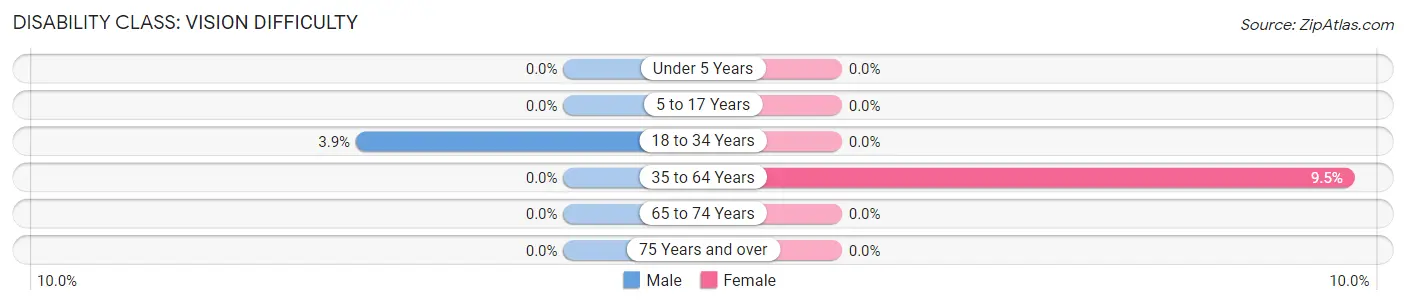
| Age Bracket | Male | Female |
| Under 5 Years | 0 (0.0%) | 0 (0.0%) |
| 5 to 17 Years | 0 (0.0%) | 0 (0.0%) |
| 18 to 34 Years | 2 (3.8%) | 0 (0.0%) |
| 35 to 64 Years | 0 (0.0%) | 6 (9.5%) |
| 65 to 74 Years | 0 (0.0%) | 0 (0.0%) |
| 75 Years and over | 0 (0.0%) | 0 (0.0%) |
Disability Class: Cognitive Difficulty
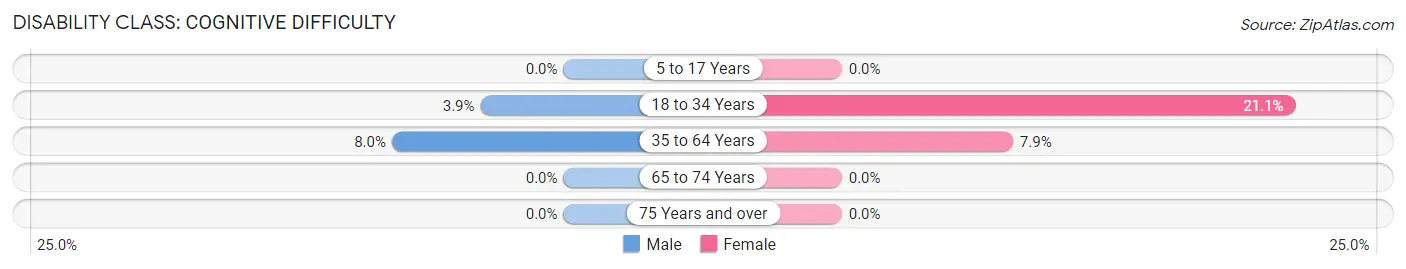
| Age Bracket | Male | Female |
| 5 to 17 Years | 0 (0.0%) | 0 (0.0%) |
| 18 to 34 Years | 2 (3.8%) | 4 (21.0%) |
| 35 to 64 Years | 9 (8.0%) | 5 (7.9%) |
| 65 to 74 Years | 0 (0.0%) | 0 (0.0%) |
| 75 Years and over | 0 (0.0%) | 0 (0.0%) |
Disability Class: Ambulatory Difficulty
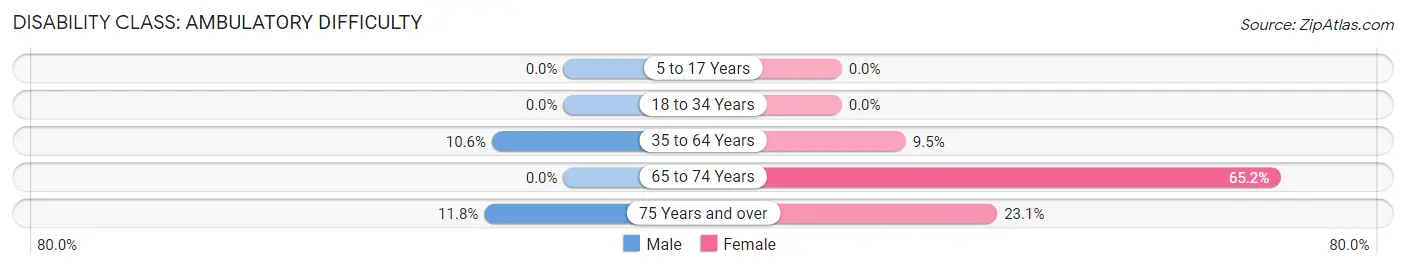
| Age Bracket | Male | Female |
| 5 to 17 Years | 0 (0.0%) | 0 (0.0%) |
| 18 to 34 Years | 0 (0.0%) | 0 (0.0%) |
| 35 to 64 Years | 12 (10.6%) | 6 (9.5%) |
| 65 to 74 Years | 0 (0.0%) | 15 (65.2%) |
| 75 Years and over | 2 (11.8%) | 9 (23.1%) |
Disability Class: Self-Care Difficulty
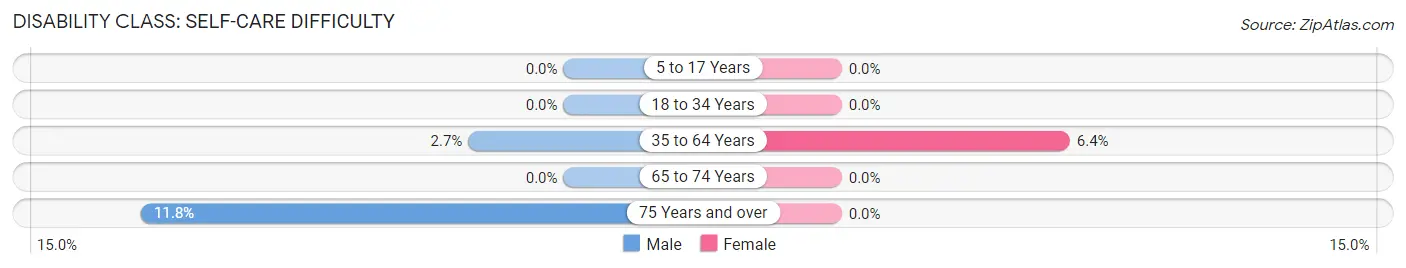
| Age Bracket | Male | Female |
| 5 to 17 Years | 0 (0.0%) | 0 (0.0%) |
| 18 to 34 Years | 0 (0.0%) | 0 (0.0%) |
| 35 to 64 Years | 3 (2.6%) | 4 (6.4%) |
| 65 to 74 Years | 0 (0.0%) | 0 (0.0%) |
| 75 Years and over | 2 (11.8%) | 0 (0.0%) |
Technology Access in Silver Creek
Computing Device Access in Silver Creek
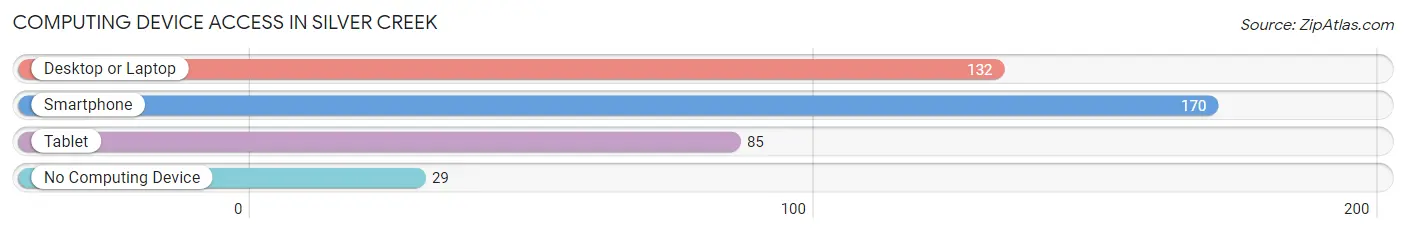
| Device Type | # Households | % Households |
| Desktop or Laptop | 132 | 64.4% |
| Smartphone | 170 | 82.9% |
| Tablet | 85 | 41.5% |
| No Computing Device | 29 | 14.1% |
| Total | 205 | 100.0% |
Internet Access in Silver Creek
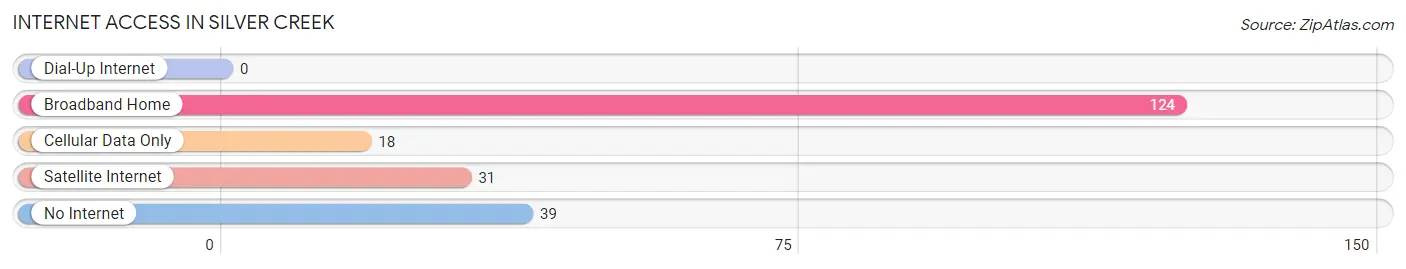
| Internet Type | # Households | % Households |
| Dial-Up Internet | 0 | 0.0% |
| Broadband Home | 124 | 60.5% |
| Cellular Data Only | 18 | 8.8% |
| Satellite Internet | 31 | 15.1% |
| No Internet | 39 | 19.0% |
| Total | 205 | 100.0% |
Silver Creek Summary
Introduction
Silver Creek is a small village located in the state of Nebraska, United States. It is situated in the southeastern corner of the state, near the border with Iowa. The village is part of the Omaha-Council Bluffs metropolitan area and is located in Saunders County. Silver Creek has a population of approximately 1,000 people and is a rural community with a strong agricultural heritage.
History
Silver Creek was founded in 1856 by a group of settlers from Ohio. The village was named after a nearby creek, which was named for the silver-colored sand that was found along its banks. The settlers were attracted to the area due to its fertile soil and abundant natural resources.
The village grew slowly over the years, and by the early 1900s, it had become a thriving agricultural community. The village was home to several businesses, including a general store, a blacksmith shop, and a post office.
In the late 1950s, the village began to experience a decline in population as many of its residents moved away in search of better economic opportunities. This trend continued until the late 1980s, when the village began to experience a resurgence in population growth.
Geography
Silver Creek is located in the southeastern corner of Nebraska, near the border with Iowa. The village is situated in Saunders County, which is part of the Omaha-Council Bluffs metropolitan area. The village is located on the banks of the Platte River, which is a major tributary of the Missouri River.
The village is surrounded by rolling hills and farmland, and is located in the heart of the Great Plains. The climate in Silver Creek is characterized by hot summers and cold winters, with an average annual temperature of 54 degrees Fahrenheit.
Economy
The economy of Silver Creek is largely based on agriculture. The village is home to several farms, which produce a variety of crops, including corn, soybeans, and wheat. The village also has a small manufacturing sector, which produces a variety of products, including furniture and clothing.
The village is also home to several small businesses, including restaurants, retail stores, and service providers. The village is served by a small airport, which provides access to the Omaha-Council Bluffs metropolitan area.
Demographics
As of the 2010 census, the population of Silver Creek was 1,000 people. The village is predominantly white, with a small Hispanic population. The median household income in the village is $45,000, and the median age is 37 years.
Conclusion
Silver Creek is a small village located in the state of Nebraska, United States. It is situated in the southeastern corner of the state, near the border with Iowa. The village is part of the Omaha-Council Bluffs metropolitan area and is located in Saunders County. Silver Creek has a population of approximately 1,000 people and is a rural community with a strong agricultural heritage. The economy of Silver Creek is largely based on agriculture, and the village is home to several small businesses. The village is predominantly white, with a small Hispanic population.
Common Questions
What is Per Capita Income in Silver Creek?
Per Capita income in Silver Creek is $33,721.
What is the Median Family Income in Silver Creek?
Median Family Income in Silver Creek is $65,625.
What is the Median Household income in Silver Creek?
Median Household Income in Silver Creek is $47,750.
What is Income or Wage Gap in Silver Creek?
Income or Wage Gap in Silver Creek is 28.6%.
Women in Silver Creek earn 71.4 cents for every dollar earned by a man.
What is Inequality or Gini Index in Silver Creek?
Inequality or Gini Index in Silver Creek is 0.36.
What is the Total Population of Silver Creek?
Total Population of Silver Creek is 384.
What is the Total Male Population of Silver Creek?
Total Male Population of Silver Creek is 221.
What is the Total Female Population of Silver Creek?
Total Female Population of Silver Creek is 163.
What is the Ratio of Males per 100 Females in Silver Creek?
There are 135.58 Males per 100 Females in Silver Creek.
What is the Ratio of Females per 100 Males in Silver Creek?
There are 73.76 Females per 100 Males in Silver Creek.
What is the Median Population Age in Silver Creek?
Median Population Age in Silver Creek is 51.0 Years.
What is the Average Family Size in Silver Creek
Average Family Size in Silver Creek is 2.4 People.
What is the Average Household Size in Silver Creek
Average Household Size in Silver Creek is 1.9 People.
How Large is the Labor Force in Silver Creek?
There are 241 People in the Labor Forcein in Silver Creek.
What is the Percentage of People in the Labor Force in Silver Creek?
69.9% of People are in the Labor Force in Silver Creek.