Scribner, NE Map & Demographics
Scribner Map
Scribner Overview
$29,918
PER CAPITA INCOME
$75,547
AVG FAMILY INCOME
$53,478
AVG HOUSEHOLD INCOME
11.6%
WAGE / INCOME GAP [ % ]
88.4¢/ $1
WAGE / INCOME GAP [ $ ]
$9,329
FAMILY INCOME DEFICIT
0.40
INEQUALITY / GINI INDEX
779
TOTAL POPULATION
424
MALE POPULATION
355
FEMALE POPULATION
119.44
MALES / 100 FEMALES
83.73
FEMALES / 100 MALES
43.1
MEDIAN AGE
3.1
AVG FAMILY SIZE
2.3
AVG HOUSEHOLD SIZE
364
LABOR FORCE [ PEOPLE ]
57.4%
PERCENT IN LABOR FORCE
2.2%
UNEMPLOYMENT RATE
Scribner Zip Codes
Scribner Area Codes
Income in Scribner
Income Overview in Scribner
Per Capita Income in Scribner is $29,918, while median incomes of families and households are $75,547 and $53,478 respectively.
| Characteristic | Number | Measure |
| Per Capita Income | 779 | $29,918 |
| Median Family Income | 181 | $75,547 |
| Mean Family Income | 181 | $83,674 |
| Median Household Income | 324 | $53,478 |
| Mean Household Income | 324 | $70,620 |
| Income Deficit | 181 | $9,329 |
| Wage / Income Gap (%) | 779 | 11.63% |
| Wage / Income Gap ($) | 779 | 88.37¢ per $1 |
| Gini / Inequality Index | 779 | 0.40 |
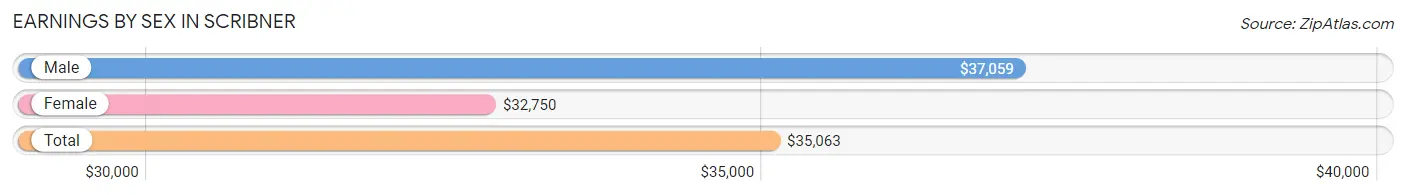
Earnings by Sex in Scribner
Average Earnings in Scribner are $35,063, $37,059 for men and $32,750 for women, a difference of 11.6%.
| Sex | Number | Average Earnings |
| Male | 240 (58.1%) | $37,059 |
| Female | 173 (41.9%) | $32,750 |
| Total | 413 (100.0%) | $35,063 |
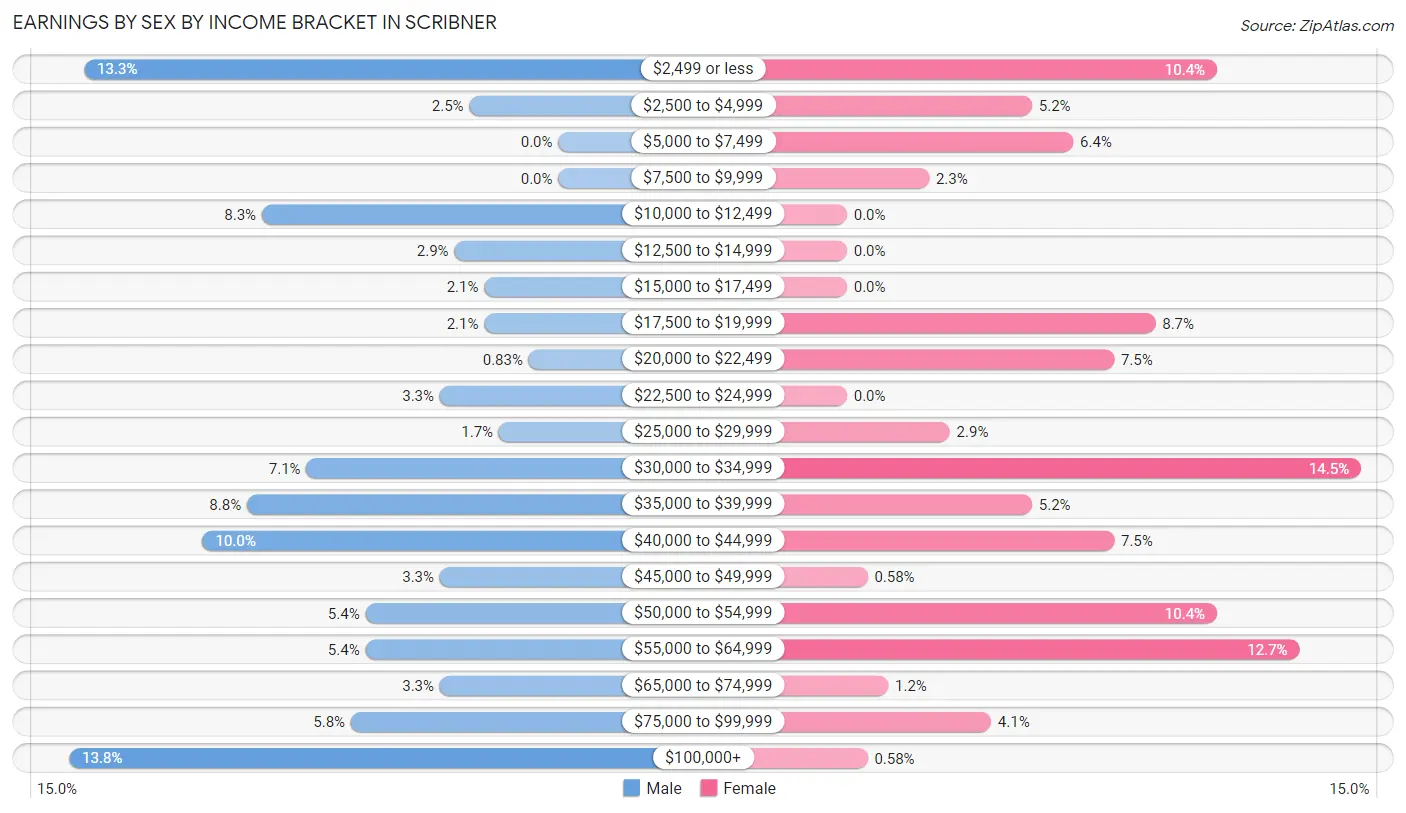
Earnings by Sex by Income Bracket in Scribner
The most common earnings brackets in Scribner are $100,000+ for men (33 | 13.8%) and $30,000 to $34,999 for women (25 | 14.4%).
| Income | Male | Female |
| $2,499 or less | 32 (13.3%) | 18 (10.4%) |
| $2,500 to $4,999 | 6 (2.5%) | 9 (5.2%) |
| $5,000 to $7,499 | 0 (0.0%) | 11 (6.4%) |
| $7,500 to $9,999 | 0 (0.0%) | 4 (2.3%) |
| $10,000 to $12,499 | 20 (8.3%) | 0 (0.0%) |
| $12,500 to $14,999 | 7 (2.9%) | 0 (0.0%) |
| $15,000 to $17,499 | 5 (2.1%) | 0 (0.0%) |
| $17,500 to $19,999 | 5 (2.1%) | 15 (8.7%) |
| $20,000 to $22,499 | 2 (0.8%) | 13 (7.5%) |
| $22,500 to $24,999 | 8 (3.3%) | 0 (0.0%) |
| $25,000 to $29,999 | 4 (1.7%) | 5 (2.9%) |
| $30,000 to $34,999 | 17 (7.1%) | 25 (14.4%) |
| $35,000 to $39,999 | 21 (8.7%) | 9 (5.2%) |
| $40,000 to $44,999 | 24 (10.0%) | 13 (7.5%) |
| $45,000 to $49,999 | 8 (3.3%) | 1 (0.6%) |
| $50,000 to $54,999 | 13 (5.4%) | 18 (10.4%) |
| $55,000 to $64,999 | 13 (5.4%) | 22 (12.7%) |
| $65,000 to $74,999 | 8 (3.3%) | 2 (1.2%) |
| $75,000 to $99,999 | 14 (5.8%) | 7 (4.1%) |
| $100,000+ | 33 (13.8%) | 1 (0.6%) |
| Total | 240 (100.0%) | 173 (100.0%) |
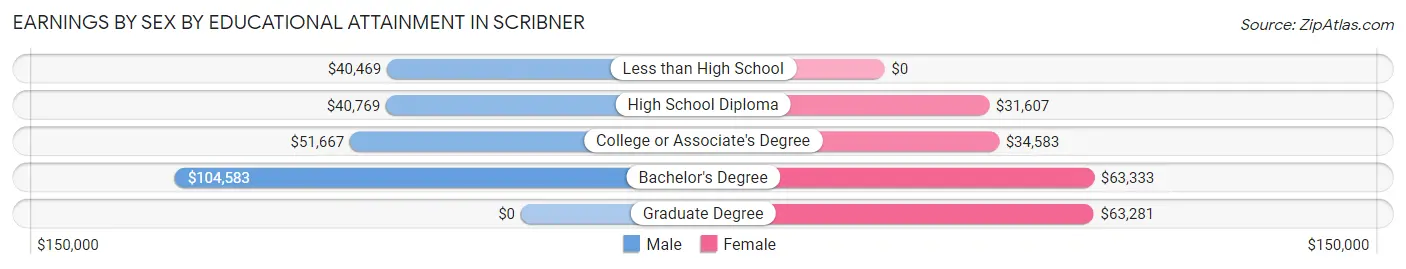
Earnings by Sex by Educational Attainment in Scribner
Average earnings in Scribner are $42,216 for men and $37,083 for women, a difference of 12.2%. Men with an educational attainment of bachelor's degree enjoy the highest average annual earnings of $104,583, while those with less than high school education earn the least with $40,469. Women with an educational attainment of bachelor's degree earn the most with the average annual earnings of $63,333, while those with high school diploma education have the smallest earnings of $31,607.
| Educational Attainment | Male Income | Female Income |
| Less than High School | $40,469 | $0 |
| High School Diploma | $40,769 | $31,607 |
| College or Associate's Degree | $51,667 | $34,583 |
| Bachelor's Degree | $104,583 | $63,333 |
| Graduate Degree | - | - |
| Total | $42,216 | $37,083 |
Family Income in Scribner
Family Income Brackets in Scribner
According to the Scribner family income data, there are 41 families falling into the $100,000 to $149,999 income range, which is the most common income bracket and makes up 22.7% of all families.
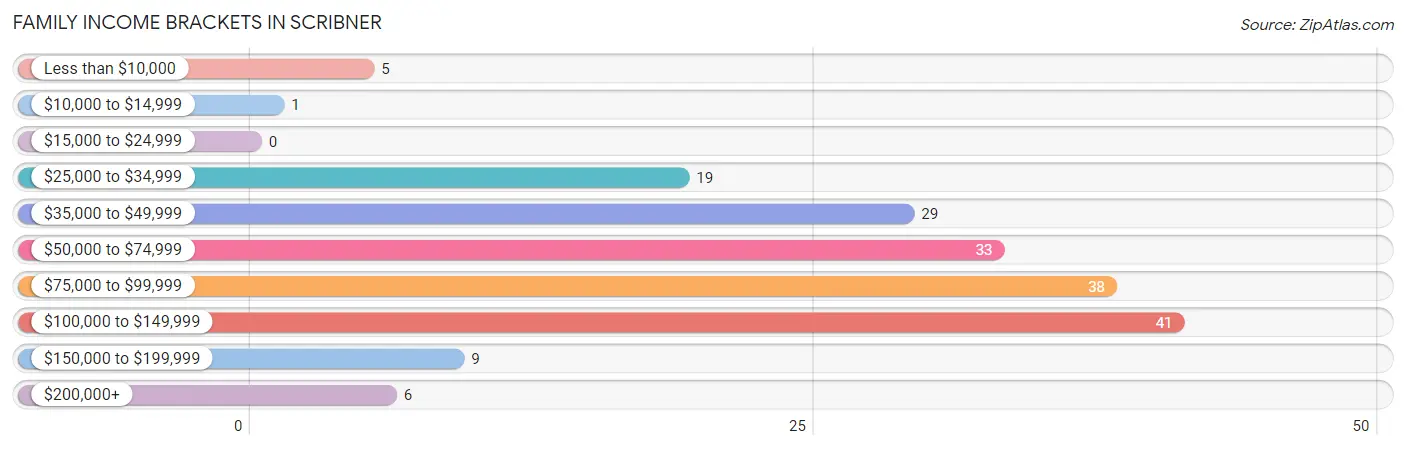
| Income Bracket | # Families | % Families |
| Less than $10,000 | 5 | 2.8% |
| $10,000 to $14,999 | 1 | 0.6% |
| $15,000 to $24,999 | 0 | 0.0% |
| $25,000 to $34,999 | 19 | 10.5% |
| $35,000 to $49,999 | 29 | 16.0% |
| $50,000 to $74,999 | 33 | 18.2% |
| $75,000 to $99,999 | 38 | 21.0% |
| $100,000 to $149,999 | 41 | 22.7% |
| $150,000 to $199,999 | 9 | 5.0% |
| $200,000+ | 6 | 3.3% |
Family Income by Famaliy Size in Scribner
4-person families (30 | 16.6%) account for the highest median family income in Scribner with $121,250 per family, while 4-person families (30 | 16.6%) have the highest median income of $30,312 per family member.
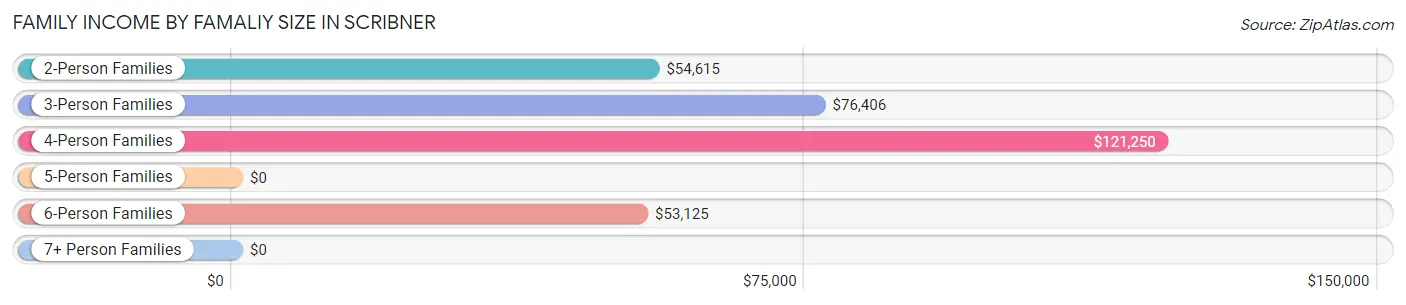
| Income Bracket | # Families | Median Income |
| 2-Person Families | 108 (59.7%) | $54,615 |
| 3-Person Families | 23 (12.7%) | $76,406 |
| 4-Person Families | 30 (16.6%) | $121,250 |
| 5-Person Families | 0 (0.0%) | $0 |
| 6-Person Families | 20 (11.1%) | $53,125 |
| 7+ Person Families | 0 (0.0%) | $0 |
| Total | 181 (100.0%) | $75,547 |
Family Income by Number of Earners in Scribner
The median family income in Scribner is $75,547, with families comprising 3+ earners (24) having the highest median family income of $120,000, while families with no earners (25) have the lowest median family income of $40,417, accounting for 13.3% and 13.8% of families, respectively.
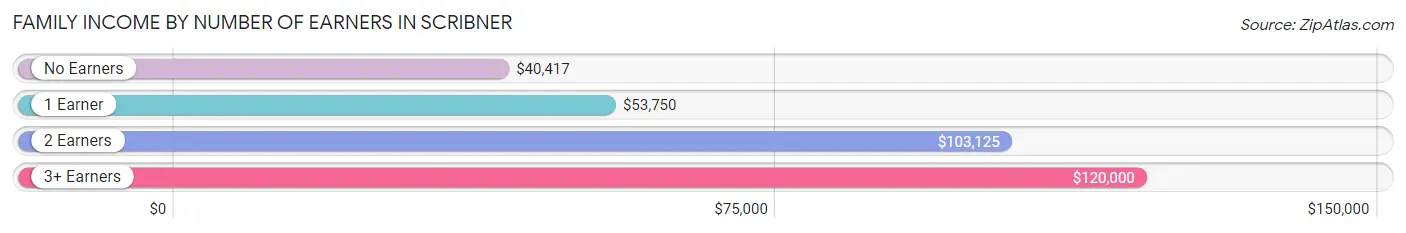
| Number of Earners | # Families | Median Income |
| No Earners | 25 (13.8%) | $40,417 |
| 1 Earner | 73 (40.3%) | $53,750 |
| 2 Earners | 59 (32.6%) | $103,125 |
| 3+ Earners | 24 (13.3%) | $120,000 |
| Total | 181 (100.0%) | $75,547 |
Household Income in Scribner
Household Income Brackets in Scribner
With 59 households falling in the category, the $35,000 to $49,999 income range is the most frequent in Scribner, accounting for 18.2% of all households. In contrast, only 7 households (2.2%) fall into the $200,000+ income bracket, making it the least populous group.
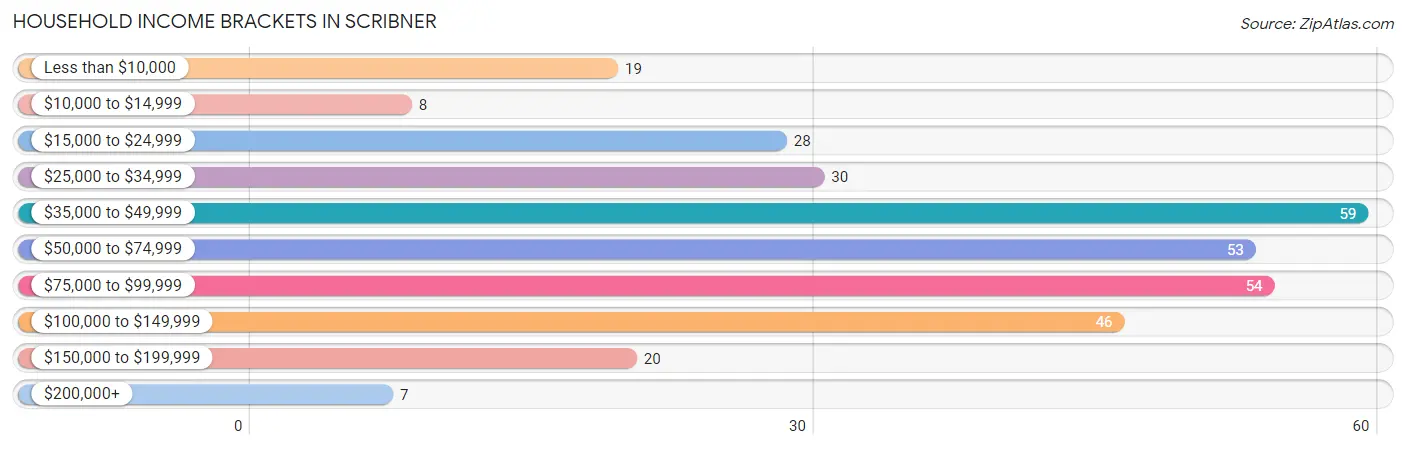
| Income Bracket | # Households | % Households |
| Less than $10,000 | 19 | 5.9% |
| $10,000 to $14,999 | 8 | 2.5% |
| $15,000 to $24,999 | 28 | 8.6% |
| $25,000 to $34,999 | 30 | 9.3% |
| $35,000 to $49,999 | 59 | 18.2% |
| $50,000 to $74,999 | 53 | 16.4% |
| $75,000 to $99,999 | 54 | 16.7% |
| $100,000 to $149,999 | 46 | 14.2% |
| $150,000 to $199,999 | 20 | 6.2% |
| $200,000+ | 7 | 2.2% |
Household Income by Householder Age in Scribner
The median household income in Scribner is $53,478, with the highest median household income of $92,788 found in the 25 to 44 years age bracket for the primary householder. A total of 71 households (21.9%) fall into this category. Meanwhile, the 15 to 24 years age bracket for the primary householder has the lowest median household income of $0, with 17 households (5.2%) in this group.
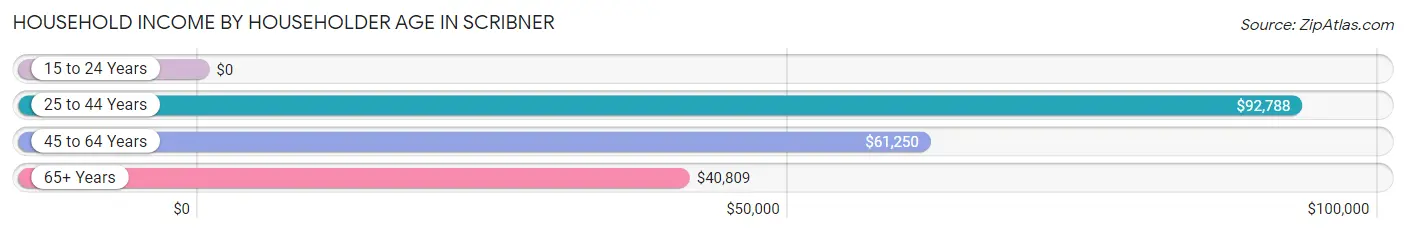
| Income Bracket | # Households | Median Income |
| 15 to 24 Years | 17 (5.2%) | $0 |
| 25 to 44 Years | 71 (21.9%) | $92,788 |
| 45 to 64 Years | 113 (34.9%) | $61,250 |
| 65+ Years | 123 (38.0%) | $40,809 |
| Total | 324 (100.0%) | $53,478 |
Poverty in Scribner
Income Below Poverty by Sex and Age in Scribner
With 8.1% poverty level for males and 19.2% for females among the residents of Scribner, 35 to 44 year old males and under 5 year old females are the most vulnerable to poverty, with 9 males (20.9%) and 18 females (90.0%) in their respective age groups living below the poverty level.
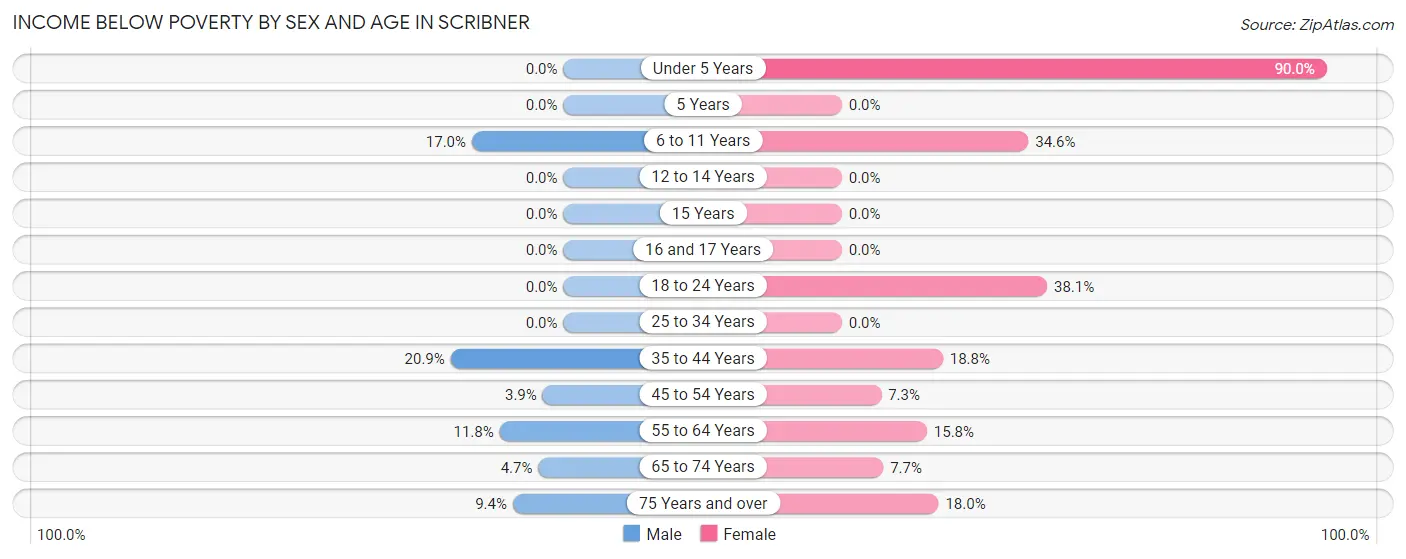
| Age Bracket | Male | Female |
| Under 5 Years | 0 (0.0%) | 18 (90.0%) |
| 5 Years | 0 (0.0%) | 0 (0.0%) |
| 6 to 11 Years | 9 (17.0%) | 9 (34.6%) |
| 12 to 14 Years | 0 (0.0%) | 0 (0.0%) |
| 15 Years | 0 (0.0%) | 0 (0.0%) |
| 16 and 17 Years | 0 (0.0%) | 0 (0.0%) |
| 18 to 24 Years | 0 (0.0%) | 8 (38.1%) |
| 25 to 34 Years | 0 (0.0%) | 0 (0.0%) |
| 35 to 44 Years | 9 (20.9%) | 9 (18.8%) |
| 45 to 54 Years | 1 (3.8%) | 3 (7.3%) |
| 55 to 64 Years | 9 (11.8%) | 6 (15.8%) |
| 65 to 74 Years | 2 (4.6%) | 4 (7.7%) |
| 75 Years and over | 3 (9.4%) | 7 (17.9%) |
| Total | 33 (8.1%) | 64 (19.2%) |
Income Above Poverty by Sex and Age in Scribner
According to the poverty statistics in Scribner, males aged under 5 years and females aged 5 years are the age groups that are most secure financially, with 100.0% of males and 100.0% of females in these age groups living above the poverty line.
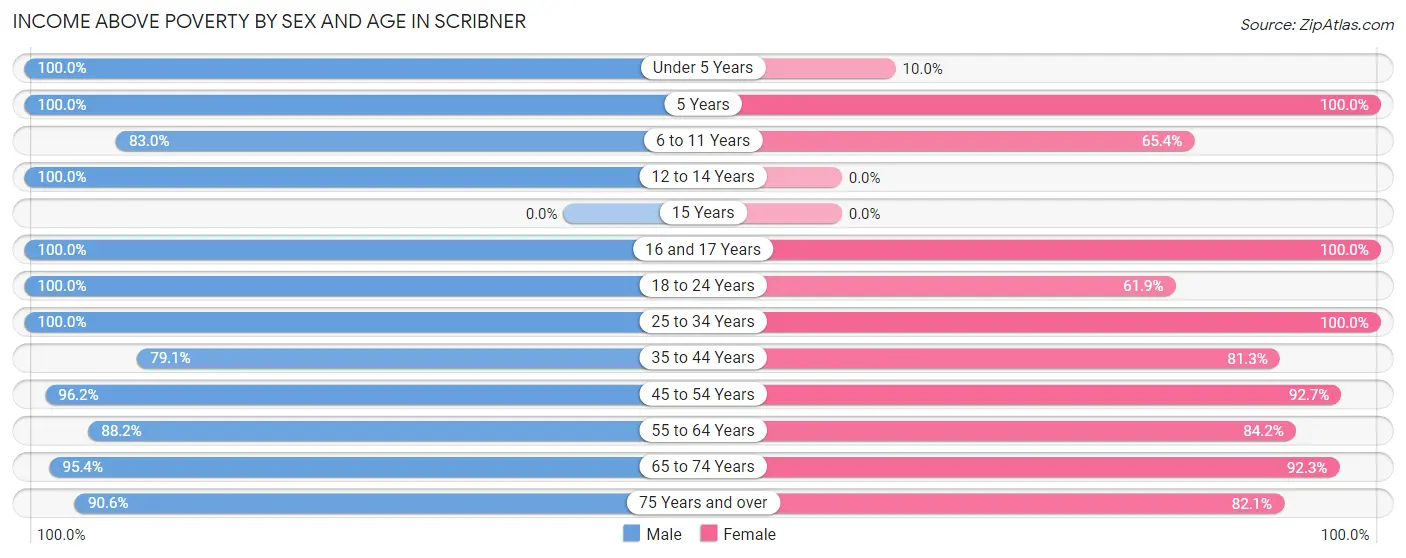
| Age Bracket | Male | Female |
| Under 5 Years | 16 (100.0%) | 2 (10.0%) |
| 5 Years | 6 (100.0%) | 5 (100.0%) |
| 6 to 11 Years | 44 (83.0%) | 17 (65.4%) |
| 12 to 14 Years | 13 (100.0%) | 0 (0.0%) |
| 15 Years | 0 (0.0%) | 0 (0.0%) |
| 16 and 17 Years | 6 (100.0%) | 15 (100.0%) |
| 18 to 24 Years | 57 (100.0%) | 13 (61.9%) |
| 25 to 34 Years | 35 (100.0%) | 28 (100.0%) |
| 35 to 44 Years | 34 (79.1%) | 39 (81.2%) |
| 45 to 54 Years | 25 (96.2%) | 38 (92.7%) |
| 55 to 64 Years | 67 (88.2%) | 32 (84.2%) |
| 65 to 74 Years | 41 (95.4%) | 48 (92.3%) |
| 75 Years and over | 29 (90.6%) | 32 (82.1%) |
| Total | 373 (91.9%) | 269 (80.8%) |
Income Below Poverty Among Married-Couple Families in Scribner
The poverty statistics for married-couple families in Scribner show that 8.9% or 14 of the total 157 families live below the poverty line. Families with 3 or 4 children have the highest poverty rate of 66.7%, comprising of 8 families. On the other hand, families with 1 or 2 children have the lowest poverty rate of 0.0%, which includes 0 families.
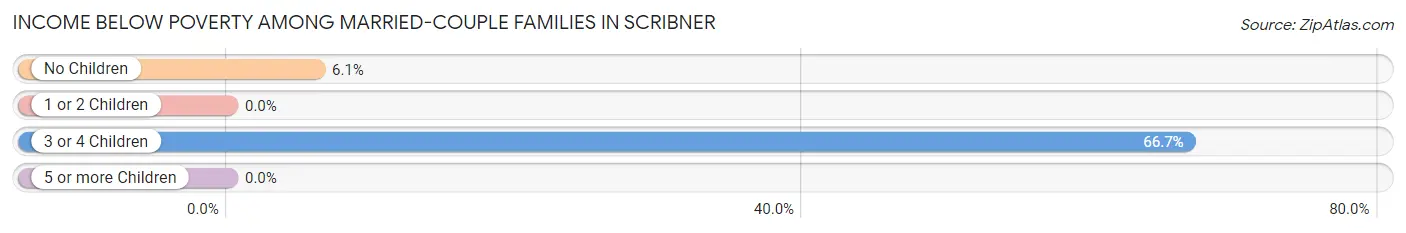
| Children | Above Poverty | Below Poverty |
| No Children | 93 (93.9%) | 6 (6.1%) |
| 1 or 2 Children | 46 (100.0%) | 0 (0.0%) |
| 3 or 4 Children | 4 (33.3%) | 8 (66.7%) |
| 5 or more Children | 0 (0.0%) | 0 (0.0%) |
| Total | 143 (91.1%) | 14 (8.9%) |
Income Below Poverty Among Single-Parent Households in Scribner
| Children | Single Father | Single Mother |
| No Children | 0 (0.0%) | 0 (0.0%) |
| 1 or 2 Children | 0 (0.0%) | 0 (0.0%) |
| 3 or 4 Children | 0 (0.0%) | 0 (0.0%) |
| 5 or more Children | 0 (0.0%) | 0 (0.0%) |
| Total | 0 (0.0%) | 0 (0.0%) |
Income Below Poverty Among Married-Couple vs Single-Parent Households in Scribner

| Children | Married-Couple Families | Single-Parent Households |
| No Children | 6 (6.1%) | 0 (0.0%) |
| 1 or 2 Children | 0 (0.0%) | 0 (0.0%) |
| 3 or 4 Children | 8 (66.7%) | 0 (0.0%) |
| 5 or more Children | 0 (0.0%) | 0 (0.0%) |
| Total | 14 (8.9%) | 0 (0.0%) |
Race in Scribner
The most populous races in Scribner are White / Caucasian (665 | 85.4%), Hispanic or Latino (84 | 10.8%), and Some other Race (74 | 9.5%).
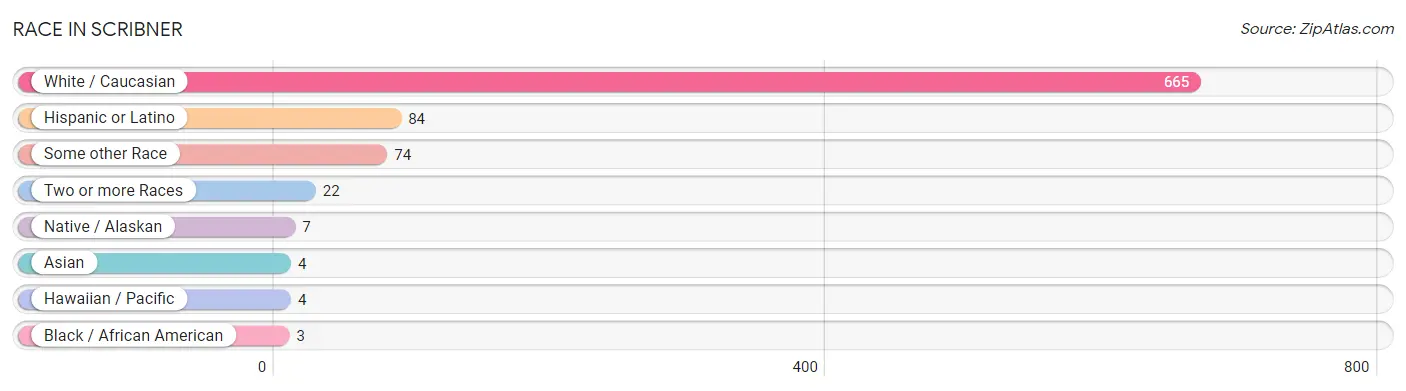
| Race | # Population | % Population |
| Asian | 4 | 0.5% |
| Black / African American | 3 | 0.4% |
| Hawaiian / Pacific | 4 | 0.5% |
| Hispanic or Latino | 84 | 10.8% |
| Native / Alaskan | 7 | 0.9% |
| White / Caucasian | 665 | 85.4% |
| Two or more Races | 22 | 2.8% |
| Some other Race | 74 | 9.5% |
| Total | 779 | 100.0% |
Ancestry in Scribner
The most populous ancestries reported in Scribner are German (352 | 45.2%), Irish (81 | 10.4%), Mexican (81 | 10.4%), Czech (56 | 7.2%), and English (48 | 6.2%), together accounting for 79.3% of all Scribner residents.
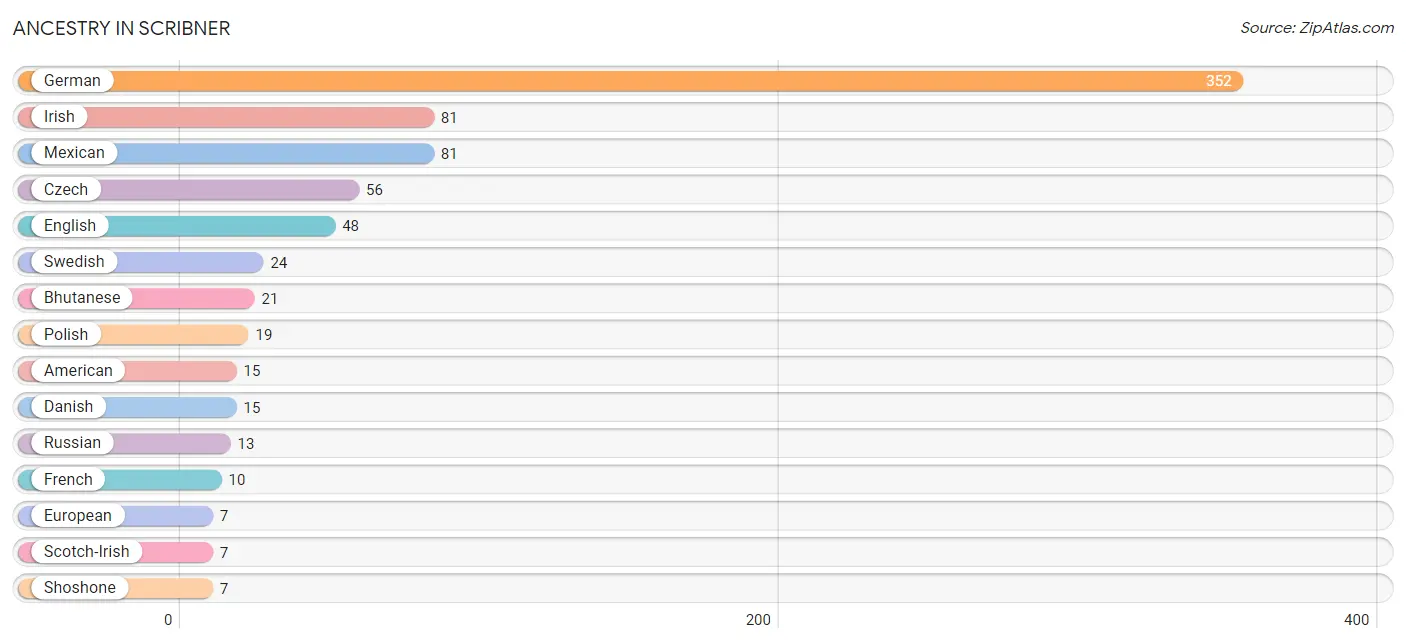
| Ancestry | # Population | % Population |
| American | 15 | 1.9% |
| Austrian | 2 | 0.3% |
| Bhutanese | 21 | 2.7% |
| Bulgarian | 2 | 0.3% |
| Czech | 56 | 7.2% |
| Czechoslovakian | 1 | 0.1% |
| Danish | 15 | 1.9% |
| Dutch | 5 | 0.6% |
| English | 48 | 6.2% |
| European | 7 | 0.9% |
| French | 10 | 1.3% |
| French Canadian | 2 | 0.3% |
| German | 352 | 45.2% |
| Irish | 81 | 10.4% |
| Italian | 2 | 0.3% |
| Korean | 3 | 0.4% |
| Mexican | 81 | 10.4% |
| Norwegian | 6 | 0.8% |
| Polish | 19 | 2.4% |
| Romanian | 2 | 0.3% |
| Russian | 13 | 1.7% |
| Samoan | 4 | 0.5% |
| Scandinavian | 2 | 0.3% |
| Scotch-Irish | 7 | 0.9% |
| Scottish | 6 | 0.8% |
| Shoshone | 7 | 0.9% |
| Spaniard | 1 | 0.1% |
| Swedish | 24 | 3.1% |
| Welsh | 2 | 0.3% | View All 29 Rows |
Immigrants in Scribner
The most numerous immigrant groups reported in Scribner came from Latin America (10 | 1.3%), Ecuador (8 | 1.0%), South America (8 | 1.0%), Africa (4 | 0.5%), and Asia (4 | 0.5%), together accounting for 4.4% of all Scribner residents.
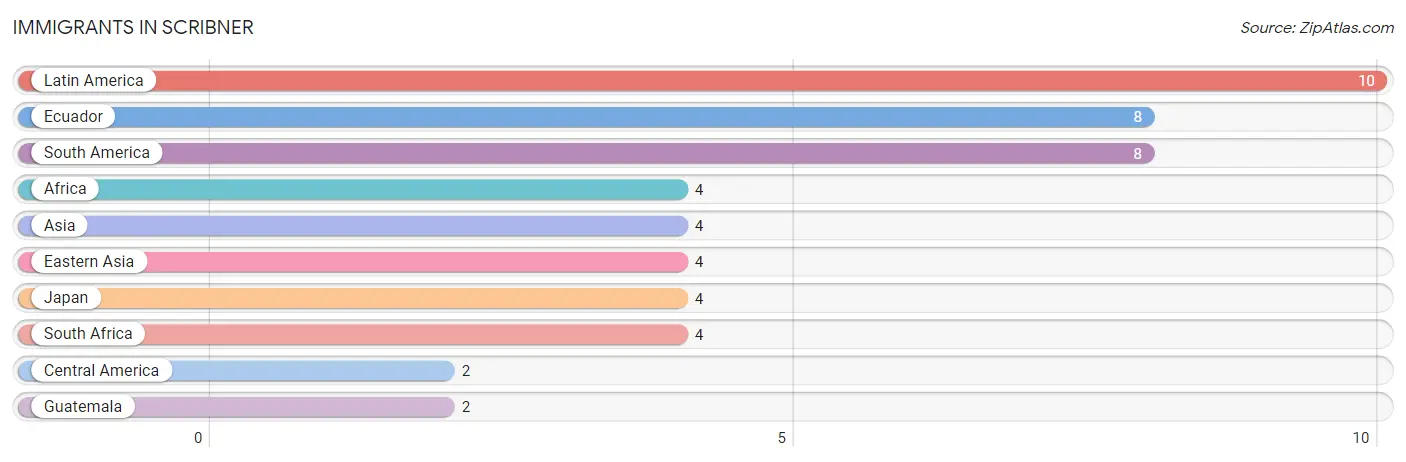
| Immigration Origin | # Population | % Population |
| Africa | 4 | 0.5% |
| Asia | 4 | 0.5% |
| Central America | 2 | 0.3% |
| Eastern Asia | 4 | 0.5% |
| Ecuador | 8 | 1.0% |
| Guatemala | 2 | 0.3% |
| Japan | 4 | 0.5% |
| Latin America | 10 | 1.3% |
| South Africa | 4 | 0.5% |
| South America | 8 | 1.0% | View All 10 Rows |
Sex and Age in Scribner
Sex and Age in Scribner
The most populous age groups in Scribner are 55 to 59 Years (53 | 12.5%) for men and 5 to 9 Years (31 | 8.7%) for women.
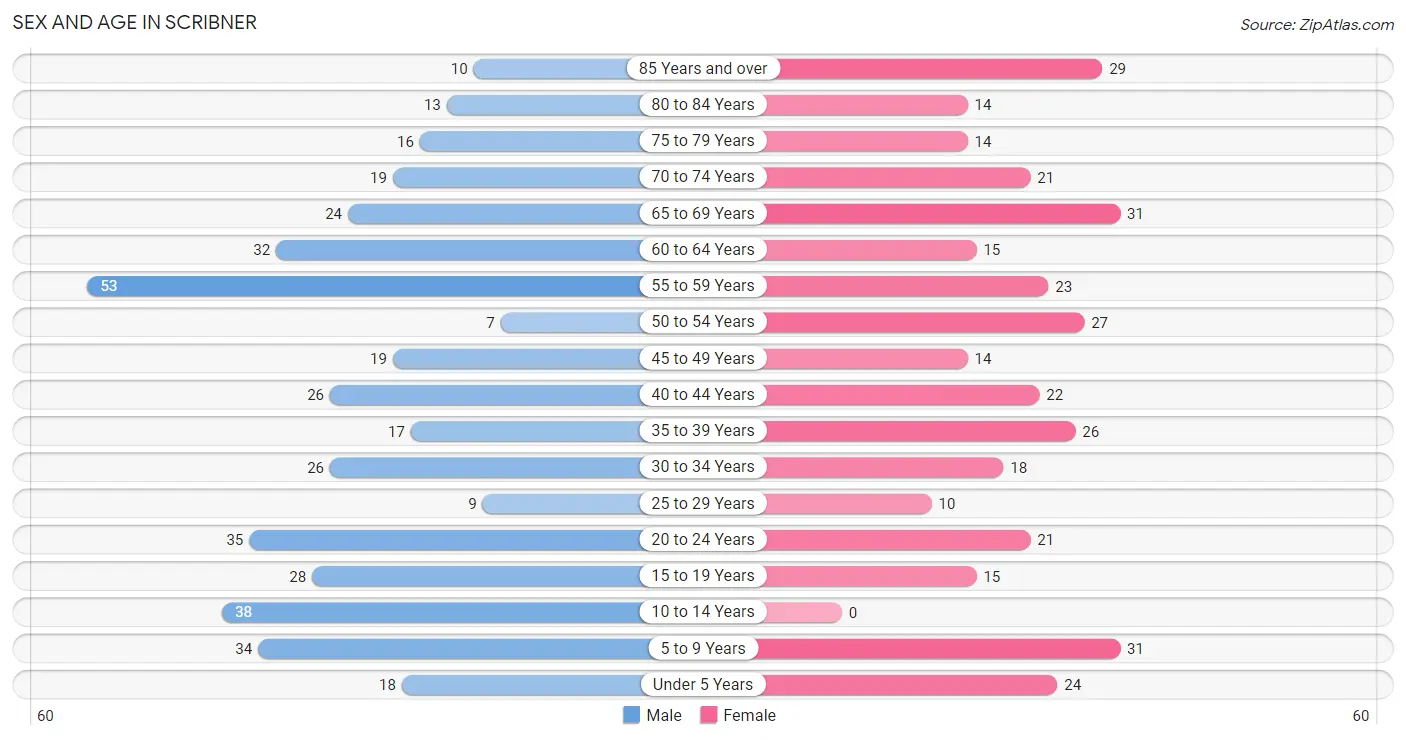
| Age Bracket | Male | Female |
| Under 5 Years | 18 (4.3%) | 24 (6.8%) |
| 5 to 9 Years | 34 (8.0%) | 31 (8.7%) |
| 10 to 14 Years | 38 (9.0%) | 0 (0.0%) |
| 15 to 19 Years | 28 (6.6%) | 15 (4.2%) |
| 20 to 24 Years | 35 (8.3%) | 21 (5.9%) |
| 25 to 29 Years | 9 (2.1%) | 10 (2.8%) |
| 30 to 34 Years | 26 (6.1%) | 18 (5.1%) |
| 35 to 39 Years | 17 (4.0%) | 26 (7.3%) |
| 40 to 44 Years | 26 (6.1%) | 22 (6.2%) |
| 45 to 49 Years | 19 (4.5%) | 14 (3.9%) |
| 50 to 54 Years | 7 (1.7%) | 27 (7.6%) |
| 55 to 59 Years | 53 (12.5%) | 23 (6.5%) |
| 60 to 64 Years | 32 (7.5%) | 15 (4.2%) |
| 65 to 69 Years | 24 (5.7%) | 31 (8.7%) |
| 70 to 74 Years | 19 (4.5%) | 21 (5.9%) |
| 75 to 79 Years | 16 (3.8%) | 14 (3.9%) |
| 80 to 84 Years | 13 (3.1%) | 14 (3.9%) |
| 85 Years and over | 10 (2.4%) | 29 (8.2%) |
| Total | 424 (100.0%) | 355 (100.0%) |
Families and Households in Scribner
Median Family Size in Scribner
The median family size in Scribner is 3.10 persons per family, with married-couple families (157 | 86.7%) accounting for the largest median family size of 3.22 persons per family. On the other hand, single male/father families (6 | 3.3%) represent the smallest median family size with 1.83 persons per family.
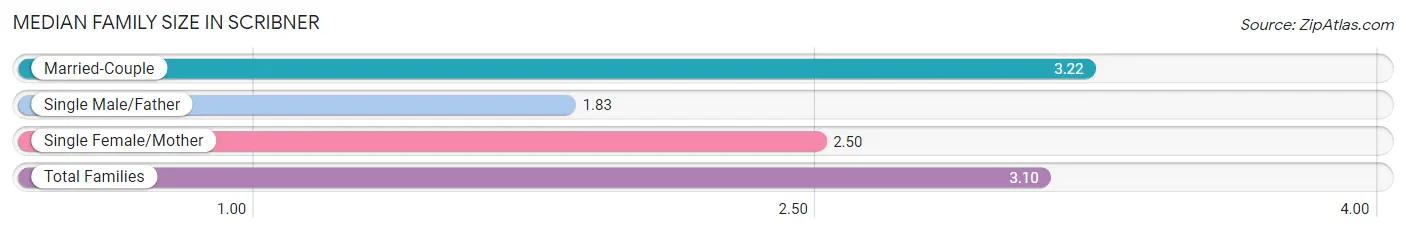
| Family Type | # Families | Family Size |
| Married-Couple | 157 (86.7%) | 3.22 |
| Single Male/Father | 6 (3.3%) | 1.83 |
| Single Female/Mother | 18 (9.9%) | 2.50 |
| Total Families | 181 (100.0%) | 3.10 |
Median Household Size in Scribner
The median household size in Scribner is 2.30 persons per household, with married-couple households (157 | 48.5%) accounting for the largest median household size of 3.22 persons per household. non-family households (143 | 44.1%) represent the smallest median household size with 1.18 persons per household.
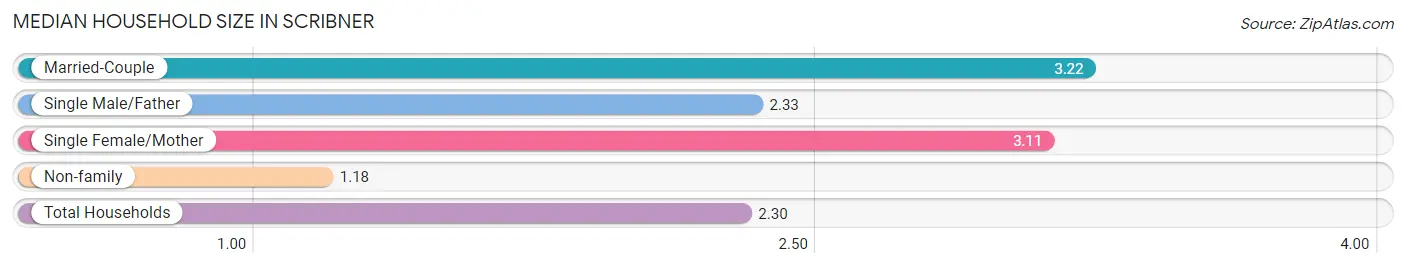
| Household Type | # Households | Household Size |
| Married-Couple | 157 (48.5%) | 3.22 |
| Single Male/Father | 6 (1.8%) | 2.33 |
| Single Female/Mother | 18 (5.6%) | 3.11 |
| Non-family | 143 (44.1%) | 1.18 |
| Total Households | 324 (100.0%) | 2.30 |
Household Size by Marriage Status in Scribner
Out of a total of 324 households in Scribner, 181 (55.9%) are family households, while 143 (44.1%) are nonfamily households. The most numerous type of family households are 2-person households, comprising 99, and the most common type of nonfamily households are 1-person households, comprising 115.
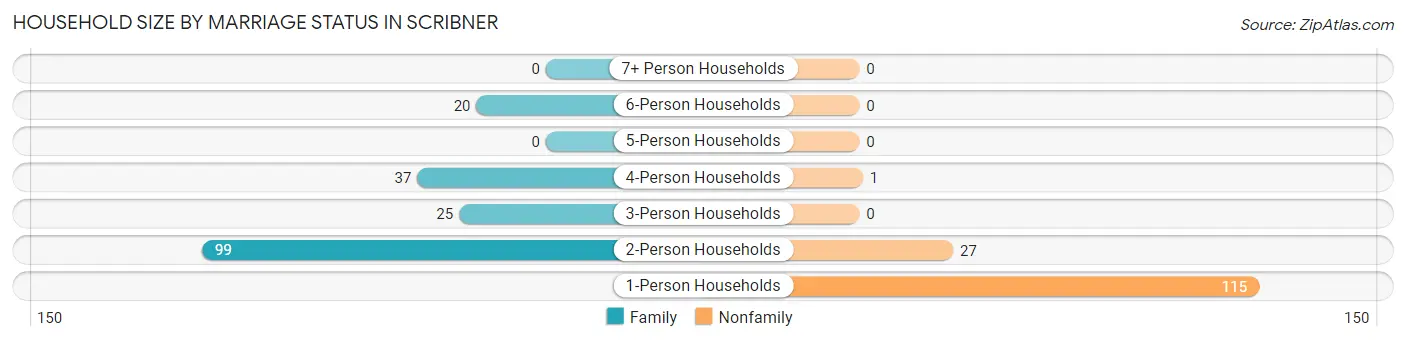
| Household Size | Family Households | Nonfamily Households |
| 1-Person Households | - | 115 (35.5%) |
| 2-Person Households | 99 (30.6%) | 27 (8.3%) |
| 3-Person Households | 25 (7.7%) | 0 (0.0%) |
| 4-Person Households | 37 (11.4%) | 1 (0.3%) |
| 5-Person Households | 0 (0.0%) | 0 (0.0%) |
| 6-Person Households | 20 (6.2%) | 0 (0.0%) |
| 7+ Person Households | 0 (0.0%) | 0 (0.0%) |
| Total | 181 (55.9%) | 143 (44.1%) |
Female Fertility in Scribner
Fertility by Age in Scribner
Average fertility rate in Scribner is 45.0 births per 1,000 women. Women in the age bracket of 35 to 50 years have the highest fertility rate with 59.0 births per 1,000 women. Women in the age bracket of 35 to 50 years acount for 66.7% of all women with births.
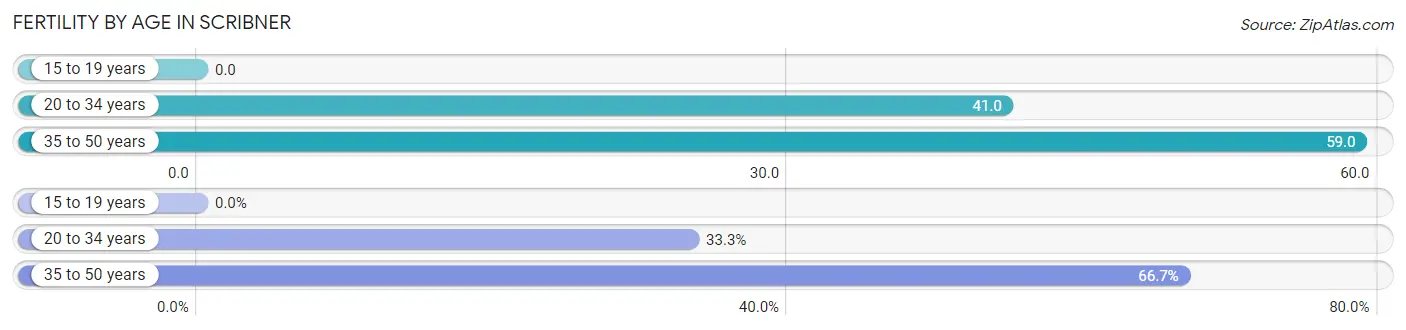
| Age Bracket | Women with Births | Births / 1,000 Women |
| 15 to 19 years | 0 (0.0%) | 0.0 |
| 20 to 34 years | 2 (33.3%) | 41.0 |
| 35 to 50 years | 4 (66.7%) | 59.0 |
| Total | 6 (100.0%) | 45.0 |
Fertility by Age by Marriage Status in Scribner
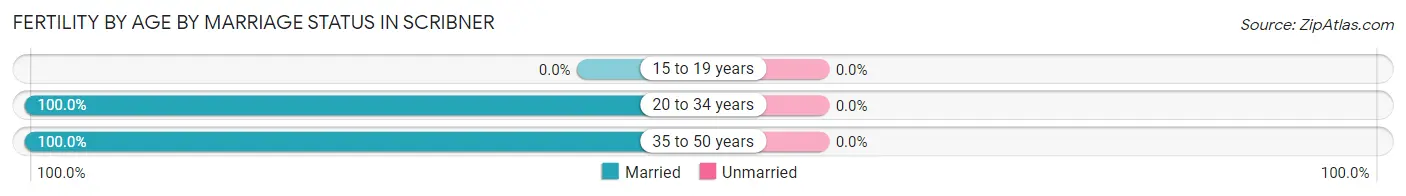
| Age Bracket | Married | Unmarried |
| 15 to 19 years | 0 (0.0%) | 0 (0.0%) |
| 20 to 34 years | 2 (100.0%) | 0 (0.0%) |
| 35 to 50 years | 4 (100.0%) | 0 (0.0%) |
| Total | 6 (100.0%) | 0 (0.0%) |
Fertility by Education in Scribner
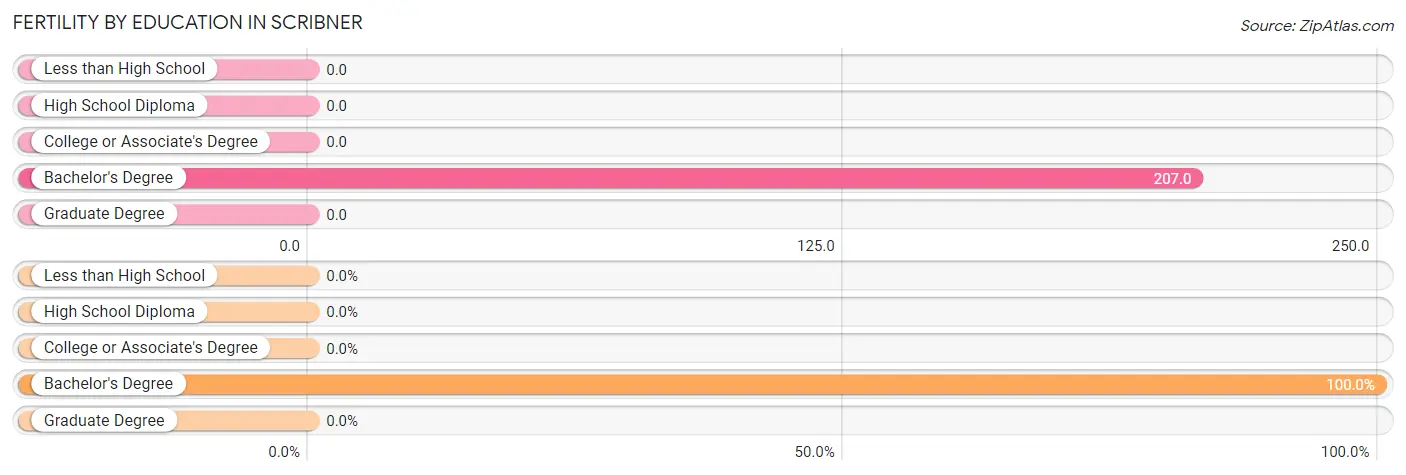
| Educational Attainment | Women with Births | Births / 1,000 Women |
| Less than High School | 0 (0.0%) | 0.0 |
| High School Diploma | 0 (0.0%) | 0.0 |
| College or Associate's Degree | 0 (0.0%) | 0.0 |
| Bachelor's Degree | 6 (100.0%) | 207.0 |
| Graduate Degree | 0 (0.0%) | 0.0 |
| Total | 6 (100.0%) | 45.0 |
Fertility by Education by Marriage Status in Scribner
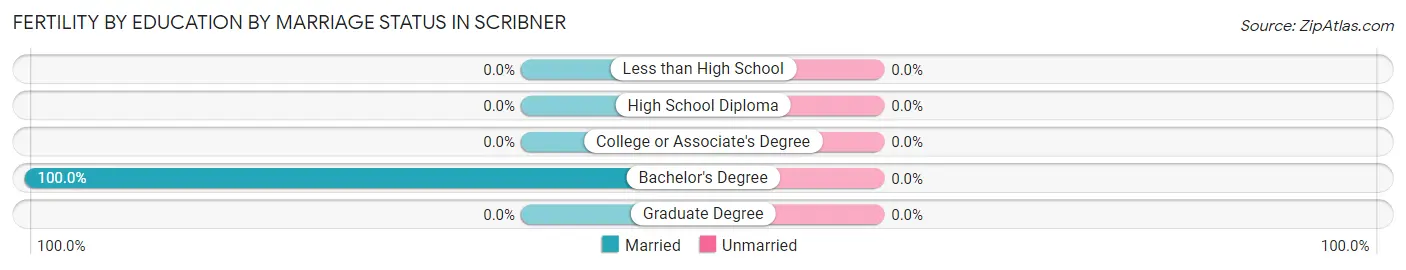
| Educational Attainment | Married | Unmarried |
| Less than High School | 0 (0.0%) | 0 (0.0%) |
| High School Diploma | 0 (0.0%) | 0 (0.0%) |
| College or Associate's Degree | 0 (0.0%) | 0 (0.0%) |
| Bachelor's Degree | 6 (100.0%) | 0 (0.0%) |
| Graduate Degree | 0 (0.0%) | 0 (0.0%) |
| Total | 6 (100.0%) | 0 (0.0%) |
Employment Characteristics in Scribner
Employment by Class of Employer in Scribner
Among the 346 employed individuals in Scribner, private company employees (199 | 57.5%), not-for-profit organizations (59 | 17.1%), and self-employed (incorporated) (24 | 6.9%) make up the most common classes of employment.
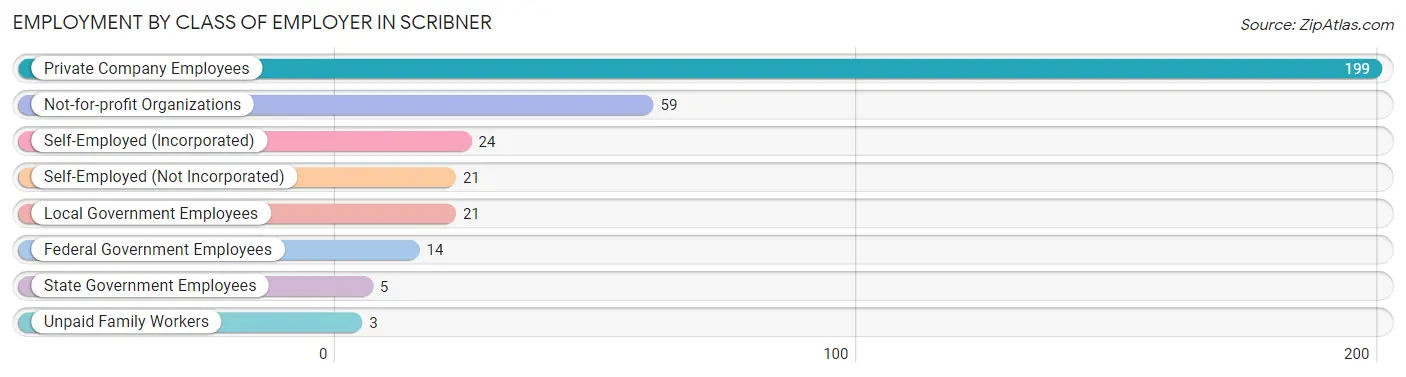
| Employer Class | # Employees | % Employees |
| Private Company Employees | 199 | 57.5% |
| Self-Employed (Incorporated) | 24 | 6.9% |
| Self-Employed (Not Incorporated) | 21 | 6.1% |
| Not-for-profit Organizations | 59 | 17.1% |
| Local Government Employees | 21 | 6.1% |
| State Government Employees | 5 | 1.5% |
| Federal Government Employees | 14 | 4.1% |
| Unpaid Family Workers | 3 | 0.9% |
| Total | 346 | 100.0% |
Employment Status by Age in Scribner
According to the labor force statistics for Scribner, out of the total population over 16 years of age (634), 57.4% or 364 individuals are in the labor force, with 2.2% or 8 of them unemployed. The age group with the highest labor force participation rate is 20 to 24 years, with 100.0% or 56 individuals in the labor force. Within the labor force, the 25 to 29 years age range has the highest percentage of unemployed individuals, with 17.6% or 3 of them being unemployed.
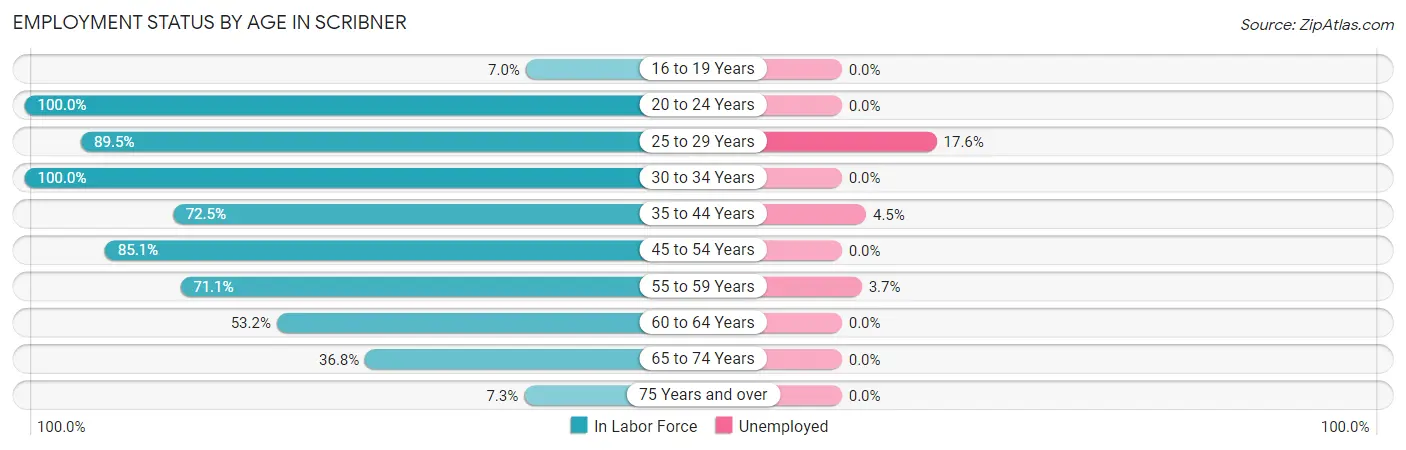
| Age Bracket | In Labor Force | Unemployed |
| 16 to 19 Years | 3 (7.0%) | 0 (0.0%) |
| 20 to 24 Years | 56 (100.0%) | 0 (0.0%) |
| 25 to 29 Years | 17 (89.5%) | 3 (17.6%) |
| 30 to 34 Years | 44 (100.0%) | 0 (0.0%) |
| 35 to 44 Years | 66 (72.5%) | 3 (4.5%) |
| 45 to 54 Years | 57 (85.1%) | 0 (0.0%) |
| 55 to 59 Years | 54 (71.1%) | 2 (3.7%) |
| 60 to 64 Years | 25 (53.2%) | 0 (0.0%) |
| 65 to 74 Years | 35 (36.8%) | 0 (0.0%) |
| 75 Years and over | 7 (7.3%) | 0 (0.0%) |
| Total | 364 (57.4%) | 8 (2.2%) |
Employment Status by Educational Attainment in Scribner
According to labor force statistics for Scribner, 76.5% of individuals (263) out of the total population between 25 and 64 years of age (344) are in the labor force, with 3.0% or 8 of them being unemployed. The group with the highest labor force participation rate are those with the educational attainment of high school diploma, with 84.5% or 125 individuals in the labor force. Within the labor force, individuals with college / associate degree education have the highest percentage of unemployment, with 6.0% or 5 of them being unemployed.
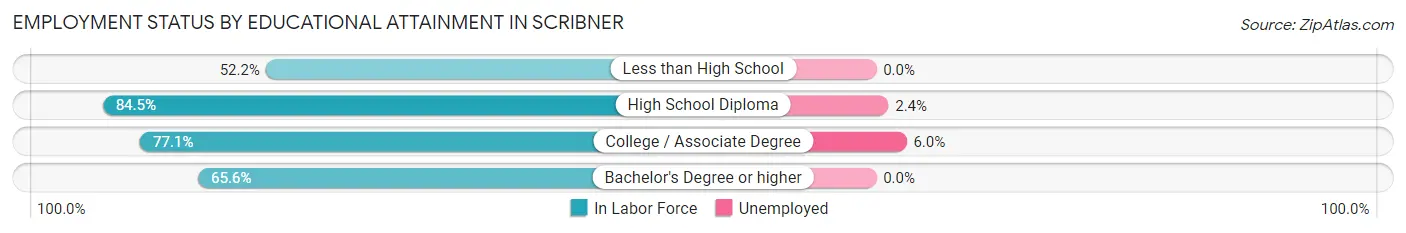
| Educational Attainment | In Labor Force | Unemployed |
| Less than High School | 12 (52.2%) | 0 (0.0%) |
| High School Diploma | 125 (84.5%) | 4 (2.4%) |
| College / Associate Degree | 84 (77.1%) | 7 (6.0%) |
| Bachelor's Degree or higher | 42 (65.6%) | 0 (0.0%) |
| Total | 263 (76.5%) | 10 (3.0%) |
Employment Occupations by Sex in Scribner
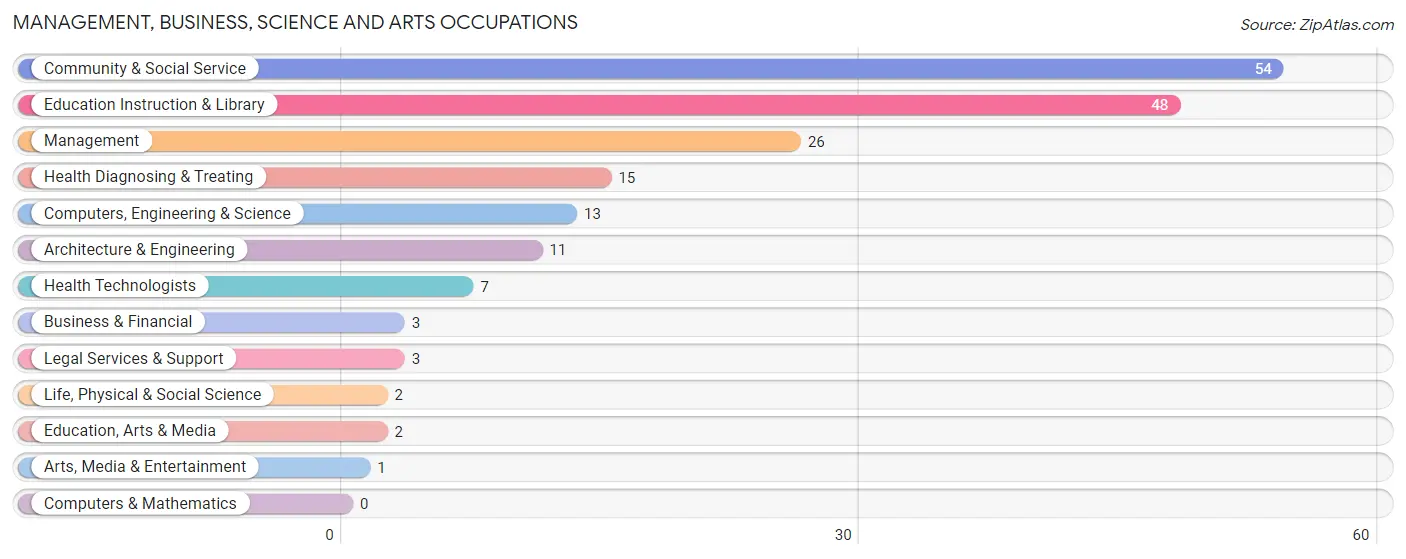
Management, Business, Science and Arts Occupations
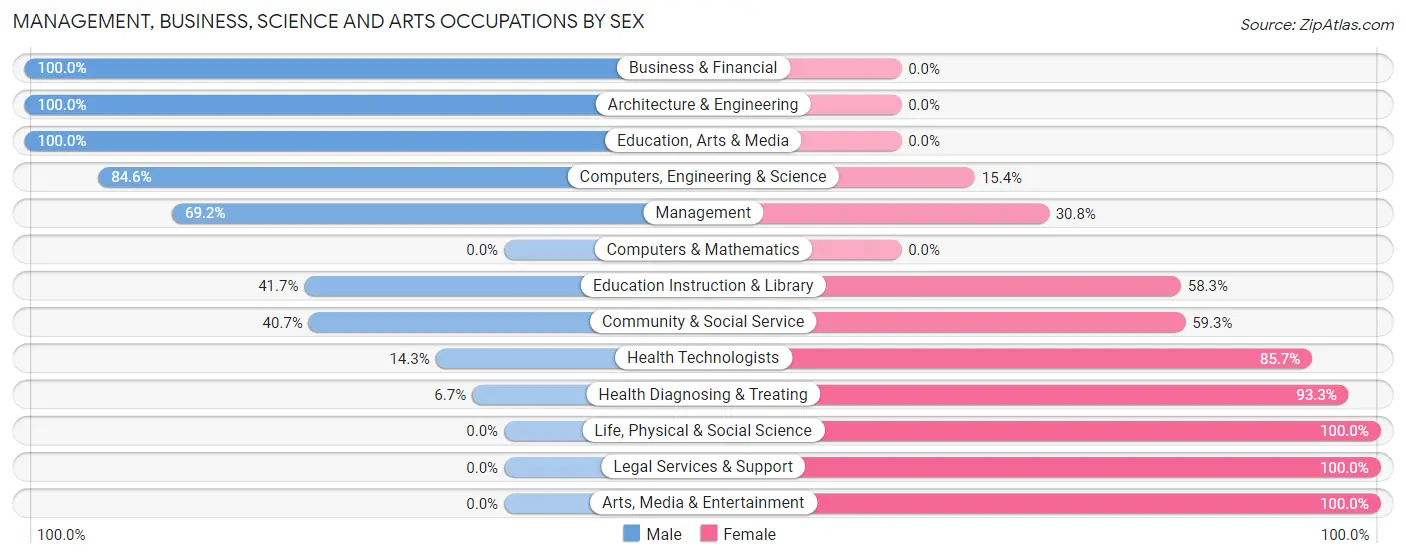
The most common Management, Business, Science and Arts occupations in Scribner are Community & Social Service (54 | 15.2%), Education Instruction & Library (48 | 13.5%), Management (26 | 7.3%), Health Diagnosing & Treating (15 | 4.2%), and Computers, Engineering & Science (13 | 3.6%).
Management, Business, Science and Arts Occupations by Sex
Within the Management, Business, Science and Arts occupations in Scribner, the most male-oriented occupations are Business & Financial (100.0%), Architecture & Engineering (100.0%), and Education, Arts & Media (100.0%), while the most female-oriented occupations are Life, Physical & Social Science (100.0%), Legal Services & Support (100.0%), and Arts, Media & Entertainment (100.0%).
| Occupation | Male | Female |
| Management | 18 (69.2%) | 8 (30.8%) |
| Business & Financial | 3 (100.0%) | 0 (0.0%) |
| Computers, Engineering & Science | 11 (84.6%) | 2 (15.4%) |
| Computers & Mathematics | 0 (0.0%) | 0 (0.0%) |
| Architecture & Engineering | 11 (100.0%) | 0 (0.0%) |
| Life, Physical & Social Science | 0 (0.0%) | 2 (100.0%) |
| Community & Social Service | 22 (40.7%) | 32 (59.3%) |
| Education, Arts & Media | 2 (100.0%) | 0 (0.0%) |
| Legal Services & Support | 0 (0.0%) | 3 (100.0%) |
| Education Instruction & Library | 20 (41.7%) | 28 (58.3%) |
| Arts, Media & Entertainment | 0 (0.0%) | 1 (100.0%) |
| Health Diagnosing & Treating | 1 (6.7%) | 14 (93.3%) |
| Health Technologists | 1 (14.3%) | 6 (85.7%) |
| Total (Category) | 55 (49.5%) | 56 (50.4%) |
| Total (Overall) | 211 (59.3%) | 145 (40.7%) |
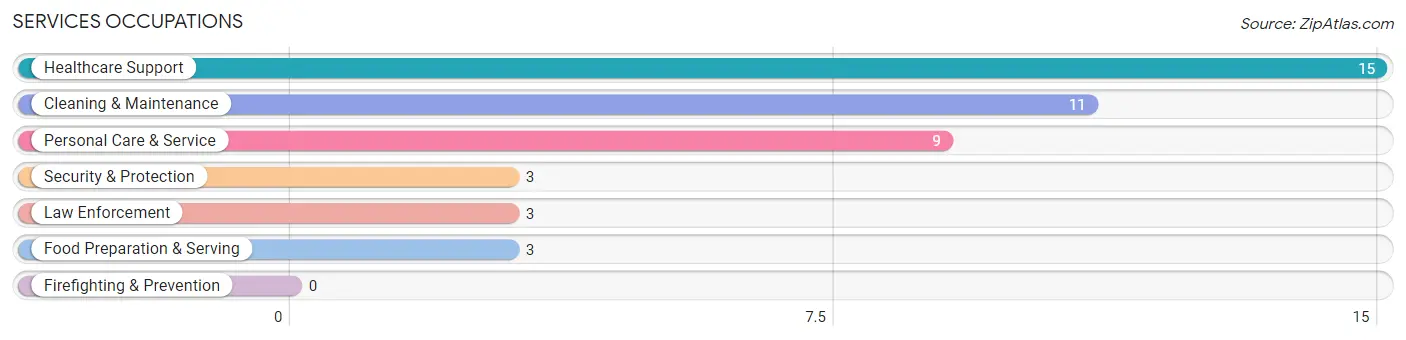
Services Occupations
The most common Services occupations in Scribner are Healthcare Support (15 | 4.2%), Cleaning & Maintenance (11 | 3.1%), Personal Care & Service (9 | 2.5%), Security & Protection (3 | 0.8%), and Law Enforcement (3 | 0.8%).
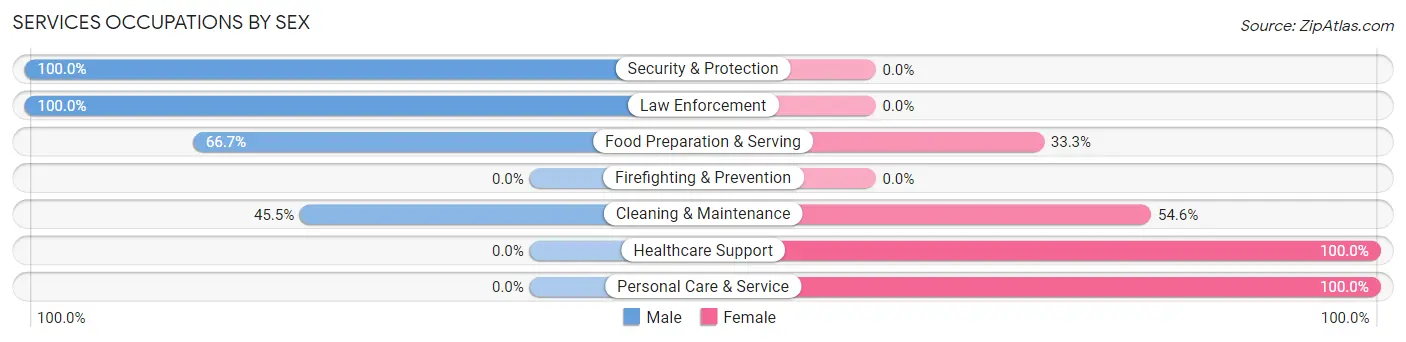
Services Occupations by Sex
Within the Services occupations in Scribner, the most male-oriented occupations are Security & Protection (100.0%), Law Enforcement (100.0%), and Food Preparation & Serving (66.7%), while the most female-oriented occupations are Healthcare Support (100.0%), Personal Care & Service (100.0%), and Cleaning & Maintenance (54.5%).
| Occupation | Male | Female |
| Healthcare Support | 0 (0.0%) | 15 (100.0%) |
| Security & Protection | 3 (100.0%) | 0 (0.0%) |
| Firefighting & Prevention | 0 (0.0%) | 0 (0.0%) |
| Law Enforcement | 3 (100.0%) | 0 (0.0%) |
| Food Preparation & Serving | 2 (66.7%) | 1 (33.3%) |
| Cleaning & Maintenance | 5 (45.5%) | 6 (54.5%) |
| Personal Care & Service | 0 (0.0%) | 9 (100.0%) |
| Total (Category) | 10 (24.4%) | 31 (75.6%) |
| Total (Overall) | 211 (59.3%) | 145 (40.7%) |
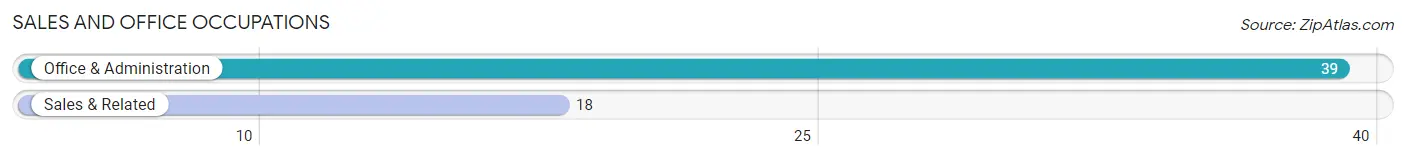
Sales and Office Occupations
The most common Sales and Office occupations in Scribner are Office & Administration (39 | 11.0%), and Sales & Related (18 | 5.1%).
Sales and Office Occupations by Sex
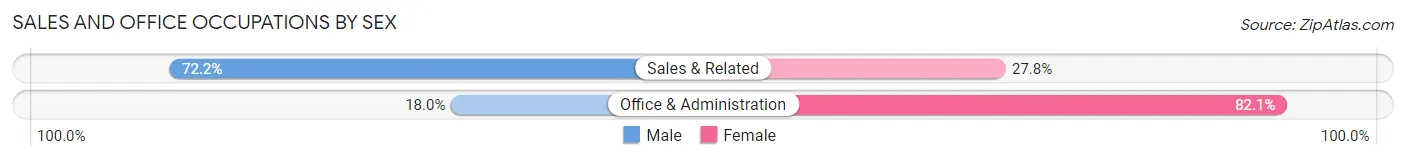
| Occupation | Male | Female |
| Sales & Related | 13 (72.2%) | 5 (27.8%) |
| Office & Administration | 7 (17.9%) | 32 (82.1%) |
| Total (Category) | 20 (35.1%) | 37 (64.9%) |
| Total (Overall) | 211 (59.3%) | 145 (40.7%) |
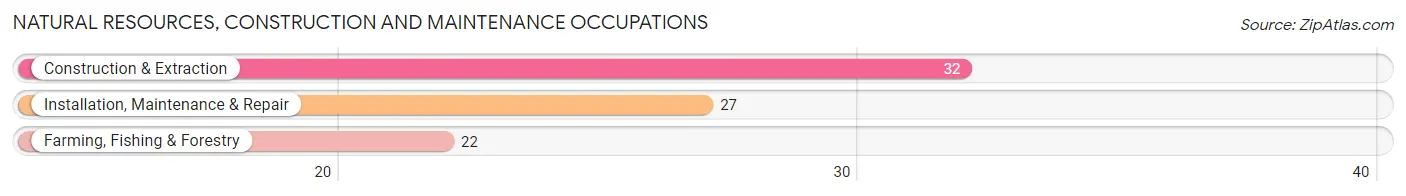
Natural Resources, Construction and Maintenance Occupations
The most common Natural Resources, Construction and Maintenance occupations in Scribner are Construction & Extraction (32 | 9.0%), Installation, Maintenance & Repair (27 | 7.6%), and Farming, Fishing & Forestry (22 | 6.2%).
Natural Resources, Construction and Maintenance Occupations by Sex
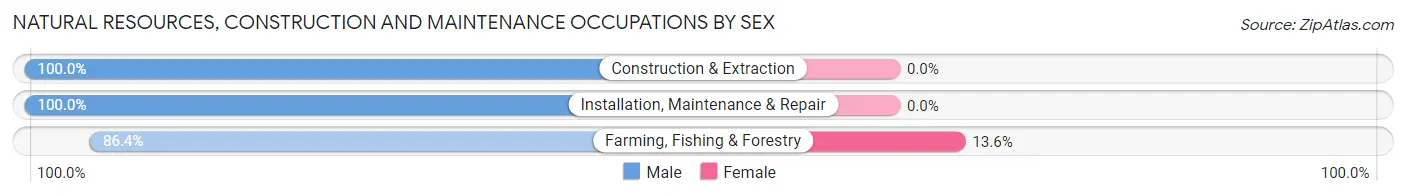
| Occupation | Male | Female |
| Farming, Fishing & Forestry | 19 (86.4%) | 3 (13.6%) |
| Construction & Extraction | 32 (100.0%) | 0 (0.0%) |
| Installation, Maintenance & Repair | 27 (100.0%) | 0 (0.0%) |
| Total (Category) | 78 (96.3%) | 3 (3.7%) |
| Total (Overall) | 211 (59.3%) | 145 (40.7%) |
Production, Transportation and Moving Occupations
The most common Production, Transportation and Moving occupations in Scribner are Production (39 | 11.0%), Material Moving (16 | 4.5%), and Transportation (11 | 3.1%).
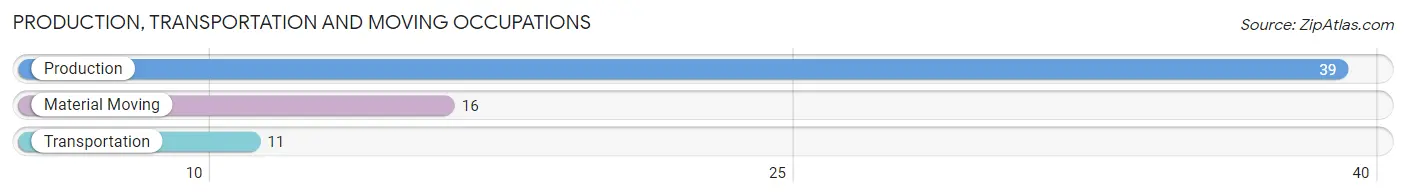
Production, Transportation and Moving Occupations by Sex
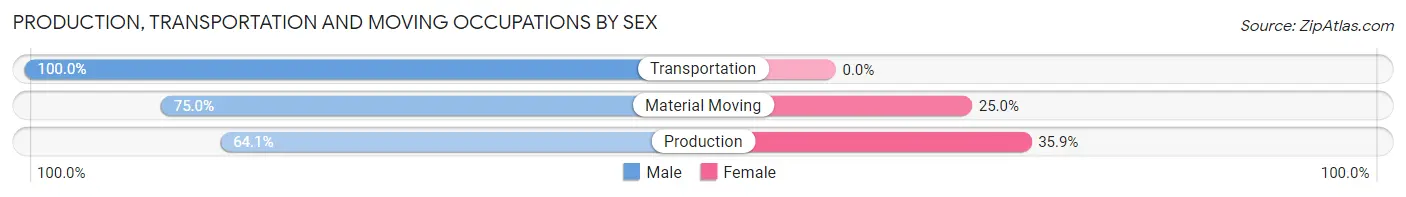
| Occupation | Male | Female |
| Production | 25 (64.1%) | 14 (35.9%) |
| Transportation | 11 (100.0%) | 0 (0.0%) |
| Material Moving | 12 (75.0%) | 4 (25.0%) |
| Total (Category) | 48 (72.7%) | 18 (27.3%) |
| Total (Overall) | 211 (59.3%) | 145 (40.7%) |
Employment Industries by Sex in Scribner
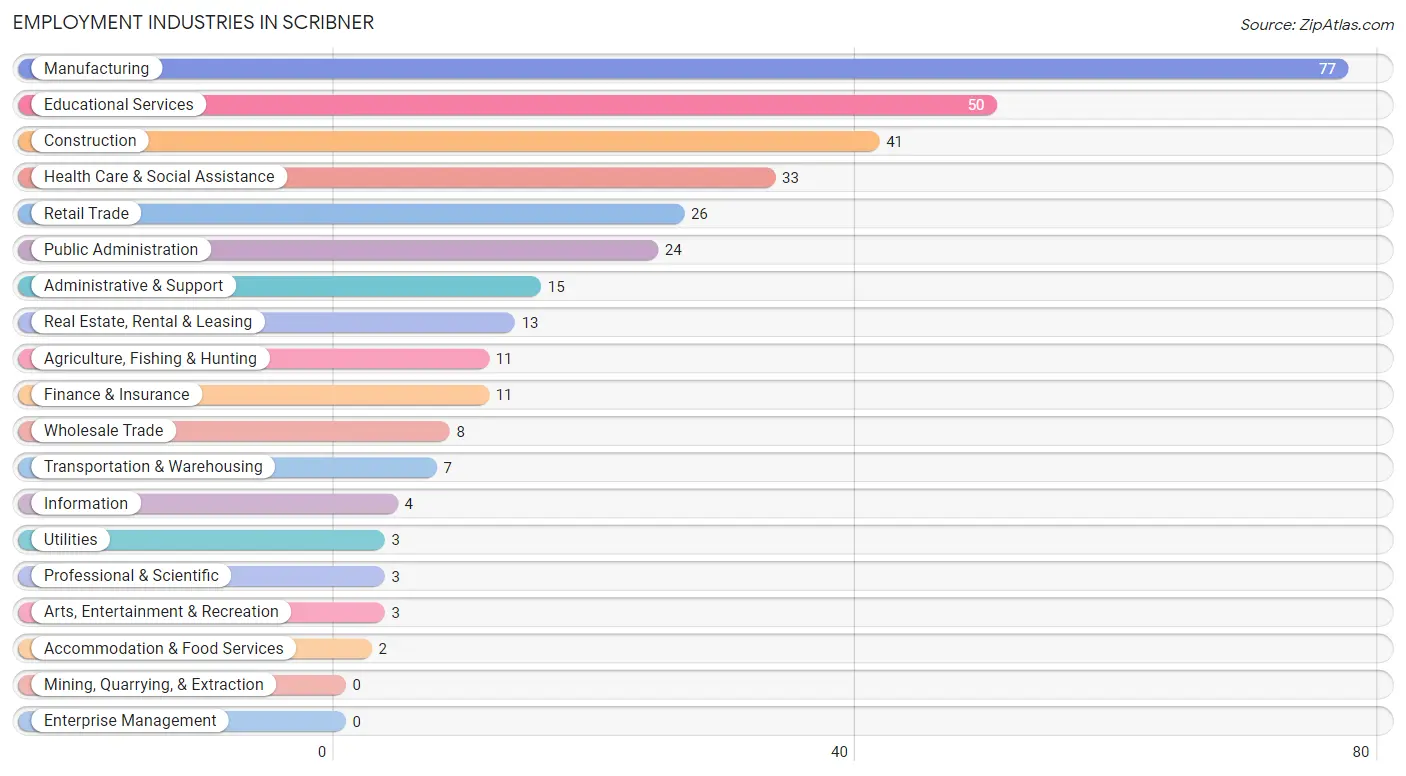
Employment Industries in Scribner
The major employment industries in Scribner include Manufacturing (77 | 21.6%), Educational Services (50 | 14.0%), Construction (41 | 11.5%), Health Care & Social Assistance (33 | 9.3%), and Retail Trade (26 | 7.3%).
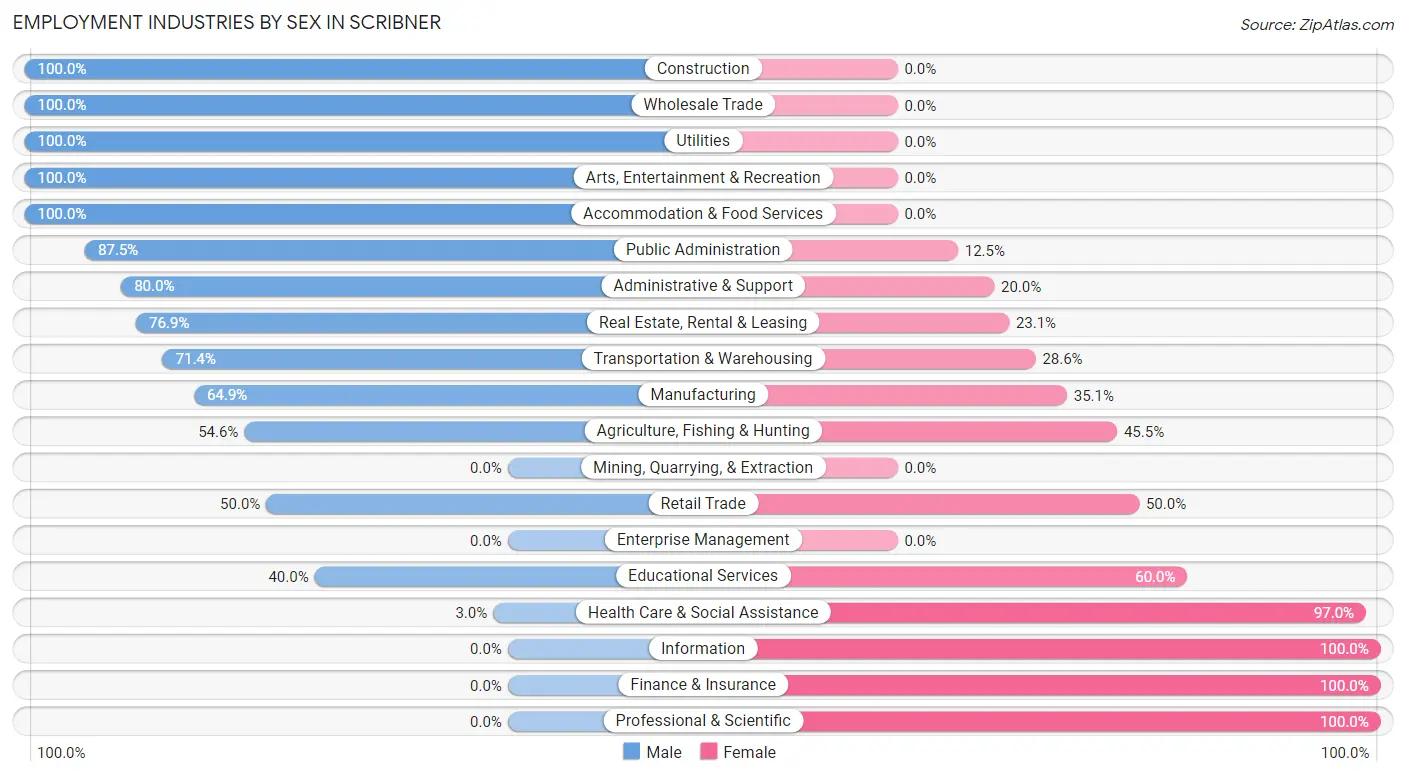
Employment Industries by Sex in Scribner
The Scribner industries that see more men than women are Construction (100.0%), Wholesale Trade (100.0%), and Utilities (100.0%), whereas the industries that tend to have a higher number of women are Information (100.0%), Finance & Insurance (100.0%), and Professional & Scientific (100.0%).
| Industry | Male | Female |
| Agriculture, Fishing & Hunting | 6 (54.5%) | 5 (45.5%) |
| Mining, Quarrying, & Extraction | 0 (0.0%) | 0 (0.0%) |
| Construction | 41 (100.0%) | 0 (0.0%) |
| Manufacturing | 50 (64.9%) | 27 (35.1%) |
| Wholesale Trade | 8 (100.0%) | 0 (0.0%) |
| Retail Trade | 13 (50.0%) | 13 (50.0%) |
| Transportation & Warehousing | 5 (71.4%) | 2 (28.6%) |
| Utilities | 3 (100.0%) | 0 (0.0%) |
| Information | 0 (0.0%) | 4 (100.0%) |
| Finance & Insurance | 0 (0.0%) | 11 (100.0%) |
| Real Estate, Rental & Leasing | 10 (76.9%) | 3 (23.1%) |
| Professional & Scientific | 0 (0.0%) | 3 (100.0%) |
| Enterprise Management | 0 (0.0%) | 0 (0.0%) |
| Administrative & Support | 12 (80.0%) | 3 (20.0%) |
| Educational Services | 20 (40.0%) | 30 (60.0%) |
| Health Care & Social Assistance | 1 (3.0%) | 32 (97.0%) |
| Arts, Entertainment & Recreation | 3 (100.0%) | 0 (0.0%) |
| Accommodation & Food Services | 2 (100.0%) | 0 (0.0%) |
| Public Administration | 21 (87.5%) | 3 (12.5%) |
| Total | 211 (59.3%) | 145 (40.7%) |
Education in Scribner
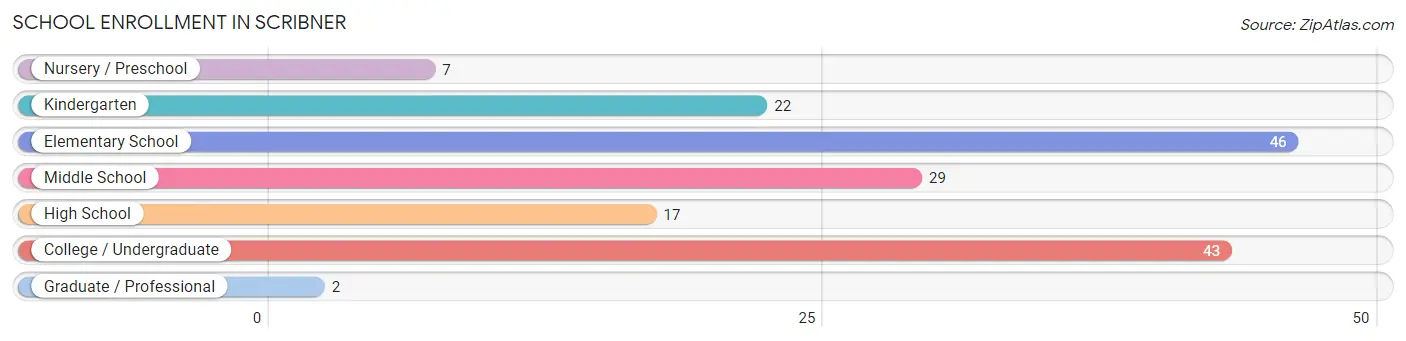
School Enrollment in Scribner
The most common levels of schooling among the 166 students in Scribner are elementary school (46 | 27.7%), college / undergraduate (43 | 25.9%), and middle school (29 | 17.5%).
| School Level | # Students | % Students |
| Nursery / Preschool | 7 | 4.2% |
| Kindergarten | 22 | 13.3% |
| Elementary School | 46 | 27.7% |
| Middle School | 29 | 17.5% |
| High School | 17 | 10.2% |
| College / Undergraduate | 43 | 25.9% |
| Graduate / Professional | 2 | 1.2% |
| Total | 166 | 100.0% |
School Enrollment by Age by Funding Source in Scribner
Out of a total of 166 students who are enrolled in schools in Scribner, 22 (13.3%) attend a private institution, while the remaining 144 (86.7%) are enrolled in public schools. The age group of 3 to 4 year olds has the highest likelihood of being enrolled in private schools, with 4 (100.0% in the age bracket) enrolled. Conversely, the age group of 15 to 17 year olds has the lowest likelihood of being enrolled in a private school, with 17 (100.0% in the age bracket) attending a public institution.
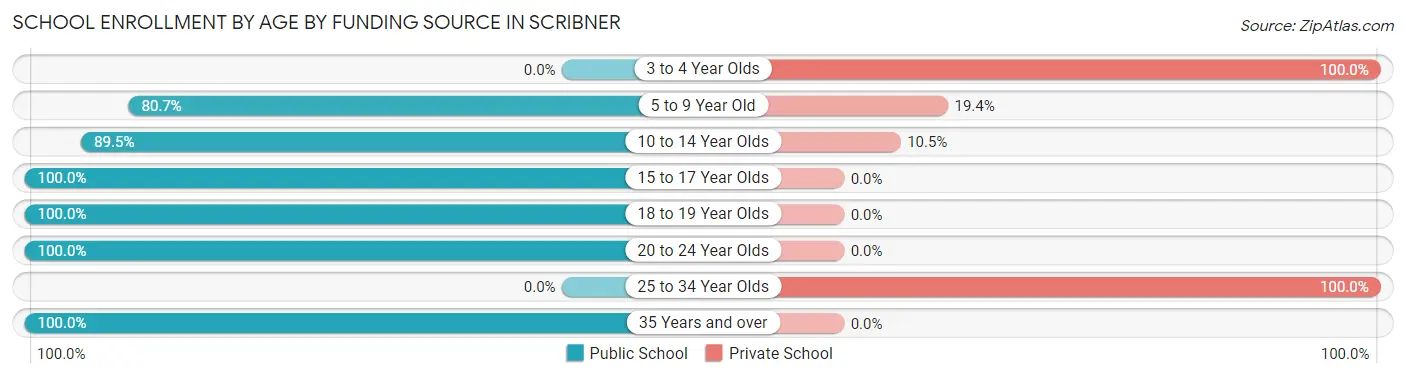
| Age Bracket | Public School | Private School |
| 3 to 4 Year Olds | 0 (0.0%) | 4 (100.0%) |
| 5 to 9 Year Old | 50 (80.6%) | 12 (19.4%) |
| 10 to 14 Year Olds | 34 (89.5%) | 4 (10.5%) |
| 15 to 17 Year Olds | 17 (100.0%) | 0 (0.0%) |
| 18 to 19 Year Olds | 20 (100.0%) | 0 (0.0%) |
| 20 to 24 Year Olds | 20 (100.0%) | 0 (0.0%) |
| 25 to 34 Year Olds | 0 (0.0%) | 2 (100.0%) |
| 35 Years and over | 3 (100.0%) | 0 (0.0%) |
| Total | 144 (86.7%) | 22 (13.3%) |
Educational Attainment by Field of Study in Scribner
Education (32 | 25.8%), psychology (24 | 19.4%), business (17 | 13.7%), science & technology (14 | 11.3%), and engineering (10 | 8.1%) are the most common fields of study among 124 individuals in Scribner who have obtained a bachelor's degree or higher.
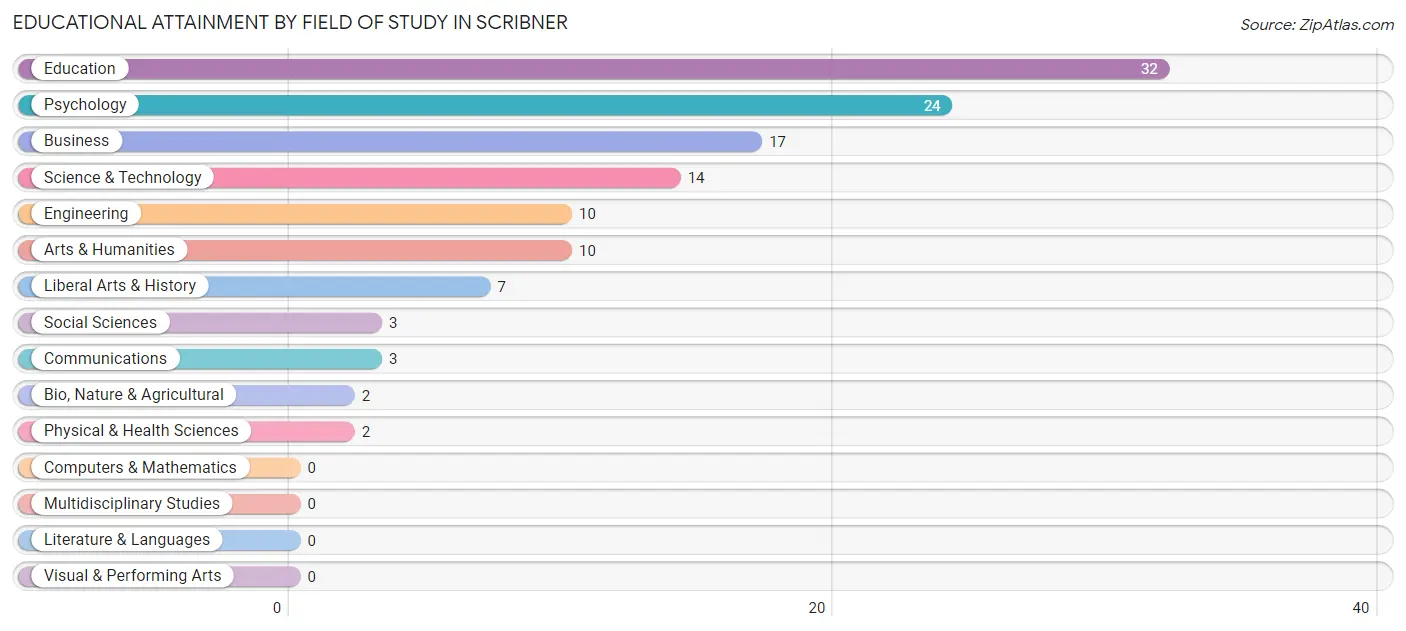
| Field of Study | # Graduates | % Graduates |
| Computers & Mathematics | 0 | 0.0% |
| Bio, Nature & Agricultural | 2 | 1.6% |
| Physical & Health Sciences | 2 | 1.6% |
| Psychology | 24 | 19.4% |
| Social Sciences | 3 | 2.4% |
| Engineering | 10 | 8.1% |
| Multidisciplinary Studies | 0 | 0.0% |
| Science & Technology | 14 | 11.3% |
| Business | 17 | 13.7% |
| Education | 32 | 25.8% |
| Literature & Languages | 0 | 0.0% |
| Liberal Arts & History | 7 | 5.7% |
| Visual & Performing Arts | 0 | 0.0% |
| Communications | 3 | 2.4% |
| Arts & Humanities | 10 | 8.1% |
| Total | 124 | 100.0% |
Transportation & Commute in Scribner
Vehicle Availability by Sex in Scribner
The most prevalent vehicle ownership categories in Scribner are males with 3 vehicles (74, accounting for 35.1%) and females with 3 vehicles (40, making up 54.8%).
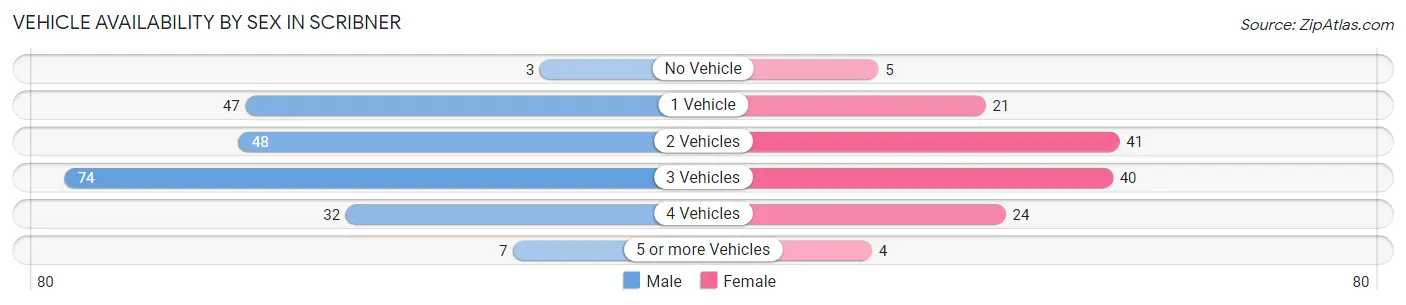
| Vehicles Available | Male | Female |
| No Vehicle | 3 (1.4%) | 5 (3.7%) |
| 1 Vehicle | 47 (22.3%) | 21 (15.6%) |
| 2 Vehicles | 48 (22.8%) | 41 (30.4%) |
| 3 Vehicles | 74 (35.1%) | 40 (29.6%) |
| 4 Vehicles | 32 (15.2%) | 24 (17.8%) |
| 5 or more Vehicles | 7 (3.3%) | 4 (3.0%) |
| Total | 211 (100.0%) | 135 (100.0%) |
Commute Time in Scribner
The most frequently occuring commute durations in Scribner are less than 5 minutes (62 commuters, 18.4%), 20 to 24 minutes (60 commuters, 17.8%), and 10 to 14 minutes (58 commuters, 17.2%).
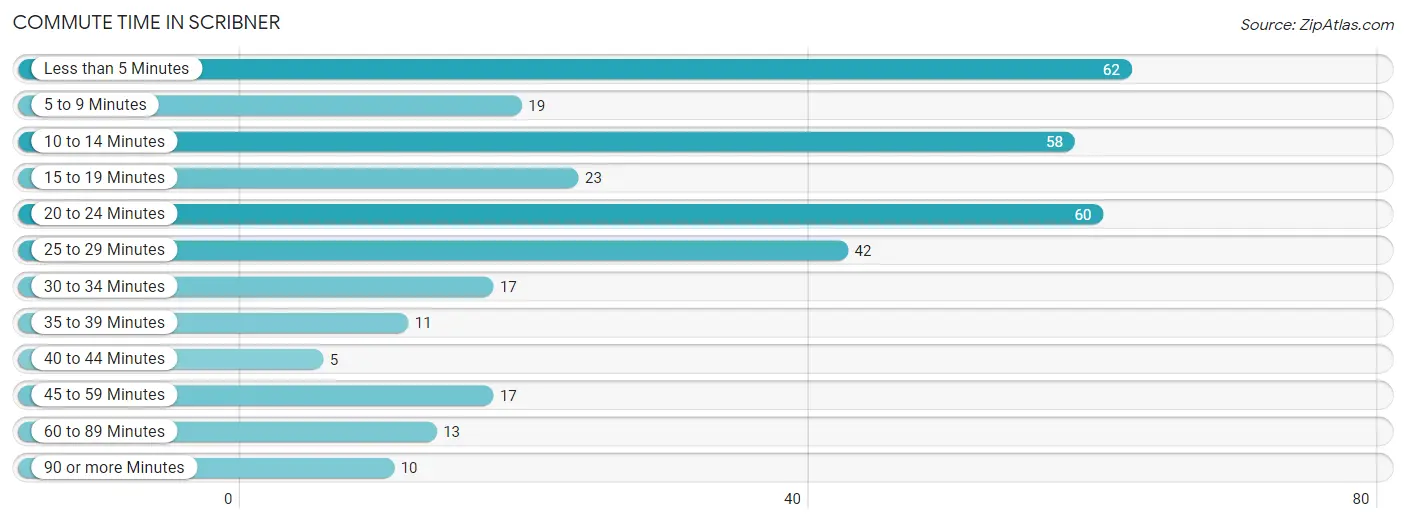
| Commute Time | # Commuters | % Commuters |
| Less than 5 Minutes | 62 | 18.4% |
| 5 to 9 Minutes | 19 | 5.6% |
| 10 to 14 Minutes | 58 | 17.2% |
| 15 to 19 Minutes | 23 | 6.8% |
| 20 to 24 Minutes | 60 | 17.8% |
| 25 to 29 Minutes | 42 | 12.5% |
| 30 to 34 Minutes | 17 | 5.0% |
| 35 to 39 Minutes | 11 | 3.3% |
| 40 to 44 Minutes | 5 | 1.5% |
| 45 to 59 Minutes | 17 | 5.0% |
| 60 to 89 Minutes | 13 | 3.9% |
| 90 or more Minutes | 10 | 3.0% |
Commute Time by Sex in Scribner
The most common commute times in Scribner are 10 to 14 minutes (51 commuters, 24.3%) for males and less than 5 minutes (29 commuters, 22.8%) for females.
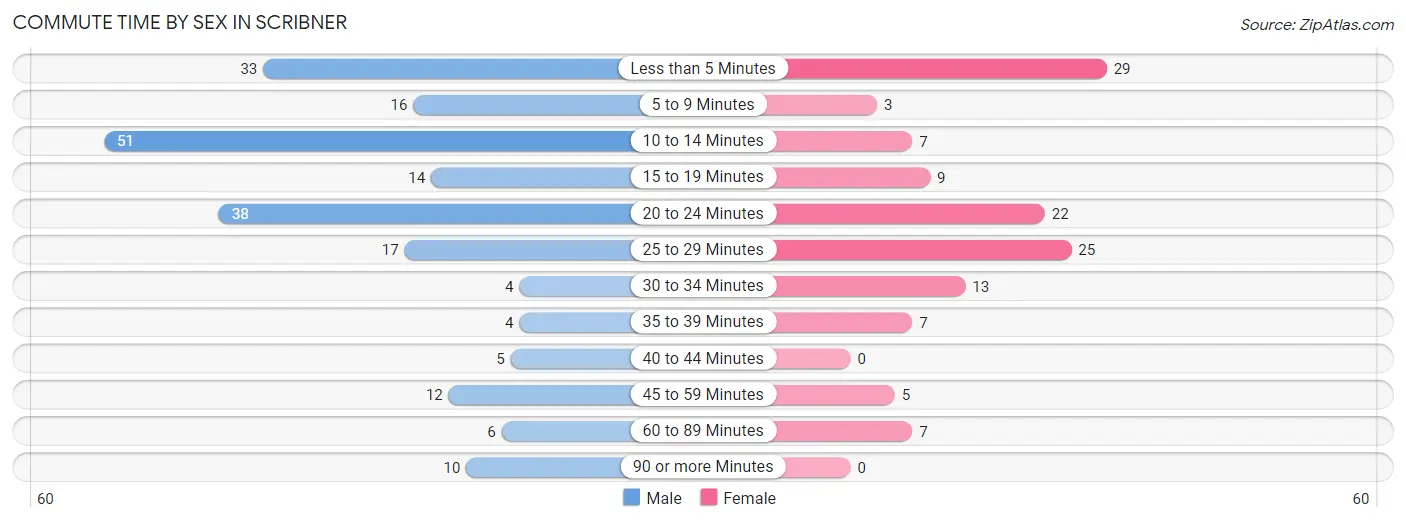
| Commute Time | Male | Female |
| Less than 5 Minutes | 33 (15.7%) | 29 (22.8%) |
| 5 to 9 Minutes | 16 (7.6%) | 3 (2.4%) |
| 10 to 14 Minutes | 51 (24.3%) | 7 (5.5%) |
| 15 to 19 Minutes | 14 (6.7%) | 9 (7.1%) |
| 20 to 24 Minutes | 38 (18.1%) | 22 (17.3%) |
| 25 to 29 Minutes | 17 (8.1%) | 25 (19.7%) |
| 30 to 34 Minutes | 4 (1.9%) | 13 (10.2%) |
| 35 to 39 Minutes | 4 (1.9%) | 7 (5.5%) |
| 40 to 44 Minutes | 5 (2.4%) | 0 (0.0%) |
| 45 to 59 Minutes | 12 (5.7%) | 5 (3.9%) |
| 60 to 89 Minutes | 6 (2.9%) | 7 (5.5%) |
| 90 or more Minutes | 10 (4.8%) | 0 (0.0%) |
Time of Departure to Work by Sex in Scribner
The most frequent times of departure to work in Scribner are 6:30 AM to 6:59 AM (55, 26.2%) for males and 7:00 AM to 7:29 AM (34, 26.8%) for females.
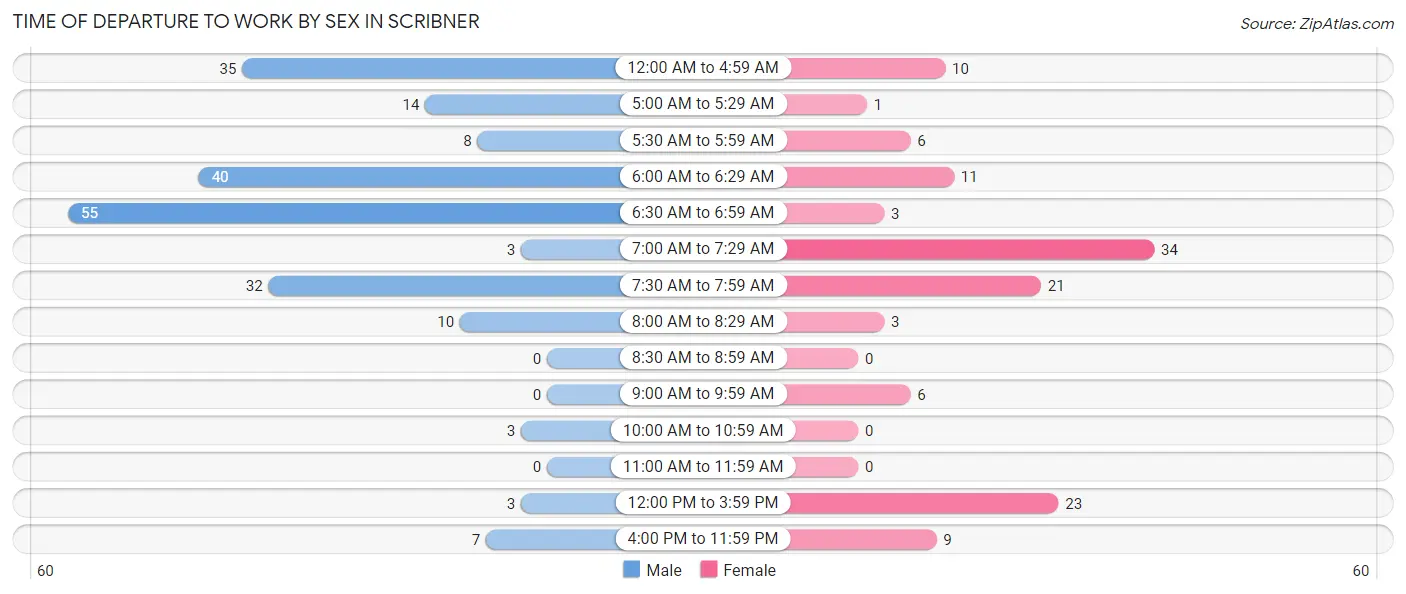
| Time of Departure | Male | Female |
| 12:00 AM to 4:59 AM | 35 (16.7%) | 10 (7.9%) |
| 5:00 AM to 5:29 AM | 14 (6.7%) | 1 (0.8%) |
| 5:30 AM to 5:59 AM | 8 (3.8%) | 6 (4.7%) |
| 6:00 AM to 6:29 AM | 40 (19.1%) | 11 (8.7%) |
| 6:30 AM to 6:59 AM | 55 (26.2%) | 3 (2.4%) |
| 7:00 AM to 7:29 AM | 3 (1.4%) | 34 (26.8%) |
| 7:30 AM to 7:59 AM | 32 (15.2%) | 21 (16.5%) |
| 8:00 AM to 8:29 AM | 10 (4.8%) | 3 (2.4%) |
| 8:30 AM to 8:59 AM | 0 (0.0%) | 0 (0.0%) |
| 9:00 AM to 9:59 AM | 0 (0.0%) | 6 (4.7%) |
| 10:00 AM to 10:59 AM | 3 (1.4%) | 0 (0.0%) |
| 11:00 AM to 11:59 AM | 0 (0.0%) | 0 (0.0%) |
| 12:00 PM to 3:59 PM | 3 (1.4%) | 23 (18.1%) |
| 4:00 PM to 11:59 PM | 7 (3.3%) | 9 (7.1%) |
| Total | 210 (100.0%) | 127 (100.0%) |
Housing Occupancy in Scribner
Occupancy by Ownership in Scribner
Of the total 324 dwellings in Scribner, owner-occupied units account for 273 (84.3%), while renter-occupied units make up 51 (15.7%).

| Occupancy | # Housing Units | % Housing Units |
| Owner Occupied Housing Units | 273 | 84.3% |
| Renter-Occupied Housing Units | 51 | 15.7% |
| Total Occupied Housing Units | 324 | 100.0% |
Occupancy by Household Size in Scribner
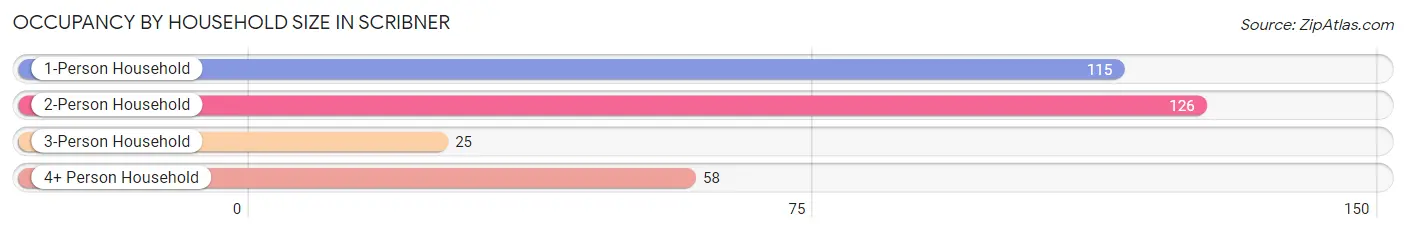
| Household Size | # Housing Units | % Housing Units |
| 1-Person Household | 115 | 35.5% |
| 2-Person Household | 126 | 38.9% |
| 3-Person Household | 25 | 7.7% |
| 4+ Person Household | 58 | 17.9% |
| Total Housing Units | 324 | 100.0% |
Occupancy by Ownership by Household Size in Scribner
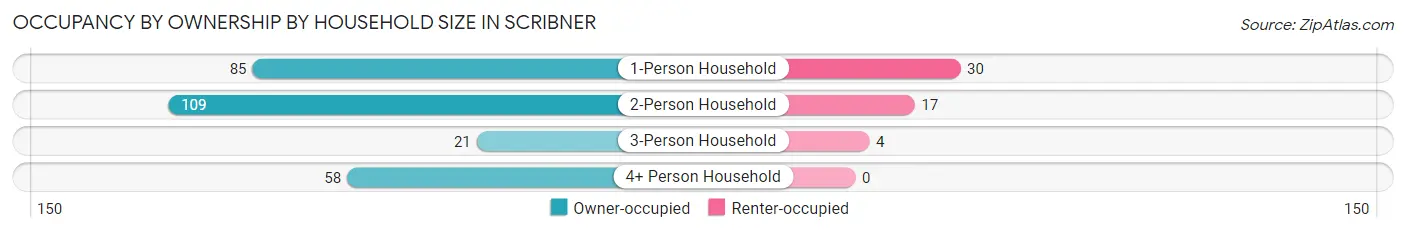
| Household Size | Owner-occupied | Renter-occupied |
| 1-Person Household | 85 (73.9%) | 30 (26.1%) |
| 2-Person Household | 109 (86.5%) | 17 (13.5%) |
| 3-Person Household | 21 (84.0%) | 4 (16.0%) |
| 4+ Person Household | 58 (100.0%) | 0 (0.0%) |
| Total Housing Units | 273 (84.3%) | 51 (15.7%) |
Occupancy by Educational Attainment in Scribner
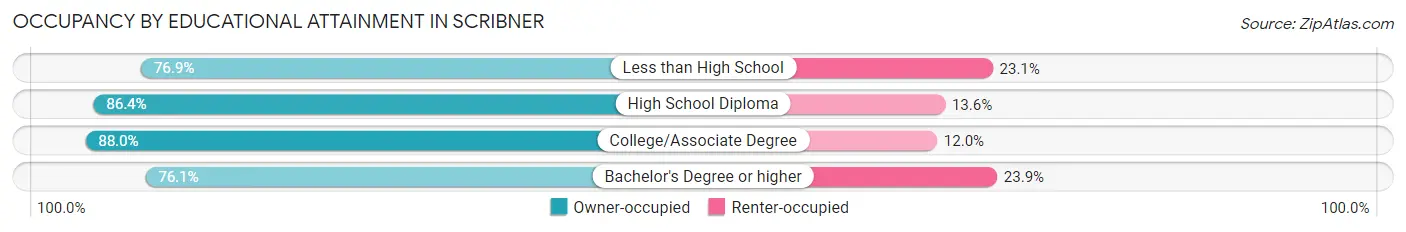
| Household Size | Owner-occupied | Renter-occupied |
| Less than High School | 10 (76.9%) | 3 (23.1%) |
| High School Diploma | 114 (86.4%) | 18 (13.6%) |
| College/Associate Degree | 95 (88.0%) | 13 (12.0%) |
| Bachelor's Degree or higher | 54 (76.1%) | 17 (23.9%) |
Occupancy by Age of Householder in Scribner
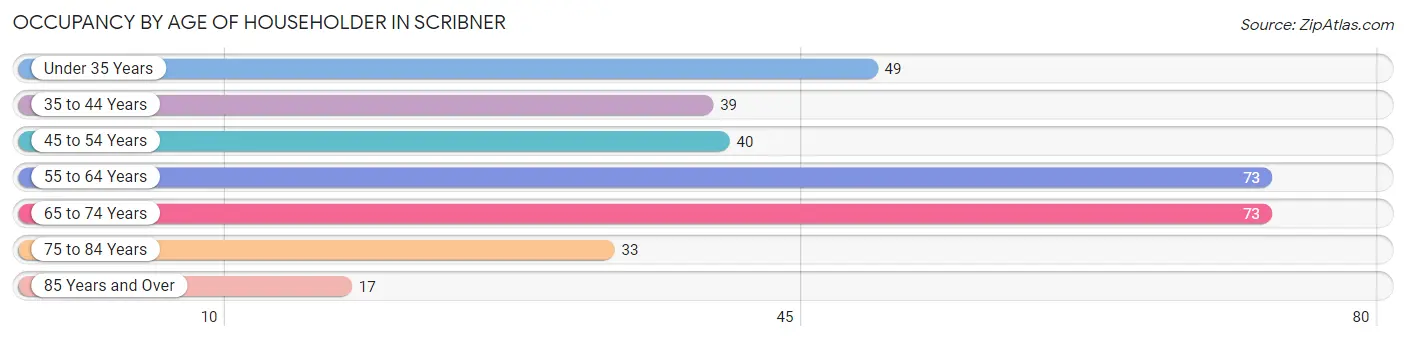
| Age Bracket | # Households | % Households |
| Under 35 Years | 49 | 15.1% |
| 35 to 44 Years | 39 | 12.0% |
| 45 to 54 Years | 40 | 12.3% |
| 55 to 64 Years | 73 | 22.5% |
| 65 to 74 Years | 73 | 22.5% |
| 75 to 84 Years | 33 | 10.2% |
| 85 Years and Over | 17 | 5.2% |
| Total | 324 | 100.0% |
Housing Finances in Scribner
Median Income by Occupancy in Scribner
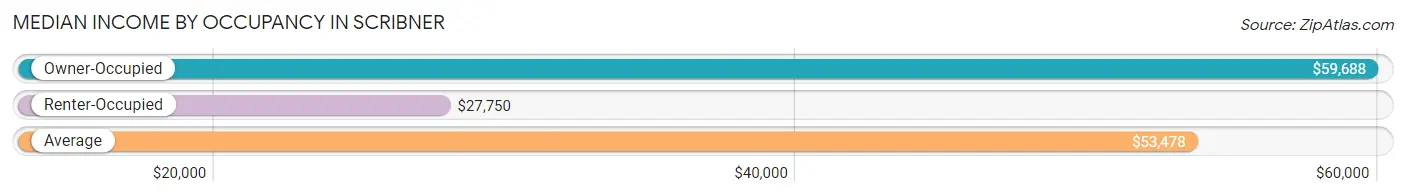
| Occupancy Type | # Households | Median Income |
| Owner-Occupied | 273 (84.3%) | $59,688 |
| Renter-Occupied | 51 (15.7%) | $27,750 |
| Average | 324 (100.0%) | $53,478 |
Occupancy by Householder Income Bracket in Scribner
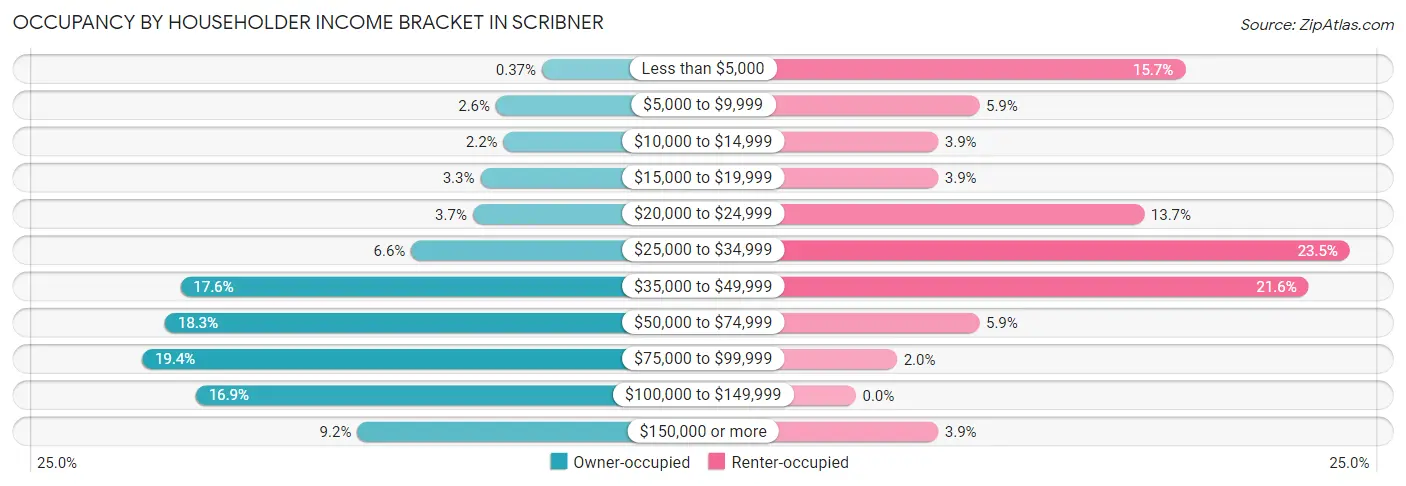
| Income Bracket | Owner-occupied | Renter-occupied |
| Less than $5,000 | 1 (0.4%) | 8 (15.7%) |
| $5,000 to $9,999 | 7 (2.6%) | 3 (5.9%) |
| $10,000 to $14,999 | 6 (2.2%) | 2 (3.9%) |
| $15,000 to $19,999 | 9 (3.3%) | 2 (3.9%) |
| $20,000 to $24,999 | 10 (3.7%) | 7 (13.7%) |
| $25,000 to $34,999 | 18 (6.6%) | 12 (23.5%) |
| $35,000 to $49,999 | 48 (17.6%) | 11 (21.6%) |
| $50,000 to $74,999 | 50 (18.3%) | 3 (5.9%) |
| $75,000 to $99,999 | 53 (19.4%) | 1 (2.0%) |
| $100,000 to $149,999 | 46 (16.9%) | 0 (0.0%) |
| $150,000 or more | 25 (9.2%) | 2 (3.9%) |
| Total | 273 (100.0%) | 51 (100.0%) |
Monthly Housing Cost Tiers in Scribner
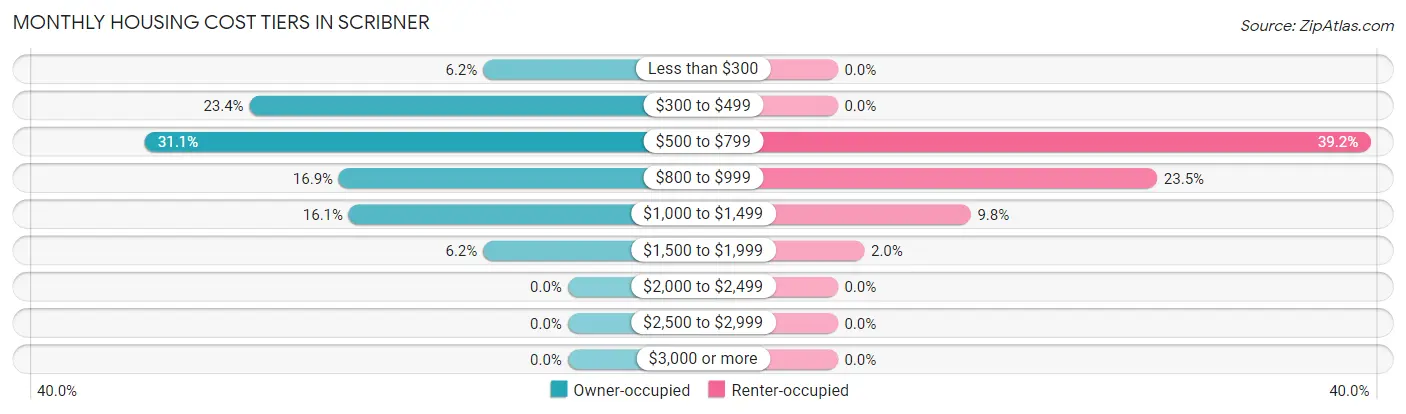
| Monthly Cost | Owner-occupied | Renter-occupied |
| Less than $300 | 17 (6.2%) | 0 (0.0%) |
| $300 to $499 | 64 (23.4%) | 0 (0.0%) |
| $500 to $799 | 85 (31.1%) | 20 (39.2%) |
| $800 to $999 | 46 (16.9%) | 12 (23.5%) |
| $1,000 to $1,499 | 44 (16.1%) | 5 (9.8%) |
| $1,500 to $1,999 | 17 (6.2%) | 1 (2.0%) |
| $2,000 to $2,499 | 0 (0.0%) | 0 (0.0%) |
| $2,500 to $2,999 | 0 (0.0%) | 0 (0.0%) |
| $3,000 or more | 0 (0.0%) | 0 (0.0%) |
| Total | 273 (100.0%) | 51 (100.0%) |
Physical Housing Characteristics in Scribner
Housing Structures in Scribner
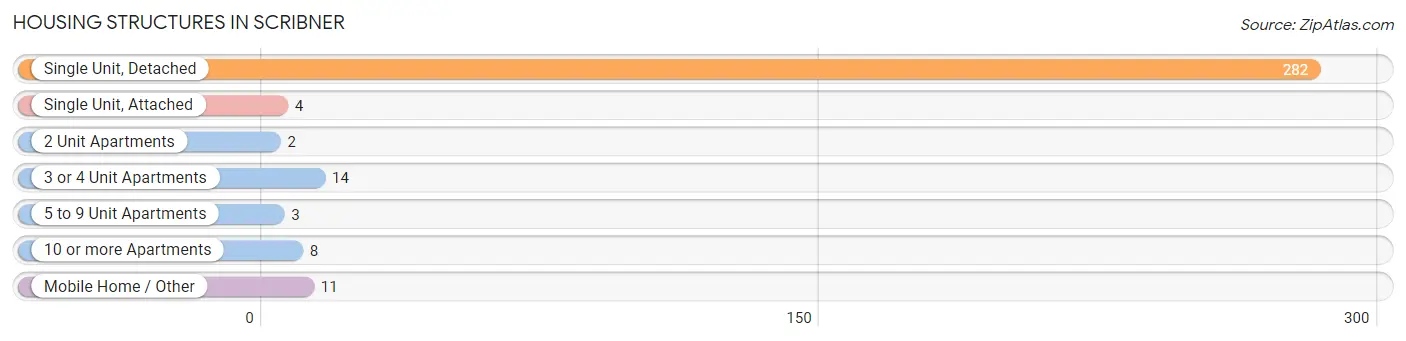
| Structure Type | # Housing Units | % Housing Units |
| Single Unit, Detached | 282 | 87.0% |
| Single Unit, Attached | 4 | 1.2% |
| 2 Unit Apartments | 2 | 0.6% |
| 3 or 4 Unit Apartments | 14 | 4.3% |
| 5 to 9 Unit Apartments | 3 | 0.9% |
| 10 or more Apartments | 8 | 2.5% |
| Mobile Home / Other | 11 | 3.4% |
| Total | 324 | 100.0% |
Housing Structures by Occupancy in Scribner
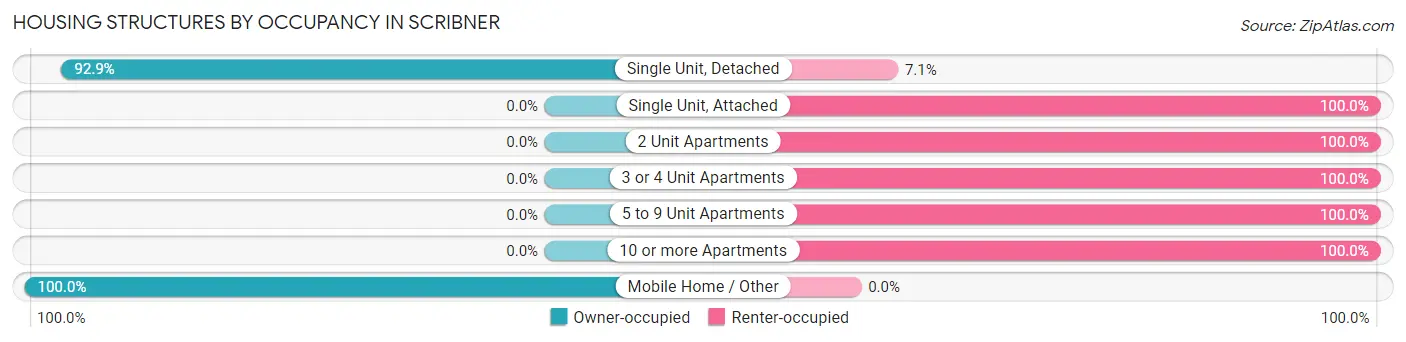
| Structure Type | Owner-occupied | Renter-occupied |
| Single Unit, Detached | 262 (92.9%) | 20 (7.1%) |
| Single Unit, Attached | 0 (0.0%) | 4 (100.0%) |
| 2 Unit Apartments | 0 (0.0%) | 2 (100.0%) |
| 3 or 4 Unit Apartments | 0 (0.0%) | 14 (100.0%) |
| 5 to 9 Unit Apartments | 0 (0.0%) | 3 (100.0%) |
| 10 or more Apartments | 0 (0.0%) | 8 (100.0%) |
| Mobile Home / Other | 11 (100.0%) | 0 (0.0%) |
| Total | 273 (84.3%) | 51 (15.7%) |
Housing Structures by Number of Rooms in Scribner
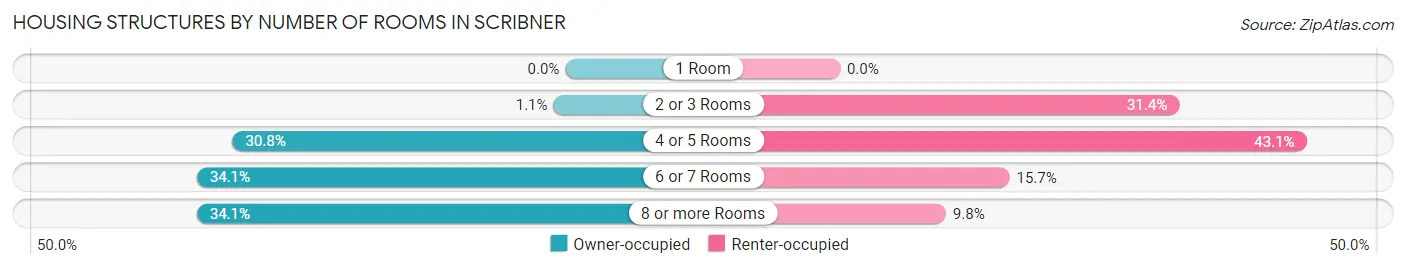
| Number of Rooms | Owner-occupied | Renter-occupied |
| 1 Room | 0 (0.0%) | 0 (0.0%) |
| 2 or 3 Rooms | 3 (1.1%) | 16 (31.4%) |
| 4 or 5 Rooms | 84 (30.8%) | 22 (43.1%) |
| 6 or 7 Rooms | 93 (34.1%) | 8 (15.7%) |
| 8 or more Rooms | 93 (34.1%) | 5 (9.8%) |
| Total | 273 (100.0%) | 51 (100.0%) |
Housing Structure by Heating Type in Scribner
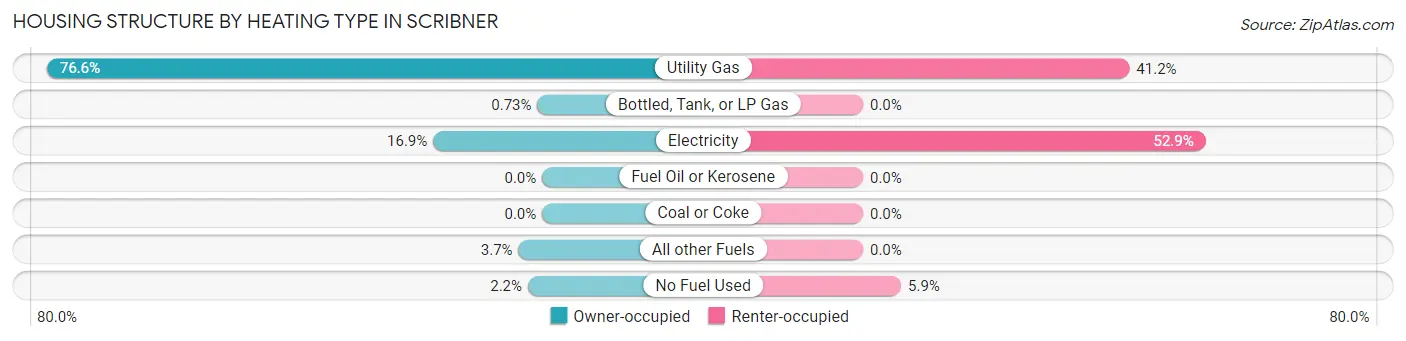
| Heating Type | Owner-occupied | Renter-occupied |
| Utility Gas | 209 (76.6%) | 21 (41.2%) |
| Bottled, Tank, or LP Gas | 2 (0.7%) | 0 (0.0%) |
| Electricity | 46 (16.9%) | 27 (52.9%) |
| Fuel Oil or Kerosene | 0 (0.0%) | 0 (0.0%) |
| Coal or Coke | 0 (0.0%) | 0 (0.0%) |
| All other Fuels | 10 (3.7%) | 0 (0.0%) |
| No Fuel Used | 6 (2.2%) | 3 (5.9%) |
| Total | 273 (100.0%) | 51 (100.0%) |
Household Vehicle Usage in Scribner
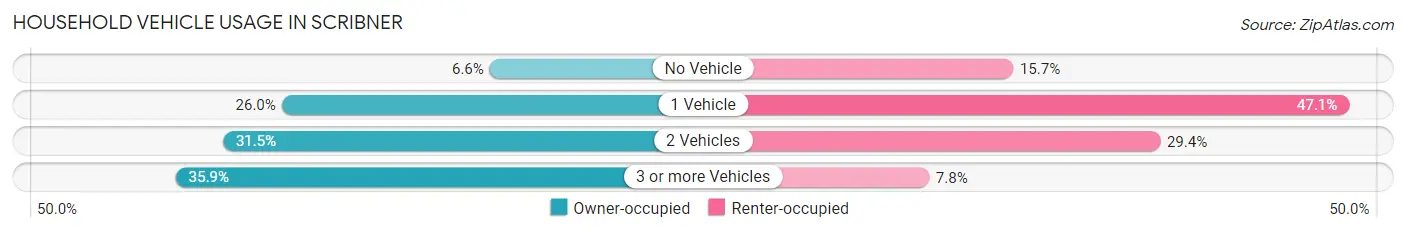
| Vehicles per Household | Owner-occupied | Renter-occupied |
| No Vehicle | 18 (6.6%) | 8 (15.7%) |
| 1 Vehicle | 71 (26.0%) | 24 (47.1%) |
| 2 Vehicles | 86 (31.5%) | 15 (29.4%) |
| 3 or more Vehicles | 98 (35.9%) | 4 (7.8%) |
| Total | 273 (100.0%) | 51 (100.0%) |
Real Estate & Mortgages in Scribner
Real Estate and Mortgage Overview in Scribner
| Characteristic | Without Mortgage | With Mortgage |
| Housing Units | 160 | 113 |
| Median Property Value | $90,800 | $119,300 |
| Median Household Income | $52,619 | $11 |
| Monthly Housing Costs | $497 | $0 |
| Real Estate Taxes | $1,108 | $2 |
Property Value by Mortgage Status in Scribner
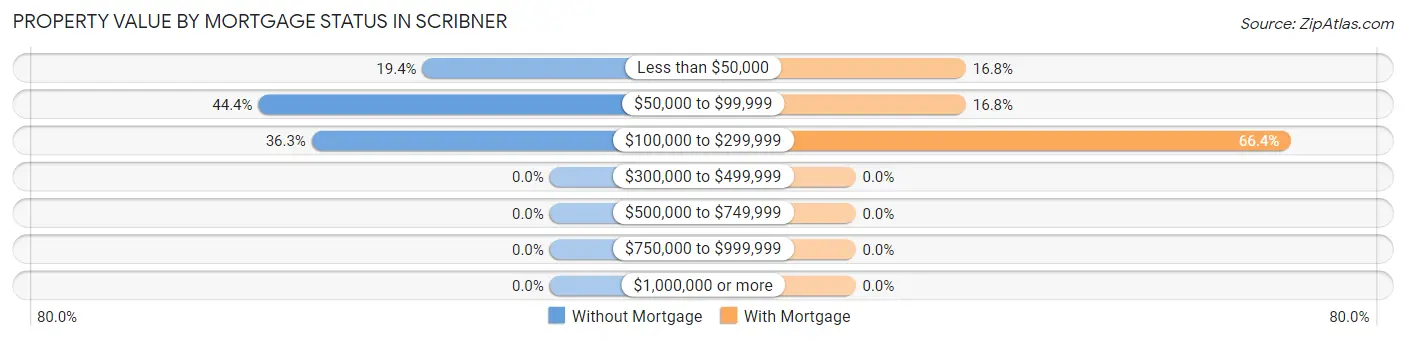
| Property Value | Without Mortgage | With Mortgage |
| Less than $50,000 | 31 (19.4%) | 19 (16.8%) |
| $50,000 to $99,999 | 71 (44.4%) | 19 (16.8%) |
| $100,000 to $299,999 | 58 (36.2%) | 75 (66.4%) |
| $300,000 to $499,999 | 0 (0.0%) | 0 (0.0%) |
| $500,000 to $749,999 | 0 (0.0%) | 0 (0.0%) |
| $750,000 to $999,999 | 0 (0.0%) | 0 (0.0%) |
| $1,000,000 or more | 0 (0.0%) | 0 (0.0%) |
| Total | 160 (100.0%) | 113 (100.0%) |
Household Income by Mortgage Status in Scribner
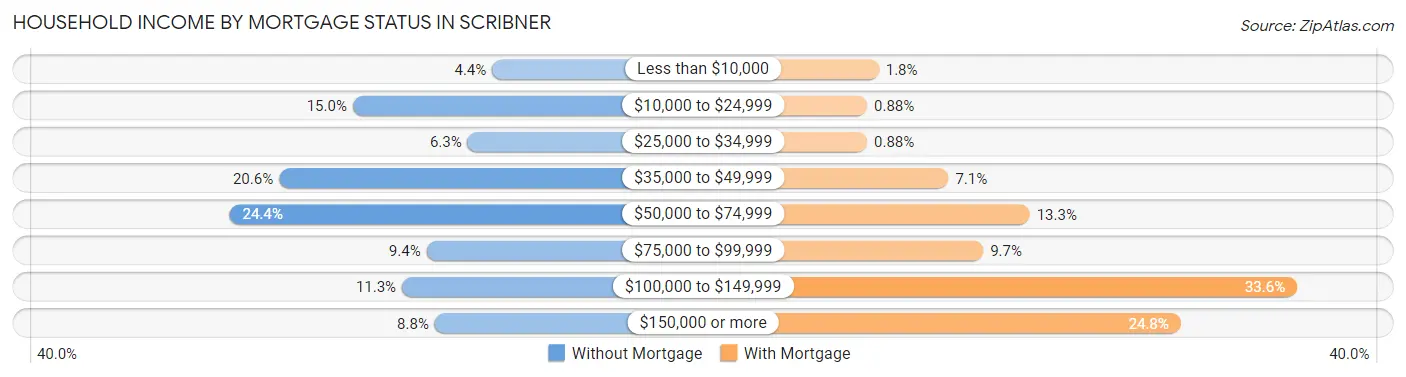
| Household Income | Without Mortgage | With Mortgage |
| Less than $10,000 | 7 (4.4%) | 2 (1.8%) |
| $10,000 to $24,999 | 24 (15.0%) | 1 (0.9%) |
| $25,000 to $34,999 | 10 (6.2%) | 1 (0.9%) |
| $35,000 to $49,999 | 33 (20.6%) | 8 (7.1%) |
| $50,000 to $74,999 | 39 (24.4%) | 15 (13.3%) |
| $75,000 to $99,999 | 15 (9.4%) | 11 (9.7%) |
| $100,000 to $149,999 | 18 (11.3%) | 38 (33.6%) |
| $150,000 or more | 14 (8.7%) | 28 (24.8%) |
| Total | 160 (100.0%) | 113 (100.0%) |
Property Value to Household Income Ratio in Scribner
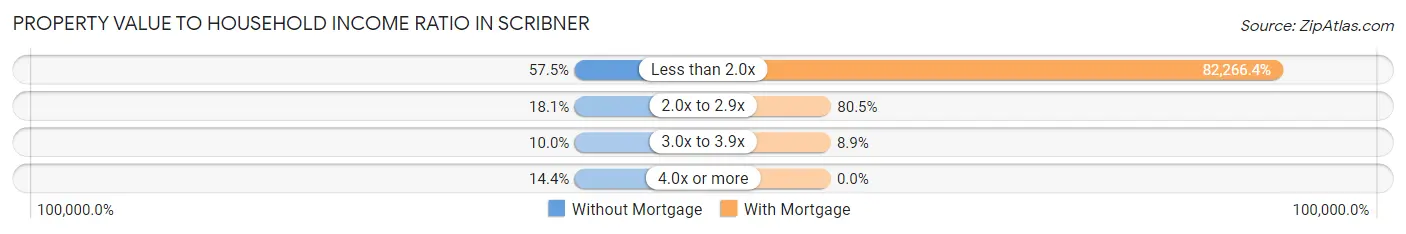
| Value-to-Income Ratio | Without Mortgage | With Mortgage |
| Less than 2.0x | 92 (57.5%) | 92,961 (82,266.4%) |
| 2.0x to 2.9x | 29 (18.1%) | 91 (80.5%) |
| 3.0x to 3.9x | 16 (10.0%) | 10 (8.8%) |
| 4.0x or more | 23 (14.4%) | 0 (0.0%) |
| Total | 160 (100.0%) | 113 (100.0%) |
Real Estate Taxes by Mortgage Status in Scribner
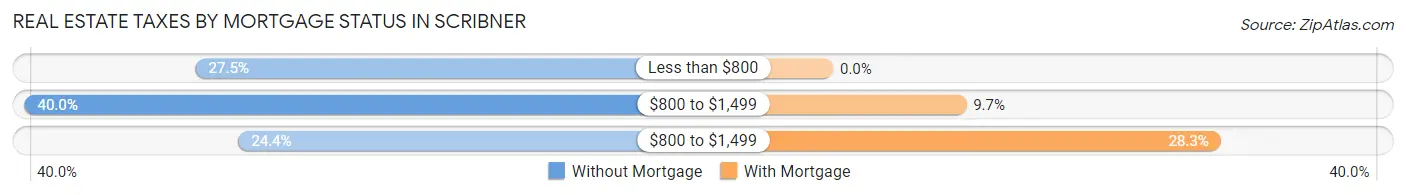
| Property Taxes | Without Mortgage | With Mortgage |
| Less than $800 | 44 (27.5%) | 0 (0.0%) |
| $800 to $1,499 | 64 (40.0%) | 11 (9.7%) |
| $800 to $1,499 | 39 (24.4%) | 32 (28.3%) |
| Total | 160 (100.0%) | 113 (100.0%) |
Health & Disability in Scribner
Health Insurance Coverage by Age in Scribner
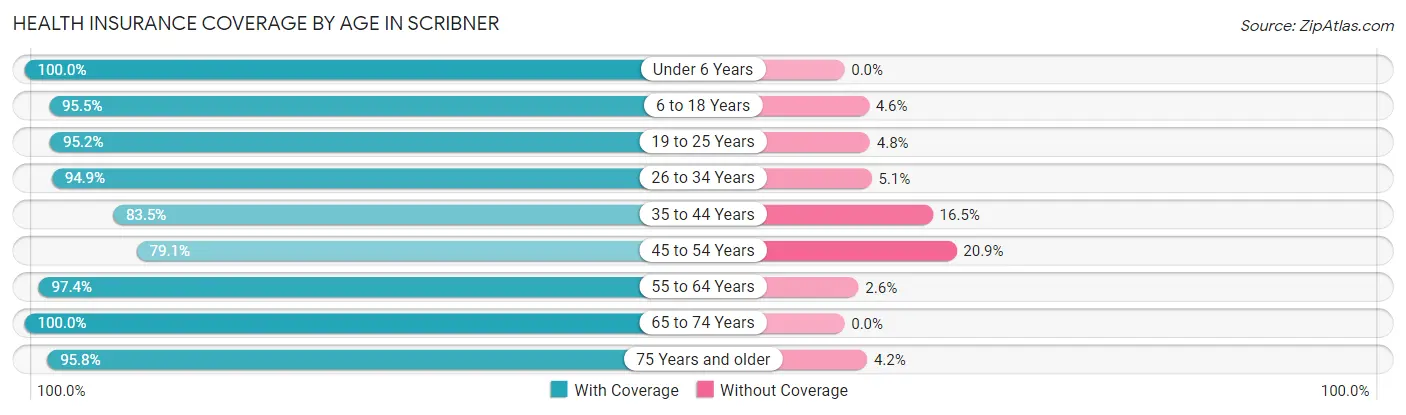
| Age Bracket | With Coverage | Without Coverage |
| Under 6 Years | 53 (100.0%) | 0 (0.0%) |
| 6 to 18 Years | 126 (95.5%) | 6 (4.5%) |
| 19 to 25 Years | 60 (95.2%) | 3 (4.8%) |
| 26 to 34 Years | 56 (94.9%) | 3 (5.1%) |
| 35 to 44 Years | 76 (83.5%) | 15 (16.5%) |
| 45 to 54 Years | 53 (79.1%) | 14 (20.9%) |
| 55 to 64 Years | 111 (97.4%) | 3 (2.6%) |
| 65 to 74 Years | 95 (100.0%) | 0 (0.0%) |
| 75 Years and older | 68 (95.8%) | 3 (4.2%) |
| Total | 698 (93.7%) | 47 (6.3%) |
Health Insurance Coverage by Citizenship Status in Scribner
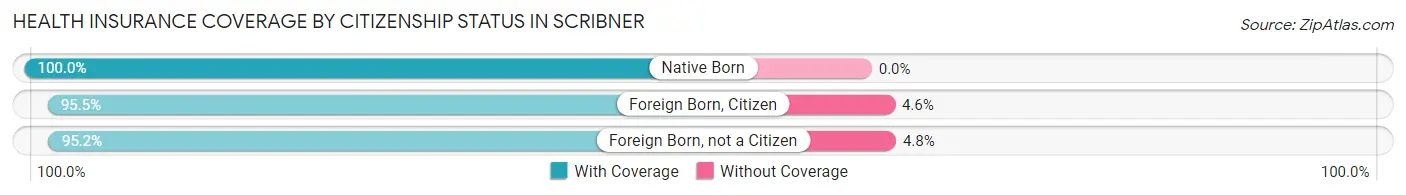
| Citizenship Status | With Coverage | Without Coverage |
| Native Born | 53 (100.0%) | 0 (0.0%) |
| Foreign Born, Citizen | 126 (95.5%) | 6 (4.5%) |
| Foreign Born, not a Citizen | 60 (95.2%) | 3 (4.8%) |
Health Insurance Coverage by Household Income in Scribner
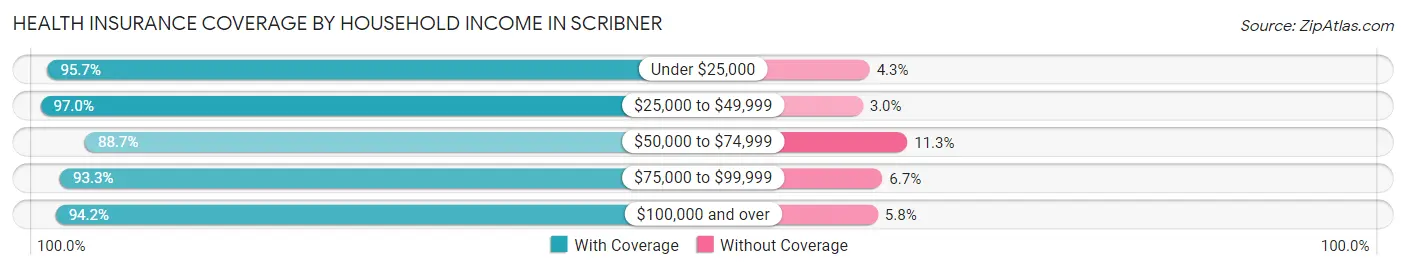
| Household Income | With Coverage | Without Coverage |
| Under $25,000 | 67 (95.7%) | 3 (4.3%) |
| $25,000 to $49,999 | 162 (97.0%) | 5 (3.0%) |
| $50,000 to $74,999 | 133 (88.7%) | 17 (11.3%) |
| $75,000 to $99,999 | 126 (93.3%) | 9 (6.7%) |
| $100,000 and over | 210 (94.2%) | 13 (5.8%) |
Public vs Private Health Insurance Coverage by Age in Scribner
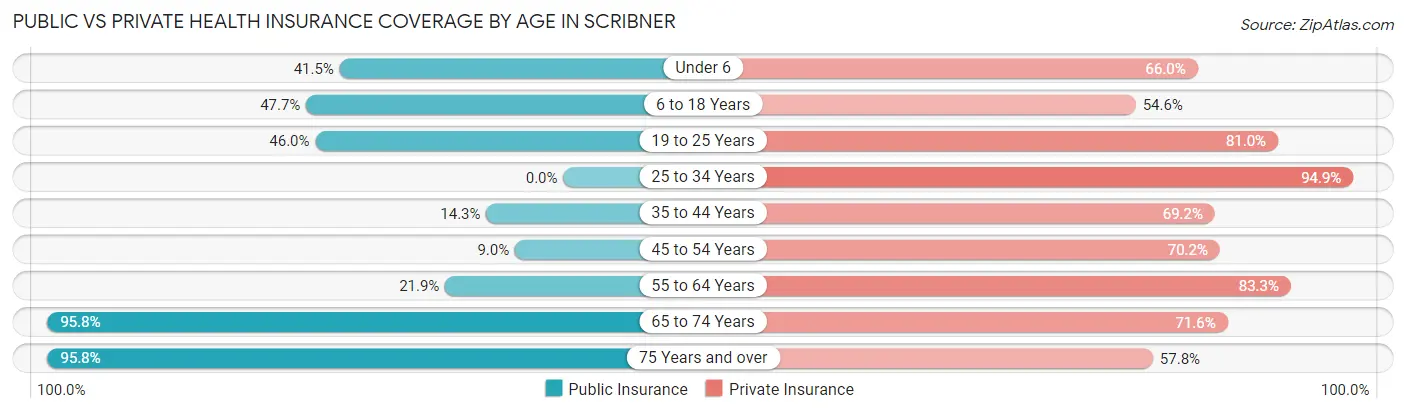
| Age Bracket | Public Insurance | Private Insurance |
| Under 6 | 22 (41.5%) | 35 (66.0%) |
| 6 to 18 Years | 63 (47.7%) | 72 (54.5%) |
| 19 to 25 Years | 29 (46.0%) | 51 (80.9%) |
| 25 to 34 Years | 0 (0.0%) | 56 (94.9%) |
| 35 to 44 Years | 13 (14.3%) | 63 (69.2%) |
| 45 to 54 Years | 6 (9.0%) | 47 (70.2%) |
| 55 to 64 Years | 25 (21.9%) | 95 (83.3%) |
| 65 to 74 Years | 91 (95.8%) | 68 (71.6%) |
| 75 Years and over | 68 (95.8%) | 41 (57.8%) |
| Total | 317 (42.5%) | 528 (70.9%) |
Disability Status by Sex by Age in Scribner
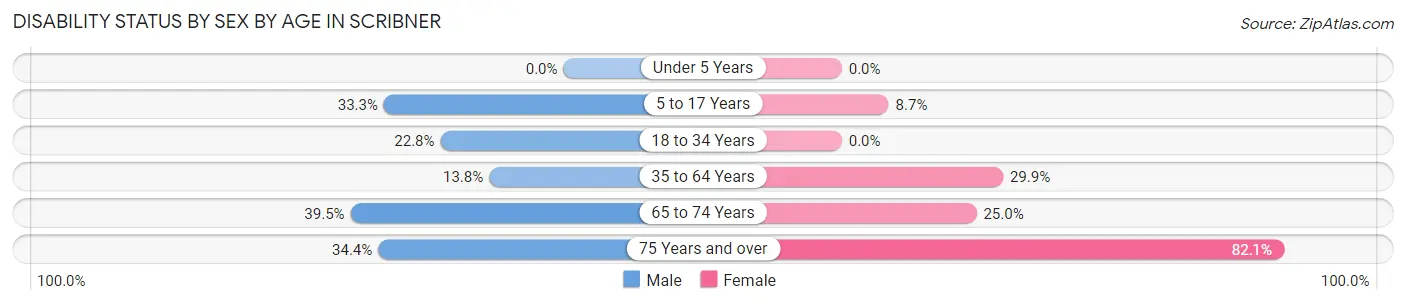
| Age Bracket | Male | Female |
| Under 5 Years | 0 (0.0%) | 0 (0.0%) |
| 5 to 17 Years | 26 (33.3%) | 4 (8.7%) |
| 18 to 34 Years | 21 (22.8%) | 0 (0.0%) |
| 35 to 64 Years | 20 (13.8%) | 38 (29.9%) |
| 65 to 74 Years | 17 (39.5%) | 13 (25.0%) |
| 75 Years and over | 11 (34.4%) | 32 (82.1%) |
Disability Class by Sex by Age in Scribner
Disability Class: Hearing Difficulty
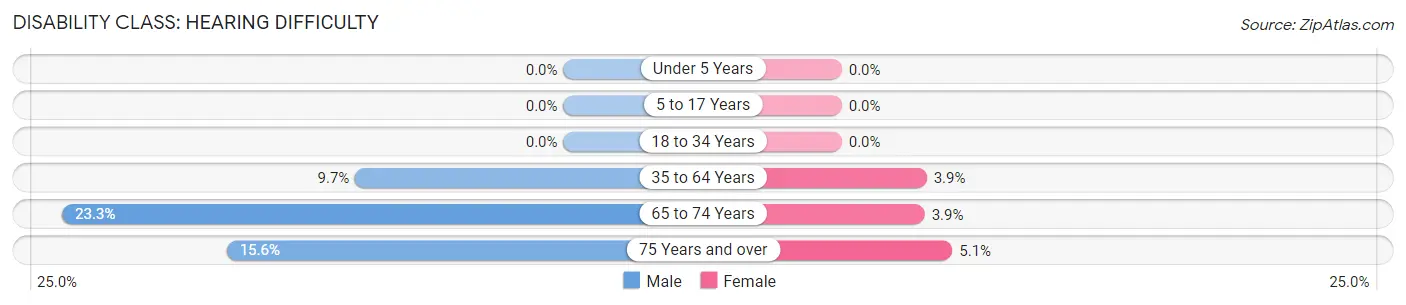
| Age Bracket | Male | Female |
| Under 5 Years | 0 (0.0%) | 0 (0.0%) |
| 5 to 17 Years | 0 (0.0%) | 0 (0.0%) |
| 18 to 34 Years | 0 (0.0%) | 0 (0.0%) |
| 35 to 64 Years | 14 (9.7%) | 5 (3.9%) |
| 65 to 74 Years | 10 (23.3%) | 2 (3.8%) |
| 75 Years and over | 5 (15.6%) | 2 (5.1%) |
Disability Class: Vision Difficulty
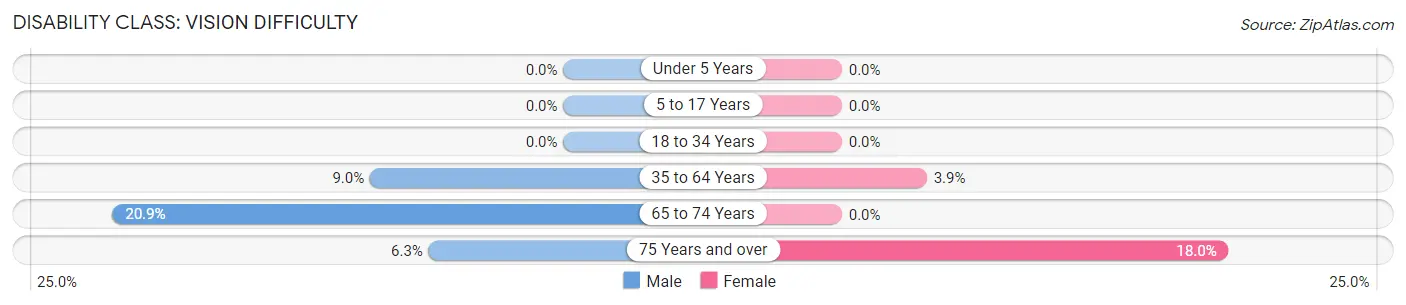
| Age Bracket | Male | Female |
| Under 5 Years | 0 (0.0%) | 0 (0.0%) |
| 5 to 17 Years | 0 (0.0%) | 0 (0.0%) |
| 18 to 34 Years | 0 (0.0%) | 0 (0.0%) |
| 35 to 64 Years | 13 (9.0%) | 5 (3.9%) |
| 65 to 74 Years | 9 (20.9%) | 0 (0.0%) |
| 75 Years and over | 2 (6.2%) | 7 (17.9%) |
Disability Class: Cognitive Difficulty
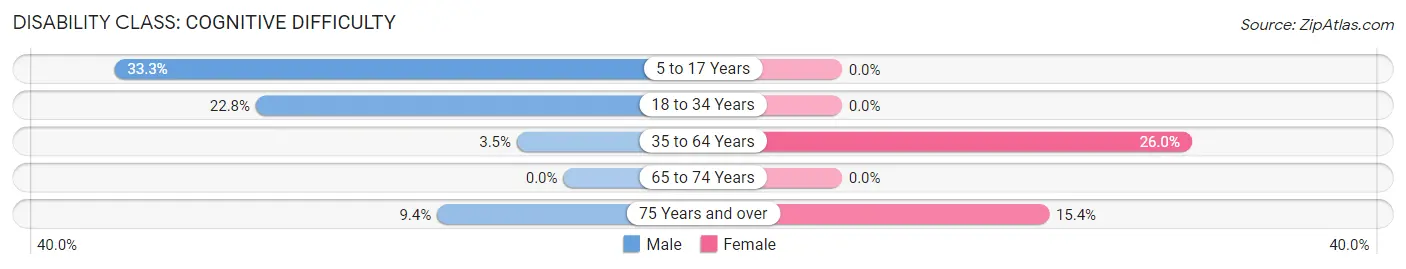
| Age Bracket | Male | Female |
| 5 to 17 Years | 26 (33.3%) | 0 (0.0%) |
| 18 to 34 Years | 21 (22.8%) | 0 (0.0%) |
| 35 to 64 Years | 5 (3.5%) | 33 (26.0%) |
| 65 to 74 Years | 0 (0.0%) | 0 (0.0%) |
| 75 Years and over | 3 (9.4%) | 6 (15.4%) |
Disability Class: Ambulatory Difficulty
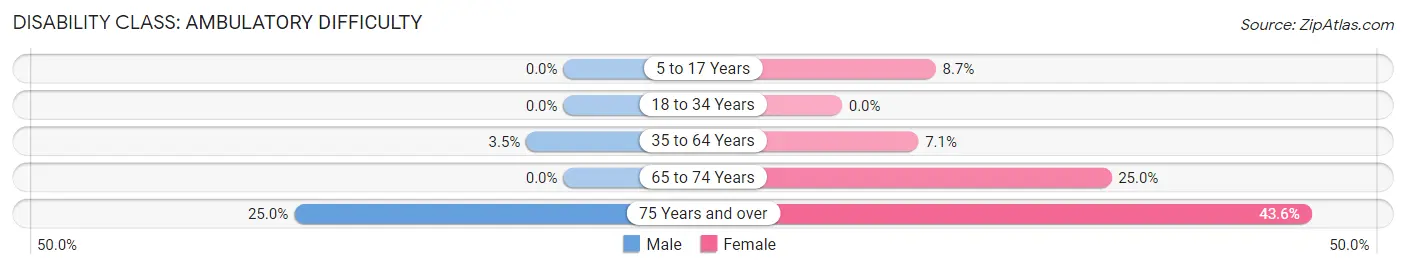
| Age Bracket | Male | Female |
| 5 to 17 Years | 0 (0.0%) | 4 (8.7%) |
| 18 to 34 Years | 0 (0.0%) | 0 (0.0%) |
| 35 to 64 Years | 5 (3.5%) | 9 (7.1%) |
| 65 to 74 Years | 0 (0.0%) | 13 (25.0%) |
| 75 Years and over | 8 (25.0%) | 17 (43.6%) |
Disability Class: Self-Care Difficulty
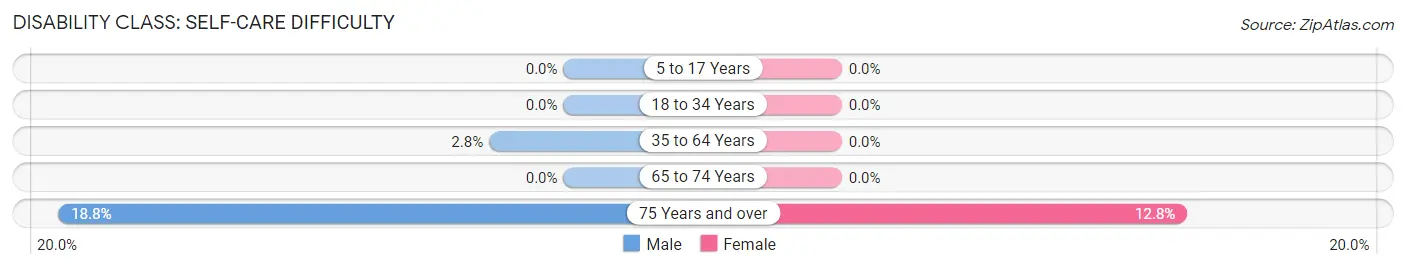
| Age Bracket | Male | Female |
| 5 to 17 Years | 0 (0.0%) | 0 (0.0%) |
| 18 to 34 Years | 0 (0.0%) | 0 (0.0%) |
| 35 to 64 Years | 4 (2.8%) | 0 (0.0%) |
| 65 to 74 Years | 0 (0.0%) | 0 (0.0%) |
| 75 Years and over | 6 (18.8%) | 5 (12.8%) |
Technology Access in Scribner
Computing Device Access in Scribner
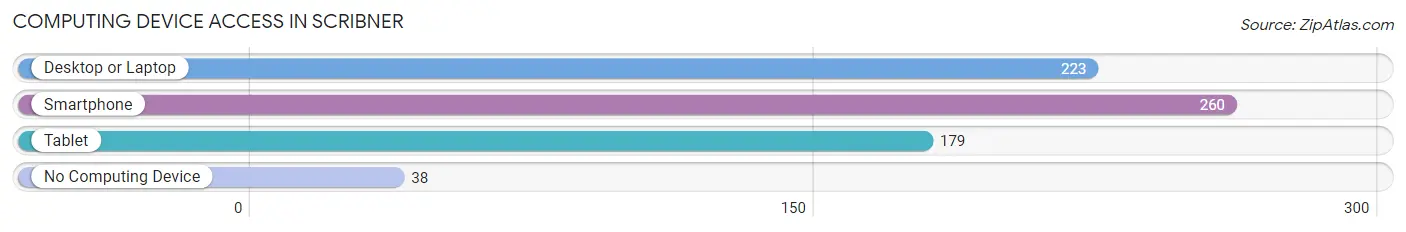
| Device Type | # Households | % Households |
| Desktop or Laptop | 223 | 68.8% |
| Smartphone | 260 | 80.2% |
| Tablet | 179 | 55.2% |
| No Computing Device | 38 | 11.7% |
| Total | 324 | 100.0% |
Internet Access in Scribner
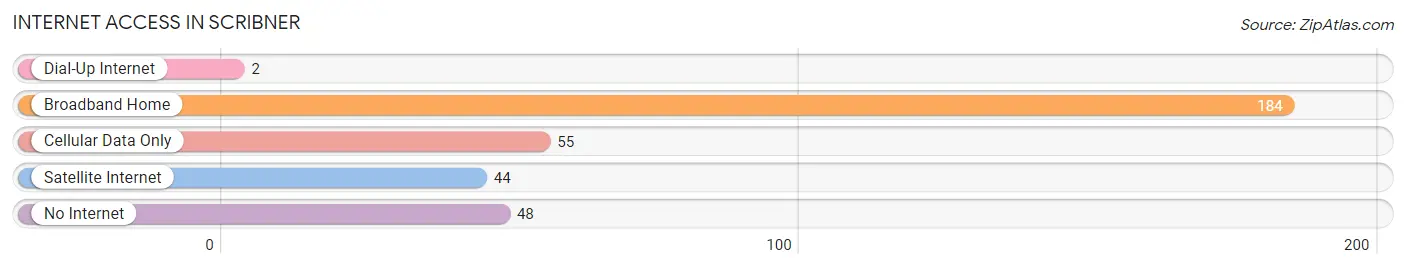
| Internet Type | # Households | % Households |
| Dial-Up Internet | 2 | 0.6% |
| Broadband Home | 184 | 56.8% |
| Cellular Data Only | 55 | 17.0% |
| Satellite Internet | 44 | 13.6% |
| No Internet | 48 | 14.8% |
| Total | 324 | 100.0% |
Scribner Summary
Scribner is a small city located in Dodge County, Nebraska. It is situated on the banks of the Elkhorn River, approximately 30 miles northwest of Omaha. The city has a population of 1,845 people, according to the 2010 census.
History
The area that is now Scribner was first settled in 1856 by a group of German immigrants. The town was originally called “New Berlin”, but was later changed to “Scribner” in honor of the Scribner family, who were early settlers in the area. The town was officially incorporated in 1887.
In the early 1900s, Scribner was a thriving agricultural community. The town was home to several grain elevators, a creamery, a flour mill, and a lumber yard. The town also had a hotel, a bank, and several stores.
In the 1950s, the town began to decline as many of its residents moved away in search of better economic opportunities. The decline continued until the late 1980s, when the town began to experience a resurgence. The town was revitalized by the construction of a new school, a new library, and a new city hall.
Geography
Scribner is located in the eastern part of Dodge County, Nebraska. The city is situated on the banks of the Elkhorn River, approximately 30 miles northwest of Omaha. The city has a total area of 1.2 square miles, all of which is land.
The city is located in the Central Plains region of the United States. The climate is characterized by hot, humid summers and cold, dry winters. The average annual temperature is around 50 degrees Fahrenheit.
Economy
The economy of Scribner is largely based on agriculture. The city is home to several grain elevators, a creamery, a flour mill, and a lumber yard. The city also has several retail stores, restaurants, and other businesses.
The city is also home to several manufacturing companies, including a plastics manufacturer and a metal fabrication company. The city is also home to a number of small businesses, including a printing company, a furniture store, and a bakery.
Demographics
According to the 2010 census, the population of Scribner was 1,845 people. The racial makeup of the city was 95.3% White, 0.7% African American, 0.3% Native American, 0.7% Asian, 0.1% Pacific Islander, 1.2% from other races, and 1.7% from two or more races. Hispanic or Latino of any race were 3.2% of the population.
The median household income in Scribner was $45,938, and the median family income was $51,250. The per capita income for the city was $20,945. About 8.3% of families and 10.2% of the population were below the poverty line, including 14.2% of those under age 18 and 8.2% of those age 65 or over.
Common Questions
What is Per Capita Income in Scribner?
Per Capita income in Scribner is $29,918.
What is the Median Family Income in Scribner?
Median Family Income in Scribner is $75,547.
What is the Median Household income in Scribner?
Median Household Income in Scribner is $53,478.
What is Income or Wage Gap in Scribner?
Income or Wage Gap in Scribner is 11.6%.
Women in Scribner earn 88.4 cents for every dollar earned by a man.
What is Family Income Deficit in Scribner?
Family Income Deficit in Scribner is $9,329.
Families that are below poverty line in Scribner earn $9,329 less on average than the poverty threshold level.
What is Inequality or Gini Index in Scribner?
Inequality or Gini Index in Scribner is 0.40.
What is the Total Population of Scribner?
Total Population of Scribner is 779.
What is the Total Male Population of Scribner?
Total Male Population of Scribner is 424.
What is the Total Female Population of Scribner?
Total Female Population of Scribner is 355.
What is the Ratio of Males per 100 Females in Scribner?
There are 119.44 Males per 100 Females in Scribner.
What is the Ratio of Females per 100 Males in Scribner?
There are 83.73 Females per 100 Males in Scribner.
What is the Median Population Age in Scribner?
Median Population Age in Scribner is 43.1 Years.
What is the Average Family Size in Scribner
Average Family Size in Scribner is 3.1 People.
What is the Average Household Size in Scribner
Average Household Size in Scribner is 2.3 People.
How Large is the Labor Force in Scribner?
There are 364 People in the Labor Forcein in Scribner.
What is the Percentage of People in the Labor Force in Scribner?
57.4% of People are in the Labor Force in Scribner.
What is the Unemployment Rate in Scribner?
Unemployment Rate in Scribner is 2.2%.